

Submitted:
05 September 2026
Posted:
07 September 2026
You are already at the latest version
Abstract
Cartography spans millennia of human civilization. Maps helped humans interpret and represent the world before writing. This review examines the evolution of cartographic knowledge from Prehistory to the Middle Ages. It focuses on how maps helped people understand, represent and navigate the world. The methodology used bibliographic search and analysis. Sources came from academic libraries, bibliographic databases and repositories. The literature was divided into Prehistory, Antiquity, and Middle Ages. Approximately 20 maps were selected for their innovations or cosmological significance. They were grouped by orientation, material, content, and Earth’s shape for systematic comparison. The study of maps showed that the Earth‑centred model changed over centuries, slowly replaced by heliocentrism. In Antiquity, Greeks proved the Earth is a sphere, a view that remained mainstream throughout the Middle Ages. Map orientation varied, with Babylonian and Ptolemaic maps facing north, mappae mundi facing east, while Islamic ones facing south. Cartographic materials changed over time, with prehistoric maps on rock, Antiquity using clay tablets, metal, papyrus and parchment, while in the Middle Ages, parchment became common. Content changed with prehistoric artefacts used for local land, in Antiquity became mathematical and administrative, Medieval ones showing religious symbols. By the 13th century, maps had become practical navigation tools.
Keywords:
shape of Earth
; map materials
; antiquity
; Earth in space
; map orientation
; map content
; historical maps
1. Introduction
Cartography has evolved over centuries as a discipline that combines scientific principles with artistic expression. Since ancient times, human societies have interacted with their environments, and many early cultures have considered nature sacred [1]. The connection between people and nature is widely documented in literature, visual art and cartography.
Maps have always been important for understanding the world and humans’ place in it, even before writing was invented. Prehistoric people used maps to depict their environment and transmit knowledge to future generations [2]. In Antiquity, ancient Greeks thought of themselves as part of nature, a belief that influenced their daily lives, philosophy, and religion.
According to Harley & Woodward, maps are visual representations that help us understand concepts, conditions, processes, and events in the human world in space [3]. In present times, maps are accessible on digital devices such as mobile phones and tablets, vehicle navigation systems, and in printed form [4]. Also, they provide information about the geographical location of objects or areas. They can show the Earth’s surface, or a portion of it, or even celestial bodies. Some maps offer accurate, two-dimensional representations of three-dimensional (3D) space, while others are dynamic (changing over time), interactive (allowing user input), or even three-dimensional [5].
The study and use of maps can help solve problems and understand changes over time. Historical maps are increasingly used as spatial datasets in historical geography, environmental reconstruction, and GIS-based research. Their value extends beyond cartographic history, providing information about past landscapes, territorial organisation, and long-term environmental change [6,7,8]. For example, analyzing changes in a relief, such as the bed of a river, can explain floods and, of course, contribute to their management [9]. Maps provide critical information that supports various activities, such as monitoring the spread of disease or navigating to new places. In general, scientists across specialities use maps to improve the efficiency of their work.
This review examines how cartographic knowledge evolved from Prehistory to the Middle Ages. Among its main aims is to explore the purposes of map creation and to highlight the earliest known examples. In parallel, it presents the progression of theories concerning Earth’s shape and its position in the Universe. This study analyses findings on thematic content and materials used in map-making and map orientation during this period.
1.1. Historical Cartography
The earliest known maps date to the Palaeolithic era (40,000 to 10,000 BCE), a period which predates the invention of writing. These maps were used for educational purposes and depicted the natural surroundings where early humans lived [10,11]. Petroglyphs, which are images carved into rock, represent an early form of visual communication and are the first known examples of maps [12].
The basic cartographic principles, such as orientation and scale, were first introduced by the Babylonians. Around 2500 BCE, they created the earliest known maps on clay tablets, which showed property boundaries, city plans, and the world. The Babylonians viewed the Earth as flat, circular, and surrounded by ocean [13].
Dating to the eighth century BCE, Homer is regarded as the first geographer. In his poem The Iliad, the description of Achilles’s golden shield serves, as a cosmological map in his era [12,14].
In Antiquity by the end of the pre-Christian era, the ancient Greeks had laid the foundations of scientific cartography. Three factors advanced this development. Firstly, the expedition of Alexander the Great extended the known world to the Indus River. Secondly, Eratosthenes proved Earth’s sphericity and calculated its circumference [15]. Thirdly, Hipparchus developed meridians and parallels.
Ancient Greeks decisively shaped cartography. They introduced scientific and mathematical principles. Also, they recognized the spherical shape of Earth, which allowed map accuracy [16]. They used mathematical methods and instruments for measurements. The invention of map projections was another innovation, which helped the mathematical organization of Earth’s surface and the connection of empirical data with precise calculations. Eratosthenes’ measurement of Earth’s diameter is an example. These Greek innovations influenced Roman, Islamic and Renaissance cartography. Ultimately, these principles shaped how maps were produced and used throughout history [15].
Claudius Ptolemy (85-165 AD) was a great astronomer, mathematician, and geographer at the Library of Alexandria. He is considered the leading figure in history of cartography and the first modern cartographer. Building on the work of Hipparchus and Marinus, he wrote two major works: the astronomical manual Mathematical Syntax and the geographical landmark Geographia.
Geography was the first complete guide to mapmaking. It introduced theoretical principles and techniques of cartographic projections and included a pioneering catalogue of 8,000 place names with their geographical coordinates. In addition, it was accompanied by 26 regional maps covering the then-known world. This makes Ptolemy the creator of the first cartographic atlas [2,16,17,18].
Although it is unknown whether Ptolemy himself drew the maps, his manuscripts formed the foundation for the development of cartography. They influenced Islamic cartography from the 9th century onwards and post-medieval European cartography.
Roman literature references many maps. However, no contemporary maps from the classical world have survived. While the Romans inherited Greek geographical knowledge, they showed little interest in its scientific aspects, such as astronomical observations and the determination of geographical coordinates. Despite this, first-century CE treatises indicate that topographical knowledge was well developed, particularly regarding land surveying and cadastral systems. Roman interest is further shown by the rise of the high-prestige profession of surveyors [3,16]. The Tabula Peutingeriana, also known as the Peutinger Map, is thought to be the only known surviving map of the Roman Empire. It spans eleven sheets [19]. This compilation was a significant contribution; as an important ancient text, it served as a map of the Roman road network. Schematic in nature, the map represented the roads and cities of the Roman Empire. It stretched from Britain to the Ganges River in India.
Cartography in China evolved independently, with a continuous history dating back to the Chou dynasty (1027–221 BCE) official map-making regulations. The earliest known reference to a map dates to 227 BCE [20]. Over the centuries, China made several foundational contributions, such as the invention of paper and printing, with the first printed map appearing in 1155. Another vital innovation was the rectangular grid system and used the right triangle for accurate scaling and distance measurement [16].
Western cartography, influenced by Greek and Roman traditions, emphasized mathematical calculations, geometric projections, and positioning through latitude and longitude. On the other hand, Chinese developments focused on administrative and governance needs, utilizing functional tools such as paper and woodblock printing. Both approaches contributed significantly to the evolution of cartography [21].
Concurrently, the Arab world also played a major role in cartography, especially during the Middle Ages. Islamic cartographers and scientists developed accurate maps and improved geographical knowledge. From the 12th century onwards, cartography was influenced by Arab cartography and the development of nautical charts. This led to greater accuracy and a wider variety of maps [16,22]. Islamic expansion and extensive trade missions to regions such as the Sahara, Africa, India, and China helped accumulate vast amounts of travel data. This wealth of information enabled Arab cartographers to resume creating more realistic maps. They combined classical Ptolemaic theory with newer empirical observations [23].
The culmination of this cartographic heyday was in 1154 AD with the great geographer Al-Idrizi [17]. Commissioned by King Roger II of Sicily, he created the famous Tabula Rogeriana. This monumental work included 70 maps of the then-known world. The work was considered superior to similar European works of the time. It stands out for its characteristic southern orientation, with the south at the top. It also features a cosmological depiction of the Earth, surrounded by ocean and fire [12].
Cartography during the Middle Ages remained stagnant. Maps, or mappae mundi, showed significant differences between ancient and modern times. Their purpose was both educational and to represent the time’s geographical, religious and mythological concepts [3,24]. The inaccuracies of medieval maps were mainly attributed to the gradual misinterpretation and alteration of this knowledge. However, it has been argued that what was seen as a medieval distortion was in fact a conscious seventh-century attempt to transform the classical, more geographically accurate view of the world to reflect the Christian belief in the Holy Trinity and a divinely ordered universe [25,26]. There are ongoing scholarly debates regarding the origins and meaning of these distortions. Some historians argue that the inaccuracies resulted from a loss of scientific knowledge and a decline in technical skills after antiquity, while others contend that medieval cartographers deliberately reinterpreted mapping traditions for ideological or theological reasons. This debate reveals that medieval map-making was shaped by a combination of shared geographic knowledge and distinct cultural values [27].
Mappae mundi were produced for over a thousand years, from the fall of Rome to the fifteenth century. The maps displayed differences in both their content and their degree of complexity, as well as in their design. This diversity has drawn much attention from geographers, historians, and archaeologists. They are widely discussed in mapmaking history textbooks. Yet, in terms of technology, mappae mundi are less significant [28,29].
T and O-type maps were religious and depicted the world with Jerusalem at the center and the east at the top [30]. Another type of map showed the world as a circle divided into seven geographical zones - the climates of Eratosthenes - or the five zones of the Roman writer Macrobius. Portolans are maps that appeared in the 13th century and depicted coastal areas, intended to help sailors on their travels [31].
As previously noted, maps from the Middle Ages were primarily designed to convey religious, political, or symbolic ideas, rather than to provide precise geographical or navigational references. The varied purposes of map-making throughout history—ranging from practical navigation and land management to the expression of philosophical, religious, and cultural concepts—shaped cartographic development by continually adapting both the form and function of maps to reflect society’s evolving needs and values.
2. Methods
The methodology comprised bibliographic search, collection, and analysis of relevant references and cartographic sources.
Bibliography was retrieved from Greek libraries, bibliographic databases, academic repositories and online resources. Sources were obtained from the Library and Information Centre of the National and Kapodistrian University of Athens (NKUA) and its digital databases (JSTOR, Scopus, Web of Science) as well as electronic repositories of Greek and international academic institutions.
Combined searches were performed using keywords related to historical cartography, early maps, old maps, historical maps, evolution, analysis, classification, technological progress, thematic changes, and influential contributors. The retrieved bibliography focused on the following themes:
- The objectives and purposes of map creation
- The earliest known examples of cartographic artefacts
- The explicit role of ancient civilizations in the development of map creation
- The influence of geopolitical conditions on the development and evolution of maps
Following the literature review, the data were classified. To align with the chronological structure of this study, the bibliography was divided into three historical periods: Prehistory, Antiquity, and the Middle Ages. This division allowed for a systematic comparison of cartographic developments across each era.
From the collected materials, approximately 20 historically significant maps were selected for detailed analysis based on two criteria:
- Maps that introduced innovations in representation, projection or orientation.
- Maps that reflect the cosmological, religious or geographical understanding of their time
These maps were assigned to the same three periods: Prehistory, Antiquity and the Middle Ages.
The analysis combined cartographic and textual sources, depending on the parameter examined.
Textual sources only:
- The place of the Earth in the Universe, based on the views of key philosophers and scientists across centuries, was examined with focus on the transition from geocentric to heliocentric model.
Both maps and textual sources:
- Earth’s outline and shape were analyzed from cartographic artefacts and philosophical ideas, such as flat disk, sphere, or other conceptions.
Maps only:
- Evolution of orientation over time, for example, east-up and north-up.
- Materials used in their construction such as clay, papyrus, parchment, metal, and stone.
- They encompassed thematic areas including cosmology, geography, navigation, and religion.
The collected maps were not uniform. They differed in origin, date, purpose, and style. To allow systematic comparison, they were grouped according to shared features: orientation (east, south, north), construction material (clay, papyrus, parchment, metal), thematic content (topographical, religious, navigational), and the depiction of Earth’s shape (flat disk, sphere). This grouping provides a comparative framework for analysing long-term developments in cartographic knowledge across different cultural and historical contexts.
3. Comparative Analysis of Historical Cartography
3.1. Cosmological Views and Their Influence on Cartography
The beliefs about Earth’s position in the universe shifted historically from geocentrism to heliocentrism. Each phase was formed by progress in philosophical, religious, and scientific thought. Across the ancient world, the Earth-centred model was not just an astronomical idea, but it served as a foundation for religion, social order, cosmography, and cultural meaning.
Greek cosmology passed through multiple stages. Philosophers proposed different explanations of the structure of the Universe, ranging from early cosmological models associated with the Ionian philosophers to the sophisticated geocentric system developed by Aristotle and later refined by Claudius Ptolemy.
Aristotle’s believed that the Earth was placed at the center of the Universe. Later Claudius Ptolemy (85-165 CE) created the most complete geocentric model, which dominated for over a millennium. This Ptolemaic model became central to Medieval cosmology and education.
Although Aristarchus of Samos, during the 3rd century BCE had proposed a different idea, the theory of a heliocentric system. However, this theory did not gain widespread acceptance during his era. Consequently, most cartographic traditions of Antiquity and the Middle Ages developed within a geocentric understanding of the Universe.
The transition to heliocentrism marked a significant change in scientific thought. In 1543, Copernicus introduced a heliocentric model, placing the Sun in the center and treating Earth as a planet. Although initially the model attracted limited support, it was revolutionary in its essential challenge to the earth-centred worldview
Table 1 summarises this evolution from Antiquity to the Renaissance. It begins with early mythic geocentrism, then to philosophical refinements in Classical Greece and challenges from antiquity’s early heliocentrists, followed to medieval consolidation in the Ptolemaic system, and finally to the Renaissance’s shift to heliocentrism.
3.2. Representations of Earth’s Shape in Cartographic Knowledge
The sphericity of Earth was established by ancient Greek scientists and remained the accepted academic view throughout the Middle Ages.
In antiquity, existed two main beliefs about Earth’s shape:
- Flat Circular Disk: Found in ancient Egyptian, Babylonian, and Hebrew myths, as well as in the works of Homer, Anaximander, Hecataeus, and the Ionians. These depictions weren’t attempts to describe physical reality; instead, they were symbolic ways to convey the religious beliefs and stories of the time.
- Spherical Shape: Supported by philosophers such as Pythagoras, Aristotle, Eratosthenes, Crates, Hipparchus, Posidonius, Strabo, and Ptolemy based on observations of stars and various natural phenomena over time. Eratosthenes played a key role in confirming the Earth’s spherical shape by calculating its circumference.
During the Middle Ages, maps depicted the world as one-dimensional or flat, with circular or rectangular shapes that did not reflect the Earth’s actual geomorphology. These maps often illustrated the world as a flat disk surrounded by water. The current myth that medieval scholars believed the Earth to be flat is a misinterpretation of history, arising mainly from intellectual conflicts in the early centuries of the modern era.
Earth’s shape played a crucial role in late medieval geographical discoveries, including the discovery of America in the late 15th century. This new understanding encouraged exploration of sea routes and trade relations, while contributions from Arab geographers and European scholars increased seafarers’ confidence and revived geographical knowledge, initiating the era of great discoveries.
Table 2 correlates this transition from early conceptions of a flat disk or a dome covered world, to the spherical Earth theory introduced by ancient Greek philosophers based on observation and reasoning, followed by a complex reception in medieval intellectual culture.
3.3. Map Orientation Across Cartographic Traditions
The study of historical world maps from 2500 BCE to 1300 CE reveals a notable shift in the understanding of terrestrial space. Table 3 catalogues key characteristics of these maps, including map creators, construction materials, and specific depictions, ranging from practical road networks to theological symbols. It also documents evolving methods of orientation, tracing the transition from symbolic and religious representations of space to more systematic geographical approaches.
The orientation of ancient maps was not uniform, north as the main direction is a relatively recent development. In ancient societies, orientation was influenced by religious, astronomical, practical and symbolic factors, resulting in maps oriented towards the east, south or north.
In Babylonian maps, the orientation was initially towards the north. However, the earliest maps created by the ancient Greeks did not have a precise orientation. Only after the introduction of geographical coordinates, they began to orient their maps towards the north, as seen in Ptolemy’s map. This description resulted from the astronomical, geometric, and physical observations made by the ancient Greeks.
During the Middle Ages, most mappae mundi were oriented toward the east for religious reasons. Arab maps were oriented towards the south to align with Mecca. The evolution of map orientation underscores the profound cultural significance of mapmaking.
Based on Table 3, maps can be classified into three main categories based on their orientation:
East-Up: driven by Christian Religion. The east was considered the most important direction, the location of Paradise. Examples: Christian medieval maps (mappae mundi) and the mosaic map of Madaba (6th century CE).
South-Up: driven by Islamic Culture and Religion. Examples: Most Islamic world maps, such as Al-Idrisi’s, are oriented to the south, following the sacred direction towards Mecca.
North-Up: Originally a Scientific choice by Ptolemy. Later became the global standard due to use of compass and European maritime expansion. Examples: Ptolemy maps (second century CE), the medieval zonal maps of Macrobius. The famous Babylonian World Map (c. 600 BCE) is considered to be probably oriented towards the north, because of the Chaldeans’ advanced astrological knowledge.
The evolution of map orientation shows the profound cultural significance of cartography. Directional choices reflected cosmological beliefs, religious practices, and technological advances.
3.4. Materiality of Historical Maps
The materials used to make maps changed over time. Based on the data catalogued in Table 3, there is a clear progression in the physical media employed, from rock carvings to clay tablets, metals, papyrus, and finally parchment. Figure 1 and Figure 2 presents the evolution of the material used to make maps.
The depiction of maps began in the Paleolithic era, when prehistoric people drew their environment on rocks. Petroglyphs, which are images carved into rock, are the first known examples of maps. Then, in Antiquity, it progressed from Babylonians clay tablets, such as Babylonian World Map, to the golden/metallic shield of Achilles as described by Homer and the bronze tablet of Anaximander. Papyrus was another material. It was the main writing surface in Egypt. It was used for over 4,000 years, due to its portability and legibility. During the Middle Ages, papyrus continued though increasingly replaced by parchment. From the fourth century became the dominant material for medieval mappae mundi, offering durability and suitability for detailed illustration.
3.5. Thematic Content of Historical Maps
Table 3 details the depictions of each map. It shows that representations range from road networks to conceptual theological symbols. The table also illustrates the diversity of map features and purposes across historical periods. It presents examples for each developmental phase.
The content of maps has shifted over time. Early artefacts such as Akkadian map, Bedolina petroglyph, map of Nippur, show small areas. They depict fields, villages, or cities. Later world maps appear. They attempt to show the entire known world, even if schematically or symbolically. Examples include the Babylonian world map, the maps of Anaximander and Ptolemy, and the medieval mappae Mundi.
Ancient cartography emphasized boundaries and resources. Roman and late medieval maps prioritized navigation to destinations such as roads and ports. The density of information also changed cyclically. Detailed Babylonian tablets and Ptolemy’s maps were replaced by the schematic T-O maps of the Middle Ages. Then in 13th century, Portolan charts returned to high precision focused mainly on coastlines rather than inland geography.
Prehistory
Local-topographical maps. Examples are Akkadian tablet and Map of Nippur. They show land use, buildings, roads.
Antiquity
Organizing space with Mathematics and administration in the Hellenistic and Roman periods. Examples are the world maps of Eratosthenes and Ptolemy. Their content was organized by meridians, parallels, and geometric projections, reflecting a spherical Earth. The Tabula Peutingeriana shows road network of Roman Empire.
Medieval era
Theological and symbolic representations. From the Madaba mosaic (560 CE) to the Hereford map (c. 1300 CE), Christian theology dominates. The key features were Jerusalem as the centre of the world. There was an east-up orientation with Paradise at the top. Maps also included biblical and legendary material and Christ’s body enclosing the world (Ebstorf map). T-O maps reduce the inhabited world to a circle divided into three continents. Separately, Islamic cartography, represented by Al-Idrisi’s Tabula Rogeriana (1154 CE), followed a different tradition. It was oriented south-up (toward Mecca) and combined Ptolemaic mathematical methods with extensive geographical description.
13th-century maritime revolution.
Precise navigational charts appear for sea exploration. Coastlines and harbors in portolan charts (Carte Pisane) were very precise, based on compass bearings and sailing directions. This return to precision was driven by the growth of Mediterranean maritime trade. Sailors needed reliable coastlines for navigation, not theological symbolism.
Each phase was built upon its predecessor. Local topographical maps in Prehistory laid the foundation for the mathematical and administrative advances of Antiquity. These were reconsidered through theological and symbolic models in the Medieval era. This shift occurred partly because of the collapse of the Western Roman Empire. With long-distance trade and centralized administration in decline, maps became tools for religious instruction rather than practical governance. The accumulation of these mapping traditions led to the 13th century when precise, purpose-driven navigational charts for exploration were developed.
World maps from Prehistory to Middle Ages show humans’ interest in understanding the world from a global perspective. These maps were geographical in nature and frequently incorporated both philosophical and religious ideas. By combining philosophical and ecclesiastical frameworks, world maps connect physical geography with prevailing beliefs about existence, morality, and destiny. This mix influenced navigation, administration, and social order.
4. Discussion
The reviewed literature indicates that cosmological beliefs strongly influenced cartographic thought throughout Antiquity and the Middle Ages. The geocentric model dominated most ancient and medieval representations of the world and provided the intellectual framework within which maps were produced and interpreted. Although Aristarchus proposed a heliocentric model during Antiquity, geocentrism remained dominant until the Renaissance. The gradual transition to heliocentrism contributed to new understandings of the Earth and ultimately influenced later developments in geography and cartography [14,32,33].
Early depictions of a Flat Circular Disk were symbolic, not attempts to describe physical environment. The sphericity of Earth was established by ancient Greek scientists and remained the accepted academic view throughout the Middle Ages. During the Middle Ages, maps depicted the world as one-dimensional or flat. The flat-Earth medieval myth is a modern misinterpretation, rooted in early modern intellectual conflicts.
Prehistoric humans relied on myths to explain the Earth and cosmos. They often visualizing a flat world supported by animals or cosmic architecture. Geomyths interpreted landforms and natural disasters through supernatural stories, forming the earliest explanations of Earth’s structure. Mayor argues that pre-scientific cultures used mythic stories to explain geological features and catastrophic events [34].
Kessler gives details on historical symbolic cosmologies, including descriptions of a flat disc surrounded by oceans and a hemispheric dome [35]. Ancient cultures proposed different models of Earth’s shape, often influenced by philosophy or religion. While many early thinkers supported a spherical Earth, some traditions described alternative forms, such as a flat disc or a dome supported by mythological structures. It has been suggested that before 3000 BCE, Babylonians believed the Earth was a flat disk floating in an endless ocean [36,37,38].
Kočandrle suggests that early Ionic archaic cosmologies generally pictured the Earth as a flat disc (or cylindrical) and located it in a lower dimension [39,40]. Anaximander proposed an Earth shaped like the section of a cylinder [41,42]. Pythagoras introduced the spherical Earth, motivated by mathematical symmetry. Anaxagoras advanced a naturalistic astronomical model, describing the moon as an opaque sphere lit by the sun and correctly explaining eclipses. Aristotle concluded a spherical Earth by noting the curved Earth-shadow during lunar eclipses. By the fourth century BCE, the spherical Earth at the center of a geocentric cosmos became standard belief in Greek science and philosophy.
As pointed out by Lira during the Early Middle Ages, classical knowledge persisted in Byzantium and the Islamic world, certain regions of early medieval Europe experienced intellectual decline [43]. Cosmas Indicopleustes (sixth century) argued that the Earth was a flat rectangle surrounded by oceans, drawing inspiration from Biblical imagery. However, this idea was not widely accepted. Most educated scholars continued to rely on classical models of Earth’s shape rather than adopting Cosmas’s interpretation.
It has been noted that during the High and Late Middle Ages, scholars accepted the Earth’s sphericity [14,26,44]. The myth that medieval people thought the Earth was flat emerged in the nineteenth century. It was driven by debates between science and religion and by efforts to depict the medieval period as an era of backwardness. The idea that medieval people broadly believed in a flat Earth is characterized as a modern misconception.
By the end of the Middle Ages, after Magellan’s voyages concluded in 1522, belief in the Earth’s sphericity became firmly established among scholars [45].
Ancient maps did not have uniform orientation. North as the main direction is a recent development. In ancient cultures, map orientation was influenced by religious, astronomical, practical and symbolic factors, leading maps that faced east, south or north.
According to Podossinov ancient maps, did not always consider north as the main direction, a trend that has emerged in recent centuries [46]. In ancient societies, orientation was influenced by religious, astronomical, practical and symbolic factors, resulting in maps oriented towards the east, south or even north. Also, he classifies maps into three categories theoretical-scientific maps facing to the north, religious-didactic maps mappae mundi - oriented to east or south and practical-geographical or topographic maps with various orientations.
This diversity is not limited to world maps. As Dekker points out, celestial globes from Greek, Islamic, and medieval European traditions also display varied orientation systems, further confirming the lack of uniform practice across cultures [47].
As Edson notes, medieval mappae mundi exhibit a variety of orientations – eastward, northward, and other symbolic alignments [48]. Scholars now recognize these as complex, purpose driven design choices rather than a single uniform practice.
Although Hiatt (2007) argues that the Macrobius maps should not be reduced to purely religious, because the material already points to geographical and cosmological knowledge alongside symbolic interpretation. These maps depicted ocean currents, sea formation, and the relation of known and hypothesized regions [49].
Across several millennia, the materials used to make maps have shifted dramatically. Early maps used rocks and metals, later early plant-based and animal-based surfaces then industrial papers, synthetic films, and today’s digital media.
Aber and Aber suggests a concise historical progression of materials used in map printing beginning with papyrus, then parchment, silk, linen, either handmade or machine-made paper, eventually synthetic film and digital data images [5].
As Helal and Elshenawi noted that papyrus was a foundational writing/map surface in Egypt for over 4,000 years [50]. It offered portability, legibility, and was the default for ink-based drawing. Bülow-Jacobsen highlights that stone, ostraca, wood, and linen also served as common writing surfaces across the ancient world [51].
According to Hult, parchment and vellum replaced papyrus across the Mediterranean from late Antiquity to about the fourth century CE [52]. The transition from papyrus to parchment resulted from a combination of factors such as durability compared to papyrus, which was vulnerable to moisture and brittle. This durability allowed the preservation of texts for a more extended period, which was crucial to conserving religious texts and scriptures. These animal-skin products improved durability and two-sided writing/drawing. Which was better suited to codex formats, and more workable for detailed illustration. In addition, ease of use, availability, and the need for religious writing made parchment an essential material in the history of writing and cartography [53]. This transition began in the fourth, and by the end of the eighth century, most maps used parchment as constructed material.
In the Middle Ages, most maps were made of parchment. Exceptions are the Madaba mosaic map (560 CE) and the Tabula Rogeriana map (1157 CE), which is made of parchment and silver. Towards the end of the Middle Ages, maps of animal skin (vellum), such as the Carte Pisane (1300 CE), were also made of parchment [12].
Bloom (2017) and Hult (2011) marks that true paper, introduced into Europe by the twelfth century, became common by the fourteenth century [52,54].
Map content has changed through history. Ancient maps highlighted boundaries and resources. Later, Roman and late medieval maps focused on navigation, showing roads and ports. Information density also moved in cycles: from detailed Babylonian and Ptolemaic maps to simple schematic T-O maps, back to highly precise Portolan charts. As Talbert and Unger (2008) note, these shifts demonstrate how cartographic conventions adapted to real-world needs and available knowledge in each era, pointing to the mapping practices [4].
The historical development of map content demonstrates evolving relationships between societies and spatial environments across four major phases. During the Bronze Age, mapping practices were closely associated with local topographical management [55,56]. Studies from Crete, Sardinia, and Central Europe highlight patterns of settlement and landscape use.
Several researchers suggest that in the Hellenistic and Roman periods, cartography adopted more mathematical and administrative approaches [57,58]. It used geometry, and surveying for public works and governance structures.
During the Medieval period, maps were influenced by theological worldviews and served as symbolic or didactic representations of sacred geography and Christian cosmology [59,60].
Gaspar and Nicolai point out that the maritime revolution of the 13th century established an empirical and navigational mapping paradigm [61,62]. This shift is evident in the development of portolan charts and other nautical documents that focused on coastal accuracy, orientation, and functional use at sea.
Collectively, these phases demonstrate a long-term transition from socially embedded, locally informed spatial knowledge to increasingly technical and specialized cartographic systems.
Overall, cartography changed as societies changed. Maps reflected contemporary beliefs, cultural values, available technologies, and practical needs. They were not only tools for representing space but also ways of understanding the world.
Historical cartography remains relevant beyond its historical significance. Historical maps are increasingly integrated into GIS environments and are used for landscape reconstruction, environmental history, and the analysis of long-term geographical change. Consequently, the study of historical cartographic knowledge contributes not only to the history of science but also to contemporary geographical and Earth-science research [6,63,64,65].
5. Conclusions
The study of cartographic materials from Prehistory to the Middle Ages leads to several key conclusions about cosmology, Earth’s shape, map orientation, materiality and thematic content.
Ideas about Earth’s place in the universe moved from geocentrism to heliocentrism. This change took many centuries. The Earth-centred model was not just an astronomical idea but also an important framework that influenced religion, social order, and cultural meaning of the world.
Ancient Greek philosophers and scientists, including Pythagoras, Aristotle, and Eratosthenes, proved Earth’s spherical shape. This view stayed as the mainstream scholarly position throughout the Middle Ages. A few isolated models, such as Cosmas’s flat Earth, belonged to local theological views. They were not widely accepted.
Map orientation varied widely across cultures and periods. Babylonian and Ptolemaic maps often faced north. Medieval Christian maps (mappae mundi) pointed east. Islamic maps pointed south toward Mecca. These choices resulted from a mix of astronomical knowledge, religious practice, and cultural tradition.
The materials used in map-making changed over time. The earliest cartographic representations appeared on rock surfaces. Later followed by clay tablets, metal, papyrus, and finally parchment.
The content of maps also changed. During the Bronze Age, maps mainly served local land management. In Antiquity, they became more mathematical and administrative. In the medieval period, they turned toward theological and symbolic themes. By the 13th century, maps had become practical navigation tools.
The evolution of map-making was driven not only by advances in drawing techniques but also by continuous technological innovations, shifts in prevailing beliefs, and the expanding demand for practical maritime maps.
References
- Manolas, E.I. (Ed.) The Natural Environment in Ancient Greece; Department of Forestry and Environmental and Natural Resources Management, Democritus University of Thrace, 2010; (In Greek). ISBN 978-960-89345-9-7. [Google Scholar]
- Livieratos, E. 25 Centuries of Cartography and Maps. A Tour from the Iones to Ptolemy and Riga (El); Nea ekdosē.; Ekdoseis Zētē: Thessalonikē, 2007; ISBN 978-960-456-076-9. [Google Scholar]
- Harley, J.B.; Woodward, D. (Eds.) The History of Cartography, Vol. 1: Cartography in Prehistoric, Ancient and Medieval Europe and the Mediterranean; The History of Cartography Series; THE UNIVERSITY OF CHICAGO PRESS: Chicago and London, 1987; Vol. 1, ISBN 0-226-31633-5. [Google Scholar]
- Talbert, R.J.A.; Unger, R.W. Cartography in Antiquity and the Middle Ages: Fresh Perspectives, New Methods. In Cartography in Antiquity and the Middle Ages; Brill, 2008; ISBN 978-90-474-4319-3. [Google Scholar]
- Aber, S.E.W.; Aber, J. Map Librarianship: A Guide to Geoliteracy, Map and GIS Resources and Services; Chandos Publishing, 2016; ISBN 978-0-08-100045-8. [Google Scholar]
- Chiang, Y.-Y.; Duan, W.; Leyk, S.; Uhl, J.H.; Knoblock, C.A. Using Historical Maps in Scientific Studies: Applications, Challenges, and Best Practices; Springer International Publishing AG: Cham, SWITZERLAND, 2019; ISBN 978-3-319-66908-3. [Google Scholar]
- Gregory, I.N.; Healey, R.G. Historical GIS: Structuring, Mapping and Analysing Geographies of the Past. Prog. Hum. Geogr. 2007, 31, 638–653. [Google Scholar] [CrossRef]
- Knowles, A.K.; Hillier, A. Placing History: How Maps, Spatial Data, and GIS Are Changing Historical Scholarship; ESRI Press: Redlands, CA, 2008; ISBN 978-1-58948-013-1. [Google Scholar]
- Khodaei, H.; Nasiri Saleh, F.; Nobakht Dalir, A.; Zarei, E. Future Flood Susceptibility Mapping under Climate and Land Use Change. Sci. Rep. 2025, 15, 12394. [Google Scholar] [CrossRef] [PubMed]
- Bahn, P.G. Upper Palaeolithic Imagery. In The Cambridge World Prehistory; Renfrew, C., Bahn, P., Eds.; Cambridge University Press: Cambridge, 2014; pp. 1786–1802. ISBN 978-0-521-11993-1. [Google Scholar]
- Sommer, C.; Kandel, A.W.; Hochschild, V. The Use of Prehistoric ‘Big Data’ for Mapping Early Human Cultural Networks. J. Maps 2022, 18, 674–685. [Google Scholar] [CrossRef]
- Brotton, J. Great Maps; Dorling Kindersley Limited: London, 2015; ISBN 978-1-4093-4571-8. [Google Scholar]
- Snow, P.; Houston, R.; Mumford, S.; Merritt, E.; Darlison, M.; Stirling, H. (Eds.) History of the World Map by Map; Dorling Kindersley Limited: London, 2018; ISBN 978-0-241-22614-8. [Google Scholar]
- Brotton, J. A History of the World in Twelve Maps; Allen Lane: London, 2012; ISBN 978-0-14-103493-5. [Google Scholar]
- Matthew, C.A. Eratosthenes and the Measurement of the Earth’s Circumference (c.230 BC); Oxford University Press, 2023; ISBN 978-0-19-887429-4. [Google Scholar]
- Hunt, A. 2000 Years of Map Making. Geography 2000, 85, 3–14. [Google Scholar] [CrossRef]
- Melas, B.T. Gēs periodos pasēs (“Description of the Entire Earth”): A Brief History of Cartography; Morphōtiko Idryma Ethnikēs Trapezēs: Athēna, 1997; ISBN 978-960-250-140-5. [Google Scholar]
- Michailidou, E. History of Cartography; 2004. [CrossRef]
- Kavanagh, K. ‘Google Maps’ for Roman Roads Reveals Vast Extent of Ancient Network. Nature 2025, 647, 568–569. [Google Scholar] [CrossRef] [PubMed]
- Cheng-siang, C. The Historical Development of Cartography in China. Prog. Hum. Geogr. 1978, 2, 101–120. [Google Scholar] [CrossRef]
- Gong, Y. The Concept of Tianyuan Difang and the Evolution of Single-Sheet Tianxia Tu in Ancient China (before around 1600 AD). Int. j. anthropol. ethnol. 2025, 9, 3. [Google Scholar] [CrossRef]
- Choubey, A.; Bansal, T. Maps and Mapmaking in Medieval Times: A Retrospect. 2017, 37, 41–47. [Google Scholar]
- Shea, R.W.; Bell, D. Charting the Unknown: Islamic Cartography and Visions of Africa in the ‘Abbasid Era. Hist. Afr. 2019, 46, 37–56. [Google Scholar] [CrossRef]
- Stone, J.R. The Medieval Mappaemundi: Toward an Archaeology of Sacred Cartography. Religion 1993, 23, 197–216. [Google Scholar] [CrossRef]
- Barber, P. (Ed.) The Map Book; Levenger Press: New York; Walker & Company: [Delray Beach, FL], 2005; ISBN 978-0-8027-1474-9. [Google Scholar]
- Barber, P. (Ed.) The map book (greek); Eκδόσεις Aλεξάνδρεια: Athens, 2006; ISBN 978-960-221-348-3. [Google Scholar]
- Turnbull, D. Cartography and Science in Early Modern Europe: Mapping the Construction of Knowledge Spaces. Imago Mundi 1996, 48, 5–24. [Google Scholar] [CrossRef]
- Andrews, M.C., III. The Study and Classification of Medieval Mappae Mundi. Archaeologia 1926, 75, 61–76. [Google Scholar] [CrossRef]
- Olsson, G. Mappae Mundi Medievalis. In Abysmal: A Critique of Cartographic Reason; Olsson, G., Ed.; University of Chicago Press, 2007; p. 0. ISBN 978-0-226-62930-8. [Google Scholar]
- Woodward, D. 18 · Medieval Mappaemundi. In Cartography in Prehistoric, Ancient, and Medieval Europe and the Mediterranean; The History of Cartography, 1987; Vol. 1, pp. 286–370. [Google Scholar]
- Tolias, G. Greek Nautical Charts - Portolan Charts, 15th-17th Centuries: A Contribution to Early Modern Mediterranean Cartography, (in Greek), 1st ed.; Olkos: Athens, 1999. [Google Scholar]
- Cachey, T.J. Cosmology, Geography, and Cartography. In Dante in Context; Literature in Context; Pertile, L., Barański, Z.G., Eds.; Cambridge University Press: Cambridge, 2015; pp. 221–240. ISBN 978-1-139-51937-3. [Google Scholar]
- Ferngren, G.B. Religion and Sciences. In International Encyclopedia of the Social & Behavioral Sciences; Elsevier, 2015; pp. 284–291. ISBN 978-0-08-097087-5. [Google Scholar]
- Mayor, A. GEOMYTHOLOGY. In Encyclopedia of Geology; Elsevier, 2005; pp. 96–100. ISBN 978-0-12-369396-9. [Google Scholar]
- Kessler, F.C. Projections. In International Encyclopedia of Human Geography; Elsevier, 2020; pp. 41–60. ISBN 978-0-08-102296-2. [Google Scholar]
- Horowitz, W. Mesopotamian Cosmic Geography; Mesopotamian civilizations; Eisenbrauns: Winona Lake, Ind, 1998; ISBN 978-0-931464-99-7. [Google Scholar]
- Livieratos, E. A Trip in the Dominance of Maps. Stories about Therepresentation of the Widening of the World (El); Ekdoseis Zētē: Thessalonikē, 2007; ISBN 978-960-456-050-9. [Google Scholar]
- Talbert, R.J.A. Ancient Perspectives: Maps and Their Place in Mesopotamia, Egypt, Greece, and Rome; The Kenneth Nebenzahl, Jr., lectures in the history of cartography; The University of Chicago Press: Chicago London, 2012; ISBN 978-0-226-78937-8. [Google Scholar]
- Kočandrle, R. The Earth as a Cosmic Body in Pre-Socratic Cosmology. Filos. Časopis 2020, 68, 659–677. [Google Scholar] [CrossRef]
- Kočandrle, R. Heaven as the Outermost Periphery of the Earth in Archaic Ionian Cosmologies. HB 2022, 27, 185–212. [Google Scholar] [CrossRef]
- Graham, D.W. The Development of Greek Cosmology. In Ancient Cultures of Sciences and Knowledge; Mohr Siebeck GmbH and Co. KG, 2024; Vol. 3, pp. 381–397. [Google Scholar]
- Lomas, T.; Case, B. A History of Psychogeography and Psychocosmology: Humankind’s Evolving Orientation on Earth and in Space. Curr. Res. Ecol. Soc. Psychol. 2023, 4, 100090. [Google Scholar] [CrossRef]
- Lira, J.A. If the Earth Were a Cube, What Would Be the Value of the Acceleration of Gravity at the Center of Each Face? Phys. Educ. 2018, 53, 065013. [Google Scholar] [CrossRef]
- Piva, H.C. Flat Earth Cartosemiotics and Modelling. In Feeling, Skill and Knowledge: Semiotics of the Subject in Environment, Culture and World; Numanities - Arts and Humanities in Progress; Ojala, J., Bauters, M., Díaz-Kommonen, L., Eds.; Springer Nature: Cham, Switzerland, 2025; Vol. 32, pp. 101–113. ISBN 978-3-031-95998-1. [Google Scholar]
- El-Sharif, A.-R.; Shqair, M.; Amjad, M.; Qaraq, O.A.; Al-Ahmed, S. The Evidence of the Early Scholars on the Sphericity of the Earth in the Light of Contemporary Applied and Digital Research. In Artificial Intelligence in the Digital Era;Studies in Systems, Decision and Control; Al-Ramahi, N., Musleh Al-Sartawi, A.M.A., Kanan, M., Eds.; Springer Nature Switzerland: Cham, 2026; Vol. 594, pp. 2809–2816. ISBN 978-3-031-89770-2. [Google Scholar]
- Podossinov, A.V. Die Orientierung Der Alten Karten von Der Ältesten Zeit Bis Zum Frühren Mittelalter. Cartogr. Helv. 1993. [Google Scholar] [CrossRef]
- Dekker, E. Illustrating the Phaenomena: Celestial Cartography in Antiquity and the Middle Ages; Oxford University Press, 2012; ISBN 978-0-19-960969-7. [Google Scholar]
- Edson, E. The Medieval World View: Contemplating the Mappamundi. Hist. Compass 2010, 8, 503–517. [Google Scholar] [CrossRef]
- Hiatt, A. The Map of Macrobius before 1100. Imago Mundi 2007, 59, 149–176. [Google Scholar] [CrossRef]
- Helal, W.M.K.; Elshenawi, D.M. From Papyrus to Paper: Evolution of Writing Supports in Egypt. BioRes 2026, 21, 3821–3830. [Google Scholar] [CrossRef]
- Bülow-Jacobsen, A. Writing Materials in the Ancient World. In The Oxford Handbook of Papyrology; Bagnall, R.S., Ed.; Oxford University Press, 2012; pp. 3–29. ISBN 978-0-19-984369-5. [Google Scholar]
- Hult, D.F. Manuscripts and Manuscript Culture. In The Cambridge History of French Literature; Burgwinkle, W., Hammond, N., Wilson, E., Eds.; Cambridge University Press, 2011; pp. 11–19. ISBN 978-0-521-89786-0. [Google Scholar]
- di Curci, M. The History and Technology of Parchment Making. Available online: https://scribes.lochac.sca.org/articles/parchment.htm (accessed on 14 January 2025).
- Bloom, J.M. Papermaking: The Historical Diffusion of an Ancient Technique. In Mobilities of Knowledge; Knowledge and Space; Jöns, H., Meusburger, P., Heffernan, M., Eds.; Springer International Publishing: Cham, 2017; Vol. 10, pp. 51–66. ISBN 978-3-319-44653-0. [Google Scholar]
- Argyriou, A.V.; Teeuw, R.M.; Sarris, A. GIS-Based Landform Classification of Bronze Age Archaeological Sites on Crete Island. PLoS ONE 2017, 12, e0170727. [Google Scholar] [CrossRef] [PubMed]
- Earle, T.; Kristiansen, K. (Eds.) Organizing Bronze Age Societies: The Mediterranean, Central Europe, and Scandanavia Compared; Cambridge University Press: Cambridge, 2010; ISBN 978-0-521-76466-7. [Google Scholar]
- Michel, C.; Chemla, K. Mathematics, Administrative and Economic Activities in Ancient Worlds: An Introduction. In Mathematics, Administrative and Economic Activities in Ancient Worlds; Michel, C., Chemla, K., Eds.; Springer International Publishing: Cham, 2020; pp. 1–48. ISBN 978-3-030-48389-0. [Google Scholar]
- Sauvage, M. Mathematical Computations in the Management of Public Construction Work in Mesopotamia (End of the Third and Beginning of the Second Millennium BCE). In Mathematics, Administrative and Economic Activities in Ancient Worlds; Michel, C., Chemla, K., Eds.; Springer International Publishing: Cham, 2020; pp. 201–237. ISBN 978-3-030-48389-0. [Google Scholar]
- Kupfer, M. Medieval World Maps: Embedded Images, Interpretive Frames. Word Image 1994, 10, 262–288. [Google Scholar] [CrossRef]
- Lilley, K.D. (Ed.) Mapping Medieval Geographies; Cambridge University Press: Cambridge, 2014; ISBN 978-1-107-03691-8. [Google Scholar]
- Gaspar, J.A. The Liber de Existencia Riveriarum (c.1200) and the Birth of Nautical Cartography. Imago Mundi 2019, 71, 1–21. [Google Scholar] [CrossRef]
- Nicolai, R. The Premedieval Origin of Portolan Charts: New Geodetic Evidence. Isis 2015, 106, 517–543. [Google Scholar] [CrossRef] [PubMed]
- Bender, O.; Boehmer, H.J.; Jens, D.; Schumacher, K.P. Using GIS to Analyse Long-Term Cultural Landscape Change in Southern Germany. Landsc. Urban Plan. 2005, 70, 111–125. [Google Scholar] [CrossRef]
- Petek, F.; Urbanc, M. The Franziscean Land Cadastre as a Key to Understanding the 19th-Century Cultural Landscape in Slovenia. AGS 2004, 44, 89–113. [Google Scholar] [CrossRef]
- Rumsey, D.; Williams, M. Historical Maps in GIS. In Past Time, Past Place: GIS for History; Knowles, A.K., Ed.; Esri Press, 2002; p. 18. ISBN 978-1-58948-032-2. [Google Scholar]
Figure 1.
Chronological timeline of the material used to make maps through time. It covers Prehistory to the Middle Ages.
Figure 1.
Chronological timeline of the material used to make maps through time. It covers Prehistory to the Middle Ages.
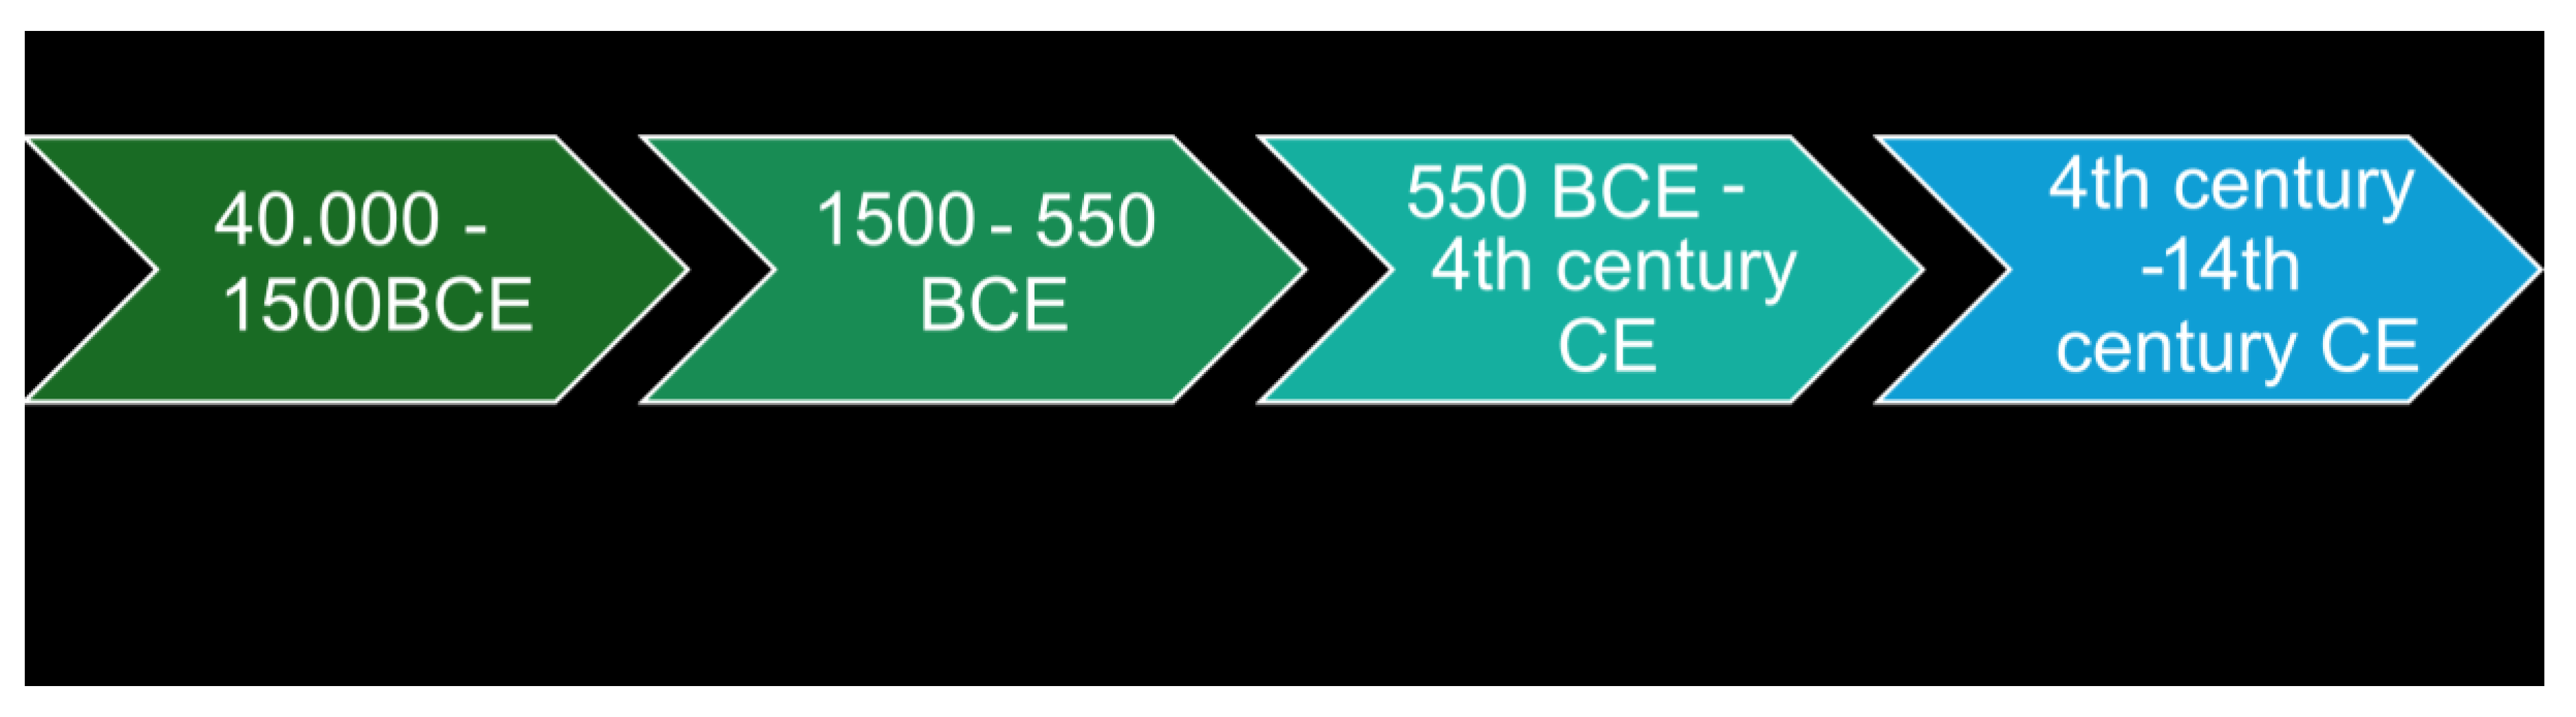
Figure 2.
Flowchart of the evolution of cartographic materials from Prehistory to the Middle Ages. It traces the transition from rock and clay to metal, papyrus, and parchment.
Figure 2.
Flowchart of the evolution of cartographic materials from Prehistory to the Middle Ages. It traces the transition from rock and clay to metal, papyrus, and parchment.
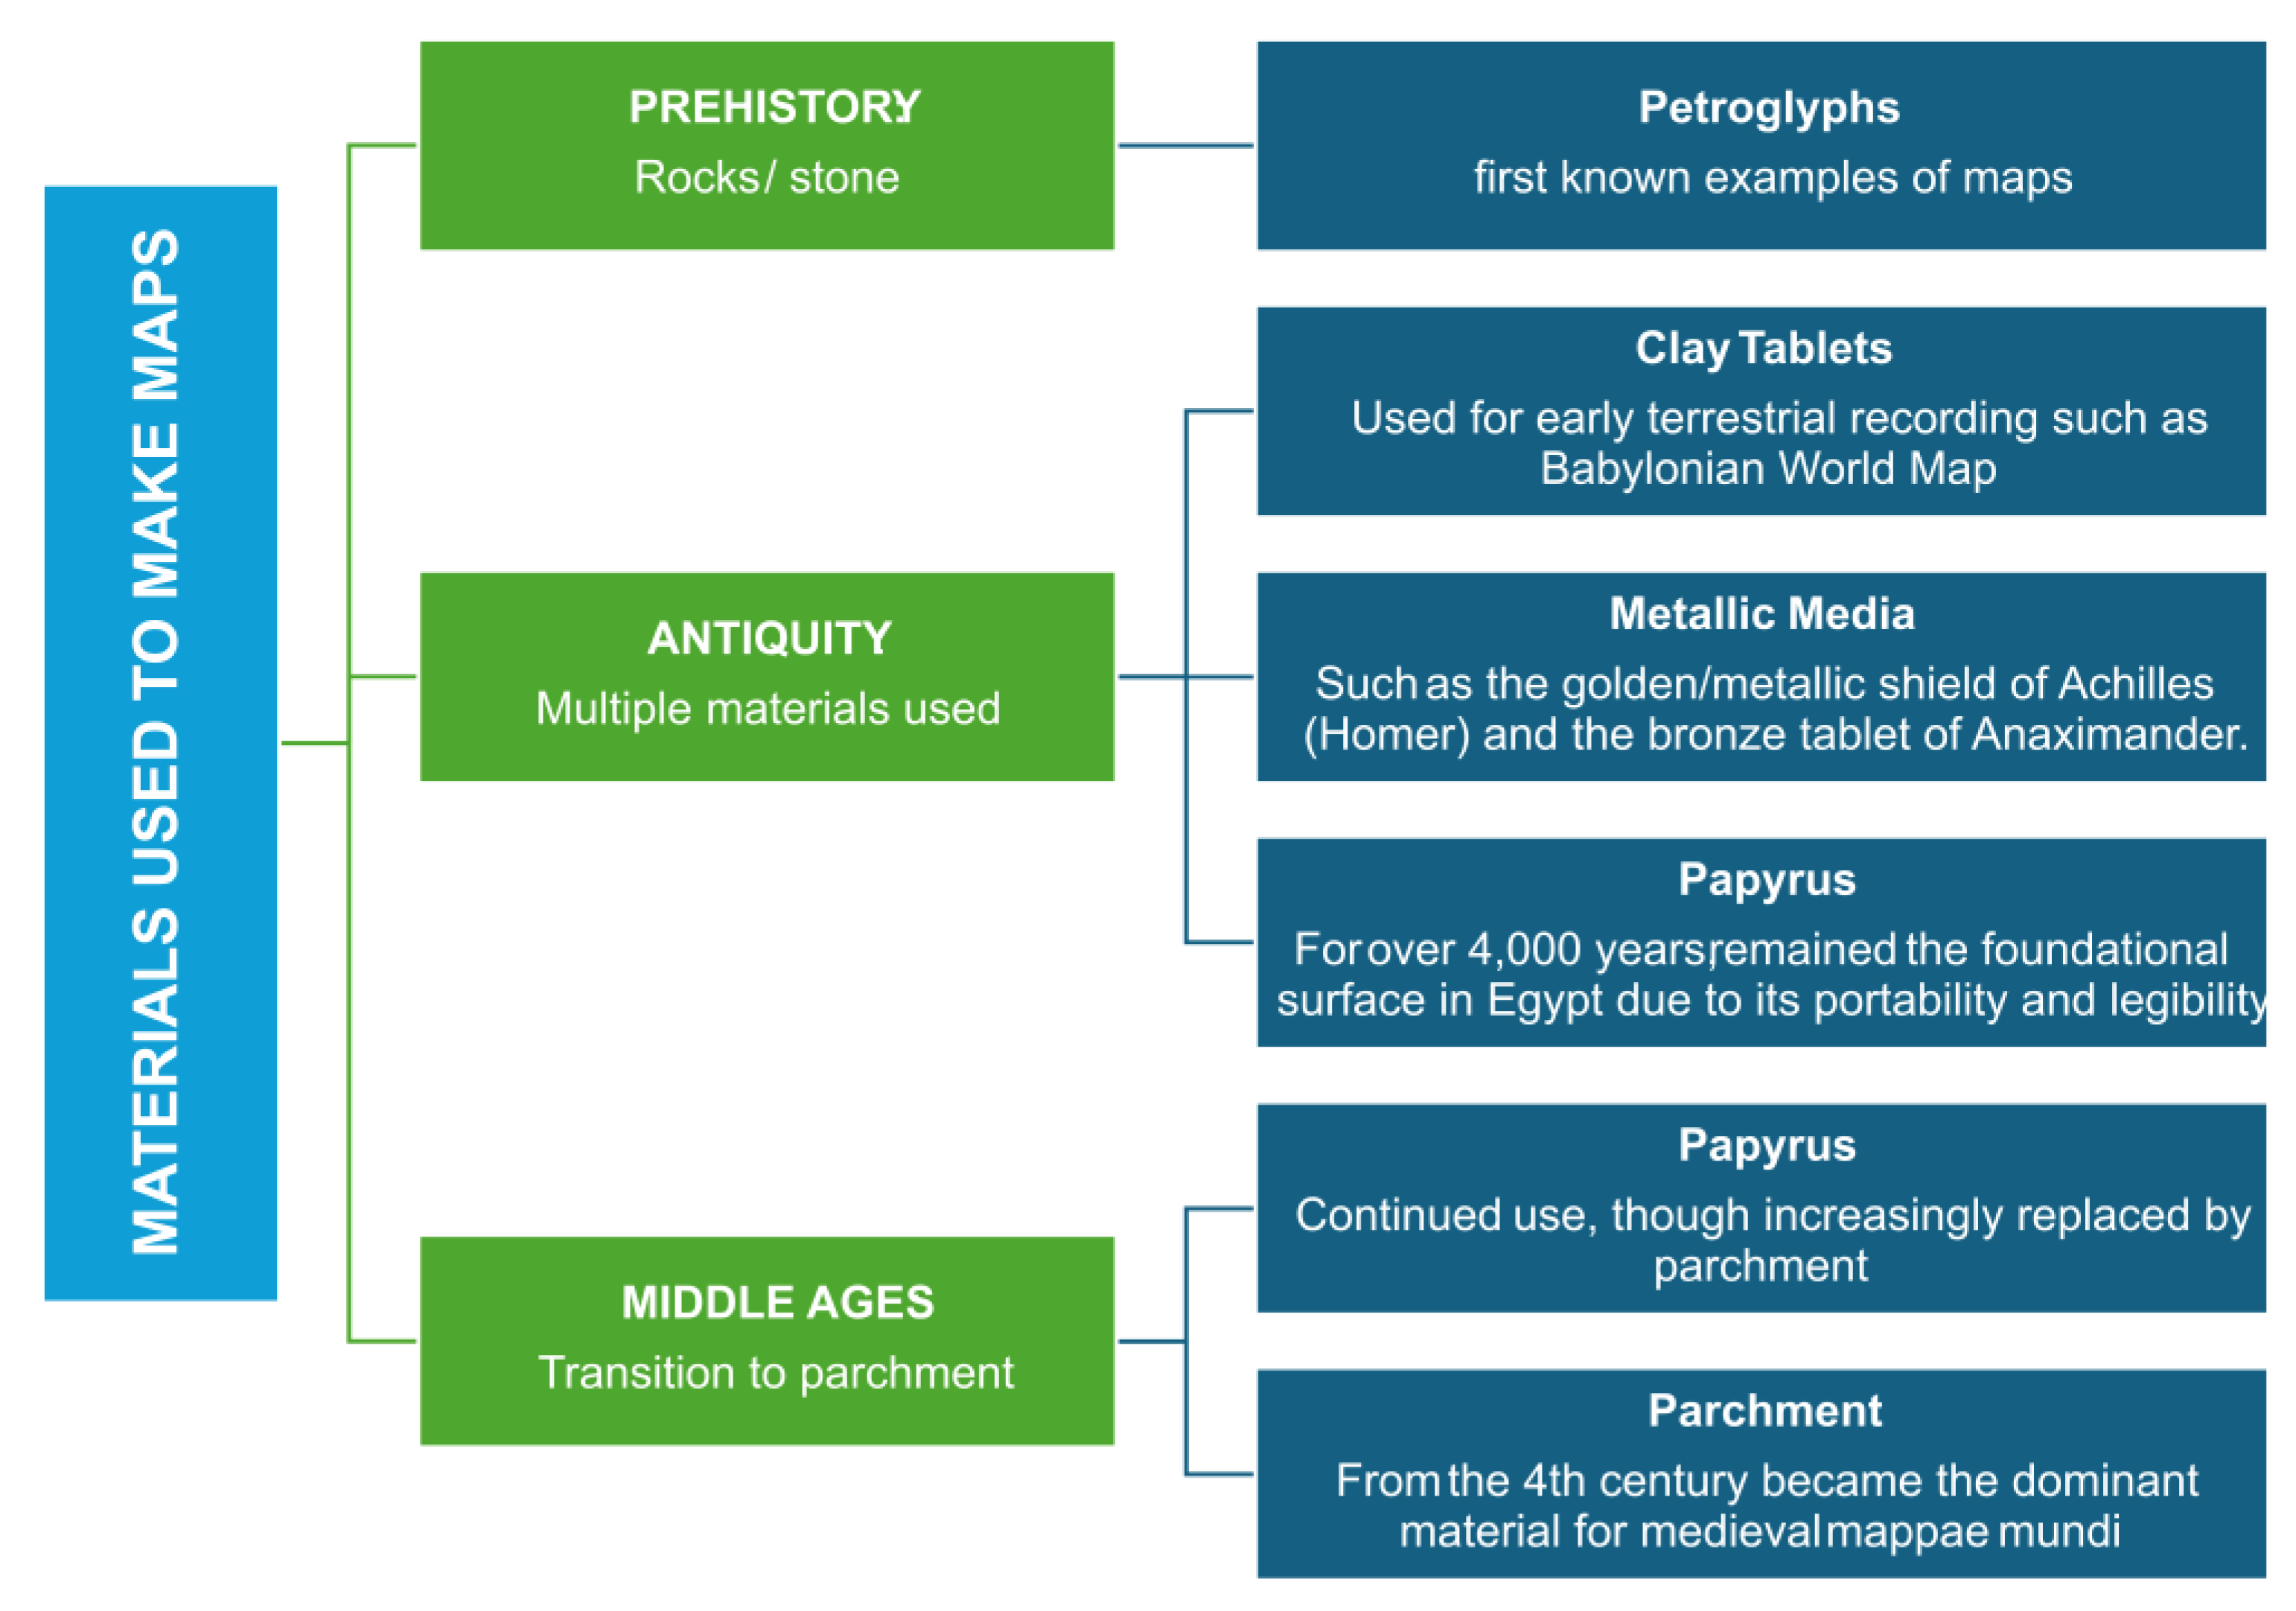

Table 1.
Earth’s place in the Universe from Antiquity to the Renaissance. A chronological overview of cosmological ideas and influential scientists, correlating historical periods with dominant views on Earth’s position.
Table 1.
Earth’s place in the Universe from Antiquity to the Renaissance. A chronological overview of cosmological ideas and influential scientists, correlating historical periods with dominant views on Earth’s position.
| Period | Important Philosophers/Scientists | Earth’s place in the Universe |
|---|---|---|
| Antiquity | Aristotle (384-322 BCE) | Geocentric model |
| Aristarchus of Samos (310-230 BCE) | Heliocentric model | |
| Claudius Ptolemy | Geocentric model | |
| Middle Ages | Church doctrine | Geocentric model |
| 16th century | Nicolaus Copernicus | Heliocentric model |
| 17th Century | Galileo Galilei | Heliocentric model |
Table 2.
Evolution of the theories about Earth’s shape. From Antiquity to Middle Ages.
| Period | Map | Person | Earth’s shape | Notes |
|---|---|---|---|---|
| 8th century BCE | Shield of Achilles | Homer | Flat circular | Epic poet Iliad |
| 600 BCE | Babylonian world map | Babylonians | Circular disk | |
| 550 BCE | Anaximander map | Anaximander | Circular disk | |
| 510 BCE | Anaximander map | Hecataeus | Circular disk | |
| 580-500 BCE | Pythagoras | Spherical and rotation around an axis | ||
| 340 BCE | Aristotle | Spherical | ||
| 250 BCE | Eratosthenes | Spherical | First measurement of the Earth | |
| 270-180 BCE | Crates | Spherical | Created the first Globe, | |
| 180-120 BCE | Hipparchus | Spherical | Invented a system of meridians and parallels | |
| 85 BCE | Poseidonius | Spherical | Second measurement of the Earth | |
| 1st century BCE | Geographical | Strabo | Spherical | |
| 2nd century CE | Geographia | Claudius Ptolemy | Spherical | |
| 536 CE | Christian Topography | Cosmas Indicoplestis | flat and elongated | |
| Middle Ages 5th – 14th century CE |
Mappae mundi | Symbolic flat disk (theological, not geographical) |
Table 3.
Features of historical world maps from 2500 BCE to 1300 CE. It includes map creators, materials, depictions (e.g., road networks, theological symbols), and orientation.
Table 3.
Features of historical world maps from 2500 BCE to 1300 CE. It includes map creators, materials, depictions (e.g., road networks, theological symbols), and orientation.
| Period | Map / Cartographer | Material | Depiction | Orientation |
|---|---|---|---|---|
| 2500 BCE | Akkadian Map (Babylonians) |
Clay tablet | Mountains, valleys, and agricultural plots of land with inscriptions. | East |
| 1500 BCE | Bedolina Petroglyph (Unknown) |
Rock (Petroglyph) | Topographical plan of a settlement with fields, paths, and houses. | Local / Descriptive |
| 1500 BCE | Map of Nippur (Babylonians) |
Clay tablet | Accurate plan of the city showing walls, the Euphrates River, and the central temple. | approximately 45° west of north. |
| 600 BCE | Babylonian Map of the World (Babylonians) |
Clay tablet | Circular world with Babylon at the center, the Euphrates, and a “Bitter River” (ocean) surrounding it. | North |
| 550-510 BCE | Maps of Anaximander & Hecataeus | Wooden/Bronze board or Papyrus | The inhabited Earth (Oecumene) as a disk surrounded by an ocean, with Greece at the center. Divided into Europe and Asia. | Unknown |
| 250-150 BCE | Eratosthenes & Hipparchus | Papyrus | Introduction of meridians and parallels (geographic grid). The first scientific depiction of a spherical Earth. | North |
| 20 CE | Map of Agrippa | Marble | The Roman Empire with an emphasis on its provinces and the road network. | East |
| 150 CE | Geographia (Claudius Ptolemy) |
Papyrus / Parchment | The entire known world from the Canary Islands to China, using mathematical projections and coordinates. | North |
| 4th CE | Tabula Peutingeriana (Castorius) |
Parchment roll | Schematic diagram of the empire’s road network (similar to a modern subway map), heavily distorted in length. | East |
| 536 CE | Christian Topography (Cosmas Indicopleustes) |
Parchment (Manuscript) | The world depicted as a rectangular box, based on the biblical Tabernacle. | - |
| 560 CE | Madaba Map | Mosaic | Detailed map of Palestine with Jerusalem located prominently in the center. | East (facing the church’s altar) |
| 630 CE | T-O Map (Isidore of Seville) |
Parchment | Schematic circle (O) divided into three parts (T): Asia (top), Europe, and Africa. | East (Paradise at the top) |
| 1154 CE | Tabula Rogeriana (Al-Idrisi) |
Solid silver / Parchment | Highly detailed mapping of Europe, Asia, and North Africa. | South (Mecca at the top) |
| 1235-1300 CE | Ebstorf & Hereford Maps (Mappa Mundi) |
Parchment / Vellum | Theological maps featuring Jerusalem at the center, Christ embracing the world, and various mythical creatures. | East |
| 1300 CE | Carte Pisane (Portolan chart) |
Treated animal skin | Accurate coastlines of the Mediterranean and Black Sea, designed specifically for maritime navigation. | North (due to compass use) |
Disclaimer/Publisher’s Note: The statements, opinions and data contained in all publications are solely those of the individual author(s) and contributor(s) and not of MDPI and/or the editor(s). MDPI and/or the editor(s) disclaim responsibility for any injury to people or property resulting from any ideas, methods, instructions or products referred to in the content. |
© 2026 by the authors. Licensee MDPI, Basel, Switzerland. This article is an open access article distributed under the terms and conditions of the Creative Commons Attribution (CC BY) license (http://creativecommons.org/licenses/by/4.0/).
Copyright: This open access article is published under a Creative Commons CC BY 4.0 license, which permit the free download, distribution, and reuse, provided that the author and preprint are cited in any reuse.