

Submitted:
04 September 2026
Posted:
07 September 2026
You are already at the latest version
Abstract
A central feature of episodic memory is the ability to transform similar and overlapping experiences into distinct representations, a process known as pattern separation. This function is critically linked to the hippocampus, particularly the dentate gyrus (DG) and its projections to CA3. Here, we introduce the Visual Sensory Memory Task (VSMT) as a novel paradigm for assessing mnemonic similarity processes in healthy adults. The VSMT uses asemantic visual stimuli derived from abstract pink-noise images and allows controlled manipulation of stimulus similarity while minimizing learning effects. Behavioral results showed reliable discrimination between targets and foils, whereas low-similarity lures were more difficult to identify than high-similarity lures, providing initial evidence for sensitivity to mnemonic similarity. Using 3T fMRI, we measured BOLD responses during encoding of asemantic stimuli. Robust bilateral hippocampal activation was observed across all stimulus categories. Exploratory atlas-guided localization suggested distributed activation for foils, whereas activation peaks for targets and high-similarity lures were spatially localized to regions encompassing CA1 and CA4/DG, respectively. These localizations should not be interpreted as evidence of subfield-specific activation given the spatial resolution of the functional data. Consistent with previous studies using explicit memory paradigms such as the Mnemonic Similarity Task, the VSMT differences in hippocampal BOLD response magnitude associated with mnemonic similarity processing. These univariate activation differences are compatible with predictions derived from pattern separation accounts but do not directly demonstrate representational pattern separation. Together, these findings provide initial evidence for the feasibility and potential utility of the VSMT for investigating hippocampal mechanisms related to mnemonic similarity and pattern separation.
Keywords:
memory
; pattern separation
; visual sensory memory test
; hippocampus
; fMRI
; neuroimaging
1. Introduction
In their everyday lives, people are constantly confronted with events that are similar in time, space or context. In order to prevent interference in episodic memory formation, it is essential to distinguish between similar environmental stimuli. The medial temporal lobe, in particular the hippocampus, plays a decisive role in this ability. The hippocampus facilitates the rapid storage of novel information separate from pre-existing representations that bear similarity. This is achieved via pattern separation (PS), the cognitive process of generating distinct, orthogonal neural representations from similar episodic inputs (McClelland et al., 1995). Conversely, during pattern completion (PC), memory retrieval is enabled from incomplete, noisy, or degraded stimuli (Norman & O’Reilly, 2003).
It is generally accepted that the hippocampus is significantly involved in this subfunction of episodic memory formation (Bakker et al., 2008; Lacy et al., 2011; Lee et al., 2004; Leutgeb et al., 2007; Nash et al., 2021). Thus, it assigns different neural codes to similar events to prevent interference or overwriting during retrieval (Lee et al., 2004; Leutgeb et al., 2007). The memory process of PS is considered a critical computation performed by a dedicated subnetwork system, specifically the hippocampal subregion of the dentate gyrus (DG) (Berron, Schütze, et al., 2016; Hainmueller & Bartos, 2020; Hanert, Rave, et al., 2019; Marr, 1971; Neunuebel & Knierim, 2014; O’Reilly & McClelland, 1994; Riphagen et al., 2020; Treves & Rolls, 1994).
Computational and animal studies have provided an important theoretical and mechanistic basis for current models of hippocampal pattern separation. Electrophysiological studies in rodents have demonstrated pattern-separation-related transformations in the DG and CA3 (Leutgeb et al., 2007), while simultaneous recordings from both regions have provided evidence for a functional dissociation between pattern separation in the DG and pattern completion in CA3 (Neunuebel & Knierim, 2014). These findings provide an important mechanistic framework for studies of pattern separation in humans. Converging evidence from human lesion and clinical populations further supports the relevance of hippocampal integrity for mnemonic discrimination and pattern separation (Hanert, Pedersen, et al., 2019; Hanert, Rave, et al., 2019). High-resolution fMRI studies have demonstrated response profiles in CA3/DG consistent with pattern separation (Bakker et al., 2008a; Lacy et al., 2011), while multivariate high-resolution fMRI has provided evidence for differentiated representations of similar inputs in the human DG (Berron, Schütze, et al., 2016).
In humans, commonly used and established memory paradigms rely on concrete, semantically meaningful material and have been shown to tax hippocampal pattern separation (Hanert, Rave, et al., 2019; Kirwan & Stark, 2007; Nash et al., 2021; Stark et al., 2013a). A prominent example of these tests is the Mnemonic Similarity Task (MST) (Kirwan & Stark, 2007; Stark et al., 2013a), an object recognition memory task that uses images of familiar and nameable everyday objects (targets) as stimuli to be learned implicitly, which, after an encoding phase, have to be discriminated from completely new (foils) or to different degrees similar images of objects (lures). The test is thus intuitively understandable and can be performed by different groups of people, such as children or persons with neurological diseases. However, problems arise on the one hand due to the familiarity and concreteness of the depicted objects. Thus, it cannot be excluded that memory performance is also influenced by different prior knowledge about the pictures of objects to be remembered. While potential familiarity or learning effects resulting from repeated administration of the MST have not been systematically investigated, they cannot be ruled out entirely. Available evidence suggests that any such effects, if present, are likely to be small. For example, Stark et al. (2023) reported modest improvements restricted to the initial retesting session, indicating that repeated-test bias appears limited under standard testing conditions. Nevertheless, given the lack of extensive longitudinal validation, the possibility of subtle learning effects remains an open question that warrants further empirical study (Stark et al., 2023). On the other hand, an objective determination of different levels of similarity between concrete, nameable objects proves to be difficult (Liu et al., 2016). In the MST, lure similarity is based on subjective perceptual judgments rather than on a quantifiable manipulation of stimulus overlap, which limits experimental control and comparability across studies.
1.1. Visual Sensory Memory Task
To overcome these limitations, Kaernbach and colleagues developed the Visual Sensory Memory Task (Kaernbach et al., 2017), a new asemantic paradigm designed to assess pattern separation. The VSMT uses abstract pink-noise images instead of everyday objects as learning stimuli and can therefore be considered conceptually closer to hippocampal processing that is independent of semantic content. While both the MST and the VSMT require participants to distinguish previously learned images (targets) from similar (lures) and entirely new (foils) images the VSMT allows precise, parametric manipulation of stimulus similarity. While the MST relies on subjectively perceived similarity between everyday objects, the VSMT introduces an objective, parametrically controlled measure of stimulus similarity. This approach ensures that differences in mnemonic performance can be directly linked to a quantifiable manipulation of perceptual overlap, rather than to idiosyncratic or experience-based judgments of similarity. Although participants ultimately make subjective recognition decisions, the use of objectively defined lure similarity enhances experimental control and reproducibility, and facilitates parametric modeling of pattern separation processes in the hippocampus. This level of experimental control is particularly important given evidence that prior knowledge and experience can significantly influence memory encoding and retrieval (Brod et al., 2013).
To generate the stimuli (see Figure 1 for an example), white-noise images were Fourier-transformed, multiplied by a 1/f filter, and inverse-transformed. The resulting stimuli were then multiplied by a Gaussian envelope (σ = 30 % of the image radius, i.e., the distance from center to edge) to discourage memory strategies based on edge artefacts. These images share the same frequency composition as natural scenes (Field, 1987), suggesting that encoding and retrieval processes may be comparable to those elicited by real-world stimuli as used in the MST despite their abstract nature. Because spatial frequency strongly influences early visual cortical processing, which in turn shapes the perceptual inputs reaching medial temporal regions (Kauffmann et al., 2014), matching the frequency content of VSMT and MST stimuli helps ensure that early-stage visual processing—and consequently the information available to the hippocampus—is comparable across the two tasks.
A further major advantage of these asemantic stimuli is that they minimize the influence of prior knowledge, thereby enhancing comparability across participants and allowing better experimental control over potential confounding factors. Furthermore, by eliminating semantic and culturally specific content, the VSMT can be considered more culture-fair than object-based paradigms, as its abstract stimuli reduce the impact of language, cultural background, and prior experience on task performance.
The present study introduces and characterizes the recently developed Visual Sensory Memory Task (VSMT) (Kaernbach et al., 2017) and provides a first neuroimaging investigation of its associated neural correlates. The VSMT offers a novel, asemantic approach to assess hippocampal pattern separation using parametrically controlled noise stimuli that minimize the influence of semantic knowledge and stimulus familiarity. At the behavioural level, we first sought to establish the performance characteristics of this new task and to examine whether participants’ response patterns show the hallmark features of mnemonic discrimination previously reported for the MST (Kirwan & Stark, 2007; Stark et al., 2013b).
At the neural level, we provide a first assessment of hippocampal BOLD responses associated with the VSMT. If the VSMT engages comparable mnemonic computations, we expected a similar response profile—namely, that the magnitude of BOLD responses to lures would more closely resemble that observed for novel stimuli than for repeated ones. This prediction is based on prior evidence from the MST and other recognition memory tasks showing that activity in the DG and CA3 subfields of the hippocampus reflects pattern separation processes (Berron et al., 2016; Stevenson et al., 2020). Specifically, CA3 and DG exhibit greater activation for lure items that are similar but not identical to previously encountered stimuli, and their activation patterns more closely resemble those evoked by novel stimuli than those for repeated targets (Bakker et al., 2008; Lacy et al., 2011). In contrast, CA1 and parahippocampal regions are more strongly engaged during pattern completion, showing increased similarity between lure and target representations. In the present study, a lure–novel resemblance in univariate BOLD response magnitude was therefore considered compatible with predictions derived from pattern separation accounts, rather than as a direct measure of representational similarity or neural pattern separation. This functional dissociation between CA3 and CA1 has also been observed across other paradigms probing pattern separation and completion, including a virtual reality paradigm (Dimsdale-Zucker et al., 2018). This pattern is consistent with findings showing that the DG acts as a domain-agnostic pattern separator, responding to both spatial and sequential changes, while CA1 activity is more sensitive to the degree rather than the type of change (Azab et al., 2014).
The present study serves as a pilot validation of the VSMT, primarily addressing its feasibility and initial behavioural and neural correlates, and laying the groundwork for future studies aimed at establishing its reliability, convergent validity, and generalizability.
2. Materials and Methods
2.1. Participants
We included 23 right-handed subjects (laterality quotient 89.6 ± 8.7) according to the Edinburgh Handedness Inventory (Oldfield, 1971) (14 female; age: M ± SD = 25.3 ± 0.8 years), to reduce inter-individual variability in hemispheric lateralization of hippocampal and medial temporal lobe functions. All participants were free of neurological or psychiatric pre-existing diseases and without regular medication, and with normal or corrected-to-normal vision. The study was approved by the Ethics Committee of the Medical Faculty of the University of Kiel and was conducted in full accordance with the Declaration of Helsinki. Written informed consent was obtained from all participants.
2.2. Generation of Stimuli
To generate lures with varying degrees of similarity to target stimuli, we blended a target image and a confound image pixel-wise using a mixing proportion . For each pixel, the lure value was calculated as:
where and denote the pixel values of the target and confound images respectively. The mixing parameter defines the relative contribution of the target and confound (lure) images, enabling a gradual transformation from the target stimulus to the lure stimulus. The denominator serves as a normalization factor to maintain consistent variance across different mixing proportions. This means that lures can be generated with systematically varying physical similarity to the corresponding target (Liu et al., 2016). For stimuli generated according to Equation 1, the squared Pearson correlation between the resulting lure and its corresponding target is determined by the mixing parameter qq as follows (Kaernbach et al., o. J.):
Previous psychophysical work with the VSMT showed that psychological lure sensitivity approximately followed a fourth-order power function of the physical lure–target correlation, with an estimated exponent close to four (Kaernbach et al., o. J.). Accordingly, the quartic lure–target correlation )was used as an approximate psychophysical similarity scale.
For this version of the VSMT we chose three similarity levels, 0.25, 0.50, and 0.75 (lure25, lure50, and lure75), corresponding to mixing parameters q ≈ 0.50, 0.61, and 0.72, respectively (Figure 1). Foil stimuli were generated using the same procedure but with a target–foil correlation of r4 < 0.01, ensuring negligible similarity to the corresponding target while preserving the overall statistical properties of the stimulus class. To minimize unintended similarities between the three different stimulus sets, the stimulus generation algorithm included an explicit decorrelation procedure. Upper limits were imposed on inter-target and target–foil correlations, resulting in negligible residual cross-set correlations that were several orders of magnitude smaller than the experimentally manipulated target–lure similarities.
2.3. Experimental Design
2.3.1. Behavioural Pretest
We conducted a pilot study (n = 23) in which the VSMT was carried outside the MRI on a PC with the same subjects as in the main study. The data of 22 subjects were included because one person´s recordings on the PC was technically impaired. This pretest was conducted to assess task comprehension and feasibility and to explore whether response patterns differed between testing outside and inside the scanner. As the pretest was shorter than the fMRI task (10 blocks, but followed the same structure otherwise) and was consistently administered before the scanner session, this comparison was not intended as a test of test–retest reliability.
2.3.2. Neuropsychological Assessment
A comprehensive neuropsychological test battery was conducted within the pretest as well as within the main experiment to test episodic memory (Rey auditory verbal learning test, RAVLT (Rey, 1941)), working memory (digit span forward and backward), executive functioning (Trail-Making Test A and B, TMT (Reitan, 1992), Regensburg word fluency test (Aschenbrenner et al., 2000)) and premorbid general intelligence (Mehrfach-Wortschatz-Intelligenztest-B, MWT-B; as a German equivalent of the National Adult Reading Test (Lehrl, 2005)) as described by Finke and colleagues (Finke et al., 2017). These assessments were not only administered to test cognitive functions but also to characterize the sample in terms of cognitive abilities and general intellectual functioning.
2.3.3. fMRI Task Design and Procedure
The experimental paradigm was divided into an encoding and a test phase. In the encoding phase, three images were presented one after the other in the same order 15 times with an interstimulus interval of 3 sec (Figure 2A). An instruction screen signaled the beginning of the test phase and asked the subjects to rate the following pictures as "old", "similar" and "new" in comparison to those learned in the encoding phase.
The test recall phase consisted of three blocks with 5, 7 and 8 sequences. The rationale for this division was twofold: firstly, to allow for sufficient breaks in order to prevent fatigue; and secondly, to provide the opportunity to address potential misunderstandings or other difficulties with the participants at an early stage, following an initial shorter block. Each sequence consisted of the three targets, three foils and 9 lures (3 per similarity level 25% (lure25), 50% (lure50) and 75% (lure75) similarity with the targets). Within one sequence the images were presented in a randomized order. Each image was presented for two seconds. The participant then had one second to categorize this image as "old" with the left key, "similar" with the middle key and "new" with the right key. The possible answers were displayed in different colors at the bottom edge (see Figure 2B) and in an order corresponding to key arrangement. The subjects did not receive any feedback about the correctness of their answers.
After a keypress, the selected answer remained on the edge of the screen, but as an afterimage, so that the participant could make sure that the computer had logged in their answer. Between the images a fixation cross appeared, which had a pseudo-randomized length of 2.5, 2.75, 3, 3.25 or 3.5 sec. The fixation jitter was incorporated to prevent systematic sampling of the same hemodynamic response phase, which would occur if the fixed scanner repetition time (TR) of 2 seconds consistently aligned with the activation cycle of a specific brain region. Breaks were given between the blocks, the length of which the participant may determine themselves for up to 2 min and which are intended to prevent fatigue effects. All in all, the experiment took about 44min. The visual representation and experimental response logging were implemented using the MATLAB R2018b (The MathWorks Inc, 2018) script program.
2.4. Statistical Analysis of Behavioural Data
Behavioural responses were analysed at the trial level using cumulative link mixed-effects models (CLMMs), with responses treated as an ordered categorical outcome (“new” < “similar” < “old”). Trials without a response were excluded. Participant was included as a random intercept to account for repeated observations within individuals. Stimulus condition (foil, lure25, lure50, lure75, and target) was entered as a categorical fixed effect. The overall effect of stimulus condition was assessed using a likelihood-ratio test, followed by Holm-adjusted pairwise comparisons between conditions.
To examine whether response patterns differed between the behavioural pretest and the fMRI session, test environment (pretest vs. fMRI) and its interaction with stimulus condition were included in a further CLMM. The condition-by-environment interaction was evaluated using a likelihood-ratio test, followed by Holm-adjusted pairwise comparisons. Relative response frequencies were additionally calculated for descriptive purposes. All analyses were performed using R statistics (version 4.4.0) (R Core Team, 2024) using the packages ordinal and emmeans.
2.5. Analysis of Mnemonic Discrimination Performance
For the VSMT, like for the MST (Stark et al., 2013b; Yassa et al., 2010; Yassa & Stark, 2011), a parameter for Recognition Memory (RM) (3) and the Lure Discrimination Index (LDI) (4a-d) can be calculated. In contrast to the standard MST approach, which treats lures as a single category, we modelled three distinct levels of lure similarity. The LDI was calculated both across all lures (4a) and separately for each similarity level (4b–d):
RM = pcorrect ‘old’ response to targets – pfalse ‘old’ response to foils
LDIoverall = p‘similar’ response to lures – p‘similar’ response to foils
LDIX = p‘similar’ response to lures of level X – p‘similar’ response to foil
These analyses were performed using R statistics (version 4.4.0) (R Core Team, 2024).
A more detailed analysis of discrimination performance allows the use of the following approach: A Gaussian signal detection theory (SDT) framework was employed, as implemented in the Matlab based Sens toolbox (https://www.sens.uni-kiel.de/). In this model, each stimulus type (target, lure25, lure50, lure75 and foil) is represented by a Gaussian distribution along an internal decision axis. The foil distribution (μ1) was fixed at 0 and served as the reference point. The internal means of the lure and target distributions (μ2 to μ5) were estimated via maximum likelihood, with higher μ-values of the lures (μ2 to μ4) reflecting greater perceived similarity to the target (μ5). Two decision criteria (cn/s and cs/o) defined the boundaries between the response categories "new", "similar", and "old". For each trial in the experiment, the likelihood of the observed response was computed by integrating the corresponding Gaussian distribution over the interval defined by the chosen response category. The overall likelihood of the data was obtained by multiplying these probabilities across trials; due to the extremely small values involved, all computations were performed on the log-likelihood scale. Model parameters were optimized to maximize the total log-likelihood of the observed responses. The optimization was conducted under a model with 6 degrees of freedom (df): the internal means (μ2 to μ5) and the two decision criteria (cn/s and cs/o). To assess whether the constraints imposed by the SDT model adequately captured the data structure, a model comparison was conducted within a hypothesis-testing framework. Specifically, the log-likelihood of the restricted (SDT) model was compared to that of an unrestricted (saturated) model with 10 df. Based on this comparison, each case was classified as "restricted" (SDT model sufficient), "unrestricted" (saturated model significantly better), or "undecided" (no clear preference). Tests were conducted at a significance level of 20%, as the validity of the restricted model corresponded to the null hypothesis (H0).
Since μ1 was fixed at 0, the estimated internal means for the lure and target conditions (μᵢ) can be directly interpreted as d′ values relative to the foil:
This modelling framework allows for a fine-grained reconstruction of the perceptual similarity structure across stimulus types (via μ-parameters) and the decision boundaries between response categories (via cn/s and cs/o). The resulting d′ values reflect how well each stimulus type can be discriminated from the foil baseline. Since the similarity of the different levels of lures and targets was modelled linearly to the foils (see equation 1), a linear increase can also be expected for the d’ prime of the different stimulus categories (linearity of μ1 to μ5).
2.6. Image Acquisition and Processing
Anatomical and functional images were acquired with a 3.0 T whole-body MRI scanner (Achieva; Philips, Best, the Netherlands) with a 32-channel head coil. An in vivo IFIS fMRI system (Invivo, Gainesville, Florida, USA) was used for stimulus presentation. The fMRI acquisition took place in four blocks: The presentation phase of the VSMT comprised 149 scans, the first test block 266 scans, the second test block 372 scans and the third test block 424 scans each with 48 slices. The first three scans of each session were discarded due to non-equilibrium of magnetization, followed by echo planar images, mentioned above, with 48 ascending transversal slices (field of view = 192 × 192x158 mm3, voxel size = 3.0 × 3.0 x 3.0 mm3, slice thickness = 3.0 mm, gap = 0.3 mm, TR = 2000 ms, TE=30 ms, flip angle = 90°). For spatial normalization and exclusion of gross structural abnormalities, a 3D T1-weighted image was acquired (field of view = 270 × 253 × 204 mm3, voxel size = 1.05 x 1.05 x 1.20 mm3, slices = 170 sagittal, slice thickness = 1 mm, TR = 6.73 ms, TE = 3.13 ms, flip angle = 9°, scan duration = 334 sec (~6min)).
Pre-processing and analysis of the fMRI data were performed with SPM 12 (Statistical Parametric Mapping, 2007) executed in MATLAB R2019b (The MathWorks Inc, 2018). The anatomical T1-weighted images were spatially normalized to the standard coordinates of the Montreal Neurological Institute (MNI) space. The realigned EPI images were then co-registered with the corresponding individual T1-weighted image. By concatenating these two steps, the SPM software wrote normalized versions of the EPI images (3 × 3 × 3 mm3) allowing a voxel wise analysis of the BOLD time-series and statistical group comparisons. Finally, we smoothed the functional MRI data with a Gaussian kernel filter of 9 mm full-with at half-maximum (FWHM). Slice-time correction was not applied, as stimulus onsets were temporally jittered relative to the TR, ensuring that the sampling of different hemodynamic phases occurred in a pseudo-randomized manner across trials. All anatomical and functional images were visually inspected after realignment, co-registration, and normalization to ensure sufficient coverage of the medial temporal lobes and to rule out severe susceptibility-induced distortions or signal dropout affecting the hippocampal formation. No datasets were excluded based on these criteria.
2.7. Functional Analysis (fMRI)
For the first level analysis on individual subject level, we modelled the task as an event-related design using a General linear model (GLM) with these specific regressors of interest: the target regressor includes all targets that were correctly responded to with the “old” key. The lure25, 50, 75 regressor contains all lures with 25%, 50 % respectively 75% match to the target to which subjects answered correctly with “similar” and the foil regressor with all foils to which subjects answered correctly with “new”.
As nuisance regressors of no interest the fixation cross, all incorrectly answered or omitted stimuli and the six realignment parameters (3 translations (x, y, z) + 3 rotations (vaw, pitch, roll)) were included, controlling for residual head motion. Due to a trade-off between correctly and incorrectly classified trials, only correctly classified trials could be included as regressors of interest. For low-similarity lures (Lure25, Lure50), too few correct trials were available for reliable inclusion, while for Targets, Foils, and Lure75, sufficient correct trials existed but too few errors were available to model incorrect responses of interest.
On the second (group) level, we used separate SPM models to compute BOLD-signal change to targets, lures25, lures50 and lures75 and foils as well as the differences between foils and targets (foils > targets), lures25 and targets (lures25 > targets) as well as lures50 and targets (lures50 > targets).
Due to the fundamental role of the hippocampus in episodic memory processes we limited our examination analysis to the hippocampus and conducted a region of interest analysis. For this purpose, masks were created for the complete hippocampal formation including all subfields as well as for all subfields individually (CA1, CA2/CA3, CA4/DG) using the 3.0 T in vivo high- resolution atlas of the hippocampus and subfields (Winterburn et al., 2013). Importantly, the Winterburn atlas (super-sampled to 0.3-mm isotropic resolution) was used solely to provide anatomically informed boundaries for small-volume correction. Given the functional resolution of our EPI data (3 × 3 × 3 mm3), subfield-level interpretations cannot reach microanatomical specificity. Therefore, any patterns emerging at the subfield level should be understood as coarse, atlas-guided localizations that supplement—rather than replace—the primary analyses focused on the hippocampal formation as a whole.
For each second level analysis (target, lures25, lures50, lures75, foils) a different number of subjects were included because only images of persons with a sufficient number of events could be included. The cut-off was defined as a significantly higher than random frequency of correct answers to the respective category (27 correctly answered stimuli per category out of 60 stimuli presented and a significance level of 5%). Using these criteria n = 18 for target, n = 14 for the lures75 and n = 20 for the foils were included in the analysis. To assess whether the condition-specific participant composition affected the spatial distribution of hippocampal activation, we additionally performed a sensitivity analysis restricted to the common subset of participants who met the inclusion criterion for all three stimulus categories (n = 12). The second-level analyses for targets, lure75, and foils were repeated in this common sample using the same analysis parameters and hippocampal ROIs as in the primary analyses. Due to the fact that no test subject achieved this criterion for the lures25 and only n=6 for lures50, we had to exclude these categories from the fMRI analysis. This reflects a trade-off inherent to the design: low-similarity lures generated many errors, preventing sufficient inclusion of correct trials, whereas higher similarity conditions allowed sufficient correct trials but too few errors to model incorrect responses. Consequently, the present analyses focus only on hippocampal activity associated with correctly classified trials. In addition, mean beta coefficients for the foil, lure75 and target stimulus categories were analysed in the CA1, CA2/CA3, CA4/DG and subiculum subregions to increase statistical power by averaging across voxels, thereby reducing noise and capturing potential subtle effects that may not emerge at the voxel level. After verifying the normal distribution assumption using Shapiro-Wilk tests, comparisons of the beta coefficients between the stimulus categories were calculated using paired t-tests that were Bonferroni corrected within each hemisphere and subregion. Each paired comparison included participants with available beta estimates for both respective conditions, resulting in n = 14 for foils versus lures75, n = 18 for foils versus targets, and n = 12 for lures75 versus targets.
3. Results
3.1. Mnemonic Discrimination Performance
Trial-level analysis revealed a significant effect of stimulus condition on response category, χ²(4) = 6186.70, p < .001. Responses shifted systematically from “new” towards “similar” and “old” responses across increasing levels of target similarity. All pairwise comparisons between stimulus conditions were significant after Holm correction (all p < .001). For a detailed descriptive overview of the relative frequencies, see Figure 3 and Table 1.
Response patterns differed significantly between the behavioural pretest and the fMRI session, as indicated by a significant condition-by-environment interaction, χ²(4) = 86.62, p < .001. Comparisons between environments revealed significant differences for foils and all three lure conditions (all p < .001), but not for targets (p = .558). Model-estimated response probabilities indicated that these differences were primarily characterized by a greater probability of “new” responses during fMRI than during the pretest. For lures25, lures50, and lures75, the estimated probabilities of a “new” response increased from 67.0% (95% CI [61.1, 72.8]), 35.7% [29.8, 41.6], and 13.3% [10.3, 16.3] in the pretest to 85.2% [82.0, 88.4], 59.5% [53.8, 65.1], and 33.2% [28.1, 38.3] during fMRI, respectively. Target responses remained highly similar across environments, with estimated “old” response probabilities of 69.6% [63.9, 75.2] and 70.9% [66.0, 75.8], respectively. Nevertheless, all five stimulus conditions differed significantly from each other within both sessions (all Holm-adjusted p < .001).
In enhancing the analysis of relative response frequencies further memory parameters were calculated following Stark et al. (2013). The parameter for Recognition Memory was 0.64 ± 0.06 (mean ± SEM). Across all lures, the mean LDI was 0.31 ± 0.14 (mean ± SEM). When analysed by lure similarity, the mean LDI increased with similarity level: LDI25% = 0.14 ± 0.12; LDI50% = 0.33 ± 0.19; LDI75% = 0.46 ± 0.22. Thus, the LDI increased with increasing lure similarity.
The additional analysis of discrimination performance using a Gaussian SDT framework estimated two decision criteria. In the pretest, the estimated criterion cn/s, separating "new" from "similar" responses, was 0.34 ± 0.016, while the second criterion cs/o, separating "similar" from "old", was located at 0.31 ± 0.017. In the main experiment, these criteria shifted to cn/s = 0.73 ± 0.018 and cs/o = 1.73 ± 0.027. To evaluate how well the SDT model captured the observed response patterns, model classification was conducted by comparing the log-likelihoods of the restricted (SDT) and unrestricted (saturated) models. During the pretest, 10 participants were classified as fitting the restricted SDT model, 9 as better described by the unrestricted model, and 3 remained undecided. In the main experiment, the respective counts were 4 restricted, 17 unrestricted, and 1 undecided. The estimated internal means μ1 to μ5, along with their associated error bars for all stimulus types, demonstrate the approximate linearity of the perceptual continuum (see Figure 4).
3.2. BOLD Signal Changes within the Hippocampal Formation
In a first step, the entire hippocampal formation, including CA subfields, dentate gyrus (DG), and subiculum, was defined as the region of interest (ROI). The ROI mask was derived from the hippocampal subfield atlas by Winterburn et al. (2013) and included the hippocampal formation bilaterally (Winterburn et al., 2013). Voxel-wise analyses were restricted to this mask, and statistical significance was assessed using family-wise error (FWE) correction for multiple comparisons at the cluster level (p < .05, small-volume corrected within the ROI). Anatomical localization of significant clusters within the hippocampal formation was confirmed by visual inspection and reference to the Winterburn atlas. During the test phase of the VSMT the hippocampal formation was activated for the stimulus categories foils, targets and lures75 (Table 2) on a FWE- corrected cluster level of p < .05 in both hemispheres.
3.3. Exploratory Atlas-Based Localization Within the Hippocampal Formation
Given the functional spatial resolution, subfield-related labels reflect approximate anatomical localization within the hippocampal formation based on atlas boundaries, rather than precise microanatomical dissociation. To provide an exploratory description of the spatial distribution of hippocampal activation, BOLD signal cluster peaks were localized with reference to the atlas-defined subfield boundaries, separately for each stimulus category. Table 3 and Figure 6 show these exploratory atlas-based localizations for target, lures75 and foil.
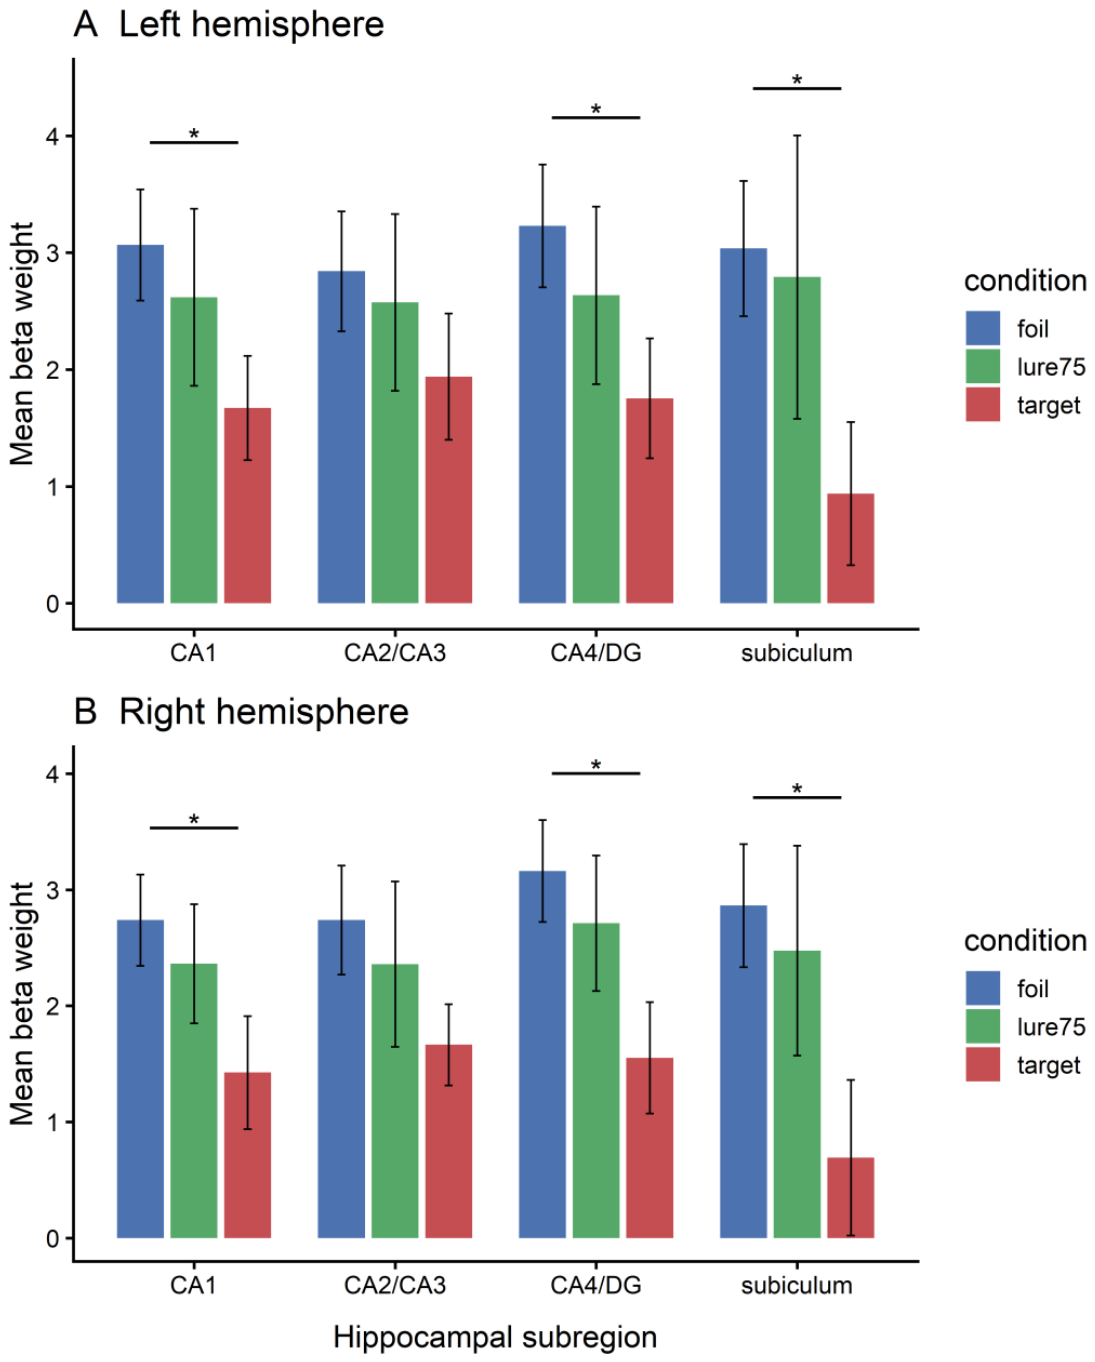
Activation associated with foils extended across regions encompassing several atlas-defined subfields in both hemispheres (Figure 5), whereas activation peaks associated with targets were localized within the atlas-defined CA1 region and those associated with lure75 within right-hemispheric regions encompassing CA1 and CA4/DG. A comparison of mean beta weights extracted from the atlas-defined regions showed the highest values for foils and the lowest for targets, with significantly higher mean beta weights for foils than targets in regions labelled as CA1, CA4/DG, and subiculum (Figure 7).
Figure 5.
Hippocampal activation in response to foils with atlas-based anatomical localization. The left panel shows hippocampal subfield boundaries derived from the Winterburn et al. (2013) atlas. The right panel illustrates the activation map for foils (n = 20) from the whole-hippocampus ROI analysis, displayed at p < 0.05, FWE-corrected, with no additional cluster-extent threshold. The image is shown in coronal orientation at y = 16. Functional voxel size was 3 × 3 × 3 mm³. The color bar indicates t-values. L and R indicate the left and right hemispheres, respectively.
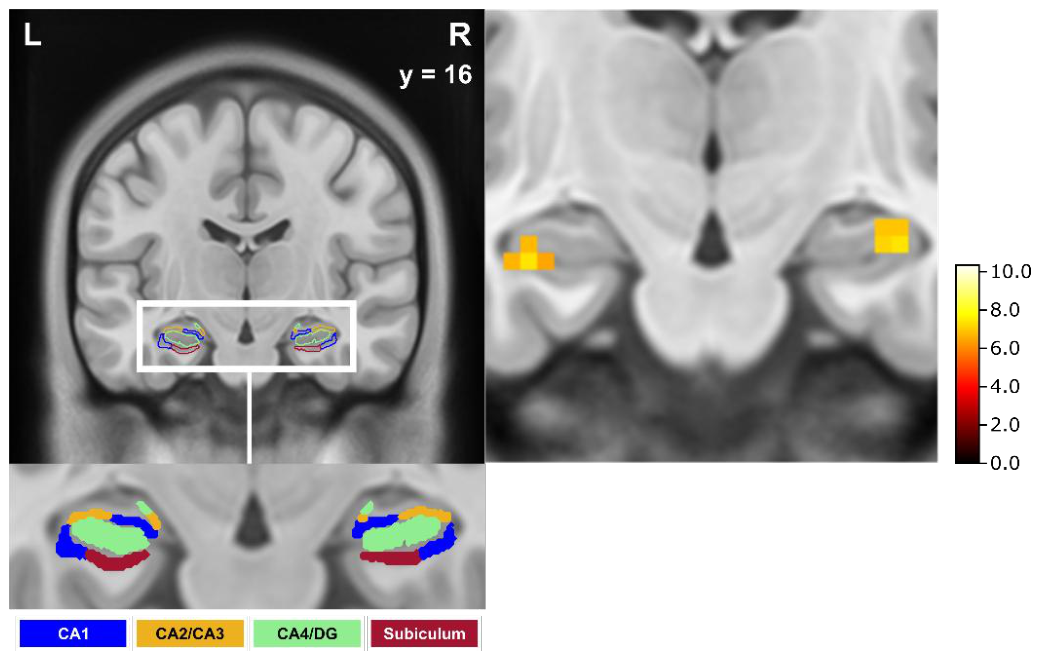
Figure 6.
Hippocampal activation across stimulus categories with atlas-based anatomical localization. Coronal sections illustrate hippocampal activation in response to targets (A; n = 18), lures75 (B; n = 14), and foils (C; n = 20), displayed at p < 0.05, FWE-corrected, with no additional cluster-extent threshold. Colored boundaries indicate hippocampal subfields as defined by the Winterburn et al. (2013) atlas. Coronal slice coordinates (y) are indicated for each section. L and R indicate the left and right hemispheres, respectively, and apply to all coronal sections within each row. Functional voxel size was 3 × 3 × 3 mm³. The color bar indicates t-values.
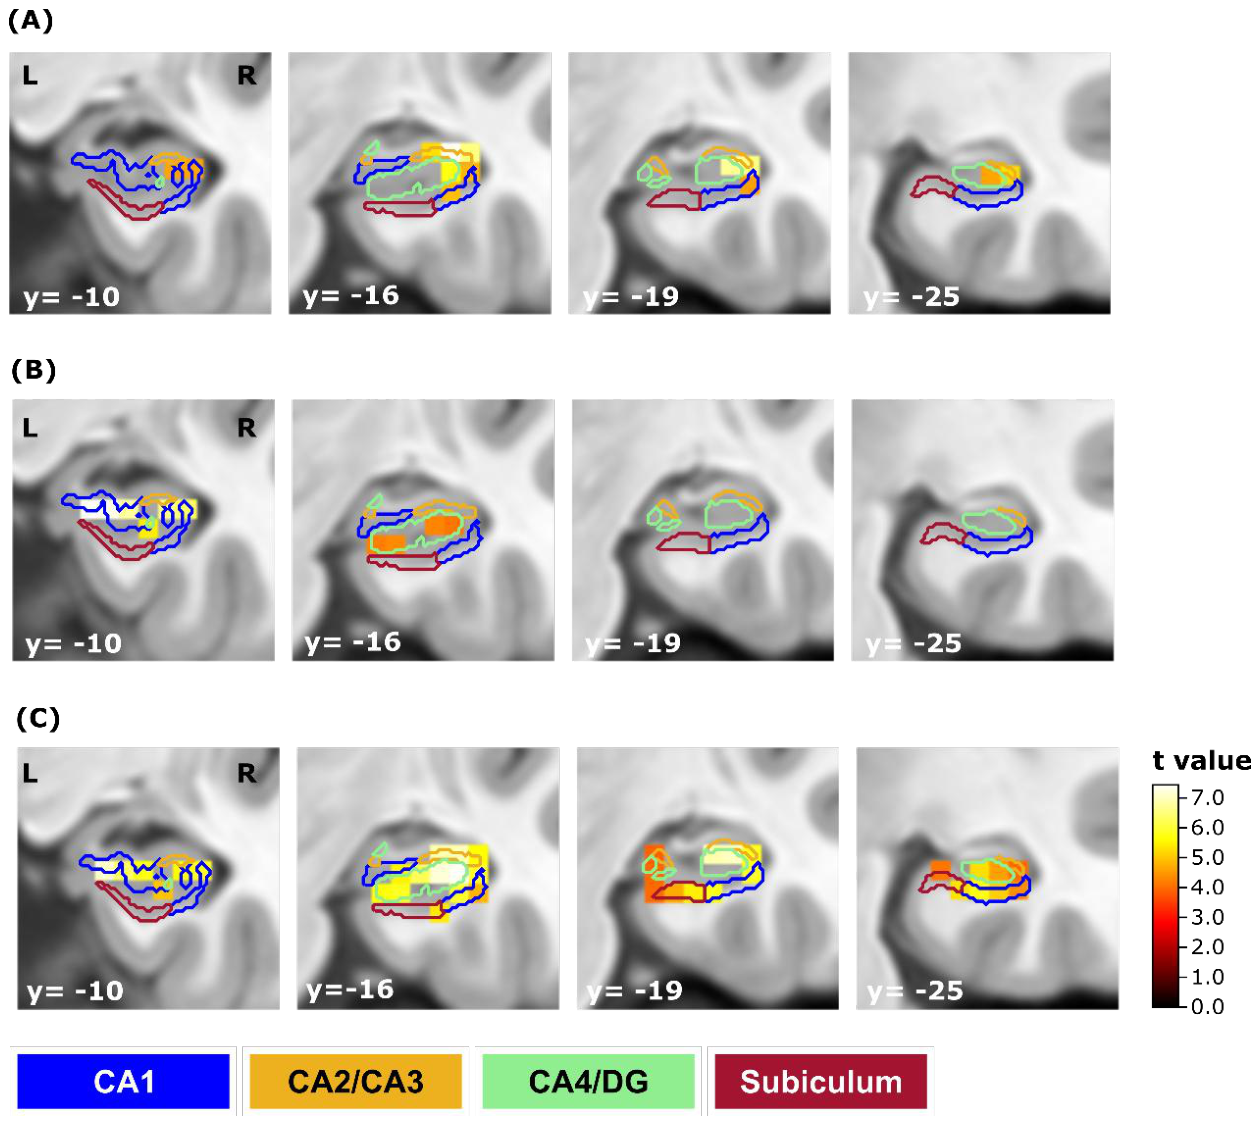
Figure 7.
Mean beta estimates across atlas-defined hippocampal by condition. Mean estimated beta coefficients in each ROI for each trial condition. Asterisks within the bar plots reflect a significant paired t-test (Bonferroni corrected for multiple comparisons within each subregion) on p < 0.05 (after correction on p < 0.0125). Each paired comparison included participants with available beta estimates for both respective conditions (foils vs. lures75: n = 14; foils vs. targets: n = 18; lures75 vs. targets: n = 12).
As a sensitivity analysis, the second-level analyses were repeated in the common subset of participants contributing sufficient correctly classified trials to all three stimulus categories (n = 12). The spatial distribution of hippocampal activation was qualitatively comparable to that observed in the primary condition-specific analyses, with principal activation peaks either preserved or located in closely corresponding hippocampal regions across targets, lures75, and foils. Exploratory atlas-based localization was likewise consistent with the primary analyses, with target-related activation localized to regions encompassing CA1 bilaterally and lure75-related activation localized to right-hemispheric regions encompassing CA1 and CA4/DG.
3.4. Neuropsychological Data
To ensure the comparability of the cohort with a norm cohort concerning cognitive functions, an extensive neuropsychological test battery was administered. The subjects showed average to above average performance on the specific tests of the test battery (Table 4).
4. Discussion
The objective of this pilot study was to provide an initial evaluation of the newly developed Visual Sensory Memory Task, focusing on its behavioural feasibility and initial neural correlates. For this, we used 3T fMRI to study processes of pattern separation in the human hippocampus by scanning subjects while they performed this incidental and novel encoding task using pictures of abstract and asemantic objects.
At a behavioural level participants were able to reliably discriminate targets and foils from lures during the VSMT. While recognition and rejection performance were significantly above chance, discrimination of lures varied with similarity: performance was close to chance for the lowest similarity lures, intermediate for moderate similarity, and higher for the most similar lures. As expected, there was a tendency to classify lures with 25% and 50% similarity as new stimuli and lures with 75% similarity as already known stimuli. Response patterns differed between testing contexts, although these differences cannot be attributed specifically to the scanner environment because of potential practice, fatigue, and order effects. The reduced fit of the SDT model in the main experiment suggests additional factors influencing decisions. Consequently, the lowest similarity lures were not included in the main fMRI analysis, limiting the ability to investigate neuronal responses to low-similarity lures.
At a neuronal level hippocampal activation was observed across all stimulus categories, with exploratory atlas-based localization indicating differences in the spatial distribution of activation within the hippocampal formation. Activation associated with foils extended across regions encompassing several atlas-defined subfields in both hemispheres, whereas activation peaks associated with targets were localized within the atlas-defined CA1 region and those associated with lures75 within right-hemispheric regions encompassing CA1 and CA4/DG. The additional analysis of mean beta weights, aimed at reducing noise and detecting subtle effects not captured at the voxel-wise level, revealed the highest activation for foils and the lowest for targets, with significantly stronger responses to foils than to targets in atlas-defined regions encompassing CA1, CA4/DG, and the subiculum. Under pattern separation accounts, the magnitude of hippocampal BOLD responses to lure stimuli would be expected to more closely resemble that observed in response to a new stimulus (foil) than a previously learned target. The observed univariate BOLD response profile is broadly compatible with this prediction at the level of the hippocampal formation. However, similarity in BOLD response magnitude does not demonstrate similarity of the underlying neural representations and therefore does not provide direct evidence of neural pattern separation. The atlas-based localization with respect to DG and CA3 was of particular theoretical interest, as these subregions are expected to play a central role in pattern separation (Berron, Schütze, et al., 2016). However, the present functional data do not provide sufficient spatial resolution to reliably separate DG and CA3 or other adjacent hippocampal subfields. Accordingly, comparisons with subfield-specific models and previous findings are considered a theoretical context for the observed hippocampal activation patterns rather than evidence for subfield-specific mechanisms.
The ability to discriminate between similar stimuli is the basis for the formation of episodic memory and depends on the hippocampus. It does so by generating non-overlapping representations of newly encoded mnemonic information (McClelland et al., 1995; Yassa & Stark, 2011). Similar to (Nash et al., 2021), but contrary to the predictions of computational models, part of the observed activation was atlas-localized to a region encompassing the subiculum. Our observation of a univariate activation profile compatible with predictions derived from pattern separation accounts, with part of the observed activation atlas-localized to a region encompassing CA4/DG, is partially consistent with computational models that have emphasized the role of the dentate gyrus, particularly in creating sparse orthogonalized representations. These models assume that the DG performs PS by sparse coding of neuronal activity from entorhinal cortex to CA3, decoding overlapping neuronal assemblies (Rolls, 2016; Treves & Rolls, 1994). Within the atlas-defined region encompassing CA4/DG, mean activation was higher in response to new, unfamiliar images (foils) than to previously learned, familiar images (targets). Again, the lures showed numerically more similar BOLD response magnitudes to foils than to targets and showed similar activity to the first presentation of a stimulus, although this statement could not be supported by statistical significance. Consequently, while this activation pattern response profile is compatible with predictions derived from hippocampal pattern separation accounts, it cannot exclude the alternative interpretation that hippocampal responses primarily distinguished learned targets from non-target stimuli. These results are broadly consistent with computational models of hippocampal subregions (Knierim & Neunuebel, 2016); its approximate atlas-based localization, however, does not permit conclusions regarding the contribution of individual hippocampal subfields.
Previous computational and animal work provides a theoretical framework for interpreting these findings. In several rodent studies, it has been shown that the hippocampal DG is indeed involved in PS, while the CA3 subfield performs PS and PC in response to the change in sensory input, thus balancing the discriminative function in the context of forming a new memory representation (Guzowski et al., 2004; Lee et al., 2004; Leutgeb et al., 2007; Neunuebel & Knierim, 2014). In this course, it is important to note that exposure to different environments caused differences in ensemble activity of CA1 and CA3 neurons, using both neuronal ensemble recordings and imaging of immediate early gene activity (Lee et al., 2004; S. Leutgeb et al., 2004; Vazdarjanova & Guzowski, 2004). Indicated experiments show stronger PS in CA3 than in CA1 (Guzowski et al., 2004). The neuronal response in CA3 indicates a sigmoidal function, meaning that large changes in input cause PS and small changes in input cause PC. Area CA1, on the other hand, appears to show PS in a different manner, as evidenced by a linear relationship between input and output (Guzowski et al., 2004). Lesion and imaging studies in humans supported these findings (Bakker et al., 2008; Berron, Schutze, et al., 2016; Hanert, Pedersen, et al., 2019; Hanert, Rave, et al., 2019). In the course of our study, the atlas-defined region encompassing CA1 likewise showed numerically more similar BOLD response magnitudes to foils than to targets, although this difference was not statistically reliable. This response profile is compatible with, but does not directly demonstrate, neural pattern separation. The observed tendency for lure-related responses to resemble those to foils may reflect either the asemantic nature of the stimulus material or the high difficulty of the task, which was already evident at the behavioural level.
An important consideration is that all stimulus categories were generated from the same class of abstract pink-noise images and therefore shared comparable low-level visual properties. However, target–foil correlations were explicitly minimized during stimulus generation and remained negligible (r4 < 0.01). Consequently, although we cannot completely exclude contributions of perceptual similarity, the observed hippocampal BOLD response profile is unlikely to be explained solely by residual visual overlap between targets and foils. Rather, the present findings are compatible with a distinction between previously learned target stimuli and non-target stimuli, while remaining broadly consistent with current accounts of hippocampal pattern separation.
In conclusion, the VSMT consists of an encoding and retrieval phase comparable to the MST (Kirwan & Stark, 2007; Stark et al., 2013a), which is frequently used in the investigation of pattern separation processes. However, in contrast to the MST, the VSMT does not use pictures of everyday objects as learning pictures, but abstract and non-nameable pink-noise pictures. This possibly offers several advantages: (I) the noise pictures are substantially harder to learn, but at this point it takes only 3 learning pictures instead of 64 (in the MST) to achieve the same effect, (II) in the course of the VSMT an infinite number of learning pictures can be generated in an uncomplicated way, (III) the possibility of generating new stimulus sets may facilitate repeated administration while reducing direct stimulus-repetition effects, although test–retest reliability and practice effects remain to be established in a dedicated study, (IV) since the pictures are abstract and asemantic prior knowledge is less likely to influence memory performance and cross-cultural use is conceivable, (V) a standardized mixing formula can be used to generate lures with a specific degree of similarity to the targets, enabling precise parametric control over stimulus similarity at the design level and thus systematic manipulation of task difficulty. While the VSMT was designed to minimize semantic confounds by employing abstract, asemantic stimuli and parametrically manipulating visual similarity, we acknowledge that this approach inherently increases reliance on perceptual and attentional processes during encoding. As such, we cannot fully rule out that differences in visual feature processing or momentary attentional fluctuations contributed to recognition performance, particularly at higher noise levels (e.g. lures25). Although our interpretation focuses on hippocampal responses in the context of pattern separation accounts, the current study does not directly examine perceptual processing during encoding, and thus perceptual and mnemonic contributions cannot be entirely disentangled particularly because all stimulus categories were generated from the same class of abstract pink-noise images. Future work should therefore incorporate additional perceptual control conditions, attention monitoring (e.g., eye-tracking), or encoding-phase neural measures to more systematically separate early visual processes from hippocampal computations. Despite these considerations, the VSMT provides a high degree of control over stimulus similarity while reducing semantic variability, offering a valuable framework for probing pattern separation under conditions of perceptual uncertainty.
4.1. Limitations and Outlook
Although the present findings show several similarities to previous findings obtained with established mnemonic similarity paradigms, several limitations need to be acknowledged.An important limitation concerns the scope of the present validation. The study was designed as an initial pilot evaluation of the VSMT and was primarily intended to establish task feasibility and characterize its behavioural and neural response patterns. It does not constitute a comprehensive validation of the task. In particular, the present study did not include an independent replication sample, an assessment of test–retest reliability, direct convergent validity against an established mnemonic similarity paradigm, or clinical validation. Accordingly, the present findings should be considered preliminary evidence supporting the feasibility and potential utility of the VSMT rather than definitive evidence of its validity as an established mnemonic similarity measure. Future studies should address these aspects in larger and independent samples.
The relatively small sample size represents a further limitation, as it may have limited may have limited the statistical power to detect subtle effects, particularly for the more difficult lure conditions. Moreover, due to the higher task difficulty compared to the MST, performance was particularly low for the lowest-similarity lure conditions, Lure25 and Lure50, resulting in insufficient numbers of correctly classified trials for meaningful fMRI analyses. As a result, only correctly classified trials could be included, while incorrect responses were modelled as nuisance regressors. This trade-off inherent to the task, where low-similarity lures generate many errors and higher-similarity lures or targets yield few, means that the current analyses capture hippocampal responses primarily to correctly classified stimuli, limiting inferences about responses to errors or subjective perception-based decisions. Consequently, the principal fMRI analyses were restricted to targets, foils, and lure75, while lure25 was excluded entirely and lure50 could not be analysed reliably at the group level due to the small number of participants contributing sufficient correctly classified trials. This limits the extent to which the present fMRI results can test the parametrically manipulated similarity continuum at the neural level. Thus, although the behavioural findings support a graded effect of lure similarity, the present neuroimaging data do not allow conclusions about a corresponding graded neural response across all three lure levels.
The comparison between the behavioural pretest and the fMRI session is subject to additional design-related limitations and should not be interpreted as a measure of test–retest reliability. The observed condition-by-environment interaction therefore cannot be attributed specifically to the scanner environment. The pretest contained fewer trials and was consistently administered before the scanner session. Consequently, differences between sessions may reflect not only the testing environment but also practice, fatigue, or order effects, which cannot be disentangled in the present design. A dedicated test–retest study with matched task versions and counterbalanced testing conditions will be required to establish the reliability of the VSMT.
A further methodological limitation concerns the anatomical specificity of the fMRI analyses. Although we used a probabilistic subfield atlas (Winterburn et al., 2013) to anatomically constrain the analyses within the hippocampal formation, the spatial resolution of our functional data (3 × 3 × 3 mm3) does not permit a true subfield-level distinction based on the BOLD signal. The observed activation patterns should therefore be interpreted as approximations of subfield activity rather than as direct evidence of distinct DG or CA3 engagement. This limitation is inherent to conventional 3 T imaging protocols and preprocessing pipelines. Future studies employing ultra–high field MRI (e.g., 7 T) and subfield-specific acquisition sequences would provide the necessary resolution and signal-to-noise ratio to validate these findings with greater anatomical precision.
The present fMRI analyses were based on univariate differences in BOLD response magnitude and therefore do not directly measure the similarity or differentiation of neural representations. Consequently, a resemblance in BOLD response magnitude between lures and foils should be interpreted as being compatible with predictions derived from pattern separation accounts rather than as direct evidence of neural pattern separation. Future studies employing multivoxel pattern analysis or representational similarity analysis will be required to directly assess representational differentiation during the VSMT.
Another limitation concerns the validation of the lure similarity levels. The similarity categories were defined algorithmically during stimulus generation based on predetermined correlation values and were not independently validated using subjective similarity ratings. Consequently, we cannot exclude the possibility that some individual stimuli were perceived differently than intended. However, behavioural performance showed the expected systematic pattern across lure categories, with increasing lure discrimination indices and increasing proportions of “similar” responses as nominal similarity increased. Future studies could complement the present approach by directly assessing perceived similarity of the stimulus categories to further validate the stimulus classification.
Relatedly, while the VSMT was designed to overcome the semantic and familiarity confounds of object-based paradigms such as the MST, a certain degree of task difficulty and the resulting trial exclusions reduce the comparability across similarity levels. Further optimization of the stimulus set and adaptive difficulty calibration could help ensure sufficient numbers of correctly classified trials across all similarity levels, thereby enabling a more complete test of the parametrically manipulated similarity continuum in future neuroimaging studies.
5. Conclusions
The present study introduced the Visual Sensory Memory Task (VSMT) and provided initial evidence for its feasibility as an asemantic paradigm for investigating mnemonic similarity. Behavioural findings demonstrated that participants could distinguish targets and foils and showed graded response tendencies across lure similarity levels. The accompanying fMRI results provide preliminary evidence of hippocampal involvement during task performance, although the anatomical and neural interpretations are constrained by the spatial resolution and the nature of the activation-based analyses.
Taken together, the findings support the feasibility and potential utility of the VSMT while highlighting the need for further validation. Future studies should establish test–retest reliability, convergent validity with established mnemonic similarity paradigms, and generalizability across larger and independent samples and clinical populations, and should employ high-resolution imaging and representational analyses to more directly investigate hippocampal pattern separation.
Author Contributions
Conceptualization, I.S., S.P., C.K., A.H., T.B.; methodology, I.T., I.S., S.P., C.K., O.G., S.W., A.H., T.B.; software, C.K., O.G., S.W., A.H., T.B.; validation, C.K., A.H., T.B.; formal analysis, I.T., I.S., C.K., O.G., S.W.; investigation, I.S., A.H.; resources, O.G., S.W.; data curation, I.S., C.K.; writing—original draft preparation, I.S., I.S.; writing—review and editing, I.T., D.G.K., S.P., Y.F., A.H., C.K.; visualization, I.T., I.S., C.K., O.G., S.W., A.H., T.B.; supervision, T.B., C.K.; project administration, I.S., C.K., T.B.; funding acquisition, T.B. All authors have read and agreed to the published version of the manuscript.
Funding
This study has been supported by the German Research Foundation (DFG) FOR 5434, by the Else Kröner-Fresenius-Stiftung for the Interdisciplinary Else Kröner Research College Kiel (EKFK), the Damp Foundation and by the Faculty of Medicine, Kiel University, Germany.
Institutional Review Board Statement
The study was conducted in accordance with the Declaration of Helsinki, and approved by the Ethics Committee of Kiel University.
Informed Consent Statement
Informed consent was obtained from all subjects involved in the study.
Data Availability Statement
The data that support the findings of this study are available from the corresponding author upon reasonable request.
Acknowledgments
This study was supported by the Deutsche Forschungsgemeinschaft (DFG) through FOR5434, the Else Kröner Forschungskolleg Kiel (EKFK) through the Else Kröner-Fresenius-Foundation, the Damp-Foundation and by the Faculty of Medicine, University of Kiel, Germany.
Conflicts of Interest
The authors declare no conflicts of interest.
Abbreviations
The following abbreviations are used in this manuscript:
| BOLD | Blood-oxygenation-level-dependent |
| DG | Dentate gyrus |
| DST | Digit span test |
| EPI | Echo-planar imaging |
| fMRI | Functional magnetic resonance imaging |
| FWE | Family-wise error |
| FWHM | Full-width at half-maximum |
| GLM | General linear model |
| LDI | Lure discrimination index |
| MNI | Montreal neurological institute |
| MST | Mnemonic similarity task |
| MWT-B | Multiple choice vocabulary intelligence test-b |
| PC | Pattern completion |
| PS | Pattern separation |
| RAVLT | Rey auditory verbal learning test |
| RM | Recognition memory |
| ROI | Region of interest |
| RWT | Regensburger word fluency test |
| SDT | Signal detection theory |
| TE | Echo time |
| TMT | Trail-making test |
| TR | Repetition time |
| VSMT | Visual sensory memory task |
References
- Aschenbrenner, S.; Tucha, O.; Lange, K. W. Regensburger Wortflüssigskeitstest (RWT). In Wechsler Intelligenztest für Erwachsene (WIE); Aster, M., Neubauer, A., Horn, R., Eds.; Hogrefe, 2000. [Google Scholar]
- Azab, M.; Stark, S. M.; Stark, C. E. L. Contributions of human hippocampal subfields to spatial and temporal pattern separation. Hippocampus 2014, 24(3), 293–302. [Google Scholar] [CrossRef]
- Bakker, A.; Kirwan, C. B.; Miller, M.; Stark, C. E. L. Pattern Separation in the Human Hippocampal CA3 and Dentate Gyrus. Science 2008, 319(5870), 1640–1642. [Google Scholar] [CrossRef]
- Berron, D.; Schütze, H.; Maas, A.; Cartenas-Blanco, A.; Kuijf, H. J.; Kumaran, D.; Düzel, E. Strong Evidence for Pattern Separation in Human Dentate Gyrus. J. Neurosci. 2016, 36, 7569–7579. [Google Scholar] [CrossRef]
- Berron, D.; Schutze, H.; Maass, A.; Cardenas-Blanco, A.; Kuijf, H. J.; Kumaran, D.; Duzel, E. Strong Evidence for Pattern Separation in Human Dentate Gyrus. J. Neurosci. 2016, 36(29), 7569–7579. [Google Scholar] [CrossRef]
- Brod, G.; Werkle-Bergner, M.; Shing, Y. L. The Influence of Prior Knowledge on Memory: A Developmental Cognitive Neuroscience Perspective. Front. Behav. Neurosci. 2013, 7. [Google Scholar] [CrossRef]
- Dimsdale-Zucker, H. R.; Ritchey, M.; Ekstrom, A. D.; Yonelinas, A. P.; Ranganath, C. CA1 and CA3 differentially support spontaneous retrieval of episodic contexts within human hippocampal subfields. Nat. Commun. 2018, 9(1), 294. [Google Scholar] [CrossRef]
- Field, D. Neuroscience & Biobehavioral Reviews. J. Opt. Soc. Am. 1987, 4, 2379–2394. [Google Scholar]
- Finke, C.; Prüss, H.; Heine, J.; Reuter, S.; Kopp, U. A.; Wegner, F.; Then Bergh, F.; Koch, S. Evaluation of cognitive deficits and structural hippocampal damage in encephalitis with leucine-rich, glioma-inactiveted 1 antibodies. JAMA Neurol. 2017, 74, 50–59. [Google Scholar] [CrossRef]
- Guzowski, J. F.; Knierim, J. J.; Moser, E. I. Ensemble Dynamics of Hippocampal Regions CA3 and CA1. Neuron 2004, 44, 581–584. [Google Scholar] [CrossRef]
- Hainmueller, T.; Bartos, M. Dentate gyrus circuits for encoding, retrieval and discrimination of episodic memories. Nat. Rev. Neurosci. 2020, (21), 158–168. [Google Scholar] [CrossRef]
- Hanert, A.; Pedersen, A.; Bartsch, T. Transient hippocampal CA1 lesions in humans impair pattern seperation performance. Hippocampus 2019, 29, 736–747. [Google Scholar] [CrossRef]
- Hanert, A.; Rave, J.; Granert, O.; Pedersen, A.; Born, J.; Bartsch, T. Hippocampal dentate gyrus atrophy predicts pattern separation impairment in patients with LGI1 encephalitis. Neuroscience 2019, 400, 120–131. [Google Scholar] [CrossRef]
- Hothorn, T.; Hornik, K.; Van De Wiel, M. A.; Zeileis, A. A Lego System for Conditional Inference. Am. Stat. 2006, 60(3), 257–263. [Google Scholar] [CrossRef]
- Kaernbach, C.; Bartsch, T.; Schubert, A.; Kanczok, J.; Ulrich, A. M.; Brütt, M.; Krause, J.; Rohde, J. How similar is similar? A novel sensory memory task based on visual pink noise and its implications for pattern separation and completion.
- Kaernbach, C.; Schubert, A.; Bartsch, A. Introducing a new visual sensory memory task for the assessment of pattern separation. In Beiträge zur 59. Tagung experimentell arbeitender Psychologen; Goshke, T., Bolte, A., Kirschbaum, C., Eds.; Pabst Science Publishers, 2017; p. S. 178. [Google Scholar]
- Kauffmann, L.; Ramanoël, S.; Peyrin, C. The neural bases of spatial frequency processing during scene perception. Front. Integr. Neurosci. 2014, 8. [Google Scholar] [CrossRef]
- Kirwan, C. B.; Stark, C. E. L. Overcoming interference: An fMRI investigation of pattern separation in the medial temporal lobe. Learn. Mem. 2007, 14, 625–633. [Google Scholar] [CrossRef]
- Knierim, J. J.; Neunuebel, J. P. Tracking the flow of hippocampal computation: Pattern separation, pattern completion, and attractor dynamics. Neurobiol. Learn. Mem. 2016, 129, 38–49. [Google Scholar] [CrossRef]
- Lacy, J. W.; Yassa, M. A.; Stark, S. M.; Muftuler, L. T.; Stark, C. E. L. Distinct pattern separation related transfer functions in human CA3/dentate and CA1 revealed using high-resolution fMRI and variable mnemonic similarity. Learn. Mem. 2011, 1, 15–18. [Google Scholar] [CrossRef]
- Lee, I.; Yoganarasimha, D.; Rao, G.; Knierim, J. J. Comparison of population coherence of place cells in hippocampal subfields CA1 and CA3. Nature 2004, 430, 456–459. [Google Scholar] [CrossRef]
- Lehrl, S. Mehrfachwahl-Wortschaft-Intelligenztest MWT-B; Spitta Verlag, 2005. [Google Scholar]
- Leutgeb, J. K.; Leutgeb, S.; Moser, M. B.; Moser, E. I. Pattern separation in the dentate gyrus and CA3 of the hippocampus. Science 2007, 315, 961–966. [Google Scholar] [CrossRef]
- Leutgeb, S.; Leutgeb, J.; Treves, A.; Moser, M.-B.; Moser, E. I. Distinct Ensemble Codes in Hippocampal Areas CA3 and CA1. Science 2004, 305, 1295–1298. [Google Scholar] [CrossRef]
- Liu, K. Y.; Gould, R. L.; Coulson, M. C.; Ward, E. V.; Howard, R. J. Tests of pattern separation and pattern completion in humans—A systematic review. Hippocampus 2016, (26), 705–717. [Google Scholar] [CrossRef]
- Marr, D. Simple memory: A theory for archicortex. R. Soc. 1971, 262, 23–81. [Google Scholar] [CrossRef]
- McClelland, J. L.; McNaughton, B. L.; O’Reilly, R. C. Why there are complementary learning systems in the hippocampus and neocortex: Insights from the successes and failures of connectionist models of learning and memory. Psychol. Rev. 1995, 102, 419–457. [Google Scholar] [CrossRef]
- Nash, M. J.; Hodges, C. B.; Muncy, N. M.; Kirwan, C. B. Pattern Seperation beyond the hippocampus: A high-resolution whole-brain investigation of mnemonic discrimination in healthy adults. Hippocampus 2021, 1–14. [Google Scholar]
- Neunuebel, J. P.; Knierim, J. J. CA3 Retrieves Coherent Representations from Degraded Input: Direct Evidence for CA3 Pattern Completion and Dentate Gyrus Pattern Separation. Neuron 2014, 81(2), 416–427. [Google Scholar] [CrossRef]
- Norman, K. A.; O’Reilly, R. C. Modeling hippocampal and neocortical contributions to recognition memory: A complementary-learning-systems approach. Psychol. Rev. 2003, 110(4), 611–646. [Google Scholar] [CrossRef]
- Oldfield, R. C. The assessment and analysis of handedness: The Edinburgh inventory. Neuropsychologia 1971, 9(1), 97–113. [Google Scholar] [CrossRef]
- O’Reilly, R. C.; McClelland, J. L. Hippocampal conjunctive encoding, storage, and recall: Avoiding a trade-off. Hippocampus 1994, 4, 661–682. [Google Scholar] [CrossRef]
- R Core Team. R: A Language and Environment for Statistical Computing [Software]; R Foundation for Statistical Computing, 2024. [Google Scholar]
- Reitan, R. Trail Making Test; Reitan Neuropsychology Laboratory, 1992. [Google Scholar]
- Rey, A. L’examen psychologique dans les cas d’encéphalopathie traumatique. Arch. De Psychol. 1941, 28, 21. [Google Scholar]
- Riphagen, J. M.; Schmiedek, L.; Gronenschild, B. M.; Verhey, F. R.; Jacobs, H. L. Associations between pattern seperation and hippocampal subfield structure and function vary along the lifespan: A 7T imaging study. Sci. Rep. 2020, 1–13. [Google Scholar] [CrossRef]
- Rolls, E. T. Pattern separation, completion, and categorisation in the hippocampus and neocortex. Neurobiol. Learn. Mem. 2016, 129, 4–28. [Google Scholar] [CrossRef]
- Stark, C. E. L.; Noche, J. A.; Ebersberger, J. R.; Mayer, L.; Stark, S. M. Optimizing the mnemonic similarity task for efficient, widespread use. Front. Behav. Neurosci. 2023, 17, 1080366. [Google Scholar] [CrossRef]
- Stark, S. M.; Yassa, M. A.; Lacy, J. W.; Stark, C. E. L. A task to assess behavioral pattern separation (BPS) in humans: Data from healthy aging and mild cognitive impairment. Neuropsychologia 2013a, 51, 2442–2449. [Google Scholar] [CrossRef]
- Stark, S. M.; Yassa, M. A.; Lacy, J. W.; Stark, C. E. L. A task to assess behavioral pattern separation (BPS) in humans: Data from healthy aging and mild cognitive impairment. Neuropsychol. Spec. Issue Funct. Neuroimaging Episodic Mem. 2013b, 51(12), 2442–2449. [Google Scholar] [CrossRef]
- Statistical Parametric Mapping; Elsevier, 2007. [CrossRef]
- Stevenson, R. F.; Reagh, Z. M.; Chun, A. P.; Murray, E. A.; Yassa, M. A. Pattern Separation and Source Memory Engage Distinct Hippocampal and Neocortical Regions during Retrieval. J. Neurosci. 2020, 40(4), 843–851. [Google Scholar] [CrossRef]
- The MathWorks Inc. MATLAB [Software]; The MathWorks Inc, 2018. [Google Scholar]
- Treves, A.; Rolls, E. T. Computational analysis of the role of the hippocampus in memory. Hippocampus 1994, 4, 374–391. [Google Scholar] [CrossRef]
- Vazdarjanova, A.; Guzowski, J. F. Differences in hippocampal neuronal population responses to modifications of an environmental context: Evidence for distinct, yet complementary, functions of CA3 and CA1 ensemble. J. Neurosci. 2004, 21, 6489–6496. [Google Scholar] [CrossRef]
- Wickham, H.; mit Sievert, C. ggplot2: Elegant graphics for data analysis (Second edition); Springer international publishing, 2016. [Google Scholar]
- Winterburn, J. L.; Pruessner, J. C.; Chavez, S.; Schira, M. M.; Lobaugh, N. J.; Voineskos, A. N.; Chakravarty, M. M. A novel in vivo atlas of human hippocampal subfields using high-resolution 3T magnetic resonance imaging. NeuroImage 2013, 74, 254–265. [Google Scholar] [CrossRef]
- Yassa, M. A.; Stark, C. E. L. Pattern separation in the hippocampus. Trends Neu-Rosciences 2011, 34, 515–525. [Google Scholar] [CrossRef]
- Yassa, M. A.; Stark, S. M.; Bakker, A.; Albert, M. S.; Gallagher, M.; Stark, C. E. L. High-resolution structural and functional MRI of hippocampal CA3 and dentate gyrus in patients with amnestic Mild Cognitive Impairment. NeuroImage 2010, 51, 1242–1252. [Google Scholar] [CrossRef]
Figure 1.
Stimulus generation procedure. Target images were created by applying a Fourier-based transformation of white noise into pink noise, followed by Gaussian envelope filtering to avoid edge artefacts. Lures and foils were generated by pixel-wise blending of each target image (T) with an unrelated confound image (C) using the mixing parameter q according to the formula shown above. The mixing parameter q determines the relative contribution of the target and confound images, whereas denotes the quartic lure–target correlation used as an approximate psychophysical similarity scale. High-, medium-, and low-similarity lures were generated at = 0.75, 0.50, and 0.25, corresponding to q ≈ 0.72, 0.61, and 0.50, respectively. Foils were generated with negligible target similarity ( ≤ 0.01). This procedure enabled a controlled manipulation of mnemonic similarity while maintaining comparable low-level visual properties across all stimulus categories.
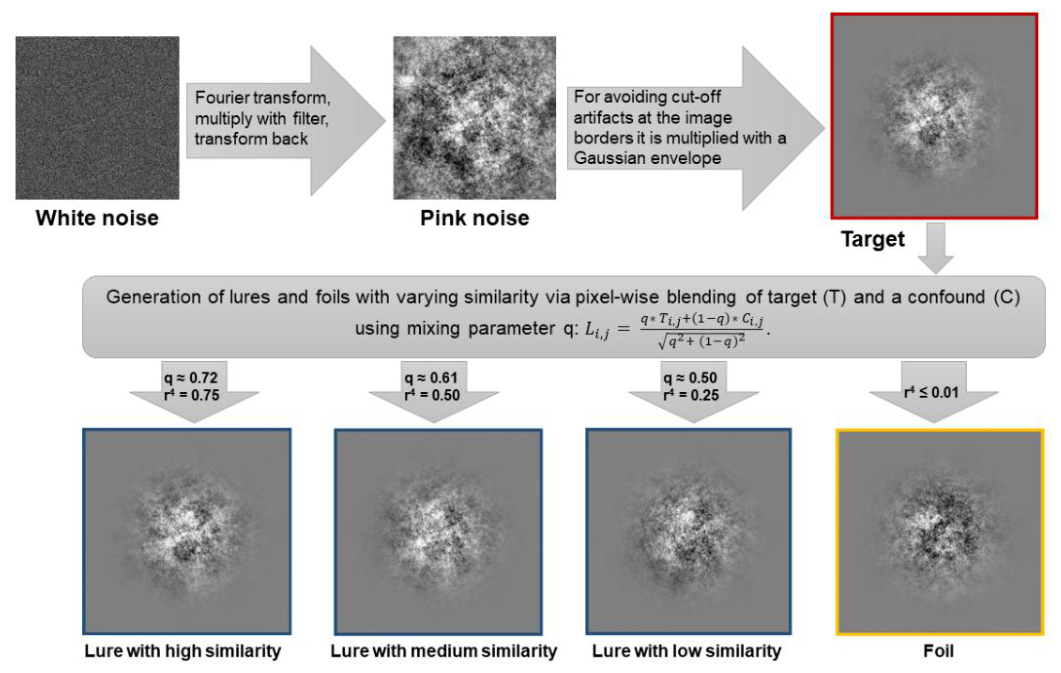
Figure 2.
Experimental design of the VSMT as used in this study. (A) shows the structure of the test that is divided into an encoding phase with three targets to be learned, which are presented in the same order 15 times, and a test phase with at least 20 sequences, scanned in three blocks (5,7 and 8 sequences respectively). Within each sequence the three learned targets, three foils and three lures per similarity level (25%, 50% and 75% match with the target) are presented in a randomized order, so that at the end 300 images have to be classified by the test persons. Breaks were given between the blocks, the length of which the test person may determine themselves for up to 2 min and which are intended to prevent fatigue effects. (B) shows an excerpt from the test procedure. (C) After each image, the subject had 1 sec to decide by keypress whether the image was an "old", a "similar" or a "new" image.
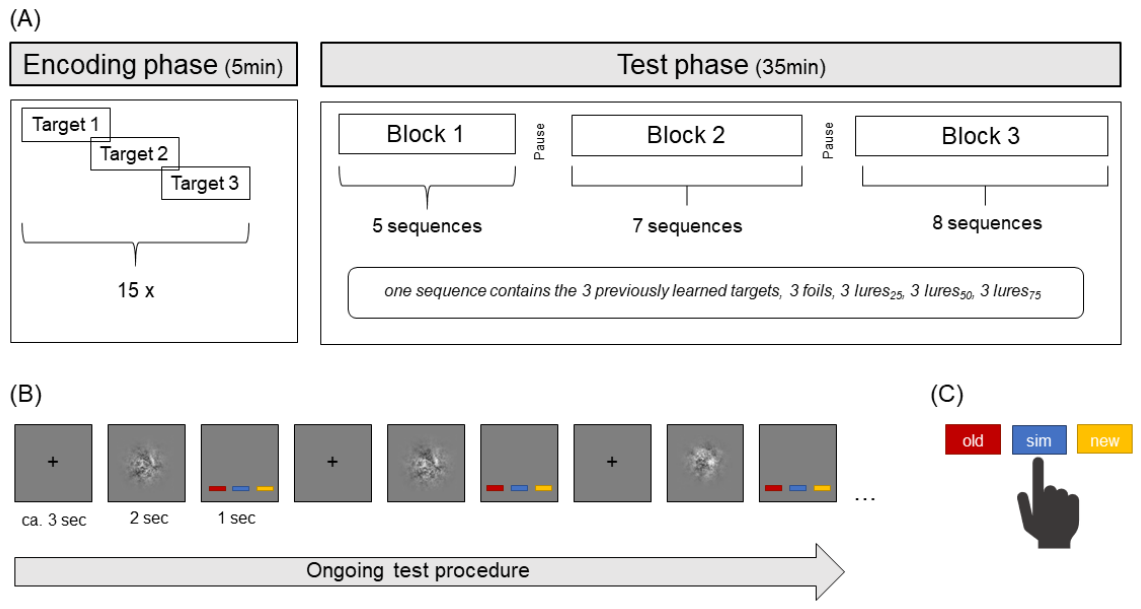
Figure 3.
Relative response frequencies across stimulus conditions. Mean relative frequencies (± SEM) of “new,” “similar,” and “old” responses for each stimulus category (foil, lure25, lure50, lure75, and target), shown separately for the behavioural pretest and the fMRI session. Lure25, lure50, and lure75 denote lure stimuli with predefined target similarity levels of r4=.25, .50, and .75, respectively; foils had negligible similarity to the target (r4<.01), whereas targets were identical to the previously learned stimuli. Response categories refer to participants’ classifications and are therefore distinct from the presented stimulus categories. Correct responses were “new” for foils, “similar” for all lure conditions, and “old” for targets.
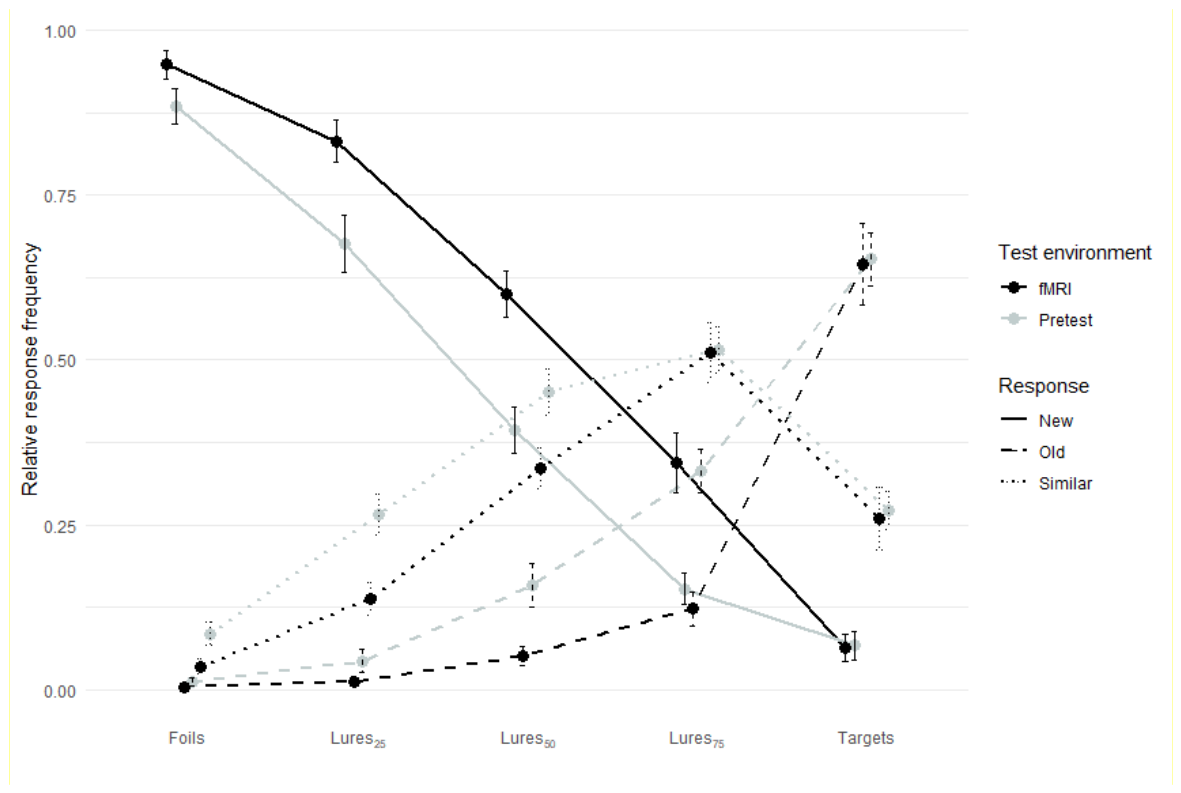
Figure 4.
Estimated internal means across stimulus types in the VSMT. Estimated internal means (μ-values) for each stimulus type based on the Gaussian signal detection theory model. Increasing r4 values reflect higher perceived similarity to the target. Error bars represent ±1 standard error of the mean. The approximately linear increase in μ-values across quartic correlation supports the assumption of a graded similarity continuum from foil to target.
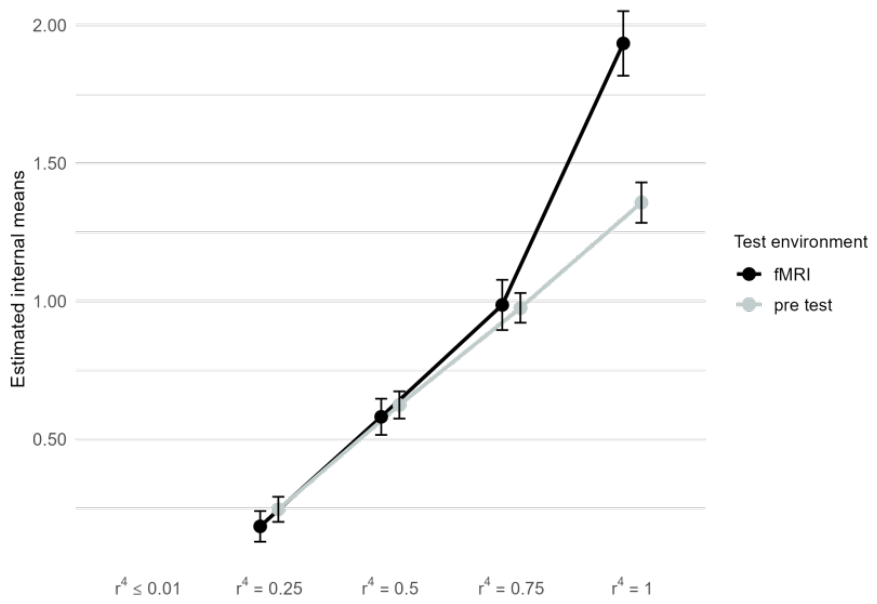

Table 1.
Relative response frequencies during both test settings.
| Foils | Lures25 | Lures50 | Lures75 | Targets | |
|---|---|---|---|---|---|
| Pretest | |||||
| “new” | 0.89 (0.03) | 0.68 (0.04) | 0.39 (0.03) | 0.15 (0.02) | 0.07 (0.02) |
| “similar” | 0.08 (0.02) | 0.26 (0.03) | 0.45 (0.03) | 0.52 (0.03) | 0.27 (0.03) |
| “old” | 0.01 (0.00) | 0.04 (0.02) | 0.16 (0.03) | 0.33 (0.03) | 0.65 (0.04) |
| fMRI | |||||
| “new” | 0.95 (0.02) | 0.83 (0.03) | 0.61 (0.04) | 0.34 (0.05) | 0.06 (0.02) |
| “similar” | 0.03 (0.01) | 0.14 (0.03) | 0.33 (0.03) | 0.52 (0.05) | 0.26 (0.05) |
| “old” | 0.00 (0.00) | 0.01 (0.00) | 0.05 (0.01) | 0.12 (0.03) | 0.64 (0.06) |
Note. Data were given as means (SEM in brackets). The relative frequencies of the correct answers are printed in bold. Almost every stimulus category was followed by omissions, which is why the columns over the response options do not add up exactly to 1. N = 22.
Table 2.
Main effects for the ROI analysis including the whole hippocampal formation for targets (n = 18), lures75 (n = 14), and foils (n = 20).
Table 2.
Main effects for the ROI analysis including the whole hippocampal formation for targets (n = 18), lures75 (n = 14), and foils (n = 20).
| Condition |
Left hemisphere | Right hemisphere | ||||||||
|---|---|---|---|---|---|---|---|---|---|---|
| Cluster size | x | y | z | t- value | Cluster size | x | y | z | t- value | |
| Targets | 21 | -36 | -25 | -13 | 5.25 | 18 | 33 | -16 | -16 | 6.11 |
| Lures75 | 6 | -33 | -28 | -10 | 4.80 | 21 | 18 | -10 | -22 | 7.38 |
| Foils | 84 | -33 | -16 | -22 | 7.39 | 56 | 33 | -16 | -19 | 7.43 |
| 12 | 21 | -40 | 2 | 6.21 | ||||||
Table 3.
Exploratory atlas-based localization of hippocampal activation for targets (n = 18), lures75 (n = 14), and foils (n = 20).
Table 3.
Exploratory atlas-based localization of hippocampal activation for targets (n = 18), lures75 (n = 14), and foils (n = 20).
| Condition | Region | Left hemisphere | Right hemisphere | ||||||||
|---|---|---|---|---|---|---|---|---|---|---|---|
| Cluster size | x | y | z | t- value | Cluster size | x | y | z | t- value | ||
| Targets | CA1 | 8 | -36 | -25 | -16 | 4.67 | 6 | 33 | -13 | -25 | 4.16 |
| CA2/CA3 | |||||||||||
| CA4/DG | |||||||||||
| Sub | |||||||||||
| Lures75 | CA1 | 10 | 18 | -10 | -22 | 7.38 | |||||
| CA2/CA3 | |||||||||||
| CA4/DG | 10 | 21 | -13 | -22 | 6.09 | ||||||
| Sub | |||||||||||
| Foils | CA1 | 24 | -33 | -16 | -22 | 7.39 | 22 | 18 | -10 | -22 | 7.08 |
| 5 | -21 | -13 | -19 | 5.06 | 9 | 21 | -40 | 2 | 6.21 | ||
| CA2/CA3 | 6 | -33 | -13 | -19 | 5.97 | ||||||
| CA4/DG | 30 | -33 | -16 | -19 | 6.72 | 20 | 33 | -16 | -19 | 7.43 | |
| 12 | -27 | -19 | -22 | 5.39 | |||||||
Table 4.
Neuropsychological data of subjects (raw and z-values).
| Test | raw value | z-value | ||||||
|---|---|---|---|---|---|---|---|---|
| mean | SEM | 95% CI | mean | SEM | ||||
| RAVLT | sum | 63.10 | 1.42 | [60.14, 66.06] | 1.34 | 0.18 | ||
| del | 13.67 | 0.45 | [12.72, 14.61] | 0.96 | 0.18 | |||
| rec | 14.48 | 0.24 | [13.99, 14.99] | 0.83 | 0.20 | |||
| TMT | A | 22.23 | 4.95 | [11.90, 32.56] | 0.70 | 0.16 | ||
| B | 41.95 | 2.37 | [37.00, 46.90] | 0.68 | 0.26 | |||
| DST | for | 11.00 | 0.49 | [9.97, 12.02] | 1.70 | 0.26 | ||
| back | 10.47 | 0.54 | [9.34, 11.60] | 1.80 | 0.33 | |||
| MWT-B | 30.19 | 0.78 | [28.56, 31.82] | 1.14 | 0.20 | |||
| RWT | cat | 32.90 | 1.79 | [29.17, 36.64] | 1.17 | 0.25 | ||
| lex | 19.52 | 1.19 | [17.05, 21.99] | 0.63 | 0.20 | |||
Note. RAVLT = Rey Auditory Verbal Learning Test (sum = trial 1 – 5, del = delayed recall, rec = recognition), TMT = Trial Making Test (version A & B), DST = Digit Span Test (for = forward, back = backward), MWT = Multiple Choice Vocabulary Intelligence Test-B (a German version of the National Adult Reading Test); RWT = Regensburger word fluency test (cat = categorical, lexical fluency).
Disclaimer/Publisher’s Note: The statements, opinions and data contained in all publications are solely those of the individual author(s) and contributor(s) and not of MDPI and/or the editor(s). MDPI and/or the editor(s) disclaim responsibility for any injury to people or property resulting from any ideas, methods, instructions or products referred to in the content. |
© 2026 by the authors. Licensee MDPI, Basel, Switzerland. This article is an open access article distributed under the terms and conditions of the Creative Commons Attribution (CC BY) license (http://creativecommons.org/licenses/by/4.0/).
Copyright: This open access article is published under a Creative Commons CC BY 4.0 license, which permit the free download, distribution, and reuse, provided that the author and preprint are cited in any reuse.