

Submitted:
03 September 2026
Posted:
04 September 2026
You are already at the latest version
Abstract
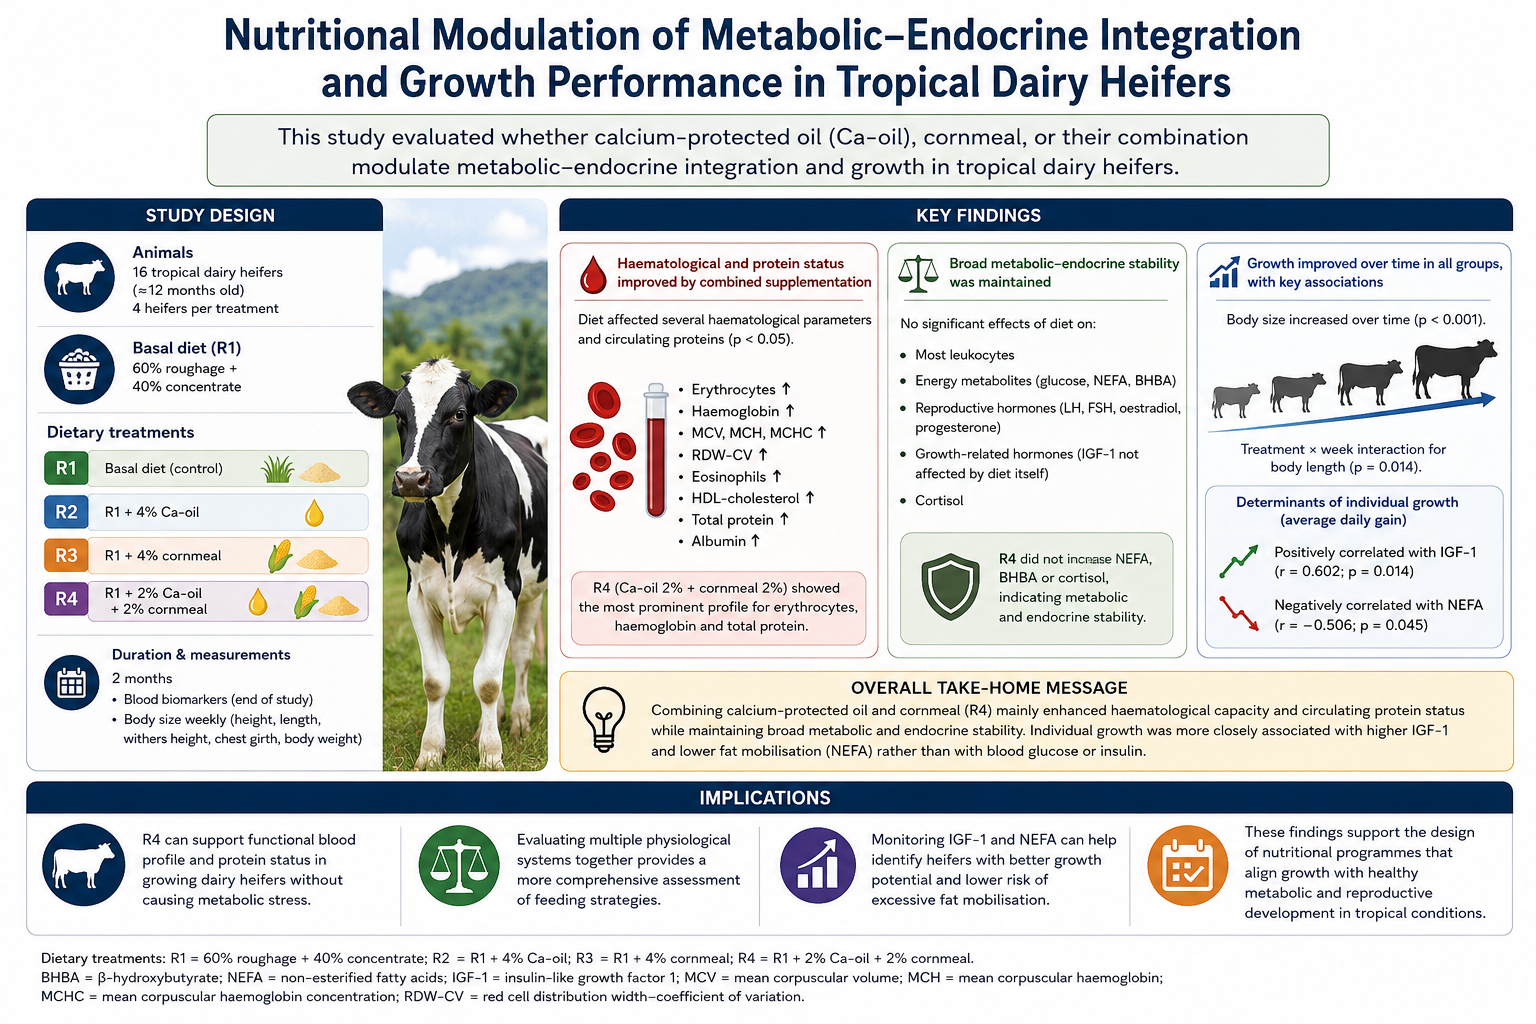
This study evaluated whether calcium-protected oil and cornmeal modulate metabolic–endocrine integration and growth in tropical dairy heifers. Four diets were tested: R1, 60% roughage + 40% concentrate; R2, R1 + 4% Ca-oil; R3, R1 + 4% cornmeal; and R4, R1 + 2% Ca-oil + 2% cornmeal, with four heifers per treatment. We assessed blood biomarkers over two months using one-way ANOVA of individual means, and analysed weekly growth with linear mixed-effects models. Diet affected erythrocytes, haemoglobin, MCV, MCH, MCHC, RDW-CV, eosinophils, HDL-cholesterol, total protein, and albumin (p < 0.05). In contrast, most leukocytes, energy metabolites, reproductive hormones, growth-related hormones, and cortisol were unchanged. R4 showed the most prominent erythrocyte, haemoglobin, and total-protein profile without increased NEFA, BHBA, or cortisol. Body size increased over time (p < 0.001), with a treatment × week interaction for body length (p = 0.014). Average daily gain correlated positively with IGF-1 (r = 0.602; p = 0.014) and negatively with NEFA (r = −0.506; p = 0.045). Thus, combined Ca-oil and cornmeal mainly influenced haematological capacity and circulating protein status while maintaining broad metabolic and endocrine stability.
Keywords:
blood
; metabolic status
; hematology
; energy nutrition
; puberty
1. Introduction
The heifer phase is a biological period that determines dairy cows’ growth trajectory, age at puberty, mating readiness, and productivity. Modern nutritional approaches therefore no longer focus solely on weight gain but also aim to align growth rate with metabolic and reproductive maturation. Recent reviews confirm that heifer responses to nutrition result from integrating intake, energy density, tissue growth, metabolic signals, and maturation of the hypothalamic-pituitary-ovarian axis [1,2,3,4]. Experiments with different nutritional planes also indicate that nutritional changes before and after weaning can impact growth efficiency, metabolism, leptin, LH, and age at puberty [5,6,7].
Effective energy provisioning strategies are crucial because heifers need energy for somatic growth. However, excess energy without proper guidance can change body composition without providing reproductive advantages. In Holstein heifers, higher energy allowances and different growth patterns have been linked to variations in feed efficiency and body development [8]. Meanwhile, multiparameter monitoring indicates that energy plans can influence both puberty timing and growth trajectories without harming overall reproductive health [9]. A recent study on heifers with nutritionally accelerated puberty showed that ovarian response and oocyte competence remained relatively intact, despite changes in oocyte mitochondrial transcripts [10]. These results highlight the importance of evaluating nutrition’s effects across multiple physiological systems. Research also shows that energy density, nutrient intake, and growth programs can impact feed efficiency, body composition, mammary tissue development, and the progression to puberty [11,12,13,14].
Different energy sources are thought to support distinct metabolic adaptation pathways. Corn starch increases the supply of fermentable substrates and glucogenic precursors, while Ca-oil provides high-energy-density lipids designed to mitigate rumen fermentation disorders. Studies in young cattle have shown that corn processing form and protein source can modulate performance, rumen fermentation, and blood metabolites [15,16,17]. Substituting or modifying corn sources can also alter blood metabolite status in heifers and calves [18,19], while changes in dietary starch levels in dairy cattle affect digestion, production, and systemic metabolism [20,21].
On the lipid side, recent meta-analyses have shown that rumen-protected fat or calcium salts of fatty acids can increase ration energy density and alter digestive responses and performance. However, the direction and magnitude of these responses depend strongly on basal ration composition, physiological phase, and supplementation level [22,23,24]. Therefore, combining starch with protected fat sources is attractive for testing in heifers, as it could theoretically provide energy through complementary pathways without excessively increasing one metabolic substrate. Limit-feeding studies in dairy heifers have also shown that changes in energy density and concentrate source can shift nutrient utilisation efficiency, rumen fermentation, metabolic profiles, and the timing of puberty [13,25,26].
Nutritional evaluation in heifers should not rely solely on glucose or body weight. Haematology provides information on oxygen-carrying capacity, erythropoiesis, and blood cell status, while the leukocyte differential can help assess immune stability and stress. Haematological reference ranges in cattle vary by age and physiological status, so interpretations should consider the population context and production phase [27,28,29]. At the same time, total protein, albumin, lipids, NEFA, BHBA, and metabolic hormones provide complementary information on nutrient availability, energy mobilisation, and homeostasis.
The reproductive axis also needs to be placed in the context of ovarian reserve and metabolic status. Anti-Müllerian hormone (AMH) has emerged as a biomarker of antral follicle population and reproductive potential in cattle [30,31], and researchers have evaluated its variation in both heifers and adult cattle for donor selection and reproductive capacity estimation [32,33,34]. However, AMH and other reproductive hormones do not operate in isolation from the developmental environment. Maternal conditions, early growth, juvenile nutrition, and physiological challenges can all be associated with ovarian reserve or pubertal timing [35,36,37,38].
Based on this framework, this study tested the hypothesis that adding Ca-oil, cornmeal, or a combination of both to a 60% fibre and 40% concentrate basal ration would produce different physiological response patterns. The Ca-oil and cornmeal combination was predicted to provide the most balanced profile of haematological capacity, metabolic status, and endocrine signalling. The study objective was to evaluate the effects of four rations on haematology, energy metabolism, reproductive hormones, and growth hormone–anabolic activity in dairy heifers over two months.
2. Materials and Methods
2.1. Study Design
The dataset included four ration treatments, each with (n = 32) heifers, and measurements were taken twice: in month 1 and month 2. The treatments consisted of R1 = 60% roughage plus 40% concentrate; R2 = R1 with an added 4% Ca-oil; R3 = R1 with 4% cornmeal; and R4 = R1 with 2% Ca-oil and 2% cornmeal. Heifer identity was consistent across the two months, making each heifer the experimental unit and the month the repeated measure.
2.2. Sampling and Laboratory Analysis
Blood samples were collected in months 1 and 2. EDTA tubes and 3 mL syringes were used for blood collection. The collected blood was handled immediately according to standard procedures to prevent damage and deterioration of sample quality. After haematology analysis, whole blood samples were separated from plasma by centrifugation at 3500 rpm for 5 minutes.
The haematology panel, including erythrocytes, haemoglobin, hematocrit, MCV, MCH, MCHC, RDW-CV, total and differential leukocytes, neutrophil: lymphocyte ratio, platelet count, and MPV, was determined using a haematology analyser. The metabolic panel was analysed per the Randox Kit protocol. It included glucose, NEFA, BHBA, triglycerides, total cholesterol, HDL, LDL, total protein, albumin, globulin, BUN, creatinine, lactate, and glucose: insulin ratio. The endocrine panel was analysed according to the instructions and procedures in the Mybiosource Kit and included estradiol-17β, progesterone, LH, FSH, AMH, prolactin, leptin, GH, IGF-1, insulin, T3, T4, and cortisol.
2.3. Statistical Analysis
For haematological parameters, energy and protein metabolism, reproductive hormones, growth hormone–anabolic, and cortisol, the experimental unit was the heifer. We first averaged month 1 and month 2 values for each heifer to obtain one individual value per parameter. We analysed these individual means using one-way analysis of variance (ANOVA), with diet treatment as the fixed factor. If we found a significant treatment effect, we compared treatments using Tukey’s honestly significant difference (HSD) test. Results are presented as mean ± SD, and differences were declared significant at P < 0.05. To visualise temporal variation not reflected in the two-month average, the average of each treatment × month combination for each biomarker was standardised to a Z-score [Z = (x − μ)/σ] and presented as a heatmap (Figure 1, Figure 2, Figure 3 and Figure 4). The heatmap is a descriptive, exploratory visualisation and was not used as the basis for significance testing.
Longitudinal growth data of weekly body weight, body length, chest circumference, and shoulder height were analysed using a linear mixed-effects model to accommodate repeated measurements on the same heifer. The model included treatment, week, and the treatment × week interaction as fixed effects, and heifer as a random effect. Significance of main effects and interactions was set at P < 0.05. Growth trajectories were visualised as the mean treatment value across weeks of observation (Figure 5). The average daily gain (ADG) of each heifer was calculated from the change in body weight between week 0 and week 7 divided by the length of the observation interval. The relationships of ADG with IGF-1, NEFA, insulin, and glucose in the second month were analysed using Pearson correlation and visualised with scatter plots, regression lines, and 95% confidence intervals. Next, we constructed an exploratory integrated physiological response network from the Pearson correlation matrix, integrating growth, energy metabolism, and endocrine indicators. Only variable pairs with |r| ≥ 0.50 and nominal P < 0.05 are displayed as edges; Solid lines indicate positive correlations and dashed lines indicate negative correlations. To assess the robustness of associations to multiple testing, we corrected the P-values in the network analysis using the false discovery rate (FDR) with the Benjamini–Hochberg procedure. Given the limited number of individual observations (n = 16), we treated the network as exploratory (hypothesis-generating), not as evidence of a causal relationship. P-values are reported as actual values whenever possible.
3. Results
3.1. Haematological Response
The dietary treatments produced different responses, particularly in the erythrocytic component, while most leukocyte and platelet parameters remained relatively unchanged (Table 1). RBC counts differed between treatments (P = 0.001), with R2 and R4 showing higher values than R1 and R3. Haemoglobin showed a similar pattern (P = 0.003), with the highest concentration in R4. In addition to changes in erythrocyte counts and haemoglobin, treatments also affected erythrocyte morphometric characteristics as indicated by differences in MCV (P = 0.004), MCH (P = 0.018), MCHC (P = 0.014), and RDW-CV (P = 0.037). Overall, these changes indicate that the haematological response to supplementation is not limited to erythrocyte counts but also involves erythrocyte size distribution and haemoglobin content. In contrast, hematocrit did not differ between treatments (P > 0.05), although some erythrocyte indices showed differences. Total leukocytes, neutrophils, lymphocytes, monocytes, basophils, and the neutrophil: lymphocyte ratio also showed no response to treatment (P > 0.05). Similarly, platelet counts and MPV were relatively stable. Among the differential leukocyte components, eosinophils were the only parameter that differed (P = 0.038), with a lower value in R2 than in other treatments. Thus, the effect of the ration on the haematological profile was more dominant in the erythrocytic compartment than in the leukocyte or platelet components.
3.2. Energy and Protein Metabolism
The treatments showed distinct metabolite patterns reflecting energy homeostasis and lipid transport and circulating protein status (Table 2). Glucose concentrations did not differ between treatments (P = 0.072). Similarly, NEFA and β-hydroxybutyrate (BHBA), indicators of lipid mobilisation and oxidation, did not differ (P > 0.05). The lack of differences in triglycerides, total cholesterol, LDL-cholesterol, BUN, creatinine, lactate, and the glucose: insulin ratio further showed that most indicators of systemic energy metabolism were relatively stable among the four diets. However, several metabolic components showed clear responses. HDL-cholesterol differed between treatments, with values in R2, R3, and R4 being higher than in R1 (P < 0.05). Circulating protein status showed more pronounced differences. Total protein increased gradually from R1 to the supplemented diet, with the highest values occurring in R4, while R2 and R3 were intermediate. Albumin was also higher in R2, R3, and R4 compared to R1 (P < 0.05), while globulin did not differ between treatments. This pattern suggests that the response to energy supplementation is more readily detected in plasma protein fractions and HDL-cholesterol than in key indicators of glucose homeostasis and lipid mobilisation.
3.3. Reproductive Hormones
In contrast to the haematological responses and some metabolic components, the reproductive hormone profile remained relatively stable across treatments (Table 3). Estradiol-17β, progesterone, LH, FSH, AMH, prolactin, and leptin concentrations did not differ among treatments (P > 0.05).
Therefore, there was no statistical evidence that supplementation with Ca-oil, corn meal, or their combination produced consistent changes in reproductive axis activity throughout the observation period. This stability persisted despite differences in several haematological indicators and protein status. This pattern suggests dissociation across physiological domains, with changes in haematological-metabolic components not accompanied by concurrent changes in reproductive hormones. Across treatments, no single diet consistently produced the highest or lowest concentrations of all reproductive hormones. Thus, individual and temporal variation appears to outweigh treatment effects on the overall reproductive endocrine panel.
3.4. Growth–Anabolic and Stress Axes
GH, IGF-1, insulin, T3, T4, and cortisol concentrations did not differ between treatments (P> 0.05; Table 4). The lack of change in insulin and IGF-1 is consistent with the relatively stable glucose and glucose: insulin ratios in the metabolic panel. Similarly, T3 and T4 concentrations did not show a consistent response to supplementation. Cortisol was also relatively unchanged, providing no statistical indication of differences in stress axis activation among the four treatments based on these parameters. Overall, the results from these domains indicate that differences in energy sources and combinations in the diets did not produce detectable shifts in the somatotropic–thyroid–insulin axis during the observation period. Thus, the response to treatment appears to be reflected earlier or more strongly in some hematologic parameters and circulating proteins than in growth hormone and metabolism.
3.5. Multivariate Response Visualisation
We utilised Z-score-based heatmaps to examine the relative structure of each biomarker’s response across treatment combinations and observation months (Figure 1, Figure 2, Figure 3 and Figure 4). This visualisation complements univariate results by exposing temporal heterogeneity that may be hidden when two months are summarised as a single mean per heifer. Since Z-scores indicate a value’s position within the biomarker distribution, red or blue colours do not necessarily imply better or worse outcomes. In haematology, standardised Z-scores uncovered a more intricate temporal and treatment pattern than mean-based comparisons (Figure 1). R1 generally exhibited negative Z-scores for most erythrocytic parameters, especially in the first month, with several parameters increasing in the second month. Conversely, R4 mainly showed positive Z-scores for various erythrocytic indicators, including erythrocytes, haemoglobin, MCH, MCHC, RDW-CV, and MCV in one or both observation months. This aligns with the univariate findings, which indicated that the dietary response mainly affected the erythrocytic compartment. Leukocyte responses were more heterogeneous, with the neutrophil: lymphocyte ratio relatively high in R1-M1 and R3-M2 but lower in other treatment-month combinations. WBC and neutrophils also fluctuated between months without a consistent pattern across R1 to R4. Overall, the R4 haematological pattern is more noticeable in erythrocytic parameters than in leukocytes and exhibits temporal variations that the two-month average analysis does not fully capture.
The energy metabolism heatmap showed greater heterogeneity in responses than the haematology domain (Figure 2). Negative Z-scores characterised R1-M1 for several indicators, including glucose, HDL-cholesterol, total protein, albumin, and globulin, while several parameters increased in R1-M2. R4 showed a different profile between the first and second months. Total protein and albumin showed positive Z-scores, particularly in R4, consistent with the univariate analysis. Parameters directly related to energy mobilisation did not move in parallel. NEFA was relatively high in R3-M1 and R4-M1 but decreased in R4-M2, while BHBA also showed a directional change between the first and second months in some treatments. Glucose in R4 was above the mean in both months, but this pattern did not produce significant treatment differences in the univariate analysis. Therefore, the heatmap suggests that metabolic adaptation is parameter- and time-specific, rather than a uniform shift across all metabolites toward higher or lower values.
The reproductive hormone Z-score profiles showed fairly clear intermonthly fluctuations but did not yield a consistent single-treatment pattern (Figure 3). R2 showed positive Z-scores for estradiol-17β in the first month and LH and FSH in the second month. Conversely, some of these hormones had negative Z-scores in other treatment-month combinations.
R3-M2 showed positive Z-scores for progesterone and leptin, while R4 showed different patterns between the first and second months for AMH, estradiol, progesterone, leptin, and prolactin. This variability in response direction is consistent with the absence of significant differences between treatments in the reproductive hormone panel. In other words, the heatmap indicates that the hormonal variations reflected temporal dynamics and heterogeneity among hormones rather than coordinated shifts in the overall reproductive axis in response to a specific diet.
The growth hormone–anabolic heatmap also shows a pattern that depends strongly on the month of observation (Figure 4). Insulin shows relatively high Z-scores in R1-M1 and R4-M1, but lower in some other combinations.
GH exhibits relatively high values in R1-M2 and R4, while IGF-1 exhibits positive Z-scores, particularly in R4-M2. T3 increases relatively strongly in R4-M1, while T4 exhibits the highest Z-score in R4-M2. Conversely, cortisol reaches relatively high Z-scores in R3-M1 and lower in R4. However, because there are no significant differences between treatments for GH, IGF-1, insulin, T3, T4, or cortisol, these colour patterns should be viewed as relative structure within the dataset, not evidence of a significant treatment effect. The heatmap primarily reveals that these hormones do not move synchronously and that the first-month response is not always maintained in the second month.
When all four biomarker groups are considered together, a pattern emerges that the response to the nutritional strategy is hierarchical and domain-specific. Statistical evidence is clearest in the erythrocytic compartment and circulating proteins and lipoproteins, while key energy metabolites and the endocrine axis show greater stability. R4 produced relatively prominent profiles for erythrocytes, haemoglobin, and total protein, but this superiority was not accompanied by consistent increases in all growth or reproductive hormones. The heatmap further demonstrates that treatment effects cannot be completely separated from the temporal dimension. Several biomarkers exhibited substantial Z-score shifts from the first to the second month within the same treatment. Overall, the results indicate that physiological adaptation to the diet is a multidimensional, dynamic response, with haematological-metabolic changes more pronounced than endocrine changes over the two months of observation.
3.6. Longitudinal Growth and Growth–Metabolic Integration
All growth indicators changed significantly by week of observation (P < 0.001; Figure 5), confirming progressive somatic growth throughout the study period. Treatment had no significant main effect on body weight, body length, chest circumference, or shoulder height. However, we detected a treatment × week interaction for body length (P = 0.014), indicating that body length trajectories differed between feeding strategies. No such interaction was found for body weight (P = 0.306), chest circumference (P = 0.992), or shoulder height (P = 0.985).
Thus, nutritional differences were more evident in specific growth trajectories than in consistent shifts across body size. Growth–metabolic association analysis revealed a moderate-strong positive relationship between ADG and IGF-1 (r = 0.602; P = 0.014), while ADG was negatively associated with NEFA (r = −0.506; P = 0.045; Figure 6). In contrast, the associations between ADG and insulin (r = 0.142; P = 0.600) and glucose (r = 0.197; P = 0.465) were not significant. This pattern suggests that individual growth variation is more closely related to the medium-term somatotropic signal and the degree of lipid mobilisation than to glucose or insulin concentration at a single sampling point.
The exploratory network formed two main physiological modules (Figure 7). The growth–energy module linked ADG with IGF-1 (r = 0.602), chest circumference gain with ADG (r = 0.570), and GH (r = 0.546), while NEFA negatively correlated with IGF-1 (r = −0.590), ADG (r = −0.506), and LH (r = −0.540). The endocrine–reproductive module was primarily characterised by the leptin–P4 (r = 0.608), T4–P4 (r = 0.596), and T4–E2 (r = −0.666) relationships. Although this structure suggests a biological connection between energy status, growth signals, and the reproductive axis, no edges remained significant after FDR correction q < 0.05. Therefore, interpret the network as hypothesis-generating and validate it in larger samples.
4. Discussion
The main finding of this dataset is that energy source manipulation produces a more pronounced response in haematological compartments and circulating proteins than in classical energy metabolites or the reproductive endocrine axis. R2 and especially R4 increase red blood cells and haemoglobin, accompanied by changes in MCV, MCH, MCHC, and RDW-CV. Physiologically, this pattern reflects changes in oxygen-transport capacity and red blood cell characteristics but does not imply direct stimulation of erythropoiesis. Haematological interpretation in cattle must consider age, physiological status, hydration, and population biological variation [27,28,29]. Because this study did not measure reticulocytes, Fe, vitamin B12/folate, or erythropoietin, the erythrocytic responses are better described as changes in haematological phenotype rather than evidence of a specific hematopoietic mechanism.
Stable WBC, neutrophil, lymphocyte, neutrophil: lymphocyte ratio, and cortisol are relevant because they indicate that consistent signals of systemic stress activation do not accompany increases in erythrocytic indicators. Eosinophils differed significantly in R2, but parasite status, allergies, and individual variation strongly influence these parameters. Therefore, interpret changes in eosinophils without parallel shifts in total leukocytes or the neutrophil: lymphocyte ratio with caution. Early nutritional studies in heifers also demonstrated that changes in the plane of nutrition can subtly modulate metabolic and immune phenotypes without always producing uniform changes in all blood indicators [2,7].
In energy metabolism, unchanged glucose, NEFA, BHBA, triglycerides, and the glucose: insulin ratio indicate that all four diets likely kept heifers within a relatively stable range of energy homeostasis. This aligns with the concept that metabolic responses to the plane of nutrition depend on developmental stage, actual intake, and growth rate, rather than simply on the labelled energy source. Rosadiuk et al. [5] and Bruinjé et al. [6] showed that nutritional changes can affect metabolic and reproductive indicators differently depending on pre- and post-weaning stages. Williams et al. [8] also demonstrated that energy levels and feed efficiency can influence heifer growth, while Colas et al. [9] emphasised the value of multiparameter monitoring to capture growth and developmental responses not always reflected in a single biomarker.
Interpret responses to corn components in the context of fermentation and starch availability. Corn grain processing can alter microbial access to starch and ultimately affect fermentation, performance, and blood metabolites in young cattle [15,16,17]. Other studies have shown that substituting corn sources or using corn silage in starter rations can shift fermentation patterns and metabolic status without producing a universal response in glucose or lipids [18,19]. In dairy cattle, responses to starch content also depend on interactions with digestion and physiological status [20,21]. Therefore, the absence of significant glucose changes in R3 does not imply an ineffective effect of corn meal; the effect may be channelled through fermentation patterns, intake, or nutrient partitioning, which this dataset did not measure.
On the lipid side, the increase in HDL-cholesterol in the supplemented group and the trend toward a better protein profile in R4 could reflect changes in lipid transport and energy availability. A meta-analysis of calcium salts of palm fatty acids suggests that the response to protected fat depends on the dose and dietary context, with changes in digestibility and performance not always identical between studies [22]. Increasing calcium salt levels can also produce different responses across physiological periods [23]. More broadly, a meta-analysis of rumen-protected fat in cattle confirmed potential changes in fermentation, digestion, performance, and product quality. Still, the magnitude of the response depends on numerous biological and nutritional moderators [24]. Therefore, the increase in HDL in R2-R4 is plausible as part of a lipid transport adaptation, but the mechanism cannot be ascertained without more detailed lipoprotein profiles and intakes.
R4 is interesting because it combines 2% Ca-oil and 2% cornmeal. Conceptually, this ration combines energy from protected lipids with a fermentable carbohydrate source. R4’s superior profiles for erythrocytes, haemoglobin, and total protein may suggest benefits from diversifying energy sources. However, the data do not support the claim that a single mechanism explains the entire response, as R2 also increased several erythrocyte indices. In contrast, R3 increased albumin and HDL without significant hormonal changes. Modern heifer nutrition literature emphasises that optimal growth responses depend on matching nutrient supply to developmental stage, not simply on increased energy density [3,7,11,13,14].
In the reproductive axis, unchanged levels of estradiol, progesterone, LH, FSH, AMH, prolactin, and leptin indicate that the four diets did not produce consistent endocrine shifts over the observation period. This is not surprising, as puberty in heifers results from integrating physiological age, body weight, adiposity, growth, and metabolic signals [1,3]. Experimental evidence also suggests early nutritional carryover to reproductive tract development and follicle population, although endocrine changes are not always persistent [39]. Nutritional experiments show that leptin and LH can change with the plane of nutrition and developmental rate [6]. In contrast, other controlled studies show that nutritional influences on pubertal timing do not always translate into changes in adult reproductive function [36]. Recent studies have also shown that accelerated puberty through nutritional programs does not necessarily decrease ovarian responsiveness or oocyte competence, despite molecular responses in oocytes [10].
AMH stability, in particular, deserves separate discussion. AMH is a relatively useful biomarker for describing ovarian reserve and antral follicle population in cattle [30,31,40]. Researchers have evaluated a single AMH measurement for selecting donor ovum pick-ups [32], while longitudinal studies have shown patterns of AMH change throughout development in dairy cattle [33]. Researchers have also studied the relationship between AMH and reproductivity in Bos indicus [34]. However, the developmental environment can influence ovarian reserve: maternal status and prenatal environmental exposures have been reported to be associated with AMH or ovarian reserve in offspring [35,37]. Non-nutritional factors, such as health interventions, can also be evaluated against oestrous cycle parameters and AMH in heifers [38]. Therefore, the absence of changes in AMH in this study is more accurately interpreted as no evidence of changes in ovarian reserve within a two-month window, rather than evidence that nutrition has no long-term reproductive effects.
Z-score heatmaps enhance interpretation by highlighting temporal heterogeneity. Some biomarkers change direction between months 1 and 2 of the same treatment, so analyses using only two-month averages may mask treatment × month interactions. Biologically, these temporal patterns matter because nutritional responses in heifers vary with age and developmental stage. Longitudinal monitoring has been used to elucidate heifer metabolic adaptations to different nutritional programs [7,9], and recent reproductive research also emphasises the importance of linking age at puberty to ovarian traits longitudinally [10]. Therefore, for manuscripts, analyse raw data with linear mixed repeated-measures models that preserve heifer identity, include treatment, month, and treatment × month as fixed effects, and report effect sizes and their uncertainties.
Longitudinal growth analysis broadens interpretation by showing that time is a key determinant of changes in body weight and size. Heifer growth should ideally be assessed as a trajectory, rather than simply final weight, because postweaning nutritional targets should align with ADG, frame size, growth composition, and reproductive readiness [41]. Population studies also indicate that nutrient supply, health, environment, and management influence ADG [42]. At the same time, long-term monitoring suggests that weight advantages can persist without parallel changes in overall body size or feed efficiency [43]. In this dataset, the significant treatment × week effect on body length but not on weight, chest circumference, or shoulder height suggests a trait-specific growth response.
The positive ADG–IGF-1 relationship provides physiological support for the somatotropic axis’s involvement in individual growth variation. IGF-1 is a key mediator of anabolic responses to nutrient availability; in dairy heifer calves, higher levels of nutrition can alter the concentrations of IGF-1 and its binding proteins [44], while differences in pre- and post-weaning nutrient supply affect growth, efficiency, glucose, insulin, IGF-1, and developmental indicators [5]. The finding that ADG does not correlate with glucose or insulin but does correlate with IGF-1 suggests that cumulative growth signals may be more informative than metabolites, which are strongly influenced by feeding time and sampling. Metabolomics studies also indicate that nutrient supply shapes responses across energy, protein, and hepatic function pathways [45].
The negative correlations between ADG–NEFA and NEFA–IGF-1 are consistent with the interpretation that greater fatty acid mobilisation may reflect energy partitioning that favours less tissue deposition. However, because these relationships are correlational, these results do not prove clinical negative energy balance. The network linking GH, IGF-1, ADG, NEFA, LH, and the T4–P4–leptin–E2 module biologically supports communication among nutritional status, the somatotropic axis, the thyroid, adipose signalling, and the reproductive axis. The loss of significance after FDR correction confirms that Figure 7 should be treated as an exploratory systems-level visualisation, not a confirmation of a mechanism; its primary value is identifying biomarkers and modules worthy of testing in future studies with larger heifer numbers and denser longitudinal sampling.
Overall, the data support the interpretation that energy supplementation alters specific components of heifer physiology without causing broad systemic endocrine shifts. The strength of this approach is its cross-domain panel combining haematology, metabolism, and endocrine measures. The main limitations are the small sample size, the two-month duration, the lack of intake and growth performance data, and limited information on pubertal status. Based on the literature from 2019–2026, the most informative heifer studies tend to integrate nutrition with whole-animal outcomes, metabolites, hormones, and reproductive indicators (Geiger et al., 2016a; Geiger et al., 2016b; Weller et al., 2016; van Niekerk et al., 2021; Williams et al., 2022; Fantuz et al., 2024; Ockenden et al., 2025; Leal et al., 2025; Leal et al., 2026). For the final manuscript, adding DMI, average daily gain, BCS, age and weight at puberty, and ovarian ultrasonography would substantially strengthen the biological inference.
5. Conclusions
Supplementation with Ca-oil, cornmeal, or their combination modulated the physiological responses of dairy heifers in a domain-specific manner, with the most pronounced changes in erythrocyte, HDL-cholesterol, total protein, and albumin profiles, while most indicators of energy homeostasis and reproductive and growth-anabolic hormones remained stable. The combination of 2% Ca-oil + 2% cornmeal (R4) produced the most pronounced changes in erythrocytes, haemoglobin, and total protein, without associated increases in NEFA, BHBA, or cortisol. Somatic growth was progressive over time across all treatments, and differences in feeding strategies were primarily reflected in body length trajectories, rather than in a primary effect on overall body size. The positive association of ADG with IGF-1 and the negative association of ADG with NEFA suggest that individual growth variation is more closely related to somatotropic signalling and energy partitioning than to transient glucose or insulin. The physiological network further suggests potential linkages between growth, energy metabolism, and the endocrine-reproductive axis. Still, because no edges persisted after FDR correction, the pattern should be viewed as hypothesis-generating. Thus, the combination of Ca-oil and cornstarch may support haematological–metabolic adaptation without disrupting endocrine stability; however, larger sample sizes and longer longitudinal monitoring are needed to establish its biological and practical implications.
Author Contributions
Conceptualisation, U.H.T., A.M. and I.S; Data curation, U.H.T., N.P.I.and D.S.; Formal analysis, A.M., I.S., U.H.T., F.P. and S.I.Z.A.; Funding acquisition, U.H.T., A.M. and I..S.; Investigation, U.H.T., A.M. I.S., N.P.I., D.S., R.L. and S.I. Z.A.; Methodology, U.H.T., A.M. D.S. and F.P., Project administration, I.S. and N.P.I., Resources, A.M., F.P., R.L. and S.I.Z.A., Supervision, U.H.T. and A.M.; Validation, U.H.T., A.M. F.P. and R.L.; Visualisation, D.S. and R.L.; Writing – original draft and writing – review & editing, Writing – original draft, A.M., U.H.T., I.S., N.P.I. and D.S. All authors have read and agreed to the published version of the manuscript.
Funding
This entire research project is funded by the Rector of Universitas Padjadjaran through the Universitas Padjadjaran Internal Research Grant, under contract number 4060/UN6.J/PT.00/2026.
Institutional Review Board Statement
The entire series of experiments—encompassing planning, animal care, performance measurement, and blood sampling—was evaluated and approved for ethical compliance by the Animal Experimentation Ethics Division of the Directorate of Food Research and Development, Ministry of Health of the Republic of Indonesia (Ethics Certificate No. 486/DRPP/IV/1.3/2026).
Data Availability Statement
No data or results are stored in an official repository. All data and materials related to this research are presented in this article or are available upon request or through correspondence with the authors.
Acknowledgments
The authors express their sincere appreciation to the Head of BPPIBTSP (Food Security and Livestock Agency of West Java) for permitting the use of animals (heifers) for this experiment. The authors also thank the animal science students who participated in this research.
Conflicts of Interest
None.
Abbreviations
The following abbreviations are used in this manuscript:
| MCV | Mean Corpuscular Volume |
| MCH | Mean Corpuscular Haemoglobin |
| MCHC | Mean Corpuscular Haemoglobin Concentration |
| RDW-CV | Red Cell Distribution Width–Coefficient of Variation |
| MPV | Mean Platelet Volume |
| NEFA | Non-Esterified Fatty Acids |
| HDL | High-Density Lipoprotein |
| LDL | Low-Density Lipoprotein |
| LH | Luteinizing Hormone |
| FSH | Follicle-Stimulating Hormone |
| IGF-1 | Insulin-Like Growth Factor 1 |
| T3 | Triiodothyronine |
| T4 | Thyroxine (Tetraiodothyronine) |
References
- Abeni, F.; Petrera, F.; Le Cozler, Y. Effects of feeding treatment on growth rates, metabolic profiles and age at puberty, and their relationships in dairy heifers. Animals 2019, 13, 1020–1029. [Google Scholar] [CrossRef] [PubMed]
- van Niekerk, J.K.; Fischer-Tlustos, A.J.; Wilms, J.N.; Hare, K.S.; Welboren, A.C.; Lopez, A.J.; Yohe, T.T.; Cangiano, L.R.; Leal, L.N.; Steele, M.A. ADSA Foundation Scholar Award: New frontiers in calf and heifer nutrition—From conception to puberty. J. Dairy Sci. 2021, 104, 8341–8362. [Google Scholar] [CrossRef] [PubMed]
- Fantuz, F.; Fatica, A.; Salimei, E.; Marcantoni, F.; Todini, L. Nutrition, growth, and age at puberty in heifers. Animals 2024, 14, 2801. [Google Scholar] [CrossRef] [PubMed]
- Leal, L.N.; Daniel, J.B.; Doelman, J.; Keppler, B.R.; Steele, M.A.; Martín-Tereso, J. Effects of preweaning milk allowance on long-term metabolism in Holstein heifers. J. Dairy Sci. 2025, 108, 4988–4999. [Google Scholar] [CrossRef] [PubMed]
- Rosadiuk, J.P.; Bruinjé, T.C.; Moslemipur, F.; Fischer-Tlustos, A.J.; Renaud, D.L.; Ambrose, D.J.; Steele, M.A. Different planes of pre- and postweaning phase nutrition in Holstein heifers: I. Effects on feed intake, growth efficiency, and metabolic and developmental indicators. J. Dairy Sci. 2021, 104, 1136–1152. [Google Scholar] [CrossRef] [PubMed]
- Bruinjé, T.C.; Rosadiuk, J.P.; Moslemipur, F.; Sauerwein, H.; Steele, M.A.; Ambrose, D.J. Different planes of pre- and postweaning phase nutrition in Holstein heifers: II. Effects on circulating leptin, luteinizing hormone, and age at puberty. J. Dairy Sci. 2021, 104, 1153–1163. [Google Scholar] [CrossRef] [PubMed]
- Ockenden, E.M.; Russo, V.M.; Leury, B.J.; Giri, K.; Wales, W.J. Early-life nutrition and its effects on the developing heifer: Growth, nutritive intakes, and metabolism. J. Dairy Sci. 2025, 108, 3515–3528. [Google Scholar] [CrossRef] [PubMed]
- Williams, K.T.; Weigel, K.A.; Coblentz, W.K.; Esser, N.M.; Schlesser, H.; Hoffman, P.C.; Ogden, R.; Su, H.; Akins, M.S. Effect of dietary energy level and genomic residual feed intake on bred Holstein dairy heifer growth and feed efficiency. J. Dairy Sci. 2022, 105, 2201–2214. [Google Scholar] [CrossRef] [PubMed]
- Colas, C.; Venturi, E.; Saget, M.; Métivier, L.; Briant, E.; Dupont, M.; Georget, D.; Daudon, M.; Ramé, C.; Elleboudt, F.; Ducrocq, L.; Ravineau, C.; Salvetti, P.; Dalbies-Tran, R.; Staub, C. Multiparameter growth-performance monitoring of Holstein dairy heifers fed on moderate- or high-energy feeding plans from birth to puberty—PLoS ONE. 2024, 19, e0314015. [Google Scholar] [CrossRef] [PubMed]
- le Bourhis, D.; Jarrier-Gaillard, P.; Cadoret, V.; Lefort, G.; Dupont, M.; Desnoes, O.; Briant, E.; Metivier, L.; Venturi, E.; Salvetti, P.; Staub, C.; Dalbies-Tran, R. Nutrition-induced advanced puberty in dairy heifers does not affect ovarian response or oocyte in vitro competence despite reduced oocyte mitochondrial transcripts. Animal 2026, 20, 101821. [Google Scholar] [CrossRef] [PubMed]
- Zanton, G.I.; Heinrichs, A.J. Efficiency and rumen responses in younger and older Holstein heifers limit-fed diets of differing energy density. J. Dairy Sci. 2016, 99, 2825–2836. [Google Scholar] [CrossRef] [PubMed]
- Weller, M.M.D.C.A.; Albino, R.L.; Marcondes, M.I.; Silva, W.; Daniels, K.M.; Campos, M.M.; Duarte, M.S.; Mescouto, M.L.; Silva, F.F.; Guimarães, S.E.F. Effects of nutrient intake levels on mammary parenchyma growth and gene expression in crossbred (Holstein × Gyr) prepubertal heifers. J. Dairy Sci. 2016, 99, 9962–9973. [Google Scholar] [CrossRef] [PubMed]
- Williams, K.T.; Weigel, K.A.; Coblentz, W.K.; Esser, N.M.; Schlesser, H.; Hoffman, P.C.; Su, H.; Akins, M.S. Effect of dietary energy density and genomic residual feed intake on prebred dairy heifer feed efficiency, growth, and manure excretion. J. Dairy Sci. 2019, 102, 4041–4050. [Google Scholar] [CrossRef] [PubMed]
- Van Amburgh, M.E.; Ross, D.A.; Lintault, L.; Molano, R.A. Growth performance, efficiency, and composition of Holstein heifers fed 2 levels of nutrient intake from 44 to 350 kilograms body weight. J. Dairy Sci. 2026, 109, 6301–6317. [Google Scholar] [CrossRef] [PubMed]
- Malekkhahi, M.; Vyas, D.; Bazgir, A.; Bagheri, F.; Norouzi Ebdalabadi, M.; Razzaghi, A. Increased super-conditioning temperature of corn grain affects performance, skeletal growth, and blood metabolites in Holstein dairy calves. J. Dairy Sci. 2021, 104, 12486–12495. [Google Scholar] [CrossRef] [PubMed]
- Malekkhahi, M.; Razzaghi, A.; Ahmadi Zadeh, M.; Satlekh Mohammadi, B.; Khosravi, P.; Farrokhi, M.R.; Drackley, J.K.; Vyas, D. Evaluating the effect of finely ground, dry-rolled, and crumbled corn grain on performance, feeding behavior, and starch digestion in Holstein dairy heifers. J. Dairy Sci. 2022, 105, 3142–3152. [Google Scholar] [CrossRef] [PubMed]
- Jafarpour, M.; Alikhani, M.; Riasi, A.; Omidi-Mirzaei, H.; Khorvash, M.; Ghaffari, M.H. Effects of corn grain processing and protein source on calf performance, rumen fermentation, and blood metabolites. Sci. Rep. 2023, 13, 10129. [Google Scholar] [CrossRef] [PubMed]
- Kim, T.I.; Lim, D.H.; Lee, H.J.; Park, S.M.; Kim, Y.J.; Choi, H.C.; Park, J.H.; Kim, S.C.; Ki, K.S.; Mayakrishnan, V. Effects of replacing corn with hydroponically sprouted barley on the growth performance and blood metabolite status of Holstein dairy heifers. Appl. Sci. 2020, 10, 7442. [Google Scholar] [CrossRef]
- Zhang, J.; Shang, J.; Hao, Y.; Wang, Y.; Cao, Z.; Yang, H.; Wang, W.; Li, S. Growth performance, blood metabolites, ruminal fermentation, and bacterial community in preweaning dairy calves fed corn silage-included starter and total mixed ratio. J. Dairy Sci. 2023, 106, 4545–4558. [Google Scholar] [CrossRef] [PubMed]
- Krogstad, K.C.; Bradford, B.J. The effects of feeding α-amylase-enhanced corn silage with different dietary starch concentrations to lactating dairy cows on milk production, nutrient digestibility, and blood metabolites. J. Dairy Sci. 2023, 106, 4666–4681. [Google Scholar] [CrossRef] [PubMed]
- Sirjani, M.A.; Amanlou, H.; Mirzaei-Alamouti, H.; Shahir, M.H.; Hasanlou, J.; Opsomer, G. Effects of dietary starch content and body condition score at calving on reproductive parameters in Holstein dairy cows. Prev. Vet. Med. 2021, 196, 105488. [Google Scholar] [CrossRef] [PubMed]
- dos Santos Neto, J.M.; de Souza, J.; Lock, A.L. Effects of calcium salts of palm fatty acids on nutrient digestibility and production responses of lactating dairy cows: A meta-analysis and meta-regression. J. Dairy Sci. 2021, 104, 9752–9768. [Google Scholar] [CrossRef] [PubMed]
- dos Santos Neto, J.M.; Silva, J.O.; Meschiatti, M.A.P.; de Souza, J.; Negrão, J.A.; Lock, A.L.; Santos, F.A.P. Increasing levels of calcium salts of palm fatty acids affect production responses during the immediate postpartum and carryover periods in dairy cows. J. Dairy Sci. 2022, 105, 9652–9665. [Google Scholar] [CrossRef] [PubMed]
- Albarki, H.R.; Kusuma, R.I.; Daulai, M.S.; Suntara, C.; Iwai, C.B.; Jayanegara, A.; Cherdthong, A. Effects of rumen-protected fat on rumen fermentation products, meat characteristics, cattle performance, and milk quality: A meta-analysis. Anim. Feed Sci. Technol. 2024, 318, 116137. [Google Scholar] [CrossRef]
- Manthey, A.K.; Anderson, J.L.; Perry, G.A.; Keisler, D.H. Feeding distillers dried grains in replacement of forage in limit-fed dairy heifer ratios: Effects on metabolic profile and onset of puberty. J. Dairy Sci. 2017, 100, 2591–2602. [Google Scholar] [CrossRef] [PubMed]
- Manthey, A.K.; Anderson, J.L. Growth performance, rumen fermentation, nutrient utilization, and metabolic profile of dairy heifers limit-fed distillers dried grains with ad libitum forage. J. Dairy Sci. 2018, 101, 365–375. [Google Scholar] [CrossRef] [PubMed]
- Roadknight, N.W.; Courtman, N.F.; Mansell, P.D.; Jongman, E.C.; Loh, Z.A.; Fisher, A.D. Biochemistry and hematology reference intervals for neonatal dairy calves aged 5–12 days. Vet. Clin. Pathol. 2021, 50, 278–286. [Google Scholar] [CrossRef] [PubMed]
- Chen, H.; Yu, B.; Liu, C.; Cheng, L.; Yu, J.; Hu, X.; Xiang, M. Hematology reference intervals for Holstein cows in Southern China: A study of 786 subjects. Vet. Sci. 2022, 9, 565. [Google Scholar] [CrossRef] [PubMed]
- Tsiamadis, V.; Kougioumtzis, A.; Siachos, N.; Panousis, N.; Kritsepi-Konstantinou, M.; Valergakis, G.E. Hematology reference intervals during the prepartum period, first week after calving, and peak lactation in clinically healthy Holstein cows. Vet. Clin. Pathol. 2022, 51, 134–145. [Google Scholar] [CrossRef] [PubMed]
- Mossa, F.; Ireland, J.J. Physiology and endocrinology symposium: Anti-Müllerian hormone: a biomarker for the ovarian reserve, ovarian function, and fertility in dairy cows. J. Anim. Sci. 2019, 97, 1446–1455. [Google Scholar] [CrossRef] [PubMed]
- Alward, K.J.; Bohlen, J.F. Overview of anti-Müllerian hormone (AMH) and association with fertility in female cattle. Reprod. Domest. Anim. 2020, 55, 3–10. [Google Scholar] [CrossRef] [PubMed]
- Fushimi, Y.; Monniaux, D.; Takagi, M. Efficacy of a single measurement of plasma anti-Müllerian hormone concentration for ovum pick-up donor selection of Japanese Black heifers in herd breeding programs. J. Reprod. Dev. 2019, 65, 369–374. [Google Scholar] [CrossRef] [PubMed]
- Alward, K.J.; Graves, W.M.; Palomares, R.A.; Ely, L.O.; Bohlen, J.F. Characterizing anti-Müllerian hormone (AMH) concentration and change over time in Holstein dairy cattle. Theriogenology 2021, 168, 83–89. [Google Scholar] [CrossRef] [PubMed]
- Ramesha, K.P.; Jeyakumar, S.; Mall, S.; Vedamurthy, G.V.; Kumaresan, A.; Devadasn, M.J.; Kataktalware, M.A.; Arul, D.; Das, D.N.; Manimaran, A. Anti-Müllerian hormone as an endocrine biomarker of reproductive longevity and assessment of single nucleotide polymorphisms in AMH gene of Bos indicus breeds of cattle. Reprod. Domest. Anim. 2022, 57, 1450–1464. [Google Scholar] [CrossRef] [PubMed]
- Succu, S.; Sale, S.; Ghirello, G.; Ireland, J.J.; Evans, A.C.O.; Atzori, A.S.; Mossa, F. Exposure of dairy cows to high environmental temperatures and their lactation status impairs establishment of the ovarian reserve in their offspring. J. Dairy Sci. 2020, 103, 11957–11969. [Google Scholar] [CrossRef] [PubMed]
- Maia, T.S.; Guimarães, H.R.; Garza, V.; Pohler, K.G.; Cardoso, R.C.; Williams, G.L. Early juvenile but not mid-to-late prenatal nutrition controls puberty in heifers but neither impacts adult reproductive function. Biol. Reprod. 2022, 107, 1035–1045. [Google Scholar] [CrossRef] [PubMed]
- Thomson, E.E.; Beltman, M.E.; Crowe, M.A.; McAloon, C.G.; Furlong, J.G.; Duane, M.M.; Brennan, J.P.N.; McDonald, M.M.; Kelly, E.T. Association between maternal growth in the pre-conception and early gestational period of nulliparous dairy heifers with anti-Müllerian hormone in their female offspring. Reprod. Domest. Anim. 2024, 59, e14498. [Google Scholar] [CrossRef] [PubMed]
- Widener, C.L.; Graves, W.M.; Alward, K.J.; Bohlen, J.F. Influence of a bovine respiratory disease vaccine with a temperature-sensitive modified live or killed infectious bovine rhinotracheitis component on oestrous cycle parameters and anti-Müllerian hormone concentration in nulliparous heifers. Reprod. Domest. Anim. 2019, 54, 1470–1476. [Google Scholar] [CrossRef] [PubMed]
- Bruinjé, T.C.; Rosadiuk, J.P.; Moslemipur, F.; Carrelli, J.E.; Steele, M.A.; Ambrose, D.J. Carryover effects of pre- and postweaning planes of nutrition on reproductive tract development and estrous cycle characteristics in Holstein heifers. J. Dairy Sci. 2019, 102, 10514–10529. [Google Scholar] [CrossRef] [PubMed]
- Jimenez-Krassel, F.; Scheetz, D.M.; Neuder, L.M.; Ireland, J.L.H.; Pursley, J.R.; Smith, G.W.; Tempelman, R.J.; Ferris, T.; Roudebush, W.E.; Mossa, F.; Lonergan, P.; Evans, A.C.O.; Ireland, J.J. Concentration of anti-Müllerian hormone in dairy heifers is positively associated with productive herd life. J. Dairy Sci. 2015, 98, 3036–3045. [Google Scholar] [CrossRef] [PubMed]
- Van Amburgh, M.E.; Sobe ron, F.; Meyer, M.J.; Molano, R.A. Symposium review: Integration of postweaning nutrient requirements and supply with composition of growth and mammary development in modern dairy heifers. J. Dairy Sci. 2019, 102, 3692–3705. [Google Scholar] [CrossRef] [PubMed]
- Shivley, C.B.; Lombard, J.E.; Urie, N.J.; Weary, D.M.; von Keyserlingk, M.A.G.; Kopral, C.A.; Santin, M.; Earleywine, T.J.; Olson, J.D.; Garry, F.B. Preweaned heifer management on US dairy operations: Part VI. Factors associated with average daily gain in preweaned dairy heifer calves. J. Dairy Sci. 2018, 101, 9245–9258. [Google Scholar] [CrossRef] [PubMed]
- Riesgraf, K.A.; Weigel, K.A.; Akins, M.S.; Van Os, J.M.C. Long-term effects of pre-weaning individual or pair housing of dairy heifer calves on subsequent growth and feed efficiency. Animals 2024, 14, 716. [Google Scholar] [CrossRef] [PubMed]
- Haisan, J.; Oba, M.; Ambrose, D.J.; Steele, M.A. Short communication: The effects of offering a high or low plane of milk preweaning on insulin-like growth factor and insulin-like growth factor binding proteins in dairy heifer calves. J. Dairy Sci. 2018, 101, 11441–11446. [Google Scholar] [CrossRef] [PubMed]
- Leal, L.N.; Doelman, J.; Keppler, B.R.; Steele, M.A.; Martín-Tereso, J. Preweaning nutrient supply alters serum metabolomics profiles related to protein and energy metabolism and hepatic function in Holstein heifer calves. J. Dairy Sci. 2021, 104, 7711–7724. [Google Scholar] [CrossRef] [PubMed]
- Geiger, A.J.; Parsons, C.L.M.; James, R.E.; Akers, R.M. Growth, intake, and health of Holstein heifer calves fed an enhanced preweaning diet with or without postweaning exogenous estrogen. J. Dairy Sci. 2016, 99, 3995–4004. [Google Scholar] [CrossRef] [PubMed]
- Geiger, A.J.; Parsons, C.L.M.; Akers, R.M. Feeding a higher plane of nutrition and providing exogenous estrogen increases mammary gland development in Holstein heifer calves. J. Dairy Sci. 2016, 99, 7642–7653. [Google Scholar] [CrossRef] [PubMed]
Figure 1.
Heatmap Z-score of haematological profile according to ration treatment and observation month.
Figure 1.
Heatmap Z-score of haematological profile according to ration treatment and observation month.
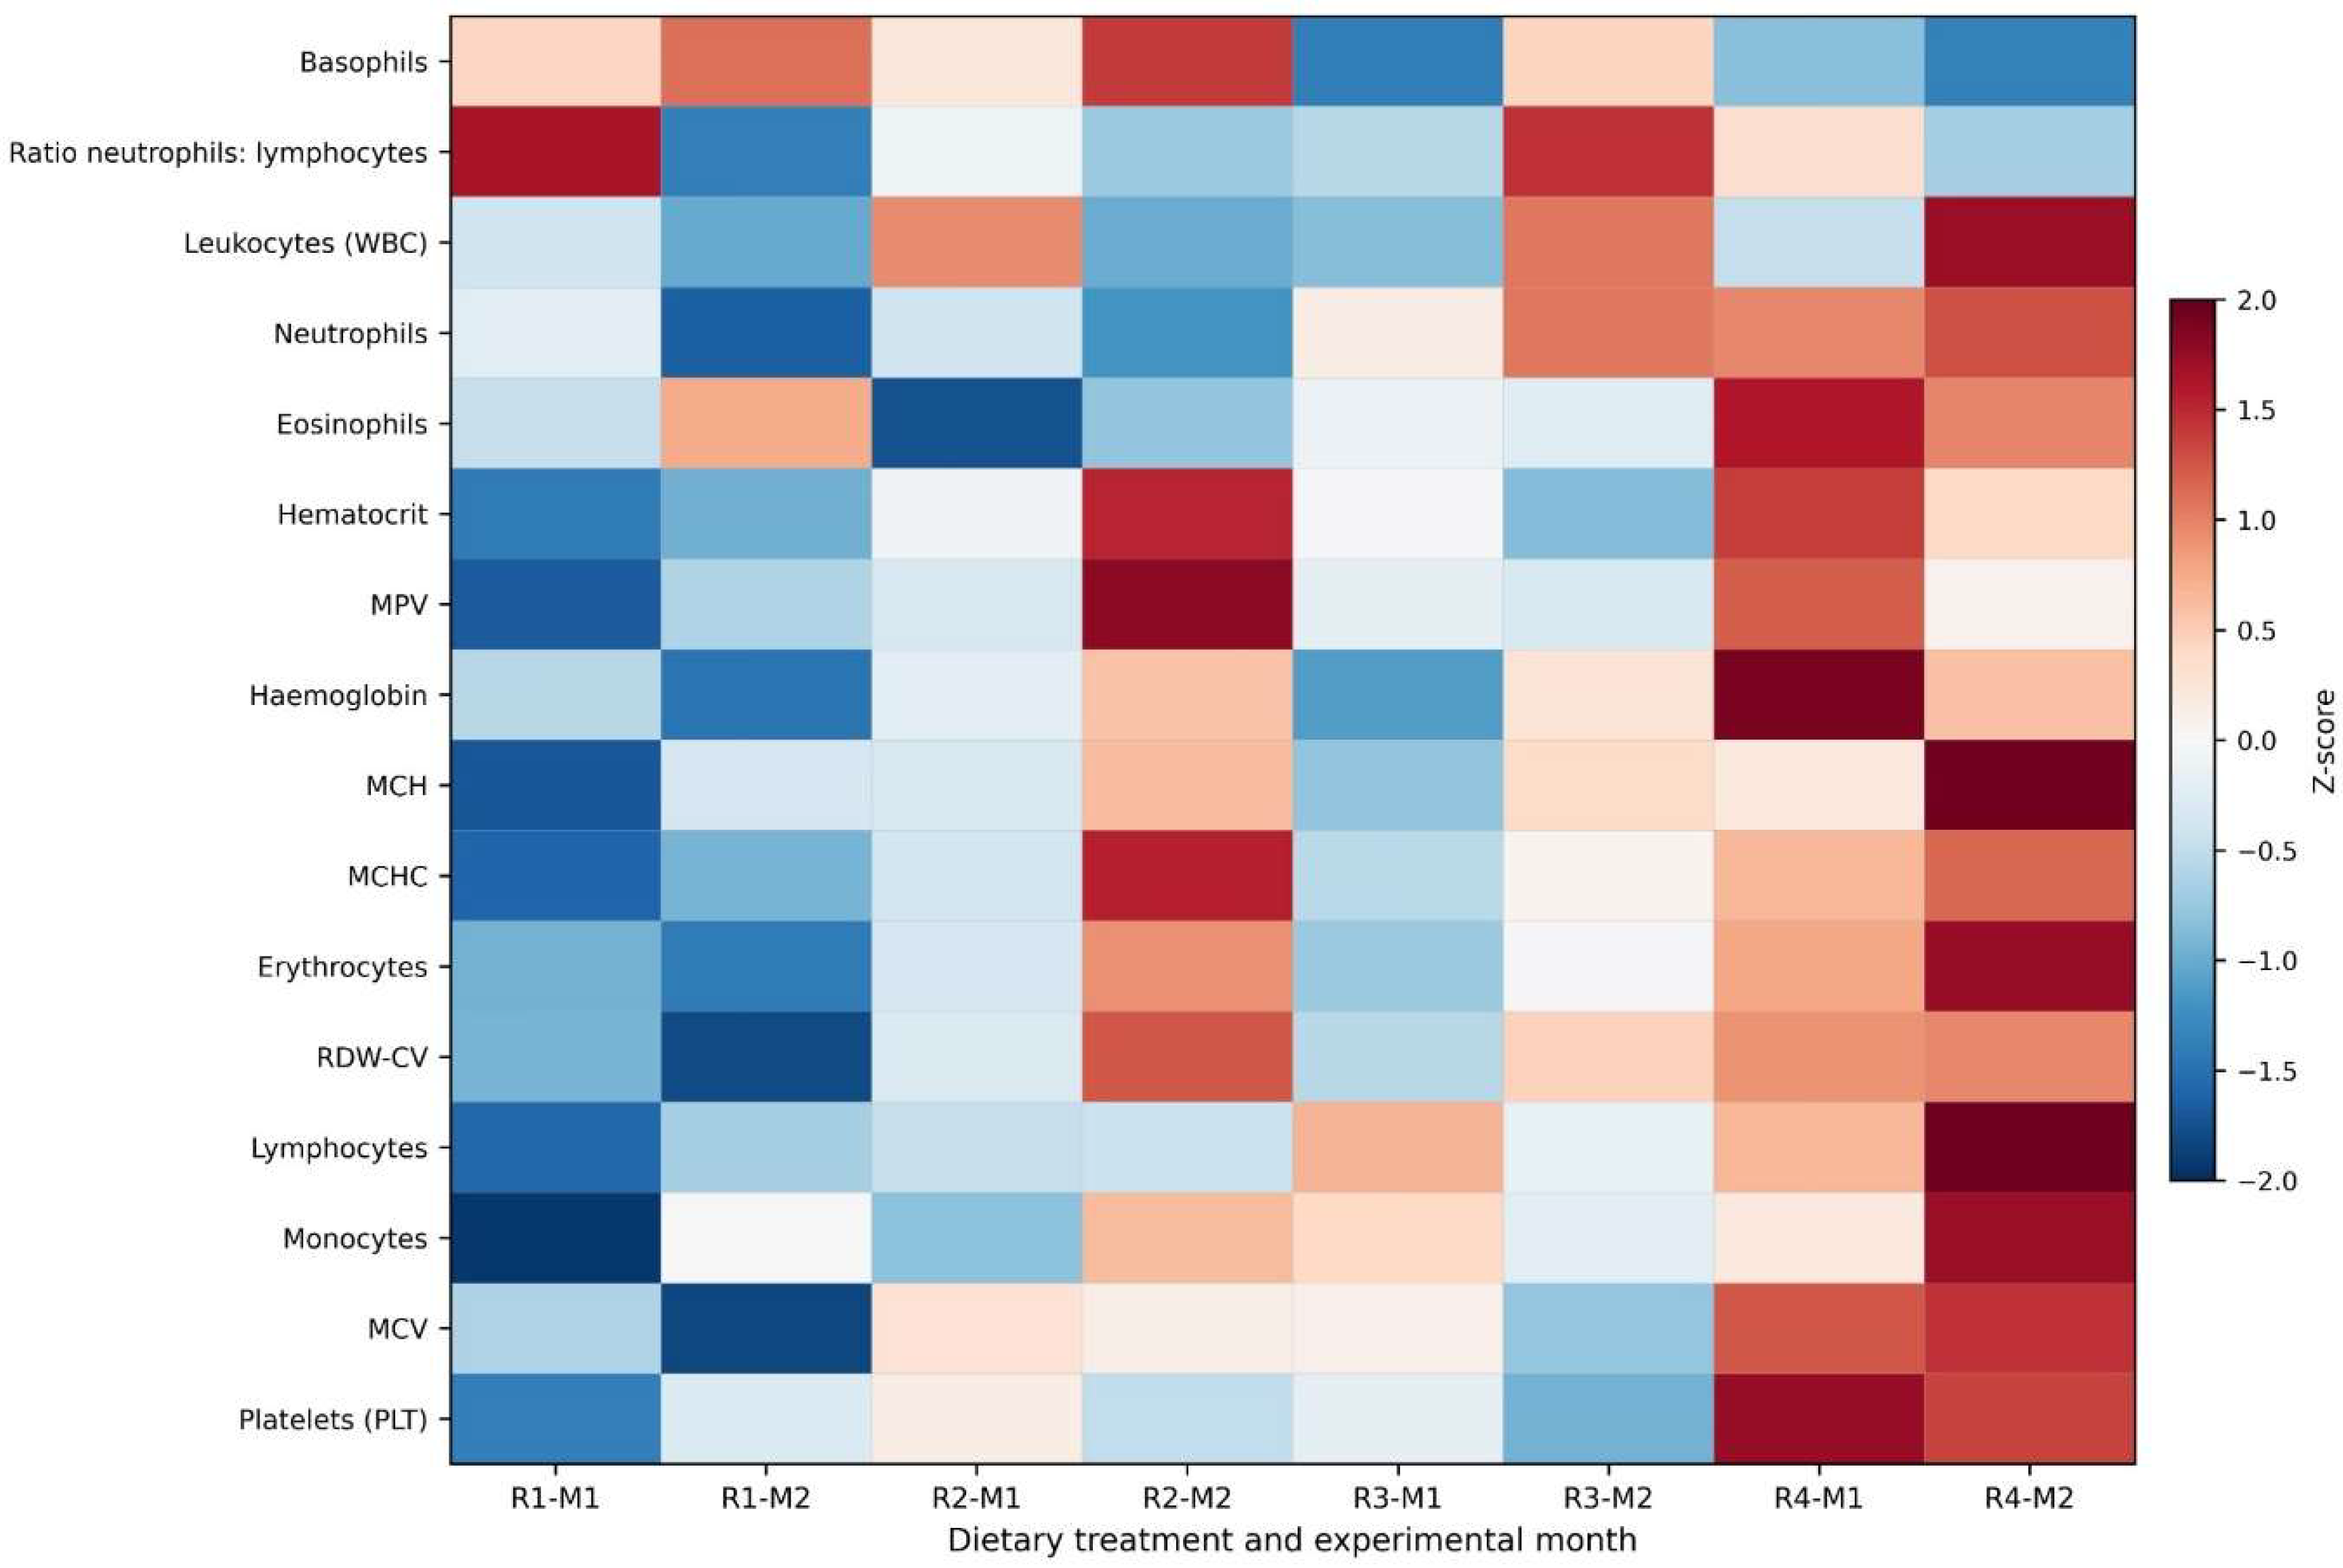
Figure 2.
Heatmap Z-score of energy metabolism profile according to ration treatment and observation month.
Figure 2.
Heatmap Z-score of energy metabolism profile according to ration treatment and observation month.
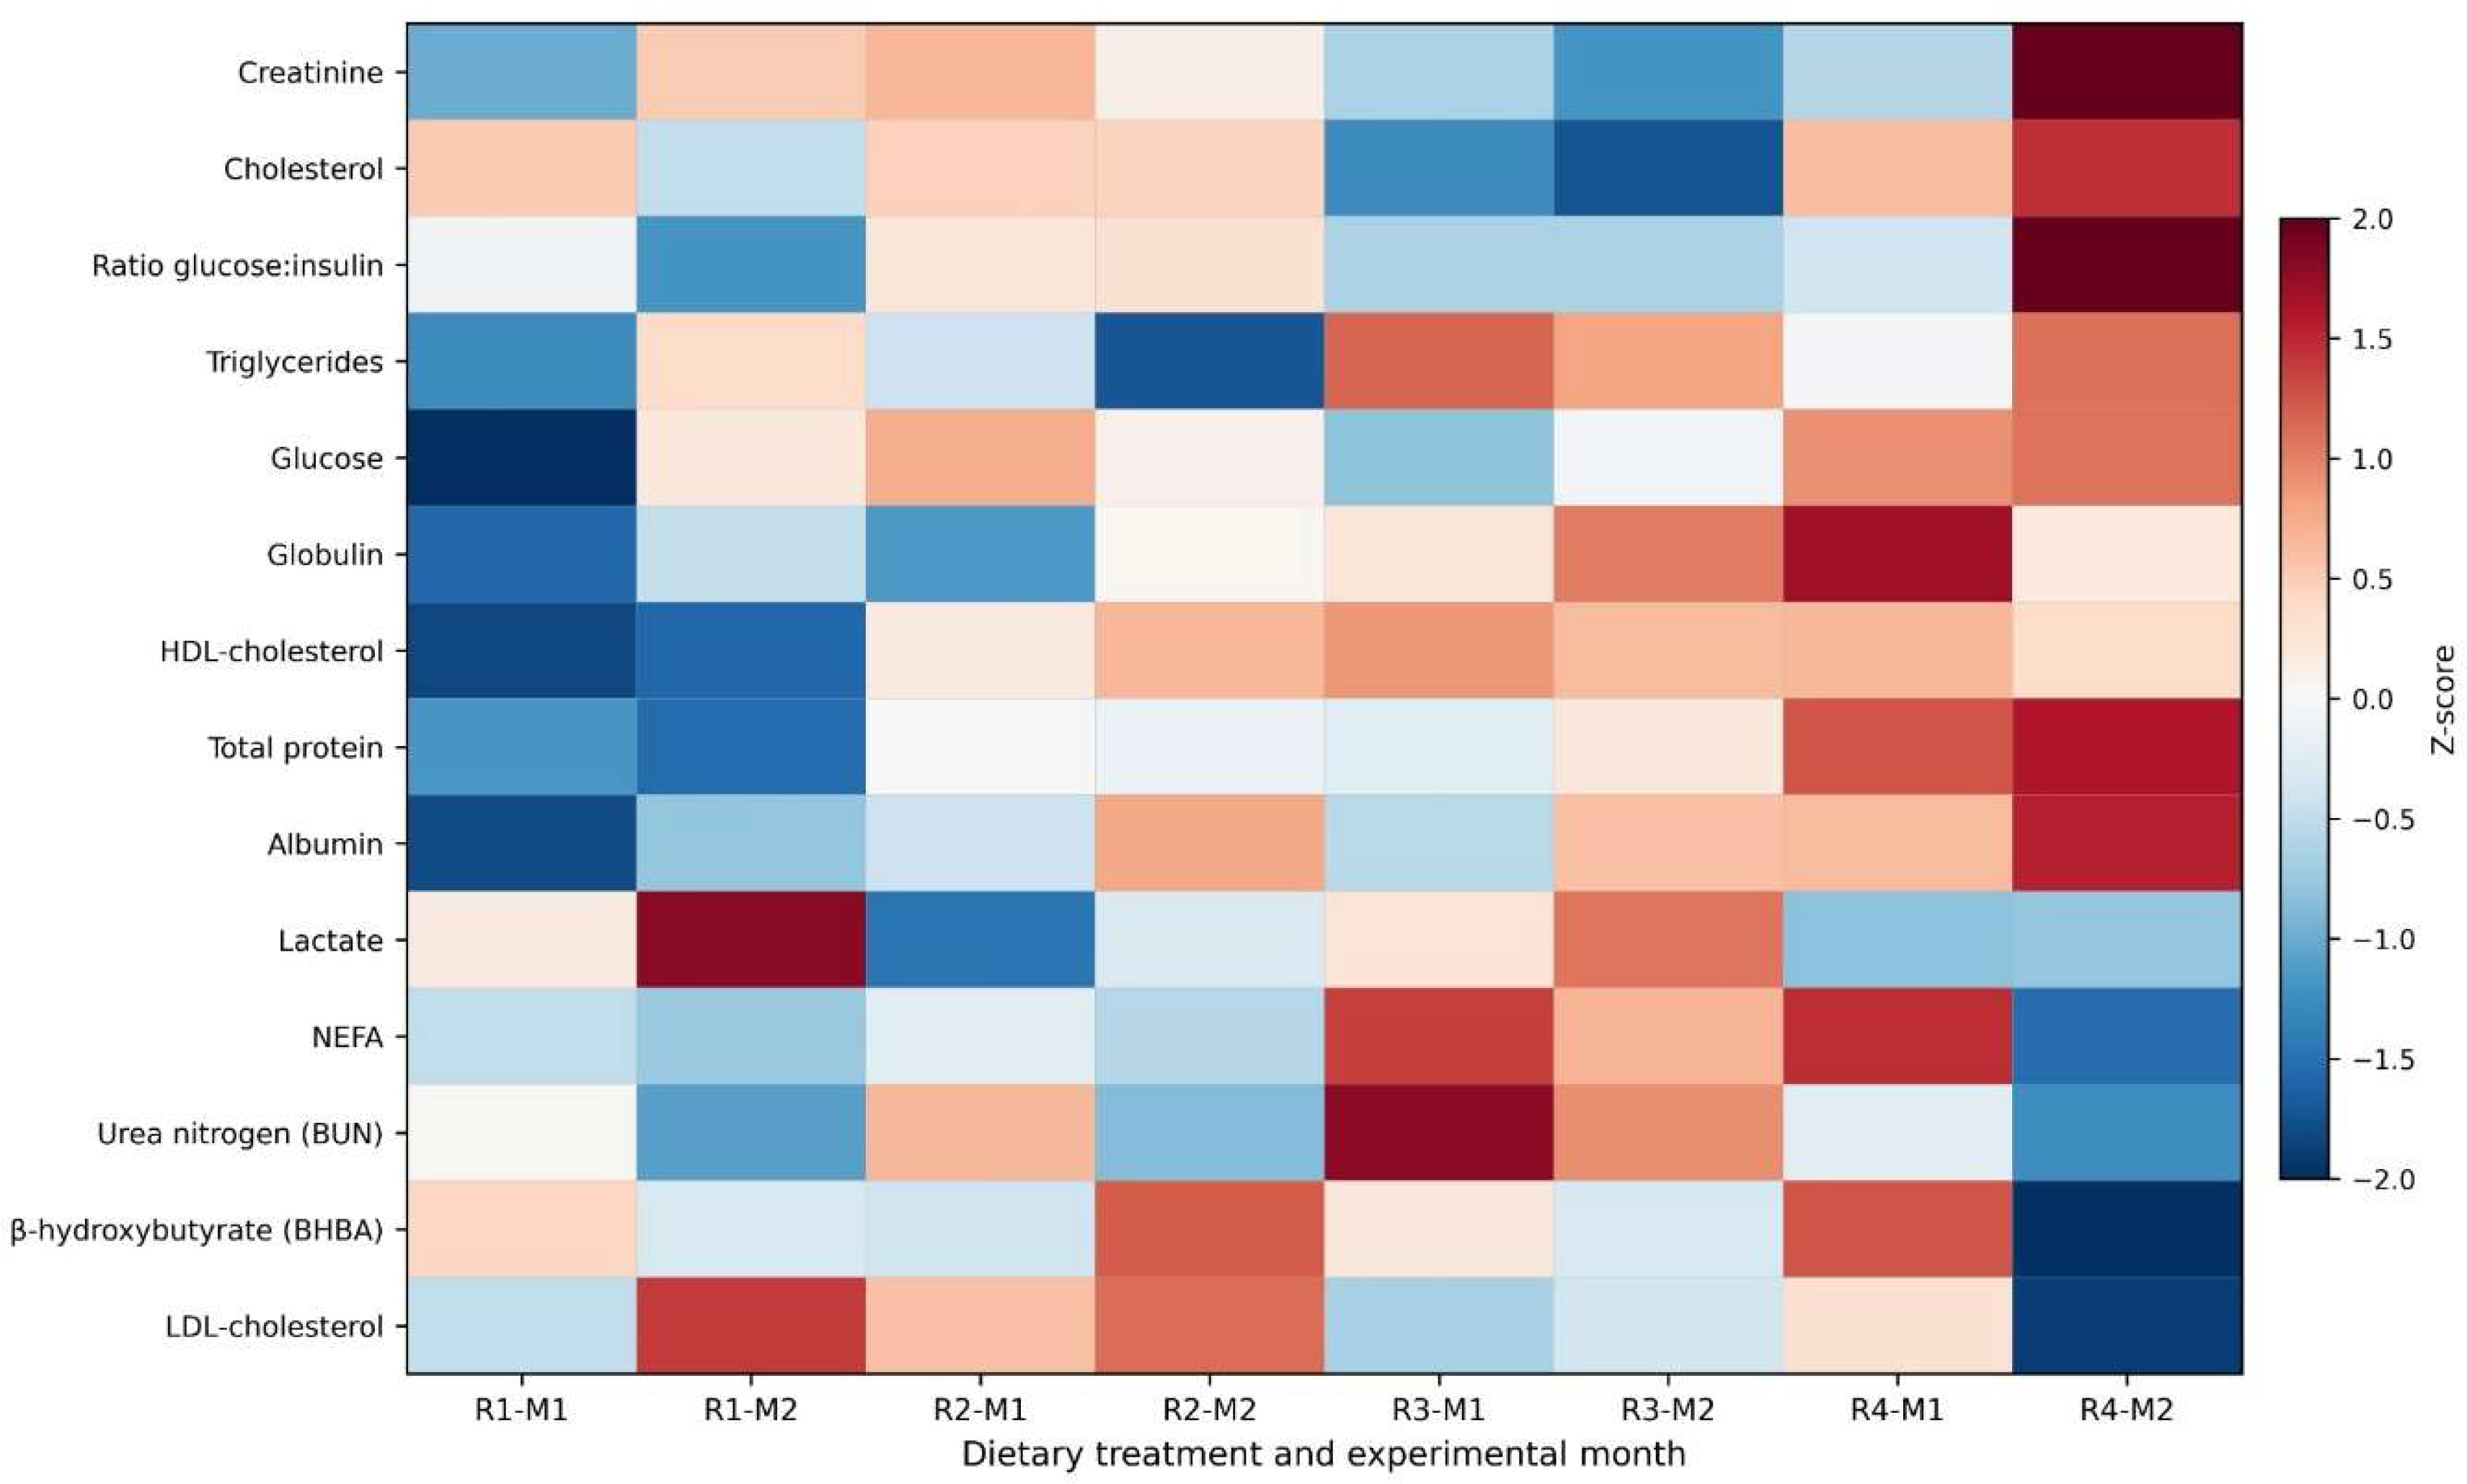
Figure 3.
Heatmap of Z-score of Reproductive hormones by ration treatment and observation month.
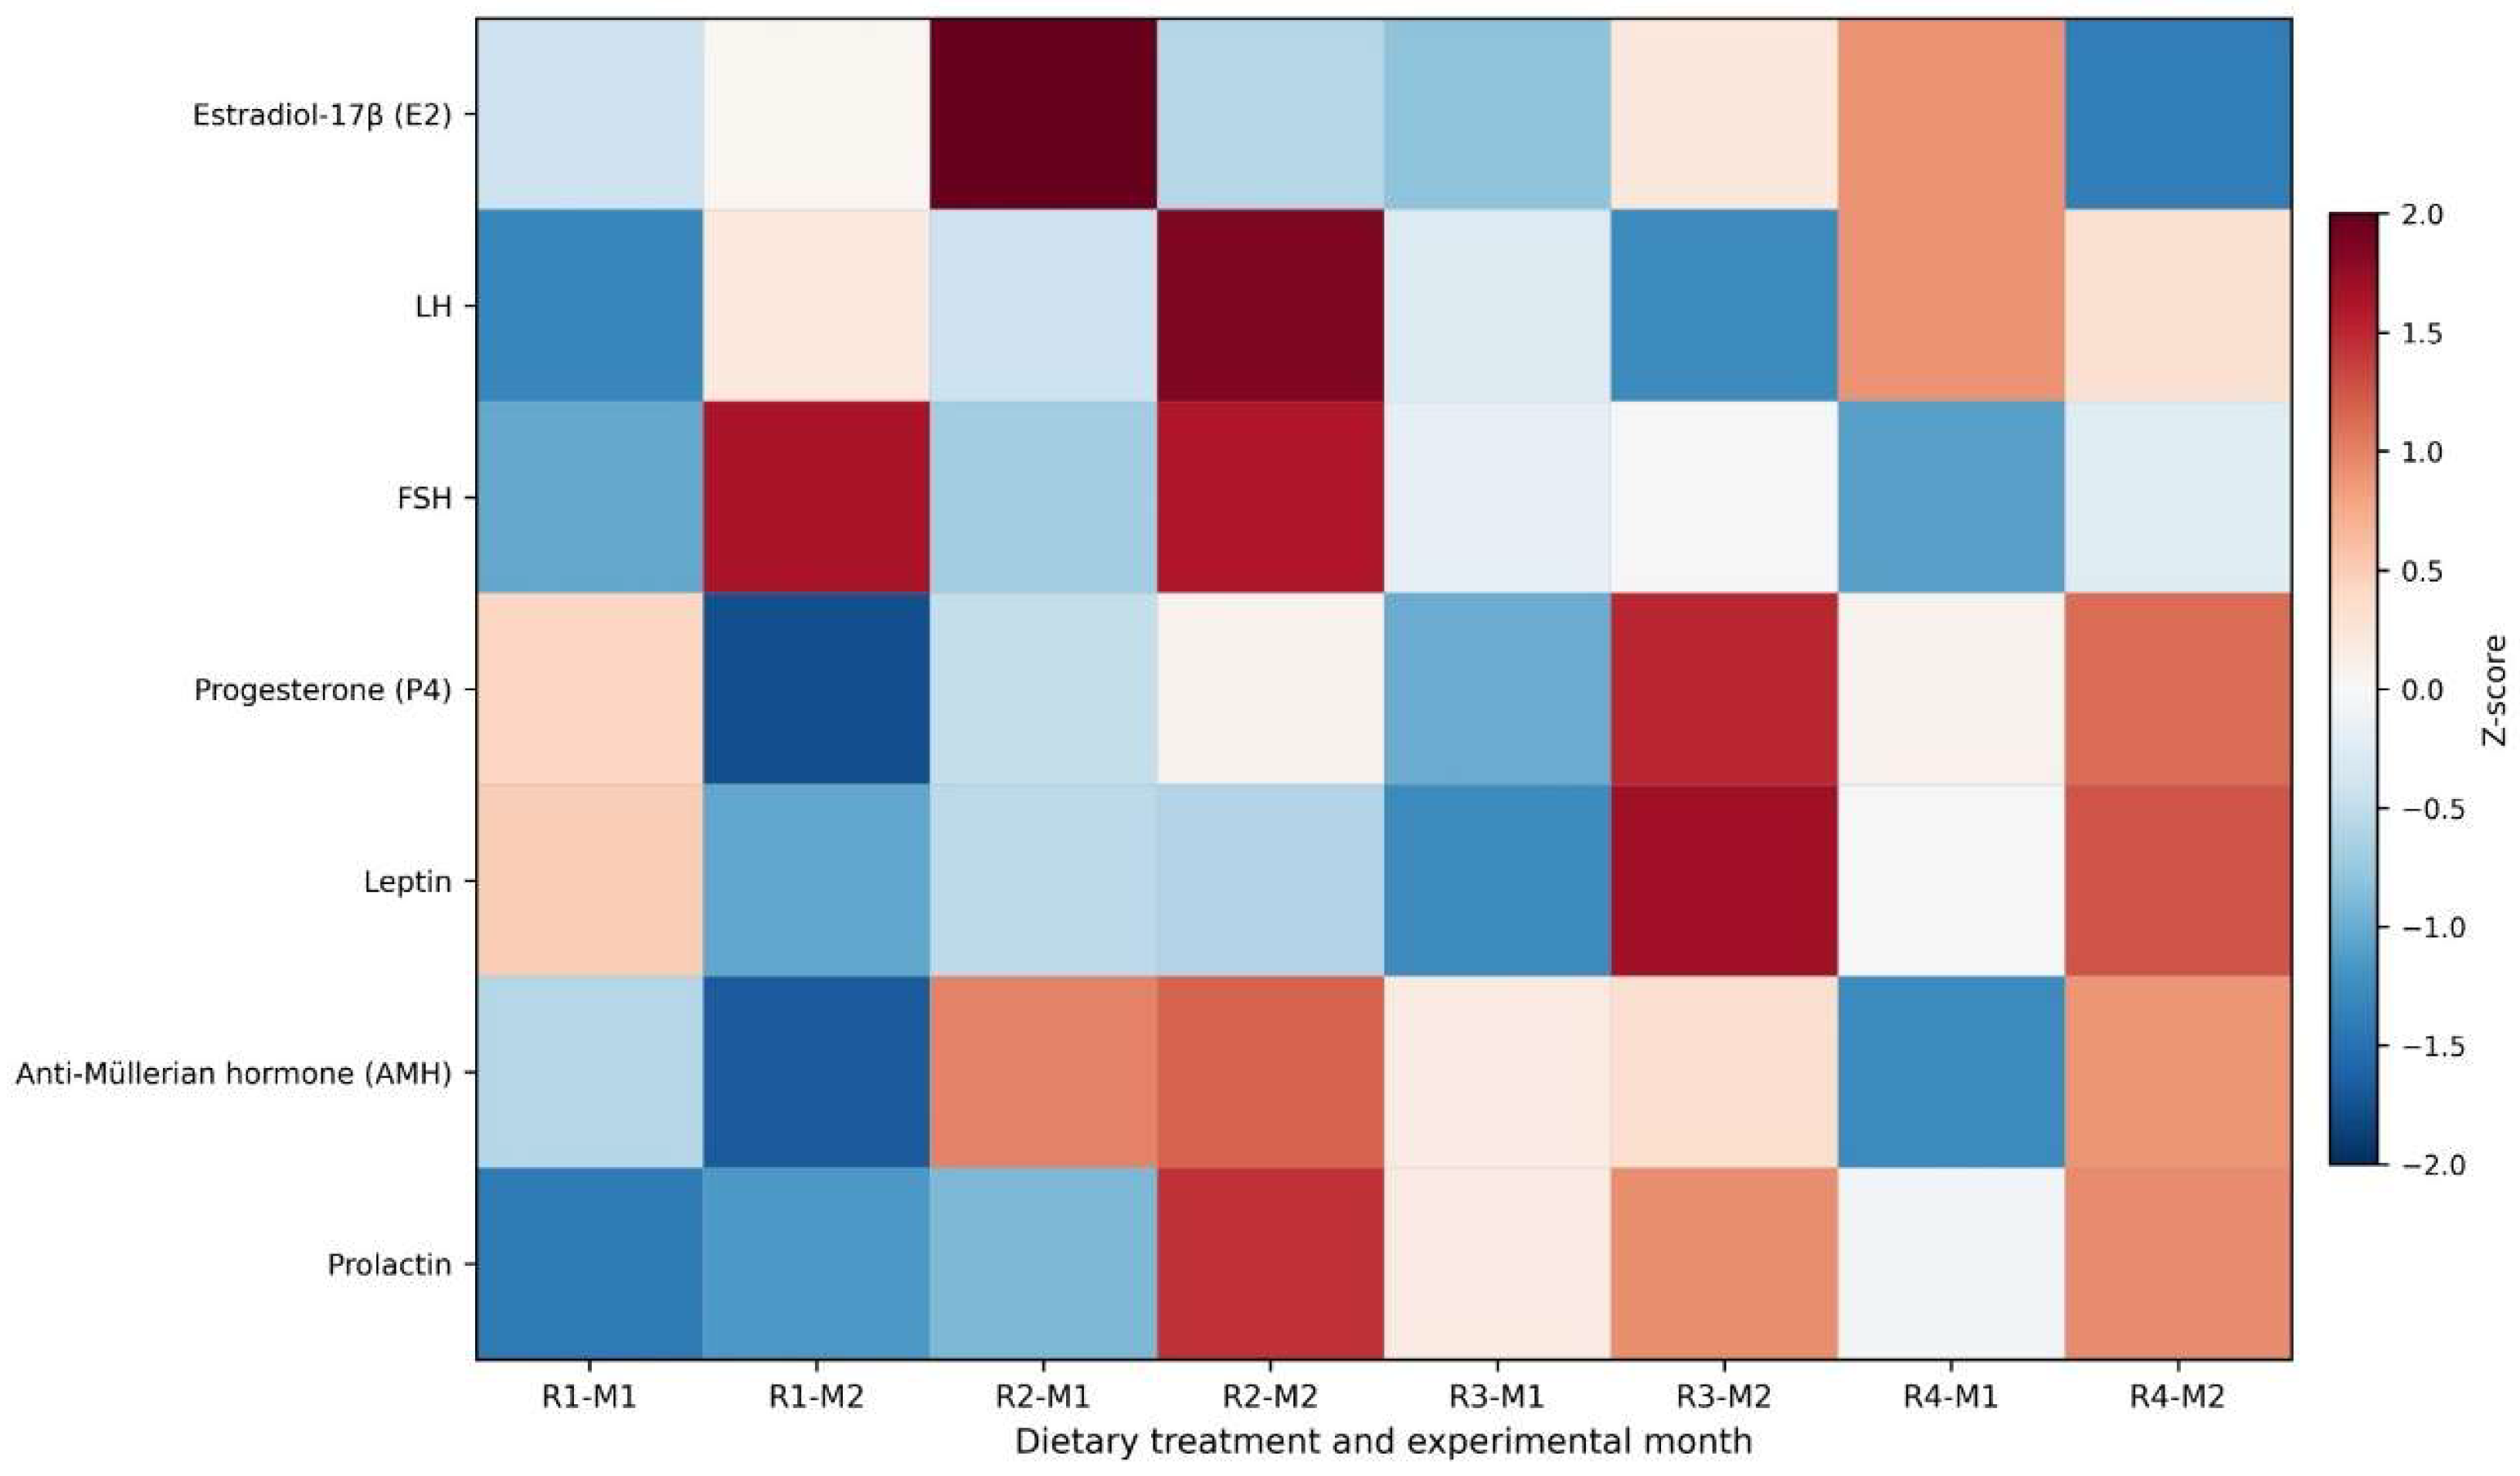
Figure 4.
Heatmap of Z-scores of growth hormone–anabolic and cortisol according to ration treatment and month of observation.
Figure 4.
Heatmap of Z-scores of growth hormone–anabolic and cortisol according to ration treatment and month of observation.
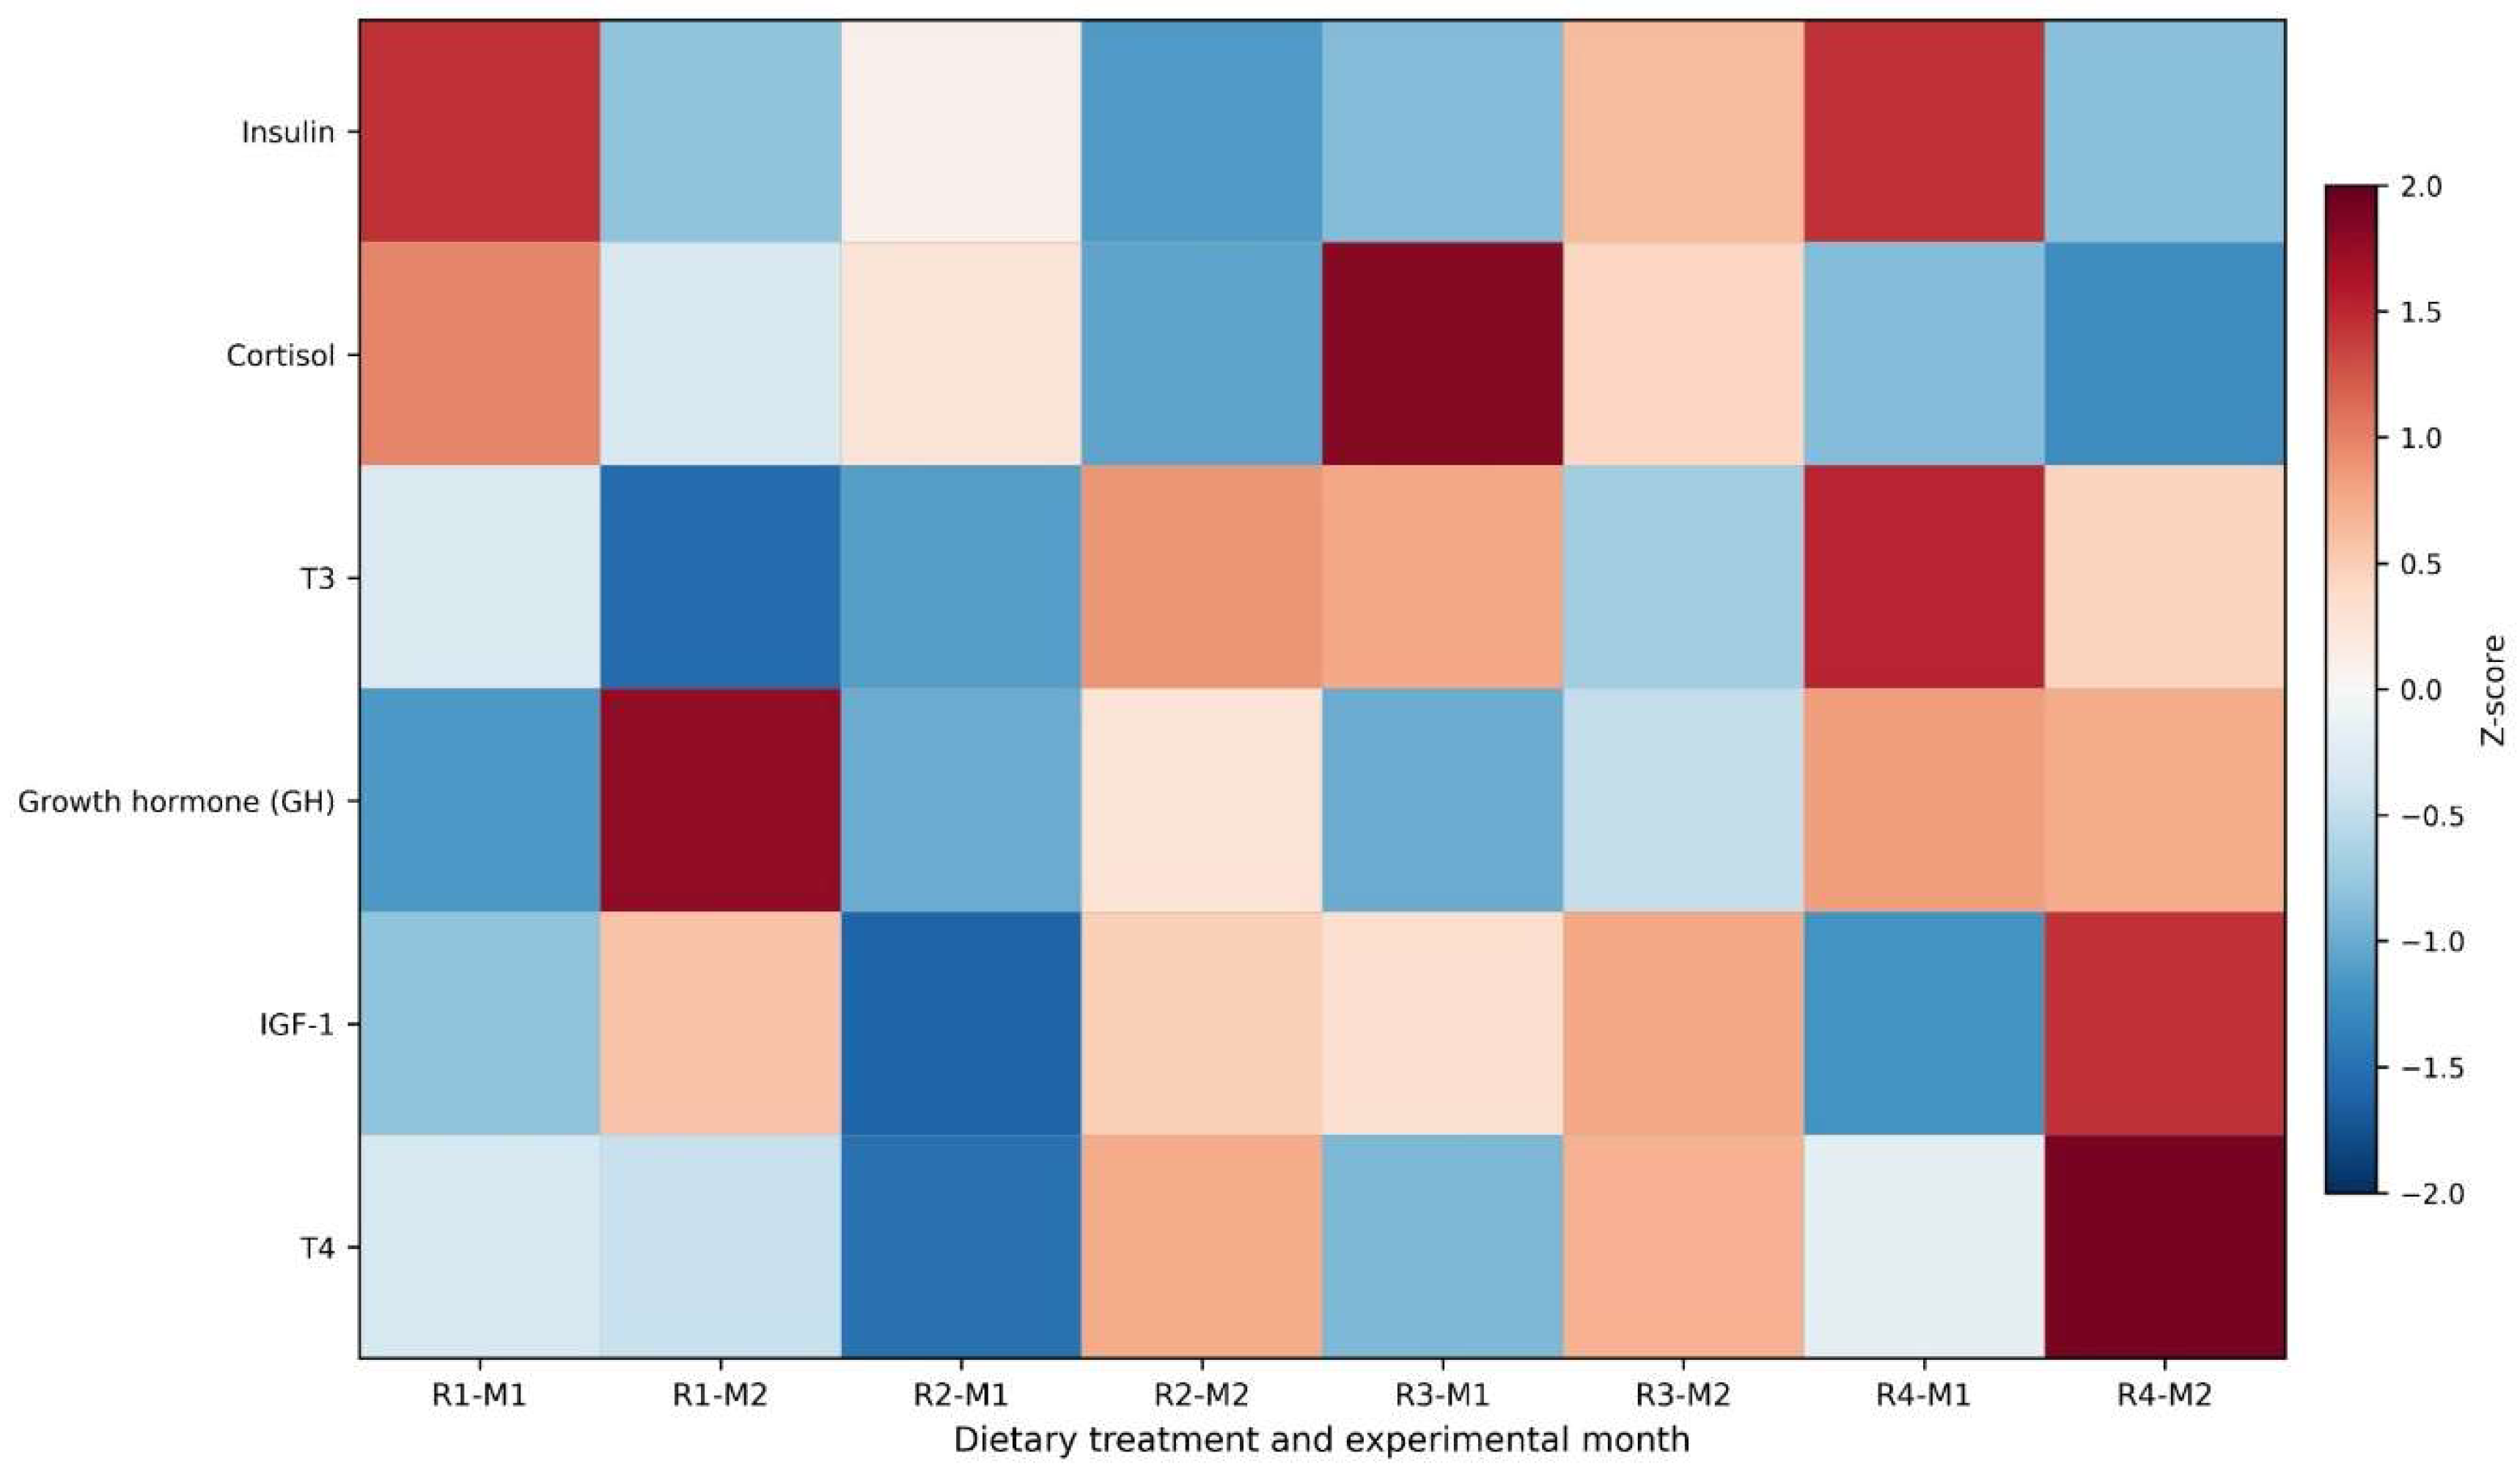
Figure 5.
Longitudinal growth trajectories of tropical dairy heifers receiving four dietary treatments. (A) body weight, (B) body length, (C) chest circumference, and (D) withers height across the observation period. Lines represent treatment-specific trajectories; Longitudinal inference was based on a linear mixed model including treatment, week, and treatment × week, with heifer as a random effect.
Figure 5.
Longitudinal growth trajectories of tropical dairy heifers receiving four dietary treatments. (A) body weight, (B) body length, (C) chest circumference, and (D) withers height across the observation period. Lines represent treatment-specific trajectories; Longitudinal inference was based on a linear mixed model including treatment, week, and treatment × week, with heifer as a random effect.
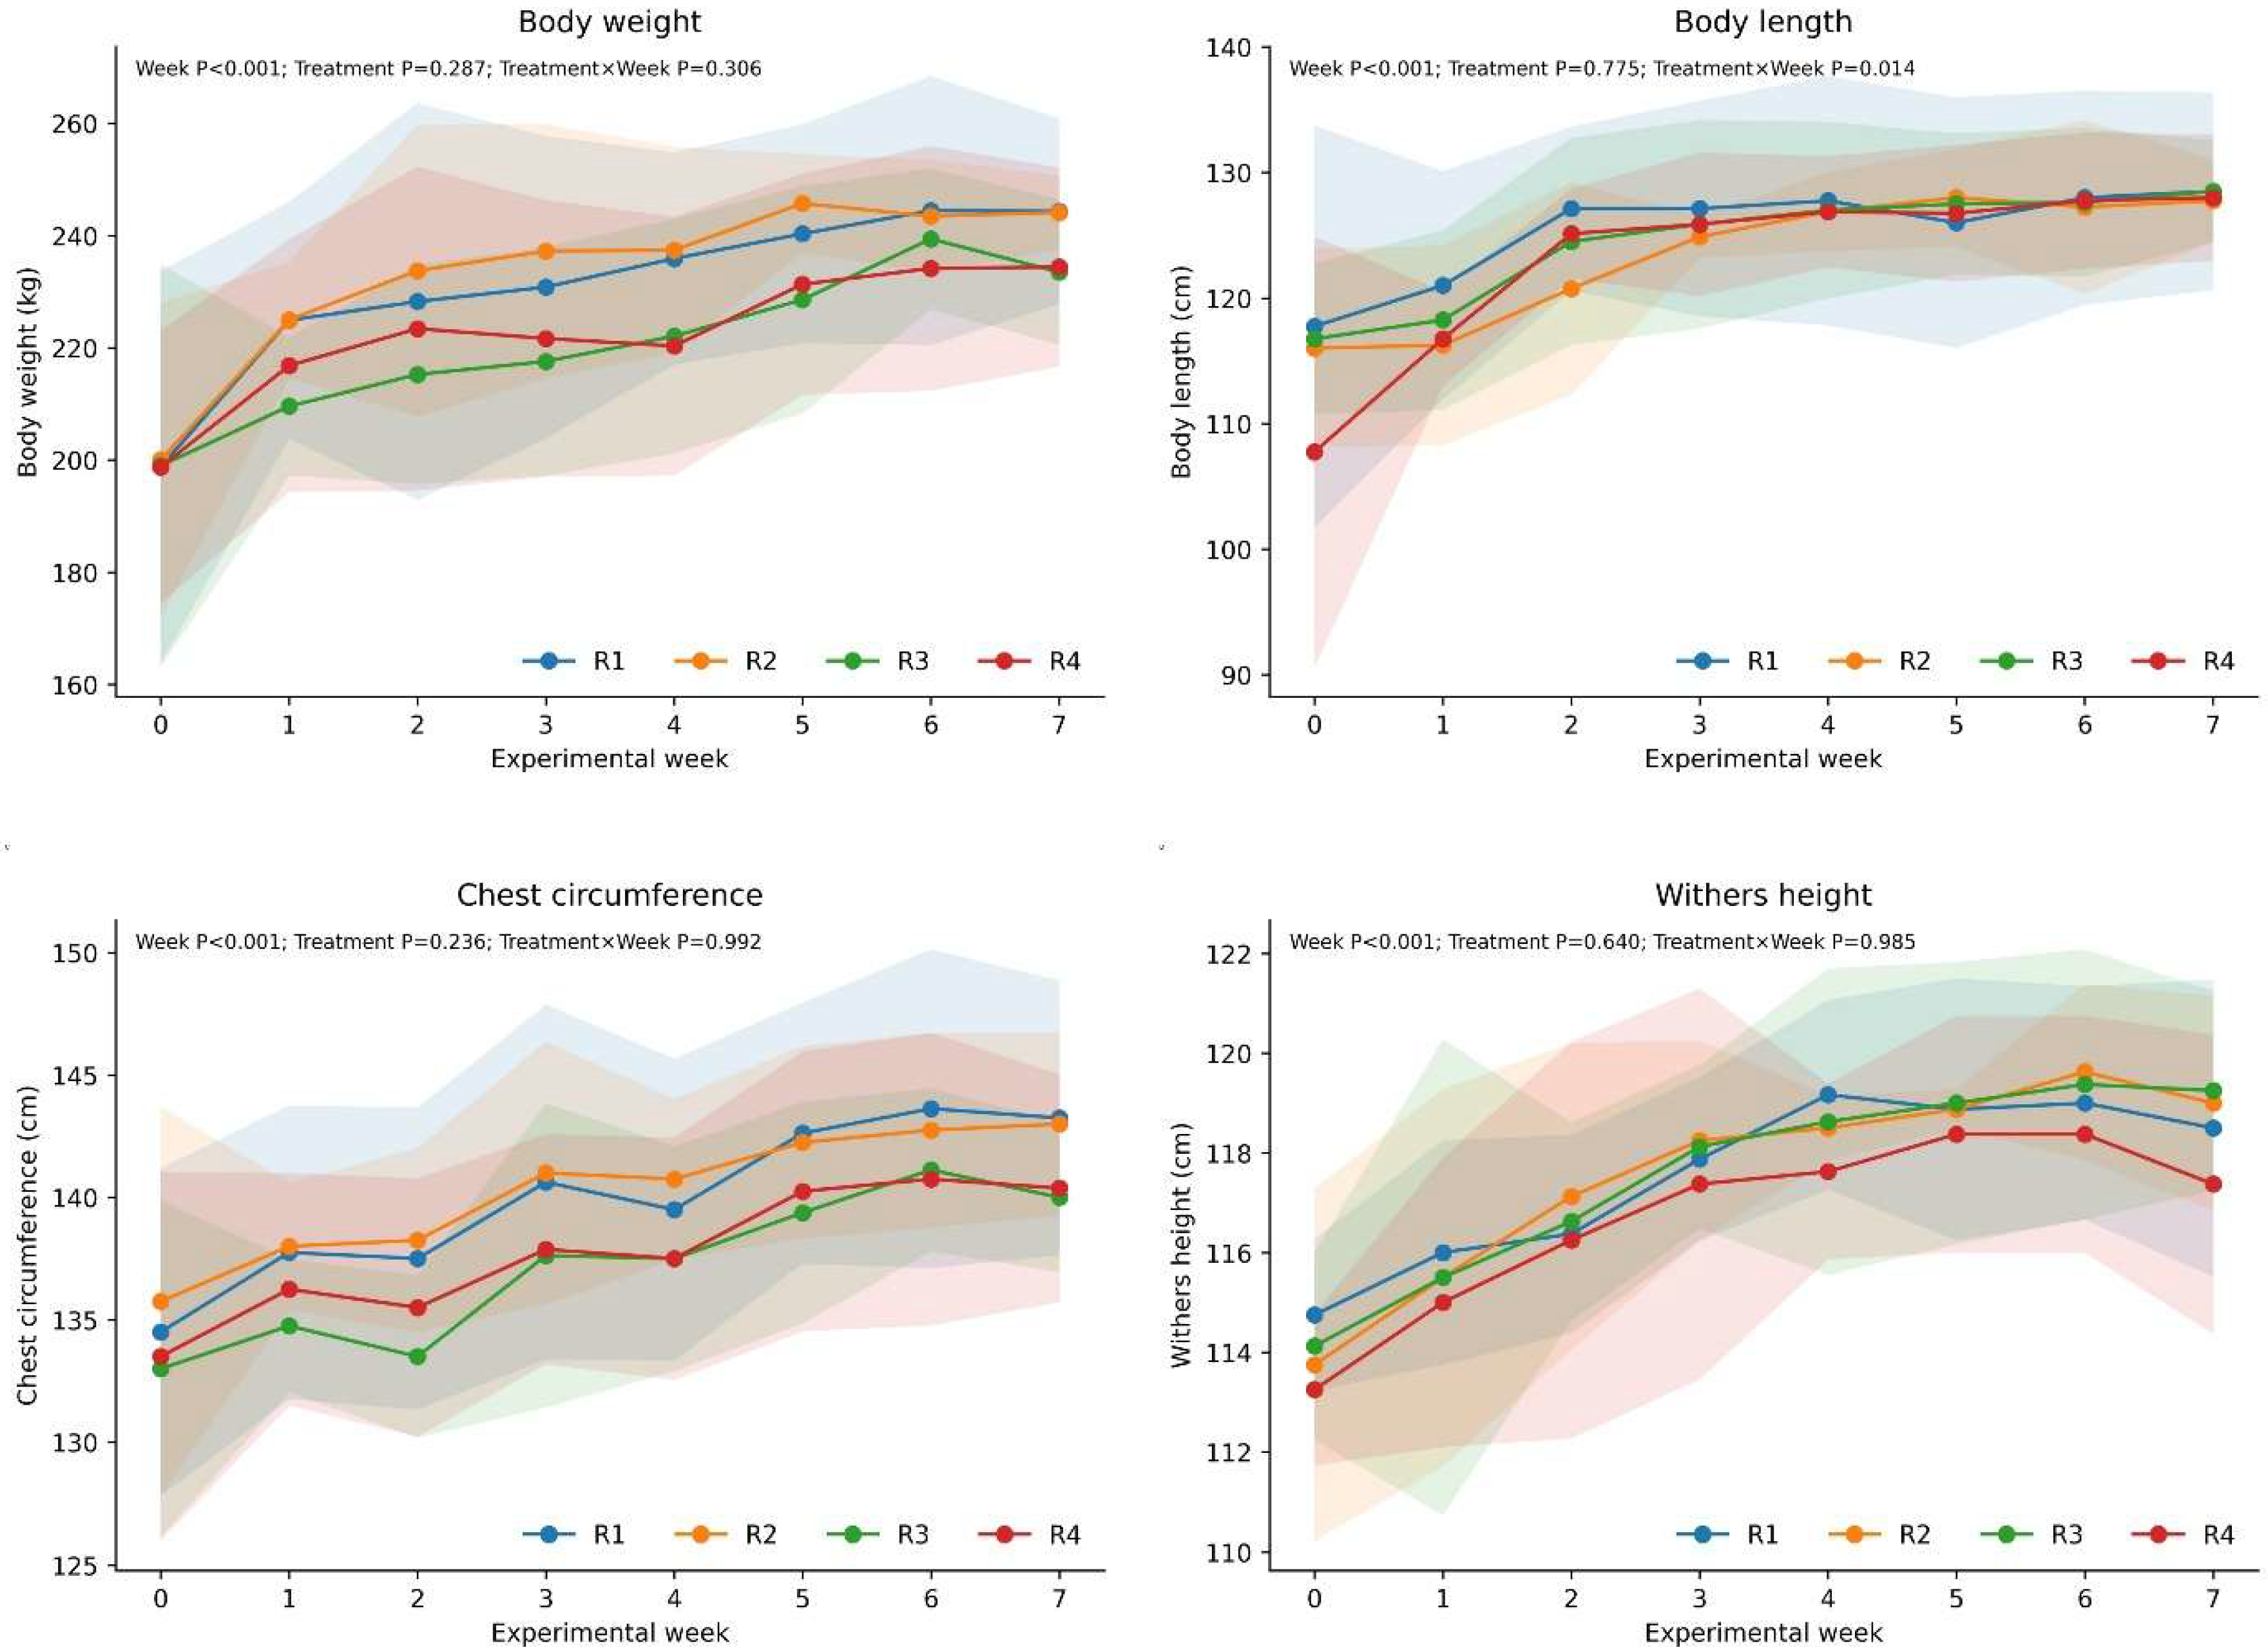
Figure 6.
Associations between average daily gain (ADG) and selected metabolic–anabolic biomarkers in tropical dairy heifers. (A) ADG versus IGF-1, (B) ADG versus NEFA, (C) ADG versus insulin, and (D) ADG versus glucose. Pearson correlation coefficients and P-values are shown in the respective panels.
Figure 6.
Associations between average daily gain (ADG) and selected metabolic–anabolic biomarkers in tropical dairy heifers. (A) ADG versus IGF-1, (B) ADG versus NEFA, (C) ADG versus insulin, and (D) ADG versus glucose. Pearson correlation coefficients and P-values are shown in the respective panels.
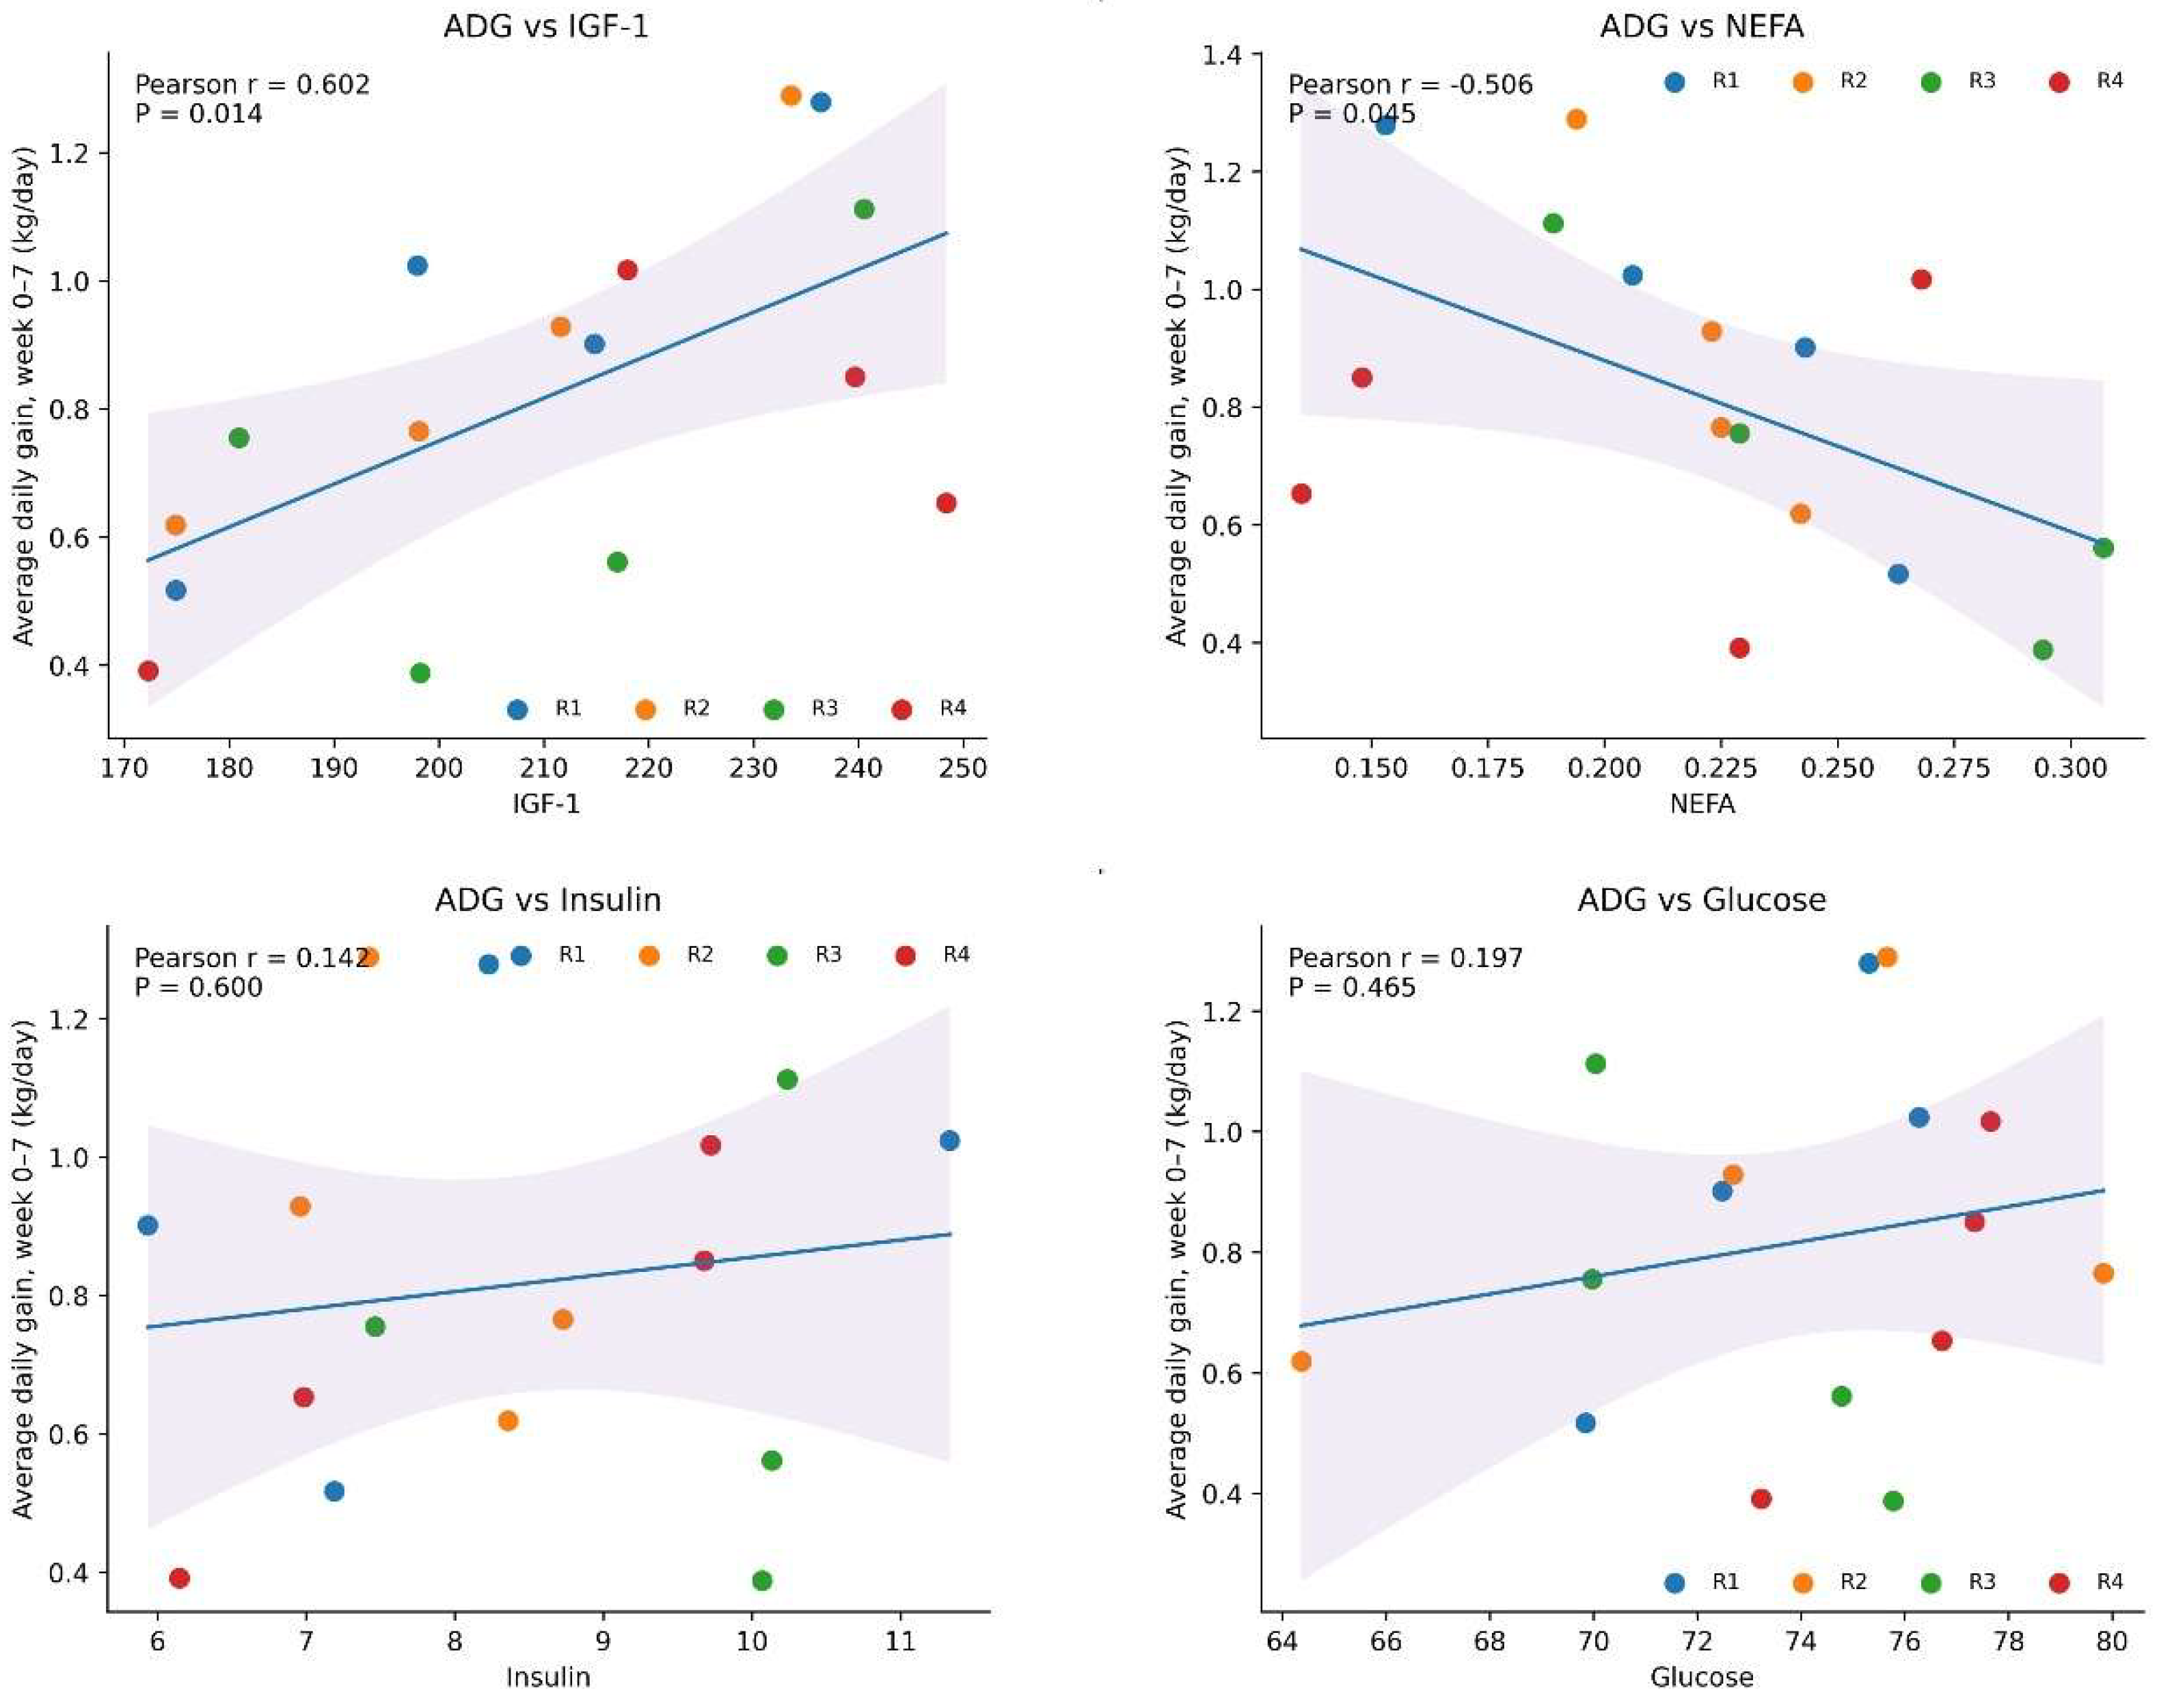
Figure 7.
Exploratory integrated physiological response network linking growth, energy metabolism, and endocrine variables in tropical dairy heifers. Solid edges indicate positive correlations and dashed edges indicate negative correlations. Only associations with |r| ≥ 0.50 and P < 0.05 are displayed. ADG, average daily gain; GH, growth hormone; IGF-1, insulin-like growth factor-1; NEFA, non-esterified fatty acids; LH, luteinizing hormone; E2, estradiol-17β; P4, progesterone.
Figure 7.
Exploratory integrated physiological response network linking growth, energy metabolism, and endocrine variables in tropical dairy heifers. Solid edges indicate positive correlations and dashed edges indicate negative correlations. Only associations with |r| ≥ 0.50 and P < 0.05 are displayed. ADG, average daily gain; GH, growth hormone; IGF-1, insulin-like growth factor-1; NEFA, non-esterified fatty acids; LH, luteinizing hormone; E2, estradiol-17β; P4, progesterone.
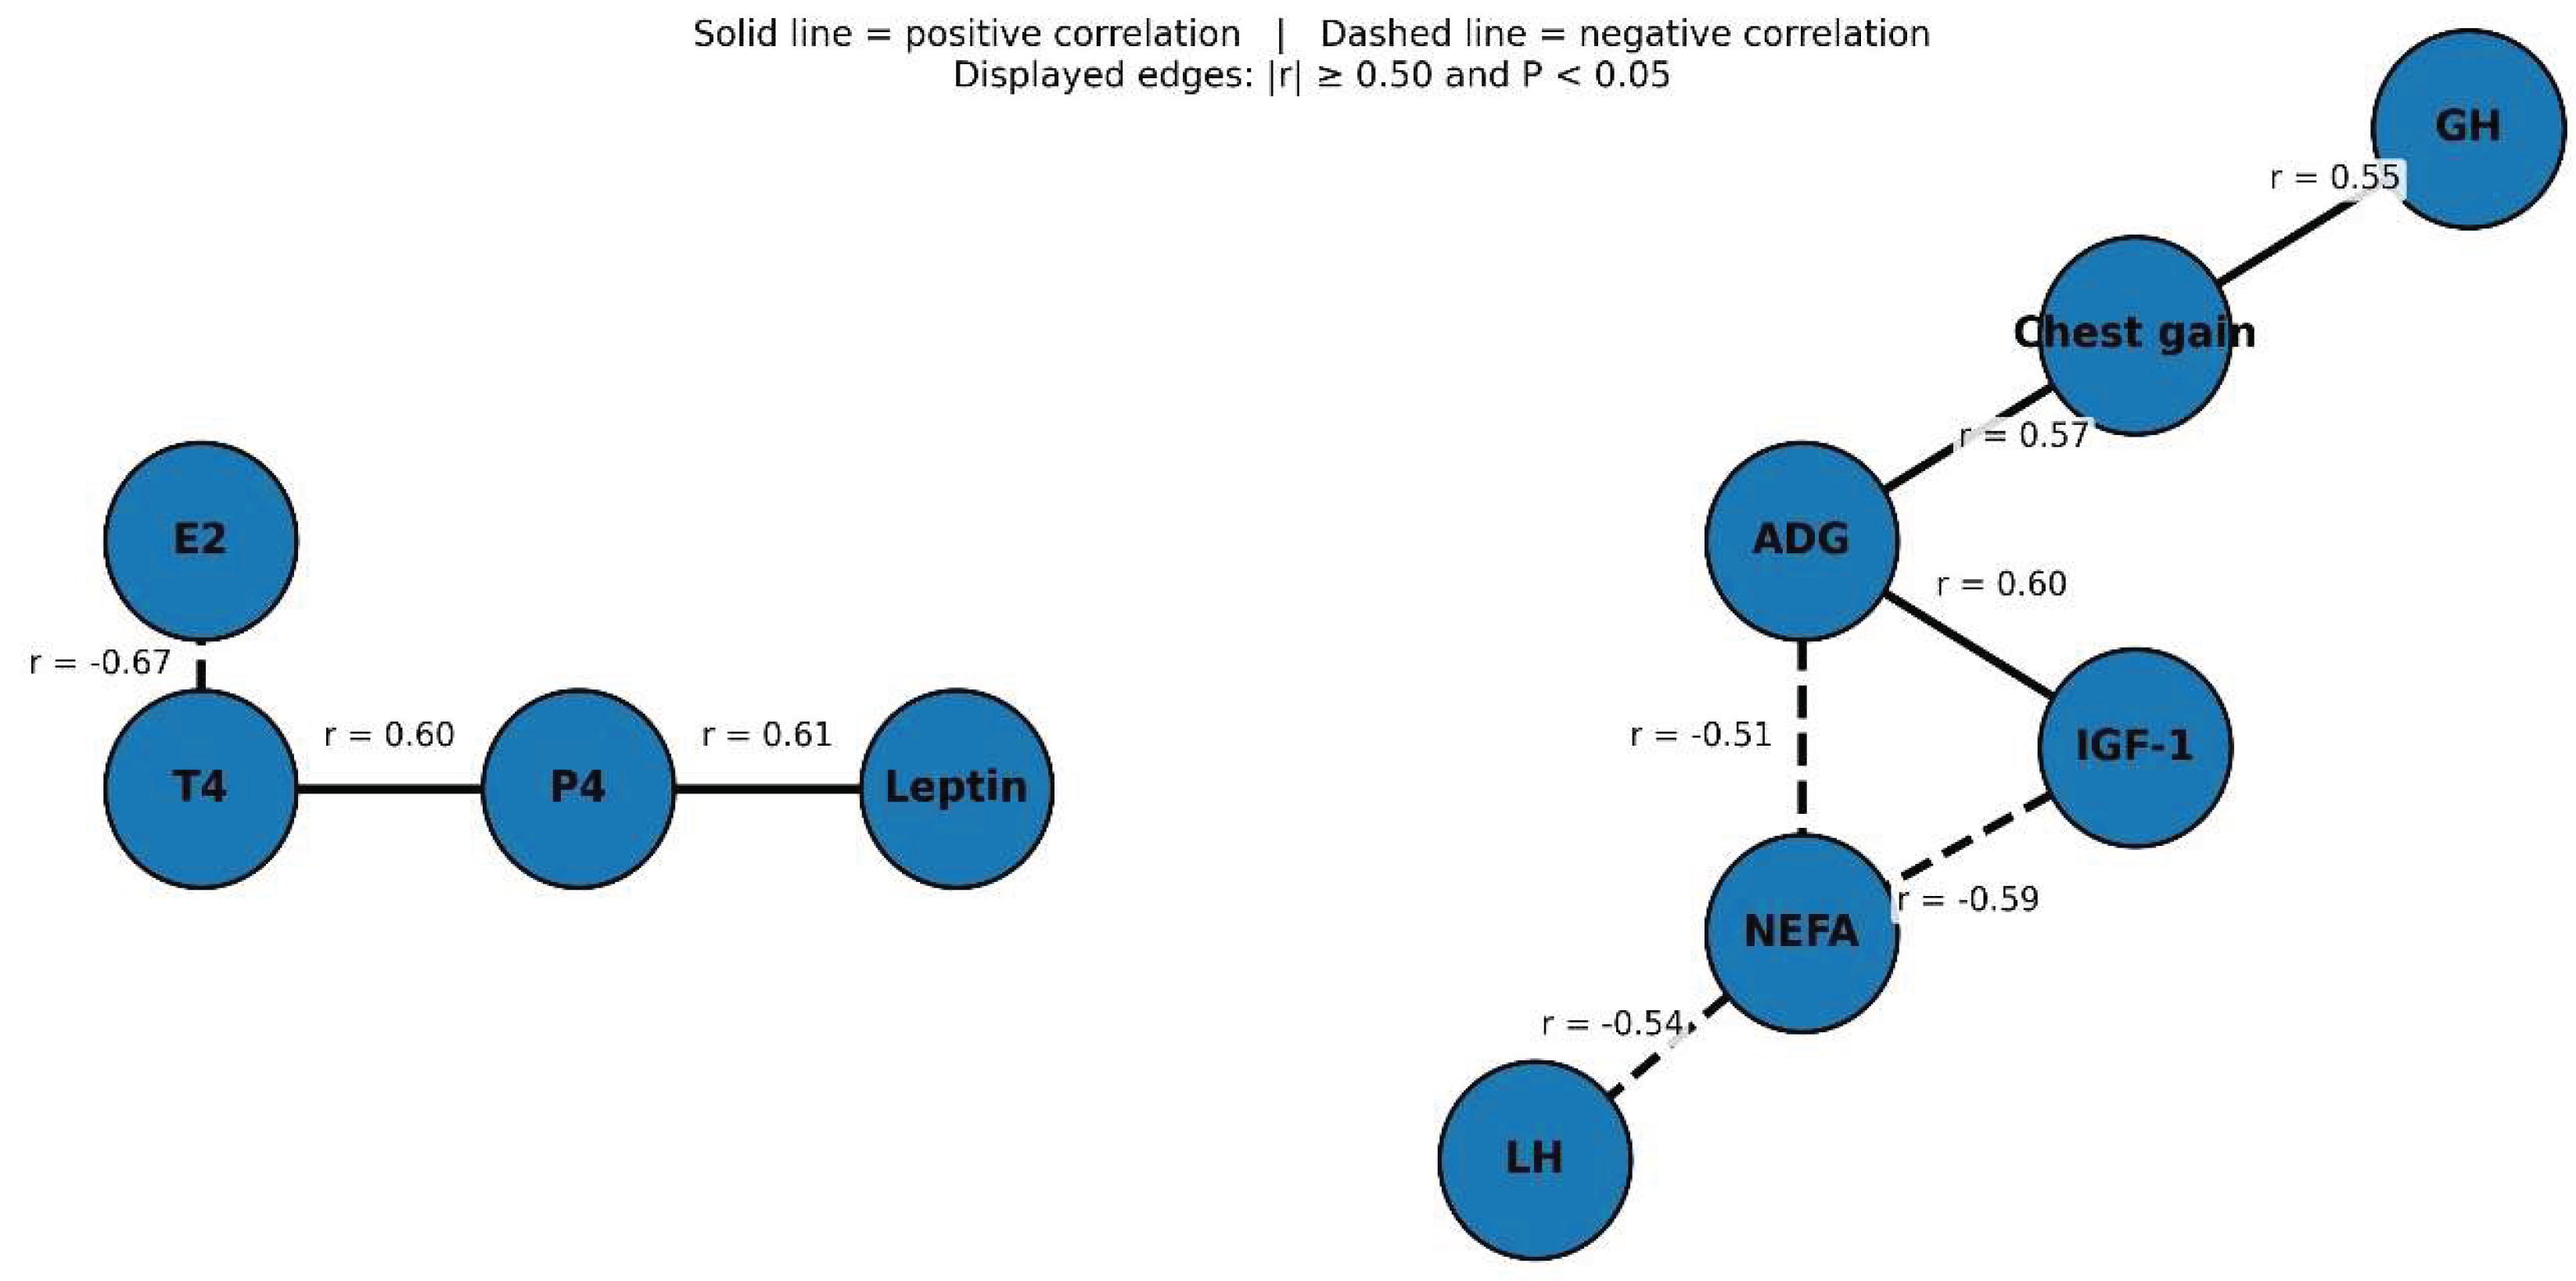

Table 1.
Haematological profile of dairy heifers.
| Parameter | Unit | R1 | R2 | R3 | R4 | P |
|---|---|---|---|---|---|---|
| Erythrocytes | 10 6/µL | 7.29±0.06b | 7.72±0.11a | 7.52±0.26b | 8.01±0.27a | 0.001 |
| Hemoglobin | g/dL | 11.14±0.38b | 11.77±0.29 | 11.45±0.29b | 12.33±0.43a | 0.003 |
| Hematocrit | % | 33.49±0.21a | 35.47±1.58a | 34.25±1.65a | 35.64±0.78a | 0.081 |
| MCV | fL | 46.83±0.75b | 49.74±2.11a | 48.63±1.38b | 52.04±1.77a | 0.004 |
| MCH | pg | 15.38±0.73b | 16.32±0.62a | 16.03±0.40a | 17.06±0.70a | 0.018 |
| MCHC | g/dL | 34.11±0.91b | 35.88±0.99a | 35.09±0.76a | 36.18±0.44a | 0.014 |
| RDW-CV | % | 18.67±0.81b | 20.58±1.26a | 20.04±1.16a | 21.05±0.88a | 0.037 |
| Leukocytes (WBC) | 10^3/µL | 9.36±1.03a | 9.62±1.03a | 9.67±1.06a | 9.87±0.30a | 0.886 |
| Neutrophils | % WBC | 37.53±2.29a | 37.89±2.71a | 41.63±1.11a | 42.99±4.71a | 0.059 |
| Lymphocytes | % WBC | 53.02±1.53a | 55.45± 5.90a | 57.98±5.64a | 61.70±2.76a | 0.081 |
| Monocytes | % WBC | 5.00±0.27a | 5.31±0.57a | 5.37±0.32a | 5.68±0.25a | 0.142 |
| Eosinophils | % WBC | 1.66±0.05a | 1.40±0.14b | 1.60±0.33a | 1.88±0.17a | 0.038 |
| Basophils | % WBC | 0.57±0.11a | 0.57±0.20a | 0.53±0.09a | 0.51±0.07a | 0.877 |
| RaNeutrophils: lymphocytes | ratio | 0.71±0.06a | 0.69 ± 0.07a | 0.73±0.08a | 0.70±0.10a | 0.934 |
| Platelets (PLT) | 10 3/µL | 415.83±37.13a | 430.81±28.01a | 421.83±17.23a | 471.24±23.10a | 0.056 |
| MPV | fL | 8.18±0.22a | 8.74±0.53a | 8.44±0.77a | 8.71±0.78a | 0.558 |
Values are the mean ± SD of the two-month average per heifer (n = 4 heifers/treatment). Different letters in the same row indicate differences in Tukey HSD (P < 0.05).
Table 2.
Energy and protein metabolism profile of dairy heifers.
| Parameter | Unit | R1 | R2 | R3 | R4 | P |
|---|---|---|---|---|---|---|
| Glucose | mg/dL | 69.75±1.87a | 74.13±3.82a | 71.47±3.06a | 75.97±3.63a | 0.072 |
| NEFA | mmol/L | 0.22 ± 0.04a | 0.23 ± 0.03a | 0.26 ± 0.03a | 0.24±0.05a | 0.437 |
| β-hydroxybutyrate (BHBA) | mmol/L | 0.59±0.04a | 0.61 ± 0.06a | 0.58±0.09a | 0.55±0.02a | 0.643 |
| Triglycerides | mg/dL | 18.72 ± 4.66a | 17.58±1.01a | 21.31±1.89a | 20.52±2.00a | 0.260 |
| Cholesterol | mg/dL | 117.60±4.98a | 120.41±7.17a | 107.85±13.38a | 124.18±7.59a | 0.110 |
| HDL cholesterol | mg/dL | 62.62±6.29b | 71.98±4.42a | 73.47 ± 4.11a | 72.41±3.56a | 0.023 |
| LDL-cholesterol | mg/dL | 35.92±2.52a | 37.19±4.49a | 32.88±4.08a | 31.98±5.01a | 0.284 |
| Total protein | g/dL | 6.71±0.10c | 7.07±0.30b | 7.08±0.14b | 7.49±0.07a | <0.001 |
| Albumin | g/dL | 3.29±0.10b | 3.53±0.19a | 3.51±0.11a | 3.68±0.06a | 0.007 |
| Globulin | g/dL | 3.52±0.06a | 3.59±0.19a | 3.76 ± 0.23a | 3.81 ± 0.27a | 0.194 |
| Urea nitrogen (BUN) | mg/dL | 13.23±2.01a | 13.47±1.64a | 14.31±0.52a | 13.12±0.85a | 0.632 |
| Creatinine | mg/dL | 1.10±0.15a | 1.14±0.03a | 1.05±0.04a | 1.17±0.06a | 0.254 |
| Lactate | mmol/L | 1.27±0.04a | 1.05±0.22a | 1.23±0.14a | 1.06±0.12a | 0.109 |
| Glucose:insulin ratio | ratio | 8.44±0.38a | 9.09±1.25a | 8.43±0.57a | 9.62±1.83a | 0.433 |
Values are the mean ± SD of the two-month average per heifer (n = 4 heifers/treatment). Different letters in the same row indicate differences in Tukey HSD (P < 0.05).
Table 3.
Reproductive hormone profile of dairy heifers.
| Parameter | Unit | R1 | R2 | R3 | R4 | P |
|---|---|---|---|---|---|---|
| Estradiol-17β (E2) | pg/mL | 7.02±0.64a | 7.79±1.58a | 6.92±1.27a | 6.97±0.48a | 0.651 |
| Progesterone (P4) | ng/mL | 0.57±0.14a | 0.64±0.10a | 0.70±0.25a | 0.75±0.22a | 0.584 |
| LH | ng/mL | 1.52±0.31a | 1.63±0.17a | 1.50±0.21a | 1.62±0.21a | 0.820 |
| FSH | ng/mL | 0.97±0.12a | 0.99±0.13a | 0.92±0.08a | 0.85±0.18a | 0.528 |
| Anti-Müllerian hormone (AMH) | ng/mL | 0.82±0.05a | 0.96±0.16a | 0.91±0.16a | 0.88±0.05a | 0.493 |
| Prolactin | ng/mL | 5.36±0.29a | 5.93±0.46a | 6.04±0.77a | 6.00±1.08a | 0.520 |
| Leptin | ng/mL | 2.63±0.37a | 2.58±0.30a | 2.73±0.29a | 2.80±0.38a | 0.793 |
Values are the mean ± SD of the two-month average per heifer (n = 4 heifers/treatment). Different letters in the same row indicate differences in Tukey HSD (P < 0.05).
Table 4.
Growth hormone–anabolic and cortisol profiles.
| Parameter | Unit | R1 | R2 | R3 | R4 | P |
|---|---|---|---|---|---|---|
| Growth hormone (GH) | ng/mL | 2.20±0.81a | 2.09±0.27a | 2.04±0.21a | 2.27±0.25a | 0.896 |
| IGF-1 | ng/mL | 195.29±18.84a | 188.48±5.16a | 205.63±11.29a | 199.09±15.39a | 0.386 |
| Insulin | µIU/mL | 9.20±1.18a | 8.43±0.73a | 8.79±0.70a | 9.18±1.99a | 0.803 |
| T3 | ng/mL | 1.36±0.09a | 1.42±0.05a | 1.43±0.08a | 1.49±0.03a | 0.107 |
| T4 | µg/mL | 73.42±6.04a | 73.50±7.49a | 74.93±5.96a | 80.19±8.50a | 0.509 |
| Cortisol | ng/mL | 16.15±0.65a | 15.37±0.80a | 16.99±2.98a | 14.67±2.88a | 0.480 |
Values are the mean ± SD of the two-month average per heifer (n = 4 heifers/treatment). Different letters in the same row indicate differences in Tukey HSD (P < 0.05).
Disclaimer/Publisher’s Note: The statements, opinions and data contained in all publications are solely those of the individual author(s) and contributor(s) and not of MDPI and/or the editor(s). MDPI and/or the editor(s) disclaim responsibility for any injury to people or property resulting from any ideas, methods, instructions or products referred to in the content. |
© 2026 by the authors. Licensee MDPI, Basel, Switzerland. This article is an open access article distributed under the terms and conditions of the Creative Commons Attribution (CC BY) license (http://creativecommons.org/licenses/by/4.0/).
Copyright: This open access article is published under a Creative Commons CC BY 4.0 license, which permit the free download, distribution, and reuse, provided that the author and preprint are cited in any reuse.