
Submitted:
03 September 2026
Posted:
04 September 2026
You are already at the latest version
Preprints on COVID-19 and SARS-CoV-2
Abstract
Background: Structured RNA elements in viral genomes are underexplored therapeutic targets, yet coding regions have not been systematically screened for conserved, structurally defined motifs.
Methods: We screened the SARS‑CoV‑2 spike coding sequence across eight major variants using a staged pipeline combining thermodynamic scanning, secondary‑structure cross‑validation between physics‑based and deep‑learning predictors, tertiary prediction across seven tools with decoy‑controlled analogy searches, comparison with genome‑wide chemical‑probing data from three laboratories, and molecular dynamics simulation.
Results: The screen identified three conserved, window‑robust loci at functionally important spike regions: near the N343 glycosylation site (Region A), the E484 receptor‑binding motif (Region B), and the S2′ cleavage site (Region C). Only Region A satisfied all thermodynamic and structural criteria, with a dinucleotide‑shuffle z‑score of −3.39 (p = 0.020), near‑identical secondary structure between RNAfold and MXfold2 (F1 = 0.99), and a best‑supported tertiary fold from convergence of Boltz‑2 and AlphaFold3 (TM‑score_RNA = 0.53). In‑cell chemical‑probing supported Region A (F1 = 0.83–0.85; AUROC = 0.663–0.892), while Regions B and C failed. Probing data refined the predicted fold to a two‑helix architecture with a flexible middle segment, and molecular dynamics of the 101‑nt window revealed two individually stable domains (3′ stem‑loop RMSD = 2.58 ± 0.53 Å; 5′ helix RMSD = 4.65 ± 1.30 Å) joined by a mobile hinge.
Conclusions: Region A is a conserved, structurally defined RNA element within the spike coding sequence, supported by multiple orthogonal lines of evidence and suitable for further therapeutic development. The staged framework is applicable to coding regions beyond SARS‑CoV‑2.
Keywords:
SARS-CoV-2
; spike gene
; RNA structure
; conserved motif
; RNA therapeutics
; computational screening
; chemical probing
; molecular dynamics
1. Introduction
Small-molecule antiviral development has long focused on viral proteins, including polymerases, proteases and entry glycoproteins. Structured RNA elements in viral genomes have remained an under-exploited alternative, even though essential steps in viral biology, including translation initiation via internal ribosome entry sites, programmed ribosomal frameshifting, packaging, replication initiation, and cis-acting gene regulation, are executed by RNA structures rather than by proteins [1]. Two developments have made such RNA tractable as a therapeutic target class. First, small molecules have been shown to bind defined RNA folds with high affinity and useful selectivity against structurally similar off-targets, in bacterial riboswitches [2] and, most prominently, at the SMN2 exon-7 splicing regulator by risdiplam [3]. Second, both physics-based and deep-learning RNA structure-prediction tools can now identify structured candidates directly from genomic sequence at genome scale [4,5,6,7]. Together, these define an opportunity to search viral genomes systematically for structured RNA elements that could serve as drug targets, complementing rather than duplicating the mature discipline of viral protein targeting [8]. A nucleotide-level target has a different escape profile from a protein-level one. Antibody and small-molecule pressure on the spike glycoprotein selects for amino-acid substitution, and the receptor-binding domain has accumulated substitutions that have repeatedly compromised therapeutic monoclonal antibodies [9,10]. A base-paired RNA element is constrained by its pairing requirements, and when it lies inside a coding sequence, it is also constrained at the amino-acid level. Whether any such doubly constrained element exists in spike is the empirical question this study addresses.
The SARS-CoV-2 genome is a large positive-sense RNA of approximately 30 kb [11]. Several functional RNA structures are well characterized: the 5’-UTR stem-loops SL1-SL4, required for replication and translational regulation [12]; the pseudoknotted −1 ribosomal frameshift element (FSE) at the ORF1a/1b junction, essential for polyprotein expression and already a drug-development target [13]; and a 3’-UTR bulged stem-loop and pseudoknot required for replication [12]. Genome-wide DMS-MaPseq and SHAPE probing have mapped structural content across the whole genome in infected cells, producing nucleotide-resolution reactivity models broadly consistent with computational predictions [12,14,15].
This characterization is uneven: well-defined elements are mostly non-coding or at regulatory boundaries. Genome-wide surveys have flagged structured segments within coding regions, including spike [12,16,17], but these are windows meeting statistical criteria, not individually characterized elements, and no coding region has been screened as a class against sequence-matched controls from the same procedure. The gap is most acute for spike: intensively studied at the antibody, small-molecule, and vaccine levels, and exploited as a vaccine antigen, its approximately 3.8-kb coding sequence has not been systematically screened for a discrete, conserved, druggable RNA element. Three obstacles account for this. Coding-region conservation mainly reflects amino-acid selection, so RNA-level signal must be disentangled from protein constraint; covariation analysis is underpowered by sarbecoviruses’ low substitution rate across spike; and reactivity alone cannot distinguish a discrete element from generally structured background. Together they make any single line of insufficient evidence, motivating the staged design adopted here.
One prior study bears directly on this gap and has been read as a negative result for spike mRNA. Zhu et al. developed intranasal locked-nucleic-acid ASOs against SARS-CoV-2 and reported a lead compound, targeting the 5’ leader with strong potency in humanized mouse lungs by disrupting a conserved stem-loop [18]. Their ASOs were generated by tiling short windows positionally, not structurally; DMS-MaPseq entered only afterward to rationalize the successful compound’s mechanism and never guided site selection. Spike-directed ASOs were tested and underperformed, but under positional tiling these tests provide naive coverage of spike, not whether spike contains a discrete targetable structure. The authors stated reservation about spike concerns the protein, which mutates and may escape inactivation, an argument that does not transfer to a nucleotide target with near-identical sequence conservation across variants. The leader has a copy-number and essentiality advantage a single spike locus lacks, but whether the spike coding sequence contains a discrete, conserved, and structurally defined RNA motif suitable for therapeutic targeting therefore remains an open question.
Here we screened the spike coding sequence across eight major SARS-CoV-2 variants for conserved, thermodynamically stable, structurally defined RNA motifs, evaluating the leading candidate against orthogonal, methodologically independent evidence: thermodynamic significance against composition-matched nulls, secondary-structure agreement between physics-based and deep-learning predictors, tertiary convergence across seven prediction tools with decoy-controlled analogy searches, comparison with genome-wide chemical-probing data from multiple laboratories, and molecular dynamics simulation. Candidates were assessed against negative controls identified by the same screen, conserved loci that failed structural tests, so the signal is measured against a sequence-matched, not abstract, null. The screen returned three conserved, window-robust loci at functionally important spike regions: near the N343 glycosylation site, the E484 receptor-binding motif, and the S2’ cleavage site, which resolve into one candidate (Region A) and two internal controls (Regions B and C). Region A, a 101-nt window centered on N343, contains a 70-nt structured core that the tertiary predictors converge on; this core is not supported as a standalone excised construct, so the full 101-nt window is the unit carried through molecular dynamics. Its predicted secondary structure agrees with in-cell probing models from all three laboratories (F1 = 0.83-0.85), with both flanking helices recovered at near-complete base-pair accuracy, while Region B fails to match the same models. Probing data show the middle stem is unsupported in cells, so Region A is better described as two experimentally supported flanking helices separated by a flexible, unpaired middle segment, and at the tertiary level it behaves as a two-domain element on a flexible hinge whose orientation no predictor resolves. The element lies outside the alternative-conformation clusters detected elsewhere in spike, and shows fold-specific similarity to compact viral RNA regulatory elements and riboswitches, without an exact experimental homologue. We propose Region A as a plausible entry point for RNA-targeted therapeutic development, emphasizing that no predicted three-dimensional model is presented as a solved structure and that no analysis here establishes a function for the element. Direct structure determination and structure-guided ligand discovery are the principal next steps, and this staged, target-agnostic framework can be applied to any viral or cellular coding region under comparable design constraints.
2. Methods
2.1. Sequence Datasets, Conservation Scoring and Coordinate Systems
2.1.1. Sequences and Conservation Scoring
Spike coding sequences from eight SARS-CoV-2 lineages were analyzed: Wuhan-Hu-1, Alpha, Beta, Gamma, Delta, Omicron, Lambda, and XBB. Wuhan-Hu-1 (NC_045512.2; spike coding sequence, genome positions 21,563–25,384) was used as the reference sequence for coordinate assignment [19]. Sequence accessions, lineage assignments, collection information, and spike-CDS lengths are provided in Supplementary File 1. DNA sequences were converted to RNA before analysis, and all folding analyses were performed on individual ungapped variant sequences.
For each analysis window, the Wuhan-Hu-1 sequence was aligned independently to each full-length variant spike coding sequence. Homologous segments were compared column-wise after exclusion of gap characters, and conservation was calculated as the mean frequency of the modal nucleotide across ungapped positions. Conservation was used to describe and prioritize candidate loci and was not interpreted as evidence of RNA-level selection. Full alignment settings and validation procedures are provided in Supplementary Methods S1.2.
Covariation was assessed using a curated alignment of 58 sarbecovirus genomes and its accompanying phylogeny [20]. The spike-region alignment was extracted with all 58 sequences retained, and R-scape was used to calculate mean pairwise sequence identity and evaluate covariation. Genome accessions and alignment metadata are provided in Supplementary File 2; alignment construction, phylogenetic information, and coordinate verification are described in Supplementary Methods S1.3 and S1.4.
2.1.2. Coordinate Systems and Region Designations
All nucleotide coordinates are 1-based and inclusive. Three coordinate systems were used: the canonical Wuhan-Hu-1 spike-coding-sequence frame (3,822 nt) for thermodynamic, secondary-structure, and tertiary-structure analyses; the NC_045512.2 genome frame for comparison with chemical-probing datasets; and the sarbecovirus-alignment frame for covariation analysis. Genome coordinates were converted from spike-CDS coordinates as genome position = spike-CDS position + 21,562. Coordinate mapping and validation procedures are described in Supplementary Methods S1. The three conserved loci identified by screening are termed Region A, Region B, and Region C in 5’→3’ order. A 70-nt subregion within Region A, identified by construct-length analysis, is termed the 70-nt core. Region coordinates and coordinate conversions are provided in Supplementary File 3.
2.2. Genome-Wide Structural Screening
2.2.1. Thermodynamic Scanning and Window-Robustness Filtering
Each of the eight spike coding sequences was independently scanned for locally stable RNA structure using ScanFold with the ViennaRNA back-end at 37 °C [7,21]. Scans were performed using 80-, 100-, and 120-nt windows, a 1-nt step size, and 100 mononucleotide shuffles per window, producing 24 scans in total.
Within each scan, positions with were classified as structurally favorable, and contiguous qualifying positions were merged into candidate segments. For each lineage, segments were retained only when supported across all three window sizes with >20-nt pairwise overlap; overlapping retained segments were then merged. This multi-window criterion was used to prioritize loci whose structural signal was robust to window length. Per-position z-scores are provided in Supplementary File 4. Candidate-segment and retained-region data are provided in Supplementary File 3. Additional ScanFold parameters and screening-threshold rationale are provided in Supplementary Methods S1.5.
2.2.2. Cross-variant Clustering and Definition of the Analysis Windows
Retained lineage-level candidate segments were pooled and clustered across variants by single linkage. Segments were assigned to the same cluster when their spike-CDS spans overlapped by at least one nucleotide. Clusters supported by segments from at least four of the eight lineages were retained as conserved structured loci, and the contributing segments were merged to define each cluster span.
To enable direct comparison among loci, each retained cluster was represented by a fixed 101-nt spike-CDS analysis window that fully enclosed the corresponding merged span. These windows were used for all subsequent thermodynamic, secondary-structure, tertiary-structure, chemical-probing, and molecular-dynamics analyses. Final candidate loci, lineage support, merged spans, and 101-nt analysis windows are provided in Supplementary File 3. Detailed clustering rules and window-selection procedures are provided in Supplementary Methods S1.6. The three retained loci represent the complete output of the pre-specified screen rather than a top-ranked subset.
2.3. Thermodynamic Significance and Benchmarking
2.3.1. Native Folding and Ensemble Characterization
Each 101-nt analysis window was folded on the Wuhan-Hu-1 reference sequence with ViennaRNA RNAfold 2.7.2 [21] at 37 °C with the partition function enabled, and four quantities were retained: the minimum-free-energy (MFE) structure and its folding free energy; the Boltzmann frequency of the MFE structure, defined as the fraction of the equilibrium ensemble occupied by that single conformation; the ensemble diversity, defined as the mean base-pair distance between structures sampled from the Boltzmann ensemble; and the base-pair entropy, computed as the negative sum of p ln p over the pairing probability p of every possible base pair returned by the partition function.
2.3.2. Thermodynamic Significance by Sequence Shuffling
Native folding stability was evaluated against composition-matched null distributions. For each 101-nt window, 50 mononucleotide shuffles and 50 exact dinucleotide-preserving shuffles were generated by the Altschul-Erikson algorithm [22] using a fixed random seed of 42 and folded under the same conditions as the native sequence. Z-scores and empirical p-values were calculated by comparing native MFE values with the corresponding shuffle distributions.
The dinucleotide-preserving null was the primary test, whereas mononucleotide shuffles were retained for comparison with the initial ScanFold screen. Regions were classified using pre-specified criteria as significant structured elements , borderline regions , or unstructured regions. Additional statistical details are provided in Supplementary Methods S1.7.1.
2.3.3. Benchmarking Against the Genome and Known Structured Elements
To contextualize candidate z-scores, the same shuffle-based procedure was applied to 200 randomly sampled 100-nt windows from the NC_045512.2 genome and to three experimentally characterized SARS-CoV-2 RNA elements: the programmed −1 ribosomal frameshift element (FSE, 85 nt) [13], the 5’-UTR stem-loops SL1 to SL3 (100 nt) [15], and the 3’-UTR bulged stem-loop (BSL, 86 nt) [12]. Random genomic windows were sampled with replacement using the same fixed seed as the candidate analysis.
Because each z-score was calculated against sequence-specific, length- and composition-matched shuffles, comparisons were made at the region level despite differences in sequence length. The BSL was used as the principal structured positive-control comparator because it is a compact, non-pseudoknotted element. The FSE was retained as a reference but is expected to be under-ranked by RNAfold because RNAfold does not model pseudoknots. Full benchmark sequences and results are provided in Supplementary Methods S1.7.2.
2.4. Secondary-Structure Cross-Validation and Length Robustness
2.4.1. Cross-validation Against a Methodologically Distinct Predictor
To evaluate the robustness of predicted secondary structures, each 101-nt Wuhan-Hu-1 analysis window was independently predicted with MXfold2 v0.1.1 using default pretrained parameters and without experimental restraints [23]. MXfold2 predictions were compared with the corresponding RNAfold minimum-free-energy (MFE) structures using exact base-pair matching.
Precision, recall, and F1 score were calculated from the shared RNAfold and MXfold2 base-pair sets; positional slippage was not permitted, such that a base pair was counted as shared only when both nucleotide positions matched exactly. Regions were classified descriptively according to cross-predictor agreement. The base pairs recovered by both methods were defined as the consensus fold and were used as the structural reference for covariation and chemical-probing comparisons. Full software settings, metric definitions, and classification criteria are provided in Supplementary Methods S1.8.
2.4.2. Length Robustness of the Predicted Fold
Length dependence of the Region A secondary-structure prediction was evaluated by RNAfold analysis of three nested constructs: the full 101-nt window (spike-CDS positions 1000–1100), a 90-nt intermediate construct (1005–1094), and a 70-nt construct (1009–1078). The constructs shared the same central sequence and differed only in the extent of flanking sequence. Predicted base-pair patterns were compared to determine whether interior helices were retained across construct lengths. The shortest tested construct retaining the interior predicted helices was designated the 70-nt core and carried forward for tertiary-structure prediction. Detailed comparison criteria are provided in Supplementary Methods S1.9.
2.5. Evolutionary Covariation Analysis
2.5.1. Rationale, Alignment Substrate and Regions Tested
Covariation analysis was used to assess whether predicted base pairs showed evidence of evolutionary maintenance beyond primary-sequence conservation. Because the eight SARS-CoV-2 variants provide limited phylogenetic diversity, covariation was evaluated using the 58-genome sarbecovirus spike alignment described above. For each eligible locus, the corresponding 101-column alignment block was extracted with all 58 sequences retained. Regions were tested only if they met the dinucleotide-preserving significance criterion or were classified as borderline in the thermodynamic analysis. Regions that did not meet either threshold were recorded as not tested rather than as covariation negative. Alignment validation and analysis details are provided in Supplementary Methods S1.10.
2.5.2. Covariation Detection and Power Estimation
Each eligible alignment block was analyzed with R-scape v2.0.0a and its structure-folding extension CaCoFold using the default GTp statistic with APC correction [24]. Covarying nucleotide pairs were considered significant at a pre-specified threshold of . R-scape statistical power estimates were retained for each region to assess the number of covarying pairs that could be detected given the substitutions present in the alignment. CaCoFold structures were used only within the covariation analysis and were not quantitatively compared with the RNAfold–MXfold2 consensus fold. Additional analysis settings and interpretive details are provided in Supplementary Methods S1.11.
2.5.3. Interpretive Convention and Classification
Covariation results were interpreted according to pre-specified criteria. Absence of significant covariation in an underpowered alignment was considered non-informative rather than evidence against a predicted structure. A covarying pair was considered structurally informative only when the corresponding positions were non-adjacent and paired in the RNAfold–MXfold2 consensus fold.
Regions were classified as covariation-supported when at least one significant covarying pair met these criteria, inconclusive when the alignment was underpowered or significant pairs did not correspond to non-adjacent consensus base pairs and not tested when the region did not meet thermodynamic eligibility criteria. Inconclusive covariation was not counted as an independent line of support. Full interpretive rationale is provided in Supplementary Methods S1.12.
2.6. Three-Dimensional Structure Prediction and Analysis
2.6.1. Predictors, Sampling Regime and Construct Lengths
Tertiary-structure prediction was used to assess whether Region A could form a reproducible three-dimensional fold. Because no experimentally determined structure is available, individual predicted models were not treated as solved structures; instead, evidence of a shared fold was assessed from agreement among prediction methods.
Region A was modeled using seven RNA tertiary-structure tools: Boltz-2 [25], AlphaFold3 [6], RhoFold+ [5], DRfold2 [4], Emergent[26], FARFAR2 [27], and RNAComposer [28]. Predictions were generated for the 70-nt core, 90-nt intermediate, and full 101-nt window using RNA sequence alone, without structural templates or user-supplied restraints. Multi-model predictors were sampled using their default settings, whereas RhoFold+ and RNAComposer returned one model per construct. Predictor-reported confidence scores were recorded but were not used for model selection, filtering, or weighting. Software versions, sampling depths, and tool-specific settings are provided in Supplementary Methods S1.13.
2.6.2. Cross-Tool Comparison and the Sampling-Asymmetry Convention
Within-tool structural agreement was assessed by mean pairwise C1’-atom RMSD among models generated by the same predictor at each construct length. Cross-tool similarity was evaluated with ARTEMIS v1.51 [29] using topology-independent TM-score_RNA comparisons. Models were compared all-versus-all at each construct length and clustered by average linkage; TM-score_RNA > 0.45 was used as the pre-specified same-fold threshold.
For the full 101-nt construct, models were additionally compared separately for the 5’ domain (window positions 1–51), the 3’ domain (positions 67–101), and their relative orientation across the linker (positions 52–66). This domain-resolved analysis evaluated whether global structural variation reflected loss of local domain structure or flexibility in inter-domain orientation. Detailed superposition procedures, clustering rules, and treatment of unequal sampling among predictors are provided in Supplementary Methods S1.14.
Sampling-asymmetry convention: tools that generated only one model per construct (RhoFold+ and RNAComposer) were not used to define the principal cross-tool cluster or to argue against convergence elsewhere; their absence from a cluster was not interpreted as evidence that the tool failed to recover that fold.
2.6.3. Selection of Representative Model
A single representative model was selected from the principal cross-tool cluster for the structural-analogy search and for the fragment simulation. The representative was defined as the model with the highest mean TM-score_RNA to the other members of that cluster, that is, the most central model of the cluster. Predictor-reported confidence scores did not enter the selection at any point. No averaging, refinement, or manual editing was applied after selection.
2.6.4. Database Analogy Search and Decoy Control
The representative model was searched with ARTEMIS against the BGSU non-redundant RNA structure set obtained through RNAsolo [30], release BGSU__M__All__A__4_0__cif_4_48 (all members, 4.0 Å resolution cut-off). Similarity was quantified as QTM, that is, TM-score_RNA normalized by the query length rather than symmetrically. Hits were interpreted within reference-length bins partitioned a priori into whole-fold (40 ≤ RL ≤ 140), sub-motif (6 ≤ RL < 40), large (RL > 140) and trivial (RL < 6, excluded); the whole-fold bin is the basis of the analogy claim and is evaluated against the complete set of comparable-size structures rather than a hand-selected subset. A resemblance claim of this kind is uninterpretable without a decoy, since a reader cannot otherwise distinguish the statement that this fold resembles known viral elements from the statement that any fold of this sequence would return such hits. The search was therefore repeated using an alternative three-dimensional model of the identical 70-nt sequence as the query, generated with FARFAR2, against the same whole-fold reference set with identical parameters, thresholds and post-filtering, so that the two searches differ only in the conformation of the query. A resemblance was accepted as fold-specific only where the primary query returned above-threshold hits that the identical-sequence decoy did not reproduce.
2.7. Comparison with Published Chemical-Probing Data
2.7.1. Datasets and Coordinate Verification
Published genome-wide chemical-probing datasets were used as an external comparison for the predicted Region A structures. Six datasets from three laboratories were included: SHAPE and DMS measurements from Manfredonia et al. [12], SHAPE-MaP data from Huston et al. [15], and DMS-MaPseq data from Lan et al. [14]. The four in-cell datasets were used to construct probing-supported consensus models and to evaluate structural predictions; the two in-vitro datasets were included for comparison. Dataset metadata are provided in Supplementary File 5.
SHAPE reactivity data from Yang et al. [16] were reserved as a held-out test set because a machine-readable reactivity-constrained secondary-structure model was not available for the relevant coding region. The Yang dataset was not used for consensus construction and was used only to evaluate competing structural models.
An additional independent genome-wide secondary-structure model was obtained from the RNAStructuromeDB ScanFold resource, specifically structure #382 spanning genome positions 22,561–22,613 [17]. This model was used only as an additional comparison for the extended 5’ helix present in the probing-supported consensus. It was not used for AUROC scoring, consensus construction, or leave-one-out cross-validation. Because this resource also uses ScanFold, it is independent of the RNAfold MFE and of the laboratory reactivity-constrained models, but it is not independent of the initial screening method. All reactivity datasets were mapped from NC_045512.2 genomic coordinates to the spike-CDS coordinate system after sequence-based coordinate verification. Dataset-specific reference checks and validation procedures are described in Supplementary Methods S1.15.
2.7.2. Reactivity as a Classifier of Predicted Pairing Status
Chemical-probing reactivity was evaluated as a classifier of predicted unpaired nucleotides in the RNAfold MFE structure for each analysis window. Predictive performance was quantified by the area under the receiver-operating-characteristic curve (AUROC), with predicted-unpaired positions treated as the positive class. This rank-based approach did not require a common reactivity threshold or normalization across datasets.
For DMS datasets, analyses were restricted to adenine and cytosine positions. Statistical significance was assessed by shuffling the reactivity values within each window 200 times using a fixed seed of 42 and recalculating the AUROC. Detailed permutation procedures and empirical p-value calculations are provided in Supplementary Methods S1.16.
2.7.3. Comparison Against Reactivity-Constrained Structural Models
A second analysis evaluated agreement between predicted base pairs and published reactivity-constrained secondary-structure models, independently of reactivity magnitude. Each laboratory’s whole-genome model, generated using its own reactivity data as a folding constraint, was restricted to the relevant analysis window and converted to a base-pair set. Agreement with the corresponding RNAfold MFE structure was quantified by base-pair F1 using the same exact-position matching convention applied to RNAfold–MXfold2 comparisons, with no positional slippage tolerance.
Because the published reactivity-constrained models are data-guided predictions rather than experimentally determined structures, these F1 values were interpreted as corroboration between independent modelling procedures, one of which had access to experimental reactivity, and is reported as corroboration rather than as accuracy against ground truth.
2.7.4. The Probing-Supported Consensus and Model Comparison Under Cross-Validation
When reactivity-constrained models differed systematically from the RNAfold prediction, a probing-supported consensus was defined from the experimental models. The consensus comprised base pairs present in at least three of the four in-cell reactivity-constrained models within the analysis window. This majority rule incorporated the extended 5’ helix only when it was reproducibly supported across the in-cell models, rather than through manual modification. Three structural models were evaluated against reactivity: the RNAfold MFE model, the MFE model with the unsupported middle stem removed, and the probing-supported consensus. Models were compared using AUROC as defined above. To avoid evaluating a consensus against data that contributed to its construction, comparisons were performed using leave-one-out cross-validation: when a laboratory’s reactivity profile was scored, its structural model was excluded from construction of the probing-supported consensus.
The held-out Yang reactivity dataset, which was not used in consensus construction, was scored against all three models without modification. Local support along Region A was assessed using a sliding 25-nt AUROC analysis; detailed procedures are provided in Supplementary Methods S1.17, and the resulting profile is available in Supplementary File 6.
2.7.5. Construct Evaluation, Conformational Heterogeneity and Independence Controls
The isolated 70-nt core was evaluated against the same reactivity datasets and published reactivity-constrained models used for the full 101-nt window. Base pairs connecting the core to flanking sequence in the full-window model were enumerated to assess the structural consequences of excision. The construct showing stronger experimental support was selected as the primary construct for molecular-dynamics simulation. Potential conformational heterogeneity was assessed using published read-level DMS-MaPseq clustering data that identify genomic regions with coexisting RNA structures [14]. Candidate-window coordinates were intersected with the published alternative-structure regions in the genome coordinate frame. Alternative-structure regions within the spike coding sequence and their distances from the candidate loci are provided in Supplementary File 7.
Two controls assessed the independence of probing-based support. First, Huston and Manfredonia reactivity-constrained whole-genome models were compared using the same base-pair F1 metric genome-wide and within Region A to determine whether local agreement exceeded their general genome-wide agreement. Second, the Yang reactivity dataset was retained as a held-out comparison, and its regional coverage and read depth were assessed when interpreting its results. Chemical-probing comparisons were interpreted as corroboration of secondary-structure architecture rather than as structural ground truth. The published models are data-guided predictions, the models share RNAstructure-family folding software, DMS analyses are limited to adenine and cytosine positions, and in-cell reactivity may also be influenced by translation-associated protection. Additional implementation and interpretive details are provided in Supplementary Methods S1.18.
2.8. Molecular Dynamics of the Predicted Fold
2.8.1. Constructs, Starting Models and Framing
Two Region A constructs were simulated under identical molecular-dynamics protocols and trajectory lengths: the full 101-nt window and the isolated 70-nt core. The 101-nt window was treated as the primary construct because it was supported by the chemical-probing comparison, whereas the 70-nt core was simulated as a fragment comparison because tertiary-prediction convergence was strongest at this length. Results from the core simulation were not used to infer the behavior of the intact element in cells. The 70-nt starting structure was the representative model selected from the principal cross-tool cluster. The 101-nt starting structure was selected from the pooled tertiary-prediction models using a pre-specified composite ranking: S = 0.40P + 0.25H + 0.25C + 0.10Q where P is agreement between coordinate-derived base pairs and the probing-supported consensus, H is the fraction of the two experimentally supported helices formed, C is ensemble centrality (inverse mean RMSD to all models in the pool), and Q is a steric-quality score based on atomic clashes and non-physical bond geometry. Weights and component definitions were fixed before model ranking and were not adjusted after inspection of the results. The top-ranked model was accepted only after reproduction in an independent sampling run of the same predictor.
Because agreement with the probing-supported consensus contributed to selection of the 101-nt starting model, the 101-nt simulation was interpreted as testing the dynamic persistence of a probing-compatible fold class under an unrestrained physics-based force field, rather than as an independent validation of the probing result. Full ranking criteria and model-selection procedures are provided in Supplementary Methods S1.19.
2.8.2. System Preparation and Equilibration
Both systems were built with tleap (AmberTools 25) using the AMBER RNA.OL3 force field with χOL3 torsion parameters [31], the OPC four-point water model [32], and Li/Merz 12-6 monovalent-ion parameters for OPC [33]; the 12-6-4 parameterization was not used. Each RNA was solvated in a truncated octahedral box with a 10 Å buffer, neutralized with sodium, and brought to approximately 0.15 M bulk chloride with additional sodium chloride. Solvation, ionization and the staged restraint-reduction relaxation protocol, including force constants, thermostat and barostat settings and convergence criteria, are given in full in Supplementary Table S1- and Table S3.
2.8.3. Production and Trajectory Analysis
Unrestrained production simulations were performed in the isothermal–isobaric ensemble at 300 K and 1 bar using AMBER 24 pmemd.cuda. No ligand was included. Two independent 500-ns replicates were generated for each construct using distinct Langevin seeds, yielding 1 μs of simulation per construct and 2 μs in total. Coordinates were saved every 50 ps. Trajectories were analyzed with cpptraj v6.24.0 [34]. For each replicate, backbone RMSD, per-residue RMSF, radius of gyration, and inter-domain distance were calculated. For the full 101-nt construct, domain-specific RMSD was also calculated separately for the 5’ and 3’ domains. Base-pair persistence was evaluated geometrically only for the 101-nt trajectories, using the probing-supported consensus as the reference base-pair set. For the 70-nt-core trajectories, departure from the starting fold was assessed using global and core backbone RMSD rather than base-pair persistence, because the core was not supported as an autonomously folding unit by the preceding chemical-probing comparison. Therefore, direct between-construct comparisons were limited to reference-independent measures, including per-residue RMSF and radius of gyration. Complete simulation and analysis settings are provided in Supplementary Methods S1.20.
2.8.4. Interpretive Conventions and Scope
Trajectories were interpreted using pre-specified criteria for structural persistence and reproducibility. A fold was considered compatible with dynamic stability when backbone RMSD reached a bounded plateau while the relevant reference base pairs remained persistent. The pre-specified plateau criterion was defined over the final 40% of each production trajectory as a rolling-mean RMSD slope with an absolute value below 0.01 Å ns⁻¹ and an RMSD standard deviation below 1.0 Å. For the full 101-nt construct, domain-level behavior was prioritized over global RMSD: increases in global RMSD with preservation of both probing-supported helices were interpreted as inter-domain reorientation rather than fold loss. Loss of either supported helix was interpreted as loss of the supported fold class.
Concordant behavior across the two independent replicates was treated as stronger evidence than a result observed in one trajectory alone; divergent replicates were interpreted as incomplete sampling at the available trajectory length rather than as definitive evidence for or against a fold. The simulations characterize apo RNA behavior under the applied force field and conditions; they do not establish atomic-level structural accuracy, ligand binding, ligandability, or biological function. Additional reproducibility conventions are provided in Supplementary Methods S1.21.
3. Result
3.1. Genome-Wide Screening Identifies Three Conserved, Window-Robust Structured Loci
Applying the staged sliding-window screen to eight SARS-CoV-2 lineages (Wuhan-Hu-1, Alpha, Beta, Gamma, Delta, Omicron, Lambda and XBB) at three window sizes (80, 100 and 120 nt) returned three conserved structured loci across the spike gene. Representative Wuhan-Hu-1 z-score profiles for the three window sizes are shown in Figure 1a, with the screening threshold and the three retained loci marked; all eight lineages were screened independently. Cross-lineage support for the retained candidate spans is shown in Figure 1b against the ≥ 4/8 retention cutoff, and the position of each locus in the spike protein architecture in Figure 1c. This is the complete output of the screen at the parameters described in the Methods, not a top-three selection from a longer list. The three loci, with coordinates given in both the spike-CDS frame and NC_045512.2, correspond to distinct functional elements of the spike protein (Table 1).
Regions A and C are supported by seven of the eight lineages and Region B by six. Region B’s lower support is not arbitrary: it is specifically absent in Omicron and XBB, the two lineages carrying the most extensive mutation of the RBM. Sequence conservation across the eight-variant panel is high at all three loci: mean per-position identity is 0.993 for Region A, 0.976 for Region B and 0.998 for Region C. This uniformity is expected, since all three loci sit at positions central to spike function and conservation at this stage reflects amino-acid-level selection rather than RNA structure. All three also coincide with positions of well-established functional importance in the spike protein: receptor engagement at the RBD/N343 and RBM/E484 sites, and membrane fusion at S2’. Whether this coincidence reflects a systematic association between structured RNA signal and functionally critical protein positions, or the choice of screening thresholds, cannot be determined from the screen alone; it is returned to in the Discussion and is not presented as an enrichment test, which this study did not perform.
The sensitivity of these conserved-locus calls to the cross-lineage clustering criterion is shown in Supplementary Figure S1. Regions A and B are retained under both transitive single-linkage clustering and strict reference-overlap matching, whereas coordinate-shifted lineage-specific spans in Beta, Delta, Omicron and XBB cause Region C to fall from 7/8 to 3/8 lineages under the strict criterion, below the ≥ 4/8 cutoff. Region C’s retention therefore depends on the clustering rule adopted, which is stated in full in the Methods rather than left implicit.
Genome-wide ScanFold scans have previously reported low-z windows throughout the SARS-CoV-2 coding sequence, including within spike [17], and a consensus screen combining reactivity, Shannon entropy and folding stability has nominated a structured region containing Region A’s coordinates [12]. A favorable window score in such a scan is a screening observation rather than a validated structural claim, which is why the three regions were next subjected to the thermodynamic significance test.
3.2. Thermodynamic Significance Separates Region A from Regions B and C
All three loci returned by the screen are highly conserved at the sequence level, so sequence conservation alone does not distinguish among them. Each 101-nt region was folded on the Wuhan-Hu-1 reference sequence and its stability evaluated using the dinucleotide-preserving shuffle z-score at the pre-specified threshold z_dinuc ≤ −2 with empirical p ≤ 0.05, fixed before these three regions were examined.
The three loci separated cleanly into one significant structured element, one unstructured locus, and one borderline case (Figure 2a; Table 2). Region A folded far more stably than its dinucleotide-matched shuffles (z_dinuc = −3.39, p = 0.020) at a native MFE of −32.6 kcal mol⁻¹. Region B was not structured against the dinucleotide null (z_dinuc = +0.44, p = 0.686). Region C occupied an intermediate position (z_dinuc = −1.65, p = 0.078; z_mono = −2.25), clearing the lenient mononucleotide null but not the stringent dinucleotide null. This three-way separation is driven entirely by the folding evidence, since sequence conservation is similarly high across all three loci.
Three independent descriptors of the equilibrium ensemble rank the three regions in the same order as the significance test (Figure 2b). Region A adopts a compact, deterministic fold (MFE frequency 20.9%, ensemble diversity 6.55, base-pair entropy 6.95), whereas Region B shows a broad, dispersed ensemble (0.75%, 35.35, 41.81). Region C falls between the two on every measure (8.19%, 12.40, 16.67). Because all four quantities are computed from the partition function rather than from the shuffle procedure, their agreement with the z-score ranking is an independent line on the same three-way separation rather than a restatement of the significance test.
To place these z-scores on an interpretable scale, the same procedure was applied to 200 randomly sampled 100-nt windows of the SARS-CoV-2 genome and to three experimentally characterized functional RNA structures: the 5’-UTR stem-loops SL1–3, the 3’-UTR bulged stem-loop (BSL), and the programmed −1 ribosomal frameshift element (FSE). Against the genomic background, Region A falls at the 96th percentile, Region C at the 71st, and Region B at the 14th (Figure 2c). The BSL, being neither pseudoknotted nor multipartite, is the appropriate positive-control comparator; Region A scores more stably against it (z = −2.40, 86th percentile). The FSE and SL1–3 score modestly (z = −0.82 and −0.84, respectively) because RNAfold does not model pseudoknots and the SL1–3 window spans multiple independent hairpins. These comparisons calibrate the folding metric and identify Region A as a thermodynamically significant, comparatively well-defined candidate structured locus rather than as a validated functional or druggable RNA element.
Region A was carried forward to secondary-structure cross-validation, covariation analysis and three-dimensional modelling; Region C into secondary-structure cross-validation and covariation analysis but not into subsequent structural analyses; and Region B into secondary-structure cross-validation as a negative control. Detailed free-energy components, null-model comparisons, ensemble descriptors, and the sequence–structure comparison are provided in Supplementary Figure S2.
3.3. Region A’s Secondary Structure Is Robust to Prediction Method
A significant dinucleotide-shuffle z-score establishes that a region folds more stably than expected of its dinucleotide composition; it does not establish that the base pairs recovered by the nearest-neighbour model are the ones the region actually adopts. Each of the three regions was therefore independently re-predicted with MXfold2, and the two base-pair sets for each region were compared. The three regions separated on this measure in the same rank order as on the thermodynamic significance test (Figure 3; Table 3; Supplementary Figure S3).
Region A: near-identical base pairing between physics and ML. MXfold2 reproduced the RNAfold structure of Region A almost exactly: 33 of the 34 RNAfold base pairs were also predicted by MXfold2, corresponding to a precision of 1.000, a recall of 0.971 and an F1 of 0.985 (Figure 3a, b). The single disagreement involves a terminal pair near the 3’ boundary of the window. The two methods converge on a compact, multi-helical secondary structure comprising a 5’ hairpin (14 base pairs), a middle stem (6 base pairs) and a 3’ stem-loop (14 base pairs). That the addition of parameters learned from experimentally solved structures leaves the predicted pairing essentially unchanged indicates that Region A’s secondary structure is well determined within this class of methods, rather than an artefact of the nearest-neighbour parameterization alone; it does not establish the experimentally adopted structure. This physics/ML-agreed pattern is used as the consensus fold of Region A throughout the remainder of the paper, including as the reference against which the covariation results and the chemical-probing comparison are evaluated.
Region B: predictors disagree. MXfold2 and RNAfold agreed on only 5 base pairs out of 15 and 23 predicted (F1 = 0.26), and the two predictions are essentially incompatible, sharing only a limited central region (Supplementary Figure S3a). This is the outcome anticipated by the Boltzmann analysis above: with an ensemble diversity of 35.35 and an MFE frequency of 0.75 %, no single conformation of Region B dominates the equilibrium, and two methods weighting the same energy landscape differently have no reason to arrive at the same answer. The low F1 is not a failure of either predictor; it is the expected result for a sequence whose folding landscape lacks a defined ground state.
Region C: predictors agree on a central hairpin but not on its context. MXfold2 reproduced Region C’s central hairpin (F1 = 0.84; 8 shared base pairs out of 11 predicted by RNAfold and 8 by MXfold2), differing principally on the peripheral 3’ stem-loop (Supplementary Figure S3b). This places Region C in the reproducible-core class: a dominant hairpin is recovered by both methods, but its peripheral context is not, consistent with its borderline thermodynamic classification and locating where along the sequence that borderline signal resides. Whether the hairpin is biologically significant structure requires further evidence, addressed by the covariation analysis below.
Because the RNAfold structure of Region A is essentially reproduced by MXfold2, we further asked whether the consensus fold depends on the length of sequence supplied to the folding calculation. Three predetermined lengths were folded under RNAfold, 70 nt, 90 nt and the full 101-nt window, and their dot-bracket structures compared by inspection (Figure 3c).
The interior helices are retained across all three constructs, whereas the terminal base-pairing patterns change with the supplied flanking sequence: the 101-nt structure carries a substantial 3’-terminal stem that is reduced or absent at the shorter lengths. We therefore designate spike CDS nt 1009–1078 as a computationally defined 70-nt core for subsequent tertiary-structure modelling. This is the shortest of the three lengths tested at which the interior fold is preserved by visual inspection, not the outcome of a search over construct lengths or a computed matching score, and the designation indicates retention of the interior predicted pattern within the tested length series; it does not establish that the excised core folds autonomously in cells, which is evaluated separately against chemical-probing data below. All three constructs, including this core, were carried forward to three-dimensional structure prediction.
3.4. Covariation Analysis Is Underpowered by the Available Sarbecovirus Diversity
Region A and Region C were tested for covariation across the 58-sarbecovirus spike alignment using R-scape with the CaCoFold extension; Region B was excluded because it did not fold as a defined structure against the dinucleotide null. The analysis is underpowered on this alignment: R-scape power estimates indicate only 2.1 ± 1.2 detectable pairs for Region A and 1.2 ± 1.0 for Region C, given the observed substitutions and a mean pairwise identity of 81.6% and 84.9%, respectively (Table 4). A test expecting only one to two detectable pairs cannot discriminate between a structure under selection and one that is not.
Region C yielded no significant covarying pair. Region A yielded one nominally significant pair at alignment columns 46 and 47 (E = 0.0044). This signal is inconclusive rather than supportive for three reasons: the columns are adjacent and cannot form a canonical Watson–Crick base pair; neither the RNAfold nor MXfold2 consensus places these positions as paired with each other; and the CaCoFold structure that reports this pair would require a zero-nucleotide hairpin loop, which is not physically realizable. Correlated substitution at adjacent codon positions is most economically explained by amino-acid-level selection.
The underpowered outcome reflects the sarbecovirus phylogeny rather than a property of Region A, and is not counted as an independent line of support. Extending the alignment to a broader coronavirus set would gain evolutionary depth at the cost of alignment quality and is considered in the Discussion.
3.5. Region A’s 70-nt Core Has a Best-Supported Three-Dimensional Fold
3.5.1. Cross-Tool Prediction: Only Boltz-2 and AlphaFold3 Converge, and Only on the 70-nt Core
Region A was modelled at three nested lengths, 70, 90 and 101 nt, with seven independent predictors. No predictor converged at the full 101-nt length. Within-tool agreement was best at the 70-nt core and degraded as length increased: Boltz-2’s mean pairwise C1’ RMSD rose from 1.9 Å at 70 nt to 5.4 Å at 90 nt and 7.8 Å at 101 nt, and AlphaFold3 showed the same pattern (2.9, 3.1 and 28.7 Å). The 70-nt core is therefore the only length at which cross-tool agreement can be meaningfully assessed, and the tertiary analysis below is an analysis of the excised core; the chemical-probing comparison that follows treats the full 101-nt window as the unit that folds in cells, and the two constructs are kept distinct throughout.
At the 70-nt core, the tools separated into three groups on within-tool agreement: self-consistent (Boltz-2, 1.9 Å; AlphaFold3, 2.9 Å), internally converging on a distinct fold (FARFAR2, 4.8 Å), and non-convergent (DRfold2, 13.2 Å; Emergent, 12.5 Å). RhoFold+ and RNAComposer produced a single model each and are not testable for internal convergence; their results are reported factually but not used to argue against convergence elsewhere. The 36 models from all seven tools were compared all-versus-all with ARTEMIS. At the same-fold threshold of TM-score_RNA = 0.45, average-linkage clustering returned a single cross-tool cluster containing all ten Boltz-2 and all five AlphaFold3 models; every other predictor formed either a single-tool cluster or a singleton (Figure 4a, b). The quantitative cross-tool and within-tool TM-score_RNA values for each predictor are summarized in Table 5. Because both predictors in this cluster are diffusion-based architectures, their agreement establishes reproducibility across independent implementations of one paradigm rather than across unrelated paradigms.
Two claims are supported here, and one is deliberately not made. Boltz-2 and AlphaFold3 recover the same fold: their between-tool similarity (0.53) exceeds the same-fold threshold and sits close to each predictor’s own within-tool value (0.65 and 0.56), so the two tools differ from each other little more than each differs from itself. None of the remaining multi-model predictors joins this cluster: FARFAR2 converges internally on a different fold, and DRfold2 and Emergent do not converge internally at all. What is not claimed is that Boltz-2 and AlphaFold3 predict identical structures; the between-tool value of 0.53 shows they recover a shared fold class rather than identical coordinates, and not a unique or experimentally established tertiary structure for the core. The representative central model of this cluster comprises two predicted subdomains corresponding approximately to the 5’ and 3’ portions of the 70-nt construct (Figure 4c), and it is this model that was carried forward to the analogy search and the fragment simulation. The full 101-nt construct was analysed separately, because the chemical-probing data support the full window rather than the excised core as the biologically relevant structural unit.
Predictor self-confidence scores were uniformly low at the 70-nt core (Boltz-2 pTM = 0.44 for the top-ranked model overall, 0.42 for the specific medoid selected as the cross-tool representative; AlphaFold3 pTM = 0.27; RhoFold+ pLDDT = 42.1) and declined further at 90 and 101 nt (AlphaFold3 pTM 0.22 then 0.19; Boltz-2 pTM 0.33 then 0.29). These scores were not used to select or filter models, consistent with the convention set out in the Methods. Region A’s 70-nt core is therefore captured by a best-supported fold class on which two independently trained implementations of one predictive architecture agree, while its full three-dimensional architecture remains unresolved by current de novo prediction. This consensus is not presented as a solved structure.
3.5.2. The Consensus Fold Is Structurally Analogous to Compact Viral Regulatory RNAs
The representative model was searched with ARTEMIS against the BGSU non-redundant RNA structure set using query-normalized TM-score (QTM). The search included 1,857 database structures, of which 1,844 were successfully scored, and comparisons in the whole-fold length range used the 731 eligible structures with reference lengths of 40 to 140 nt (Figure 5a). This fold has no exact match in the reference set: the best-scoring hit achieved QTM = 0.583, above the same-fold threshold but below the value expected for a close structural homolog, consistent with Region A being a previously uncharacterized RNA element rather than a member of a well-catalogued family. The top-scoring structural neighbours cluster on a coherent structural class of compact viral RNA regulatory elements and small riboswitches: the bacteriophage phi29 packaging RNA (PDB 1FOQ, QTM = 0.583), the Dengue virus stem-loop (7LYF, 0.574), adenovirus VA RNA (6OL3, 0.509), an HIV-1 RNA domain (8UO6, 0.508) and the Coxsackievirus cloverleaf (8SP9, 0.50), together with the guanidine, YkoY, PreQ1 and ZTP riboswitches and several aptamers. Region A therefore scores above threshold against a class of experimentally validated compact viral regulatory RNAs and riboswitches, not merely against isolated members of the reference set.
This resemblance is specific to the predicted fold rather than to the underlying sequence. The identical search was repeated using a FARFAR2 model of the same 70-nt sequence as a conformation-matched decoy, under identical parameters and thresholds (Figure 5b). At QTM ≥ 0.45 the primary query returned 45 eligible hits and the decoy none; at QTM ≥ 0.50 the counts were 10 and 0; and at the more permissive QTM ≥ 0.40 they were 202 and 8. The above-threshold database matches therefore depend on the selected query conformation rather than on sequence alone. Because the comparison used a single alternative model, it is a decoy-control result rather than definitive validation of the three-dimensional structure, and it establishes neither structural homology, biological function, nor ligand binding.
3.5.3. The Consensus Fold Separates into Two Well-Converged Domains Joined by a Flexible Hinge
Because the chemical-probing analysis resolves Region A into two supported helices separated by an unpaired linker, the 101-nt models admit a domain-resolved comparison that a single global RMSD cannot provide. Models from the five multi-model predictors were compared pairwise over the 5’ domain (window positions 1 to 51), the 3’ domain (positions 67 to 101), and a hinge measure isolating their relative orientation, using the same domain boundaries the probing analysis identifies as the linker (positions 52 to 66) (Table 6).
The 3’ domain is tightly converged across every tool (mean D2 = 3.1 Å, range 2.1 to 4.8 Å). The 5’ domain converges less tightly (mean D1 = 8.5 Å, range 4.4 to 14.7 Å), with AlphaFold3 a clear outlier at 14.71 Å against the other four tools’ range of 4.4 to 11.7 Å. The hinge measure, by contrast, is uniformly large (mean 46.9 Å, range 20.6 to 73.7 Å): every tool disagrees substantially on how the two domains are oriented relative to one another, even where each domain’s own internal geometry is well resolved. RhoFold+ and RNAComposer, each producing a single model at this length, cannot be assessed by this within-tool measure and are not included in the table. This pattern is consistent with a genuine two-domain architecture joined by a flexible linkage rather than a single rigid fold: high global RMSD, driven by disagreement in inter-domain orientation, is measured across the same window positions the chemical-probing consensus identifies as unpaired. Region A is accordingly best described, at the tertiary level, as two domains the predictors largely agree on individually, the 3’ domain consistently so and the 5’ domain somewhat less tightly with AlphaFold3 the outlier, connected by a hinge whose orientation is not resolved by current prediction methods.
3.6. In-Cell Chemical Probing Supports a Two-Helix Architecture in the Full Region A Window
The evidence above derives from a single energy model; an external check was available in published genome-wide chemical-probing data from SARS-CoV-2-infected cells. Four in-cell datasets from three laboratories were used: SHAPE from Manfredonia et al., SHAPE-MaP from Huston et al., and DMS-MaPseq from Lan et al. in both Vero and Huh7 cells. Coordinate correspondence to the spike-CDS frame was verified by byte-identical sequence comparison for every window.
Across the full 101-nt window the reactivity profiles consistently support the two flanking helices, while the central segment corresponding to the RNAfold middle stem shows elevated or heterogeneous reactivity (Figure 6a). Reactivity is consistent with the predicted pairing in every in-cell dataset for Region A and for no other region (Table 7). Each laboratory also folded the genome using its own reactivity as a constraint, without reference to the present predictions; compared to the Region A RNAfold MFE structure, these four models recover 28 of its 34 base pairs (F1 = 0.83–0.85), whereas Region B fails in every dataset (F1 = 0.24–0.30) and Region C scores 0.59–0.84. The agreement is specific to Region A: Huston and Manfredonia’s genome-wide models agree on only 5,441 of roughly 8,400 base pairs (F1 = 0.647), yet inside Region A their models are identical, sharing all 32 of the base pairs each contains.
Two features of these data revise the predicted structure. First, agreement is not uniform: the 5’ hairpin was recovered in 92.8% and the 3’ stem-loop in 100% of the probing-constrained structures, whereas the RNAfold middle stem was recovered in only 10.7% (Figure 6b). These percentages quantify agreement with probing-constrained models and are not direct measurements of base-pair occupancy. The experimental models instead leave the middle segment predominantly unpaired and extend the 5’ helix by approximately three outer base pairs. A similar extended 5’ helix is also present in an independent genome-wide structure model at the same coordinates. Region A is therefore better described as two experimentally supported flanking helices separated by a flexible or predominantly unpaired middle segment, rather than as the three-helix RNAfold MFE structure described earlier. The earlier consensus-fold figure should consequently be interpreted as the computational reference used for F1 scoring, not as the final structural model.
Second, the 70-nt core is not supported as an autonomously folding unit. Excising spike CDS 1009 to 1078 and folding it in isolation breaks 16 of the 34 base pairs present in the full window: 4 pairs closing the 5’ hairpin, including the outermost pair, which spans the excision boundary, and 12 pairs of the 3’ stem-loop that cross it, with a further 2 pairs lost entirely because both partners lie outside the core. The resulting 70-nt MFE structure scores F1 = 0.53 against every in-cell model, with reactivity AUROC weak or non-significant in three of four datasets (Manfredonia 0.540, p = 0.27; Huston 0.603, p = 0.07; Lan Vero 0.514, p = 0.41; Lan Huh7 0.736, p = 0.09). The core, excised and folded on its own, is therefore neither well supported by reactivity nor well matched to the in-cell consensus.
The revision from the three-helix MFE to a two-helix architecture was tested under leave-one-out cross-validation, scoring three candidate models—the raw MFE, the MFE with its middle stem removed, and the full probing-supported consensus—against each laboratory’s reactivity with that laboratory’s contribution excluded from the model being scored (Figure 6c; Table 8). The revised models outperform the raw MFE in three of the four in-cell datasets: Huston, from 0.663 to 0.744; Lan Vero, from 0.778 to 0.849; and Lan Huh7, from 0.892 to 0.980. Manfredonia is the exception, where the raw MFE scores marginally higher than the full consensus (0.685 versus 0.665), though the middle-stem-deleted intermediate model scores highest of all three there (0.709). The held-out Yang dataset, which entered no consensus at any stage, shows very similar values for the raw MFE and the revised models (0.723 and 0.729) and therefore does not clearly distinguish among the candidates, consistent with its role as an independent check.
To localize where along the region this support is strongest, AUROC was recomputed in a sliding 25-nt window across Region A. The profile tracks the base-pair recovery pattern closely: it peaks over the 3’ stem-loop (maximum approximately 0.88, positions 1068–1092) and over the 5’ helix (maximum approximately 0.75, positions 1010–1040), and dips sharply over the middle stem and linker (as low as approximately 0.63, positions 1020–1048), the same segment the base-pair recovery and domain analyses identify as unsupported and structurally mobile. Whether Region A occupies a single conformation in cells was assessed against a published list of alternative-structure regions derived from read-level clustering of DMS-MaPseq data. Of 71 such regions found genome-wide, five fall within the spike coding sequence, and Region A is not among them; the nearest alternative-structure region lies 762 nt away. Because absence from this list could in principle reflect insufficient coverage rather than genuine conformational homogeneity, this is read alongside the reactivity evidence already established for this locus: Lan’s own data at Region A gives strongly significant AUROC values (0.778 and 0.892), indicating a reactivity signal of good quality at exactly this position rather than a coverage gap. Region A’s absence from the alternative-structure list is accordingly read as evidence of a single dominant fold rather than as an artefact of missing data.
The published models are data-guided predictions rather than determined structures, DMS coverage is limited to adenine and cytosine positions, and in-cell reactivity may also be influenced by translating ribosomes; the agreement is therefore strong corroboration of the two-helix architecture, not ground truth. Together these results support the full 101-nt window as the relevant structural unit in cells, while the excised 70-nt core is not supported. Both constructs were carried forward to molecular dynamics rather than resolving the disagreement by assumption: the 101-nt window as the primary construct, and the 70-nt core as a fragment comparison.
3.7. Molecular Dynamics Reveals Persistent Local Domains and Flexible Inter-Domain Motion
Two independent 500 ns all-atom molecular dynamics trajectories were run for each construct, the probing-supported full 101-nt Region A window and the computationally defined 70-nt fragment (Figure 7). The full 101-nt construct showed larger global backbone RMSD values than the isolated 70-nt fragment, but this behaviour is dominated by motion of the single-stranded linker and by changes in the relative orientation of the two domains rather than by loss of the experimentally supported helices (Figure 7a, b). The isolated 70-nt fragment showed lower global RMSD and a narrower radius-of-gyration distribution over the simulations (Figure 7a, d).
3.7.1. The 101-nt Window: Individually Stable Domains Joined by a Mobile Hinge
Domain-resolved analysis of the production trajectories shows a clear separation between the internal stability of each domain and the behaviour of the construct as a whole (Figure 7b; Table 9). The 3’ stem-loop (domain 2, nt 67 to 101) is stable throughout both replicates: mean backbone RMSD of 2.58 ± 0.53 Å, rolling-mean slopes near zero over the final 200 ns in both replicates (0.0004 and 0.0025 Å ns⁻¹), and standard deviations of 0.53 Å in each, satisfying the plateau criterion. Structural snapshots taken at 100 ns intervals throughout production are detailed in Supplementary Table S4A, and trajectory time-series in Supplementary Files 8 and 9 and per-residue RMSF values are provided in Supplementary File 10. The 5’ helix (domain 1, nt 1 to 51) shows a similar absence of long-term drift, with a mean RMSD of 4.65 ± 1.30 Å and rolling-mean slopes near zero (0.0136 and −0.0010 Å ns⁻¹). Its fluctuation is larger than the pre-specified 1.0 Å bound (SD 1.33 Å and 1.39 Å), so this domain does not strictly satisfy the plateau criterion as defined. Base-pair persistence (Figure 7e; Supplementary Table S5) localizes the source of this fluctuation: 13 of 14 pairs in this domain persist above 90 % throughout, and the elevated variance is attributable to a single terminal pair, G1–C51, which frays to 55–60 % persistence in both replicates. Excluding this one pair, domain 1’s fluctuation is consistent with the same bounded, non-drifting behaviour seen in domain 2, and is interpreted as conformational relaxation of the terminal base pair rather than as a failure of the domain overall.
Global backbone RMSD across the full 101-nt construct does not plateau (mean 22.45 ± 5.66 Å; rolling-mean slopes of −0.055 and −0.028 Å ns⁻¹ over the final 200 ns, both far outside the plateau bound). Under the domain-resolved criterion this is not read as fold instability, since both domains individually remain intact throughout. Per-residue fluctuation is highest in the linker and terminal regions, localizing the source of the global RMSD to the single-stranded linker (nt 52 to 66, RMSF 17.7 to 26.2 Å; Figure 7c), and the inter-domain centre-of-mass distance samples a continuous range from a compact starting conformation (27.6 Å) to an extended one (65.2 Å), averaging 52.7 ± 6.5 Å across both replicates (Figure 7b), consistent with flexible linker-mediated reorientation between otherwise persistent local domains. The two replicates disagree in their momentary global RMSD (17.7 Å in one, 27.2 Å in the other), which by itself would read as poor reproducibility. This disagreement is resolved by the domain and centre-of-mass measures: both replicates sample closely matching ranges of inter-domain separation (27.5 to 64.4 Å and 27.3 to 65.2 Å) and closely matching domain-internal stability, differing only in when along the trajectory a given degree of extension is reached.
3.7.2. The 70-nt Core: Loss of the Native Fold
The excised 70-nt core behaves differently. Its RMSD against the fold it was built from rises over the first 100 to 200 ns and then plateaus by the same criterion applied to the full window (slopes of 0.0005 and −0.0047 Å ns⁻¹, standard deviations of 0.71 Å and 0.92 Å). Snapshot metrics show core RMSD settling between 4.4 and 7.8 Å and the radius of gyration rising from approximately 25.5 Å to 28.4 Å by 500 ns (Supplementary Table S4B); both replicates reach a similar terminal value (7.07 Å and 5.78 Å) by different routes. This is a plateau reached away from the reference rather than at it, and under the convention set out in the Methods a stable RMSD is not itself evidence of a retained fold. Because persistence was scored only for the probing-validated helices of the 101-nt construct, the departure is characterized at the level of global and core RMSD rather than pair by pair, so the simulation is consistent with loss of the predicted fold without demonstrating it. The fragment is the quieter system on every reference-independent measure lower fluctuation, tighter radius of gyration (Figure 7a, c, d) but quiescence here is that of a structure that has already left its starting conformation, whereas the full construct’s mobility is confined to a linker that probing independently identifies as unpaired, with both helices intact. This outcome is consistent with the core being poorly supported by reactivity (F1 = 0.53; AUROC weak or non-significant in three of four datasets). The simulation began from a structure that comparison had already rejected, so it is complementary evidence rather than independent confirmation. Full trajectory time-series for the two 70-nt-core replicates are provided in Supplementary Files 11 and 12, and per-residue RMSF values are provided in Supplementary File 13.
3.7.3. Base-Pair Persistence Analysis
Base-pair persistence provides the most granular assessment of structural integrity at the individual-pair level (Figure 7e; Supplementary Table S5). In the 101-nt construct the 3’ stem-loop is exceptionally stable, all 13 monitored base pairs persisting above 97 % across both replicates, with four pairs maintaining 100.00 % occupancy throughout the full 500 ns; the 5’ helix shows 13 of 14 pairs persisting above 90 %, with five pairs at 100.00 %, the sole outlier being the terminal pair G1–C51 at 54.89 % and 60.56 % in the two replicates, consistent with end fraying rather than internal structural degradation. Direct comparison of persistence between the two constructs is limited, because the full 101-nt window was evaluated against the probing-supported consensus while the 70-nt fragment was evaluated against its own RNAfold MFE structure. Additional trajectory descriptors for both constructs, including total intramolecular hydrogen bonds, total solvent-accessible surface area, mean helical rise and mean helical twist, are shown in Supplementary Figure S4; these are consistent with preservation of overall helical geometry and the absence of large-scale expansion during the simulations.
Under the domain-resolved criterion, the full 101-nt window is therefore compatible with a stable fold: both supported domains retain their internal structure and the large majority of their base pairs throughout 500 ns, the elevated global RMSD reflecting inter-domain hinge motion rather than degradation. Additional descriptors for both constructs are shown in Supplementary Figure S4 and are consistent with preserved helical geometry and no large-scale expansion. These simulations support persistence of local domains under the applied force field, but establish nothing about the cellular tertiary structure, ligandability, or biological function of Region A.
4. Discussion
4.1. What the Composite Evidence Establishes, and How Independent Its Strands Are
The central finding is that Region A withstands every test to which it was subjected, while Regions B and C, matched to it for sequence conservation and for window-robustness in the screen, do not. The design rests on each test targeting a different way in which a conserved, favorably-folding sequence can fail to be a genuine RNA structure. Two qualifications bound that claim. The three loci were not carried through an identical battery: the comparison is strictly like-for-like only on thermodynamic significance, secondary-structure method-independence, and agreement with chemical-probing data. Tertiary modelling and molecular dynamics were performed for Region A alone, since neither is interpretable for a sequence with no defined secondary structure to model. Region A is therefore the only locus passing every test applied to all three, and the tertiary and dynamic work extends its characterization rather than discriminating it from the controls.
The strands differ in independence. Thermodynamic and secondary-structure tests share the ViennaRNA energy model, since MXfold2 incorporates a thermodynamic term built on those parameters; their near-identical agreement tests the addition of learned parameters, not the energy model itself. Boltz-2 and AlphaFold3 are both diffusion architectures, so their convergence demonstrates reproducibility across independent implementations of one paradigm rather than agreement across unrelated ones.
The chemical-probing comparison is the most nearly independent strand, resting on reactivity from three laboratories using two chemistries, none of which saw the present predictions. Its independence is partial because all three groups used RNAstructure-family software, but the genome-wide control settles this: two models agreeing on ~65 % of base pairs genome-wide are identical inside Region A. Shared software cannot produce a locus-specific jump of that size, so the convergence must come from the reactivity.
The molecular dynamics is the most constrained strand of all, and the constraint is one of construction rather than of execution. Because probing agreement dominated the composite score that selected the 101-nt starting model, the simulation cannot test that agreement; it can only ask whether a model built to satisfy the probing data survives 500 ns under a physics-based force field without restraints. It does, and that is not a trivial outcome, but it corroborates a design choice already justified elsewhere rather than adding a further independent line. The one departure from the pre-specified criteria, the 5’ helix exceeding the plateau bound, is attributed to terminal fraying on the strength of the per-pair persistence data rather than by relaxing the criterion after the fact.
One alternative explanation is excluded by none of these strands. Every positive line above, thermodynamic stability, cross-predictor agreement, reactivity consistency and dynamic persistence, would hold equally of a structure arising as a by-product of the amino-acid sequence and under no RNA-level selection whatever, since a coding sequence must fold into something. Covariation is the test that discriminates, and it returned nothing usable, so the question remains open rather than answered in the negative. Two things narrow the gap without closing it: comparably conserved windows from the same gene do not fold comparably (Section 3.2), so coding-sequence composition alone is not sufficient to produce this signal; and the probing agreement establishes that the structure is adopted in cells, which an incidental fold may equally be, but which removes the possibility that it exists only in silico. The decisive test was not performed. A null preserving codon usage and amino-acid identity, shuffling only synonymous positions, would ask directly whether the stability survives protein-level constraint; such a null is not yet standard in thermodynamic folding analysis, which is why the dinucleotide-preserving model was used, but its absence is the principal gap in the evidence rather than a technical footnote. A related conditioning should be acknowledged: the three loci were nominated by scanning every window across the coding sequence in eight lineages, and the dinucleotide z-test was applied afterwards without correction for that selection, so Region A’s 96th-percentile standing in the genomic background marks it as unusual rather than rare. Until the codon-preserving null is run, or an alignment of sufficient depth makes covariation informative, the honest statement is that Region A is a structurally defined element whose evolutionary status is undetermined.
4.2. Construct-Length Dependence Is a Property of the Element
The construct-length dependence is a property of the element, not a technical artefact. Excision removes flanking sequence that nearly half the full-window base pairs depend on, and the isolated core is correspondingly unsupported by both reactivity and simulation (Section 3.6 and Section 3.7.2). What these two results jointly establish is narrower than it might appear: they show that the 70-nt core is not an autonomously folding unit. They do not show that either domain would be unstable in isolation, since no isolated single domain was probed or simulated, and within the intact window both domains held throughout.
Tertiary prediction converges only on the core and fails at full length, but the domain-resolved comparison resolves the tension. Every predictor reproduces the 3’ domain tightly and most reproduce the 5’ domain reasonably; what none agrees on is the relative placement of the two halves across the linker. That is precisely the degree of freedom the simulations show to be genuinely mobile. A construct truncating the linker eliminates that freedom and permits apparent convergence, but only by discarding real flexibility. The core simulation began from a structure the probing comparison had already rejected, so its failure is complementary evidence, not a second vote. The 90-nt intermediate is not pursued because it neither resolved the convergence problem nor entered the probing comparison.
4.3. Controls, Nulls and the Interpretation of the Middle Stem
The dinucleotide-preserving null is standard for this analysis but does not absorb codon-level constraint; a codon- and amino-acid-preserving null would be stricter, and is not established practice. The internal controls compensate indirectly. Comparably conserved coding windows from the same gene, returned by the same screen, do not produce comparable stability (Section 3.2), so composition alone is not driving the signal. The correct reading of this is that the signal is specific to Region A among the loci this screen returned, which is weaker than the claim that no other coding window in spike could produce it. Region C’s own retention depends on the transitive clustering rule, which is documented rather than eliminated; that bears on its standing as a control, not on Region A’s result.
Covariation contributes nothing either way for phylogenetic rather than structural reasons. At sarbecovirus divergence the test could detect only one or two pairs even under strong selection, and the single nominally significant signal is not a real base pair. A null result under these conditions is uninformative. The decoy control carries more weight than the analogy itself. The separation between the primary query and a conformation-matched decoy is complete at and above the pre-specified threshold. The best match sits above the same-fold threshold but below homologue range, supporting the reading that Region A resembles a recognized functional class without belonging to a catalogued family. The middle stem is where experiment overturns prediction. Probing-constrained models leave the segment unpaired and extend the 5’ helix, and cross-validation supports this revision. Two explanations remain open: intrinsic instability or ribosome occlusion. Neither is distinguished here. In vitro probing of the isolated 101-nt construct would settle it. Either way, the window with an unpaired middle segment is the architecture the in-cell data support.
4.4. Relation to Prior Work
Region A’s coordinates were not previously characterized as an element, but they were not unexamined. Yang et al. nominated an overlapping window among twelve consensus structured elements [16]. Convergence of two independent screens on the same coordinates is corroboration, and what distinguishes this work is what follows nomination: decoy-controlled tertiary analogy, evolutionary analysis, simulation, and comparison against sequence-matched controls from the same screen. Zhu et al. found spike-directed ASOs to underperform a leader-targeted lead [18], but their panel was generated by positional tiling, so the result measures coverage, not whether spike contains a targetable structure. The leader appears in genomic RNA and every subgenomic transcript; Region A appears in genomic RNA and the spike subgenomic mRNA alone, an intermediate exposure.
4.5. Interpretation, Ligandability and Generality
The picture is of a bipartite element: two helices whose internal geometry is reproducible across prediction, experiment and simulation, joined by a linker whose conformational freedom is real. If ligandable, candidate sites follow from that architecture: the domain interface or the more rigid 3’ stem-loop. Nothing here bears on whether the element binds anything. The staged design transfers to any coding or non-coding region of comparable length, but two inputs are not generally available: sarbecovirus alignment depth and genome-wide probing from multiple laboratories. Absent them, the framework can still nominate candidates, but the claim is computational throughout.
5. Limitations
Three questions remain open. The three-dimensional architecture of the 101-nt element is unsolved: prediction converges on each domain’s internal fold but not on their relative orientation, and the simulations explain why, since the hinge samples a wide and apparently continuous range. Resolving the accessible range suits solution methods sensitive to ensemble behaviour, such as small-angle X-ray scattering, single-molecule FRET across the linker, or NMR residual dipolar couplings, better than a single cryo-EM reconstruction, which would tend to average over or select against a mobile hinge. Evolutionary evidence for selection on the pairing remains inconclusive at the depth available; extending beyond the sarbecovirus subgenus would gain substitutions at the cost of alignment quality and orthology confidence, and whether that trade is worthwhile is not addressed here. And no function has been established at any level. Everything reported characterizes a structure; none of it demonstrates what that structure does, which would require targeted mutagenesis or antisense disruption in a replication-competent or replicon system. Four constraints bound the individual analyses. The simulations are apo, comprise two replicates per construct, and do not establish that any selected model’s coordinates are correct, only whether its fold class is dynamically stable under the applied force field. The published probing-derived models are data-guided predictions rather than determined structures, and all were folded with RNAstructure-family software. DMS informs only adenine and cytosine positions, and in-cell reactivity within a coding sequence is additionally shaped by translating ribosomes. Finally, the screen returned its three loci at one set of parameter values, and the sensitivity of that output to the clustering rule is documented rather than eliminated.
6. Conclusion
Region A is a conserved, thermodynamically significant, secondary-structure-validated element within the SARS-CoV-2 spike coding sequence, supported by in-cell chemical-probing data from three independent laboratories, structurally analogous at the fold level to established classes of ligand-binding viral regulatory RNA, and dynamically stable as two individually rigid domains connected by a flexible linker. It survives comparison against two sequence-matched control loci drawn from the same unbiased screen, one unstructured and one borderline, on every test applied to all three. No analysis presented here establishes a biological function, and no three-dimensional model is offered as an experimentally solved structure; both are left to direct structural and functional follow-up. On the evidence assembled, Region A is a reasonable candidate for that follow-up, and the staged evidentiary approach used to identify it is offered as a template for comparable coding regions elsewhere in the virus and, subject to the caveats on evolutionary depth and probing-data availability, beyond it. The path forward lies not in assuming that coding-region conservation reflects RNA structure, but in applying orthogonal tests to distinguish genuine RNA elements from the background of protein-coding constraint.
Supplementary Materials
The following supporting information can be downloaded at the website of this paper posted on Preprints.org, Figure S1: Sensitivity of cross-lineage clustering and coordinate characterization of Region C; Figure S2: Thermodynamic partitioning, null-model controls, ensemble properties, and sequence–structure divergence; Figure S3: Cross-model comparison of RNAfold MFE and MXfold2 secondary-structure predictions; Figure S4: Additional trajectory descriptors from duplicate 500-ns explicit-solvent MD simulations of the Region A RNA constructs; Table S1: MD minimization, equilibration, and production protocol for the 101-nt system; Table S2: MD minimization, equilibration, and production protocol for the 70-nt system; Table S3: Composition and equilibration outcome; Table S4: Snapshot structural metrics; Table S5: Base-pair persistence profiles; File S1: Spike CDS sequences and accessions; File S2: Sarbecovirus alignment and phylogeny; File S3: Candidate segments and retained regions; File S4: Per-position ScanFold z-scores; File S5: Chemical-probing dataset metadata; File S6: Sliding-window AUROC profile; File S7: Alternative-structure regions in spike; File S8–S13: MD trajectory time-series and per-residue RMSF values.
Author Contributions
Conceptualization, S.D., J.T. and S.-G.L.; methodology, S.D. and J.T.; software, S.D. and J.T.; validation, S.D., J.T. and S.S.; formal analysis, S.D., J.T. and S.S.; investigation, S.D., J.T. and S.S.; resources, S.-G.L.; data curation, S.D. and J.T.; writing—original draft preparation, S.D. and J.T.; writing—review and editing, S.D., J.T., S.S. and S.-G.L.; visualization, S.D. and J.T.; supervision, S.-G.L.; project administration, S.-G.L.; funding acquisition, S.-G.L. All authors have read and agreed to the published version of the manuscript.
Funding
This research was funded by the Basic Science Research Program through the National Research Foundation of Korea (NRF), funded by the Ministry of Education, grant number 2021R1I1A3050836.
Institutional Review Board Statement
Not applicable.
Informed Consent Statement
Not applicable.
Data Availability Statement
Data Availability Statement: All data used in this study are publicly available from NCBI GenBank (https://www.ncbi.nlm.nih.gov/genbank/), GISAID (https://www.gisaid.org), and the published chemical probing datasets cited in the text. The analysis scripts and the predicted structural models are available from the corresponding author upon reasonable request. Supplementary files contain the processed data supporting the reported results.
Acknowledgments
We thank Pusan National University, South Korea, for providing computational facilities and technical support.
Conflicts of Interest
The authors declare no conflicts of interest.
References
- Childs-Disney, J.L.; Yang, X.; Gibaut, Q.M.R.; Tong, Y.; Batey, R.T.; Disney, M.D. Targeting RNA Structures with Small Molecules. Nat. Rev. Drug Discov. 2022, 21, 736–762. [Google Scholar] [CrossRef] [PubMed]
- Connelly, C.M.; Numata, T.; Boer, R.E.; Moon, M.H.; Sinniah, R.S.; Barchi, J.J.; Ferré-D’Amaré, A.R.; Schneekloth, J.S. Synthetic Ligands for PreQ1 Riboswitches Provide Structural and Mechanistic Insights into Targeting RNA Tertiary Structure. Nat. Commun. 2019, 10, 1501. [Google Scholar] [CrossRef] [PubMed]
- Ratni, H.; Ebeling, M.; Baird, J.; Bendels, S.; Bylund, J.; Chen, K.S.; Denk, N.; Feng, Z.; Green, L.; Guerard, M.; et al. Discovery of Risdiplam, a Selective Survival of Motor Neuron-2 (SMN2) Gene Splicing Modifier for the Treatment of Spinal Muscular Atrophy (SMA). J. Med. Chem. 2018, 61, 6501–6517. [Google Scholar] [CrossRef] [PubMed]
- Li, Y.; Feng, C.; Zhang, X.; Tsukiyama, S.; Feng, D.; Zhang, Y. DRfold2 Is a Deep Learning-Based Tool That Enables Efficient and Accurate RNA Structure Prediction. PLoS Biol. 2026, 24, e3003659. [Google Scholar] [CrossRef] [PubMed]
- Shen, T.; Hu, Z.; Sun, S.; Liu, D.; Wong, F.; Wang, J.; Chen, J.; Wang, Y.; Hong, L.; Xiao, J.; et al. Accurate RNA 3D Structure Prediction Using a Language Model-Based Deep Learning Approach. Nat. Methods 2024, 21, 2287–2298. [Google Scholar] [CrossRef] [PubMed]
- Abramson, J.; Adler, J.; Dunger, J.; Evans, R.; Green, T.; Pritzel, A.; Ronneberger, O.; Willmore, L.; Ballard, A.J.; Bambrick, J.; et al. Accurate Structure Prediction of Biomolecular Interactions with AlphaFold 3. Nature 2024, 630, 493–500. [Google Scholar] [CrossRef] [PubMed]
- Andrews, R.J.; Roche, J.; Moss, W.N. ScanFold: An Approach for Genome-Wide Discovery of Local RNA Structural Elements—Applications to Zika Virus and HIV. PeerJ 2018, 6, e6136. [Google Scholar] [CrossRef] [PubMed]
- Dutta, S.; Sri Pushan, S.; Ghosh, R.; Jose, M.; Pritam, M. In Silico Study of Antiviral Phytochemicals for the Potential Drug Development Against Wild-Type and Omicron Variants of SARS-CoV-2. Curr. Pharm. Biotechnol. 2026, 27, 168–187. [Google Scholar] [CrossRef] [PubMed]
- Harvey, W.T.; Carabelli, A.M.; Jackson, B.; Gupta, R.K.; Thomson, E.C.; Harrison, E.M.; Ludden, C.; Reeve, R.; Rambaut, A.; Peacock, S.J.; et al. SARS-CoV-2 Variants, Spike Mutations and Immune Escape. Nat. Rev. Microbiol. 2021, 19, 409–424. [Google Scholar] [CrossRef] [PubMed]
- Pritam, M.; Dutta, S.; Medicherla, K.M.; Kumar, R.; Singh, S.P. Computational Analysis of Spike Protein of SARS-CoV-2 (Omicron Variant) for Development of Peptide-Based Therapeutics and Diagnostics. J. Biomol. Struct. Dyn. 2024, 42, 7321–7339. [Google Scholar] [CrossRef] [PubMed]
- Zhou, P.; Yang, X.-L.; Wang, X.-G.; Hu, B.; Zhang, L.; Zhang, W.; Si, H.-R.; Zhu, Y.; Li, B.; Huang, C.-L.; et al. A Pneumonia Outbreak Associated with a New Coronavirus of Probable Bat Origin. Nature 2020, 579, 270–273. [Google Scholar] [CrossRef] [PubMed]
- Manfredonia, I.; Nithin, C.; Ponce-Salvatierra, A.; Ghosh, P.; Wirecki, T.K.; Marinus, T.; Ogando, N.S.; Snijder, E.J.; van Hemert, M.J.; Bujnicki, J.M.; et al. Genome-Wide Mapping of SARS-CoV-2 RNA Structures Identifies Therapeutically-Relevant Elements. Nucleic Acids Res. 2020, 48, 12436–12452. [Google Scholar] [CrossRef] [PubMed]
- Roman, C.; Lewicka, A.; Koirala, D.; Li, N.-S.; Piccirilli, J.A. The SARS-CoV-2 Programmed −1 Ribosomal Frameshifting Element Crystal Structure Solved to 2.09 Å Using Chaperone-Assisted RNA Crystallography. ACS Chem. Biol. 2021, 16, 1469–1481. [Google Scholar] [CrossRef] [PubMed]
- Lan, T.C.T.; Allan, M.F.; Malsick, L.E.; Woo, J.Z.; Zhu, C.; Zhang, F.; Khandwala, S.; Nyeo, S.S.Y.; Sun, Y.; Guo, J.U.; et al. Secondary Structural Ensembles of the SARS-CoV-2 RNA Genome in Infected Cells. Nat. Commun. 2022, 13, 1128. [Google Scholar] [CrossRef] [PubMed]
- Huston, N.C.; Wan, H.; Strine, M.S.; de Cesaris Araujo Tavares, R.; Wilen, C.B.; Pyle, A.M. Comprehensive in Vivo Secondary Structure of the SARS-CoV-2 Genome Reveals Novel Regulatory Motifs and Mechanisms. Mol. Cell 2021, 81, 584–598.e5. [Google Scholar] [CrossRef] [PubMed]
- Yang, S.L.; DeFalco, L.; Anderson, D.E.; Zhang, Y.; Aw, J.G.A.; Lim, S.Y.; Lim, X.N.; Tan, K.Y.; Zhang, T.; Chawla, T.; et al. Comprehensive Mapping of SARS-CoV-2 Interactions in Vivo Reveals Functional Virus-Host Interactions. Nat. Commun. 2021, 12, 5113. [Google Scholar] [CrossRef] [PubMed]
- Andrews, R.J.; O’Leary, C.A.; Tompkins, V.S.; Peterson, J.M.; Haniff, H.S.; Williams, C.; Disney, M.D.; Moss, W.N. A Map of the SARS-CoV-2 RNA Structurome. NAR Genom. Bioinform. 2021, 3. [Google Scholar] [CrossRef] [PubMed]
- Zhu, C.; Lee, J.Y.; Woo, J.Z.; Xu, L.; Wrynla, X.H.; Yamashiro, L.H.; Ji, F.; Biering, S.B.; Van Dis, E.; Gonzalez, F.; et al. An Intranasal ASO Therapeutic Targeting SARS-CoV-2. Nat. Commun. 2022, 13, 4503. [Google Scholar] [CrossRef] [PubMed]
- Wu, F.; Zhao, S.; Yu, B.; Chen, Y.-M.; Wang, W.; Song, Z.-G.; Hu, Y.; Tao, Z.-W.; Tian, J.-H.; Pei, Y.-Y.; et al. A New Coronavirus Associated with Human Respiratory Disease in China. Nature 2020, 579, 265–269. [Google Scholar] [CrossRef] [PubMed]
- Jungreis, Irwin. Alignment of 58 Sarbecovirus Genomes for Conservation Analysis of SARS-CoV-2. Available online: https://virological.org/t/alignment-of-58-sarbecovirus-genomes-for-conservation-analysis-of-sars-cov-2/430 (accessed on 31 March 2026).
- Lorenz, R.; Bernhart, S.H.; Höner zu Siederdissen, C.; Tafer, H.; Flamm, C.; Stadler, P.F.; Hofacker, I.L. ViennaRNA Package 2.0. Algorithms Mol. Biol. 2011, 6, 26. [Google Scholar] [CrossRef] [PubMed]
- Altschul, S.F.; Erickson, B.W. Significance of Nucleotide Sequence Alignments: A Method for Random Sequence Permutation That Preserves Dinucleotide and Codon Usage. Mol. Biol. Evol. 1985, 2, 526–538. [Google Scholar] [CrossRef] [PubMed]
- Sato, K.; Akiyama, M.; Sakakibara, Y. RNA Secondary Structure Prediction Using Deep Learning with Thermodynamic Integration. Nat. Commun. 2021, 12, 941. [Google Scholar] [CrossRef] [PubMed]
- Gao, W.; Jones, T.A.; Rivas, E. Discovery of 17 Conserved Structural RNAs in Fungi. Nucleic Acids Res. 2021, 49, 6128–6143. [Google Scholar] [CrossRef] [PubMed]
- Passaro, S.; Corso, G.; Wohlwend, J.; Reveiz, M.; Thaler, S.; Somnath, V.R.; Getz, N.; Portnoi, T.; Roy, J.; Stark, H.; et al. Boltz-2: Towards Accurate and Efficient Binding Affinity Prediction. bioRxiv 2025. [Google Scholar] [CrossRef] [PubMed]
- Herron, L.; Qiu, Y.; Verma, A.; Sreyas Adury, V.S.; John, R.; Lee, S.; Mehdi, S.; Sanwal, D.; Schneekloth, J.S.; Tiwary, P. Ab Initio Prediction of RNA Structure Ensembles with RNAnneal. bioRxiv 2026. [Google Scholar] [CrossRef] [PubMed]
- Watkins, A.M.; Rangan, R.; Das, R. FARFAR2: Improved De Novo Rosetta Prediction of Complex Global RNA Folds. Structure 2020, 28, 963–976.e6. [Google Scholar] [CrossRef] [PubMed]
- Popenda, M.; Szachniuk, M.; Antczak, M.; Purzycka, K.J.; Lukasiak, P.; Bartol, N.; Blazewicz, J.; Adamiak, R.W. Automated 3D Structure Composition for Large RNAs. Nucleic Acids Res. 2012, 40, e112–e112. [Google Scholar] [CrossRef] [PubMed]
- Bohdan, D.R.; Bujnicki, J.M.; Baulin, E.F. ARTEMIS: A Method for Topology-Independent Superposition of RNA 3D Structures and Structure-Based Sequence Alignment. Nucleic Acids Res. 2024, 52, 10850–10861. [Google Scholar] [CrossRef] [PubMed]
- Adamczyk, B.; Antczak, M.; Szachniuk, M. RNAsolo: A Repository of Cleaned PDB-Derived RNA 3D Structures. Bioinformatics 2022, 38, 3668–3670. [Google Scholar] [CrossRef] [PubMed]
- Zgarbová, M.; Otyepka, M.; Šponer, J.; Mládek, A.; Banáš, P.; Cheatham, T.E.; Jurečka, P. Refinement of the Cornell et al. Nucleic Acids Force Field Based on Reference Quantum Chemical Calculations of Glycosidic Torsion Profiles. J. Chem. Theory Comput. 2011, 7, 2886–2902. [Google Scholar] [CrossRef] [PubMed]
- Izadi, S.; Anandakrishnan, R.; Onufriev, A. V. Building Water Models: A Different Approach. J. Phys. Chem. Lett. 2014, 5, 3863–3871. [Google Scholar] [CrossRef] [PubMed]
- Li, P.; Song, L.F.; Merz, K.M. Systematic Parameterization of Monovalent Ions Employing the Nonbonded Model. J. Chem. Theory Comput. 2015, 11, 1645–1657. [Google Scholar] [CrossRef] [PubMed]
- Roe, D.R.; Cheatham, T.E. PTRAJ and CPPTRAJ: Software for Processing and Analysis of Molecular Dynamics Trajectory Data. J. Chem. Theory Comput. 2013, 9, 3084–3095. [Google Scholar] [CrossRef] [PubMed]
Figure 1.
Genome-wide ScanFold screening identifies three conserved candidate loci in the SARS-CoV-2 Spike CDS. (a) Representative z-score profiles at 80, 100, and 120 nt window sizes with the screening threshold and retained loci marked. (b) Cross-lineage support for retained candidate spans against the ≥ 4/8 cutoff. (c) Positions of the three loci within the spike protein architecture.
Figure 1.
Genome-wide ScanFold screening identifies three conserved candidate loci in the SARS-CoV-2 Spike CDS. (a) Representative z-score profiles at 80, 100, and 120 nt window sizes with the screening threshold and retained loci marked. (b) Cross-lineage support for retained candidate spans against the ≥ 4/8 cutoff. (c) Positions of the three loci within the spike protein architecture.
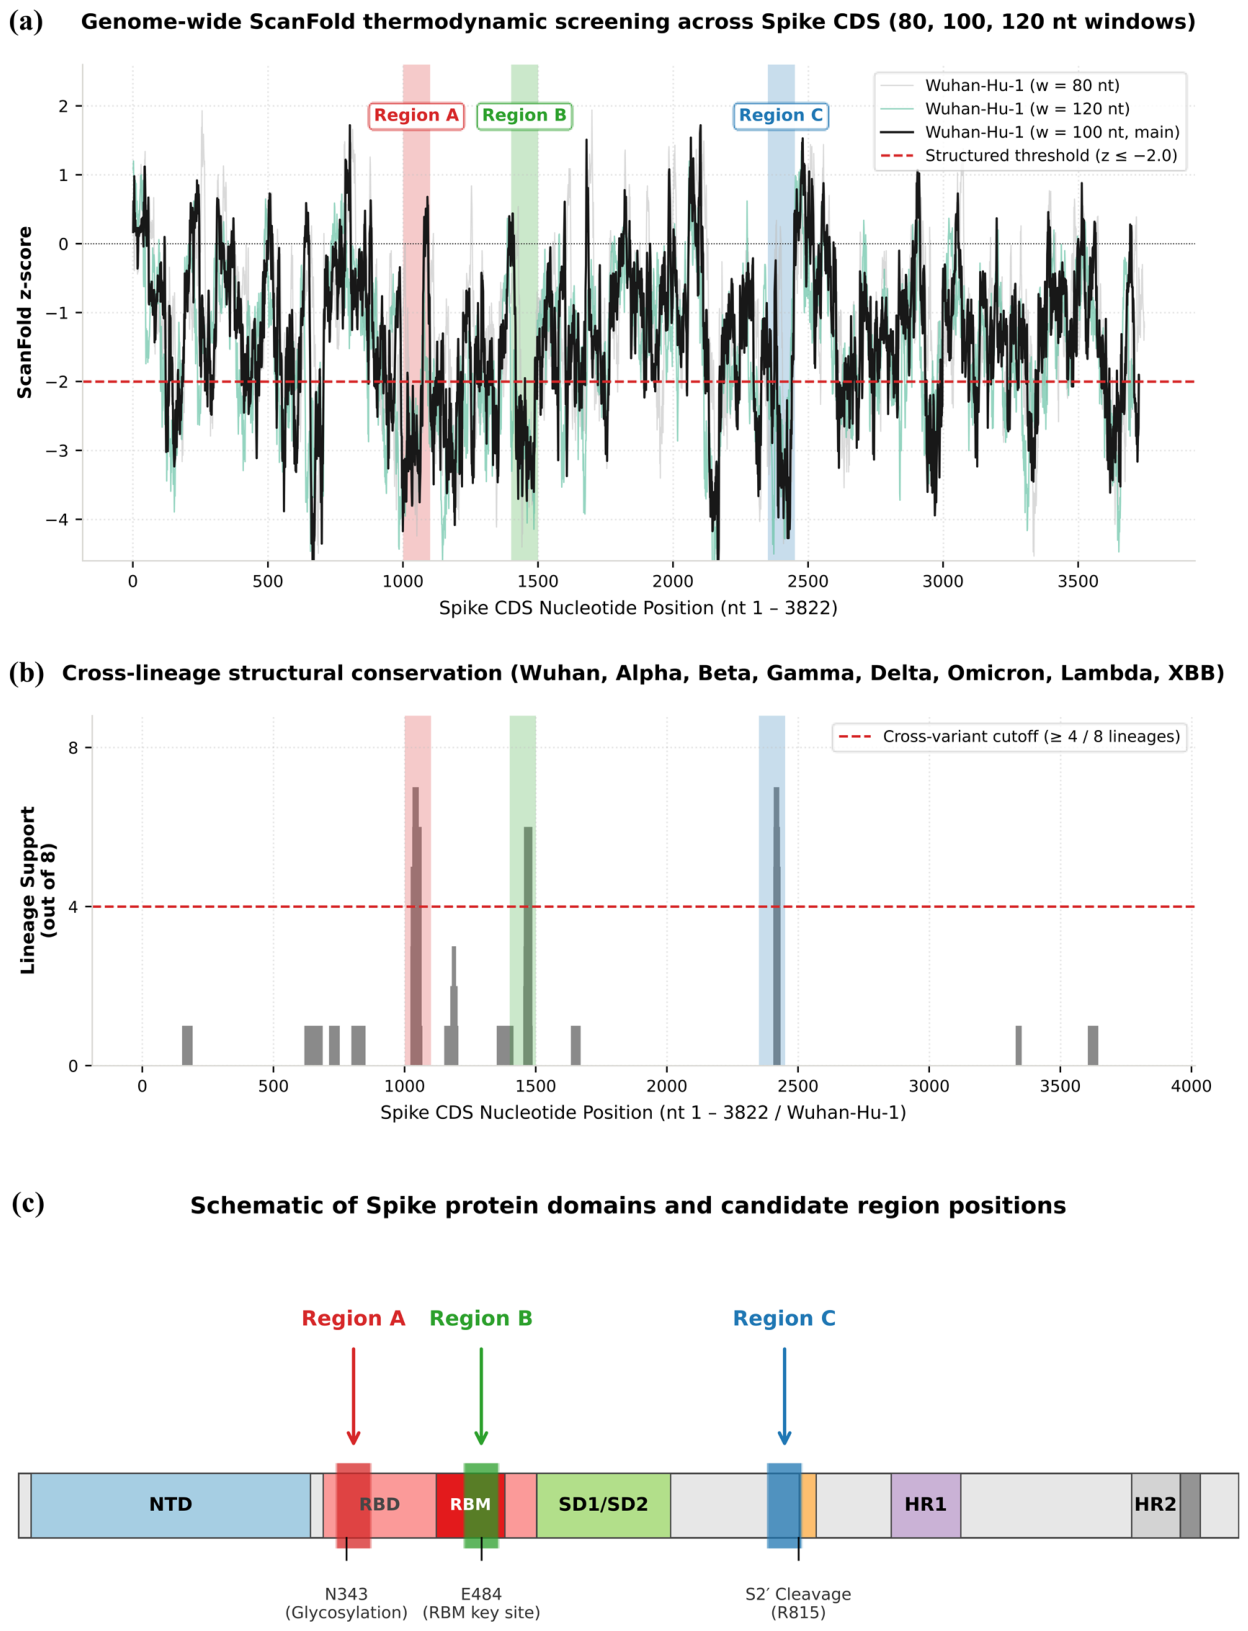
Figure 2.
Thermodynamic analysis distinguishes Region A from Regions B and C.
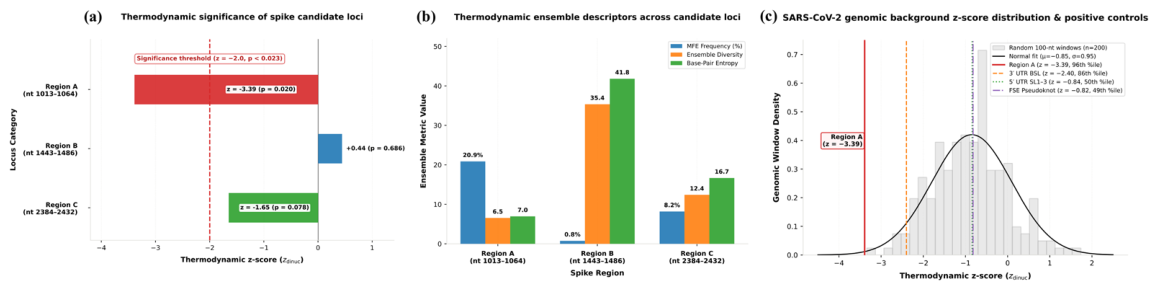
Figure 3.
Cross-predictor agreement and length dependence of the predicted Region A secondary structure.
Figure 3.
Cross-predictor agreement and length dependence of the predicted Region A secondary structure.
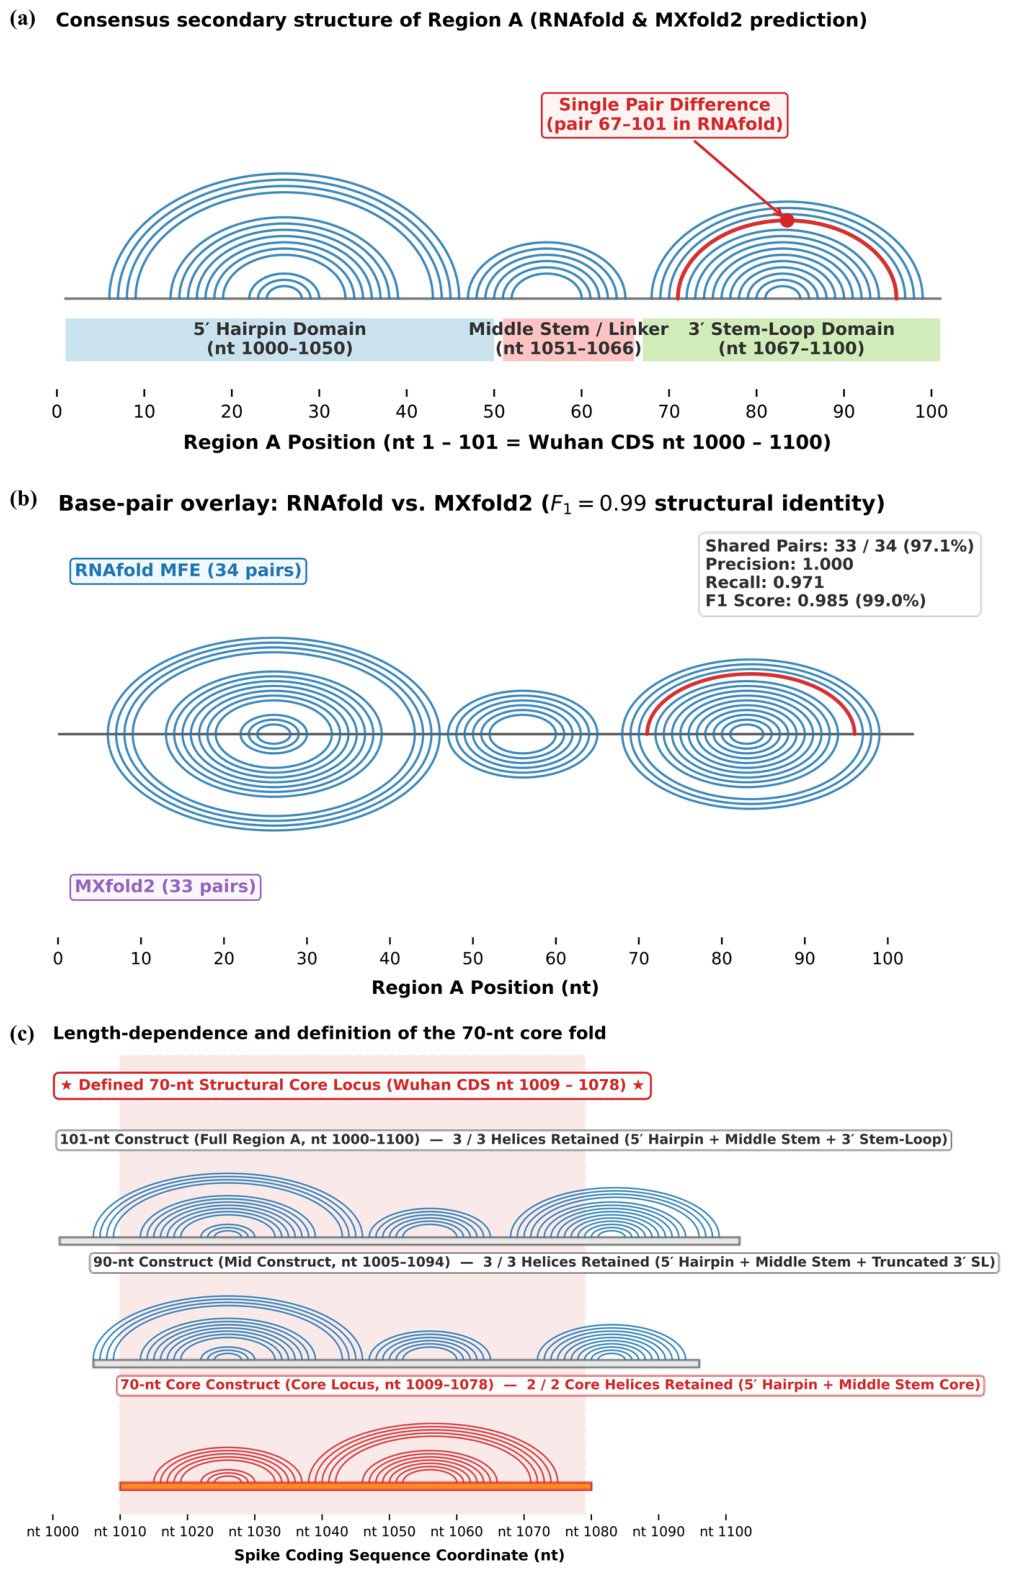
Figure 4.
Cross-tool tertiary-structure comparison of the computationally defined 70-nt Region A core.
Figure 4.
Cross-tool tertiary-structure comparison of the computationally defined 70-nt Region A core.
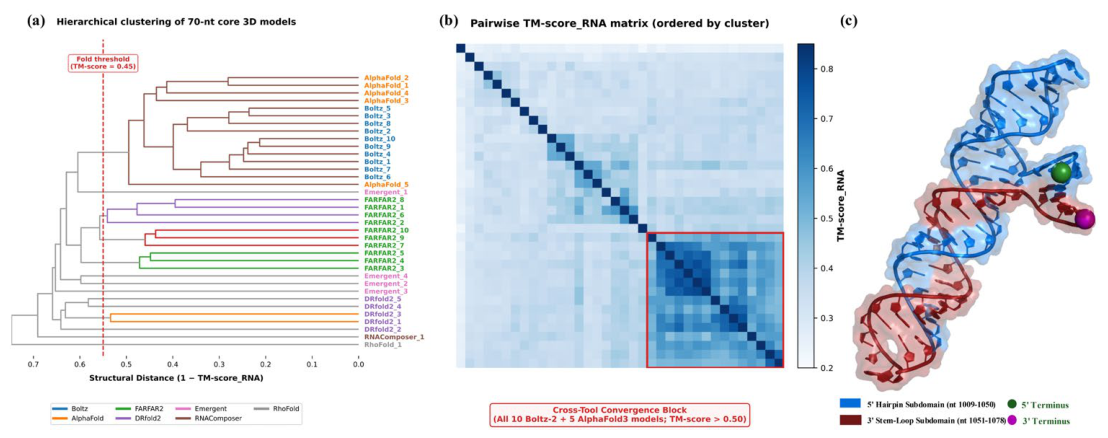
Figure 5.
Fold-specific structural analogs of the computationally defined 70-nt Region A core.
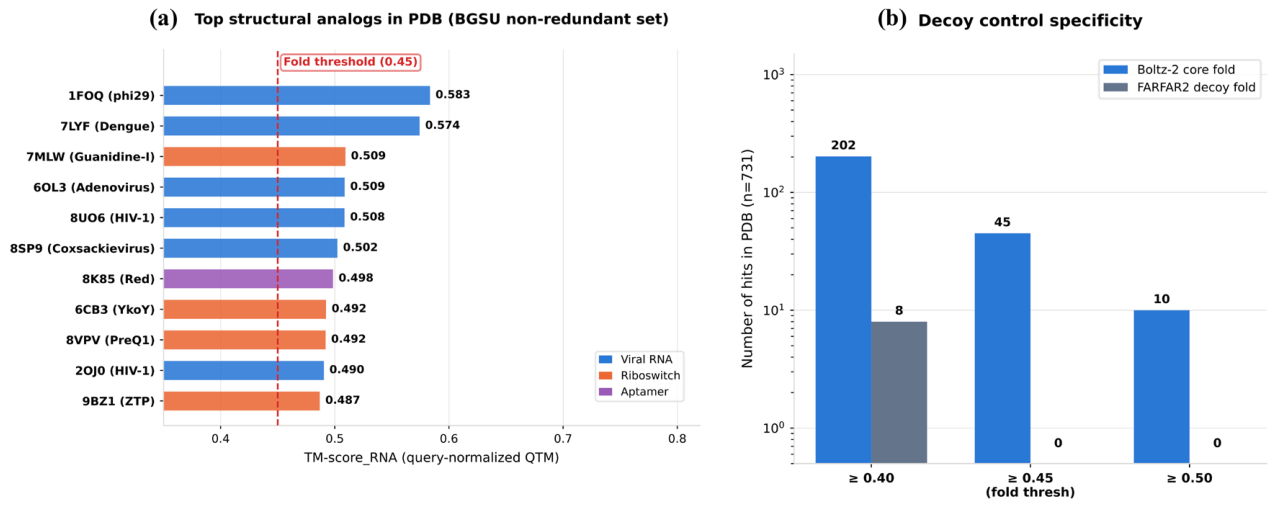
Figure 6.
In-cell chemical-probing data support a revised two-helix architecture of the full 101-nt Region A window. (a) Reactivity profiles from the four in-cell datasets across the full window. (b) Base-pair recovery percentages for the predicted 5’ hairpin, middle stem, and 3’ stem-loop in the reactivity-constrained models. (c) Leave-one-out AUROC comparison of the raw MFE, middle-stem-removed MFE, and probing-supported consensus models.
Figure 6.
In-cell chemical-probing data support a revised two-helix architecture of the full 101-nt Region A window. (a) Reactivity profiles from the four in-cell datasets across the full window. (b) Base-pair recovery percentages for the predicted 5’ hairpin, middle stem, and 3’ stem-loop in the reactivity-constrained models. (c) Leave-one-out AUROC comparison of the raw MFE, middle-stem-removed MFE, and probing-supported consensus models.
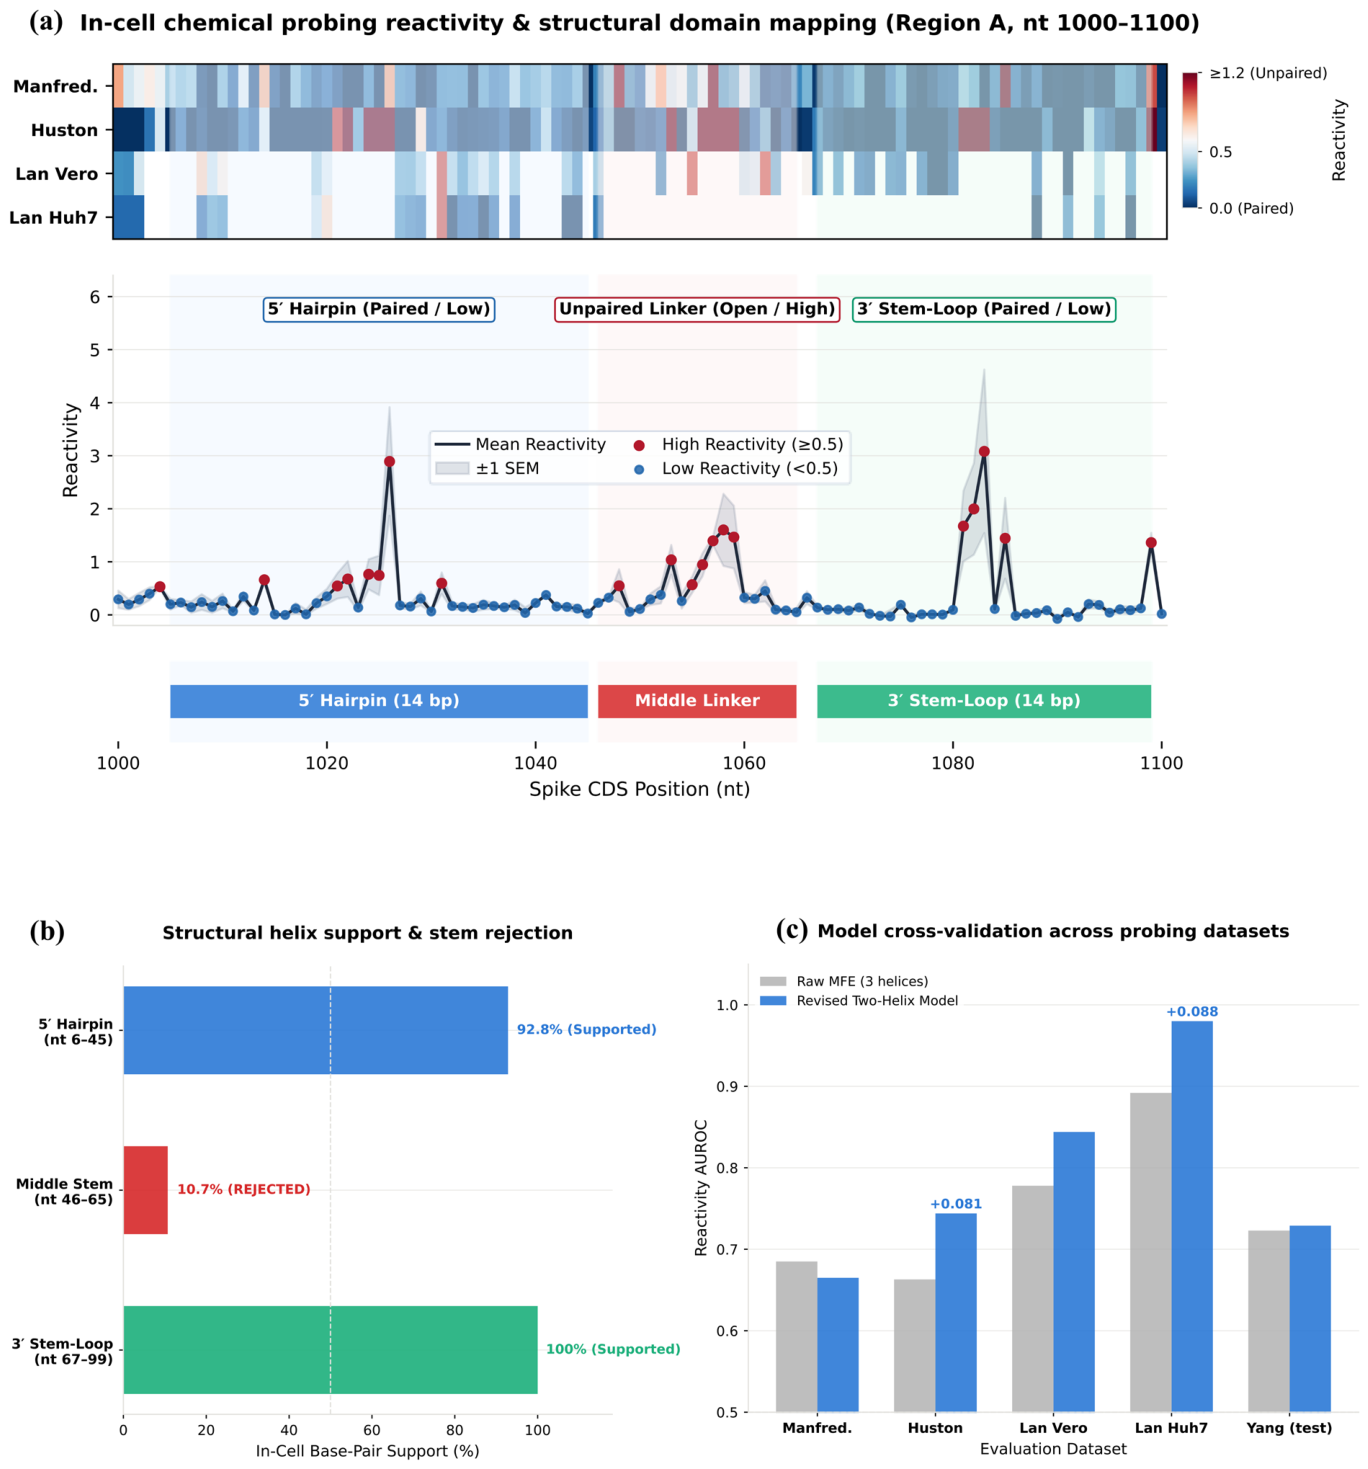
Figure 7.
Molecular-dynamics analysis reveals persistent local domains and linker-mediated motion in Region A constructs. (a) Backbone RMSD for duplicate 500-ns simulations of the full 101-nt Region A window and the isolated 70-nt core. (b) Domain RMSD and inter-domain centre-of-mass distance for the full construct. (c) Per-residue RMSF along the full 101-nt sequence, showing elevated flexibility in linker and terminal regions. (d) Radius of gyration for both constructs. (e) Persistence of reference base pairs over the trajectories; most pairs remain highly persistent, while a terminal fraying locus has reduced persistence.
Figure 7.
Molecular-dynamics analysis reveals persistent local domains and linker-mediated motion in Region A constructs. (a) Backbone RMSD for duplicate 500-ns simulations of the full 101-nt Region A window and the isolated 70-nt core. (b) Domain RMSD and inter-domain centre-of-mass distance for the full construct. (c) Per-residue RMSF along the full 101-nt sequence, showing elevated flexibility in linker and terminal regions. (d) Radius of gyration for both constructs. (e) Persistence of reference base pairs over the trajectories; most pairs remain highly persistent, while a terminal fraying locus has reduced persistence.
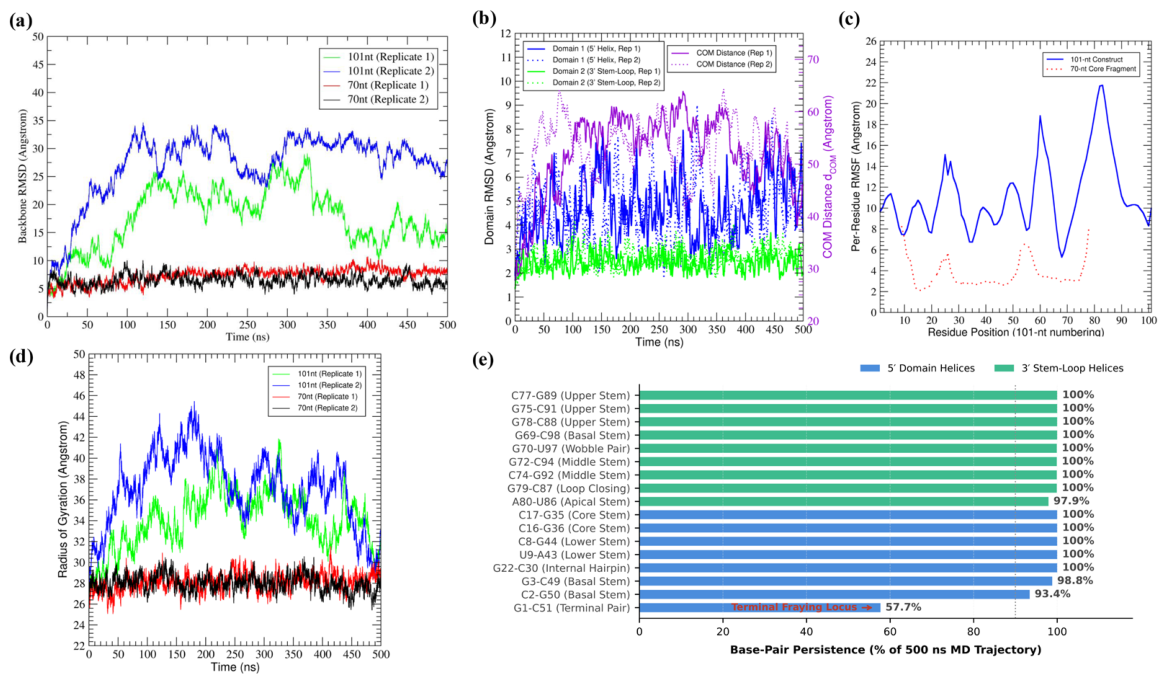

Table 1.
The three conserved, window-robust structured loci returned by the screen, with their coordinates in the spike-CDS frame, their protein register, and their structural or functional context on the spike protein.
Table 1.
The three conserved, window-robust structured loci returned by the screen, with their coordinates in the spike-CDS frame, their protein register, and their structural or functional context on the spike protein.
| Locus | Spike CDS (nt) | Protein register | Structural / functional context on the protein |
| Region A | 1000–1100 | aa 334–367 | Receptor-binding domain (RBD); spans the N343 glycosylation site |
| Region B | 1400–1500 | aa 467–500 | Receptor-binding motif (RBM); spans E484 |
| Region C | 2350–2450 | aa 784–817 | Region immediately upstream of, and including, the S2’ cleavage site |
Table 2.
Native folding, statistical significance and ensemble properties of the three conserved loci returned by the screen. Folding free energies are minimum-free-energy and ensemble values at 37 °C on the Wuhan-Hu-1 reference sequence. The z-scores and empirical p-values are computed against 50 mononucleotide and 50 dinucleotide-preserving shuffles per region; p = 0.020 is the minimum resolvable value at this shuffle count. Base-pair entropy is an unnormalised sum over predicted base pairs and is comparable across these regions because all three windows are of equal length. Bolded entries are the operative significance criterion (z_dinuc ≤ −2, p ≤ 0.05) and the ensemble descriptors that distinguish Region A from the other two loci.
Table 2.
Native folding, statistical significance and ensemble properties of the three conserved loci returned by the screen. Folding free energies are minimum-free-energy and ensemble values at 37 °C on the Wuhan-Hu-1 reference sequence. The z-scores and empirical p-values are computed against 50 mononucleotide and 50 dinucleotide-preserving shuffles per region; p = 0.020 is the minimum resolvable value at this shuffle count. Base-pair entropy is an unnormalised sum over predicted base pairs and is comparable across these regions because all three windows are of equal length. Bolded entries are the operative significance criterion (z_dinuc ≤ −2, p ≤ 0.05) and the ensemble descriptors that distinguish Region A from the other two loci.
| Region | Native MFE (kcal mol⁻¹) | Ensemble ΔG (kcal mol⁻¹) | z_mono | z_dinuc | p_dinuc | MFE frequency | Ensemble diversity | Base-pair entropy |
| A | −32.6 | −33.57 | −3.22 | −3.39 | 0.020 | 20.9% | 6.55 | 6.95 |
| B | −14.9 | −17.92 | −0.31 | +0.44 | 0.686 | 0.75% | 35.35 | 41.81 |
| C | −12.7 | −14.24 | −2.25 | −1.65 | 0.078 | 8.19% | 12.40 | 16.67 |
Table 3.
Base-pair agreement between the RNAfold MFE structure and the MXfold2 prediction for each of the three regions. Base pairs were matched by exact position with no slippage tolerance. Precision is computed with the RNAfold structure as reference. Bolded entries denote the region carried forward to three-dimensional modelling.
Table 3.
Base-pair agreement between the RNAfold MFE structure and the MXfold2 prediction for each of the three regions. Base pairs were matched by exact position with no slippage tolerance. Precision is computed with the RNAfold structure as reference. Bolded entries denote the region carried forward to three-dimensional modelling.
| Region | Physics bp | ML bp | Common | Precision | Recall | F1 | Class |
| A | 34 | 33 | 33 | 1.00 | 0.97 | 0.99 | Method-independent structure |
| B | 23 | 15 | 5 | 0.33 | 0.22 | 0.26 | Not method-independent |
| C | 11 | 8 | 8 | 1.00 | 0.73 | 0.84 | Reproducible core |
Table 4.
Covariation analysis of the two regions carried forward. Expected pair counts are R-scape power estimates given the substitutions present in the 58-sarbecovirus alignment; mean identity is R-scape’s internal pairwise identity calculation for each alignment. Significance threshold E ≤ 0.05, fixed in advance. Region B was not tested; see text.
Table 4.
Covariation analysis of the two regions carried forward. Expected pair counts are R-scape power estimates given the substitutions present in the 58-sarbecovirus alignment; mean identity is R-scape’s internal pairwise identity calculation for each alignment. Significance threshold E ≤ 0.05, fixed in advance. Region B was not tested; see text.
| Region | Sequences × columns | Mean pairwise identity | Expected covarying pairs (power) | Observed (E ≤ 0.05) | Interpretation |
| A | 58 × 101 | 81.6% | 2.1 ± 1.2 | 1 (columns 46–47; E = 0.0044) | Inconclusive — adjacent positions; not paired in consensus fold; the proposed pairing is a zero-loop hairpin and cannot exist |
| C | 58 × 101 | 84.9% | 1.2 ± 1.0 | 0 | Non-informative — alignment underpowered |
| B | — | — | — | Not tested | Did not clear thermodynamic filter |
Table 5.
Cross-tool comparison of the 70-nt core predictions, at the same-fold threshold of 0.45.
| Tool | Within-tool TM-score_RNA | Between-tool comparison | Classification |
| Boltz-2 | 0.65 | 0.53 vs AlphaFold3 | In cross-tool cluster |
| AlphaFold3 | 0.56 | 0.53 vs Boltz-2 | In cross-tool cluster |
| FARFAR2 | 0.45 | < 0.45 vs the Boltz-2/AlphaFold3 cluster | Distinct, internally split fold |
| DRfold2 | 0.38 | < 0.45 vs all others | Non-convergent |
| Emergent | 0.36 | < 0.45 vs all others | Non-convergent |
| RhoFold+ | n/a (1 model) | 0.25 vs Boltz-2, 0.26 vs AlphaFold3, 0.25 vs FARFAR2 | Not testable for convergence |
| RNAComposer | n/a (1 model) | 0.32 vs Boltz-2, 0.34 vs AlphaFold3 | Not testable for convergence |
Table 6.
Domain-resolved structural comparison of the 101-nt models. Values are mean pairwise C1’ RMSD (Å) within each tool’s model set, using exact residue-to-residue superposition without outlier rejection.
Table 6.
Domain-resolved structural comparison of the 101-nt models. Values are mean pairwise C1’ RMSD (Å) within each tool’s model set, using exact residue-to-residue superposition without outlier rejection.
| Tool | n | Global | D1 (5’ domain) | D2 (3’ domain) | Hinge |
| Boltz-2 | 10 | 10.30 | 4.43 | 3.13 | 20.61 |
| FARFAR2 | 10 | 15.55 | 5.54 | 2.07 | 45.13 |
| AlphaFold3 | 5 | 33.47 | 14.71 | 2.50 | 73.69 |
| DRfold2 | 5 | 17.25 | 11.74 | 3.18 | 43.86 |
| Emergent | 7 | 16.89 | 6.30 | 4.80 | 51.27 |
Table 7.
Agreement between the four in-cell reactivity-constrained models and the RNAfold MFE structure of each region. AUROC tests whether reactivity discriminates predicted-paired from predicted-unpaired positions (200-shuffle permutation null; p = 0.005 is the floor of the test). F1 scores base-pair agreement against each laboratory’s own reactivity-constrained model. The Lan DMS (Huh7) dataset is unpopulated for Region C because read depth over that locus was 0 %, preventing structural scoring.
Table 7.
Agreement between the four in-cell reactivity-constrained models and the RNAfold MFE structure of each region. AUROC tests whether reactivity discriminates predicted-paired from predicted-unpaired positions (200-shuffle permutation null; p = 0.005 is the floor of the test). F1 scores base-pair agreement against each laboratory’s own reactivity-constrained model. The Lan DMS (Huh7) dataset is unpopulated for Region C because read depth over that locus was 0 %, preventing structural scoring.
| Dataset | Region A AUROC (p) | Region A F1 | Region B F1 | Region C F1 |
| Manfredonia SHAPE | 0.685 (0.005) | 0.85 | 0.24–0.30 | 0.73 |
| Huston SHAPE-MaP | 0.663 (0.010) | 0.85 | 0.24–0.30 | 0.59 |
| Lan DMS (Vero) | 0.778 (0.005) | 0.83 | 0.24–0.30 | 0.84 |
| Lan DMS (Huh7) | 0.892 (0.005) | 0.85 | 0.24–0.30 | — |
Table 8.
Leave-one-out AUROC for three candidate structural models against each in-cell dataset, and against the held-out Yang dataset without modification.
Table 8.
Leave-one-out AUROC for three candidate structural models against each in-cell dataset, and against the held-out Yang dataset without modification.
| Dataset | Raw MFE | MFE, middle stem removed | Probing-supported consensus |
| Manfredonia | 0.685 | 0.709 | 0.665 |
| Huston | 0.663 | 0.661 | 0.744 |
| Lan (Vero) | 0.778 | 0.849 | 0.844 |
| Lan (Huh7) | 0.892 | 0.903 | 0.980 |
| Yang (held-out) | 0.723 | 0.716 | 0.729 |
Table 9.
Comparative dynamic metrics and trajectory convergence/plateau analysis across 500 ns MD production trajectories.
Table 9.
Comparative dynamic metrics and trajectory convergence/plateau analysis across 500 ns MD production trajectories.
| System / Domain / Metric | Replicate 1 | Replicate 2 / 3 | Overall Consensus | Final 200 ns Rolling Slope (Å/ns) | Final 200 ns SD (Å) | Plateau Status (< 0.01 Å ns⁻¹, SD < 1.0 Å) |
| 101-nt Domain 2 (3’ Stem-Loop, nt 67–101) | 2.48 ± 0.50 Å | 2.67 ± 0.56 Å | 2.58 ± 0.53 Å | +0.0004 / +0.0025 | 0.53 / 0.53 | Satisfied (Strict Equilibrium Plateau) |
| 101-nt Domain 1 (5’ Helix, nt 1–51) | 4.73 ± 1.30 Å | 4.57 ± 1.31 Å | 4.65 ± 1.30 Å | +0.0136 / −0.0010 | 1.33 / 1.39 | Intermediate (Slope Near-Zero; Fluctuation Driven by G1–C51 Fraying) |
| 101-nt Global Backbone (Full 0–500 ns) | 17.72 ± 5.45 Å | 27.18 ± 5.87 Å | 22.45 ± 5.66 Å | −0.0546 / −0.0280 | 4.27 / 2.01 | Not Applicable (Inter-Domain Hinge Motion) |
| 101-nt Global Backbone (Post 50 ns Opening) | 18.77 ± 4.59 Å | 28.82 ± 3.04 Å | 23.80 ± 6.27 Å | −0.0546 / −0.0280 | 4.27 / 2.01 | Not Applicable (Sustained Inter-Domain Separation) |
| 101-nt Inter-Domain COM Distance | 52.26 ± 7.50 Å (27.5–64.4 Å) | 53.11 ± 5.47 Å (27.3–65.2 Å) | 52.69 ± 6.49 Å | — | — | Concordant Sampling Range Across Replicates |
| 101-nt Linker Fluctuation (nt 52–66 RMSF) | 17.7–24.8 Å | 18.5–26.2 Å | 17.7–26.2 Å | — | — | Single-Stranded Flexible Hinge Locus |
| 70-nt Excised Core Global RMSD | 7.35 ± 1.15 Å | 6.51 ± 1.00 Å | 6.93 ± 1.08 Å | +0.0005 / −0.0047 | 0.71 / 0.92 | Satisfied Plateau (Non-Native Fold) |
| 70-nt Excised Core Backbone RMSD | 6.10 ± 1.02 Å | 6.09 ± 0.96 Å | 6.09 ± 0.99 Å | −0.0003 / −0.0062 | 0.84 / 0.91 | Satisfied Plateau (Non-Native Fold) |
Disclaimer/Publisher’s Note: The statements, opinions and data contained in all publications are solely those of the individual author(s) and contributor(s) and not of MDPI and/or the editor(s). MDPI and/or the editor(s) disclaim responsibility for any injury to people or property resulting from any ideas, methods, instructions or products referred to in the content. |
© 2026 by the authors. Licensee MDPI, Basel, Switzerland. This article is an open access article distributed under the terms and conditions of the Creative Commons Attribution (CC BY) license (http://creativecommons.org/licenses/by/4.0/).
Copyright: This open access article is published under a Creative Commons CC BY 4.0 license, which permit the free download, distribution, and reuse, provided that the author and preprint are cited in any reuse.