

Submitted:
02 September 2026
Posted:
04 September 2026
You are already at the latest version
Abstract
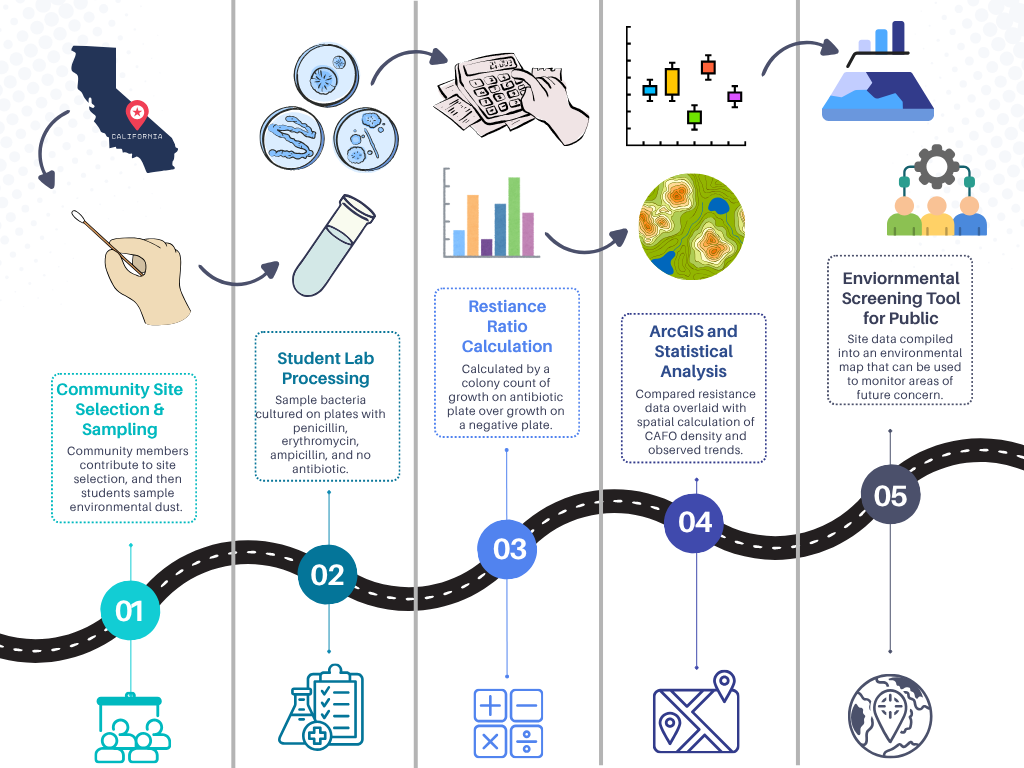
Environmental antibiotic-resistant bacteria (ARB) are a growing public health concern, yet monitoring data remain sparse for many exposure-relevant matrices. Particles can transport bacteria carrying resistance determinants, particularly in regions impacted by concentrated animal feeding operations (CAFOs). We adapted a low-cost, culture-based screening approach used for soil in course-based environmental surveillance to settled dust and deployed it through a community-engaged course-based undergraduate research experience (CURE). Because soil protocols did not transfer directly, we first identified antibiotics and concentrations that resolved differences among sites. Students then collected dust from 25 sites in Kern and Tulare Counties, California, spanning a gradient of CAFO density, and determined resistance ratios (RRs; CFU on antibiotic-amended plates / CFU on antibiotic-free plates) on agar containing penicillin, erythromycin, or ampicillin. Mean RRs (a relative screening index, not an absolute measure of resistance prevalence) were consistently higher at high-density sites (penicillin: 20% vs. 3%; erythromycin: 11% vs. 1%; ampicillin: 7% vs. 1%), and student-generated GIS maps showed correspondence between animal density and RRs. This work demonstrates that a protocol simple enough for undergraduate coursework, and for a community workshop in which local residents generated their own RRs, can produce spatially interpretable antimicrobial resitance data from an underexamined matrix.
Keywords:
antimicrobial resistance
; antibiotic-resistant bacteria
; settled dust
; concentrated animal feeding operations
; environmental surveillance
; resistance ratio
; course-based undergraduate research experience
; geographic information systems
1. Introduction
Antimicrobial resistance (AMR) is a global and growing threat, driven in large part by the misuse and overuse of antibiotics, and the environment is increasingly recognized as a reservoir and conduit for its spread. In 2019, an estimated 4.95 million deaths were associated with bacterial AMR worldwide, of which 1.27 million were directly attributable — a burden exceeding that of HIV or malaria [1]. Recent modeling projects that attributable deaths will rise to approximately 1.91 million annually by 2050, with more than 39 million cumulative deaths attributable to AMR between 2025 and 2050 [2].
Concentrated animal feeding operations (CAFOs) are recognized sources of antibiotic-resistant bacteria (ARB), as antibiotics are used in livestock to treat and prevent disease and to promote growth. Global livestock production used an estimated 110,777 metric tons of antibiotics in 2019, projected to reach 143,481 metric tons by 2040 if current trends continue. This use selects for resistant organisms and promotes their release into the surrounding environment through multiple routes, including manure application, water, bioaerosols, and dust [3,4,5]. Aerosolization from CAFOs carries ARB into the atmosphere along with fur, feathers, saliva, and feces [5,6,7].
Aerosolized ARB and antibiotic resistance genes (ARGs) have been detected across the particle size spectrum, in fine (PM2.5), coarse (PM10-2.5), and larger particles [8,9]. These size fractions behave very differently. Fine particles, generated largely by droplet emission and subsequent evaporation, can remain suspended for days and travel tens to hundreds of kilometers [10]. Coarse and larger particles, which dominate wind-driven suspension of soil and surface material, are removed efficiently by gravitational settling and typically travel tens to hundreds of meters before deposition [8,11]. Deposited material can be resuspended repeatedly, but because resuspended mass is dominated by coarse and larger particles, ARB and ARGs that have settled — regardless of the size fraction in which they were originally emitted — are transported only over short distances with each cycle [12,13,14]. Settled dust near CAFOs should therefore exhibit a steep spatial gradient in resistance, a prediction that is directly testable with site-level sampling.
Consistent with this expectation, studies of residential dust downwind of dairy and poultry operations have found that livestock density is associated with AMR markers in both airborne and settled dust, suggesting that livestock-associated resistance reaches nearby residential communities [15,16]. Dust is an exposure-relevant matrix in its own right: humans encounter settled and resuspended particles through inhalation as well as hand-to-mouth contact and incidental ingestion [13,17,18,19]. Despite this, ARB and ARGs in dust remain considerably less studied than in soil and water, and the influence of CAFOs on dust-borne resistance in particular is poorly characterized.
Closing this gap requires monitoring at a spatial density that conventional research programs are unlikely to achieve on their own, and it requires that findings reach the communities they concern. The One Health framework — which addresses health challenges through coordinated work across human, animal, and environmental health [20,21] — provides the conceptual basis for treating environmental AMR as an intersectional problem, but implementing it in practice depends on who collects the data and who receives it. Community-engaged approaches address both, expanding monitoring coverage while sharing knowledge of health risks and supporting equitable responses in communities affected by CAFOs.
Existing methods, however, constrain where monitoring can happen. Conventional culture-based AMR characterization of environmental isolates generally requires containment practices and specialized facilities, and is time-consuming; DNA-based approaches are sensitive and specific but costly and dependent on technical expertise. What has been missing is a rapid, low-cost, taxon-nonspecific screening approach suited to distributed field deployment. Course-based undergraduate research experiences (CUREs) offer a natural setting for such an approach. CUREs are an inclusive pedagogy: every student enrolled in a course participates in authentic research, not only those able to secure a position in a research laboratory [22]. The Prevalence of Antibiotic Resistance in the Environment (PARE) project applies this model directly to environmental AMR, engaging students globally in supervised surveillance using a simple culture-based resistance measurement [23]. Current PARE curricular materials address soil and water; extending the protocol set to dust would expand the project's capacity to establish baselines and identify hotspots of environmental AMR.
Community-engaged research aims to transform the relationship between investigators, research participants and the public: rather than studying a community, researchers work alongside community partners to define questions, collect and interpret data, and return findings in forms partners find useful [24,25]. Its guiding principles—reciprocity, shared decision-making, and attention to locally meaningful problems—make it a compelling and natural fit for environmental antimicrobial resistance (AMR), where exposure pathways run through the air, water, soil, waste streams, and agricultural settings that residents know firsthand. In the case of AMR, student-generated data also addresses the current lack of monitoring data [23]. In a given moment as part of broader community-engaged research university to local organization partnerships local residents and researchers engagement can span a spectrum of participation, extending from brief community consultations to community driven agendas for change [26,27]. Embedding community engagement within a CURE and other forms of hands on student learning experience extends the documented benefits of course-based research. Undergraduates gain not only the ownership, iteration, and authentic discovery that define CUREs [28], but also a visible stake in who they are working with, and why it’s important to local communities. Students can learn how to communicate research findings to diverse audiences (and local residents), often in an accessible language. The motivation gained from a chance to impact “real world outcomes” can strengthen their commitment to carefully conducting the science and persisting in these fields. This is particularly true for students from groups historically underrepresented in STEM, who often report that relevance to their own communities is what sustains their engagement [29]. Students additionally practice competencies rarely developed at the bench alone, such as communicating to non-specialist audiences and recognizing science as a civic as well as a technical enterprise.
Here we extend this model in two directions: to settled particulate matter, a matrix not previously incorporated into CURE-based AMR surveillance, and to a landscape gradient of CAFO density in California's southern Central Valley. Because soil-based protocols do not transfer directly, we screened a panel of antibiotics and concentrations to identify conditions that discriminate among sites, and paired the resulting resistance ratios with student-generated GIS mapping. Our objectives were to: (1) apply community-engaged CUREs (CE-CUREs) as a means of expanding AMR monitoring in rural areas while providing hands-on training in microbiological and GIS techniques; (2) map CAFO density alongside resistance ratios in settled dust across the Central Valley; and (3) test for differences in particle-borne resistance among sites of low, medium, and high CAFO density.
2. Materials and Methods
2.1. Community Partnerships
2.1.1. Socially Responsible Agriculture Project (SRAP)
For more than 20 years, Socially Responsible Agriculture Project (SRAP), a 501(c)(3) nonprofit organization, has mobilized and assisted communities in protecting themselves from the adverse impacts caused by industrial livestock operations. SRAP advocates for a shift to a more just and resilient food system that does not involve raising animals in CAFOs. SRAP’s staff includes rural residents who have experienced first-hand the impact that CAFOs have had in their communities, technical experts, independent family farmers, and lawyers. SRAP serves as a resource for communities, offering free support, knowledge, and skills to protect their right to clean water, air, and soil.
2.1.2. Center on Race, Poverty and the Environment, CRPE
CRPE is a 501(c)(3) organization committed to addressing environmental injustice. They work alongside the most impacted communities to protect air, land, water, health, and economic security. Their approach involves collective action, community lawyering, and policy advocacy. CRPE previously partnered with Professor Christopher Bacon and students at Santa Clara University to study the prevalence of CAFOs in Kern County and if living in proximity to CAFOs impacted perceptions of ill health. That study showed that indeed, living within 2 km of a CAFO was associated with increased perception of adverse health impacts.
2.1.3. SocioEnvironmental and Education Network, SEEN
SEEN is a 501(c)(3) organization consisting of doctors, engineers, biologists, and education experts who are passionate about democratizing science and promoting justice through education to marginalized communities. SEEN serves California’s rural vulnerable communities by educating youth, adult community members and policy makers about climate change, water and air quality, and how to protect their families.
2.1.4. Community Partners Results Dissemination Event
CRPE, Santa Clara University, and UCLA co-hosted an event with residents and local leaders from environmental justice committees of Shafter, La Colonia, Arvin, Lamont, McFarland, and Delano, all communities in Kern County. The event was held at the CRPE headquarters in Delano and was conducted primarily in Spanish (with English translation for a subset of attendees). At the event, participants discussed preliminary data and possible follow up ideas. To deepen community member understanding of the science, all attendees participated in a hands-on activity to practice spreading plates, while a subset of community members participated in the processing of swabs of settled particulates from just outside the headquarters.
2.2. Course-Based Undergraduate Research Courses
This research was conducted primarily through two-unit, community-engaged hands-on courses that are offered as school-wide elective courses through the Henry Samueli School of Engineering and Applied Sciences at UCLA. The courses welcome students who are completely new to research, training them in background science, the scientific method, and relevant field and laboratory techniques. For this project, students participated in all activities, including method development, field trips, processing, data analysis and visualization, and writing. An introductory presentation to CUREs is provided in SI-3.
2.3. Study Area
Tulare and Kern Counties, in the Central Valley of California, are home to many concentrated animal feeding operations (CAFOs), which are known sources of environmental pollutants causing interconnected burdens, as community members experience documented elevated exposure to particulate matter, ozone, and drinking water contamination while simultaneously facing higher socioeconomic strain and food insecurity rates than the state average. The complexity of these stressors drives further study of the nexus of antibiotic resistance, environmental pathways, and impacted communities near CAFOs.
The Central Valley of California bears a disproportionate burden of environmental stress. The American Lung Association has deemed that Tulare has the “third-worst air quality” in the U.S. A recent study investigated the multiple stressors faced by residents of Tulare, including elevated levels of air, water, and soil pollution, lower socioeconomic status, low walkability, and low access to healthy food. Regarding pollution, Tulare residents face significantly higher exposures to fine particulate matter, ozone, pesticides, and drinking water contaminants, specifically volatile organics tetrachloroethene and 1,2,3-trichloropropane, nitrate, arsenic, manganese, and uranium, and unknown odorous chemicals. Tulare residents were shown to have significantly higher mortality rates in Alzheimer’s, diseases of the circulatory system, influenza, and pneumonia, compared to the CA state average [30].
We determined study sites with our collaborators CRPE, SEEN, and SRAP. A 10km buffer around each of the 25 sites to compute total animal units and cow headcounts within the radius using ArcGIS. Further, we found the distance to the nearest CAFO and listed all this data Table 1. Pristine sites are defined as not receiving any manure application and with no CAFOs within a 10km radius. Unimpacted (UI) sites are defined as having no CAFO within a 10km radius but with low manure application. Less agricultural impacted (LAI) sites are defined as those with animal headcount less than 150,000 within 10 km radius. Lastly, high agricultural impacted (HAI) sites were defined by animal headcounts higher than 150,000 within a 10km radius.
2.4. Sampling
Students collected environmental dust samples using four sterile collection swabs (Zymo Research) from publicly accessible, rain-protected surfaces. Each swab is used for a 1-ft section where it was swabbed four times going back and forth horizontally, with the swab rotated by one-quarter turn after each pass. The swabs are then placed into falcon tubes filled with Phosphate Buffer Solution (PBS) in a ratio of 3 swab/10mL PBS. The ‘dust’ collected with this method is a mix of deposited fine, coarse as well as larger particles.
2.5. Culture-Based Analysis
Figure 1.
Antibiotic Resistance Assessment Workflow in Dust Samples.
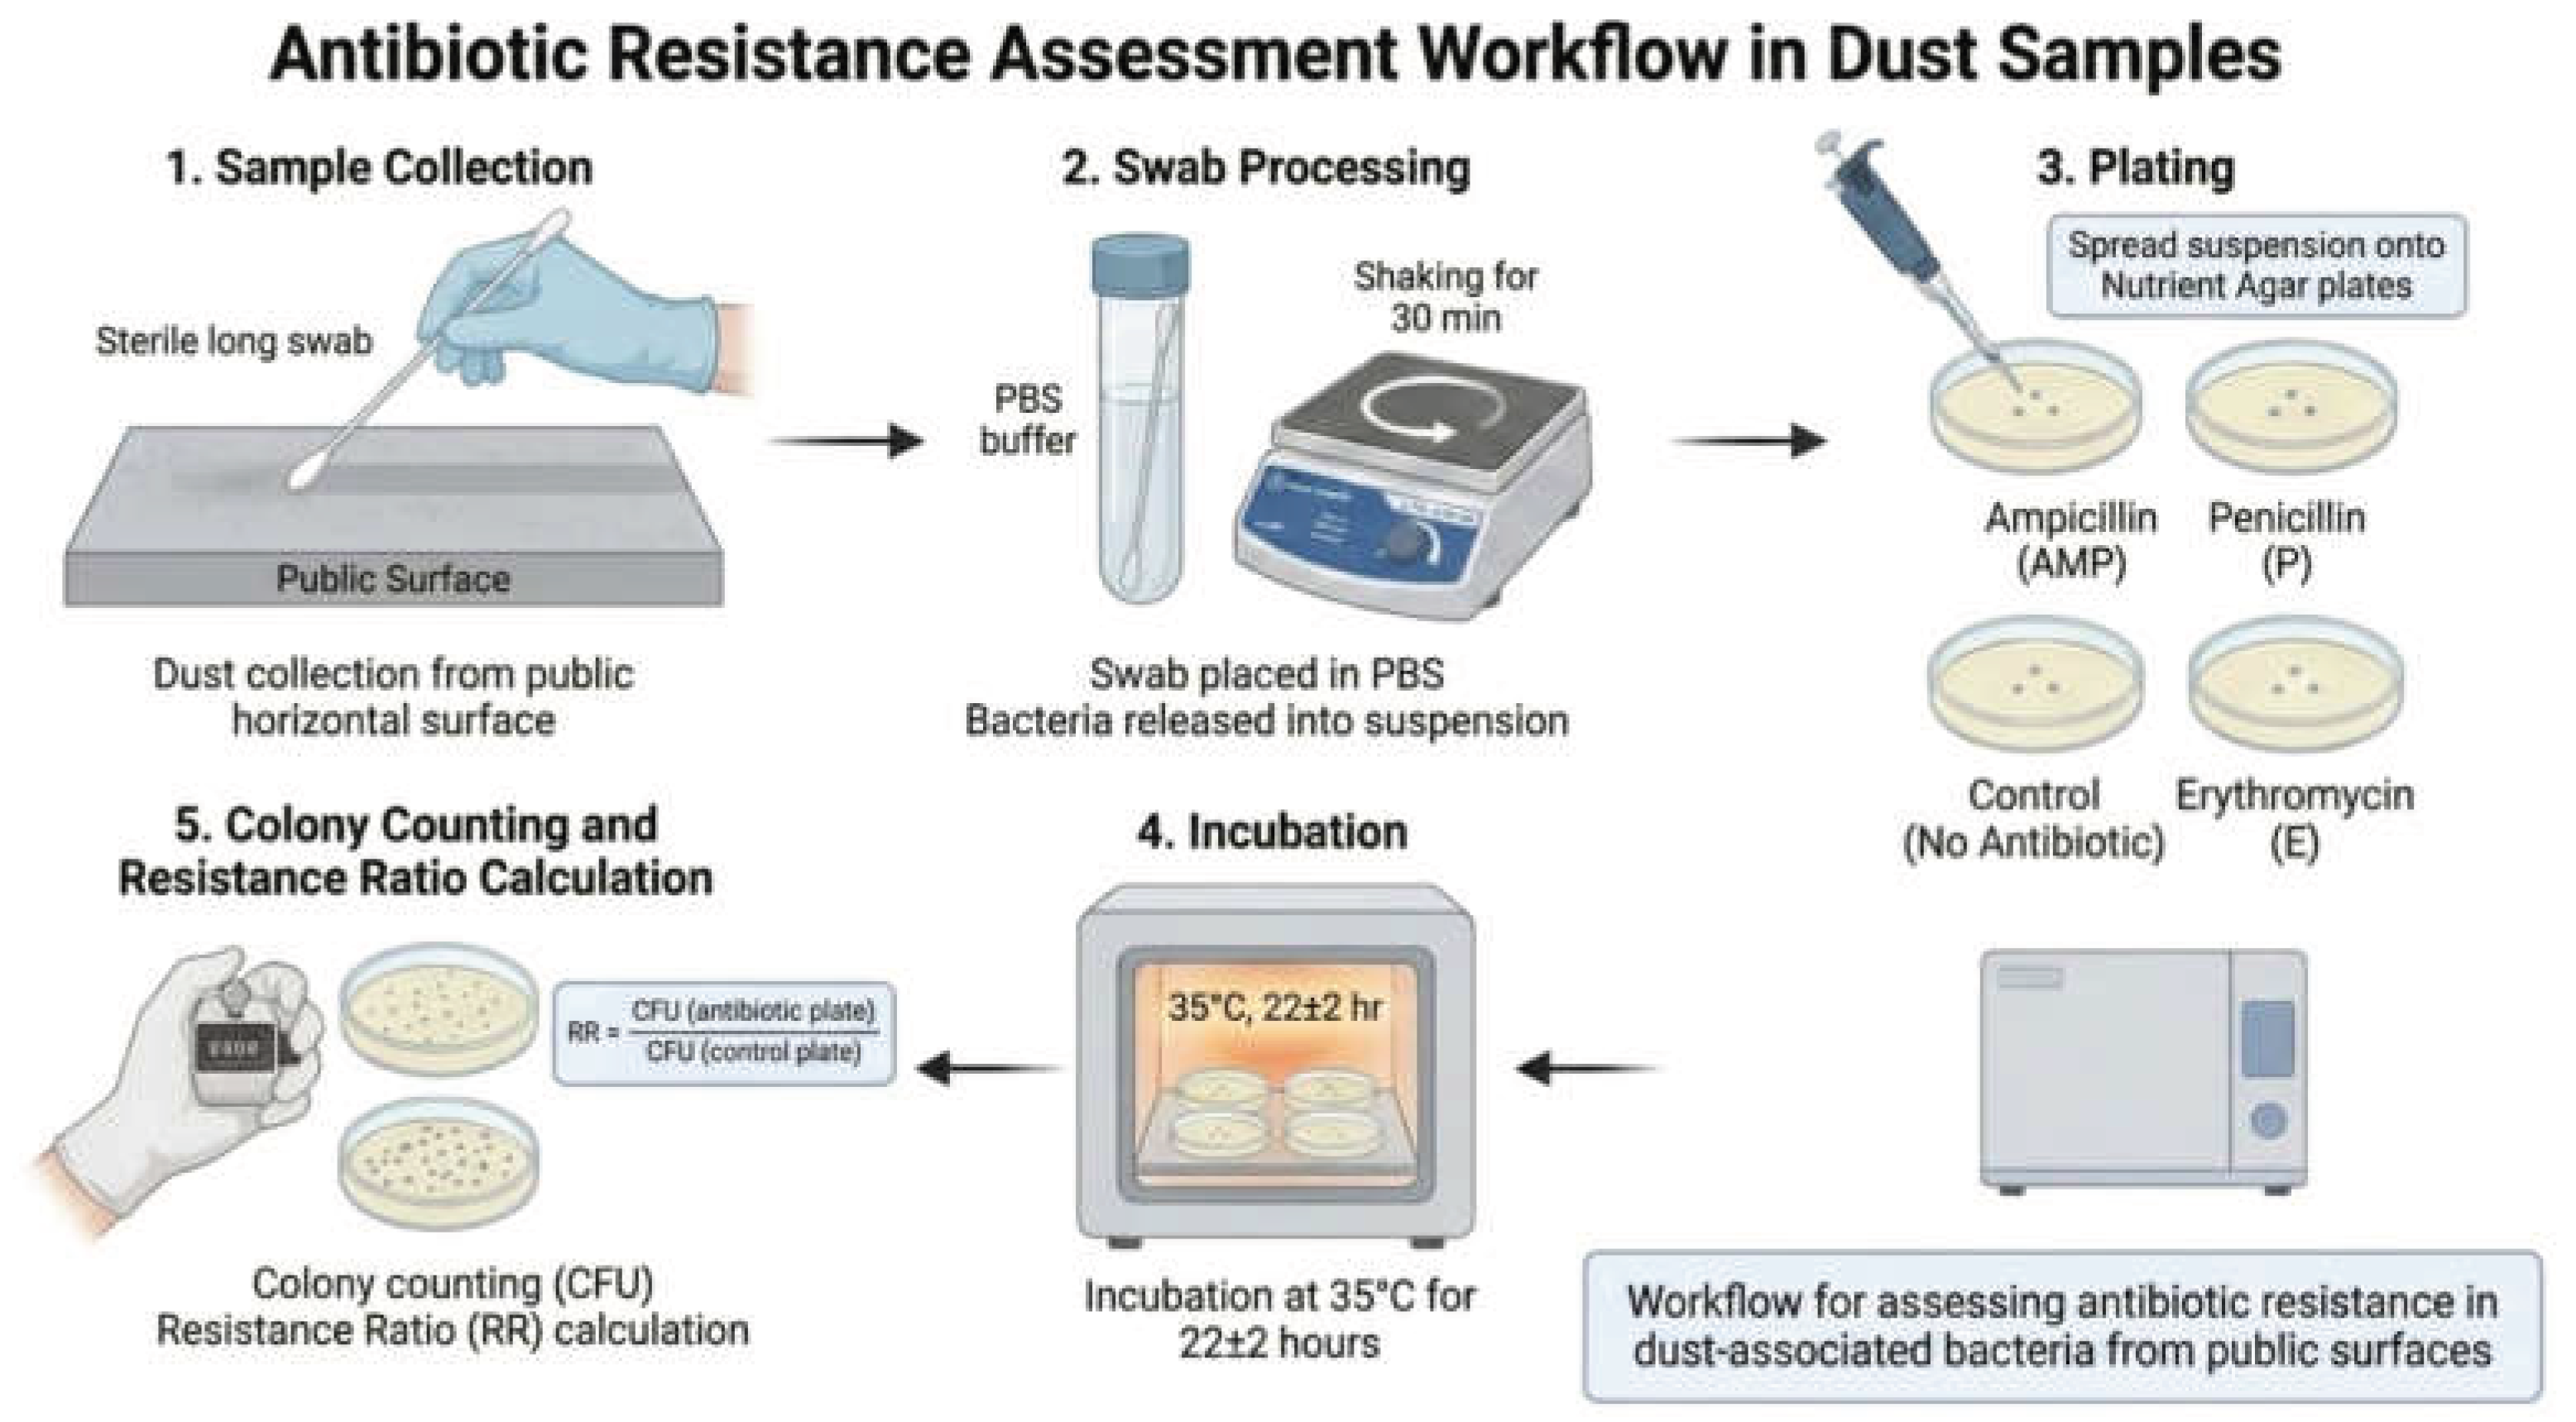
After sampling, the dust samples were kept in a cooler to preserve bacterial viability until they were processed on the same day. Before processing, the environmental dust samples were shaken with a wrist-action mechanical shaker for 30 minutes to ensure the sample is evenly mixed. Using serial dilution, 1:10 and 1:100 dilutions were prepared, and both undiluted and diluted samples were tested. A 100 µL of the aliquot of each shaken PBS sample was pipetted onto antibiotic free nutrient agar (NA) plates and antibiotic NA plates The agar plates are incubated for 24 hours (±2 hour) at 35℃.
Culture based analysis processed with nutrient agar (NA), a commonly used agar in cultivation for a variety of bacteria growth. NA plates were prepared with antibiotic amendments, while antibiotic-free plates served as controls. Antibiotic NA plates are amended by adding the appropriate concentration of antibiotic stock solution into autoclaved NA agar before pouring the plates. Before the addition of antibiotics, the agar was allowed to cool down to approximately 50-55℃, then 5mL of the antifungal solution (5mg/mL) was added into 500 mL of NA agar. Antifungal solution was made with 0.125g of Nystatin and 25mL of Dimethyl Sulfoxide. In our study, antibiotic NA plates were amended with 16 μg/ml erythromycin (E), 32 μg/ml ampicillin (AMP), and 2 μg/ml penicillin (P).
For this screening method, E, AMP, and P were chosen to assess AMR levels. All three antimicrobials are frequently used and approved for use in CAFOs, with E mostly used in poultry farms while AMP is used for a variety of livestock, and P is used for cattle and swine [31,32]. A previous study conducted from CAFO impacted surface waters found percentages up to 64% resistance to E and 67% resistance to AMP at impacted sites, suggesting E and AMP as potential effective indicators for screening, if the results from the dust samples corroborate with the high resistance found in surface waters [22,33]. Another study analyzing ARBs downwind of a CAFO documented 50% resistance to P from 25 meters downwind [34].
The chosen antibiotic concentrations in this study were determined by applying the maximum Clinical and Laboratory Standard Institute (CLSI) concentration (minimum zone diameter threshold) uniformly after rounding up all the bacterial types expected, comparing cutoffs, and choosing the most conservative concentration to overcome the need for bacterial-species identification [35]. Directly relating to the standard CLSI cutoff is not necessary for this screening method but it is used as a reference point because the bacteria are unknown.
2.6. Colony Counting Method and Calculating Resistance Ratio
Figure 2.
Flow Chart for Colony Counting Method.
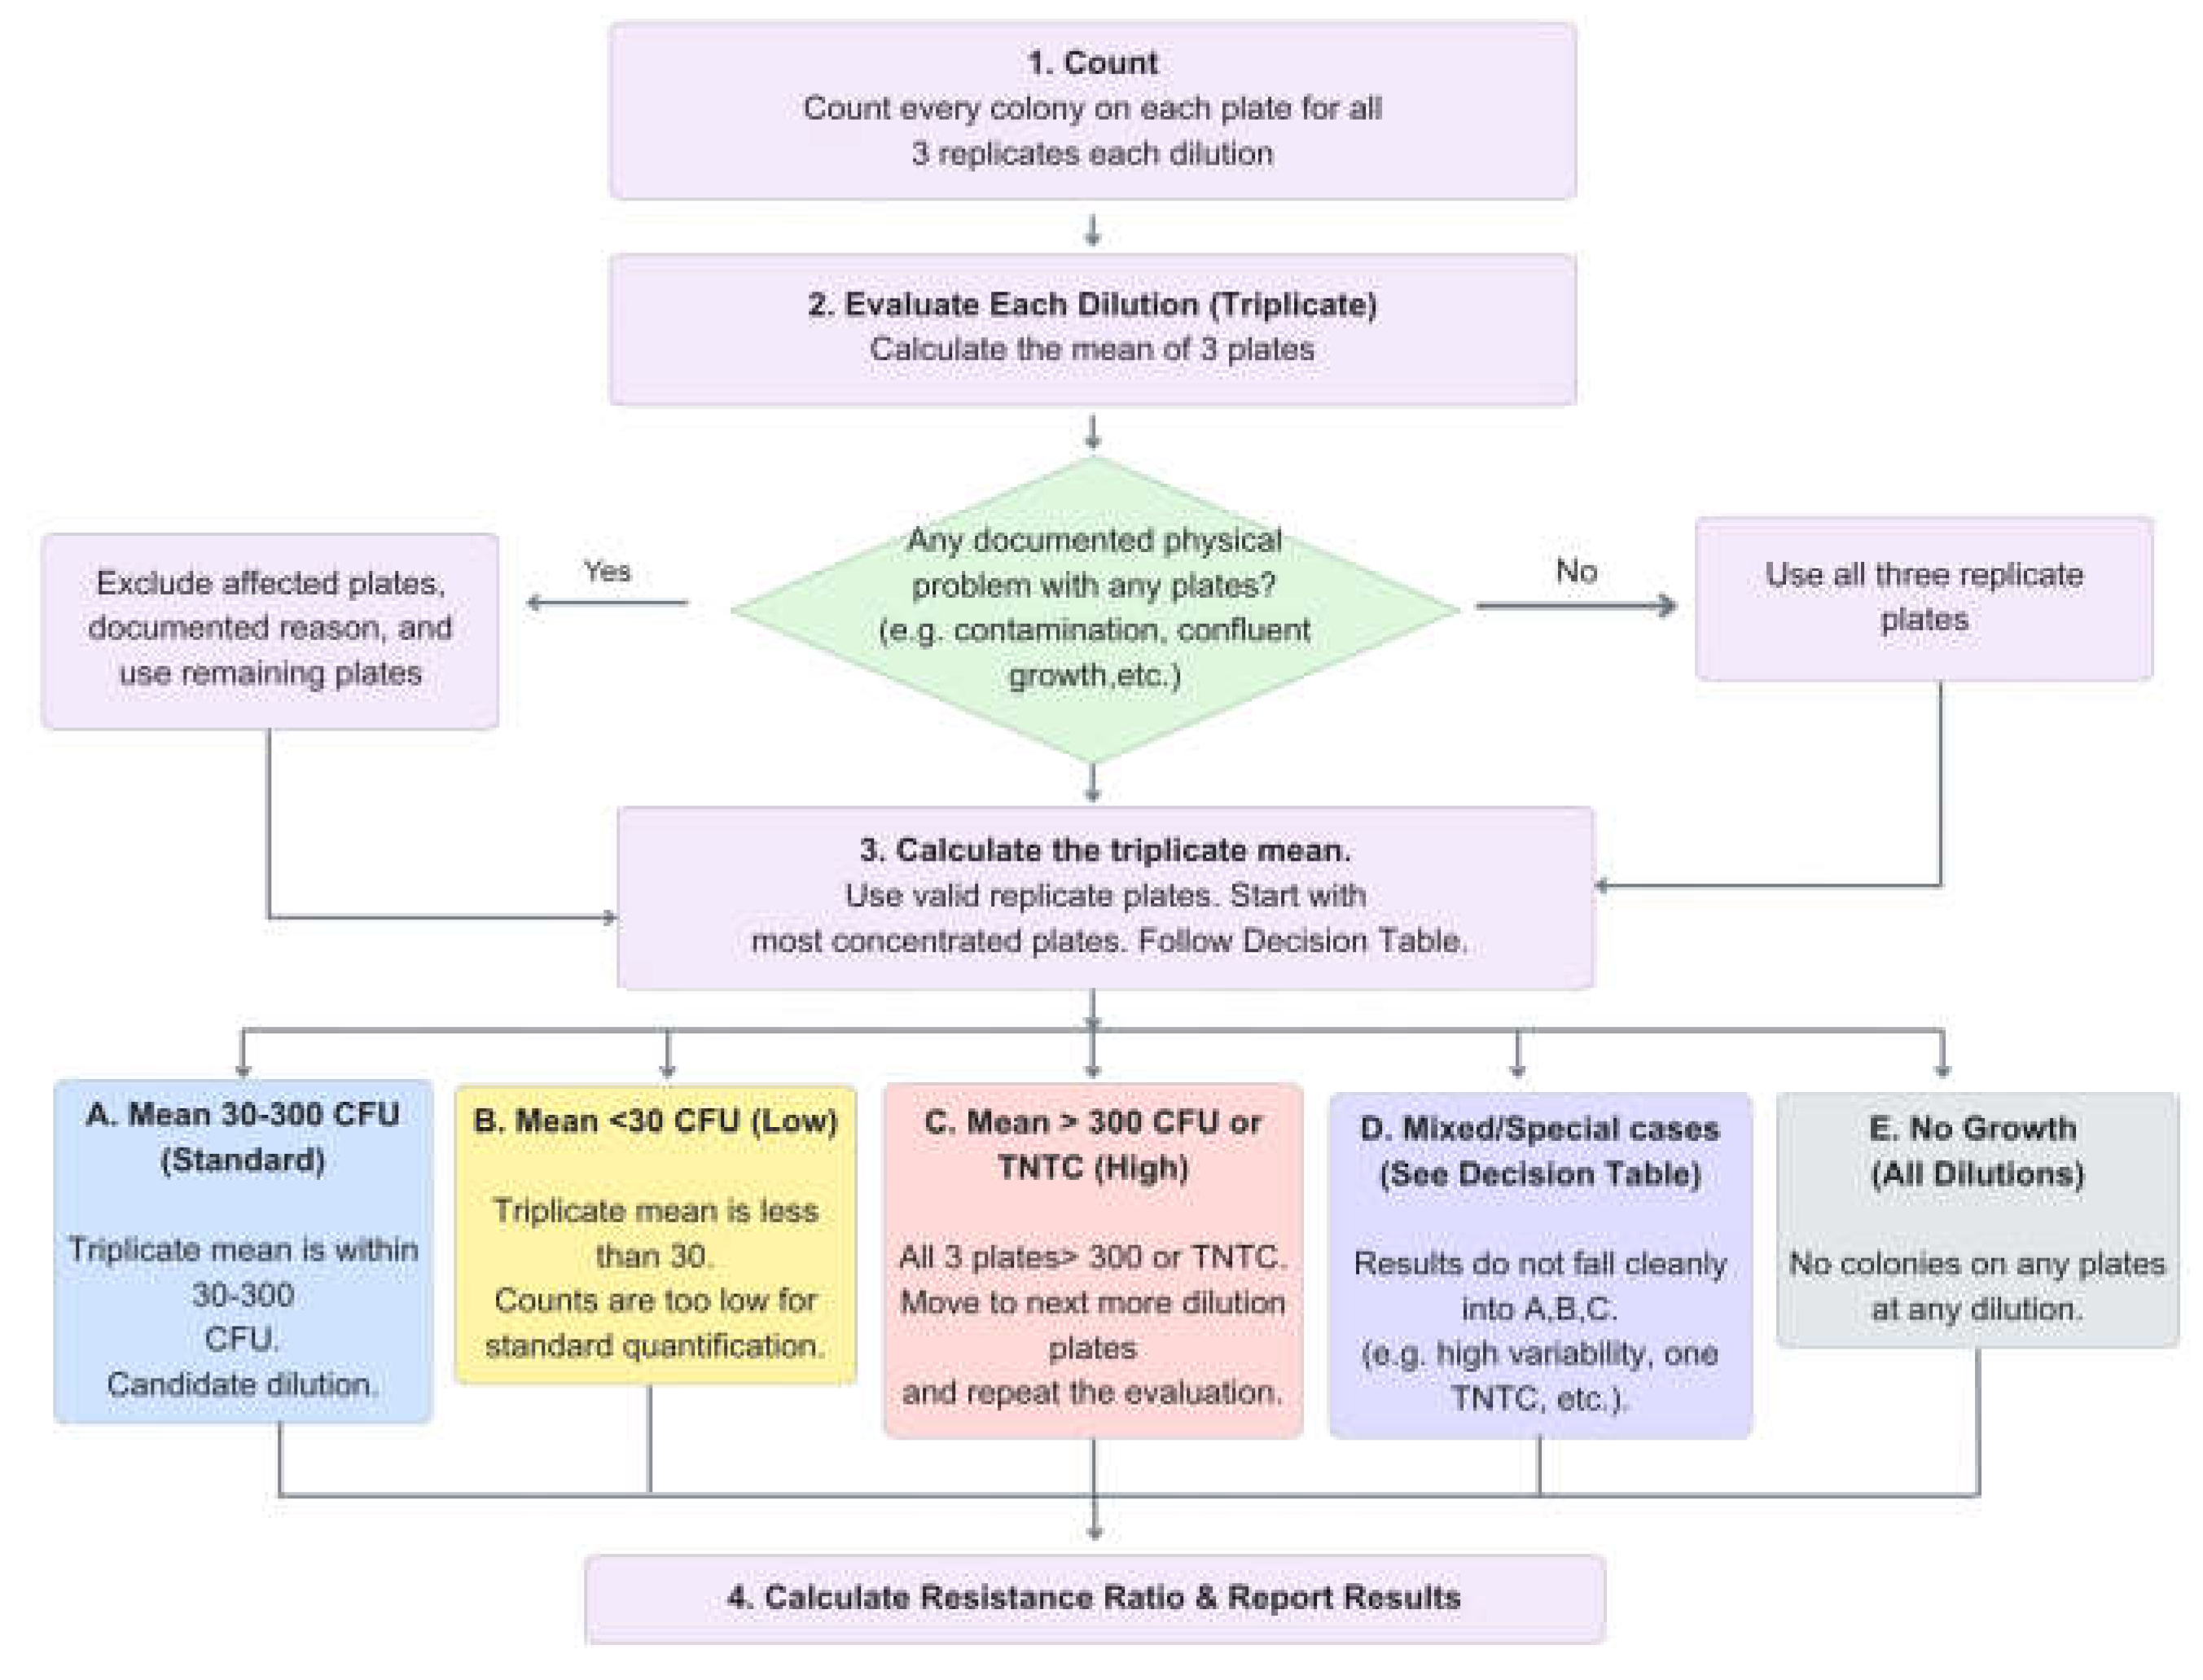

Table 2.
Decision Table for Colony Counting Method.
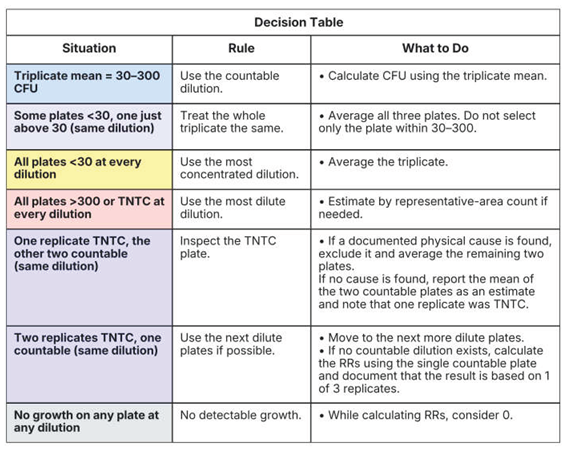 |
After 24 hours of incubation, resistance ratio was calculated by colony forming unit (CFU) counting method. The method used the previously established concept of the resistance ratio, calculated by comparing bacterial growth on antibiotic amended NA agar with growth on control agar using modified conventional colony counting cultured based analysis. Figure 2 summarizes the overall procedure from CFU counting to final reporting, while Table 2 guidance for how to count and report the colonies under the special cases. Teaching materials for this protocol in an undergraduate course format is also provided in SI-2.
To calculate the resistance ratios, the bacterial concentration in the original falcon tube (CFUs/mL Sample) was first calculated. The undiluted sample is assigned a factor of 1, 1:10 dilution has a dilution factor of 10, and 1:100 has a dilution factor of 100. The concentration in the original falcon tube (CFUs/mL Sample) and resistance ratios calculated as:
The calculation details are in SI-2.3.
2.7. Geospatial Analysis of CAFO Density
Figure 3.
All CAFO Density (left) and Cattle Density (right) map showing classification areas and sites in ArcGIS. The output values for the specific site classes are outlined in Figure 6.
Figure 3.
All CAFO Density (left) and Cattle Density (right) map showing classification areas and sites in ArcGIS. The output values for the specific site classes are outlined in Figure 6.
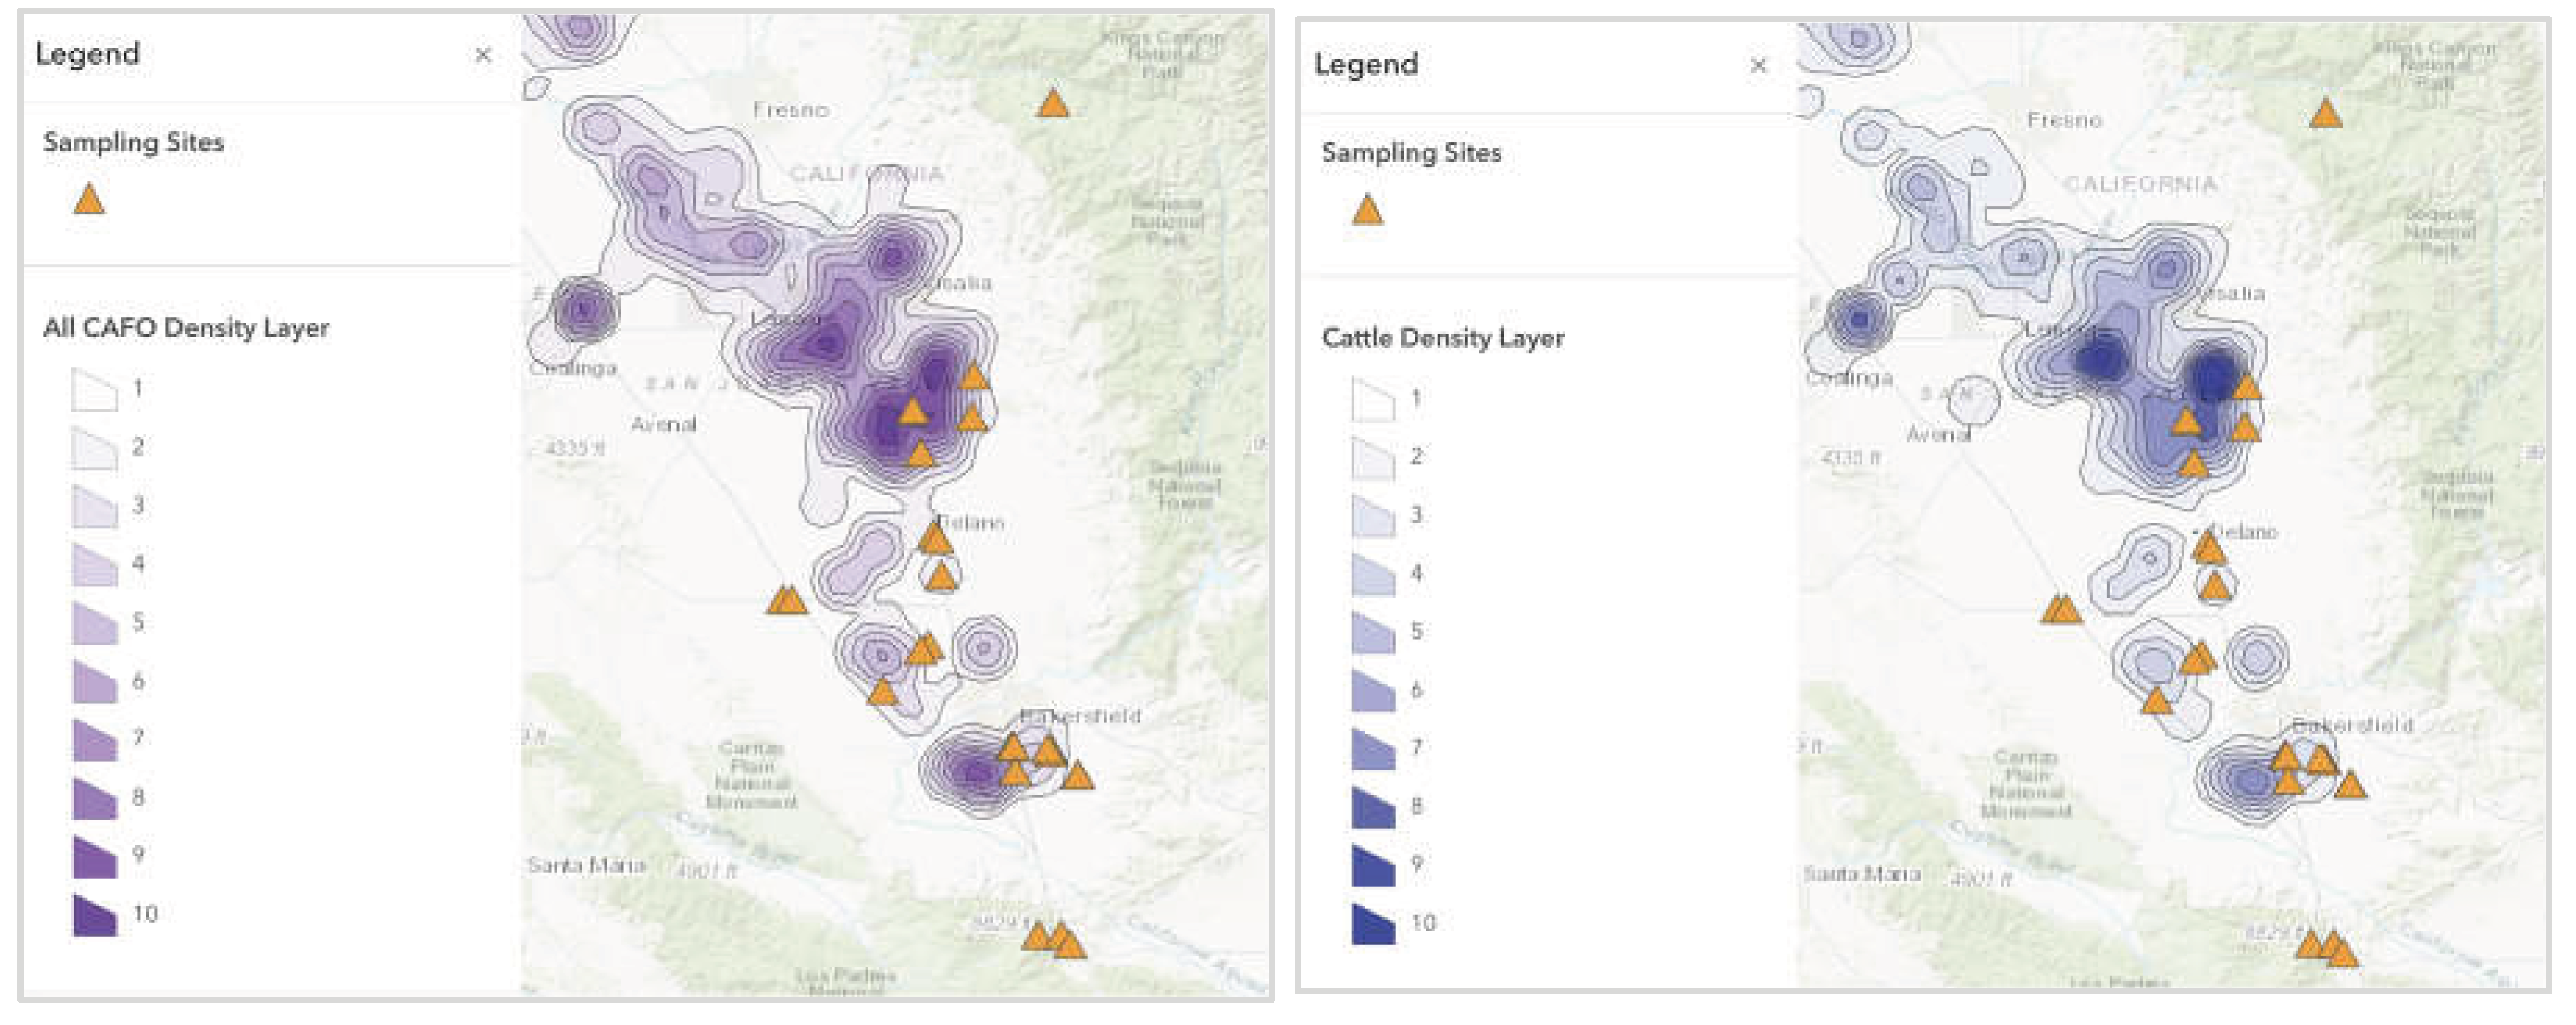
To identify the classification for CAFO, we used ArcGIS Online. To get a more in depth characterization of each site, and have CAFO impact weighted higher as facilities approach the site center, we wanted to supplement the simple buffer counts with a density layer. A spatial density calculation on ArcGIS measures a specific field, we did runs of both the sum of animal units per facility or headcount per facility. A new layer is then created by smoothing point data of each CAFO outward across a defined search distance, 10 km in our case. So, the layer creates a full spatial distribution of where all the CAFOS aggregated impact would spread. The Natural Breaks (Jenks) optimization algorithm automatically groups those raw, continuous map of density values into distinct polygon layers. Instead of making the steps equal sizes, the math positions boundaries precisely where the sharpest jumps and gaps occur in the data. This minimizes variance within each class while maximizing differences between classes, cleanly separating low-density background buffer zones from hyper-dense factory farm clusters. Each sample site of bacterial testing was then laid atop this density layer, so each of the 25 sampling sites could be given an All CAFO Density Class and Cattle Density Class on a scale of 1-10. A more detailed and teaching-oriented tutorial of this GIS workflow is provided in SI-1. These class values are displayed below in Figure 6, and the classes were used going forward for data analysis, specifically in Figure 7 and Figure 8. A manure application class layer was also created in the preliminary analysis process. Bar graphs showing the average RRs of E and P across the manure and cattle density classes are shown in SI-6 and SI-7. These later charts informed the decision to only go forward with observing the CAFO patterns in box-and-whisker plots.
2.8. Statistical Analysis
Uploading our data from a spreadsheet into matlab, we were able to generate box plots that then categorize our data into small, medium, and large levels of impact based on their density classifications. These plots also calculate the average from each of these three optimized bins for reference. Spearman correlation coefficients were then calculated in MatLab Online to quantify the statistical relationships between each independent variable’s, animal unit density or cattle density, and the resistance ratio antibiotic data. The R-values, or spearman rank coefficients, evaluates the strength and direction of the relationship in our data. Spearman r values range from -1.0 to +1.0, the sign of the value representing either a negative of positive relationship. Similarly, p-value is a measure of statistical strength against the null hypothesis. It directly signifies the probability that the observed correlation of data can be attributed to random chance. Thus, a small positive p-value, close to 0, would indicate that it is very unlikely the observed correlation could be achieved simply by the randomly ordered data, allowing rejection of this null hypothesis. For our purposes, we considered p < 0.05 as the threshold of sufficiency for rejection.
3. Results
3.1. Resistance Ratios Observed in Dust from Agriculturally-Impacted, Less Impacted, and Unimpacted Sites
Figure 4.
Resistance Ratios (%) across reference and CAFO-impaired sites 16 μg/mL of E (left), 32 μg/mL of AMP (middle), and 2 μg/mL of P (right).
Figure 4.
Resistance Ratios (%) across reference and CAFO-impaired sites 16 μg/mL of E (left), 32 μg/mL of AMP (middle), and 2 μg/mL of P (right).
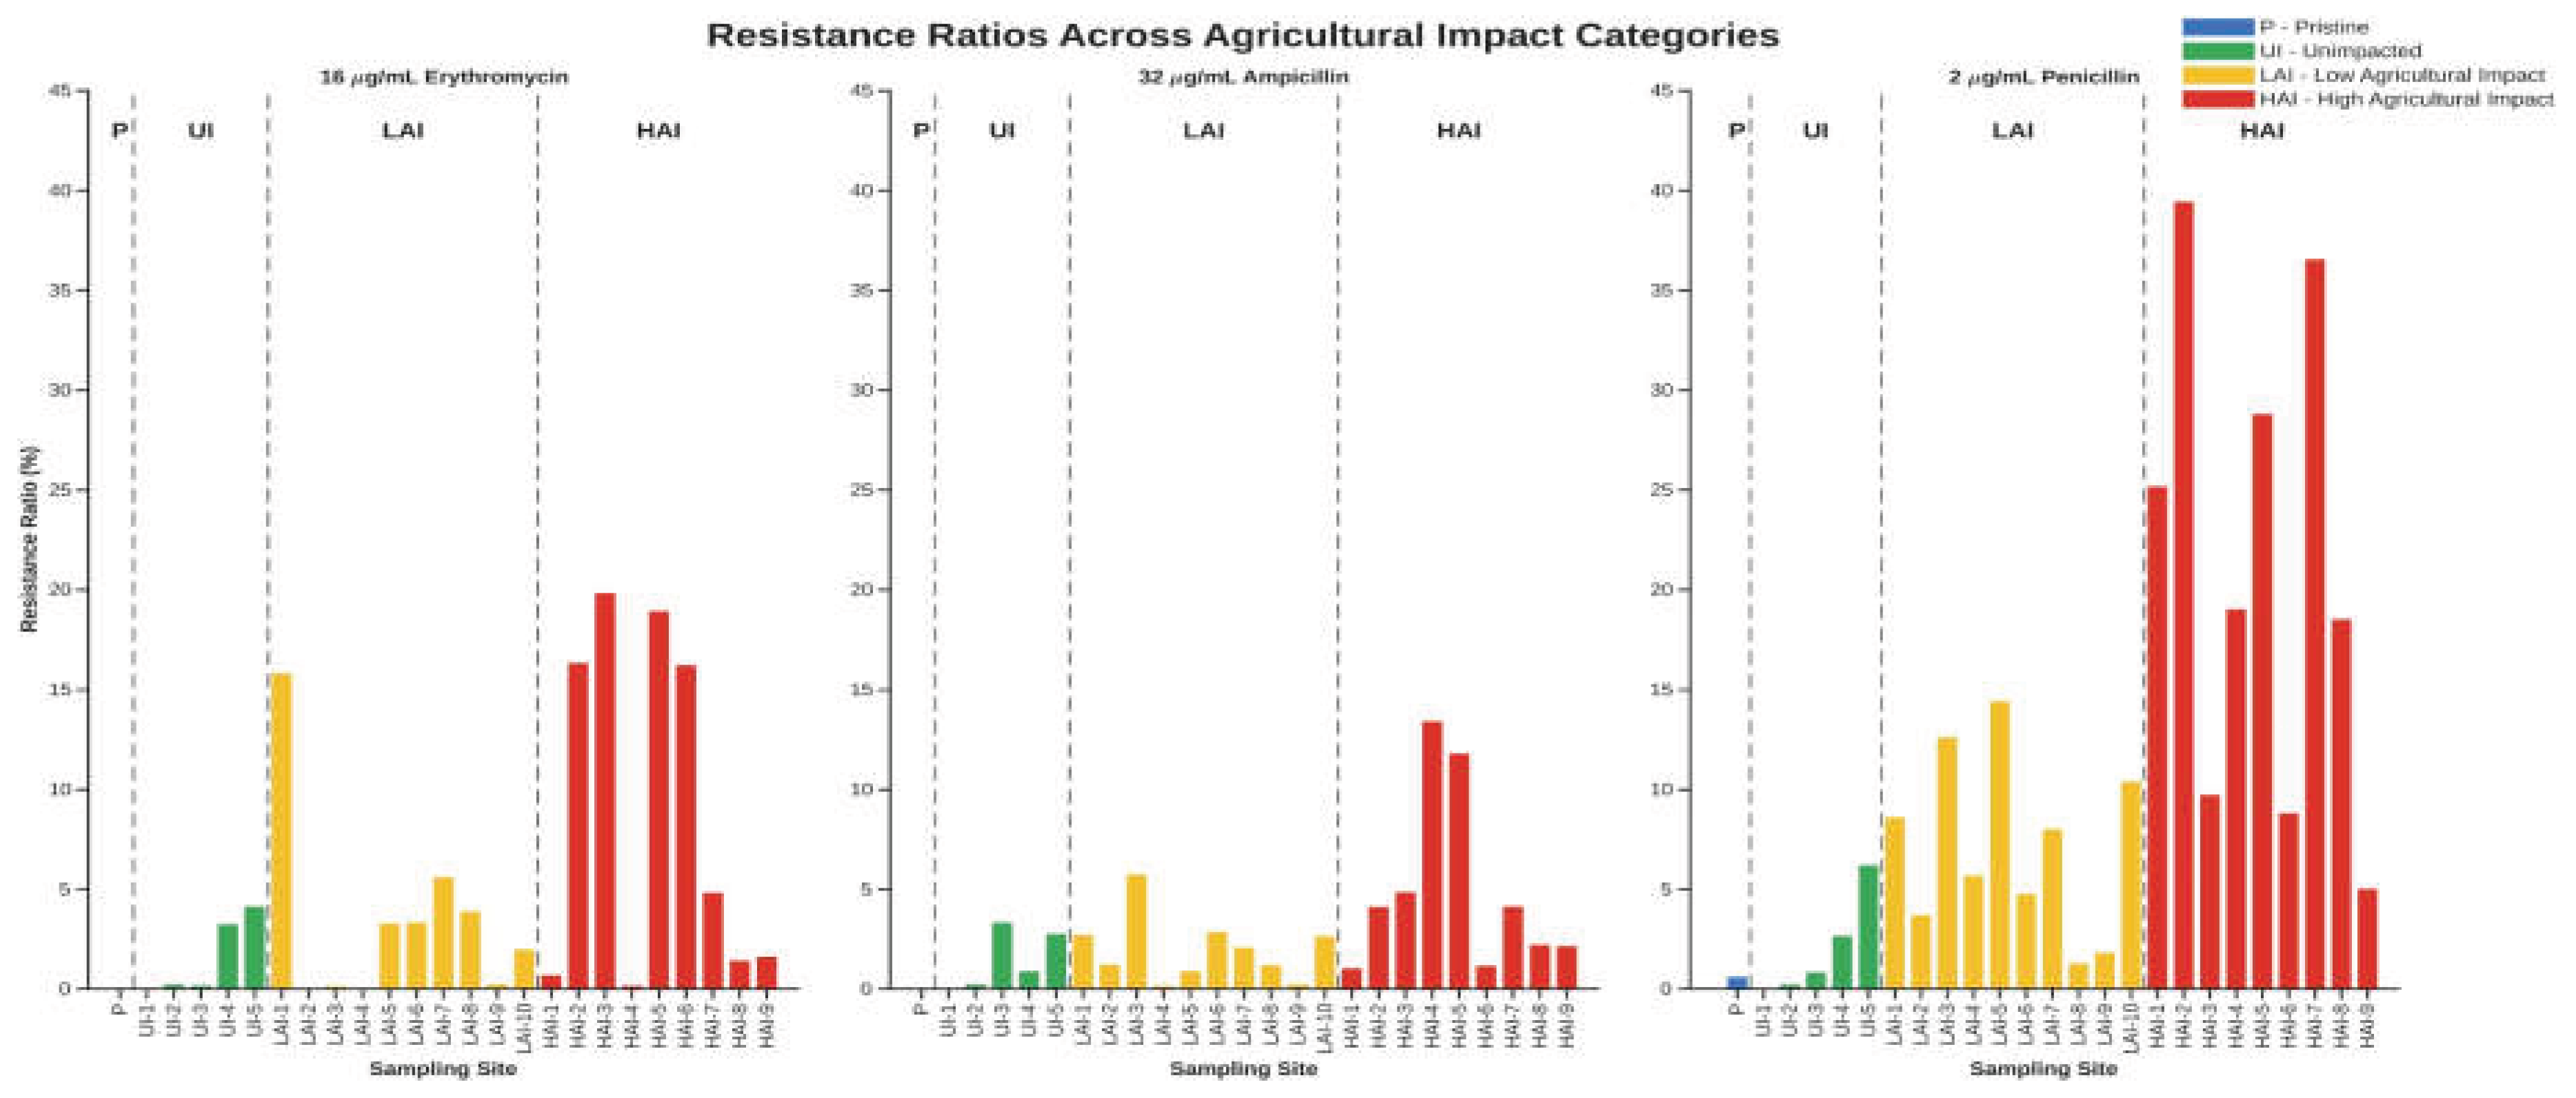
The results showed Pristine sites exhibited the lowest resistance ratio ranging from 0-0.602% followed by UI sites (0-6.21%), LAI sites (0-15.84%), and then HAI sites (0.16-39.44%) for all types of antibiotics. Resistance ratios were up to 19.84% for E, 13.42% for AMP, and 39.44% for P. Pristine and UI sites showed consistently low resistance ratios, while CAFO-impaired sites (LAI and HAI) exhibited higher and more variable resistance, with overall greater values on P amended agars.
3.2. Spatial Trends in Resistance Across the Central Valley
Figure 5.
Spatial distribution of CAFO animal head counts, manure application, and antibiotic resistance ratios across the sampling sites: 16 μg/mL of E (left), 32 μg/mL of AMP (middle), and 2 μg/mL of P. The “Total CAFO Head Counts” heat layer is derived straight from the publicly available factory farm watch facility layer.
Figure 5.
Spatial distribution of CAFO animal head counts, manure application, and antibiotic resistance ratios across the sampling sites: 16 μg/mL of E (left), 32 μg/mL of AMP (middle), and 2 μg/mL of P. The “Total CAFO Head Counts” heat layer is derived straight from the publicly available factory farm watch facility layer.
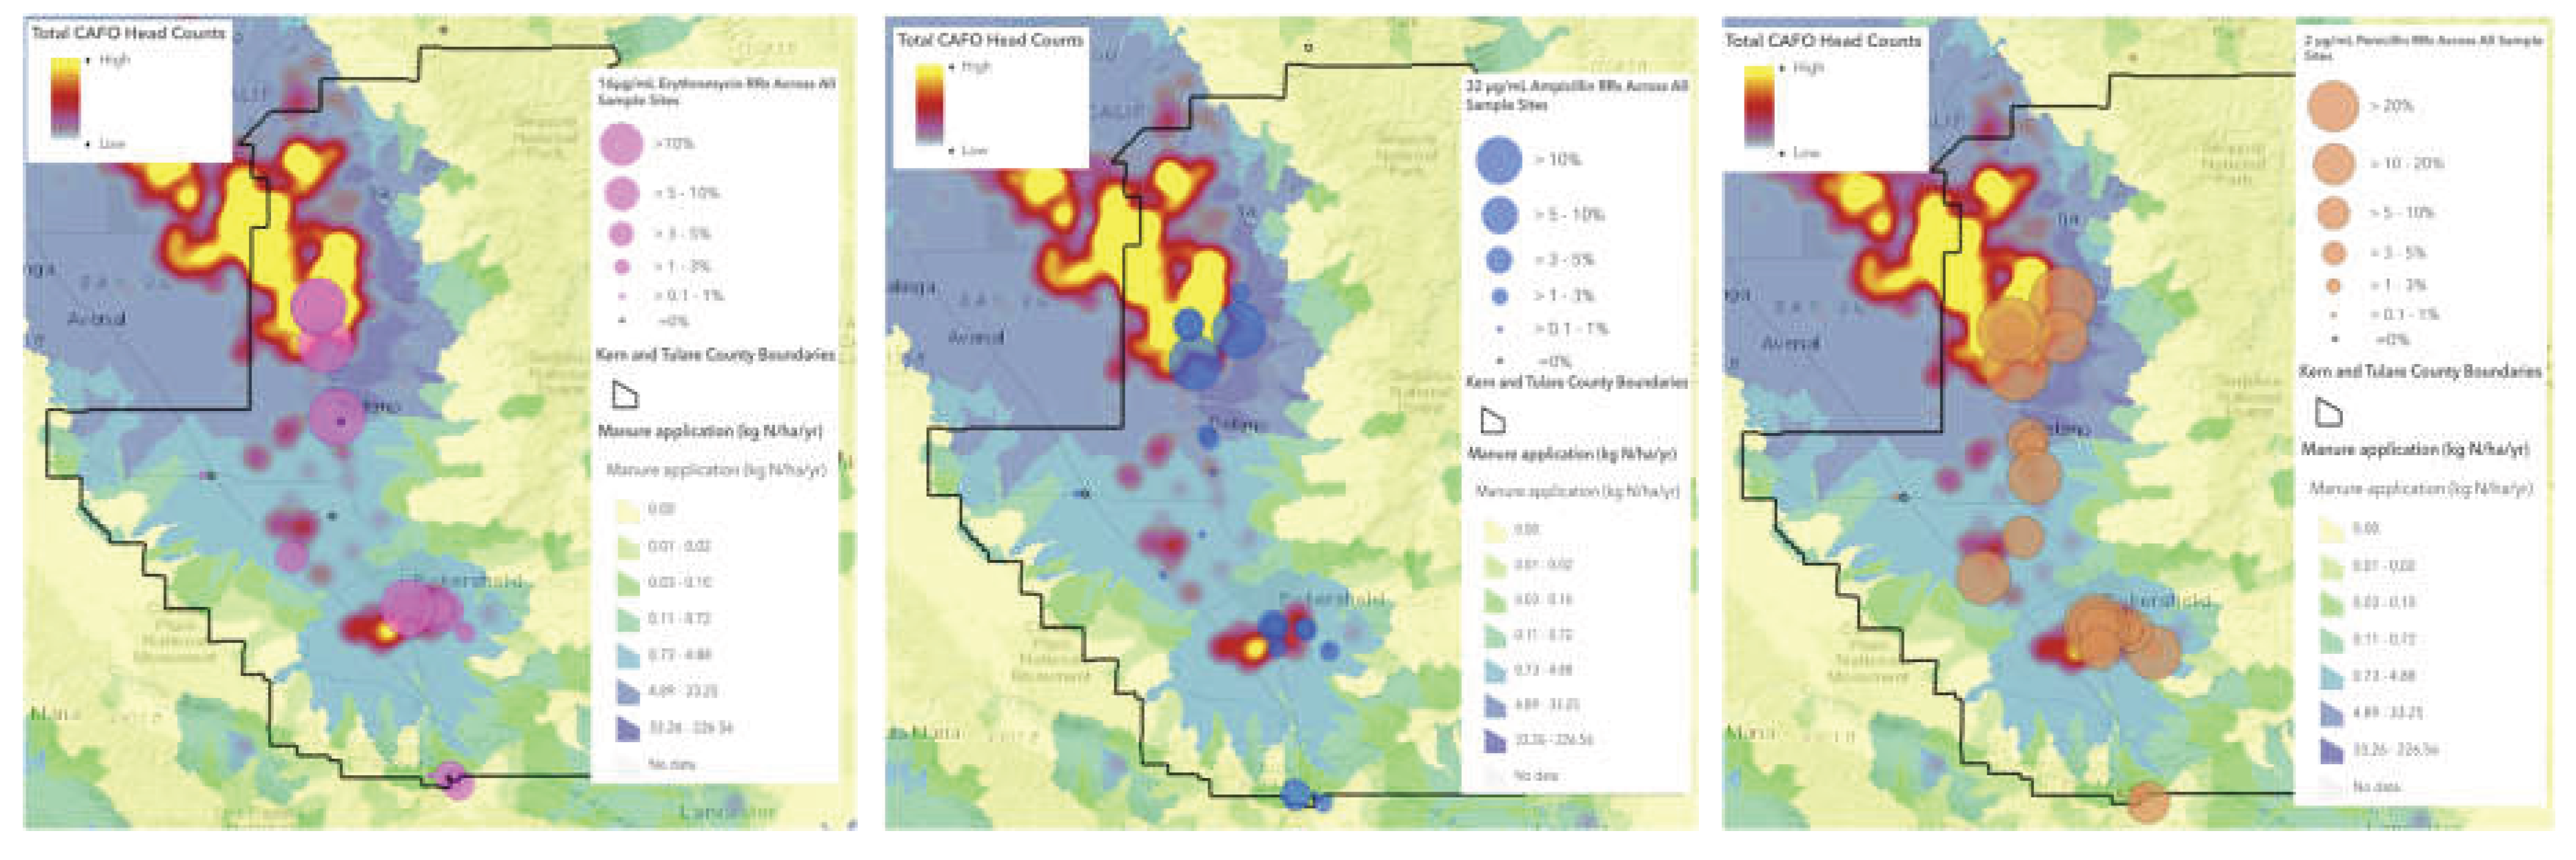
Spatial analysis (Figure 5) showed a link between increase of CAFO animal headcounts (all animal types) and elevated antibiotic resistance ratios. Regions with higher numbers of CAFO animals and higher manure application levels exhibited elevated resistance ratios in P and E, whereas AMP had a weaker association. Spatial mapping allows instant visual comparison and suggests spatial agreement between the antibiotic resistance ratio and agricultural impact patterns.
3.3. Heatmap Trends in Resistance Across the Central Valley
Figure 6.
Heat map analysis of CAFO density class and antibiotic resistance ratios for (left) All types of animal in animal units (right) Cattle-specific in animal head counts. Note that each column is colored sorted by its statistical percentile rank, rather than absolute value. This allows each antibiotic resistance type to be compared to CAFO density in a manner relative to its own scale of experimental levels. This prevented the antibiotics with differing baselines from comparatively overwhelming each other.
Figure 6.
Heat map analysis of CAFO density class and antibiotic resistance ratios for (left) All types of animal in animal units (right) Cattle-specific in animal head counts. Note that each column is colored sorted by its statistical percentile rank, rather than absolute value. This allows each antibiotic resistance type to be compared to CAFO density in a manner relative to its own scale of experimental levels. This prevented the antibiotics with differing baselines from comparatively overwhelming each other.
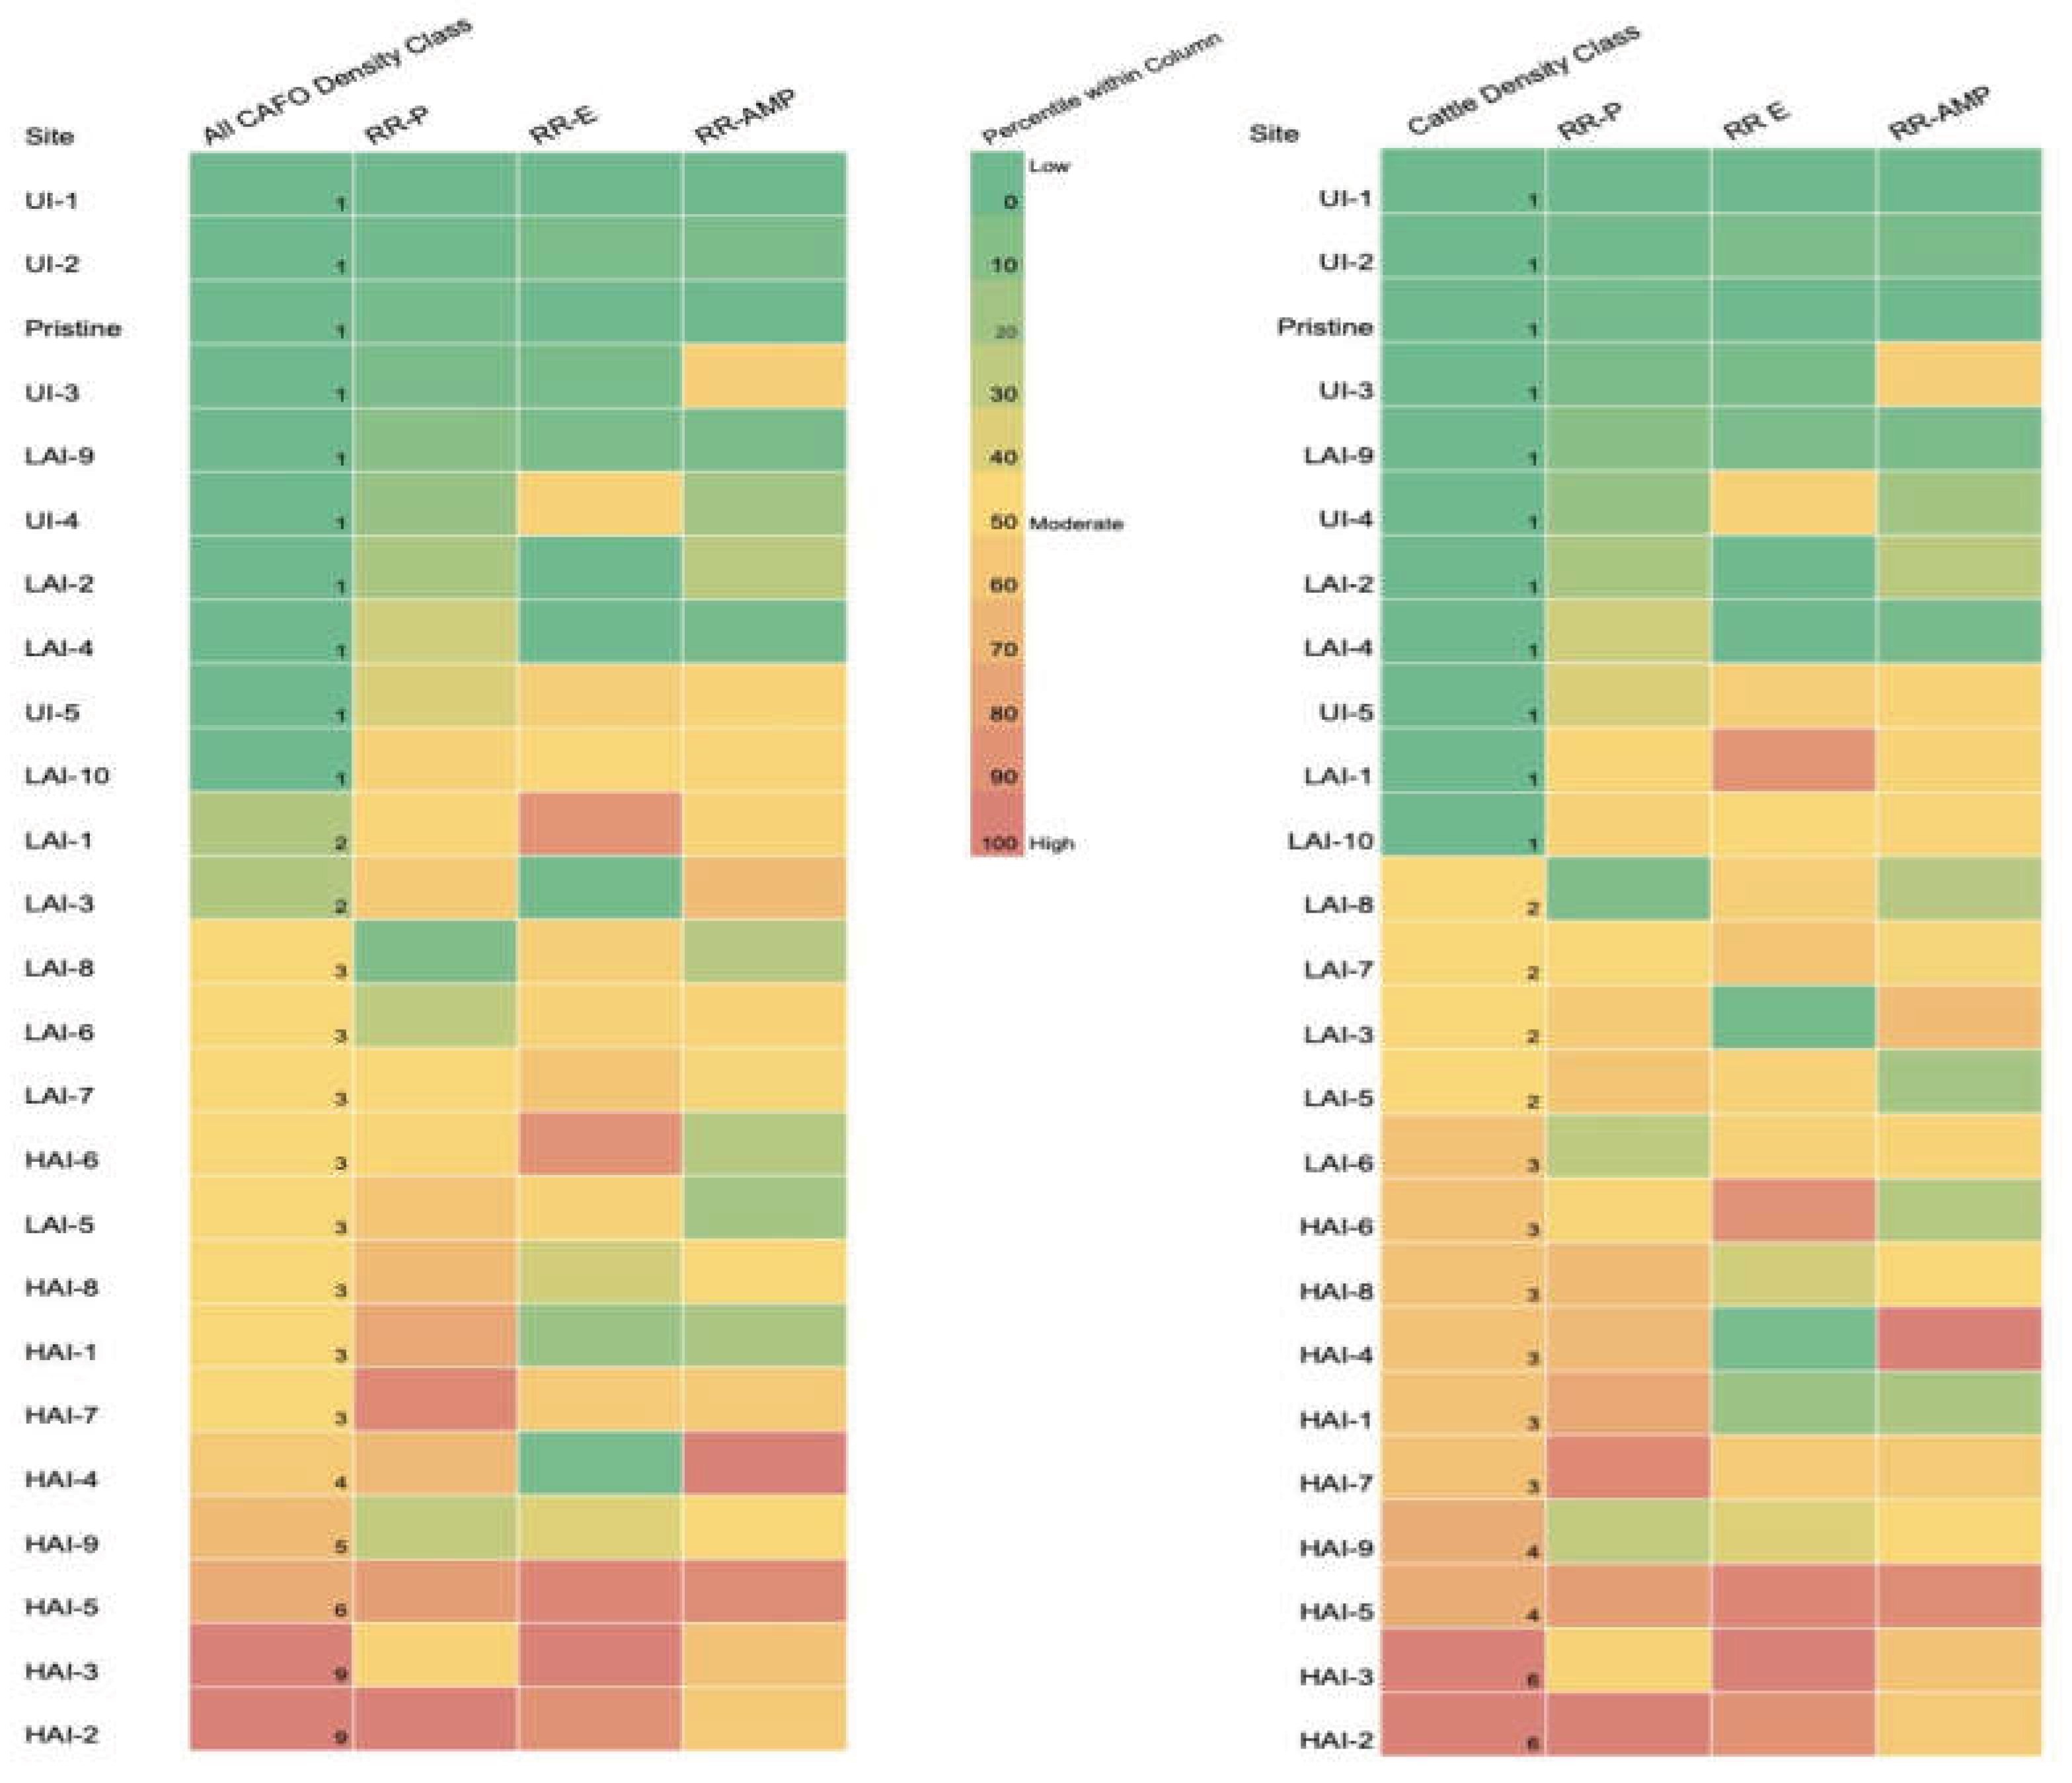
Since spatial maps can show general trends of resistance ratio in the geographic distribution of livestock density, Figure 6 was developed to visualize the site level comparison of environmental impaction classifications and resistance ratios. Both heat maps exhibited a strong relationship with P and E resistance ratio and lowest relationship with AMP which exhibited the same trend as spatial map. Notably, cow-specific heat map analysis (Figure 3 (right)) exhibited a stronger relationship with P than E.
3.4. Statistical Analysis Results
Figure 7.
Tukey-Kramer Test on all animal CAFO classes with one asterisk “*” indicating p < 0.05 and two asterisks “**” indicating p < 0.01. A similar graph with bins instead separated by the direct total CAFO headcount within a 10km buffer shown in SI-4.
Figure 7.
Tukey-Kramer Test on all animal CAFO classes with one asterisk “*” indicating p < 0.05 and two asterisks “**” indicating p < 0.01. A similar graph with bins instead separated by the direct total CAFO headcount within a 10km buffer shown in SI-4.
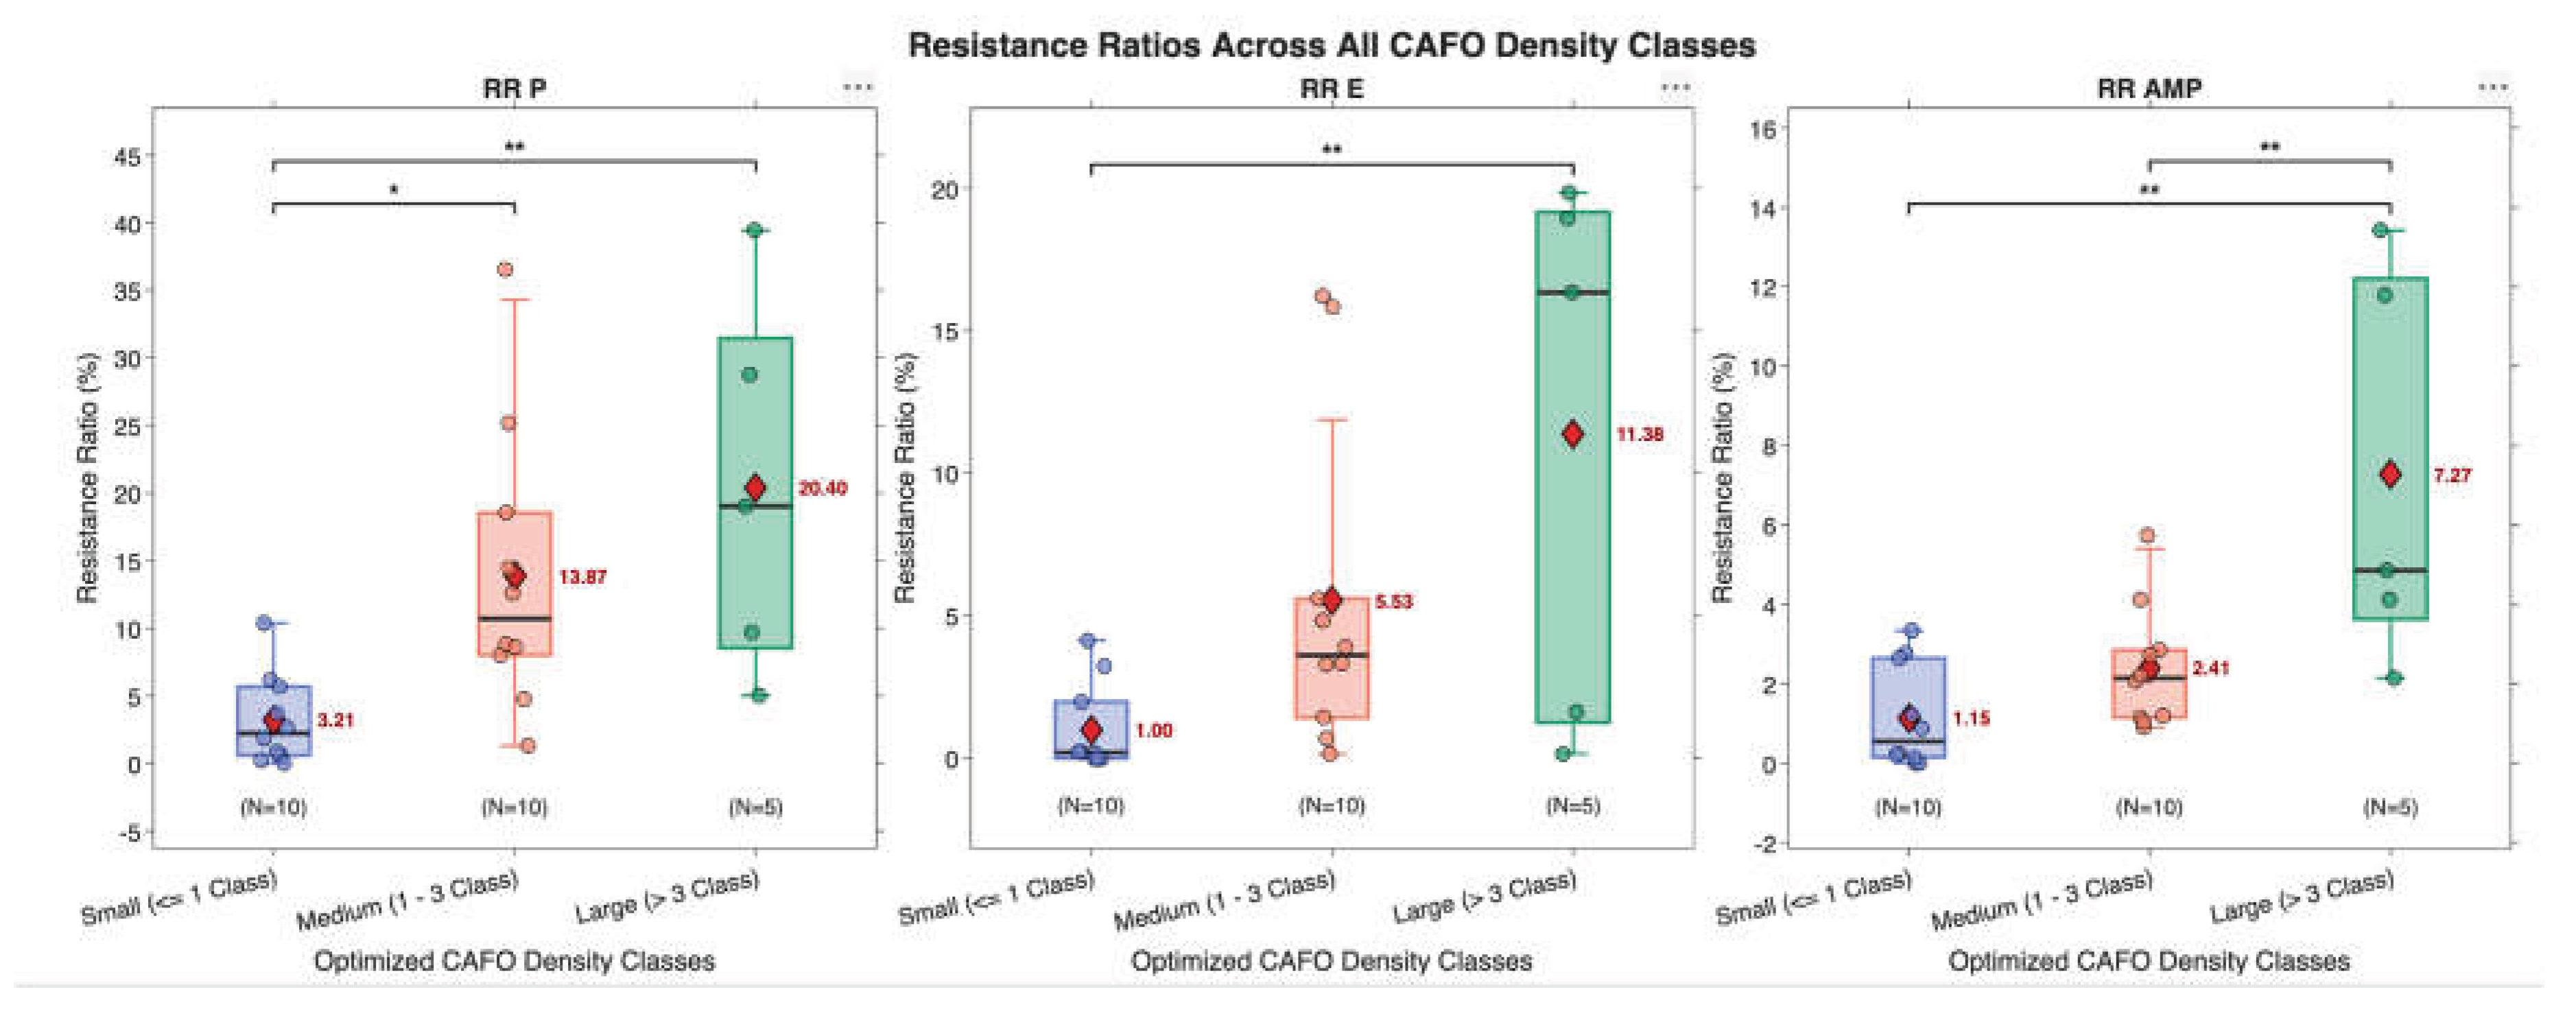
Table 3.
Statistical analysis of animal unit class vs resistance ratios.
| Statistical Relationships between Animal Unit Class vs Resistance Ratios | ||
| Type of Antibiotic | Spearman Rank (R-value) | Spearman P-value |
| P | 0.6664 | 0.0002754 |
| E | 0.6256 | 0.0008251 |
| AMP | 0.5711 | 0.002869 |
Figure 8.
Tukey-Kramer Test across cow CAFO classes with one asterisk “*” indicating p < 0.05 and two asterisks “**” indicating p < 0.01. A similar graph with bins instead separated by the direct cattle headcount within a 10km buffer shown in SI-5.
Figure 8.
Tukey-Kramer Test across cow CAFO classes with one asterisk “*” indicating p < 0.05 and two asterisks “**” indicating p < 0.01. A similar graph with bins instead separated by the direct cattle headcount within a 10km buffer shown in SI-5.
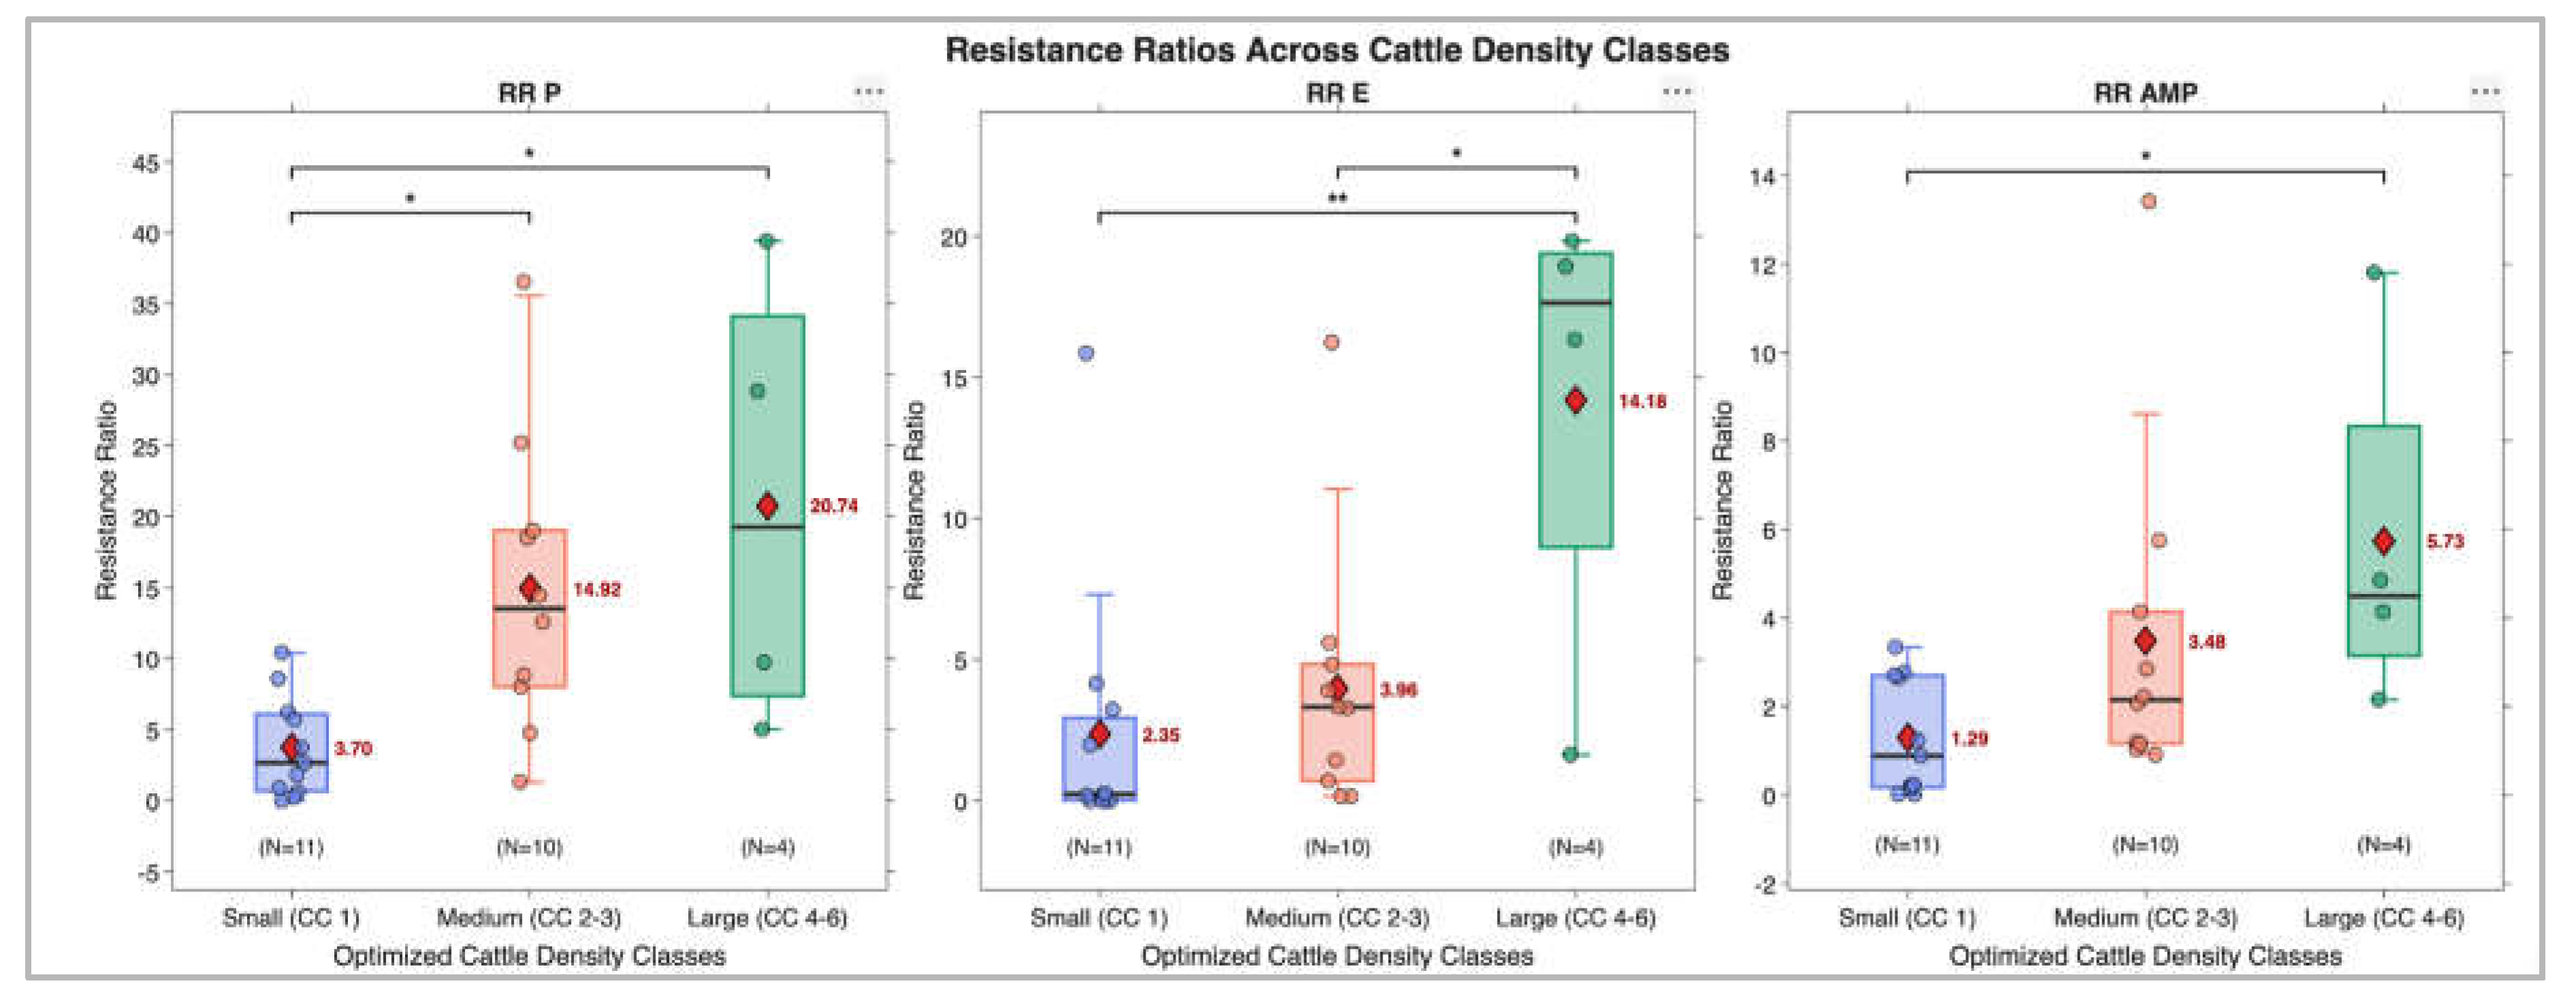
Table 4.
Statistical analysis of cattle density vs resistance ratios.
| Statistical Relationships between Cattle Density Class vs Resistance Ratios | ||
| Type of Antibiotic | Spearman Rank (R-value) | Spearman P-value |
| P | 0.6724 | 0.0002316 |
| E | 0.5569 | 0.003831 |
| AMP | 0.5604 | 0.00357 |
Calculating Spearman r-values and p-values using MATLAB Online, we observed statistically significant trends across the board. All 3 antibiotics, whether classified by animal unit Density or cattle density, showed moderate to strong positive correlations, with r-values all above 0.5. Ranking the antibiotics in their correlation strength high to low results in the following: P > E > AMP for animal unit classes, and P > AMP > E for cattle density classes.
4. Discussion
In this study, we utilized a modified colony counting resistance ratio method to serve as a low-cost screening tool to measure antibiotic resistance in deposited dust from CAFO impacted areas.
Both the bar chart and spatial mapping of our 25 sites show clear elevated resistance in sites where the agricultural impact was high relative to the less impacted sites. The spatial map included manure application as another reference frame, however, manure application was not considered in the heatmap and statistical analysis. The spread of manure is associated with dry manure particles resuspended by wind was outside the scope of this study. Overall, the findings support the suspected impact of extreme antibiotic use in factory farm operations in California’s Central Valley. As our independent variable for later figures, we used our calculated density classes derived from ArcGIS. The Figure 6 shows a clear visual gradient of how as measures of agricultural impact increase, the antibiotic resistance observed at nearby sites also increases. Specifically, penicillin resistance has a strong positive correlation to cattle density as well. When quantifying the resistance data at classified levels of total CAFO density, Penicillin resistance was at an average of 3%, 14%, and 20% for small, medium, and large density scores respectively. For the remaining antibiotics the trend was similar: 1%, 6%, and 11% for E and 1%, 2%, and 7% for AMP (Figure 7). For Cattle Density, P measured 4%, 15%, and 21%, E measured 2%, 4%, and 14% and AMP measured 1%, 3%, and 6% for AMP (Figure 8). Looking at our p-values to inversely indicate our strongest statistical correlations, we see that all 6 variant calculations result in p < 0.05. Our best p-values come from penicillin in both the animal unit density and cattle density calculations, being 0.0002754 and 0.0002316 respectively. Thus, we can safely reject the null hypothesis, reliably concluding that a non-random correlation exists across our data pool when examining various measures of CAFO density vs Antibiotic Resistance in dust. This is also found in another study [36] which was focused on settled dust collected from animal houses and shows different resistance ratio by different animal groups. Furthermore, P is commonly used in dairy cattle to treat and prevent disease while E is labeled strictly to less than 20-month-old calves [37]. Overall, this study suggests that ARB and ARGs may spread beyond agricultural areas into nearby communities.
AMR is minimally surveilled in the United States, representing a gap in public health monitoring. Our study utilized a modified culture-based method that exhibited the resistance ratio for a spread of culturable bacteria. Our method allows the resistance ratio of CFU on plates to yield an overnight resistance ratio without prior isolation or identification. Our method being non-selective limits us from identifying the resistant ratios of specific microorganisms. In other words, it does not indicate which microorganisms contain higher proportions of resistance. However, a conventional method such as Kirby Bauer disk diffusion, may miss this widespread characterization since it preselects for resistance of specific bacteria types, limiting assays to small subsets of the community. As our protocol is simply intended to serve as a quick and accessible screening method for environmental AMR, we prioritized being able to test a non-selective bacterial sample to get an overall estimation of bacterial resistance, as opposed to an in depth exploration for one specific type. Historically, only a small portion of environmental microorganisms are culturable under standard laboratory conditions [38], so DNA based methods such as qPCR are widely used to quantify ARGs without a culture process. However, in qPCR it is difficult to distinguish whether the detected gene originated from living or dead cells and what type of bacteria carries that gene. The Kirby Bauer method requires individual colonies to be pure-cultured before measuring antibiotic susceptibility under standardized conditions. This makes qPCR and Kirby Bauer quite time consuming and costly with materials. Without these constraints, this overnight method can be used for rapid and low-cost environmental monitoring without prior isolation or identification of bacteria. It is a fairly simple protocol, allowing undergraduate students the ability to break into scientific research and contribute to environmental screening.
Resistance ratios are a well-established, low-cost readout of culturable antibiotic resistance, and the PARE framework has demonstrated their value for distributed environmental surveillance by undergraduates [23]. The contribution of this work is not the ratio itself but its extension to a matrix and context that have not previously been examined in this way. To our knowledge, this is the first application of a PARE-style culture-based screen to settled dust, which required empirically identifying antibiotics and working concentrations that yielded resolvable differences among sites — conditions that could not be carried over directly from soil-based protocols. Deployed across a CAFO-density gradient in Kern and Tulare Counties, the approach recovered a coherent spatial signal, with resistance ratios for all three antibiotics elevated at high-density sites and student-generated GIS maps showing correspondence between animal density and RR. We emphasize that RRs here are a comparative index for samples processed in parallel, not an absolute measure of resistance prevalence: we did not benchmark the screen against molecular quantification of ARGs or standardized susceptibility testing, and culture-based ratios are additionally shaped by intrinsic resistance among environmental taxa and by the subset of the community recoverable overnight on nutrient agar. The novelty we claim is therefore one of scope and feasibility — that a protocol simple enough for a community-engaged course can generate spatially interpretable AMR data from settled particles in a region where such data are largely absent — and validation against reference methods is a necessary next step.
This study has the potential to help students and the public learn about AMR surveillance. In particular, this method doesn’t need high expertise training such as BSL2 for the collecting dust samples or the processing and analysis. Once the PBS sample is poured onto agar plates, the results can be counted without having to open up a grown culture. This makes it safe to perform, even if the bacterial type is unknown. Simultaneously, this overnight screening method is an easy, fast, and cost-effective process for students to practice trial and error, also known as ‘formative frustration,’ which is an important aspect of the scientific process and scientific learning [39]. The method can also be used as an educational tool for the public to understand how AMR can arise and be observed in the environment. Providing a single quantitative ratio per sample, the results were linked with geographic information to generate spatial maps. This informs the general public of potential environmental exposure patterns in their area and monitors AMR distribution. In fact, we held a community workshop in Delano in which 30 civilians participated in performing this overnight method, yielding resistance ratio results of their own. Thus, after learning the overnight method, the students and public alike can arrange sampling in any of their communities or sites of concern. This approach is relatively simple and could create a scalable environmental AMR monitoring system with the ultimate goal of rapidly recognizing exposure concerns as they arise.
5. Conclusions
Using a modified colony-counting antibiotic resistance ratio applied to settled particles, we found consistently higher resistance at sites with greater CAFO density across all three antibiotics tested. Penicillin showed the strongest association, with mean resistance ratios of 3.2%, 14%, and 20% across low-, medium-, and high-density classes. The contribution here is one of scope and feasibility rather than analytical validation: a protocol simple enough to run in an undergraduate course, and in a community workshop, produced spatially interpretable AMR data from a matrix and region where such data are largely absent. That accessibility is itself a result. Validation against reference methods remains a necessary next step. Colonies recovered from antibiotic-amended plates can be characterized by PCR or qPCR to identify which organisms survive antibiotic exposure, linking phenotype to genotype so that resistance level and genetic basis can be assessed together.
Supplementary Materials
The following supporting information can be downloaded at the website of this paper posted on Preprints.org.
Author Contributions
Conceptualization and methodology: J.A.J., Y.Z., K.O., Z.I-W., A.J., S.E.P., C.B.-S., G.A., C.B., L.C.-R., C.D., L.H., M.E.F., and C.M.; formal analysis: S.J., C.I., Y.Z., T.L., M.C., A.D., G.A., S.B., E.S., A.A., A.A., S.A., K.B., A.B., G.C., N.D., R.K., D.M., P.P., K.S., J.T., and A.X.; data curation: S.J., C.I., T.L., M.C., G.A., S.B., and E.S.; writing: S.J., C.I., M.C., G.A., E.S., J.A.J., C.B.; review and editing: Y.Z., K.O., Z.I-W., A.J., S.E.P., C.B.-S., G.A., L.C.-R., C.D., L.H., M.E.F., S.A., and C.M.; supervision: J.A.J. and Y.Z.; funding acquisition: J.A.J. All authors have read and agreed to the published version of the manuscript.
Funding
This research was supported by the Joan Doren Family Foundation and the UCLA Samueli School of Engineering and Applied Sciences.
Data Availability Statement
All data will be made available on our research group website: jaylabucla.org.
Acknowledgments
We thank the Joan Doren Family Foundation and Henry Samueli School of Engineering and Applied Sciences at UCLA for making this work possible. We are grateful for help in the laboratory from Isabella Chow, Dayna Coates, Caleb Esguerra, Anabella Hewlett, Richard Huynh, SJ Lim, Shannon Nguyen, Poe Myat Hay Thar, Sunshine Tovey.
Conflicts of Interest
The authors declare no conflict of interest.
Abbreviations
| ARB | Antibiotic Resistant Bacteria |
| CAFOs | Concentrated Animal Feeding Operations |
| CURE | Community engaged Undergraduate Research Experiences |
| CFU | Colony Forming Unit |
| RRs | Resistance Ratios |
| AMR | Antimicrobial Resistance |
| ARGs | Antibiotic Resistance Genes |
| PARE | Prevalence of Antibiotic Resistance in the Environment |
| SRAP | Socially Responsible Agriculture Project |
| CRPE | Center on Race, Poverty and the Environment |
| SEEN | SocioEnvironmental and Education Network |
| UI | Unimpacted |
| LAI | Less Agricultural Impacted |
| HAI | High Agricultural Impacted |
| PBS | Phosphate Buffer Solution |
| E | Erythromycin |
| AMP | Ampicillin |
| P | Penicillin |
| CLSI | Clinical and Laboratory Standard Institute |
| NA | Nutrient Agar |
References
- Murray, C. J.; et al. Global burden of bacterial antimicrobial resistance in 2019: a systematic analysis. The Lancet 2022, vol. 399(no. 10325), 629–655. [Google Scholar] [CrossRef] [PubMed]
- Naghavi, M.; et al. Global burden of bacterial antimicrobial resistance 1990–2021: a systematic analysis with forecasts to 2050. The Lancet 2024, vol. 404(no. 10459), 1199–1226. [Google Scholar] [CrossRef] [PubMed]
- Habibi, N.; et al. Aerosol-Mediated Spread of Antibiotic Resistance Genes: Biomonitoring Indoor and Outdoor Environments. Int. J. Environ. Res. Public Health 2024, vol. 21(no. 8), 983. [Google Scholar] [CrossRef]
- Manyi-Loh, C.; Mamphweli, S.; Meyer, E.; Okoh, A. Antibiotic Use in Agriculture and Its Consequential Resistance in Environmental Sources: Potential Public Health Implications. Mol. A J. Synth. Chem. Nat. Product. Chem. 2018, vol. 23(no. 4), 795. [Google Scholar] [CrossRef] [PubMed]
- Acosta; Tirkaso, W.; Nicolli, F.; van Boeckel, T. P.; Cinardi, G.; Song, J. The future of antibiotic use in livestock. Nat. Commun. 2025, 2025 16:1, vol. 16(no. 1), 2469. [Google Scholar] [CrossRef] [PubMed]
- Barrett, J. R. Airborne Bacteria in CAFOs: Transfer of Resistance from Animals to Humans. Environ. Health Perspect. 2005, vol. 113(no. 2), A116. [Google Scholar] [CrossRef]
- Xin, H.; Qiu, T.; Guo, Y.; Gao, H.; Zhang, L.; Gao, M. Aerosolization behavior of antimicrobial resistance in animal farms: a field study from feces to fine particulate matter. Front Microbiol. 2023, vol. 14, 1175265. [Google Scholar] [CrossRef] [PubMed]
- Zulkifle, N. T.; A Wahab, M. I.; Neoh, H. M.; Zulfakar, S. S. Environmental factors attributed on dissemination of antibiotic-resistant bacteria (ARB) and antibiotic resistance genes (ARGs) through PM2.5 and PM10. Aerobiologia 2025, vol. 41(no. 3), 569–590. [Google Scholar] [CrossRef]
- Amin, H.; et al. Urban indoor airborne antibiotic resistance genes: Role of antibiotic use and outdoor air pollution. Sci. Total Environ. 2026, vol. 1034, 181854. [Google Scholar] [CrossRef] [PubMed]
- Seinfeld, J. H.; Pandis, S. N. Atmospheric Chemistry and Physics: From Air Pollution to Climate Change, 3rd ed.; Wiley: Hoboken, NJ, USA, 2016. [Google Scholar]
- Kok, F.; Parteli, E. J. R.; Michaels, T. I.; Karam, D. B. The physics of wind-blown sand and dust. Rep. Prog. Phys. 2012, vol. 75(no. 10). [Google Scholar] [CrossRef] [PubMed]
- Zhou, Z. C.; et al. Spread of antibiotic resistance genes and microbiota in airborne particulate matter, dust, and human airways in the urban hospital. Environ. Int. 2021, vol. 153, 106501. [Google Scholar] [CrossRef] [PubMed]
- Feng, T.; Han, Q.; Su, W.; Yu, Q.; Yang, J.; Li, H. Microbiota and mobile genetic elements influence antibiotic resistance genes in dust from dense urban public places. Environ. Pollut. 2022, vol. 311, 119991. [Google Scholar] [CrossRef] [PubMed]
- Hlavay, J.; Wesemann, G. Distribution of mineralogical phases in dusts collected at different workshops. Sci. Total Environ. 1993, vol. 136(no. 1–2), 33–42. [Google Scholar] [CrossRef]
- de Rooij, M. M. T.; et al. Insights into Livestock-Related Microbial Concentrations. [CrossRef] [PubMed]
- in Air at Residential Level in a Livestock Dense Area. Environ. SciTechnol 2019, vol. 53(no. 13), 7746–7758. [CrossRef] [PubMed]
- Bai, H.; et al. Spread of airborne antibiotic resistance from animal farms to the environment: Dispersal pattern and exposure risk. Environ. Int. 2022, vol. 158, 106927. [Google Scholar] [CrossRef] [PubMed]
- Luiken, R. E. C.; et al. Farm dust resistomes and bacterial microbiomes in European poultry and pig farms. Environ. Int. 2020, vol. 143, 105971. [Google Scholar] [CrossRef] [PubMed]
- Gao, F.-Z.; et al. Airborne bacterial community and antibiotic resistome in the swine farming environment: Metagenomic insights into livestock relevance, pathogen hosts and public risks. Environ. Int. 2023, vol. 172, 107751. [Google Scholar] [CrossRef] [PubMed]
- Hamscher, G.; Pawelzick, H. T.; Sczesny, S.; Nau, H.; Hartung, J. Antibiotics in dust originating from a pig-fattening farm: A new source of health hazard for farmers? Environ. Health Perspect. 2003, vol. 111(no. 13), 1590–1594. [Google Scholar] [CrossRef] [PubMed]
- Danasekaran, R. One Health: A Holistic Approach to Tackling Global Health Issues. Indian J. Community Med. 2024, vol. 49(no. 2), 260. [Google Scholar] [CrossRef] [PubMed]
- One health. Available online: https://www.who.int/health-topics/one-health#tab=tab_1 (accessed on Aug. 29 2026).
- Chowdhry, R.; et al. Community-Engaged Course-Based Undergraduate Research of Multidrug Resistance in Escherichia coli in Water Near Dairy and Hog Farms in Michigan. Environ. Microbiol. Rep. 2025, vol. 17(no. 4), e70151. [Google Scholar] [CrossRef]
- Fuhrmeister, E. R.; Larson, J. R.; Kleinschmit, A. J.; Kirby, J. E.; Pickering, A. J.; Bascom-Slack, C. A. Combating antimicrobial resistance through student-driven research and environmental surveillance. Front. Microbiol. 2021, 12, 577821. [Google Scholar] [CrossRef] [PubMed]
- Wallerstein, N.; et al. Engage for Equity: A Long-Term Study of Community-Based Participatory Research and Community-Engaged Research Practices and Outcomes. Health Educ. Behav. 2020, vol. 47(no. 3), 380–390. [Google Scholar] [CrossRef] [PubMed]
- Balazs, C. L.; Morello-Frosch, R. The Three R’s: How Community Based Participatory Research Strengthens the Rigor, Relevance and Reach of Science. Environ. Justice 2013, vol. 6(no. 1), 9–16. [Google Scholar] [CrossRef] [PubMed]
- Bacon, C.; Devuono-Powell, S.; Frampton, M. L.; Lopresti, T.; Pannu, C. Introduction to empowered partnerships: Community-based participatory action research for environmental justice. Environ. Justice 2013, vol. 6(no. 1), 1–8. [Google Scholar] [CrossRef]
- Raphael, C.; Matsuoka, M. Ground Truths. Ground Truths Community-Engaged Res. Environ. Justice 2024, 1–328. [Google Scholar] [CrossRef]
- Brownell, S. E.; et al. A High-Enrollment Course-Based Undergraduate Research Experience Improves Student Conceptions of Scientific Thinking and Ability to Interpret Data. CBE Life Sci. Educ. 2015, vol. 14(no. 2), ar21. [Google Scholar] [CrossRef] [PubMed]
- Bangera, G.; Brownell, S. E. Course-based undergraduate research experiences can make scientific research more inclusive. CBE Life Sci. Educ. 2014, vol. 13(no. 4), 602–606. [Google Scholar] [CrossRef] [PubMed]
- Gee, M.; McKone, T. E. The synergistic health impacts of exposure to multiple stressors in Tulare County, California. Environ. Res. Health 2023, vol. 2(no. 1), 015004. [Google Scholar] [CrossRef]
- Ariful Islam, M.; et al. A review of antimicrobial usage practice in livestock and poultry production and its consequences on human and animal health ARTICLE HISTORY. J. Adv. Vet. Anim. Res. 2024, vol. 11(no. 3), 675–685. [Google Scholar] [CrossRef] [PubMed]
- Antibiotics Tested by NARMS | NARMS | CDC. Available online: https://www.cdc.gov/narms/about/antibiotics-tested.html (accessed on Aug. 29 2026).
- Zhang, Y.; et al. Elevated Antibiotic Resistance in Escherichia coli from Surface Waters Impacted by Concentrated Animal Feeding Operations in California and Michigan. Water 2026, vol. 18(no. 2), 207. [Google Scholar] [CrossRef]
- Gibbs, S. G.; Green, C. F.; Tarwater, P. M.; Mota, L. C.; Mena, K. D.; Scarpino, P. v. Isolation of Antibiotic-Resistant Bacteria from the Air Plume Downwind of a Swine Confined or Concentrated Animal Feeding Operation. Environ. Health Perspect. 2006, vol. 114(no. 7), 1032. [Google Scholar] [CrossRef] [PubMed]
- Sancheza, H. M.; et al. Antibiotic Resistance in Airborne Bacteria Near Conventional and Organic Beef Cattle Farms in California, USA. Water Air Soil Pollut. 2016, vol. 227(no. 8), 280. [Google Scholar] [CrossRef]
- Liu, M.; Kemper, N.; Volkmann, N.; Schulz, J. Resistance of enterococcus spp. in dust from farm animal houses: A retrospective study. Front Microbiol. 2018, vol. 9, no. DEC, 3074. [Google Scholar] [CrossRef]
- Azabo, R.; Mshana, S.; Matee, M.; Kimera, S. I. Antimicrobial usage in cattle and poultry production in Dar es Salaam, Tanzania: pattern and quantity. BMC Vet. Res. 2022, vol. 18(no. 1), 7. [Google Scholar] [CrossRef] [PubMed]
- Hofer, U. The majority is uncultured. Nat. Rev. Microbiol. 2018 2018, 16, 716–717. [Google Scholar] [CrossRef] [PubMed]
- Lopatto, D.; et al. Facilitating Growth through Frustration: Using Genomics Research in a Course-Based Undergraduate Research Experience. J. Microbiol. Biol. Educ. 2020, vol. 21(no. 1). [Google Scholar] [CrossRef] [PubMed]
Table 1.
Characteristics of sampling sites including CAFO proximity, livestock head counts, and manure application levels.
Table 1.
Characteristics of sampling sites including CAFO proximity, livestock head counts, and manure application levels.
| Site Number | Type of CAFO in 10km | Distance to nearest CAFO (km) | Number of CAFOs within 5 km radius | Total head (and type) within 5 km radius | Number of CAFOs within 10 km radius | Total head (and type) within 10 km radius | Manure application level (kg N/ha/yr) |
|
Pristine |
N/A | 35.79 | 0 | 0 | 0 | 0 | 0 |
| UI-1 | N/A | 13.7 | 0 | 0 | 0 | 0 | 2.04 |
| UI-2 | N/A | 15.93 | 0 | 0 | 0 | 0 | 2.04 |
| UI-3 | N/A | 33.73 | 0 | 0 | 0 | 0 | 0.05 |
| UI-4 | N/A | 33.23 | 0 | 0 | 0 | 0 | 0.05 |
| UI-5 | N/A | 35.71 | 0 | 0 | 0 | 0 | 0.05 |
| LAI-1 | Dairy cows and Poultry | 4.03 | 1 | 3,223 | 3 | 571,450 | 3.05 |
| LAI-2 | Dairy cows | 5.59 | 0 | 0 | 2 | 4,450 | 3.05 |
| LAI-3 | Dairy cows and livestock auction | 0.98 |
2 | 6.797 | 3 | 7,034 | 3.54 |
| LAI-4 | Dairy cows | 7.35 |
0 | 0 | 3 | 12,144 | 3.69 |
| LAI-5 | Dairy cows | 2.27 | 1 | 7,774 | 6 | 41,420 | 2.93 |
| LAI-6 | Dairy cows and poultry | 2.55 | 5 | 119,203 | 11 | 141,627 | 0.2 |
| LAI-7 | Dairy cows and poultry | 3.15 |
4 | 9,203 | 11 | 141,627 | 0.2 |
| LAI-8 | Dairy cows and poultry | 3.13 |
4 | 9,203 | 11 | 141,627 | 0.2 |
| LAI-9 | Dairy cows and beef cattle | 8.44 |
0 | 0 | 2 | 5,157 | 0.03 |
| LAI-10 | Dairy cows and beef cattle | 8.96 |
0 | 0 | 2 | 5,157 | 0.03 |
| HAI-1 | Dairy cows and calves | 2.37 |
2 | 5,867 | 22 | 188,489 | 18.57 |
| HAI-2 | Dairy cows, calves, beef cattle, and livestock auction | 0.20 |
25 | 73,503 | 86 | 268,222 | 44.18 |
| HAI-3 | Dairy cows, calves, beef cattle, and livestock auction | 0.29 |
25 | 73,503 | 85 |
265,751 | 44.21 |
| HAI-4 | Dairy cows, calves, and beef cattle | 2.07 |
6 |
12,807 | 22 | 92,831 | 44.21 |
| HAI-5 | Dairy cows, calves, beef cattle, and poultry | 3.41 |
5 | 18,926 | 35 |
824,388 | 43 |
| HAI-6 | Dairy cows, beef cattle, and poultry | 2.18 |
3 | 7,615 | 22 | 187,511 | 2.37 |
| HAI-7 | Dairy cows, beef cattle, and poultry | 1.72 |
4 | 9,634 | 22 | 187,879 | 2.37 |
| HAI-8 | Dairy cows, beef cattle, and poultry | 1.80 |
4 | 9,634 | 21 | 182,599 | 2.37 |
| HAI-9 | Dairy cows and beef cattle | 2.44 |
7 | 22,693 | 20 | 96,644 | 2.73 |
Disclaimer/Publisher’s Note: The statements, opinions and data contained in all publications are solely those of the individual author(s) and contributor(s) and not of MDPI and/or the editor(s). MDPI and/or the editor(s) disclaim responsibility for any injury to people or property resulting from any ideas, methods, instructions or products referred to in the content. |
© 2026 by the authors. Licensee MDPI, Basel, Switzerland. This article is an open access article distributed under the terms and conditions of the Creative Commons Attribution (CC BY) license (http://creativecommons.org/licenses/by/4.0/).
Copyright: This open access article is published under a Creative Commons CC BY 4.0 license, which permit the free download, distribution, and reuse, provided that the author and preprint are cited in any reuse.