
Submitted:
03 September 2026
Posted:
04 September 2026
You are already at the latest version
Abstract
Atmospheric compound pollution is an important challenge in China, with the nonlinear interaction between PM2.5 and O3 presenting a complex pattern of mutual offset and synergistic pollution. This study focused on Puyang, a typical oil and gas industrial city in North China (one of the “2+26” cities), to explore long-term trends and nonlinear interactions of PM2.5 and O3 based on monitoring data from 2015 to 2025. PM2.5 decreased from 79.6 μg·m−3 in 2015 to 39.3 μg·m−3 in 2025, while MdA8 O3 increased from 123.0 μg·m−3 to 189.6 μg·m−3. A weak positive correlation between PM2.5 and O3 has been observed when MdA8 O3 was greater than 160 μg·m−3 and PM2.5 was less than 35 μg·m−3. The correlation coefficient was 0.38 in winter, 0.37 in summer, 0.26 in autumn, and 0.21 in spring, respectively. O3 production efficiency (OPE) showed a declining trend and was positively correlated with PM2.5 (R = 0.46-0.65), with monthly averages consistently above 7, indicating that O3 was primarily controlled by NOx in this city. This study proposed a seasonal VOCs-NOx control strategy targeting summer photochemical O3 and autumn–winter dual-exceedance to mitigate PM2.5, optimize OPE, and reduce exceedance days.
Keywords:
Puyang
; O3
; PM
; ”2+26“ region
; OPE
1. Introduction
Atmospheric compound pollution is a key characteristic in China, particularly in the Beijing-Tianjin-Hebei region and its surrounding areas. Since the implementation of the “Action Plan for Prevention and Control of Air Pollution” in China in 2013, PM2.5 of Beijing-Tianjin-Hebei region has decreased to 36.7 μg·m−3 in 2024, a decrease of 65.4%. It surpassed the control effectiveness achieved by “Clean Air Act” after 30 years of implementation in the United States. However, O3 concentrations have been rising steadily in this region [1,2,3]. PM2.5 and O3 alternated as the primary pollutant, with occasional haze episodes of dual exceedance (both of them exceeding standards simultaneously). In February 2017, the “2+26” region (including two municipalities, Beijing and Tianjin, and 26 cities in four surrounding provinces, namely Shijiazhuang, Tangshan, Langfang, Baoding, Cangzhou, Hengshui, Xingtai, and Handan in Hebei province; Taiyuan, Yangquan, Changzhi, and Jincheng in Shanxi province; Jinan, Zibo, Jining, Dezhou, Liaocheng, Binzhou, and Heze in Shandong province; and Zhengzhou, Kaifeng, Anyang, Hebi, Xinxiang, Jiaozuo, and Puyang in Henan province) were included in this region for air pollution control. These cities served as major air pollution hotspots and important transport pathway for pollutants. Their heavily industrialized structure, concentrated energy consumption, and substantial total pollutant emissions are the main drivers of polluted weather formation. Designating these 28 cities as important for air pollution prevention and control has expanded the governance scope of the Beijing-Tianjin-Hebei region and established a joint prevention and control mechanism with surrounding cities. This mechanism enables unified standards, coordinated emission reductions, joint law enforcement, and a concentrated response to regional air pollution challenges.
The formation of PM2.5 and O3 differs because of their disparate sources. Air pollution is closely linked to precursor emissions, regional, transport, and other contributing factors. Most studies have explored this issue from perspectives [4,5,6,7,8,9]. Ye et al. innovatively studied the impact of urban spatial morphology on PM2.5 and O3 [3]. Yuan et al. found that the decrease in particulate matter concentration weakens its absorption and scattering of sunlight, enhancing the photochemical generation of O3 [10]. Meanwhile, particulate matter is an important sink for ꞏHOx radicals (ꞏHOx = ꞏHO + ꞏHO2), and its concentration decrease increases the concentration of ꞏHOx, thereby promoting O3 generation [4,11]. However, this process has not been found to dominate O3 generation in field observations [12]. Qiu et al. analyzed the relationship between PM2.5, O3, and total atmospheric oxidants (Ox = O3 + NO2) nationwide and found that PM2.5 and O3 exhibit opposite trends in the Beijing-Tianjin-Hebei region; under conditions of excessive O3, if PM2.5 is greater than 50 μg·m−3, PM2.5 inhibits O3 generation [6]. Li et al. used GEOS-Chem model to simulate that the decrease in PM2.5 concentration can indirectly promote O3 generation [11]. Overall, the spatial distribution and synergistic relationship between PM2.5 and O3 exhibit regional heterogeneity [8].
However, PM2.5 and O3 indeed exhibit a trend of mutual compensation. Some studies also reveal that under specific conditions, the relationship between the two is not simply one-way suppression but involves complex interactions and synergistic effects [13,14]. Firstly, both of them share common precursors, NOx and VOCs, providing a foundation and basis for their synergistic control. Secondly, the chemical components in PM2.5 are complex, with black carbon, metals, and other components potentially affecting the photochemical reaction efficiency of O3 through absorbing solar radiation or acting as catalysts, leading to an increase in O3 concentration. This enhances the oxidizing nature of the atmosphere, promoting the conversion of NOx and VOCs in the atmosphere into PM2.5, generating more secondary organic matter, and making the pollution of PM2.5 and O3 in the atmosphere more complex. At the same time, the two can interact through heterogeneous reactions, causing complex nonlinear superposition effects [15,16], leading to the occurrence of dual-exceedance pollution weather [17]. Nevertheless, notable differences exist between PM2.5 and O3 in terms of their sources and formation mechanisms [18]. Therefore, achieving synergistic control of PM2.5 and O3 relies on scientific research to achieve precise and effective pollution abatement.
Puyang, a “2+26” key city and a major petrochemical base in China, is rich in oil, gas, and coal resources. The dense clustering of extraction, refining, and chemical industries makes it a major source of VOCs and NOx, with its pollution characteristics being especially typical of oil-industrial cities. The synergistic effects of VOCs and NOx can induce atmospheric compound pollution, characterized by strong synergistic intensity, high photochemical activity, and nonlinear interactions (e.g., low PM2.5 promotes O3 formation while high PM2.5 suppresses it). These features distinguish its pollution attributes significantly from those of ordinary cities. However, studies on such cities remain limited, leading to an insufficient understanding of their complex pollution mechanisms and a lack of targeted control strategies. Therefore, studying Puyang’s air pollution is of great significance. It can not only reveal the unique pollution processes of oil-industrial cities but also provide scientific support for similar cities to implement differentiated measures and precise emission reduction, demonstrating a typical value for tackling atmospheric compound challenges.
2. Materials and Methods
2.1. Location of Puyang
Puyang is located in the northeast of Henan province, at the intersection of Hebei, Shandong, and Henan provinces. It borders Handan city in Hebei and Heze city in Shandong, and Anyang and Hebi cities in Henan. The city governs one district and five counties, with a permanent resident population of 3.661 million at the end of 2025. As a key city in the “2+26” region, Puyang is a typical oil and gas industrial city, where petrochemical industry is a pillar industry for its economic development and a key VOCs emission industry [19].
2.2. Data Sources
The monitoring data used in this study (from January 1, 2015, to December 31, 2025) were obtained from the China National Environmental Monitoring Center (http://www.cnemc.cn), including daily, monthly, and annual average concentrations of PM2.5, PM10, SO2, NO2, NO, CO, O3 (Ozone Maximum Daily 8-hour Average, MdA8 O3). Meteorological data were obtained from the Puyang Ecological Environment Bureau (http://sthjj.puyang.gov.cn).
CO and NOx emission data in Puyang were obtained from the MEIC Inventory developed by Tsinghua University (http://meicmodel.org.cn) [20]. Since the MEIC Inventory was only updated to 2023, this study used the 2015 to 2023 dataset for O3 formation rate calculations [21,23]. The dataset had a 0.25° × 0.25° spatial resolution, covers all sectors, and was reported on a monthly basis.
2.3. Research Methods
This study used O3 production efficiency (OPE) as an indicator for estimating O3 production. The original calculation formula for OPE was OPE = △O3/△NOz, indicating the number of O3 molecules generated per NOz molecule [21]. After several revisions, an OPE calculation formula using the regression slope of CO to NOx emission ratio and O3 to CO ratio was proposed:
In this formula, COems and NOx, ems represent CO and NOx emissions, respectively. This study used formula (1) to calculate OPE.
3. Results
3.1. Characteristics of PM2.5 and O3 in Puyang During 2015-2025
The annual mean concentration of PM2.5 decreased from 79.6 μg·m−3 to 39.3 μg·m−3 in Puyang during 2015-2025, representing a 50.6% reduction, although it was still exceeding the National Grade II standard of 30 μg·m−3. Notably, the PM2.5 of Puyang has exceeded that of many cities in “2+26” region. In August 2025, Puyang ranked fifth from the bottom in the air quality ranking of 168 cities nationwide, highlighting the challenges faced by Puyang as a typical resource-based industrial city.
Figure 1 presented the annual mean concentrations of PM2.5 and MdA8 O3 in Puyang and the Beijing-Tianjin-Hebei region from 2015 to 2025. The results showed that PM2.5 decreased year by year, while MdA8 O3 increased, with an increase from 123.0 μg·m−3 in 2015 to 189.6 μg·m−3 in 2025. Li et al. demonstrated that the Central Environmental Protection Inspection campaign has effectively decreased in PM2.5, PM10, SO2, CO, and NO2, with sustained decreases in SO2 and CO, yet its effects on PM2.5, NO2, and O3 were not statistically significant [22]. The limited effects on PM2.5 and O3 could be explained by the local government’s emphasis on primary emission controls (e.g., coal reduction, dust suppression, and vehicle restrictions), which were less effective for pollutants with complex secondary formation mechanisms like PM2.5 and O3.
The concentration of MdA8 O3 presented a continuous upward trend, which was consistent with the results of Ye et al [3], showing a decrease in PM2.5 accompanied by an increase in O3. In Beijing-Tianjin-Hebei region, however, both PM2.5 and MdA8 O3 decreased in 2015-2021. This difference may arise because the regional average of 13 cities obscures individual city variations. After 2022, MdA8 O3 in the Beijing-Tianjin-Hebei region rose sharply, exceeding 200 μg·m−3 and approaching Puyang’s levels, indicating that the “2+26” cities still face challenges in air pollution governance.
PM2.5 reduction in the “2+26” region is mainly due to enhanced measures such as coal reduction, dust suppression, and vehicle control [24,25]. However, there is a stark contrast between the rising concentration of O3 and the decreasing concentration of PM2.5. On the one hand, the reduction of pollutants such as NO in the atmosphere weakens the titration effect, releasing more O3 and leading to ozone accumulation [26]. On the other hand, the concentration of O3 generated by chemical reactions dominated by meteorological factors increases significantly. This is because the decrease in PM2.5 concentration increases atmospheric transparency, allowing stronger sunlight, which enhances the photochemical reactions of VOCs and NOx, thereby generating a large amount of O3. In recent years, the Huang-Huai region where Puyang is located has experienced an average temperature increase of 0.5-1.0°C, with an increase in extreme high temperatures in summer and stable sunlight. Moreover, Puyang sits on the Yellow River alluvial plain, where weak local winds and high summer temperatures favor continuous O3 formation. Li et al. found that the central environmental inspection had little effect on O3 [23], because rectification focused on primary emissions and O3 is strongly modulated by weather. Even with lower precursor emissions, hot and sunny conditions can still raise O3 levels. After 2022, O3 in the Beijing-Tianjin-Hebei region rebounded sharply, exceeding 200 μg·m−3—comparable to Puyang’s levels. This coincided with hot, dry weather that worsened photochemical smog, exposing structural governance issues and weather-driven variability [27]. These findings suggest that the “2+26” cities need to align emission cuts with climate adaptation, with a special focus on O3 control under high temperatures, to break the pattern of falling PM2.5 but rising O3.
3.2. Analysis of Exceedance Days in Puyang During 2015-2025
3.2.1. Statistical Characteristics of PM2.5-O3 Dual-Exceedance Days
Atmospheric compound pollution features high oxidant (e.g., O3) and PM2.5 levels [23]. Ambient Air Quality Standards (GB3095-2012) limited for PM2.5 daily mean and MDA8 O3 were 75 μg·m−3 and 160 μg·m−3, respectively. A compound pollution day is defined as a day when PM2.5 exceeds 75 μg·m−3 and MDA8 O3 exceeds 160 μg·m−3. The seasonal statistics of dual-exceedance days in Puyang from 2015 to 2025 were presented in Figure 2. The highest number of dual-exceedance days occurred in 2015, reaching 98 days. During 2016–2025, the number of days showed a fluctuating pattern.
In 2015, Puyang had 15 dual-exceedance days in winter, similar to other years, but much higher days in spring (38), summer (18), and autumn (27). In most other years, summer had only 1 or no such days. Summer in northern China was hot and humid with strong mixing, limiting PM2.5 accumulation [28,29], so dual-exceedance was rare despite frequent O3 exceedances from June to August. Across all years, dual-exceedance days mostly occurred in autumn and winter, with rare spring events (only 1 day in each of 2024 and 2025). This implied that pollution control efforts should address O3 pollution in spring and summer, while preventing PM2.5 and O3 dual-exceedance events in autumn and winter.
3.2.2. Influence of PM2.5 on O3 under O3-exceedance conditions
Previous studies have shown that O3 tends to increase as PM2.5 concentration decrease, as clearer skies favor O3 formation [10]. Qiu et al. found that PM2.5-O3 correlation varies with PM2.5 concentration when the O3 concentration exceed 160 μg·m−3 [6]. This indicates a nonlinear relationship between PM2.5 and O3.
According to the suggestions of Qiu et al., when R is between 0.1 and 0.4, there is a weak correlation between PM2.5 and O3 generation; when R is greater than 0.4, there is a strong correlation; and when R is less than 0.1, there is no correlation [6]. Table 1 summarized the correlation between PM2.5 and O3 during 2015-2015. This study selected days with O3 concentrations exceeding 160 and classified them into three groups according to PM2.5 levels (< 35 μg·m−3, 35-50 μg·m−3, and > 50 μg·m−3). The correlation coefficient (R value) between PM2.5 and O3 was calculated separately.
As shown in Table 1, all seasons presented a wear positive correlation at low PM2.5 levels (< 35 μg·m−3), with the highest R value of 0.38 in winter, followed by 0.37 in summer, 0.26 in autumn, and 0.21 in spring. This may be related to the accumulation of pollutants under stable weather conditions in winter and the increase in anthropogenic emissions such as coal-fired heating. PM2.5 and O3 showed no correlation in the medium concentration range (35-50 μg·m−3). At high PM2.5 levels (> 50 μg·m−3), the relationship turned complex. Winter maintained a weak positive correlation (R=0.09), whereas the other three seasons exhibited negative correlations, with the negative association intensifying progressively from spring to autumn (−0.06 in spring, −0.14 in summer, and −0.23 in autumn). This trend suggested a nonlinear PM2.5-O3 response at elevated concentrations.
In summary, PM2.5 and O3 showed the strongest positive synergy at low PM2.5 levels. While at high levels, a weak negative correlation emerged in non-winter seasons, reflecting a clear nonlinear relationship, thus the collaborative control of them needed to be tailored to local conditions, taking full account of regional differences.
3.3. Effects of Atmospheric Total Oxidants on PM2.5 and O3
Atmospheric oxidizing capacity is generally characterized by the atmospheric oxidation capacity (AOC), and the concentration of total atmospheric oxidants Ox (Ox = O3 + NO2) has been proven to describe AOC in urban areas [30]. O3 is an important oxidant in the atmosphere, playing a positive role in the formation of PM2.5. Section 3.2.2 analyzed the impact of PM2.5 on O3 formation under conditions where O3 exceeds 160 μg·m−3. This section explores the influence of oxidants on the generation of PM2.5.
Figure 3 presented the correlation between PM2.5, O3, and AOC in Puyang from 2015 to 2025. The results showed that the relationship between PM2.5 and O3, as well as total atmospheric oxidants Ox, is very similar, exhibiting significant seasonal characteristics. Taking Ox as an example, it was positively correlated in summer, with the correlation coefficient (R) stabilizing between 0.23 and 0.62 (R > 0.3 in most years), with an R value of 0.62 in 2020. In summer, PM2.5 concentrations were low, averaging 33.0 μg·m−3, and photochemical reactions were active under strong light. PM2.5 and secondary components in Ox are co-produced through common precursors (NOx, VOCs), thus exhibiting a positive correlation. This was consistent with the positive correlation between PM2.5 and O3 observed in the previous section when PM2.5 concentrations were less than 35 μg·m−3.
In winter, PM2.5 concentrations were higher, with a mean value of 105.7 μg·m−3. The correlation between PM2.5 and Ox fluctuated, with R ranging from −0.32 to 0.27. From 2017 to 2022, there was a predominantly negative correlation, reaching a trough of −0.32 in 2022. This was related to the increase in particulate matter concentrations due to primary pollutant emissions during winter heating and stable weather conditions, while low temperatures and weak light inhibited the formation of Ox, exhibiting an antagonistic phenomenon where PM2.5 increased and Ox decreased. From 2023 to 2025, a weak positive correlation was restored (R ranging from 0.11 to 0.22). In spring, the correlation between PM2.5 and Ox is the weakest, with an R value ranging from −0.20 to 0.22, alternating frequently between positive and negative, reflecting the unstable correlation caused by the complex and variable meteorological conditions (wind speed, temperature, and humidity) and pollution sources (the end of heating, spring dust) during the transition season between winter and summer. In autumn, the relationship between PM2.5 and Ox is similar to that in winter, with an R value ranging from −0.18 to 0.32.
The annual correlation between PM2.5 and Ox in Puyang could serve as an effective indicator to reveal the synergistic regulation mechanism among meteorological conditions, oil and gas source emission characteristics, and photochemical processes. In the summer of 2020, a strong positive correlation (R=0.62) was observed, driven by strong light-activated photolysis of oil and gas-related VOCs emitted from refining processes, which promoted the synergistic formation of secondary PM2.5 and Ox. In the winter of 2022, a strong negative correlation (R=−0.32) was associated with frequent occurrence of stable inversions (average wind speed <2 m·s−1, accounting for 65% of the days), low temperatures, and weak light (average temperature −1.2℃), coupled with a surge in primary emissions from oil and gas combustion and coal burning during the heating period, leading to an accumulation of PM2.5 and suppression of Ox, exhibiting an antagonistic effect. During 2023-2025, a weak positive correlation (winter: R = 0.11-0.22; summer: R = 0.32-0.46) was observed, reflecting the initial success in the collaborative emission reduction of VOCs/NOx from oil and gas sources under pollution reduction and carbon reduction efforts. Is also suggested that the seasonal contradiction between photochemistry and pollution sources has eased.
Furthermore, the interannual amplification effect of meteorological conditions was a key regulatory factor. Strong high temperatures and strong light in summer enhanced photochemical reactions and accelerated VOCs oxidation, strengthening the positive correlation. In winter, stable inversions restricted atmospheric diffusion, resulting in the accumulation of NOx from oil and gas combustion and PM2.5 emissions from coal combustion. These factors simultaneously weaken the formation of Ox, exacerbating the negative correlation. This amplification effect was more pronounced due to the high reactivity of VOCs/NOx, confirming the mechanism by which meteorology regulates atmospheric compound pollution through the boundary layer and photochemical activity [31].
In the Beijing-Tianjin-Hebei region, PM2.5 and Ox showed a positive correlation, with the strongest correlation in summer, but weaker than that in Puyang (R=0.23-0.62) [6]. Due to the uniqueness of Puyang’s oil and gas chemical industry, its VOCs emission is significant, and the mixed source characteristics of oil and gas combustion and heating were prominent. High VOCs emissions favored secondary organic aerosol formation, whereas strong solar radiation and stagnant weather conditions induced seasonal differentiation—photochemical enhancement in summer and primary emission suppression in winter. In summary, the PM2.5-Ox relationship was essentially the result of the comprehensive regulation of pollution sources, photochemical processes, and meteorological conditions in different seasons. The most significant feature was that photochemical synergy in summer versus primary emission suppression in winter represented the core challenge, whereas spring and autumn transitions add complexity, complicating pollution control. The weak positive correlation trend in recent years provides a positive signal for collaborative emission reduction, but it is necessary to continuously pay attention to seasonal differences to implement precise policies.
3.4. Relationship Between O3 Production Efficiency (OPE) and PM2.5/O3 in Puyang
The O3 production efficiency (OPE) can serve as a quantitative indicator for estimating O3 production and assessing O3 production sensitivity. Its definition and calculation formula are OPE=△O3/△NOz [21], indicating the number of O3 molecules generated per NOz molecule [32]. The formula has been revised some times, and this study adopted the new OPE calculation formula proposed by Wang et al., which uesed the CO/NOx emission ratio and the regression slope of O3/CO for calculation [33]. Some studies have found that when OPE<7, O3 production in the region is controlled by VOCs, while when OPE>9, it indicates control by NOx [34].
Figure 4 presented the variation curves of PM2.5, O3, and OPE from January 2015 to December 2023. The results showed that PM2.5 and OPE exhibit a long-term downward trend with seasonal fluctuations, while O3 shows a long-term upward trend with seasonal fluctuations. Overall, OPE decreased from 10-15 in 2015 to 8-12 in 2023 (with the lowest value of OPE = 7.95 in September 2020 and the highest value of OPE = 21.18 in January 2020). Within the year, it often increased periodically from January to February (with OPE > 15 in most years, such as 19.77 in January 2016 and 21.18 in January 2020), while in summer (June to August), it was mostly at a low level (such as 9.23 in August 2022 and 8.27 in May 2023), reflecting seasonal differences in photochemical efficiency.
The relationship between PM2.5 and OPE presented phased characteristics. In winter, high PM2.5 concentrations (such as 152.87 μg·m−3 in December 2016 and 146.26 μg·m−3 in January 2020) often correspond to higher OPE values (13-21), possibly due to the enhanced photochemical efficiency resulting from the accumulation of primary emissions and precursors from coal combustion. Conversely, low PM2.5 concentrations in summer (such as 24.81 μg·m−3 in August 2020 and 21.74 μg·m−3 in July 2023) were synchronized with lower OPE values (7-10), reflecting the suppression of OPE by insufficient precursors during clean periods. Overall, there was a differentiation of high PM2.5 (winter) with high OPE and low PM2.5 (summer) with low OPE. O3 exhibited a significant negative correlation with OPE. When O3 concentrations were high (strong sunlight in summer, such as 332.00 μg·m−3 in May 2015 and 338.50 μg·m−3 in June 2020), OPE tended to be lower (8-11), indicating that O3 generation saturation or rapid NOx consumption leads to a decrease. Conversely, when O3 concentrations were low (weak sunlight in winter, such as 112.88 μg·m−3 in January 2015 and 130.71 μg·m−3 in January 2020), OPE increased (15-21), suggesting that photochemical efficiency was relatively high under low O3 conditions.
Compared with different cities around the world, the long-term downward trend reflected the effectiveness of China’s regional NOx/VOCs emission reduction efforts. This contrasted with the persistently low OPE values (observed in 1995 to be 2.5-4) in the plume of power plants in the Nashville area of Tennessee, which were caused by industrial emissions [35]. The OPE values in Puyang were significantly lower than those in the Jungfraujoch site in Switzerland (elevation 3580m, OPE=18.8±1.3 from 1998 to 2004). The characteristic of high OPE in winter and low in summer corroborates the universality that OPE was dominated by seasonal variations in VOCs/NOx [36]. The pattern of high OPE in winter and low in summer was more consistent with the regional characteristics of northern China, where coal combustion accumulates NOx in winter and lacked clean precursors in summer. The dual correlation with positive correlation with PM2.5 and negative correlation with O3 not only echoed the low OPE values in urban pollution areas along Beijing’s main traffic lines (OPE=3.0 in 2004, range 1.5-6.0, with low OPE under high NOx conditions) [37], but also distinguished from the regional average characteristics calculated using the Yangtze River Delta model (OPE = 4-10, △O3/△NOy in 1999) [38], highlighting the uniqueness of Puyang’s OPE values. The differences between China’s non-industrial areas (mainly coal-fired, with low VOCs activity) and oil and gas cities underscored that O3 control in oil and gas industrial cities should prioritize NOx reduction. The low OPE and NOx suppression effects provide a unique pathway for prioritizing NOx control while also considering high-activity VOCs.
In summary, the monthly mean OPE values were greater than 7 (ranging from 7.95 to 21.18), indicating that O3 formation in Puyang is controlled by NOx, which is more directly related to the source of NOx from motor vehicles. Emphasis should be placed on the control of mobile sources, which is consistent with the research results of Wang et al. [21] and deeply reflects the dynamic changes in O3 formation sensitivity in oil and gas industrial cities, the amplification effect of meteorological conditions, and the significant differences from other types of cities. In terms of interannual trends, the decrease in OPE was related to the initial success of NOx control measures in the “2+26” region, but the peak value (21.18) in January 2020 exposed a seasonal surge in NOx from oil and gas combustion in winter. Meteorological regulation was a core variable, with high OPE values (13-21) in winter (January-February) corresponding to frequent stable inversions, low temperatures, and weak light (−1-5℃), which inhibit O3 photolysis but promote the accumulation of NOx and oil and gas-derived VOCs (such as OPE=19.77 in January 2016). Low OPE values (7-10) in summer corresponded to high temperatures and strong light-induced O3 saturation formation, and due to the high reactivity of oil and gas-derived VOCs, the meteorological amplification effect was more significant.
Figure 5 is a fitting graph of PM2.5, O3, and OPE in Puyang for each quarter from January 2015 to December 2023. The results showed that there is a significant positive correlation between PM2.5 and OPE (R=0.46-0.65), with the strongest correlation in spring (0.65), followed by winter (0.56), summer (0.60), and autumn (0.46). This indicated that an increase in PM2.5 concentration is often accompanied by an increase in OPE, which may be due to the simultaneous driving of particulate matter and O3 formation efficiency by secondary precursors (such as VOCs and NOx carriers) in PM2.5 or pollution sources (such as coal burning in winter and dust in spring), especially in spring where pollution sources and meteorological conditions (temperature rise) synergistically enhance the correlation between the two. The relationship between O3 and OPE exhibited a weak positive correlation in summer and negative correlations in the other seasons, with the strongest negative correlation in autumn. In summer (R=0.17), photochemical activity was active, and both O3 formation efficiency (OPE) and actual concentration (O3) increased simultaneously (e.g., under high temperature and strong light conditions, with sufficient precursors, high OPE leads to easy accumulation of O3), showing a weak positive correlation. In spring (R=−0.22), winter (R=−0.10), and autumn (R=−0.28), due to photochemical inhibition or non-summer O3 being limited by diffusion/precursors, there was an inverse change where O3 concentration increases while OPE decreases (e.g., in winter when O3 concentration was low, OPE increased inversely, and in autumn when O3 was slightly higher but OPE decreased due to insufficient precursors), with the strongest negative correlation in autumn (−0.28), reflecting a more significant antagonism between photochemical efficiency and O3 concentration in the transition season.
The positive correlation between OPE and PM2.5 throughout the year reflected that particulate matter concentration positively drives O3 generation efficiency through precursor accumulation or pollution source synergy, with the highest correlation intensity in spring. The relationship between OPE and O3 varied with seasonal photochemical activity, showing a weak positive correlation under photochemical synergy in summer, and a negative correlation in non-summer seasons (especially autumn) due to O3 saturation or diffusion interference, highlighting the nonlinear relationship between O3 concentration and generation efficiency. This pattern provided a seasonal differentiation basis for O3 sensitivity assessment and PM2.5-O3 synergistic control. In summer, attention should be paid to the synergistic effect of O3 and OPE, while in non-summer seasons, a balance between PM2.5 emission reduction and OPE regulation was needed to avoid abnormal O3 fluctuations.
4. Discussion
This study is based on long-term monitoring data from 2015 to 2025, and systematically reveals the nonlinear response characteristics of PM2.5 and O3 composite pollution in Puyang as a typical oil and gas industrial city. Its findings not only corroborate the research conclusions of existing "2+26" region and petrochemical industry cities, but also highlight the particularity of local source structure and geographic meteorological conditions. Unlike the "double decline" pattern of PM2.5 and O3 in the Beijing Tianjin Hebei region during the same period, O3 in Puyang has shown a continuous upward trend (with an average annual increase of about 4.8 μg·m−3), which is consistent with Li et al.’s conclusion that central environmental inspections have limited improvement effects on O3 inspections focus on primary emission control [4], while O3, as a secondary pollutant, is strongly modulated by weather and has non-linear precursor response, making it naturally more difficult to reduce than primary pollutants. The concentration stratification analysis further revealed a significant threshold effect on the correlation between PM2.5 and O3: weak positive correlation (R=0.21-0.38) was observed at low PM2.5 (<35 μg·m−3), and negative correlation turned to negative correlation (R=-0.23 in autumn) at high PM2.5 (>50 μg·m−3). This feature is highly consistent with the research in Dongying city, and supports the inhibitory effect of aerosol radiation feedback and heterogeneous chemical consumption on photochemical processes in the high concentration range. In terms of sensitivity to O3 generation, the monthly average OPE value remained above 7 (7.95-21.18), indicating that Puyang is in the NOx control zone; The winter OPE peak (reaching 21.18 in January 2020) was significantly higher than the range reported by Wang et al. in the "2+26" region (8-14)[19] and the background station of Jungfrau in Switzerland (≈ 18.8) [36] , and even higher than the smoke plume of the Nashville power plant in the United States (2.5-4) [35], reflecting the seasonal accumulation of NOx caused by the combination of oil and gas combustion and coal-fired heating, confirming the decisive role of emission source structure in Ox generation efficiency. OPE is significantly positively correlated with PM2.5 (R=0.46-0.65) and seasonally correlated with O3 (R=0.17 in summer and -0.28 in autumn), indicating that the "high OPE low O3" state in winter constitutes a potential photochemical reserve effect - after the increase in photolysis rate due to spring warming, the accumulated NOx will be rapidly converted into O3, which may be one of the key driving mechanisms for the spring O3 jump in Puyang.
The long-term time series and OPE methodology of this study have certain advantages, but are limited by the lack of VOCs species observations, lack of quantitative separation of meteorological and emission contributions, and single city perspectives, which restrict the regional extrapolation of free radical path analysis and conclusions. In the future, it is necessary to integrate VOCs component monitoring, chemical chamber models, and meteorological normalization methods to quantitatively decouple emission reduction and meteorological effects, and provide PM ₂ for oil and gas cities Provide precise support for collaborative governance with O3.
5. Conclusions
Puyang is one of the key cities in the “2+26” region, exhibiting a compound pollution characteristic of dual pollution from PM2.5 and O3. From 2015 to 2025, the annual average concentration of PM2.5 decreased from 79.6 μg·m−3 to 39.3 μg·m−3, while the annual average concentration of O3 continued to rise from 123.0 to 189.6 μg·m−3. This study defined a composite pollution day as one where the daily average PM2.5 concentration was higher than 75 μg·m−3 and the MDA8 O3 concentration was higher than 160 μg·m−3. The results showed that the number of double-standard-exceeding days was the highest in 2015, with 98 days exceeding both standards; from 2016 to 2025, the number of double-standard-exceeding days fluctuated, ranging from 23 to 51 days in all years except 2025. Under the condition of MDA8 O3 concentration higher than 160 μg·m−3, there was a nonlinear correlation between PM2.5 and O3. When PM2.5 was less than 35 μg·m−3, there was a weak positive correlation between PM2.5 and O3, with the strongest correlation in winter, reaching a value of 0.38, followed by summer (0.37), autumn (0.26), and spring (0.21). This was related to the accumulation of pollutants under stable weather conditions in winter and the increase in anthropogenic emissions such as heating. When PM2.5 was less than 50 μg·m−3 but greater than 35 μg·m−3, there was no significant correlation between PM2.5 and O3, and the correlation coefficients were all small; when PM2.5 was greater than 50 μg·m−3, there was a negative correlation in non-winter seasons (with the deepest correlation in autumn at −0.23), reflecting seasonal differences in photochemical and diffusion conditions. However, there was still a weak positive correlation in winter (0.09), indicating a nonlinear PM2.5-O3 response relationship at high concentrations.
The correlation between PM2.5 and atmospheric oxidants (O3, Ox) exhibited significant seasonal variations. In summer, due to active photochemical reactions under strong sunlight and the synergistic formation of secondary components, there was a strong positive correlation, with R values ranging from 0.23 to 0.62, peaking at 0.62 in 2020. In winter, due to primary emissions from heating and the suppression by low temperatures and weak sunlight, there was a fluctuating negative correlation, mainly manifested from 2017 to 2022, with a trough value of −0.32 in 2022, followed by a weak positive correlation from 2023 to 2025. In spring and autumn, due to transitional meteorological conditions and changes in pollution sources, the correlation was weak and unstable, with frequent alternating positive and negative values in spring and fluctuations similar to those in winter. The O3 production efficiency (OPE) has been declining over the long term (from 10-15 to 8-12), showing a significant positive correlation with PM2.5, with R values fluctuating between 0.46 and 0.65, with the strongest correlation in spring, where R was 0.65. The monthly average OPE values were all greater than 7, indicating that O3 formation was controlled by NOx. It was necessary to control PM2.5 and O3 in a coordinated manner, with a focus on photochemical risks and dual exceedances (mainly in autumn and winter) in summer. Seasonal differentiated governance should be strengthened to provide a scientific basis for the comprehensive pollution control of resource-based industrial cities.
Author Contributions
Z.W. was the data analyst and writer during the process of the thesis writing; I have read and agreed to the published version of the manuscript.
Funding
We would like to thank Research Launch Fund in Ordos Vocational College of Eco-Environment for funding assistance.
Institutional Review Board Statement
Not applicable.
Informed Consent Statement
Not applicable.
Data Availability Statement
Data is unavailable due to privacy now. We will share data when appropriate.
Conflicts of Interest
The authors declare no conflict of interest.
References
- Xie, X. D.; Hu, J. L.; Zhang, Y. H. Research topic and trend analysis of ozone pollution in China based on bibliometric review. Chin. Environ. Sci. 2024, 44(12), 6513–6521. (In Chinese) [Google Scholar]
- Chen, S. Y.; Wang, H. C.; Lu, K. D. The trend of surface ozone in Beijing from 2013 to 2019: Indications of the persisting strong atmospheric oxidation capacity. Atmos. Environ. 2020, 242, 117801. [Google Scholar] [CrossRef]
- Ye, S.; Wang, P.; Huang, Y.; She, Y. Y.; Ding, M. J. Urban morphology and the influence of the spatial heterogeneity of PM2.5 and O3 pollution: The case of the Yangtze River Delta. Ecol. Environ. Sci. 2023, 32(10), 1771–1784. [Google Scholar]
- Li, K.; Jacob, D.J.; Liao, H.; Zhu, J.; Shah, V.; Shen, L.; Bates, K.H.; Zhang, Q.; Zhai, S. A two-pollutant strategy for improving ozone and particulate air quality in China. Nat. Geosci. 2019, 12(11), 906–910. [Google Scholar] [CrossRef]
- Duan, W. J.; Wang, X.; Cheng, S.; Wang, R.; Zhu, J. Influencing factors of PM2.5 and O3 from 2016 to 2020 based on DLNM and WRF-CMAQ. Environ. Pollut. 2021, 285, 117512. [Google Scholar] [CrossRef] [PubMed]
- Qiu, Y. T.; Wu, Z. J.; Shang, D. J.; Zhang, Z. Y.; Xu, N.; Zong, T. M.; Zhao, G.; Tang, L. Z.; Guo, S.; Wang, S.; Dao, X.; Wang, X. F.; Tang, G. G.; Hu, M. The temporal and spatial distribution of the correlation between PM2.5 and O3 contractions in the urban atmosphere of China. Chin. Sci. Bull. 2022, 67(18), 2008–2017. (In Chinese) [Google Scholar] [CrossRef]
- Wang, Y.; Qu, K.; Ge, Y. Z.; Liu, H.; Chen, C.; Wang, W. X.; Sui, X.; Wei, M.; Shi, X. L.; Liu, H. F. Impact Factors of O3 and PM2.5 Pollution in Typical Cities of the Shandong Province Based on Random Forest Model. Environ. Sci. 2025, 46(4), 2103–2114. (In Chinese) [Google Scholar] [CrossRef] [PubMed]
- Zou, B.; Xie, M. M.; Li, S.; Liu, N.; Li, S. X.; Xiong, Y. Exploring the drivers of PM2.5-O3 spatial differentiation in 274 Chinese prefecture-level cities. Chin. Environ. Sci. 2025, 45(11), 6032–6044. (In Chinese) [Google Scholar]
- Xu, Y. Z.; Yang, Y. C.; Liu, Y. J.; Meng, P.; Sun, N. X.; Wu, L.; Mao, H. J. Impact characteristics of typical atmospheric circulation on the combined pollution of PM2.5 and O3 in Tianjin, Chin. Environ. Sci. 2023, 43(10), 5078–5087. (In Chinese) [Google Scholar]
- Yuan, T. L.; Remer, L. A.; Bian, H. S.; Ziemke, J. R.; Albrecht, R.; Pickering, K. E.; Oreopoulos, L.; Goodman, S. J.; Yu, H. B.; Allen, D. J. Aerosol indirect effect on tropospheric ozone via lightning. J. Geophys. Res. Atmos. 2012, 117, D18. [Google Scholar] [CrossRef]
- Li, K.; Jacob, D. J.; Liao, H.; Shen, L.; Zhang, Q.; Bates, K. H. Anthropogenic drivers of 2013–2017 trends in summer surface ozone in China. Proc. Natl. Acad. Sci. 2019, 116(2), 422–427. [Google Scholar] [CrossRef] [PubMed]
- Tan, Z. F.; Andreas, H.; Lu, K. D.; Brown, S. S.; Holland, F.; Huey, L. G.; Kiendler-Scharr, A.; Li, X.; Liu, X. X.; Ma, N.; Min, K. E.; Rohrer, F.; Shao, M.; Wahner, A.; Wang, Y. H.; Wiedensohler, A.; Wu, Y. S.; Wu, Z. J.; Zeng, L. M.; Zhang, Y. H.; Fuchs, H. No evidence for a significant impact of heterogeneous chemistry on radical concentrations in the North China Plain in summer 2014. Environ. Sci. Technol. 2020, 54(10), 5973–5979. [Google Scholar] [CrossRef] [PubMed]
- Wu, J. S.; Wang, Y.; Liang, J. T.; Yao, F. Exploring common factors influencing PM2.5 and O3 concentrations in the Pearl River Delta: Tradeoffs and synergies. Environ. Pollut. 2021, 285(117138), 10–16. [Google Scholar] [CrossRef] [PubMed]
- Li, T.W.; Yang, Q. Q.; Wang, Y.; Wu, J. A. Joint estimation of PM2.5 and O3 over China using a knowledge-informed neural network. Geosci. Front. 2023, 14(2), 101499. [Google Scholar] [CrossRef]
- Ravishankara, A. R. Heterogeneous and multiphase chemistry in the troposphere. Sci. 1997, 276(5315), 1058–1065. [Google Scholar] [CrossRef]
- Yan, W. L.; Liu, D. Y.; Wang, L.; Li, C. Analysis of characteristics and meteorological conditions of PM2.5-O3 compound pollution in Jiangsu province, Chin. Environ. Sci. 2023, 43(10), 5098–5106. (In Chinese) [Google Scholar]
- Liu, Z.; An, X. Q.; Wang, C.; Li, J. T. Emission reduction measures for typical PM2.5 and O3 co-pollution event based on the adjoint model. Chin. Environ. Sci. 2024, 44(12), 6559–6568. (In Chinese) [Google Scholar]
- Zhong, B. W.; Zhou, J.; Wang, Y.; Yuan, B.; Shao, M. Review of ozone formation sensitivity in China. Chin. Environ. Sci. 2024, 44(12), 6522–6537. (In Chinese) [Google Scholar]
- Wang, B.; Li, G. M.; Zhang, X. M.; Ma, H. L.; Wu, D. L.; Wang, W. H.; Wang, X. Z. Pollution characteristics and source analysis of atmospheric VOCs: taking Puyang, one of the “2+26” cities, as an example. Environ. Pollut. Control. 2024, 46(3), 380–386. (In Chinese) [Google Scholar]
- Geng, G.; Liu, Y.; Liu, Y.; Liu, S.; Cheng, J.; Yan, L.; Wu, N.; Hu, H.; Tong, D.; Zheng, B.; Yin, Z.; He, K.; Zhang, Q. Efficacy of China’s clean air actions to tackle PM2.5 pollution between 2013 and 2020. Nat. Geosci. 2024, 17(10), 987–994. [Google Scholar] [CrossRef]
- Liu, S. C.; Trainer, M.; Fehsenfeld, F. C.; Parrish, D. D.; Williams, E. J.; Fahey, D. W.; Hübler, G.; Murphy, P. C. Ozone production in the rural troposphere and the implications for regional and global ozone distributions. J. Geophys. Res. Atmos. 1987, 92(D4), 4191–4207. [Google Scholar] [CrossRef]
- Li, S. G.; Lu, Y. N.; He, C. Central Environmental Protection Inspection and Audit Fees: An Examination Based on the Multiperiod Difference-in-Differences Method. Sci. Manag. Res. 2022, 7, 129–148. [Google Scholar]
- Zhu, T.; Shang, J.; Zhao, D. F. The roles of heterogeneous chemical processes in the formation of an air pollution complex and gray haze. Sci. Sin. Chin. 2010, 12, 1731–1740. (In Chinese) [Google Scholar]
- Xiang, S. L.; Liu, J. F.; Tao, W.; Yi, K.; Xu, J. Y.; Hu, X. R.; Liu, H. Z.; Wang, Y. Q.; Zhang, Y. Z.; Yang, H. Z.; Hu, J. Y.; Wan, Y.; Wang, X. J.; Ma, J. M.; Wang, X. L. Control of both PM2.5 and O3 in Beijing-Tianjin-Hebei and the surrounding areas. Atmos. Environ. 2020, 224, 117259. [Google Scholar] [CrossRef]
- Wang, J.; Gao, A.; Li, S.; Liu, Y.; Zhao, W.; Wang, P.; Zhang, H. Regional joint PM2.5-O3 control policy benefits further air quality improvement and human health protection in Beijing-Tianjin-Hebei and its surrounding areas. J. Environ. Sci. 2023, 130, 75–84. [Google Scholar] [CrossRef] [PubMed]
- Huang, X.; Ding, A.; Gao, J. Enhanced secondary pollution offset reduction of primary emissions during COVID-19 lockdown in China. Natl. Sci. Rev. 2021, 8(2), nwaa137. [Google Scholar] [CrossRef] [PubMed]
- Wang, X. H.; Ma, M. H.; Xin, S. Y. Analysis of ozone pollution characteristics and influencing factors in Beijing-Tianjin-Hebei Region from 2019 to 2022. Environ. Pollut. Control. 2024, 46(6), 777–788. (In Chinese) [Google Scholar]
- Zhang, X. L.; Xiong, Y. J.; Xu, J. Analysis of the Impact of Meteorological Conditions on the Increase and Improvement of Fine Particle Concentration in the Beijing-Tianjin-Hebei Region. The 8th National Symposium on Fine and Ultrafine Particles Technology and PM2.5 Source Apportionment Exchange Conference, 2015. [Google Scholar]
- Zhang, G. B.; Cao, J. Y.; Qiu, X. H.; Peng, L. Impact of Change in Meteorological Conditions on PM2.5 Air Quality Improvement in Beijing-Tianjin-Hebei Region Using Process Analysis. Environ. Sci. 2024, 45(11), 6219–6228. [Google Scholar] [CrossRef] [PubMed]
- Tan, Z. F.; Lu, K. D.; Jiang, M. Q.; Su, R.; Wang, H. L.; Lou, S. R.; Fu, Q. Y.; Zhai, C. Z.; Tan, Q. W.; Yue, D. L.; Chen, D. H.; Wang, Z. S.; Xie, S. D.; Zeng, L. M.; Zhang, Y. H. Daytime atmospheric oxidation capacity in four Chinese megacities during the photochemically polluted season: a case study based on box model simulation. Atmos. Chem. Phys. 2019, 19(6), 3493–3513. [Google Scholar] [CrossRef]
- Zhu, B.; Yang, S.; Shi, S.; Jiang, Z.; Tang, G.; Lu, C.; Hou, X.; An, J.; Xia, L.; Liao, H. Revealing Distinct Photochemical Ages within the Vertical Boundary Layer and Seasons by Observed VOC Species Ratios. Environ. Sci. Technol. 2025, 2(7), 1172–1179. [Google Scholar] [CrossRef]
- Xu, X. B.; Ge, B. Z.; Lin, W. L. Progresses in the Research of Ozone Production Efficiency (OPE). Adv. Earth. Sci. 2009, 24(8), 845–853. (In Chinese) [Google Scholar]
- Wang, J. H.; Ge, B. Z.; Wang, Z. F. Ozone production efficiency in highly polluted environments. Curr. Pollut. Rep. 2018, 4(3), 198–207. [Google Scholar] [CrossRef]
- Sillman, S. The use of NOy, H2O2, and HNO3 as indicators for ozone-NOx-hydrocarbon sensitivity in urban locations. J. Geophys. Res. Atmos. 1995, 100(D7), 14175–14188. [Google Scholar] [CrossRef]
- Nunnermacker, L. J.; Imre, D.; Daum, P. H.; Kleinman, L.; Lee, Y. N.; Lee, J. H.; Springston, S. R.; Newman, L.; Weinstein-Lloyd, J.; Luke, W. T.; Banta, R.; Alvarez, R.; Senff, C.; Sillman, S.; Holdren, M.; Keigley, G. W.; Zhou, X. Characterization of the Nashville urban plume on July 3 and July 18, 1995. J. Geophys. Res. Atmos. 1998, 103(D21), 28129–28148. [Google Scholar] [CrossRef]
- Zanis, P.; Ganser, A.; Zellweger, C.; Henne, S.; Steinbacher, M.; Staehelin, J. Seasonal variability of measured ozone production efficiencies in the lower free troposphere of Central Europe. Atmos. Chem. Phys. 2007, 7(1), 223–236. [Google Scholar] [CrossRef]
- An, J. L. Ozone production efficiency in Beijing area with high NOx emissions. Acta Sci. Circumstantiae. 2006, 26(4), 652–657. (In Chinese) [Google Scholar]
- Hu, J. L.; Zhang, Y. H. Process analysis of ozone formation in the Yangtze River Delta. Res. Environ. Sci. 2005, 18(2), 13–18. [Google Scholar]
Figure 1.
The annual mean concentrations of PM2.5 and MDA8 O3 in Puyang and the Beijing-Tianjin-Hebei region during 2015-2025.
Figure 1.
The annual mean concentrations of PM2.5 and MDA8 O3 in Puyang and the Beijing-Tianjin-Hebei region during 2015-2025.
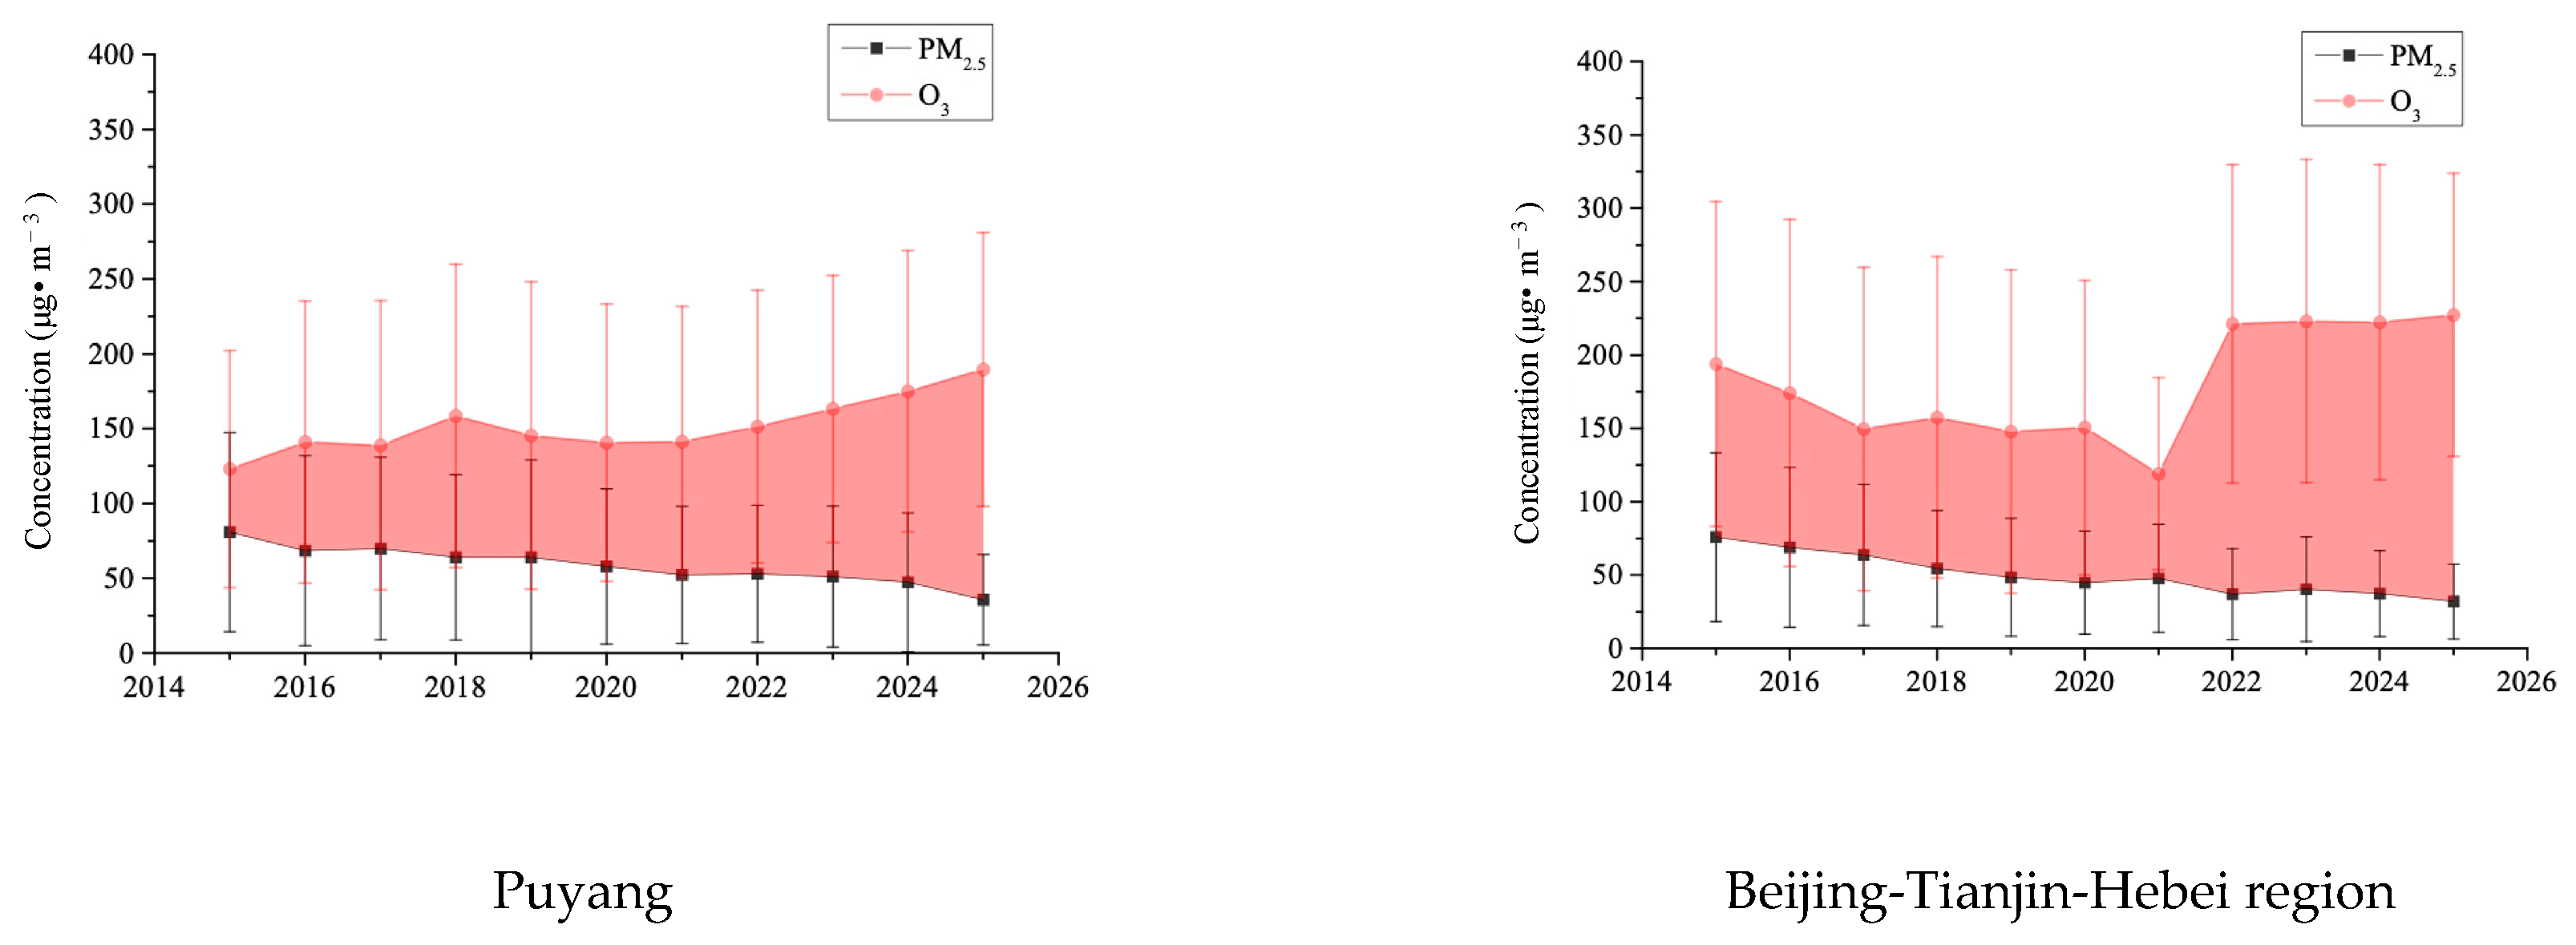
Figure 2.
Statistical chart of PM-O3 dual-exceedance days in each quarter of Puyang during 2015-2025.
Figure 2.
Statistical chart of PM-O3 dual-exceedance days in each quarter of Puyang during 2015-2025.
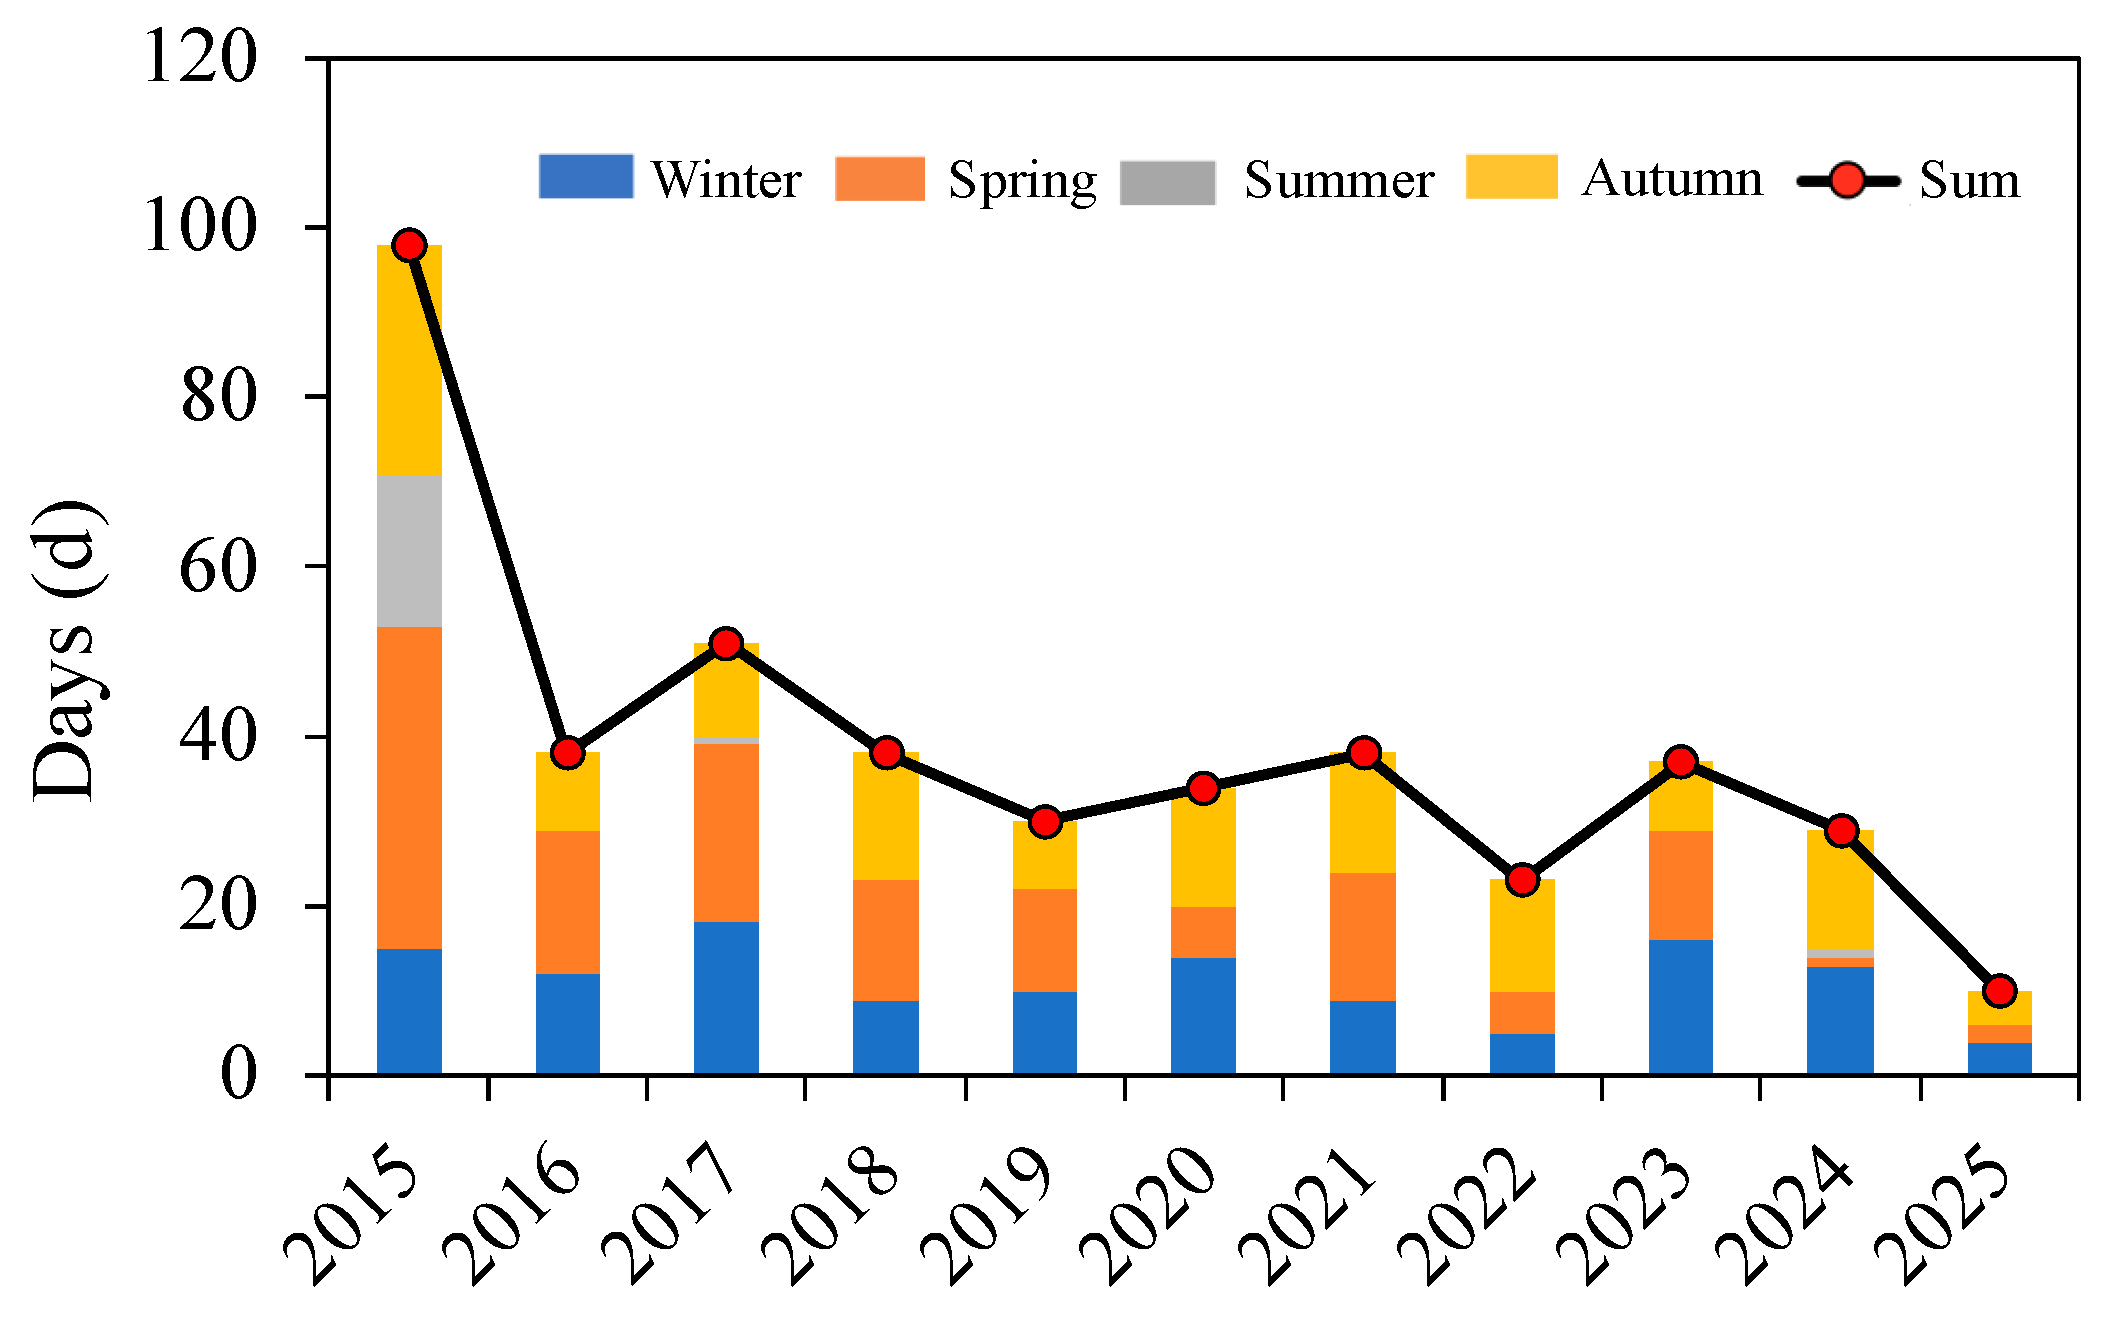
Figure 3.
Correlation filling chart of PM with O3 and AOC in Puyang from January 2015 to November 2025.
Figure 3.
Correlation filling chart of PM with O3 and AOC in Puyang from January 2015 to November 2025.
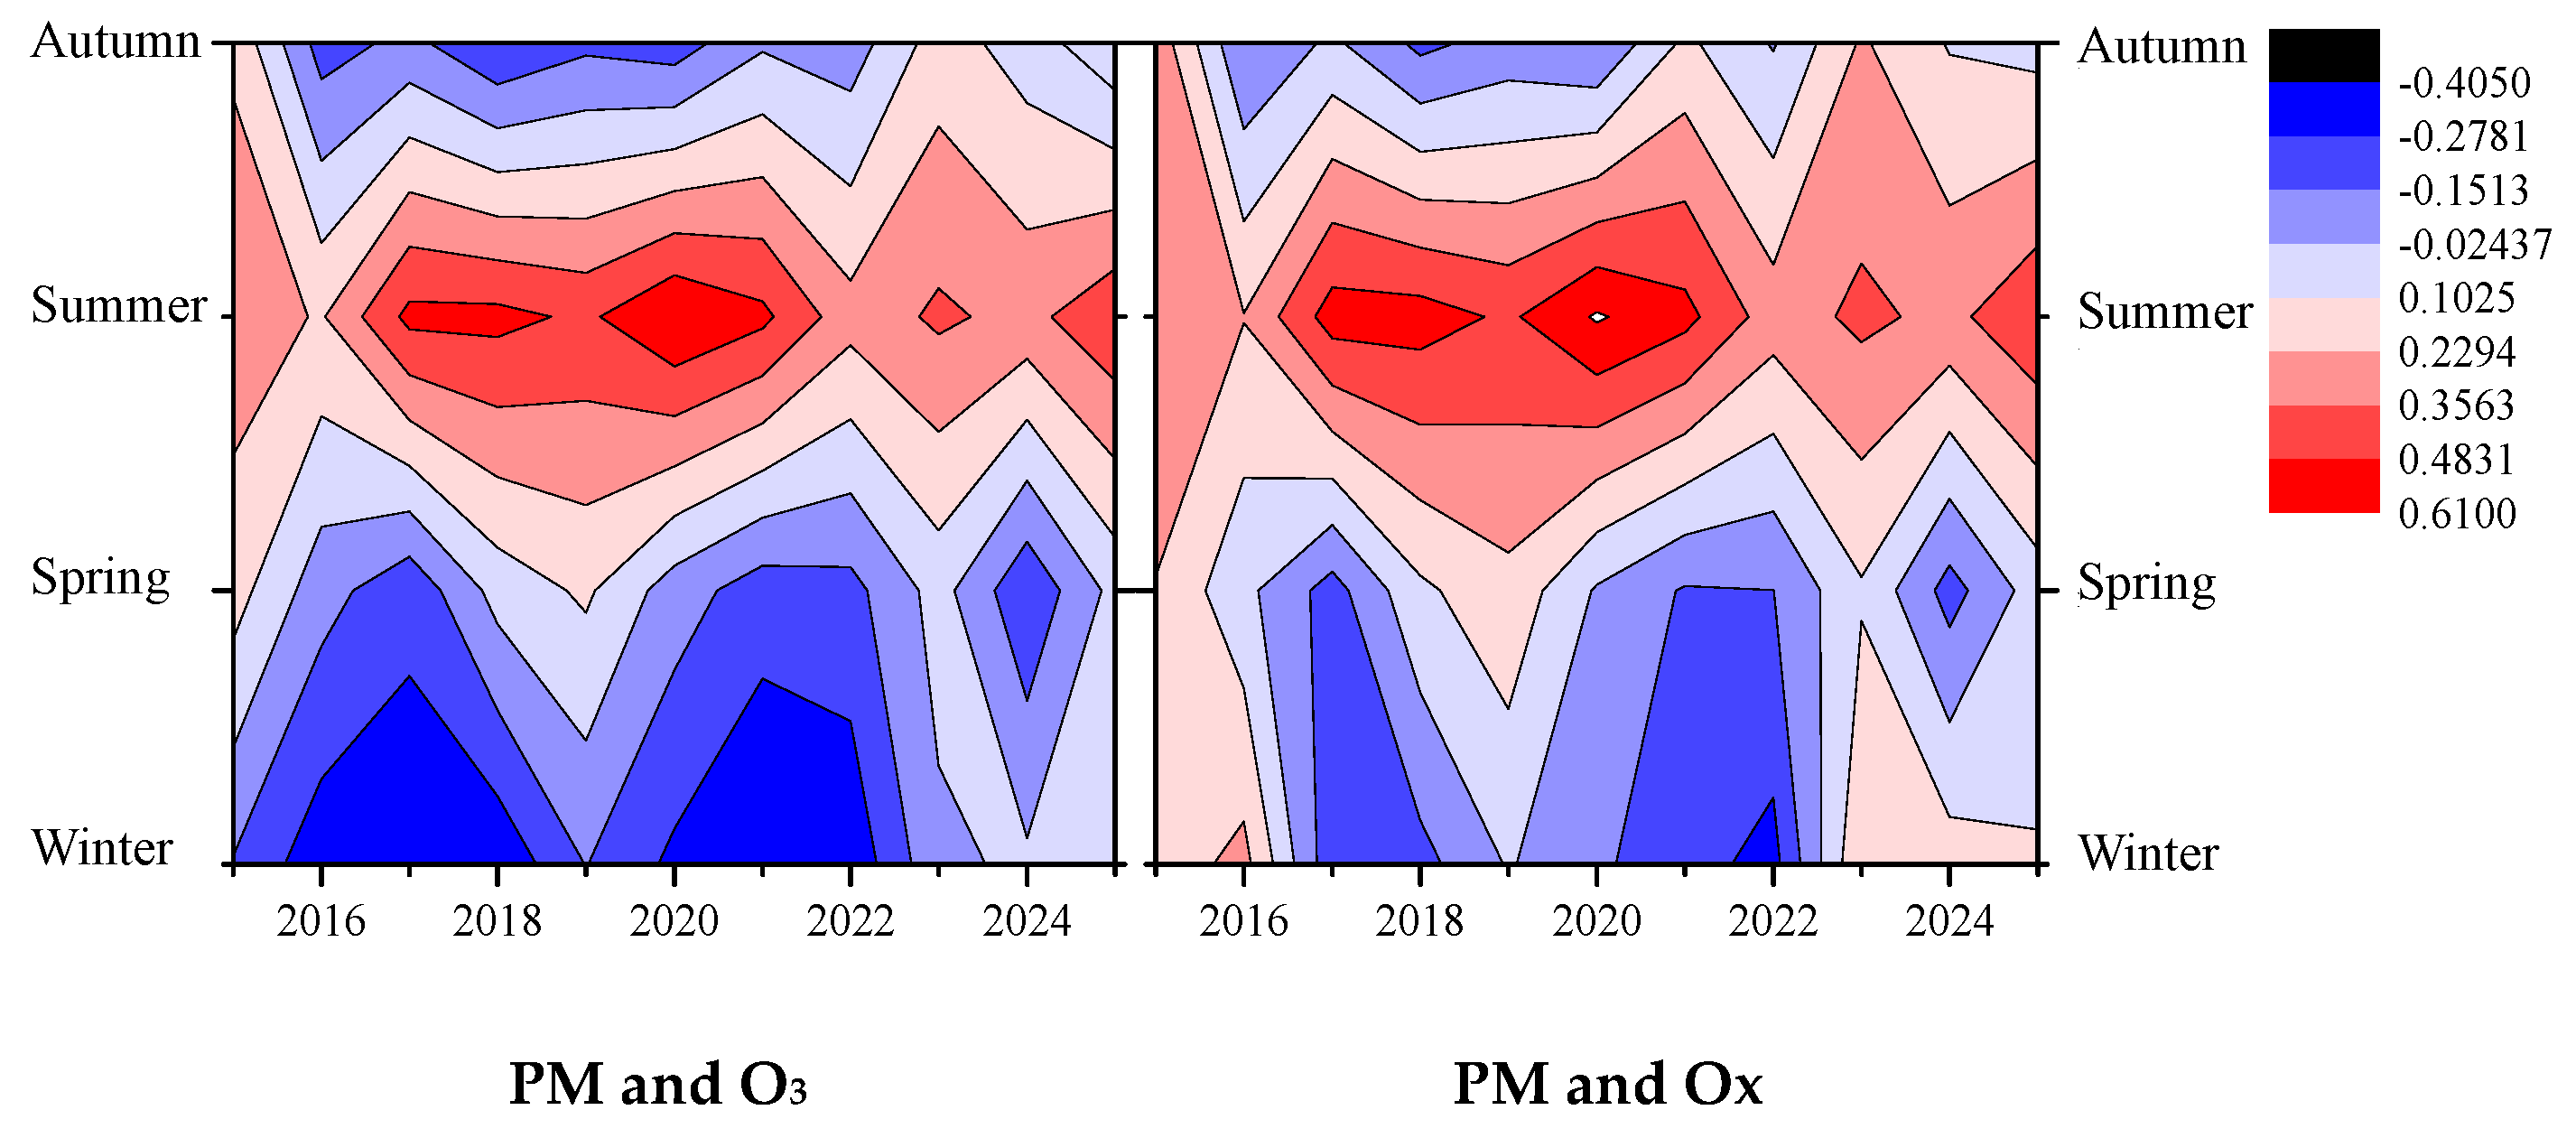
Figure 4.
Monthly average variation curves of PM2.5, O3, and OPE in Puyang from January 2015 to December 2023 (OPE using the right coordinate).
Figure 4.
Monthly average variation curves of PM2.5, O3, and OPE in Puyang from January 2015 to December 2023 (OPE using the right coordinate).
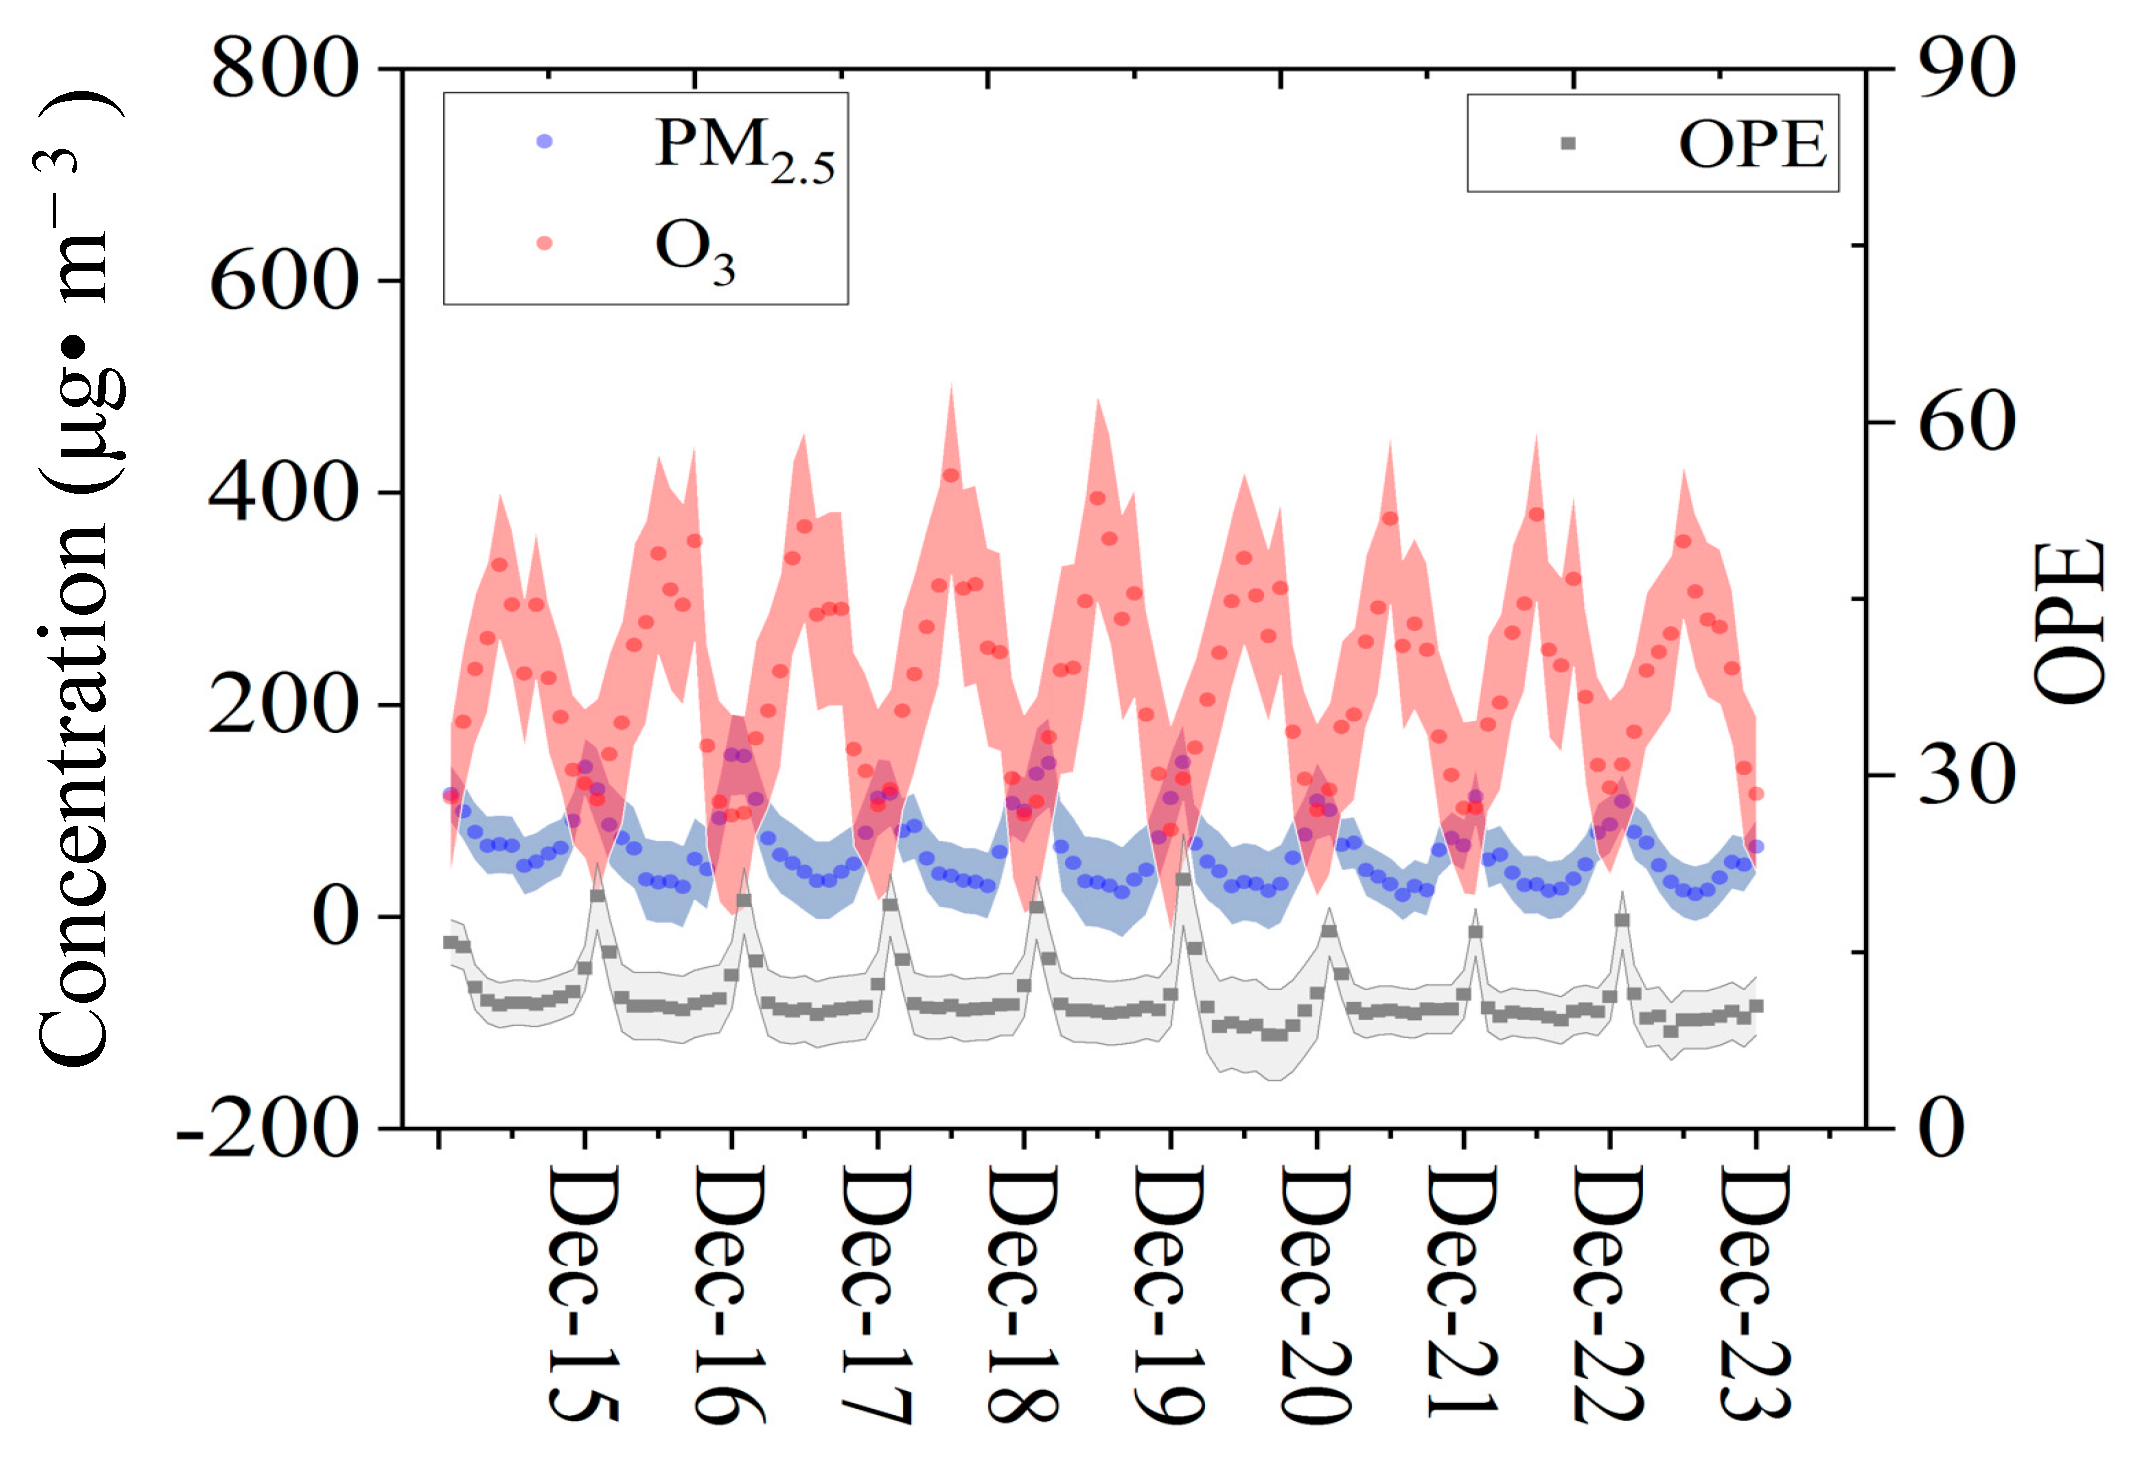
Figure 5.
Fit chart of PM2.5, O3, and OPE in Puyang for each quarter from January 2015 to December 2023.
Figure 5.
Fit chart of PM2.5, O3, and OPE in Puyang for each quarter from January 2015 to December 2023.
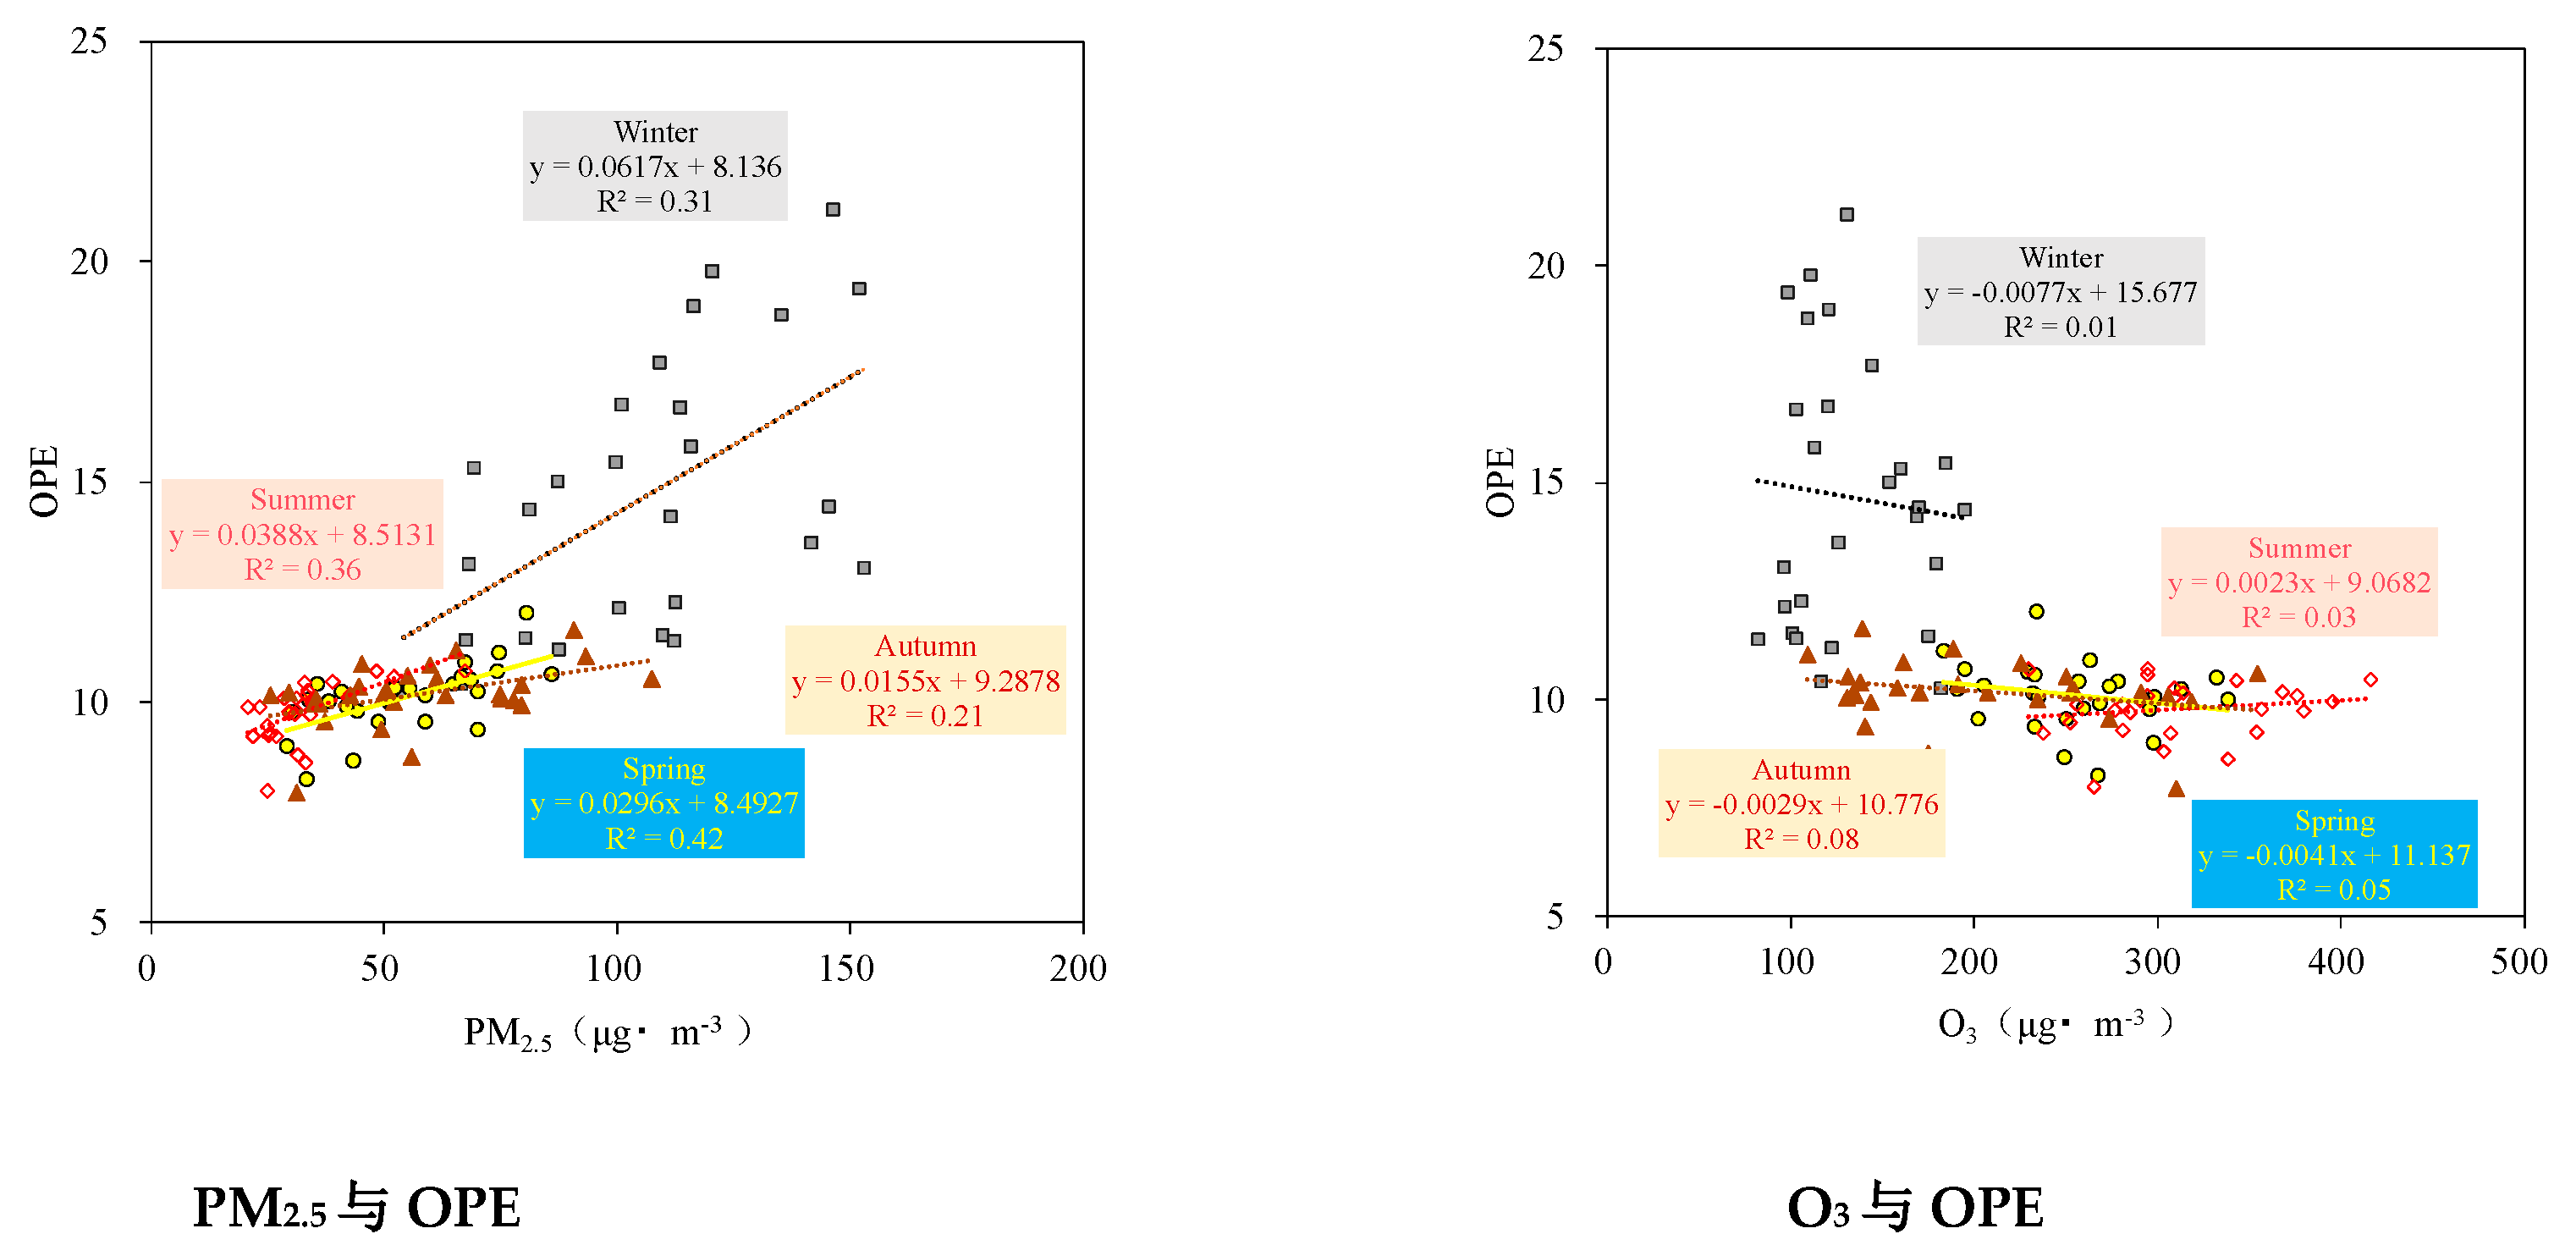

Table 1.
Correlation analysis between PM2.5 and O3 from 2015 to 2025.
| R | Winter | Spring | Summer | Autumn |
| PM2.5<35 μg·m−3 | 0.38 | 0.21 | 0.37 | 0.26 |
| 35 μg·m−3<PM2.5<50 μg·m−3 | 0.02 | 0.00 | 0.04 | 0.08 |
| 50 μg·m−3<PM2.5 | 0.09 | −0.06 | −0.14 | −0.23 |
Disclaimer/Publisher’s Note: The statements, opinions and data contained in all publications are solely those of the individual author(s) and contributor(s) and not of MDPI and/or the editor(s). MDPI and/or the editor(s) disclaim responsibility for any injury to people or property resulting from any ideas, methods, instructions or products referred to in the content. |
© 2026 by the authors. Licensee MDPI, Basel, Switzerland. This article is an open access article distributed under the terms and conditions of the Creative Commons Attribution (CC BY) license (http://creativecommons.org/licenses/by/4.0/).
Copyright: This open access article is published under a Creative Commons CC BY 4.0 license, which permit the free download, distribution, and reuse, provided that the author and preprint are cited in any reuse.