

Submitted:
02 September 2026
Posted:
03 September 2026
You are already at the latest version
Abstract
Understanding organ-specific effects of multi-agonist metabolic therapies beyond weight loss remains challenging, particularly while randomized clinical trials are ongoing and treatment allocation remains blinded. Here, we evaluated whether real-world longitudinal biomarker trajectories can provide early hypothesis-generating signals associated with masked trial-medication exposure. Using propensity-matched, de-identified electronic health records from a large federated health network, we compared changes in laboratory and physiologic biomarkers across receptor-defined metabolic therapies. Semaglutide, tirzepatide, and pramlintide served as reference therapies representing GLP-1 receptor, dual GIPR-GLP1R, and amylin-pathway pharmacology, respectively. Individuals with documented participation in a blinded CagriSema/placebo clinical trial were analyzed as a single masked exposure group because active treatment assignment could not be determined from routine-care records. Twenty-five CagriSema/placebo participants were propensity matched 1:5 to tirzepatide (n=125) and empagliflozin (n=125). At 6 months, the masked CagriSema/placebo cohort showed similar changes in weight and HbA1c compared with matched tirzepatide-treated patients (weight, -7.7% vs -10.2%, P=0.27; HbA1c, -2.8% vs -5.1%, P=0.69), but larger increases in estimated glomerular filtration rate (+26.4% vs +6.5%, BH P=0.028). Compared with matched empagliflozin-treated patients, the masked cohort demonstrated larger reductions in weight (-7.7% vs -3.5%, P=0.048), mean arterial pressure (-12.0% vs -1.0%, BH P<0.001), creatinine (-17.4% vs -2.4%, BH P=0.020), and greater increases in eGFR (+26.4% vs +6.4%, BH P=0.030). To provide pharmacologic context, patients with type 2 diabetes receiving basal insulin who initiated pramlintide were independently matched to tirzepatide (652 pairs) and semaglutide (761 pairs). Tirzepatide and semaglutide were associated with larger HbA1c reductions than pramlintide at 6 months (-9.0% vs -3.0%, BH P<0.001; -10.1% vs -3.5%, BH P<0.001). However, after normalization for weight loss, pramlintide demonstrated greater blood pressure reduction per kilogram of weight lost than tirzepatide for both systolic (-4.9 vs -3.4% per kg, BH P=0.046) and diastolic blood pressure (-5.7 vs -3.4% per kg, BH P=0.029), whereas tirzepatide and semaglutide showed similar weight-normalized laboratory responses. Medication-transition analyses did not support co-intervention confounding, and single-cell transcriptomic analyses demonstrated substantially broader expression of amylin receptor components (CALCR, RAMP1/2/3) than GIPR or GLP1R in the kidney (9.8-14.7-fold). These findings illustrate how real-world longitudinal biomarker analyses can complement ongoing blinded clinical trials by identifying early, hypothesis-generating physiologic signals associated with masked trial-medication exposure. The observed renal and blood-pressure patterns, together with receptor-expression analyses, motivate prospective evaluation after trial unblinding to determine whether they reflect amylin-pathway biology or other treatment-associated effects.
Keywords:
GLP1 receptor
; amylin receptor
; cagrisema
; semaglutide
; tirzepatide
Introduction
Next-generation incretin and amylin-based therapeutics have rapidly changed the treatment landscape for obesity and type 2 diabetes. Tirzepatide, a dual glucose-dependent insulinotropic polypeptide receptor (GIPR) and glucagon-like peptide-1 (GLP-1) receptor agonist, produces substantial weight loss in obesity [1], while CagriSema combines GLP-1 receptor agonist semaglutide with cagrilintide, a long-acting amylin analogue, and has shown clinically meaningful weight reduction in phase 2 and phase 3 studies [2,3,4,5,6]. These therapies are now being evaluated not only as metabolic agents, but also as candidates for cardiovascular, kidney disease, and broader metabolic condition modification.
Multi-agonist metabolic therapies make it difficult to distinguish organ-specific benefits mediated by GLP-1R, GIPR, and amylin-receptor signaling from benefits secondary to weight loss. This distinction is increasingly important because semaglutide reduces cardiovascular events in patients with type 2 diabetes and in obesity without diabetes [7,8], and improves clinically important kidney outcomes in type 2 diabetes with chronic kidney disease [9]. Mechanistic studies further suggest that GLP-1 receptor agonism may influence renal hemodynamics, inflammation, natriuresis, and vascular biology beyond glycemic control alone [10,11]. Yet pivotal obesity trials commonly prioritize body weight and glycated hemoglobin, while organ-specific effects on kidney, heart, vasculature, and brain biology are often studied later in dedicated outcomes trials or inferred from routine-care data after approval. This creates an opportunity to assess whether longitudinal routine-care data collected while trials are ongoing can identify early trial-associated biomarker signals that merit prospective evaluation.
CagriSema and tirzepatide provide an informative receptor-resolved contrast because they share GLP-1 receptor agonism but differ in the second receptor program paired with GLP-1R activation. CagriSema couples semaglutide with cagrilintide-mediated engagement of amylin receptor complexes formed by calcitonin receptor and receptor activity-modifying proteins (RAMPs), whereas tirzepatide couples GLP-1 receptor agonism with GIP receptor agonism [1,2,3,6,12,13]. Pramlintide, an approved amylin analogue with prior evidence of glycemic and weight effects in insulin-treated diabetes, provides an orthogonal clinical anchor for testing whether biomarker patterns observed in the masked CagriSema/Placebo cohort are directionally consistent with amylin-pathway signals identified in matched routine-care cohorts. [14,15].
Real-world de-identified electronic health record (EHR) analysis at-scale offer a complementary lens for detecting longitudinal biomarker and vital-sign changes across organ systems, but they require careful design, transparent reporting, and conservative interpretation [16,17,18,24]. Such analyses may be particularly informative while clinical trials remain ongoing, because routine-care measurements captured outside the sponsor trial database can provide early, hypothesis-generating signals without accessing randomized trial outcomes or treatment assignments. In the present study, the CagriSema-associated EHR medication label was observed during a period in which CagriSema exposure was largely restricted to blinded trials, and active cagrilintide-semaglutide assignment could not be confirmed from routine-care records[25,26,27]. We therefore designate this cohort as “CagriSema/Placebo”, do not treat the label as confirmed active exposure, and interpret the analysis as exploratory (see Methods). This trial-adjacent real-world design is intended to evaluate whether routine-care biomarker trajectories recorded outside the sponsor trial database can generate mechanistic hypotheses without unblinding treatment assignment or using randomized trial endpoints[25,26,27].
A second methodological challenge is that greater absolute organ-marker improvement may simply reflect greater weight loss. To address this, we analyzed both absolute 6-month laboratory changes and laboratory changes normalized per kilogram of weight lost, treating the latter as a descriptive “organ-response efficiency” metric for identifying weight-coupled versus weight-discordant biomarker signals. We then integrated these matched EHR analyses with single-cell transcriptomic maps of amylin receptors (CALCR, RAMP1, RAMP2, RAMP3), GIPR, and GLP1R across human heart, kidney, and brain tissues [21,22,23].
Together, this framework links routine-care clinical trajectories to receptor-defined pharmacology and tissue-level receptor substrates (Figure 1), enabling a hypothesis-generating assessment of real-time clinical trial-associated signals and their potential alignment with amylin-pathway biology.. Specifically, Figure 1A defines the receptor anchors used in this framework: semaglutide for GLP-1R, tirzepatide for GIPR-GLP1R, pramlintide for amylin receptor signaling, and CagriSema/Placebo as a masked amylin-GLP-1 trial-medication label. Figure 1B summarizes the routine-care biomarker domains used to capture 6-month metabolic, blood pressure, lipid, hepatic, and renal trajectories. Figure 1C shows the matched comparison logic used to triangulate amylin, GLP-1R, GIPR-GLP1R, and SGLT2 pathway signals. Figure 1D places cohort-level body-weight and eGFR changes on a common axis, illustrating an exploratory renal biomarker signal beyond weight-change magnitude while preserving the masked CagriSema/Placebo interpretation.
Methods
Study Design and Data Source
We conducted a retrospective observational analysis on de-identified electronic health record data accessed through the nference Federated Clinical Analytics Platform. Three index agents were studied to resolve receptor contributions: semaglutide (GLP-1 receptor agonist), tirzepatide (GIP and GLP-1 receptor agonist), and the amylin analogues pramlintide (selective amylin receptor agonist) and CagriSema (cagrilintide coformulated with semaglutide). For every patient, the index date was the first recorded order or administration of the assigned drug.
CagriSema/Placebo Exposure Designation and Separation from Trial Data
During the study period, records containing CagriSema-related medication labels were expected to arise predominantly from blinded clinical trial participation, consistent with registered CagriSema studies that include placebo or dummy-medicine comparators. Because routine-care EHR medication records did not contain treatment assignment, randomization code, sponsor case-report form data, or unblinded investigational product dispensation status, a CagriSema-associated EHR label was not interpreted as confirmed active cagrilintide-semaglutide exposure. The cohort was therefore designated CagriSema/Placebo throughout the analysis, and all estimates from this cohort were prespecified as exploratory, were analyzed only at the aggregate level, and were not used to infer individual-level active-drug assignment. To preserve clinical trial blinding, the analysis was restricted to de-identified routine-care EHR data within the federated clinical analytics environment; sponsor trial databases, randomization files, treatment allocation records, trial case-report forms, investigator assessments recorded solely for trial operations, and adjudicated trial endpoints were not accessed or linked. When encounter type or order context was available, outcomes were preferentially defined from routine clinical care records and laboratory values, vital signs, medication orders, diagnoses, and procedures were analyzed as routine-care observations rather than trial endpoint measurements. This approach is consistent with FDA guidance on EHR data in clinical investigations and real-world data studies and with reporting standards for routinely collected health data that emphasize data provenance, source separation, and interpretability of exposure definitions[24,25,26,27,28,30].
Cohort Eligibility and Attrition
For the CagriSema/Placebo comparison, eligible patients had a recorded order or administration of the index drug, age ≥18 years at initiation, ≥12 months of baseline data, ≥30 days of follow-up, and no baseline exposure to the comparator. For the amylin-pathway comparison, designed as an insulin-background type 2 diabetes analysis, eligible patients additionally had a diagnosis of type 2 diabetes and basal insulin at baseline (within the 12 months before index).
Propensity-Score Matching and Covariate Balance
Propensity scores were estimated by logistic regression for each index-comparator pair using age, sex, body mass index, HbA1c, estimated glomerular filtration rate, body weight, and predefined baseline comorbidities. Matching used nearest-neighbor matching on the propensity score without replacement (caliper 0.2 SD): 1:5 for CagriSema/Placebo and 1:1 for pramlintide against each comparator. Balance was assessed by standardized mean differences, with |SMD| < 0.1 indicating good balance and |SMD| < 0.2 indicating acceptable balance. This matched, receptor-resolved design followed target-trial emulation and propensity-score principles.
Laboratory Change at 6 Months
For each analyte and vital sign, baseline and follow-up values were selected using the same prespecified windows across the CagriSema/Placebo and comparator cohorts: baseline was the measurement closest to index within 365 days before index, and follow-up was the measurement closest to 6 months within a plus or minus 3-month window. For each cohort we computed the percent change from baseline at 6 months for body weight, HbA1c, glucose, systolic, diastolic, and mean arterial blood pressure, LDL and HDL cholesterol, the LDL/HDL ratio, total cholesterol, triglycerides, serum creatinine, eGFR, alkaline phosphatase, ALT, and AST. To assess whether between-group differences could reflect differential observation rather than biological effect, we also summarized analyte-specific follow-up availability, the time from index to the follow-up measurement, and the proportion of patients with paired baseline and follow-up values.
Weight-Normalized Laboratory Change
To separate weight-dependent from weight-independent effects, each analyte’s 6-month percent change was normalized to the kilograms of weight lost at 6 months. Patients with less than 1.0 kg of weight loss were excluded to avoid unstable ratios at small denominators. For each analyte and cohort, the mean percent change per kilogram lost and its standard error were computed. To test directly whether blood pressure change was coupled to the magnitude of weight loss within each cohort, we additionally computed, among patients who lost at least 1.0 kg, the within-arm correlation between weight change in kilograms and the percent change in systolic and in diastolic blood pressure, separately within each cohort.
Medication-Transition Analysis
To evaluate whether biomarker differences could be explained by differential changes in concomitant therapy, given the potential for co-interventions and usual-care variation to bias observed treatment-outcome associations, we characterized prescribing transitions for every medication in the months around the index date. All medication orders and administrations were harmonized to a generic drug name. Symmetric windows of 1, 2, 3, 6, 12, 18, and 24 months (30, 60, 90, 180, 360, 540, and 720 days) were defined on each side of index; the pre-index window spanned the specified number of days through the day before index, and the post-index window spanned the day after index through the specified number of days. Records on the index date itself were excluded from both windows, so that the initiating order or administration did not contribute to either the pre- or post-index count. For each drug and window length, transitions were evaluated only in patients with at least one medication record in both the pre- and post-index window, ensuring observation on both sides of the index. For each drug we then computed the prevalence of use before and after index and the change in prevalence (post-index minus pre-index, in percentage points), together with the number of patients who started the drug (a record after but not before index) and who stopped the drug (a record before but not after index).
Single-Cell Transcriptomic Analysis of Receptor Component Expression
Human single-cell transcriptomic data were obtained from the CELLxGENE Discover resource (), which aggregates uniformly processed single-cell RNA sequencing datasets from multiple tissues and studies. To investigate the tissue distribution of incretin- and amylin-pathway receptors, expression summaries for CALCR, RAMP1, RAMP2, RAMP3, GIPR, and GLP1R were extracted from heart, kidney, and brain datasets. The final analysis included 298,931 heart cells, 408,524 kidney cells, and 1,728,654 brain cells.
For each tissue, CELLxGENE reports the number of cells expressing a given gene and the total number of cells profiled. Expression frequency was calculated as the proportion of cells expressing a gene divided by the total number of cells within that tissue and reported as a percentage. Thus, a value of 1% indicates that approximately 1 in every 100 cells within the tissue expressed the gene of interest.Expression frequencies were calculated independently for CALCR, RAMP1, RAMP2, RAMP3, GIPR, and GLP1R. Because the exported summary tables did not contain cell-level co-expression information, functional amylin receptor complexes (CALCR–RAMP heterodimers) could not be directly quantified. Instead, the analysis focused on the distribution of the individual receptor components required for amylin receptor formation.
To compare the relative prevalence of amylin receptor components and incretin receptors within the same tissue, fold enrichment was calculated by dividing the expression frequency of each amylin receptor component (CALCR, RAMP1, RAMP2, or RAMP3) by the expression frequency of either GIPR or GLP1R. For example, if a receptor component was expressed in 10% of cells and GIPR was expressed in 1% of cells, the fold enrichment would be 10, indicating that the receptor component was detected in ten times more cells than GIPR within that tissue. Fold-enrichment values greater than 1 indicate higher expression frequency than the reference receptor, whereas values less than 1 indicate lower expression frequency. Fold-enrichment values were visualized using log10-scaled heat maps.Representative cell types expressing amylin receptor components were identified using CELLxGENE tissue annotations and published cell-type labels associated with each dataset. These annotations were used to highlight the major cellular compartments in which receptor components were detected, including cardiomyocytes, endothelial cells, fibroblasts, renal tubular epithelial cells, neurons, astrocytes, microglia, adipocytes, and immune cells.
Statistical Analysis
Analyses were performed in Python with the pandas, NumPy, SciPy, and statsmodels libraries and Matplotlib for figures. Continuous baseline characteristics were compared between matched arms by standardized mean differences. For the 6-month laboratory and vital-sign analysis, between-cohort differences in percent change from baseline were tested with Welch’s two-sample t-test; for the weight-normalized analysis, between-cohort differences in percent change per kilogram lost were tested with a z-test on the per-kilogram values. In both analyses, p-values were adjusted for multiple comparisons by the Benjamini-Hochberg procedure within six prespecified domains (weight, glycemic, blood pressure, lipid, hepatic, and renal), and a two-sided adjusted P < 0.05 was considered significant. Within-arm associations between weight change and blood pressure change were quantified with the Pearson correlation coefficient and a Fisher 95% confidence interval. In the medication-transition analysis, the within-patient imbalance between drug starts and stops was tested with a two-sided exact binomial McNemar test. Single-cell expression-frequency and fold-enrichment analyses were descriptive. Throughout, patient counts below 11 were reported as <11 in accordance with the privacy convention adopted in this study.
Data Source
This study analyzed de-identified EHR data from academic medical centers in the United States via the nference Federated Analytics network. Prior to analysis, all data underwent expert determination de-identification satisfying HIPAA Privacy Rule requirements (45 CFR §164.514(b)(1)), employing a multi-layered transformation approach for both structured data (cryptographic hashing of identifiers, date-shifting, geographic truncation) and unstructured clinical text (ensemble deep learning and rule-based methods with >99% recall for personally identifiable information detection) [42]. nference established secure data environments within each participating center, housing these de-identified patient data governed by expert determination. These de-identified data environments were specifically designed to enable data access and analysis without requiring Institutional Review Board oversight, approval, or exemption confirmation. Accordingly, informed consent and IRB review were not required for this study.
Data Availability
This study involves the analysis of de-identified Electronic Health Record (EHR) data via the nference Federated Analytics network. Data shown and reported in this manuscript were extracted from this environment using an established protocol for data extraction, aimed at preserving patient privacy. The data has been de-identified pursuant to an expert determination in accordance with the HIPAA Privacy Rule. Any data beyond what is reported in the manuscript, including but not limited to the raw EHR data, cannot be shared or released due to the parameters of the expert determination to maintain the data de-identification. The corresponding author should be contacted for additional details..
De-Identification and HIPAA Compliance Certification
Prior to analysis, all EHR data were de-identified under an expert determination consistent with the Health Insurance Portability and Accountability Act (HIPAA) Privacy Rule (45 CFR §164.514(b)(1)). The de-identification methodology employed a multi-layered transformation approach to both structured and unstructured data fields [37]. In structured data, direct identifiers including patient names and precise geographic locations were excluded entirely, while indirect identifiers underwent specific transformations: patient identifiers, medical record numbers, and accession numbers were replaced with one-way cryptographic hashes using confidential salts to preserve linkage across patient encounters; all dates were shifted backward by patient-specific random offsets (1–31 days) to preserve temporal relationships while obscuring exact event timing; the ZIP codes were truncated to two-digit state-level resolution; and continuous variables including age, height, weight, and body mass index were thresholded to prevent identification of extreme values (for example, ages ≥89 years transformed to ‘89+’ and BMI >40 transformed to ‘40+’). In unstructured clinical text, an ensemble de-identification system that combines attention-based deep learning models with rule-based methods achieved an estimated >99% recall for personally identifiable information (PII) detection, with detected identifiers replaced by plausible fictional surrogates [37].
Data Harmonization
To address heterogeneity in EHR data, we harmonized clinical variables including medications, anthropometric measurements, and diagnoses to standardized concepts. For medications, we first constructed a standardized drug concept database combining the nference knowledge graph with RXNorm (https://www.nlm.nih.gov/research/umls/rxnorm/index.html) hierarchies to capture ingredient, brand, and dose-specific information. EHR medication records were matched using a hierarchical approach prioritizing RXNorm codes when available, followed by ingredient-level matching, and finally natural language processing and pattern matching on free-text medication orders when structured codes were absent. For anthropometric measurements (height, weight, BMI), we created a unified vocabulary from SNOMED (https://www.snomed.org/, https://athena.ohdsi.org) and LOINC (https://loinc.org/) terminologies and matched EHR measurement descriptions using standardized text matching algorithms with abbreviation expansion and synonym resolution; ambiguous mappings were resolved using OpenAI GPT-4o (https://platform.openai.com/docs/models/gpt-4o) with summary statistics as context, followed by manual verification. For diagnoses, we developed a hierarchical disease concept database from the nference knowledge graph and matched EHR diagnosis descriptions and codes by identifying the most specific common child concept in the hierarchy. This approach enabled consistent identification of clinical entities while preserving granularity where available.
Results
Study Design, Cohort Selection, and Propensity Matching
Twenty-five adult patients had a documented CagriSema/Placebo order with at least 12 months of baseline data, at least 30 days of follow-up, and no baseline exposure to comparator therapies (Figure 2A). Comparator pools included 273,682 tirzepatide-treated and 239,009 empagliflozin-treated patients meeting identical criteria. Nearest-neighbor propensity-score matching without replacement on age, sex, body mass index, HbA1c, estimated glomerular filtration rate, body weight, and baseline comorbidities at a 1:5 ratio yielded matched cohorts of 25 CagriSema/Placebo, 125 tirzepatide (65 Zepbound, 60 Mounjaro), and 125 empagliflozin patients. After matching, baseline characteristics were well balanced (Table 1): mean age approximately 60-61 years, 46.4-52.0% female, mean BMI 32.7-33.0 kg/m2, mean HbA1c 6.4-6.5%, mean eGFR 74.1-76.5 mL/min/1.73 m2, and mean weight 96.3-97.5 kg. Balance was considered good at |SMD|<0.1; all CagriSema/Placebo matched covariates were within the prespecified acceptable range of |SMD|<0.2, with the largest residual imbalance observed for atherosclerotic cardiovascular disease in the CagriSema/Placebo versus empagliflozin comparison (SMD=-0.19). Because the CagriSema-associated EHR label was observed during a period in which CagriSema-related records were expected to arise predominantly from blinded trials, active cagrilintide-semaglutide assignment could not be confirmed from routine-care records; some patients may have received placebo. Accordingly, this cohort was analyzed as CagriSema/Placebo and all associated estimates were treated as exploratory aggregate biomarker signals rather than active-drug causal estimates.
Separately, to test whether an amylin-pathway signal was detectable outside the masked CagriSema/Placebo setting, we analyzed pramlintide as an approved amylin analogue anchor in patients with type 2 diabetes on a basal-insulin background (Figure 2B). Among 1,266 patients with documented pramlintide exposure, 797 satisfied all eligibility criteria. Pramlintide patients were matched 1:1 separately to two comparators: to tirzepatide, yielding 652 matched pairs drawn from 21,990 eligible tirzepatide users, and to semaglutide, yielding 761 matched pairs drawn from 75,650 eligible semaglutide users. Baseline covariates were well balanced in both matched sets (all |SMD| < 0.1; Table 2). Across the matched cohorts, mean age was approximately 55 years, 60.2-63.5% were female, mean BMI was 32.1-32.5 kg/m2, mean HbA1c 8.1-8.2%, mean eGFR 80.5-82.3 mL/min/1.73 m2, and mean weight 103.7-104.6 kg; the largest residual imbalance in the semaglutide comparison was for eGFR (SMD = -0.071). These pramlintide matched cohorts were not pooled with or directly compared against the CagriSema/Placebo cohorts. Rather, the study used two complementary receptor-resolved designs: an exploratory CagriSema/Placebo analysis matched to tirzepatide and empagliflozin, and a separate pramlintide amylin-anchor analysis matched to tirzepatide and semaglutide. Together, these complementary matched analyses provided routine-care pathway anchors for amylin receptor agonism, GLP-1 receptor agonism, dual GIP/GLP-1 receptor agonism, and SGLT2 inhibition, without treating CagriSema/Placebo as confirmed active exposure.
Exploratory CagriSema/Placebo Analysis Shows Greater Renal Biomarker Change than Tirzepatide at Comparable Weight Loss
At 6 months, CagriSema/Placebo showed no significant difference in body-weight or HbA1c change versus tirzepatide (body weight, -7.7% vs -10.2%, P=0.272; HbA1c, -2.8% vs -5.1%, P=0.685; Figure 3A). Mean renal biomarker changes were larger in the CagriSema/Placebo cohort: serum creatinine decreased by -17.4% versus -3.1% (P=0.011, BH-adjusted P=0.022), and eGFR increased by +26.4% versus +6.5% (P=0.028, BH-adjusted P=0.028). The median values were all similar to the mean values (Figure 3A). CagriSema/Placebo showed numerically greater reductions across diastolic blood pressure (-13.9% vs -8.7%, P=0.175), mean arterial pressure (-12.0% vs -7.8%, P=0.181), LDL cholesterol (-24.8% vs -19.6%, P=0.896, BH-adjusted P=0.962) and the LDL/HDL ratio (-24.8% vs -13.3%, P=0.814, BH-adjusted P=0.962), although the between-group differences were not statistically significant.
Against empagliflozin, an SGLT2 inhibitor with established renal effects (Figure 3B), CagriSema/Placebo showed greater reductions in body weight (-7.7% vs -3.5%; P=0.048), systolic (-12.3% vs -0.8%; P<0.001), diastolic (-13.9% vs -1.7%; P<0.001), and mean arterial pressure (-12.0% vs -1.0%; P<0.001), and greater renal improvement (creatinine -17.4% vs -2.4%, P=0.010, BH-adjusted P=0.020; eGFR +26.4% vs +6.4%, P=0.030, BH-adjusted P=0.030). The median values were all similar to the mean values (Figure 3B). This renal-active comparator analysis provides context for the magnitude of the CagriSema/Placebo biomarker signal, but does not overcome the masked-assignment limitation.
The absolute baseline and 6-month values for the primary metabolic, blood pressure, and renal biomarkers are shown in Figure 4. These trajectories showed that the CagriSema/Placebo renal signal reflected a mean creatinine change from 1.30 to 1.07 mg/dL and mean eGFR change from 54.2 to 68.5 mL/min/1.73 m2, while body weight and HbA1c changes did not differ significantly from tirzepatide. Given the small CagriSema/Placebo cohort, sparse paired renal measurements, and unknown active-drug assignment, these absolute trajectories should be interpreted as exploratory routine-care biomarker patterns rather than confirmed active-treatment effects. Mean baseline values, 6-month follow-up values, percent changes, and contributing paired sample counts for each analyte are reported in Table S1.
Selective Amylin Agonism Versus Incretin Comparators
In the larger type 2 diabetes cohorts, pramlintide was compared with tirzepatide and semaglutide (Figure 5). At 6 months, the incretin comparators lowered glycemic measures more than pramlintide: versus tirzepatide, HbA1c -3.0% vs -9.0% and glucose -4.0% vs -15.7% (both BH-adjusted P≤0.025); versus semaglutide, HbA1c -3.5% vs -10.1% and glucose -4.3% vs -16.0% (both BH-adjusted P≤0.025). There was also a more pronounced reduction in blood pressure after initiation of incretin therapy (mean arterial -9.4% vs -13.6% versus tirzepatide, adjusted P=0.002; -9.6% vs -13.4% versus semaglutide, adjusted P=0.017). Pramlintide was associated with a relative increase in triglycerides versus tirzepatide (+8.5% vs -15.6%; adjusted P=0.001). Similar to the Cagrilinite/Placebo cohort, the renal measures (serum creatinine and eGFR), in the pramlintide cohort also went down but the change in renal measures in the pramlintide cohort did not differ significantly compared to the tirzepatide cohort (all P>0.25). The median values were all similar to the mean values. The corresponding absolute baseline and 6-month values confirmed the percent-change interpretation, showing larger absolute weight and HbA1c reductions with tirzepatide than pramlintide, while both cohorts showed substantial blood pressure reductions and modest renal biomarker improvement (Figure 5). This absolute-change pattern is consistent with larger A1c shifts accompanying larger weight loss under GLP-1-containing incretin regimens and motivated the complementary weight-normalized analysis. Mean baseline values and 6-month follow-up values for each analyte and cohort are reported in Figure S1 and Figure S2 and Table S2 for patients with pairwise data used to compute percentage changes from baseline.
Weight-Normalized Laboratory Change Identifies an Amylin-Pathway Blood Pressure Response per Unit of Weight Loss
To evaluate whether laboratory and vital-sign changes differed after accounting for the magnitude of weight loss, we expressed each 6-month percent change from baseline as a weight-normalized value: the individual percent change divided by kilograms of weight lost over the same interval (Figure 6). Thus, values in this analysis represent relative percent change per kilogram of weight lost, not absolute mmHg/kg for blood pressure or HbA1c percentage-point change per kilogram. Patients who did not lose at least 1.0 kg of weight were excluded to avoid unstable ratios near zero.
After this normalization, the blood pressure comparison between pramlintide and tirzepatide reversed (Figure 6A). Pramlintide showed a larger systolic blood pressure percent reduction per kilogram of weight lost than tirzepatide (-4.9% per kg [95% CI -6.0, -3.7] vs -3.4% per kg [-4.1, -2.8]; P=0.030, adjusted P=0.046). A similar pattern was observed for diastolic blood pressure (-5.7% per kg [-7.2, -4.3] vs -3.4% per kg [-4.5, -2.4]; P=0.010, adjusted P=0.029). Mean arterial pressure was directionally concordant but did not reach statistical significance (-4.7% vs -3.4% per kg, P=0.054). These findings indicate that, after scaling blood pressure change to the amount of weight lost, pramlintide showed a larger weight-normalized blood pressure response than tirzepatide.
Glycemic measures showed the opposite pattern. HbA1c relative percent change per kilogram of weight lost was larger with tirzepatide than with pramlintide (-2.4% vs -1.0% per kg, adjusted P=0.022). Weight-normalized renal biomarker changes did not differ significantly between pramlintide and tirzepatide (eGFR +3.2% vs +2.5% per kg, P=0.634; serum creatinine -1.7% vs -1.5% per kg, P=0.835).
In the pramlintide versus semaglutide comparison (Figure 6B), HbA1c was the only measure that differed after normalization to weight loss magnitude, with larger HbA1c relative percent change per kilogram of weight lost after semaglutide than pramlintide (-3.0% vs -1.0% per kg, adjusted P=0.030). Blood pressure, renal, and lipid measures were otherwise comparable after weight normalization. To assess whether the GIPR component of tirzepatide contributed an additional weight-normalized laboratory signal beyond GLP-1R agonism, we performed an exploratory indirect comparison of tirzepatide and semaglutide, each matched separately to the same pramlintide anchor cohort. No laboratory measure differed between tirzepatide and semaglutide after normalization to kilograms of weight lost (Figure 7).
To test directly whether blood pressure reduction was statistically coupled to the magnitude of weight loss within each cohort, we computed the within-arm correlation between percent weight change and percent blood pressure change among patients who lost at least 1.0 kg (Figure S3, Figure S4). Correlations were weak in every arm and similar across treatments, with no arm showing tight coupling. For systolic blood pressure, pramlintide r=0.24 (95% CI 0.08 to 0.38) when matched to semaglutide and r=0.23 (0.07 to 0.39) when matched to tirzepatide, versus semaglutide r=0.23 (0.10 to 0.36) and tirzepatide r=0.21 (0.08 to 0.34). Diastolic correlations were comparable (pramlintide r=0.22 and r=0.23; semaglutide r=0.17; tirzepatide r=0.18). Across all arms, weight loss explained only about 3 to 6 percent of the variance in blood pressure change, and the 95% confidence intervals overlapped between pramlintide and its comparators. Thus, the larger weight-normalized blood pressure reduction per kilogram lost with pramlintide arose despite a weight-to-blood pressure coupling that was no stronger than, and statistically indistinguishable from, that of the incretin comparators, consistent with a blood pressure effect that is largely independent of the amount of weight lost. The observational design precludes definitive causal separation of weight-dependent and weight-independent components.
Medication-Transition Analyses Argue Against Cardiometabolic Co-Intervention Confounding
To evaluate whether the blood pressure or renal biomarker findings could be explained by differential post-index medication changes, we analyzed harmonized drug-level starts and stops within 1-, 2-, 3-, 6-, 12-, 18-, and 24-month windows before and after index. Each medication was evaluated in matched pre-index and post-index windows anchored to the index date, with the index-date prescription excluded from both windows and prevalence assessed only among patients observed on both sides of index; reported values are therefore post-index minus pre-index changes, and even the index study medication does not reach a 100-percentage-point increase. At the primary 6-month biomarker window, the CagriSema/Placebo cohort showed a significant increase only in the masked cagrilintide/semaglutide study-medication label (+66.67 percentage points [pp], McNemar P<0.001, Figure 8). No chronic antihypertensive, SGLT2 inhibitor, glucose-lowering, lipid-lowering, or other cardiorenal co-medication showed a significant 6-month increase in the CagriSema/Placebo cohort (Table 3, Table S3).
At 6 months, pramlintide increased by +38.64 pp in the semaglutide-matched pramlintide cohort (P<0.001), and +38.93 pp in the tirzepatide-matched pramlintide cohort (P<0.001). On the other hand, no SGLT2 inhibitor showed a significant increase at the 6-month time point in either matched pramlintide cohort. Dapagliflozin prescriptions significantly decreased (−1.65 and −1.95 pp in the semaglutide- and tirzepatide-matched cohorts, respectively; both P=0.021), while empagliflozin trended lower (non-significant) and canagliflozin was unchanged (Figure 8, Table 3, Table S3). These class-wide medication-transition patterns argue against SGLT2 inhibitor intensification as an explanation for the renal biomarker findings. Across the pramlintide cohorts, no antihypertensive agent (ACE inhibitors, angiotensin-receptor blockers, beta-blockers, calcium-channel blockers, thiazide and loop diuretics, or mineralocorticoid-receptor antagonists) showed a significant increase in prescribing within 6 months of pramlintide initiation; the only significant antihypertensive change was a decrease in the calcium-channel blocker nifedipine, in the tirzepatide-matched cohort (−1.46 pp, P=0.031). This argues against increased antihypertensive prescribing as a driver of the pramlintide-associated blood pressure signal. In the semaglutide-matched pramlintide cohort, no insulin product showed a significant increase in prescribing within 6 months of pramlintide initiation; the only significant change was a decrease in the rapid-acting (prandial) insulin lispro (−4.13 pp, P=0.038), while basal insulins (glargine, detemir, degludec) and the other prandial agents (insulin aspart and glulisine) were unchanged at this early time point.
Over longer windows, pramlintide medication transitions showed broader diabetes-regimen simplification, though not a uniformly unidirectional insulin-sparing pattern. By 12 to 24 months, the pramlintide cohorts showed significant decreases in metformin, pioglitazone, sitagliptin, glipizide, glimepiride, dulaglutide, and exenatide (Figure 8, Table 3, Table S3). In the tirzepatide-matched pramlintide cohort, the dapagliflozin decrease was again significant at 18 months (−1.71 pp, P=0.021) and 24 months (−1.89 pp, P=0.022). In contrast to the early prandial-insulin reduction, insulin aspart increased at 18 and 24 months across the pramlintide cohorts (+4.9 to +5.7 pp; all P<0.05), and insulin glulisine increased modestly in the tirzepatide-matched cohort (+2.14 pp at 18 months, P=0.031), suggesting redistribution among prandial insulin agents rather than global insulin discontinuation.
Comparator incretin cohorts showed distinct medication-transition signatures. In the semaglutide-matched cohort at 6 months, semaglutide rose +47.07 pp (P<0.001) while liraglutide (−4.34 pp, P<0.001), insulin glargine (−5.64 pp, P=0.021), and spironolactone (−2.39 pp, P=0.043) fell; at 12–24 months semaglutide remained elevated, liraglutide remained reduced, canagliflozin decreased, and tirzepatide rose, consistent with later switching or augmentation. The tirzepatide-matched cohort showed a stronger 6-month switching pattern — tirzepatide +58.35 pp (P<0.001), with decreases in metformin (−7.48 pp, P=0.001), semaglutide (−6.48 pp, P<0.001), dulaglutide (−5.49 pp, P<0.001), liraglutide (−2.00 pp, P=0.039), rosuvastatin (−4.24 pp, P=0.027), and simvastatin (−1.75 pp, P=0.039); antihypertensive reductions emerged later, including hydrochlorothiazide (12–24 months), carvedilol (18–24 months), and lisinopril (24 months) (Figure 8, Table 3, Table S3).
In the larger unmatched study cohorts, both incretins showed broad cardiometabolic de-escalation over 6–24 months, greater in magnitude for tirzepatide. By 24 months, the tirzepatide study cohort showed reductions spanning prior GLP-1 receptor agonists, glucose-lowering agents, insulins, antiplatelet, lipid-lowering, antihypertensive, and diuretic therapy — semaglutide (−17.79 pp), metformin (−17.06 pp), dulaglutide (−14.66 pp), aspirin (−12.45 pp), insulin lispro (−11.01 pp), insulin aspart (−10.65 pp), insulin glargine (−10.25 pp), atorvastatin (−9.30 pp), lisinopril (−8.82 pp), furosemide (−6.40 pp), amlodipine (−6.18 pp), empagliflozin (−4.78 pp), and dapagliflozin (−2.24 pp; all P<0.05) (Table 3, Table S3). The semaglutide study cohort showed similar reductions (metformin, insulin products, aspirin, lisinopril, furosemide, hydrochlorothiazide, amlodipine, nitroglycerin, and prior GLP-1 agonists) but also later increases in tirzepatide, empagliflozin, rosuvastatin, ezetimibe, and insulin degludec, indicating a more mixed long-term switching pattern (Table 3, Table S3).
Single-Cell Mapping Shows Amylin Receptor Components Exceed GIPR and GLP1R Across Cardiorenal and Neural Tissues
Single-cell transcriptomic analyses demonstrated marked tissue-specific differences in the distribution of amylin receptor components relative to incretin receptors (Figure 9). The kidney exhibited the strongest signal, with CALCR, RAMP2, and RAMP3 detected in 2.55%, 3.83%, and 3.43% of cells, respectively, compared with 0.26% for GIPR and 0.03% for GLP1R (Figure 9a). Correspondingly, CALCR, RAMP2, and RAMP3 were enriched 9.8-fold, 14.7-fold, and 13.2-fold relative to GIPR, and 85-fold, 128-fold, and 114-fold relative to GLP1R (Figure 9b). These findings indicate that individual components required for amylin receptor formation are detected in a substantially larger fraction of kidney cells than either incretin receptor.
In the heart, RAMP1, RAMP2, and RAMP3 were detected in 8.88%, 5.54%, and 6.72% of cells, respectively, compared with 1.02% for GIPR and 0.41% for GLP1R (Figure 9a). In the brain, RAMP1 was detected in 3.31% of cells compared with 0.41% for GIPR and 0.04% for GLP1R, whereas CALCR, RAMP2, and RAMP3 were detected in smaller fractions of cells (Figure 9a). Fold-enrichment analyses similarly demonstrated higher expression frequencies of several amylin receptor components relative to incretin receptors across both tissues (Figure 9b). Because cell-level co-expression information was not analyzed, these analyses should be interpreted as demonstrating the tissue distribution of the individual molecular components required for amylin receptor signaling rather than direct evidence of assembled amylin receptors.
Discussion
This study presents a blinding-preserving, receptor-resolved routine-care framework for identifying organ-specific biomarker signals across incretin and amylin pharmacology using matched EHR biomarker trajectories, weight-normalized analyses, medication-transition controls, and human single-cell receptor maps. The central finding is not simply that GLP-1-containing therapies lower weight and HbA1c, which is well established for tirzepatide and cagrilintide-semaglutide [1,2,3,4,5,6], but that the exploratory CagriSema/Placebo comparison and the independent pramlintide anchor each point toward amylin-pathway cardiorenal signals that are not fully explained by the metabolic endpoints most commonly emphasized in obesity and diabetes trials. Specifically, CagriSema/Placebo showed larger 6-month renal biomarker changes than tirzepatide at comparable weight and HbA1c change, while pramlintide showed greater weight-normalized blood pressure reduction than tirzepatide despite smaller absolute metabolic effects.
The CagriSema/Placebo analysis should be interpreted with particular caution, but it is also mechanistically informative. CagriSema combines semaglutide with cagrilintide, a long-acting amylin analogue, while tirzepatide combines GIPR and GLP-1R agonism [1,2,3,4,5,6]. In routine-care EHR records, however, the CagriSema-associated label was observed during a period in which CagriSema exposure was largely restricted to blinded trials, and active cagrilintide-semaglutide assignment could not be confirmed from the EHR [29]. The CagriSema/Placebo cohort therefore does not establish active-drug efficacy. Rather, it provides an exploratory, aggregate real-world clinical signal associated with a masked study-medication label. Importantly, the objective is not to infer treatment assignment or estimate trial efficacy, but to determine whether routine-care biomarker trajectories recorded while a blinded trial is ongoing can identify clinically meaningful signals that warrant prospective evaluation after trial unblinding. Within that constraint, the renal biomarker separation was notable: CagriSema/Placebo showed larger creatinine reduction and eGFR increase than tirzepatide despite no significant difference in weight or HbA1c change. This pattern is consistent with the broader concept that incretin-based therapies can influence cardiovascular and kidney outcomes through pathways not fully captured by weight loss or glycemic control alone, as shown by semaglutide cardiovascular and kidney outcome studies [7,8,9].
The renal interpretation remains deliberately biomarker-based. Serum creatinine and eGFR are linked measures, and eGFR change can reflect hemodynamics, hydration, muscle mass, assay timing, medication changes, regression to the mean, or selective follow-up rather than structural kidney protection. Nevertheless, the magnitude and direction of the CagriSema/Placebo renal signal, together with the comparison against a renal-active SGLT2 inhibitor control arm, support prospective testing of whether amylin-pathway engagement contributes renal physiology beyond GLP-1R agonism alone. Mechanistic studies have already suggested that GLP-1 receptor agonism can influence renal autoregulation, natriuresis, inflammation, and vascular biology [10,11], but the current study raises a distinct question: whether pairing GLP-1R agonism with amylin receptor biology produces a different early cardiorenal biomarker profile than pairing GLP-1R agonism with GIPR agonism.
The pramlintide analyses strengthen this pathway-level interpretation by providing an independent amylin analogue anchor outside the masked CagriSema/Placebo setting. Pramlintide is pharmacologically distinct from cagrilintide and is not coformulated with semaglutide, but it is an approved amylin analogue with prior evidence for glycemic and weight effects in insulin-treated type 2 diabetes [14,15]. In absolute 6-month analyses, tirzepatide and semaglutide produced larger weight and glycemic biomarker changes than pramlintide, as expected for GLP-1-containing incretin regimens. After normalization by kilograms of weight lost, however, pramlintide showed greater systolic and diastolic blood pressure reduction per kilogram than tirzepatide, while tirzepatide and semaglutide did not separate across weight-normalized laboratory measures. This pattern supports the hypothesis that amylin-pathway therapy may contribute a distinct blood pressure signal that is not simply proportional to total weight loss.
The medication-transition analysis further argues against simple co-intervention confounding. Antihypertensive exposure was nearly identical across matched arms, and drug-level medication-transition analyses did not show compensatory antihypertensive or SGLT2 inhibitor intensification that could explain the pramlintide blood pressure or renal biomarker patterns. Instead, dapagliflozin decreased across pramlintide cohorts, and nifedipine decreased in the tirzepatide-matched pramlintide cohort. These findings are compatible with reduced need for selected renal or blood pressure co-medications in a subset of patients, but they cannot prove biomarker-driven medication de-escalation because dose, indication, discontinuation reason, and temporal ordering were not adjudicated. In contrast, the tirzepatide and semaglutide comparator cohorts showed broader metabolic medication-transition signatures, including expected decreases in prior GLP-1 receptor agonists, metformin, insulin products, and selected lipid-lowering therapies. This distinction is important: broad medication simplification tracked more strongly with GLP-1-containing incretin therapy and larger absolute metabolic effects, whereas the pramlintide signal was narrower and more aligned with the weight-normalized blood pressure and renal-biomarker hypothesis. The need to explicitly characterize co-interventions and usual-care variation is well recognized in clinical and observational studies [32].
Single-cell receptor mapping provides biological plausibility for these clinical observations without proving functional signaling. Amylin receptors are generated through interactions between calcitonin receptor and receptor activity-modifying proteins, which can alter peptide selectivity and receptor pharmacology [12,13]. In human heart, kidney, and brain single-cell atlases, genes encoding amylin receptor components, including CALCR and RAMP1/2/3, were detected more broadly than GIPR or GLP1R [21,22,23]. In kidney, RAMP2, RAMP3, and CALCR were more frequently detected than GIPR and GLP1R, providing a plausible receptor-substrate map for renal amylin-pathway hypotheses. In heart, broader RAMP1/2/3 detection may provide a candidate substrate for blood pressure or vascular effects. These expression maps should not be interpreted as evidence of receptor complex formation, ligand engagement, or tissue-specific pharmacodynamics in treated patients. They do, however, support the biological plausibility of organ-level hypotheses generated from matched routine-care biomarkers.
A key methodological contribution of this work is the use of weight-normalized biomarker change as a descriptive lens for evaluating organ response per unit of weight loss. Absolute biomarker improvements are clinically meaningful, but in obesity pharmacology they can be difficult to interpret because larger weight loss can secondarily improve blood pressure, glycemia, lipids, and kidney biomarkers [33]. Normalizing biomarker change per kilogram of weight lost therefore offers a practical “organ-response efficiency” metric for hypothesis generation. This analysis should not be interpreted as proof that blood pressure changes are independent of weight loss. Blood pressure is regulated by multiple physiologic systems beyond body mass, including renal sodium handling, intravascular volume, sympathetic nervous system activity, neurohumoral signaling, vascular tone, and baseline hypertension biology [34]. Routine-care clinic blood pressure measurements also contain contextual variability related to measurement conditions, visit setting, cuff technique, white-coat effects, acute illness, and medication changes [35,36]. Consistent with this biology and measurement context, within-arm correlations between weight change and blood pressure change were weak across treatment arms, indicating that 6-month blood pressure response was not tightly linked to the magnitude of weight loss in any cohort. Thus, the larger pramlintide blood pressure response per unit of weight loss should be interpreted as a weight-normalized amylin-pathway blood pressure hypothesis rather than as definitive causal separation of weight-related and receptor-related components. When paired with absolute biomarker trajectories, matched active comparators, antihypertensive exposure analysis, drug-level medication transitions, and single-cell receptor-substrate maps, this approach provides a quantitative framework for identifying organ signals that warrant prospective testing [12,13,21,22,23].
This study also illustrates a broader paradigm in which de-identified routine-care EHR data can complement ongoing blinded clinical trials without compromising trial integrity. Rather than accessing sponsor-held trial databases or randomized endpoints, longitudinal routine-care measurements obtained during trial participation may provide early, hypothesis-generating clinical signals that can help prioritize mechanistic analyses and future endpoint evaluation following trial completion. Real-world evidence and target-trial thinking have become increasingly important for generating clinically meaningful hypotheses from routine-care data, but such approaches require transparent exposure definitions, careful design, and explicit bias assessment [16,17,18,24,26,27,28,30]. In the present analysis, sponsor trial databases, randomization files, treatment allocation records, case-report forms, and adjudicated trial endpoints were not accessed. The CagriSema/Placebo label was therefore treated as a masked EHR study-medication label, not as confirmed active exposure. This preserves the scientific and operational distinction between blinded randomized trial data and de-identified routine-care observations, while still allowing trial-adjacent care patterns and biomarkers to be studied at aggregate level.
Several limitations should be emphasized. First, the CagriSema/Placebo cohort was small and may include both active-treatment and placebo recipients; therefore, all CagriSema/Placebo estimates are exploratory and should not be interpreted as active cagrilintide-semaglutide causal effects. Second, the CagriSema/Placebo renal biomarker analysis involved sparse paired measurements, with low-count masking in several analytes, so estimates may be sensitive to outliers, measurement timing, and missingness. Third, analyses were observational and based on operational EHR data, so residual confounding, channeling bias, surveillance bias, incomplete medication capture, and outcome misclassification remain possible despite propensity matching and care-pattern evaluation [17,18,30]. Fourth, serum creatinine and eGFR are linked biomarkers and may reflect hemodynamics, hydration, muscle mass, medication changes, or regression to the mean rather than durable kidney protection. Fifth, weight-normalized ratio analyses are descriptive and do not prove weight independence without formal mediation or regression sensitivity analyses. Sixth, medication-transition P values were nominal, many drug concepts were tested, drug dose and indication were not adjudicated, and masked low-count cells limited reconstruction of medication intensity. Seventh, trial participation and differential encounter intensity can alter routine care patterns, a concern related to observation and Hawthorne-type effects [31]. Finally, single-cell RNA expression does not prove functional receptor complex formation, peptide exposure, downstream signaling, or tissue-specific pharmacodynamics in treated patients.
An important limitation of this study is that treatment assignment for participants enrolled in ongoing blinded clinical trials was not available within the federated environment. The de-identified routine-care EHRs used in this analysis may document trial participation (e.g., an investigational treatment recorded as “CagriSema/placebo”), but they do not contain sponsor-held randomization codes or treatment allocation. Accordingly, these analyses cannot distinguish active treatment from placebo or estimate treatment-specific efficacy, and should instead be interpreted as exploratory observations of routine-care biomarker trajectories among trial-enrolled patients whose treatment assignment remained masked.
The next step is a prospective receptor-resolved organ-outcomes study that preserves standard metabolic endpoints while adding prespecified kidney, cardiovascular, and medication-de-escalation readouts. For kidney outcomes, this should include eGFR slope, serum creatinine, albuminuria, acute kidney injury, diabetic kidney disease progression, kidney stone events, and kidney failure endpoints. For cardiovascular outcomes, it should include longitudinal systolic and diastolic blood pressure, antihypertensive medication intensification or de-escalation, cardiac imaging where feasible, and adjudicated heart failure or cardiovascular events. For mechanistic interpretation, prospective studies should integrate biomarker trajectories with medication changes, body-composition measures, and tissue or circulating markers that can distinguish weight-coupled effects from receptor-specific organ biology. Taken together, these findings demonstrate how routine-care data collected during ongoing blinded clinical trials can generate early, hypothesis-generating clinical biomarker signals while preserving treatment blinding. Following trial unblinding, these signals can be formally evaluated against randomized outcomes. Within this framework, the present findings nominate amylin-pathway pharmacology as a plausible contributor to weight-discordant blood pressure and renal biomarker signals that warrant prospective confirmation.
Supplementary Materials
The following supporting information can be downloaded at the website of this paper posted on Preprints.org.
Author Contributions
Venky Soundararajan conceived the study, and designed the study with AJ Venkatakrishnan. AJ Venkatakrishnan and Robert Matson contributed equally to analysis and interpretation. Karthik Murugadoss, Avinash Aman and Deepak Anand contributed to interpretation. Venky Soundararajan supervised the study. All authors prepared and approved the manuscript.
Funding
No external funding was received for this study.
Acknowledgments
The authors acknowledge the use of the nference federated AI platform. The authors thank Patrick Lenehan for careful review and helpful feedback.
Competing Interest Statement
The authors are employees of nference, inc., which conducts research collaborations with various biopharmaceutical companies whose therapeutic products are included in this study. None of these companies, nor any other nference collaborator, funded, supported, or had any role in the independent study design, data acquisition, analysis, interpretation, manuscript preparation, or the decision to submit this work for publication. All analyses were conducted by the authors using de-identified electronic health record data. The authors declare no additional competing interests.
References
- Jastreboff, A.M.; Aronne, L.J.; Ahmad, N.N.; Wharton, S.; Connery, L.; Alves, B.; et al. Tirzepatide once weekly for the treatment of obesity. N Engl. J. Med. 2022, 387, 205–216. [Google Scholar] [CrossRef] [PubMed]
- Garvey, W.T.; Blüher, M.; Osorto Contreras, C.K.; Davies, M.J.; Lehmann, E.W.; Pietiläinen, K.H.; et al. Coadministered cagrilintide and semaglutide in adults with overweight or obesity. N Engl. J. Med. 2025, 393, 635–647. [Google Scholar] [CrossRef] [PubMed]
- Davies, M.J.; Bajaj, H.S.; Broholm, C.; Eliasen, A.; Garvey, W.T.; le Roux, C.W.; et al. Cagrilintide–semaglutide in adults with overweight or obesity and type 2 diabetes. N Engl. J. Med. 2025, 393, 648–659. [Google Scholar] [CrossRef] [PubMed]
- Lau, D.C.W.; Erichsen, L.; Francisco, A.M.; Satylganova, A.; le Roux, C.W.; McGowan, B.; et al. Once-weekly cagrilintide for weight management in people with overweight and obesity: a multicentre, randomized, double-blind, placebo-controlled and active-controlled, dose-finding phase 2 trial. Lancet 2021, 398, 2160–2172. [Google Scholar] [CrossRef] [PubMed]
- Enebo, L.B.; Berthelsen, K.K.; Kankam, M.; Lund, M.T.; Rubino, D.M.; Satylganova, A.; et al. Safety, tolerability, pharmacokinetics, and pharmacodynamics of concomitant administration of multiple doses of cagrilintide with semaglutide 2.4 mg for weight management: a randomized, controlled, phase 1b trial. Lancet 2021, 397, 1736–1748. [Google Scholar] [CrossRef] [PubMed]
- Kruse, T.; Hansen, J.L.; Dahl, K.; Schäffer, L.; Sensfuss, U.; Poulsen, C.; et al. Development of cagrilintide, a long-acting amylin analogue. J. Med. Chem. 2021, 64, 11183–11194. [Google Scholar] [CrossRef] [PubMed]
- Marso, S.P.; Bain, S.C.; Consoli, A.; Eliaschewitz, F.G.; Jódar, E.; Leiter, L.A.; et al. Semaglutide and cardiovascular outcomes in patients with type 2 diabetes. N Engl. J. Med. 2016, 375, 1834–1844. [Google Scholar] [CrossRef] [PubMed]
- Lincoff, A.M.; Brown-Frandsen, K.; Colhoun, H.M.; Deanfield, J.; Emerson, S.S.; Esbjerg, S.; et al. Semaglutide and cardiovascular outcomes in obesity without diabetes. N Engl. J. Med. 2023, 389, 2221–2232. [Google Scholar] [CrossRef] [PubMed]
- Perkovic, V.; Tuttle, K.R.; Rossing, P.; Mahaffey, K.W.; Mann, J.F.E.; Bakris, G.; et al. Effects of semaglutide on chronic kidney disease in patients with type 2 diabetes. N Engl. J. Med. 2024, 391, 109–121. [Google Scholar] [CrossRef] [PubMed]
- Hviid, A.V.R.; Sørensen, C.M. Glucagon-like peptide-1 receptors in the kidney: impact on renal autoregulation. Am. J. Physiol. Ren. Physiol. 2020, 318, F443–F454. [Google Scholar] [CrossRef] [PubMed]
- Hinrichs, G.R.; Hovind, P.; Asmar, A. The GLP-1-mediated gut-kidney cross talk in humans: mechanistic insight. Am. J. Physiol. Cell Physiol. 2024, 326, C567–C572. [Google Scholar] [CrossRef] [PubMed]
- Qi, T.; Hay, D.L. Structure–function relationships of the N-terminus of receptor activity-modifying proteins. Br. J. Pharmacol. 2010, 159, 1059–1068. [Google Scholar] [CrossRef] [PubMed]
- Lee, S.M.; Hay, D.L.; Pioszak, A.A. Calcitonin and amylin receptor peptide interaction mechanisms: insights into peptide-binding modes and allosteric modulation of the calcitonin receptor by receptor activity-modifying proteins. J. Biol. Chem. 2016, 291, 8686–8700. [Google Scholar] [CrossRef] [PubMed]
- Ratner, R.E.; Want, L.L.; Fineman, M.S.; Velte, M.J.; Ruggles, J.A.; Gottlieb, A.; et al. Adjunctive therapy with the amylin analogue pramlintide leads to a combined improvement in glycemic and weight control in insulin-treated subjects with type 2 diabetes. Diabetes Technol. Ther. 2002, 4, 51–61. [Google Scholar] [CrossRef] [PubMed]
- Hollander, P.A.; Levy, P.; Fineman, M.S.; Maggs, D.G.; Shen, L.Z.; Strobel, S.A.; et al. Pramlintide as an adjunct to insulin therapy improves long-term glycemic and weight control in patients with type 2 diabetes: a 1-year randomized controlled trial. Diabetes Care 2003, 26, 784–790. [Google Scholar] [CrossRef] [PubMed]
- Sherman, R.E.; Anderson, S.A.; Dal Pan, G.J.; Gray, G.W.; Gross, T.; Hunter, N.L.; et al. Real-world evidence—what is it and what can it tell us? N Engl. J. Med. 2016, 375, 2293–2297. [Google Scholar] [CrossRef] [PubMed]
- Hernán, M.A.; Robins, J.M. Using big data to emulate a target trial when a randomized trial is not available. Am. J. Epidemiol. 2016, 183, 758–764. [Google Scholar] [CrossRef] [PubMed]
- Rosenbaum, P.R.; Rubin, D.B. The central role of the propensity score in observational studies for causal effects. Biometrika 1983, 70, 41–55. [Google Scholar] [CrossRef]
- Thirunavukarasu, A.J.; Ting, D.S.J.; Elangovan, K.; Gutierrez, L.; Tan, T.F.; Ting, D.S.W. Large language models in medicine. Nat. Med. 2023, 29, 1930–1940. [Google Scholar] [CrossRef] [PubMed]
- Van Veen, D.; Van Uden, C.; Blankemeier, L.; Delbrouck, J.B.; Aali, A.; Bluethgen, C.; et al. Adapted large language models can outperform medical experts in clinical text summarization. Nat. Med. 2024, 30, 1134–1142. [Google Scholar] [CrossRef] [PubMed]
- Regev, A.; Teichmann, S.A.; Lander, E.S.; Amit, I.; Benoist, C.; Birney, E.; et al. The Human Cell Atlas. eLife 2017, 6, e27041. [Google Scholar] [CrossRef] [PubMed]
- Liao, J.; Yu, Z.; Chen, Y.; Bao, M.; Zou, C.; Zhang, H.; et al. Single-cell RNA sequencing of human kidney. Sci. Data 2020, 7, 4. [Google Scholar] [CrossRef] [PubMed]
- Abdulla, S.; Aevermann, B.; Assis, P.; Badajoz, S.; Bell, S.M.; Bezzi, A.; et al. CZ CELLxGENE Discover: a single-cell data platform for scalable exploration, analysis and modeling of aggregated data. Nucleic Acids Res. 2025, 53, D886–D900. [Google Scholar] [CrossRef] [PubMed]
- Benchimol, E.I.; Smeeth, L.; Guttmann, A.; et al. The REporting of studies Conducted using Observational Routinely-collected health Data (RECORD) Statement. PLoS Med. 2015, 12, e1001885. [Google Scholar] [CrossRef] [PubMed]
- Kwakkenbos, L.; Imran, M.; McCall, S.J.; et al. CONSORT extension for the reporting of randomised controlled trials conducted using cohorts and routinely collected data (CONSORT-ROUTINE): checklist with explanation and elaboration. BMJ. 2021, 373, n857. [Google Scholar] [CrossRef] [PubMed]
- U.S. Food and Drug Administration. Real-World Data: Assessing Electronic Health Records and Medical Claims Data to Support Regulatory Decision-Making for Drug and Biological Products. In Guidance for Industry; July 2024. [Google Scholar]
- U.S. Food and Drug Administration. Use of Electronic Health Record Data in Clinical Investigations. In Guidance for Industry; July 2018. [Google Scholar]
- von Elm, E.; Altman, D.G.; Egger, M.; Pocock, S.J.; Gøtzsche, P.C.; Vandenbroucke, J.P. The Strengthening the Reporting of Observational Studies in Epidemiology (STROBE) statement: guidelines for reporting observational studies. Lancet 2007, 370, 1453–1457. [Google Scholar] [CrossRef] [PubMed]
- ClinicalTrials.gov. NCT05669755; REDEFINE 3: A Research Study to See the Effects of CagriSema in People Living With Diseases in the Heart and Blood Vessels.
- Hersh, W.R.; Weiner, M.G.; Embi, P.J.; et al. Caveats for the use of operational electronic health record data in comparative effectiveness research. Med. Care 2013, 51, S30–S37. [Google Scholar] [CrossRef] [PubMed]
- McCarney, R.; Warner, J.; Iliffe, S.; van Haselen, R.; Griffin, M.; Fisher, P. The Hawthorne Effect: a randomised, controlled trial. BMC Med. Res. Methodol. 2007, 7, 30. [Google Scholar] [CrossRef] [PubMed]
- Bührer, J.; et al. Inadequate reporting of cointerventions, other interventions, and usual care in clinical trials. J. Clin. Epidemiol. 2023. [Google Scholar] [CrossRef] [PubMed]
- Neter, J.E.; Stam, B.E.; Kok, F.J.; Grobbee, D.E.; Geleijnse, J.M. Influence of weight reduction on blood pressure: a meta-analysis of randomized controlled trials This supports the statement that weight reduction contributes to BP lowering. Hypertension 2003, 42, 878–884. [Google Scholar] [CrossRef] [PubMed]
- Hall, J.E.; do Carmo, J.M.; da Silva, A.A.; Wang, Z.; Hall, M.E. Obesity-induced hypertension: interaction of neurohumoral and renal mechanisms. Circ. Res.;This Support. Ren. Sympathetic Neurohumoral Vol.-Relat. BP Regul. Lang. 2015, 116, 991–1006. [Google Scholar] [CrossRef] [PubMed]
- Muntner, P.; Shimbo, D.; Carey, R.M. Measurement of blood pressure in humans: a scientific statement from the American Heart Association This supports the routine-care BP measurement variability and measurement-condition caveat. Hypertension 2019, 73, e35–e66. [Google Scholar] [CrossRef] [PubMed]
- Rothwell, P.M.; Howard, S.C.; Dolan, E. Prognostic significance of visit-to-visit variability, maximum systolic blood pressure, and episodic hypertension This supports the importance and reality of visit-to-visit BP variability in clinical datasets. Lancet 2010, 375, 895–905. [Google Scholar] [CrossRef] [PubMed]
Figure 1.
Receptor-resolved routine-care framework for evaluating amylin, GLP-1, GIP-GLP-1, and amylin-GLP-1-associated cardiorenal biomarker signals.
Figure 1.
Receptor-resolved routine-care framework for evaluating amylin, GLP-1, GIP-GLP-1, and amylin-GLP-1-associated cardiorenal biomarker signals.
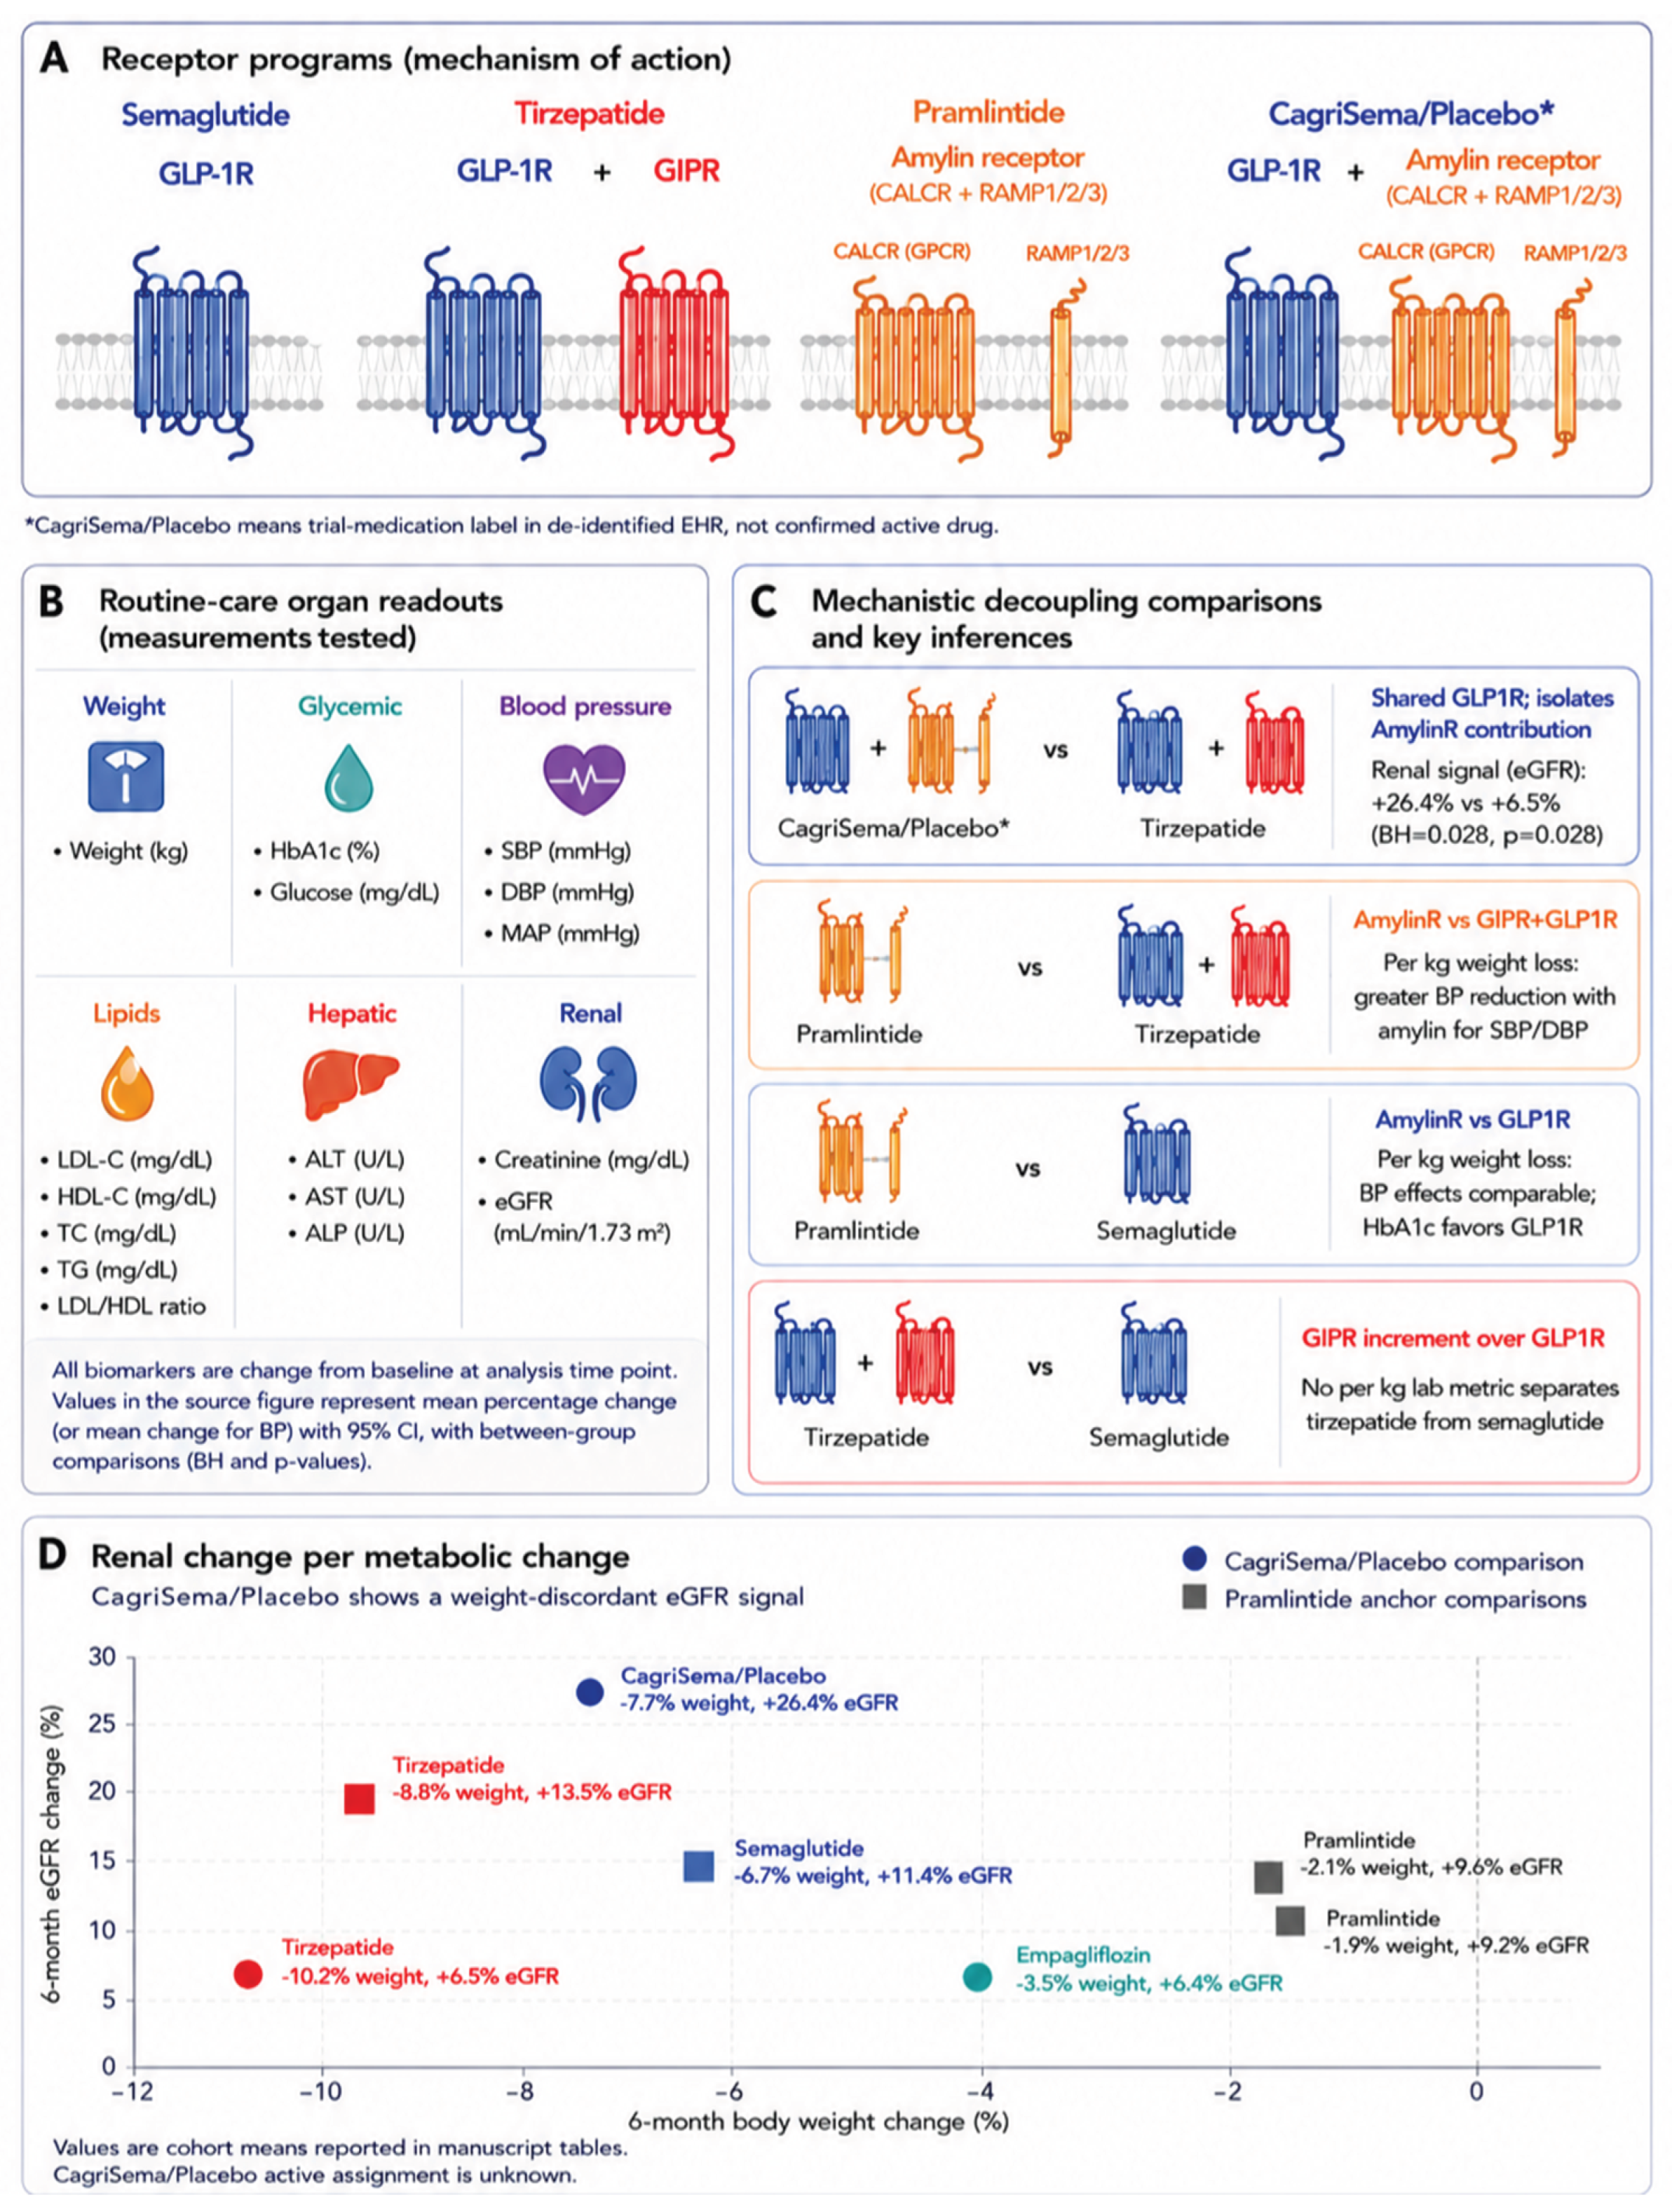
Figure 2.
Cohort attrition and propensity-score matching. (A) CagriSema/Placebo comparison. Eligibility required a recorded order or administration of the index drug, age ≥18 years at initiation, ≥12 months of baseline data, ≥30 days of follow-up, and no baseline exposure to the comparator; 25 CagriSema/Placebo patients met criteria and were matched 1:5 by nearest-neighbor propensity-score matching without replacement to tirzepatide and to empagliflozin (n=125 each). (B) Pramlintide comparison. Among patients with type 2 diabetes initiating pramlintide on a basal-insulin background, the same age, baseline-data, follow-up, and comparator non-exposure criteria applied, with the added requirement of basal insulin within the 12 months before index. 797 pramlintide-treated patients met all eligibility criteria and were each matched 1:1 by nearest-neighbor propensity-score matching without replacement to semaglutide and, separately, to tirzepatide, yielding 761 matched pairs in the semaglutide comparison and 652 matched pairs in the tirzepatide comparison. Boxes show the number of patients remaining after each eligibility step.
Figure 2.
Cohort attrition and propensity-score matching. (A) CagriSema/Placebo comparison. Eligibility required a recorded order or administration of the index drug, age ≥18 years at initiation, ≥12 months of baseline data, ≥30 days of follow-up, and no baseline exposure to the comparator; 25 CagriSema/Placebo patients met criteria and were matched 1:5 by nearest-neighbor propensity-score matching without replacement to tirzepatide and to empagliflozin (n=125 each). (B) Pramlintide comparison. Among patients with type 2 diabetes initiating pramlintide on a basal-insulin background, the same age, baseline-data, follow-up, and comparator non-exposure criteria applied, with the added requirement of basal insulin within the 12 months before index. 797 pramlintide-treated patients met all eligibility criteria and were each matched 1:1 by nearest-neighbor propensity-score matching without replacement to semaglutide and, separately, to tirzepatide, yielding 761 matched pairs in the semaglutide comparison and 652 matched pairs in the tirzepatide comparison. Boxes show the number of patients remaining after each eligibility step.
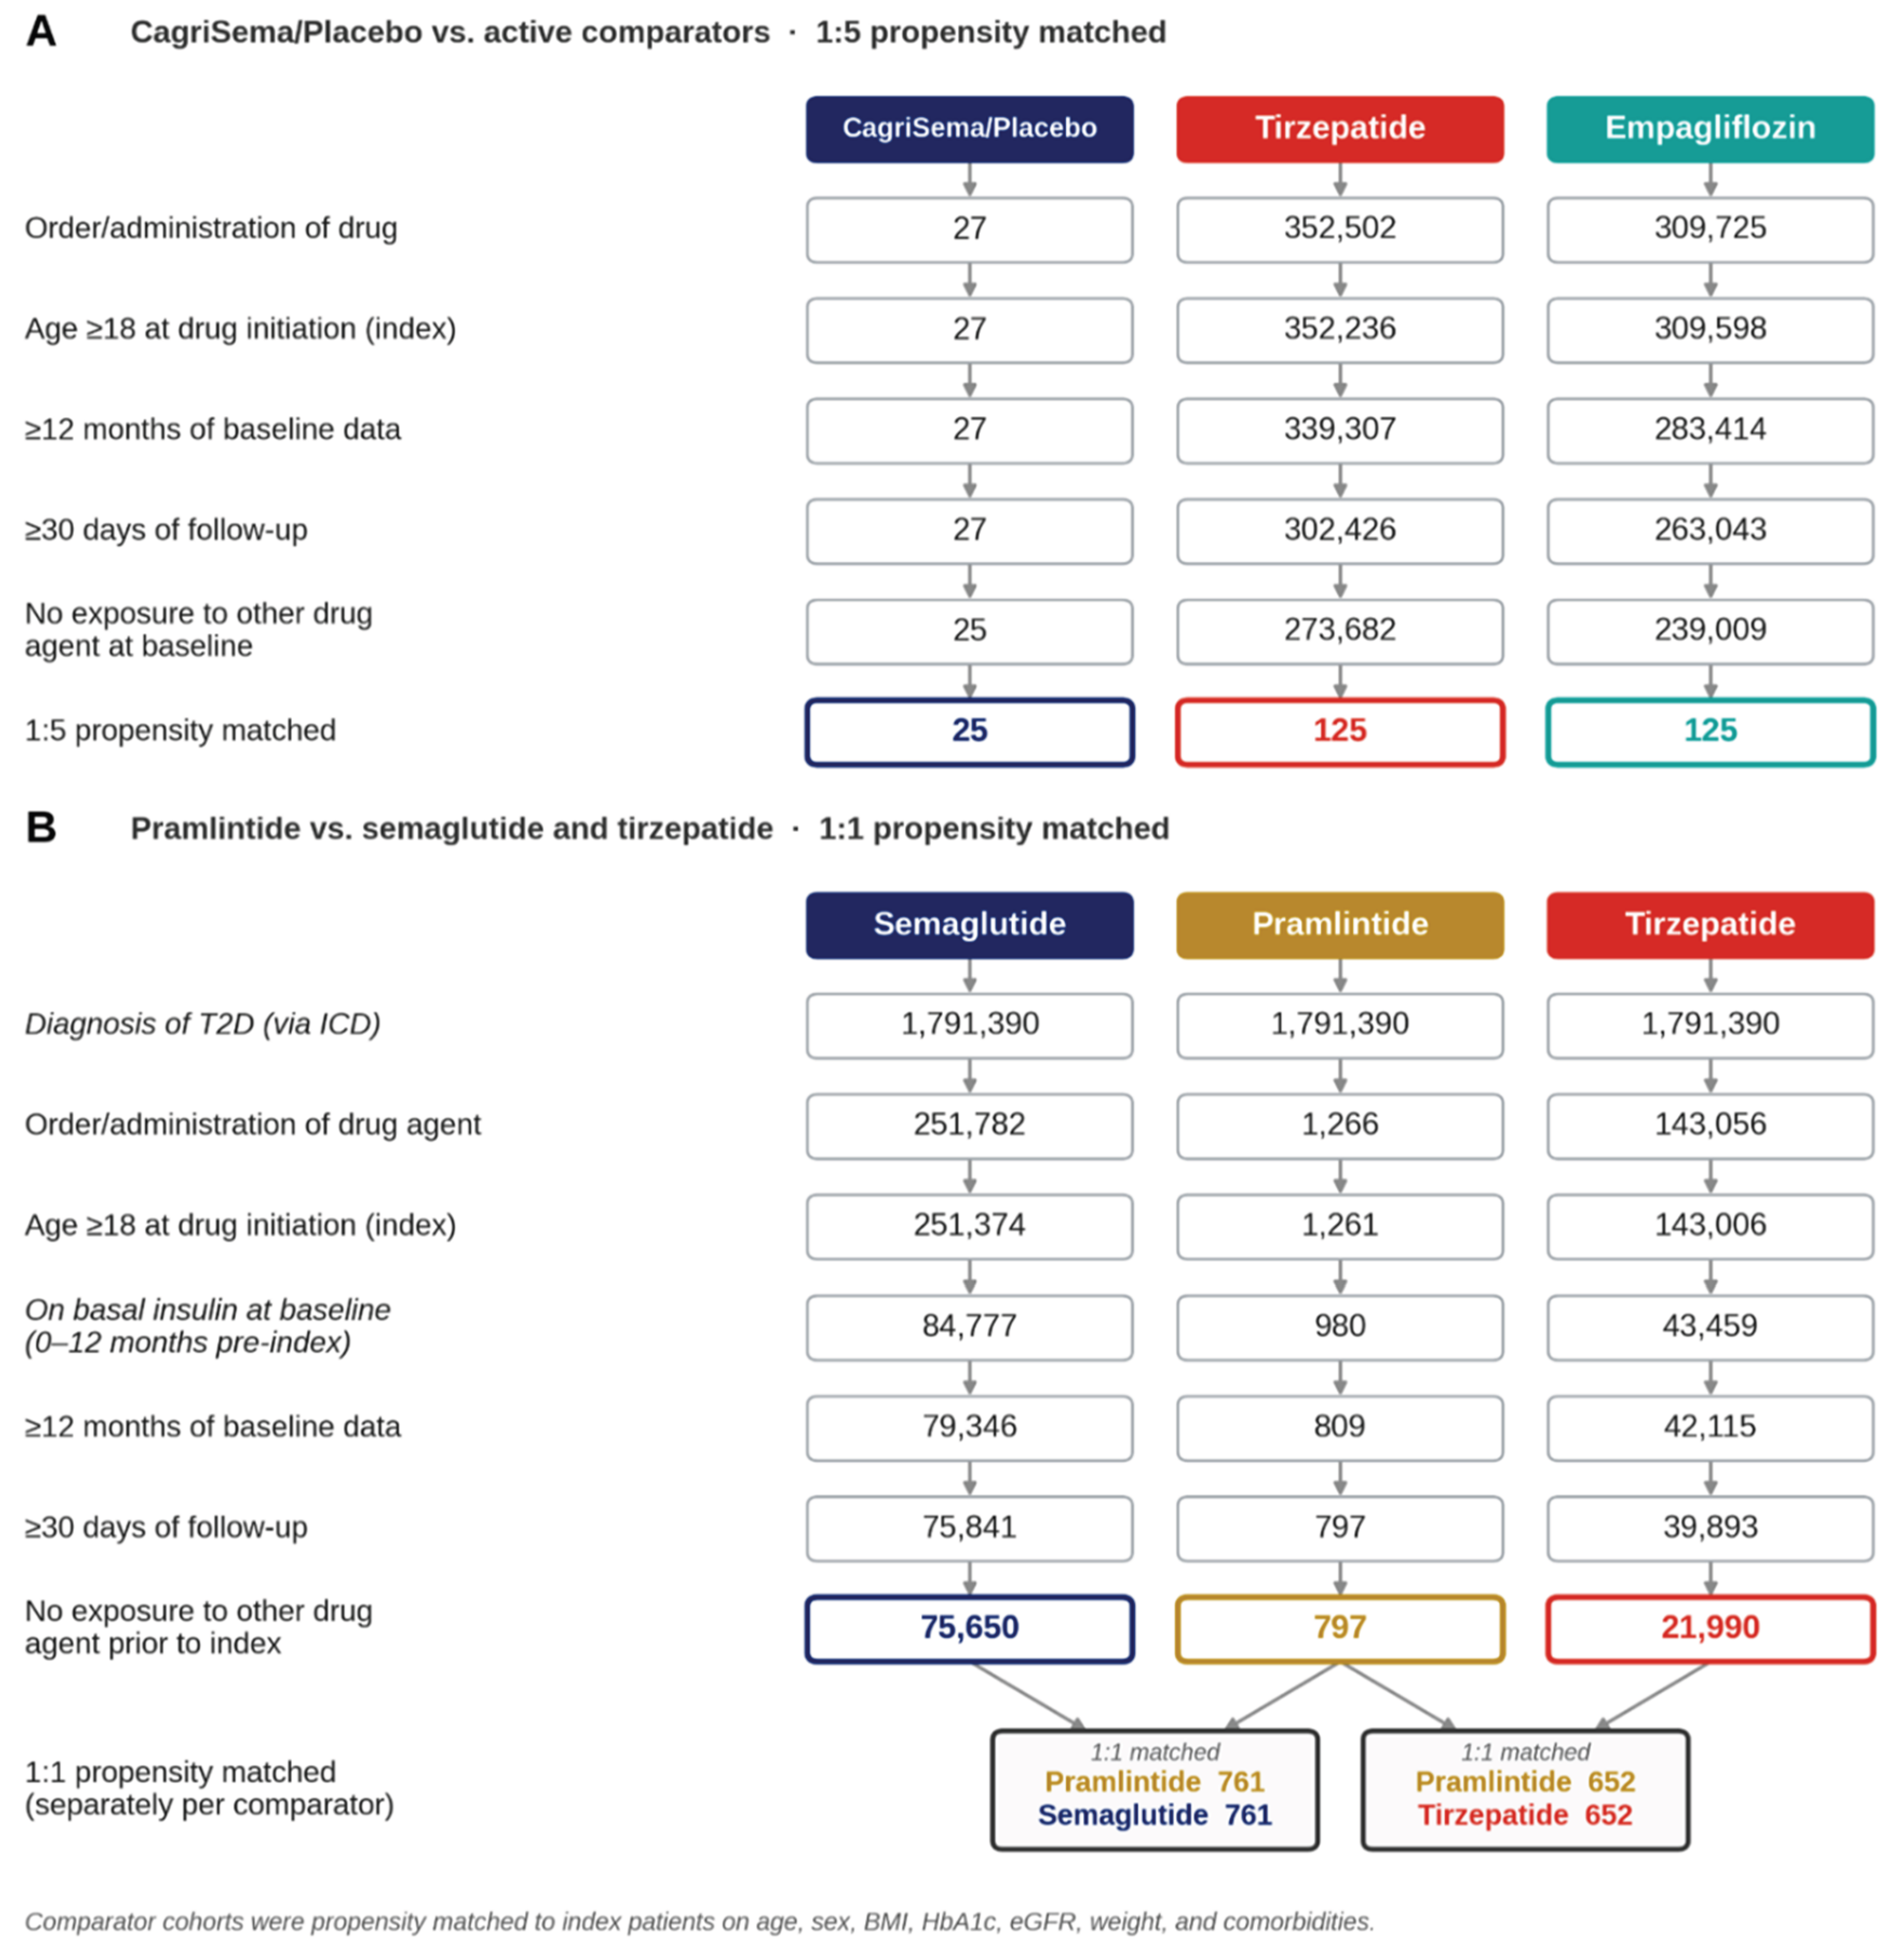
Figure 3.
Six-month laboratory change, CagriSema/Placebo versus tirzepatide and empagliflozin. Mean percent change from baseline (±SEM) at 6 months for metabolic, blood pressure, lipid, hepatic, and renal measures in the matched cohorts: (A) CagriSema/Placebo versus tirzepatide and (B) CagriSema/Placebo versus empagliflozin. CagriSema/Placebo (n=25) was matched 1:5 to tirzepatide and, separately, to empagliflozin (n=125 each). Baseline was the value closest to index within 365 days before index, and follow-up the value closest to 6 months (±3 months). Between-cohort differences were tested by Welch’s two-sample t-test with Benjamini-Hochberg adjustment within each domain; adjusted P shown, bold where P<0.05. Dashed horizontal lines indicate the median for the group.
Figure 3.
Six-month laboratory change, CagriSema/Placebo versus tirzepatide and empagliflozin. Mean percent change from baseline (±SEM) at 6 months for metabolic, blood pressure, lipid, hepatic, and renal measures in the matched cohorts: (A) CagriSema/Placebo versus tirzepatide and (B) CagriSema/Placebo versus empagliflozin. CagriSema/Placebo (n=25) was matched 1:5 to tirzepatide and, separately, to empagliflozin (n=125 each). Baseline was the value closest to index within 365 days before index, and follow-up the value closest to 6 months (±3 months). Between-cohort differences were tested by Welch’s two-sample t-test with Benjamini-Hochberg adjustment within each domain; adjusted P shown, bold where P<0.05. Dashed horizontal lines indicate the median for the group.
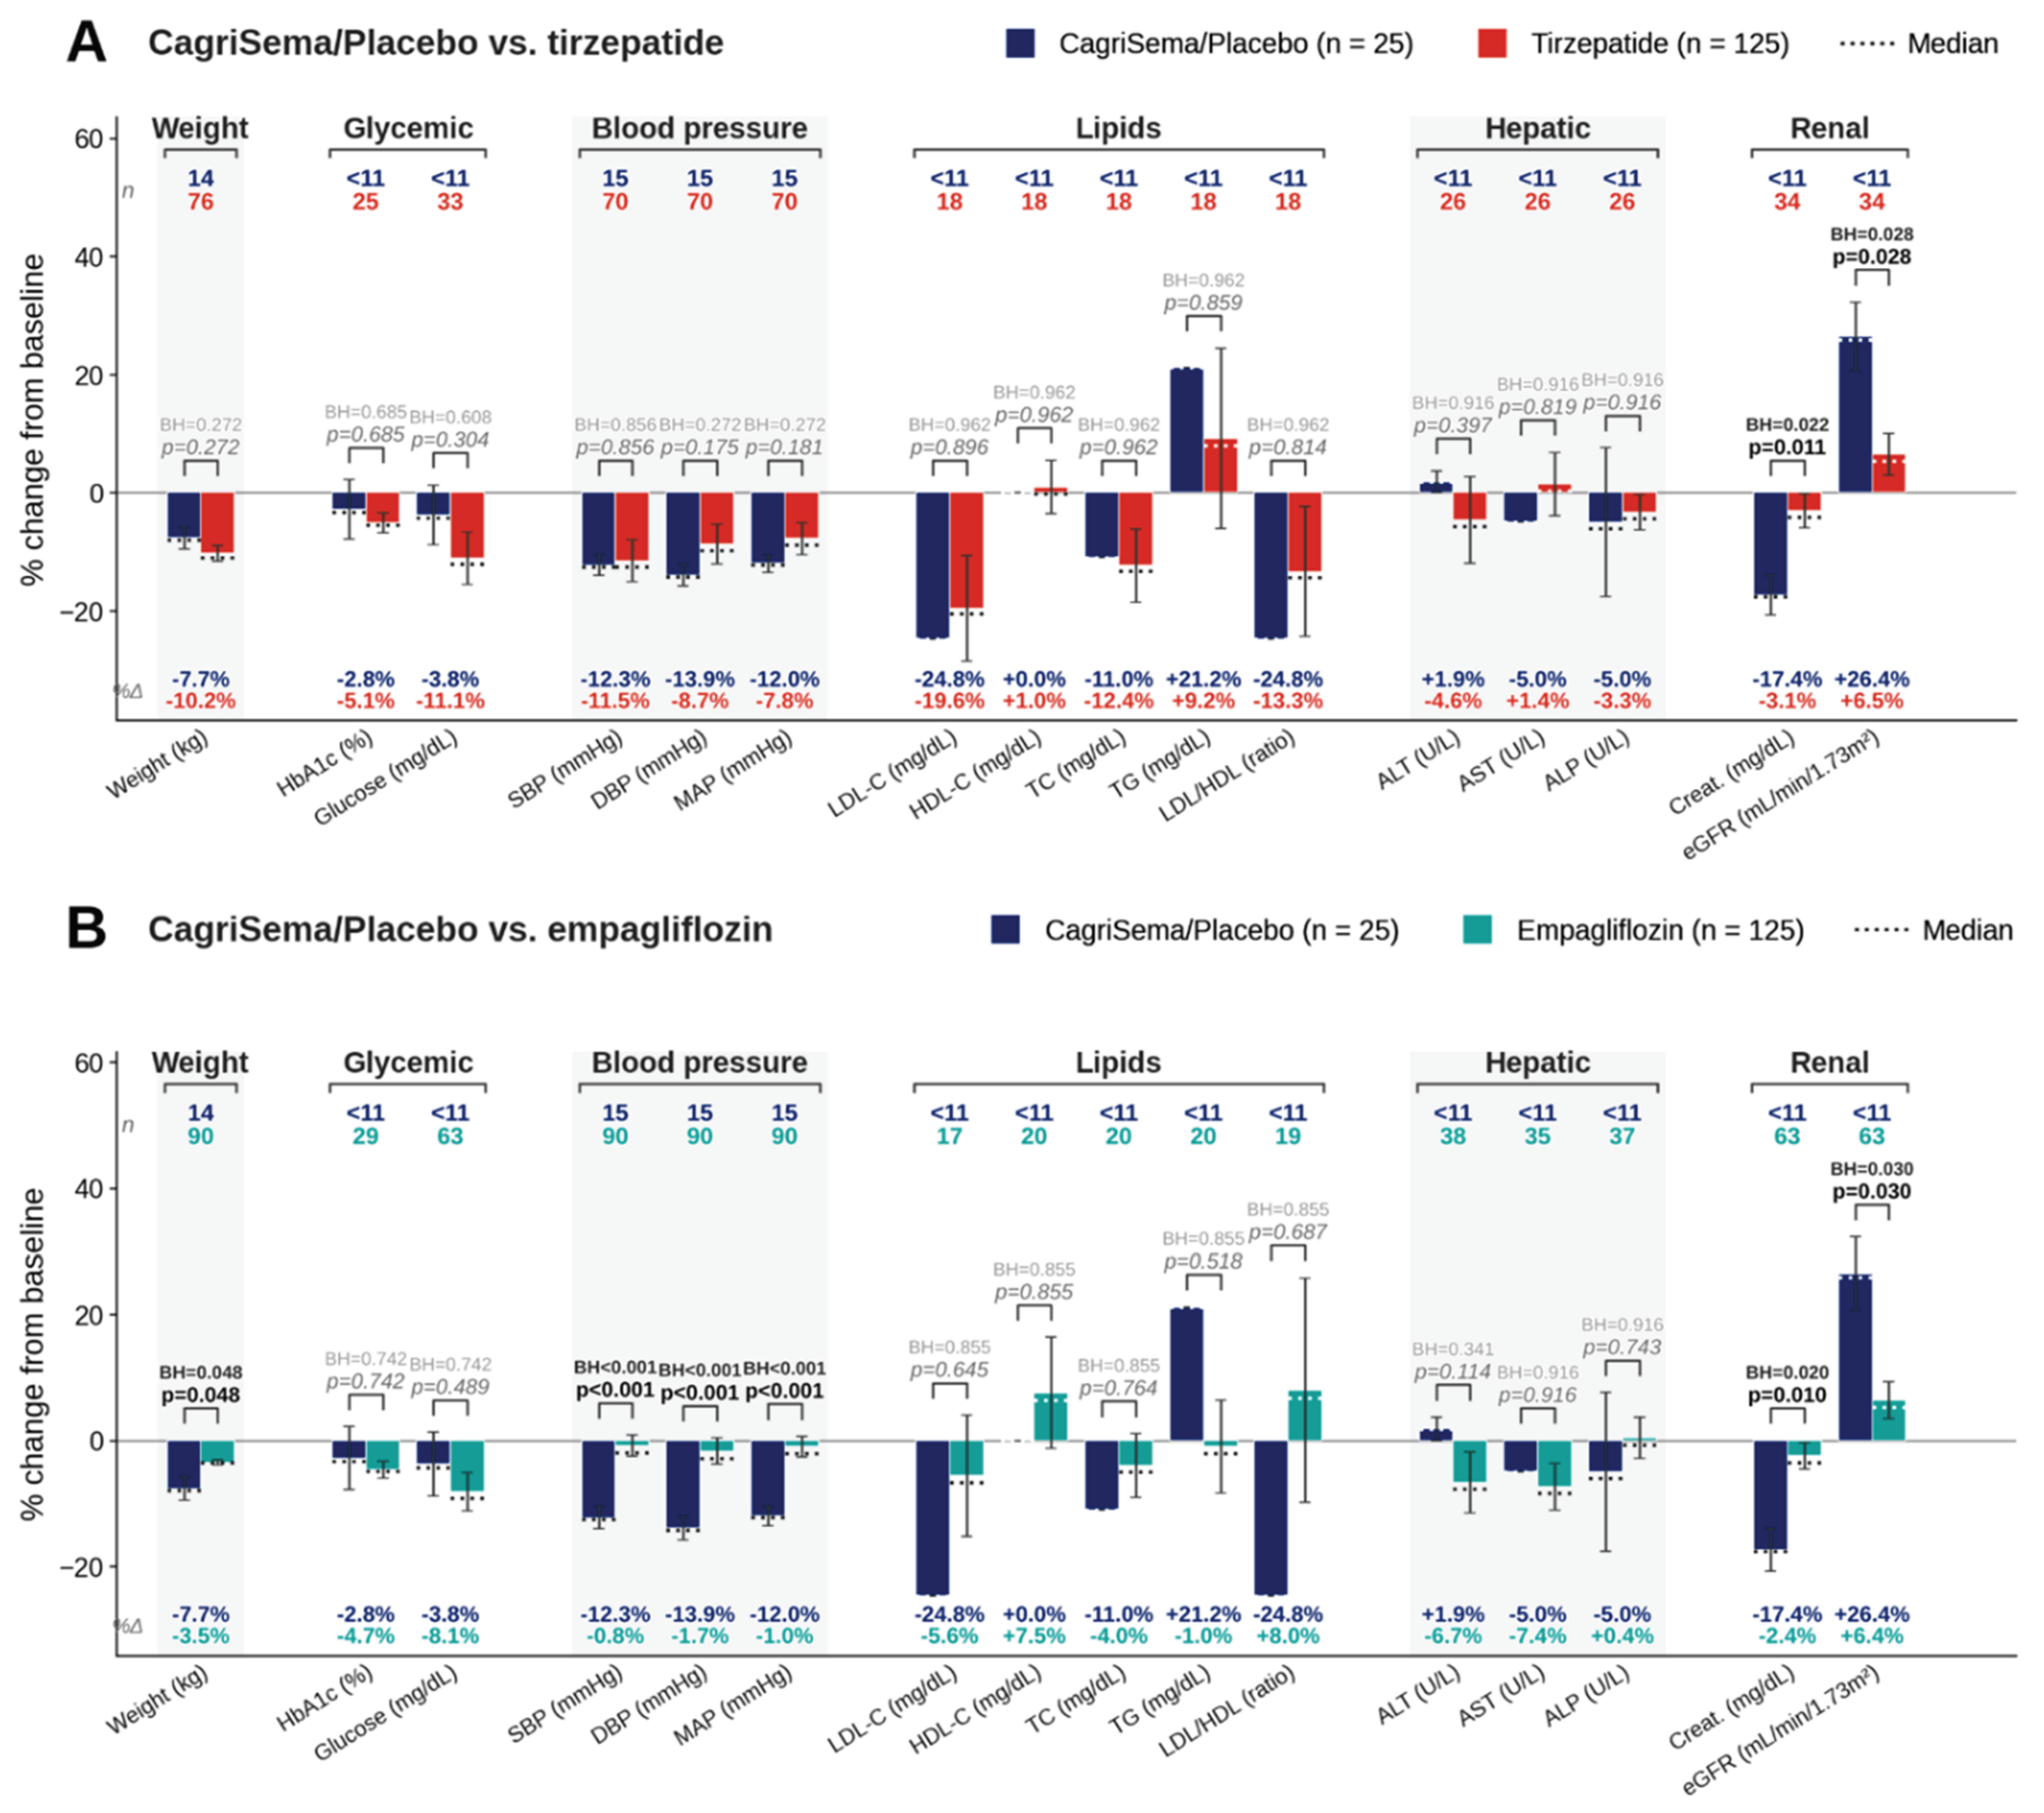
Figure 4.
Baseline and 6-month absolute laboratory values: CagriSema/Placebo, tirzepatide, and empagliflozin. For each measure, the mean baseline value is connected to the mean 6-month value; the mean percent change is shown above each panel. CagriSema/Placebo was matched 1:5 separately to tirzepatide and empagliflozin.
Figure 4.
Baseline and 6-month absolute laboratory values: CagriSema/Placebo, tirzepatide, and empagliflozin. For each measure, the mean baseline value is connected to the mean 6-month value; the mean percent change is shown above each panel. CagriSema/Placebo was matched 1:5 separately to tirzepatide and empagliflozin.
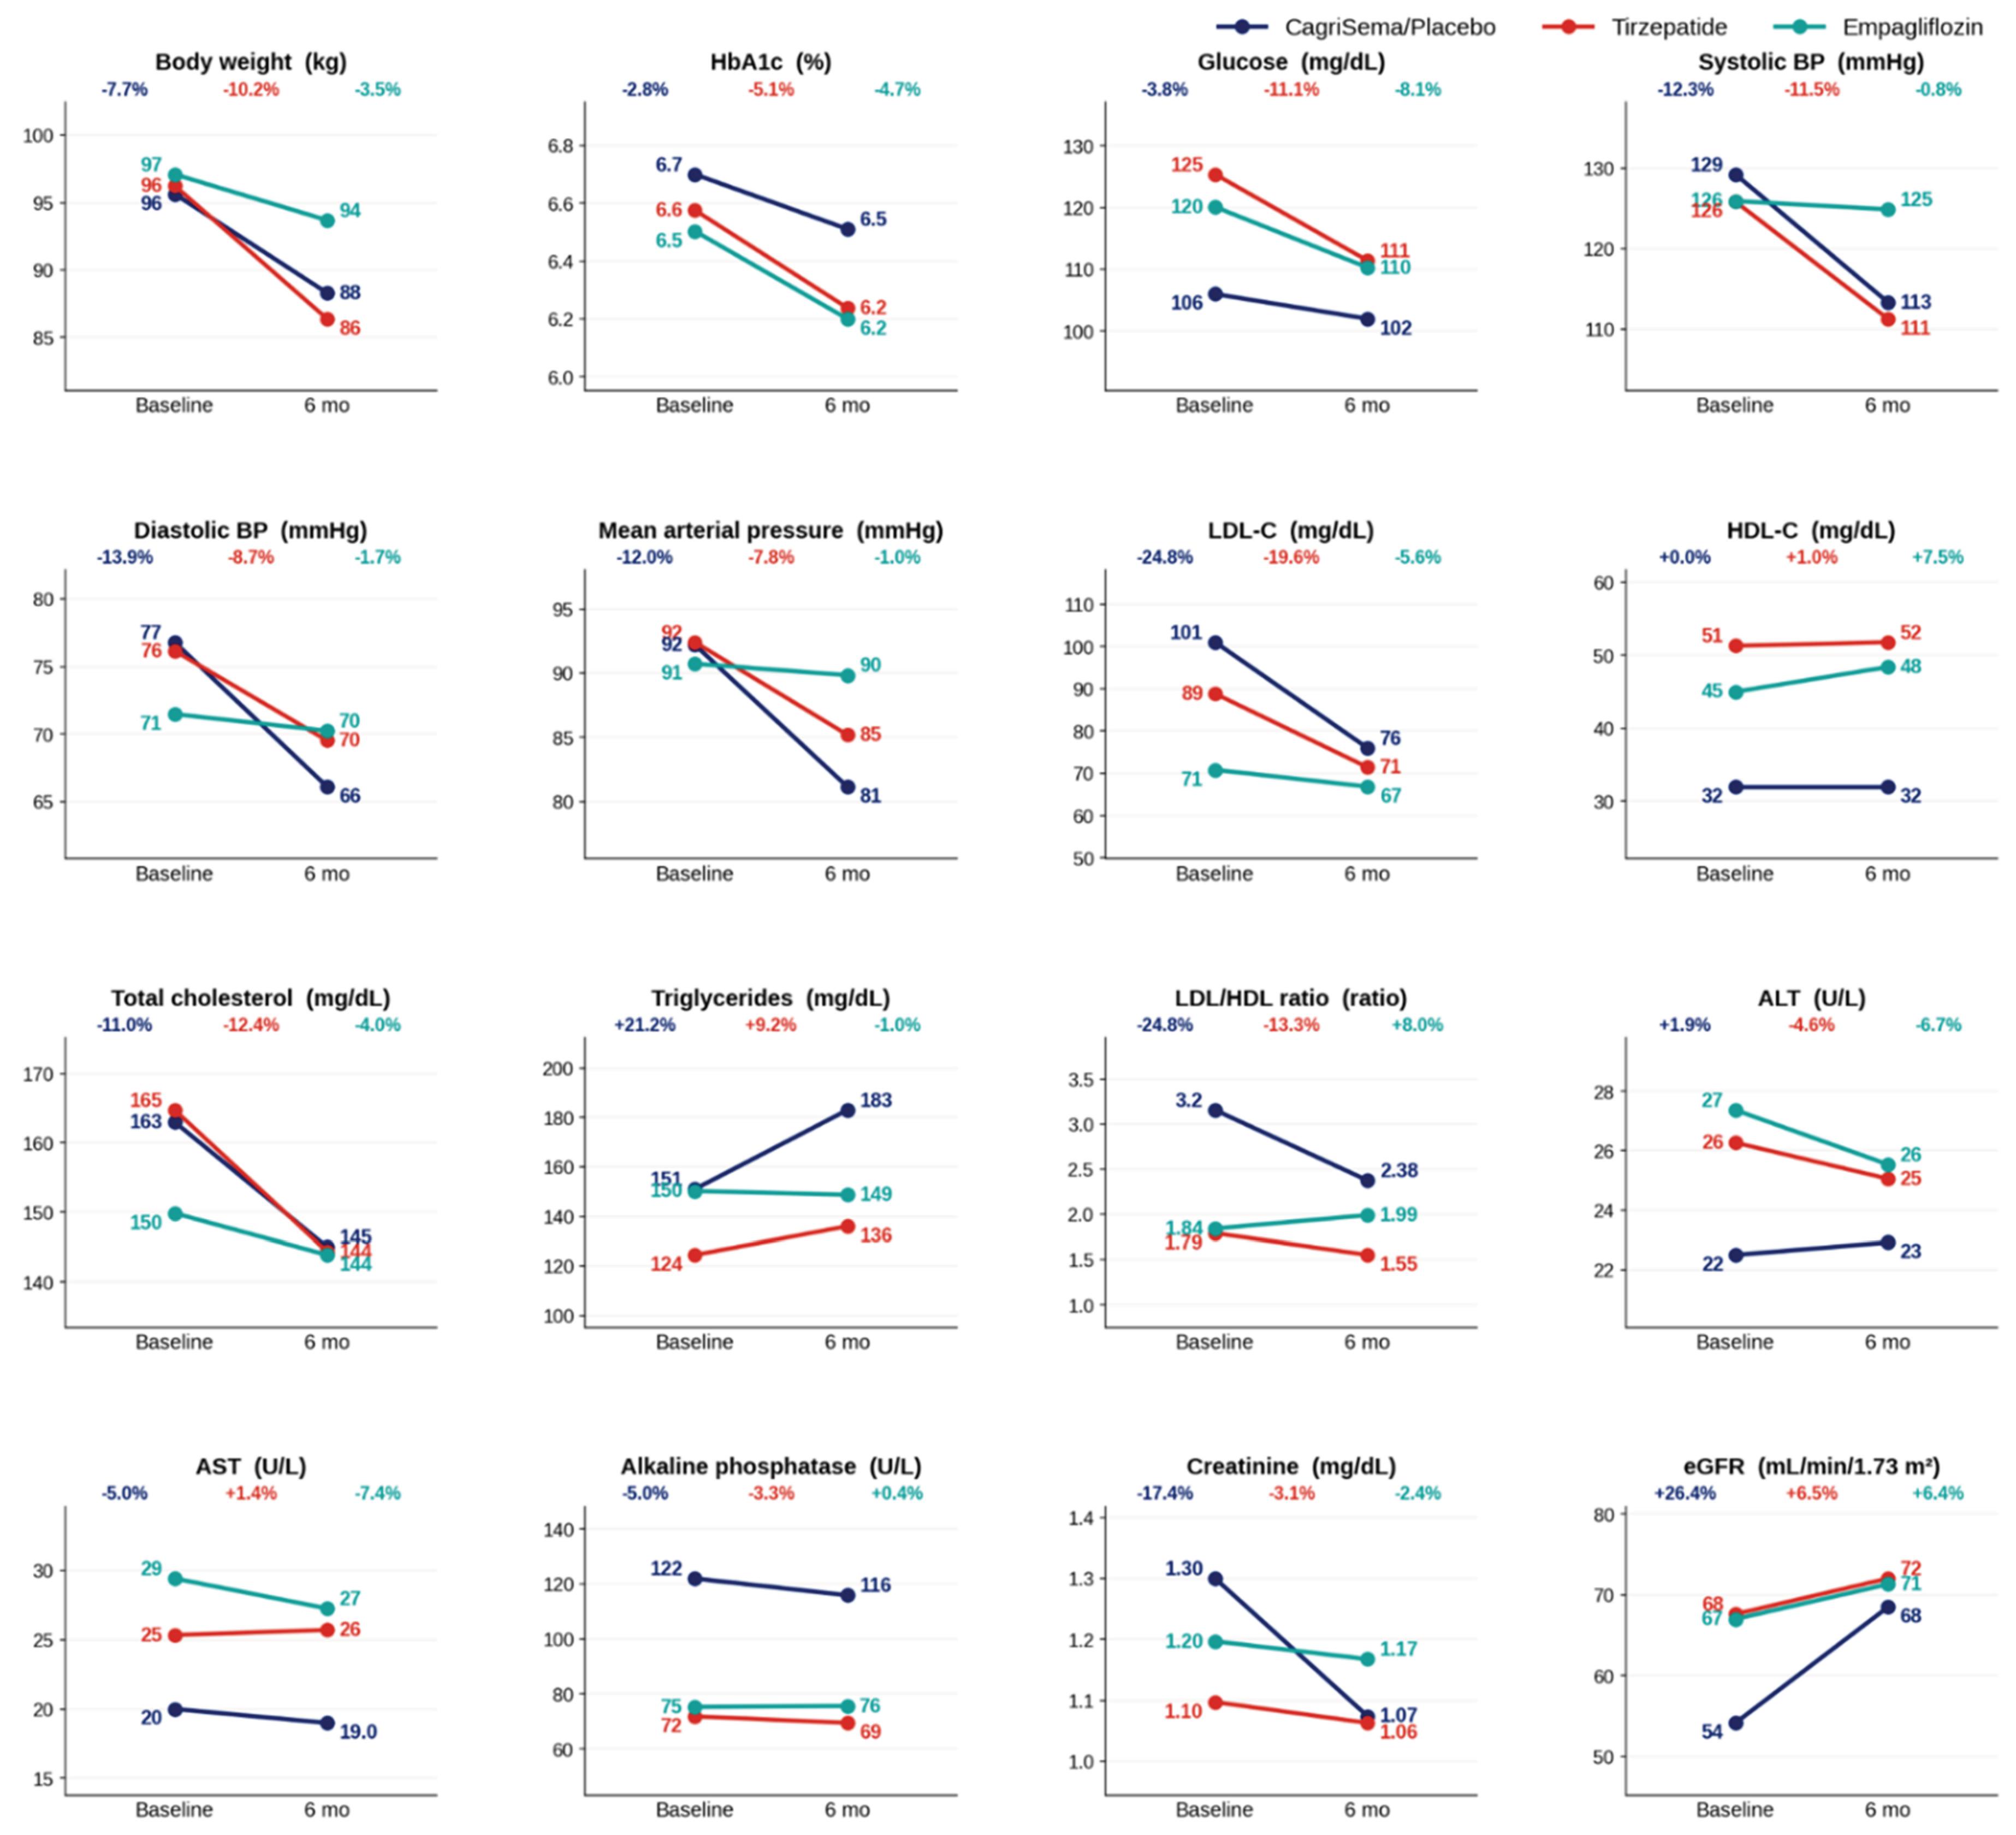
Figure 5.
Six-month laboratory change, pramlintide versus tirzepatide and semaglutide. Mean percent change from baseline (±SEM) at 6 months in the matched type 2 diabetes cohorts: (A) pramlintide versus tirzepatide and (B) pramlintide versus semaglutide. Pramlintide was matched 1:1 to tirzepatide (652 pairs) and, separately, to semaglutide (761 pairs). Baseline and follow-up windows and statistical testing as in Figure 3. Dashed horizontal lines indicate the median for the group.
Figure 5.
Six-month laboratory change, pramlintide versus tirzepatide and semaglutide. Mean percent change from baseline (±SEM) at 6 months in the matched type 2 diabetes cohorts: (A) pramlintide versus tirzepatide and (B) pramlintide versus semaglutide. Pramlintide was matched 1:1 to tirzepatide (652 pairs) and, separately, to semaglutide (761 pairs). Baseline and follow-up windows and statistical testing as in Figure 3. Dashed horizontal lines indicate the median for the group.
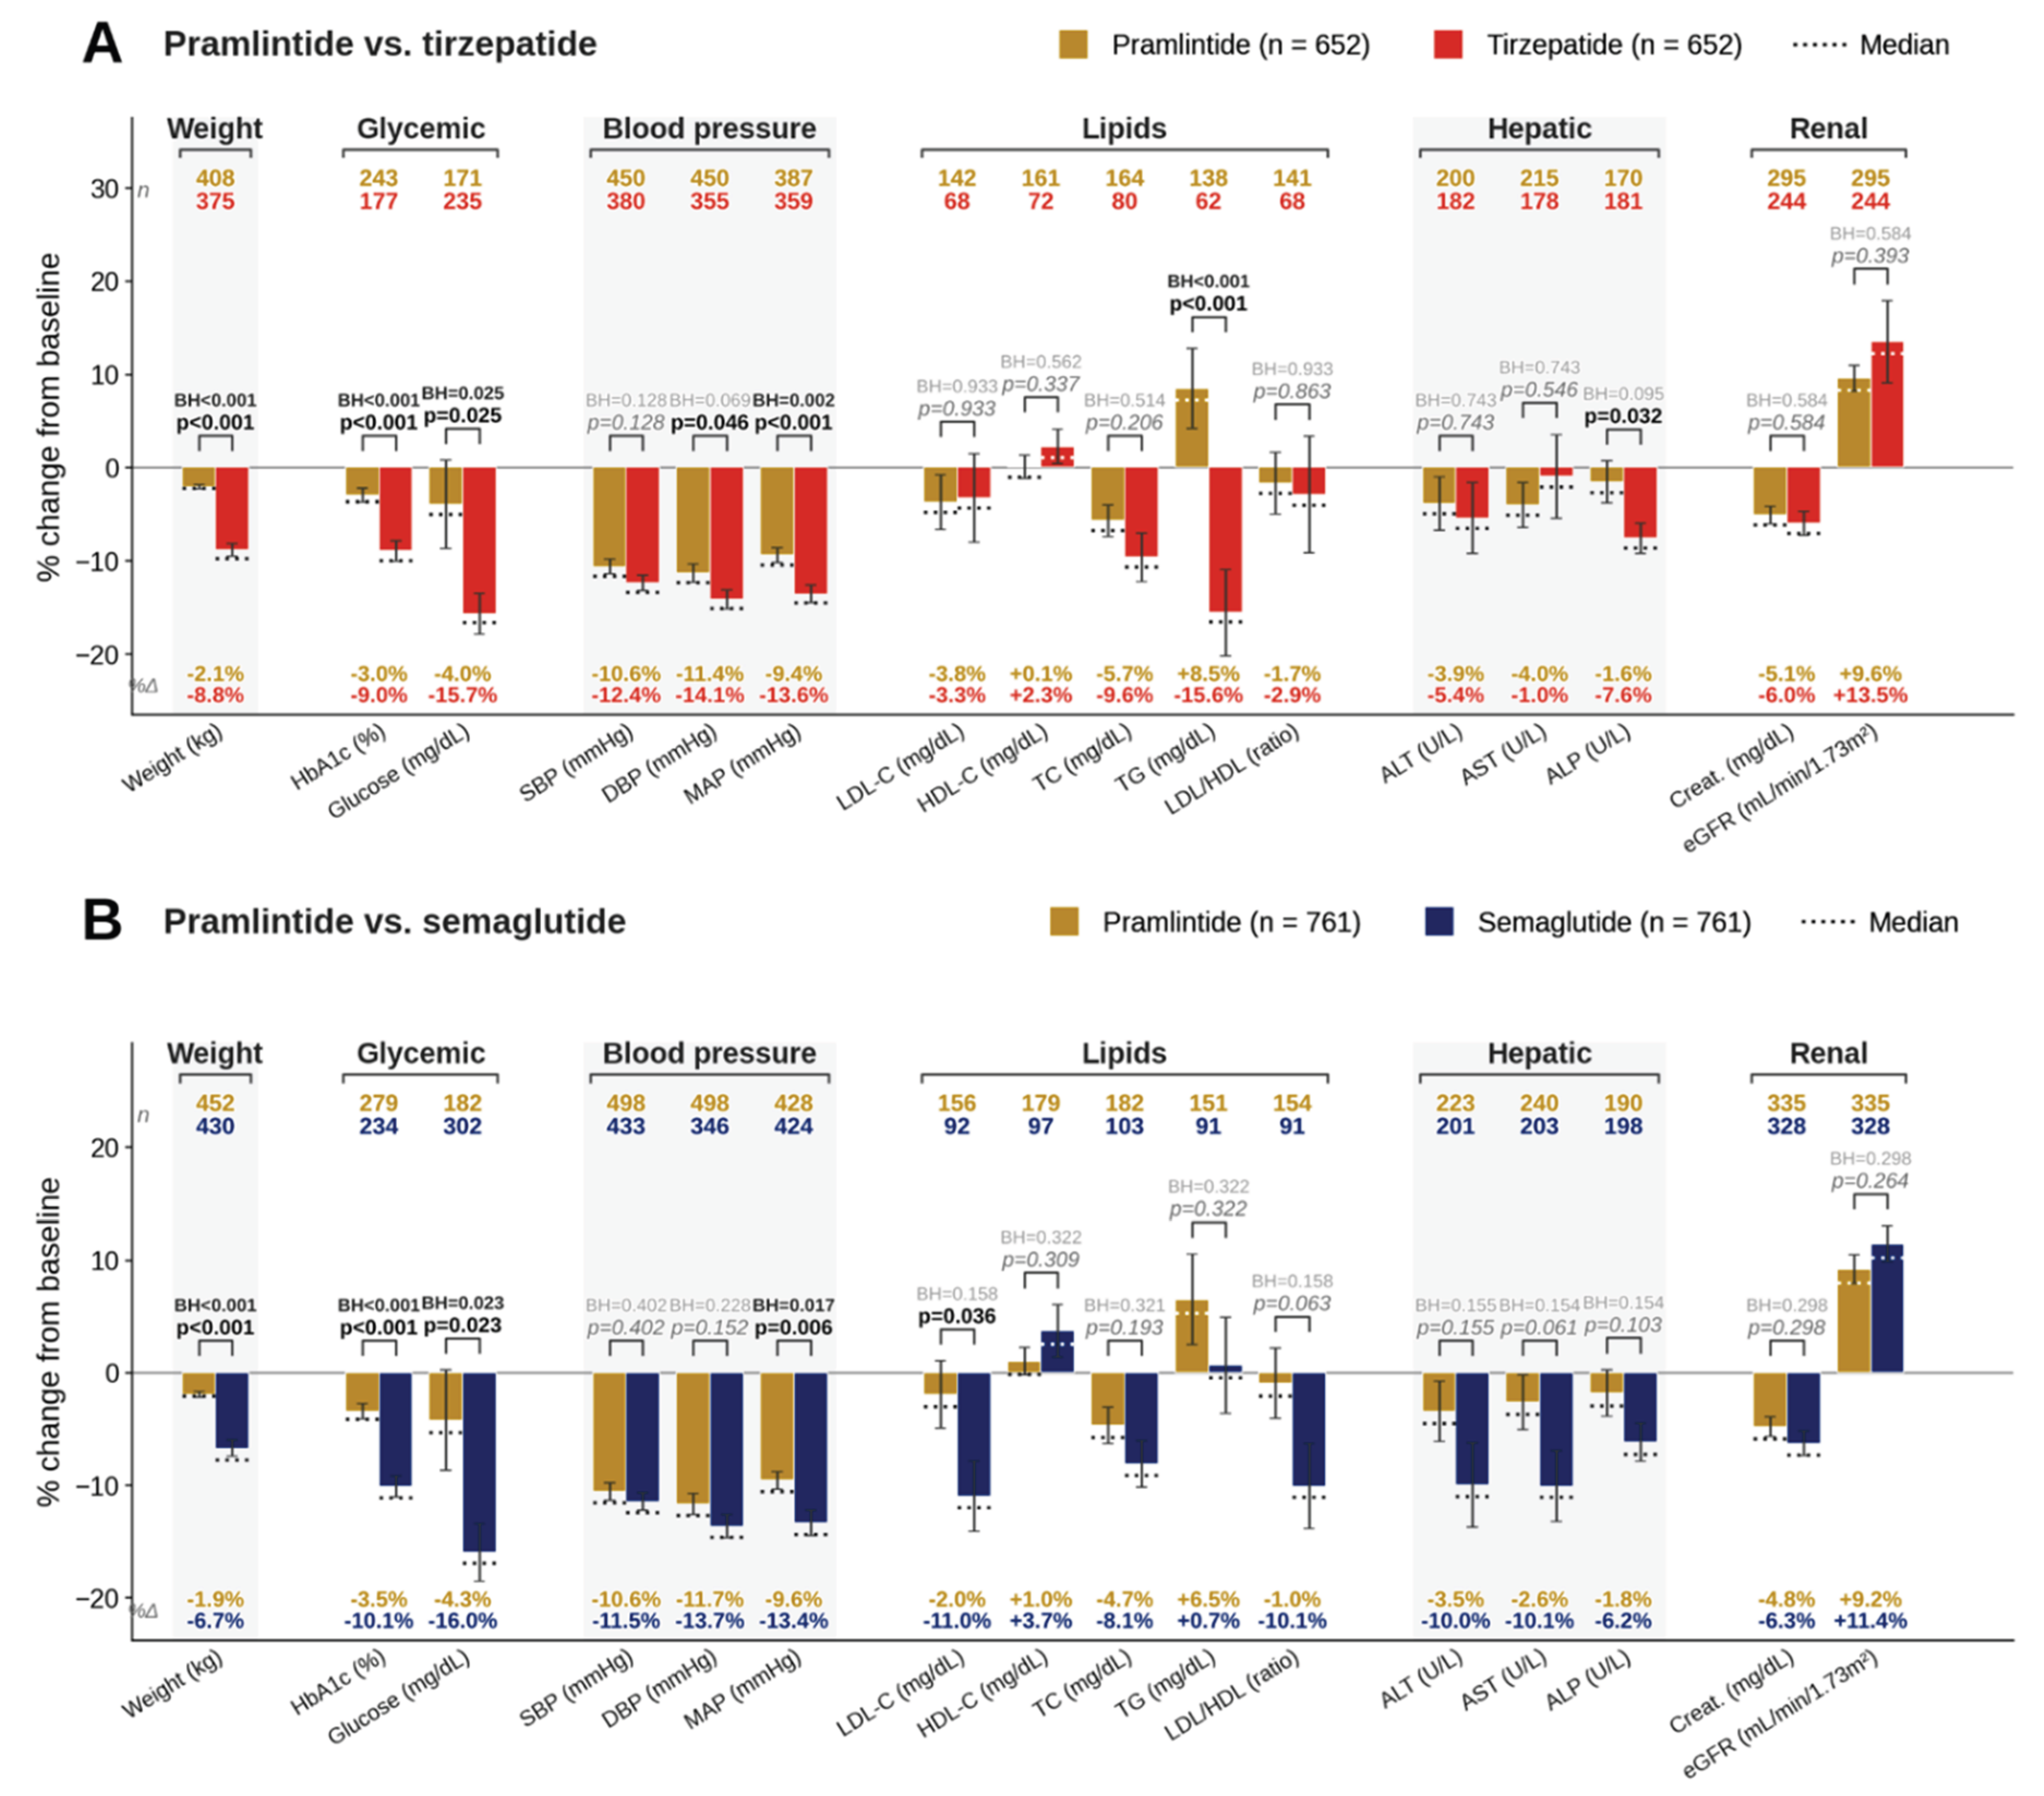
Figure 6.
Laboratory change per kilogram of weight lost at 6 months. (A) Pramlintide versus tirzepatide. (B) Pramlintide versus semaglutide. For each analyte and arm, the percent change from baseline to 6 months was divided by kilograms of weight lost; patients with <1.0 kg of weight loss were excluded. Points show the mean percentage change normalized by kilograms of weight lost and the 95% confidence interval; filled points denote an interval excluding zero, open points an interval including zero, and arrows mark estimates beyond the plotted range. Annotation columns report the mean value, 95% confidence interval, and contributing sample size, followed by the unadjusted p-value for the pramlintide-versus-comparator difference (via a z-test on the per-kilogram changes) and the Benjamini-Hochberg adjusted p-value within each domain. Negative values indicate a decline and positive values a rise per kilogram lost.
Figure 6.
Laboratory change per kilogram of weight lost at 6 months. (A) Pramlintide versus tirzepatide. (B) Pramlintide versus semaglutide. For each analyte and arm, the percent change from baseline to 6 months was divided by kilograms of weight lost; patients with <1.0 kg of weight loss were excluded. Points show the mean percentage change normalized by kilograms of weight lost and the 95% confidence interval; filled points denote an interval excluding zero, open points an interval including zero, and arrows mark estimates beyond the plotted range. Annotation columns report the mean value, 95% confidence interval, and contributing sample size, followed by the unadjusted p-value for the pramlintide-versus-comparator difference (via a z-test on the per-kilogram changes) and the Benjamini-Hochberg adjusted p-value within each domain. Negative values indicate a decline and positive values a rise per kilogram lost.
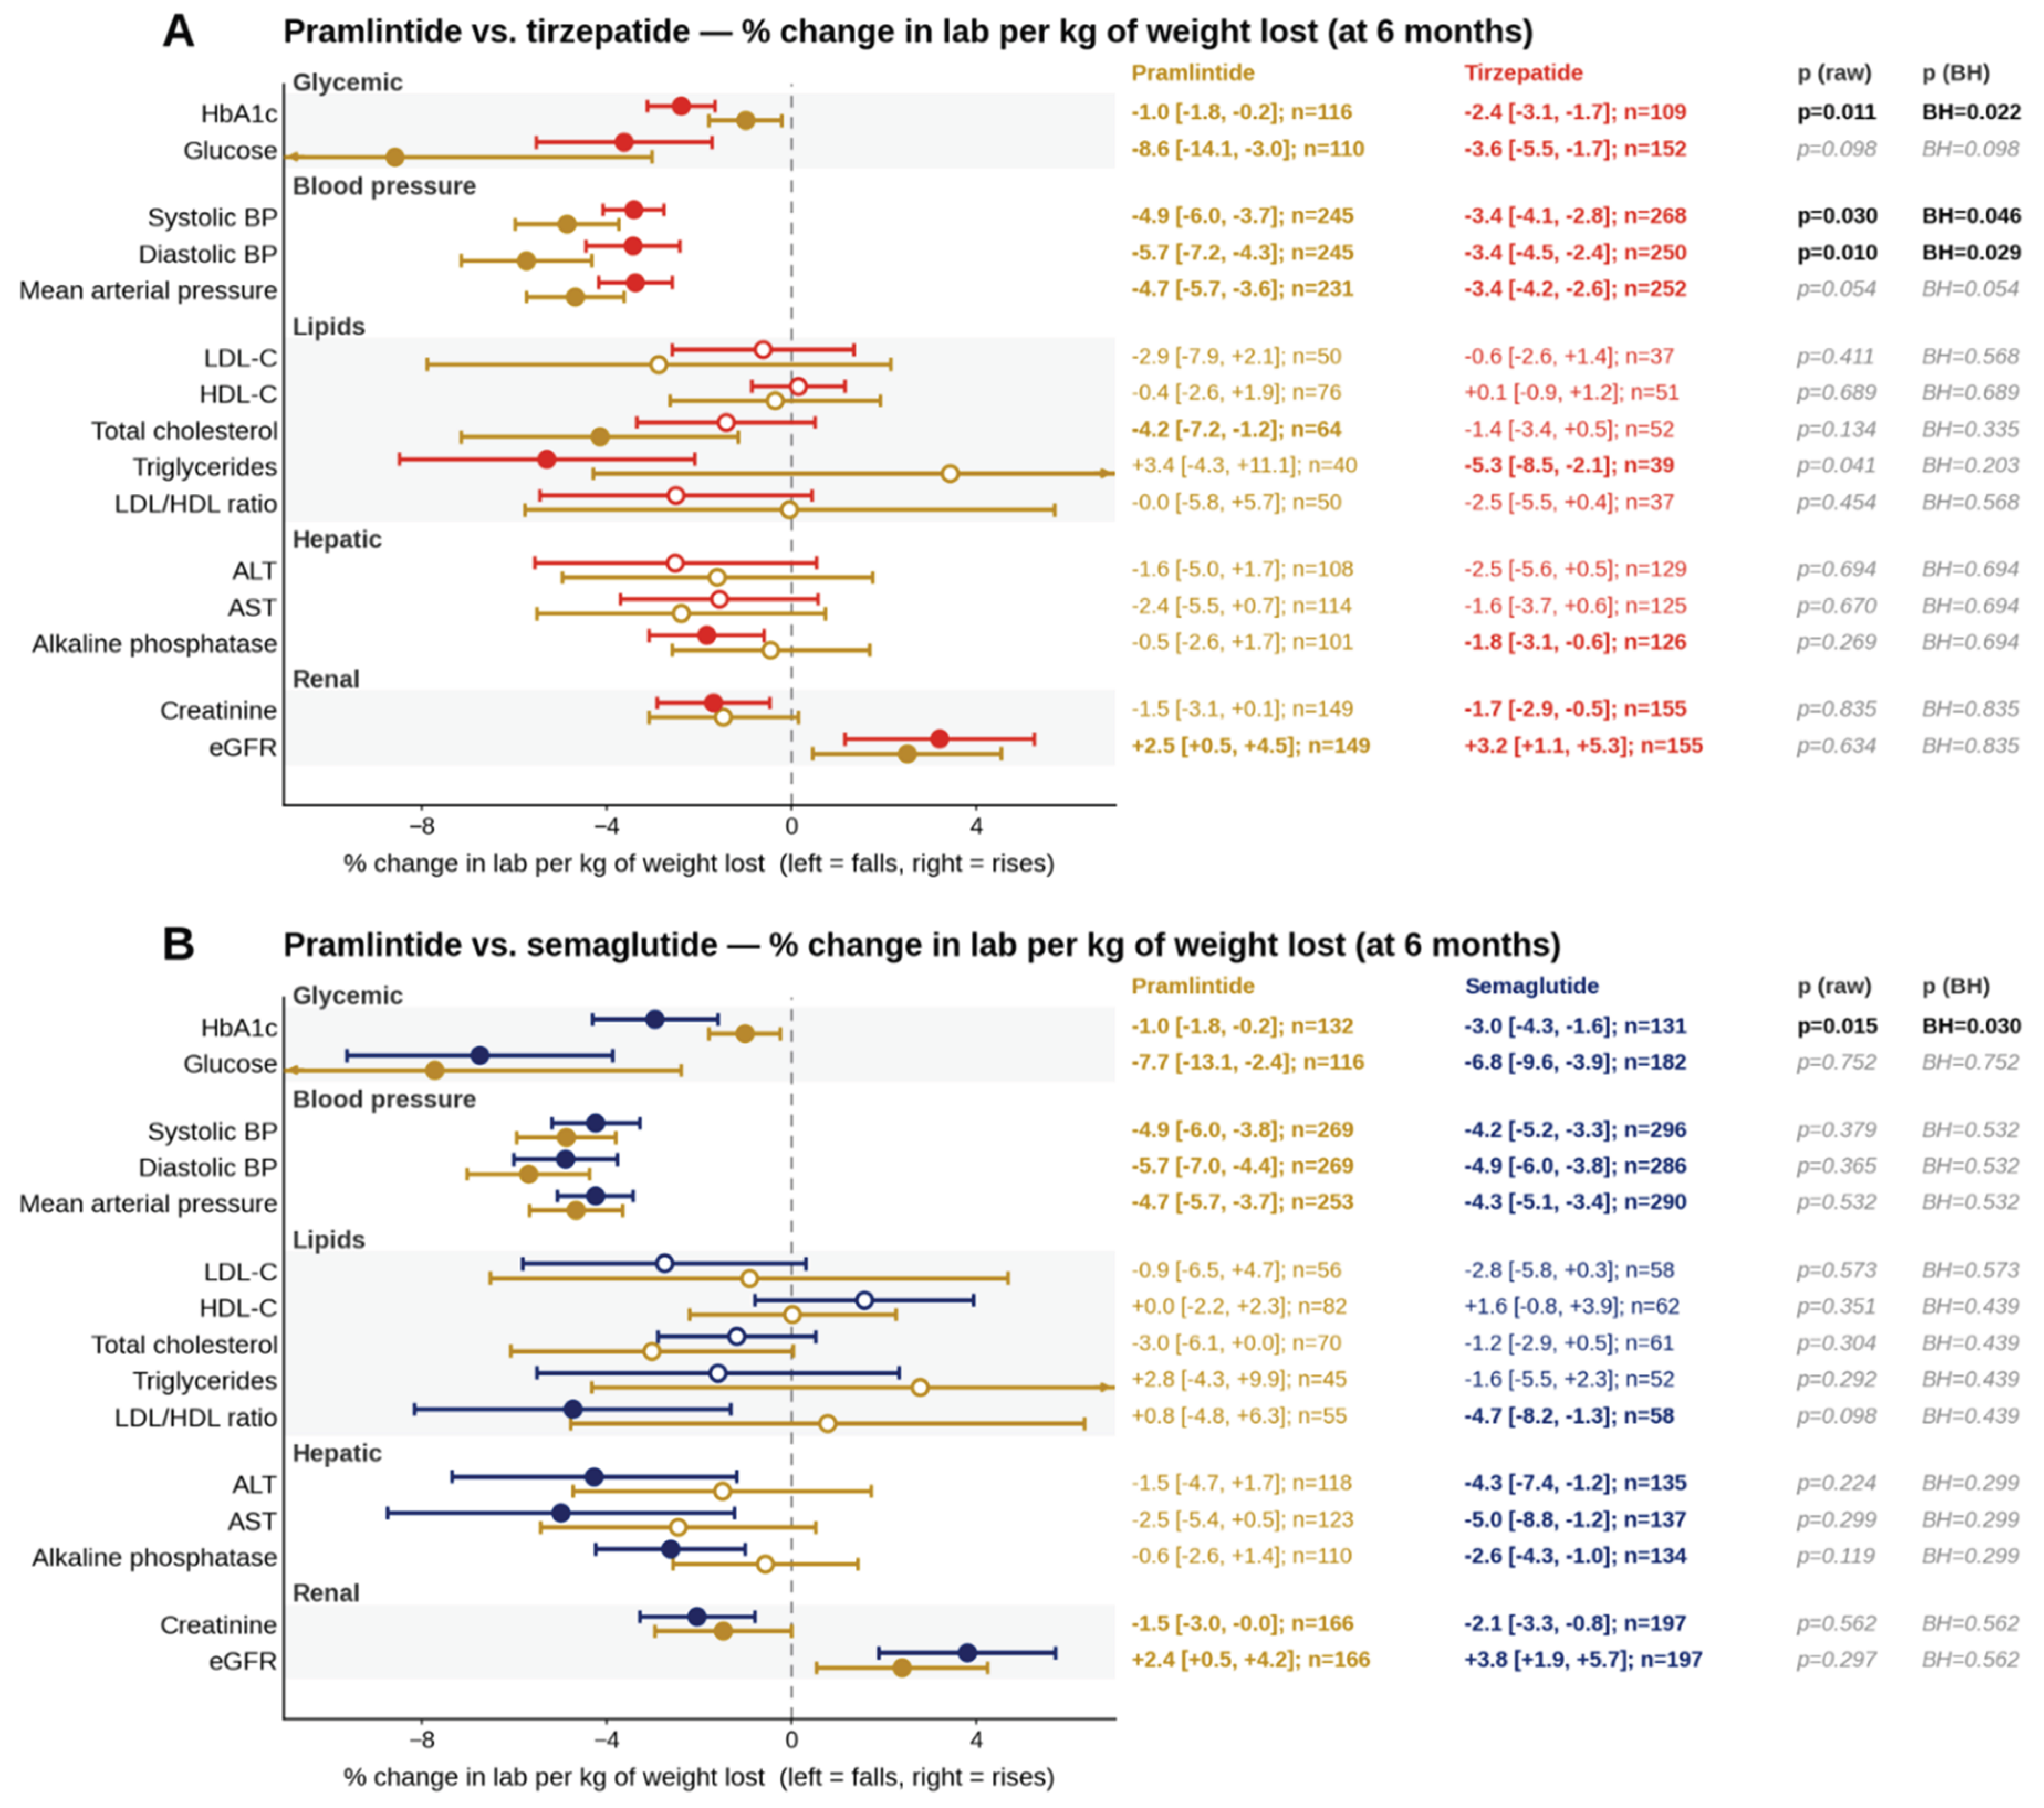
Figure 7.
Laboratory change per kilogram of weight lost at 6 months: tirzepatide versus semaglutide. Tirzepatide and semaglutide were each matched 1:1 to the same pramlintide cohort, so this is an indirect comparison assuming exchangeability through the shared anchor. Methods used are defined in Figure 5.
Figure 7.
Laboratory change per kilogram of weight lost at 6 months: tirzepatide versus semaglutide. Tirzepatide and semaglutide were each matched 1:1 to the same pramlintide cohort, so this is an indirect comparison assuming exchangeability through the shared anchor. Methods used are defined in Figure 5.
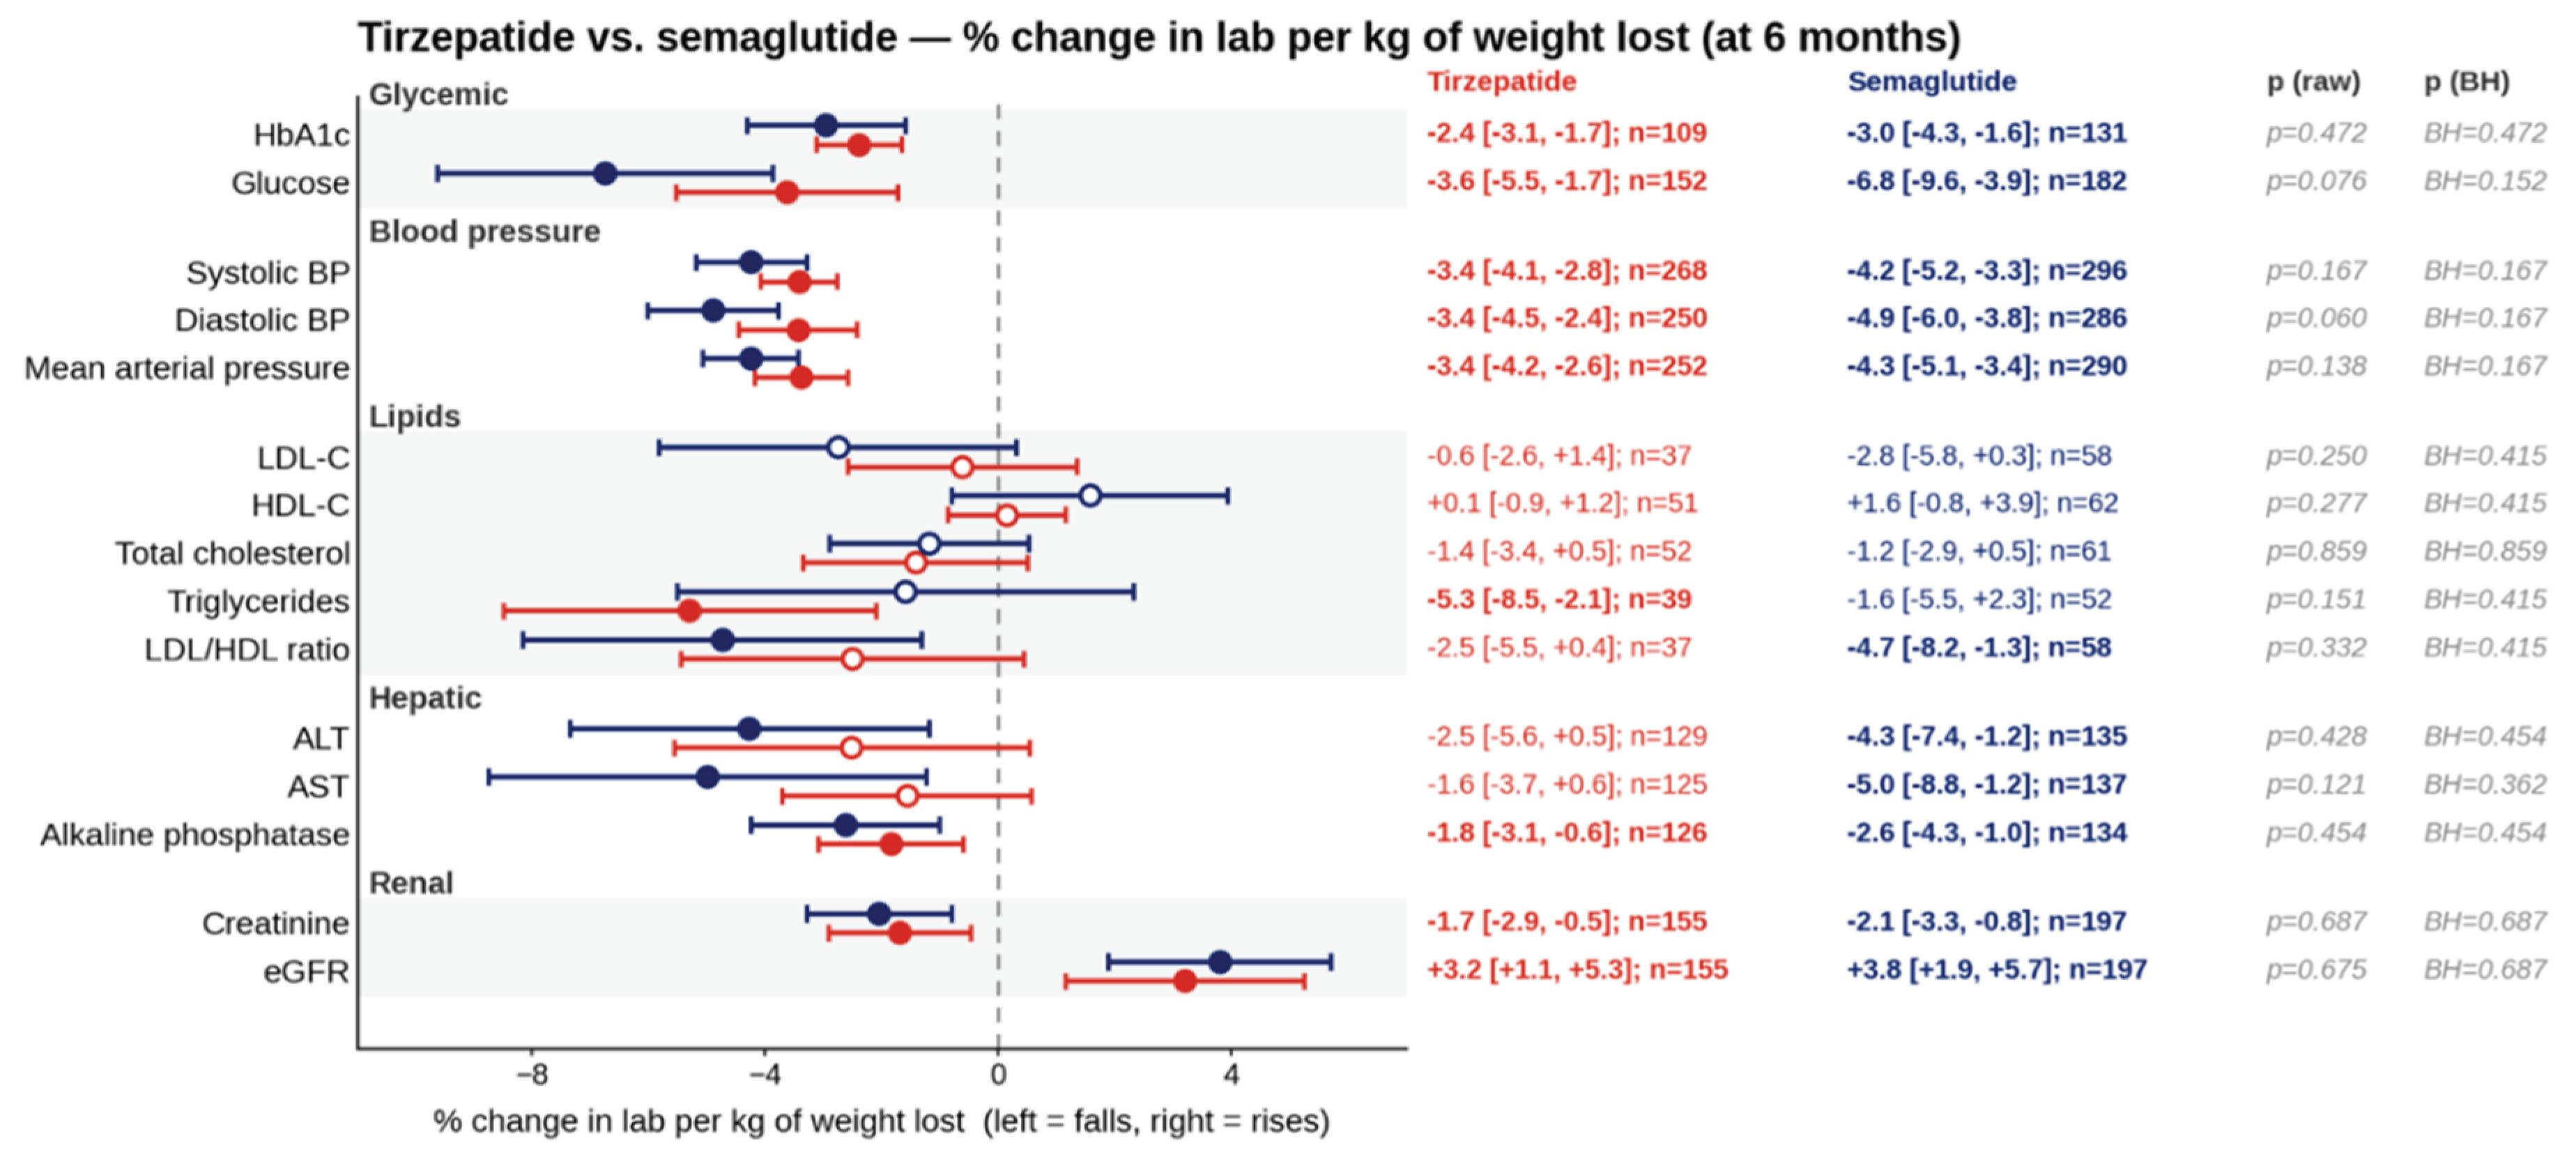
Figure 8.
Drug-level medication-transition signals around index. (A) Significant medication-prevalence decreases at the 6-month window (post-index minus pre-index prevalence, in percentage points), grouped into amylin analogue cohorts (pramlintide) and comparator cohorts (semaglutide and tirzepatide, each matched to pramlintide); the exact McNemar P value is shown at right. (B) Prevalence change (percentage points) across the 6, 12, 18, and 24-month windows for selected medications in the pramlintide-, semaglutide-, and tirzepatide-matched cohorts; each cell shows the change with significance markers (* P<0.05, ** P<0.01, *** P<0.001), colored blue for decreases and red for increases (color clipped at ±12 percentage points). The study-medication labels (pramlintide, semaglutide, tirzepatide) increase after index, as expected, and are shown for reference. Patient counts below 11 are reported as <11; the index-date record is excluded from both windows.
Figure 8.
Drug-level medication-transition signals around index. (A) Significant medication-prevalence decreases at the 6-month window (post-index minus pre-index prevalence, in percentage points), grouped into amylin analogue cohorts (pramlintide) and comparator cohorts (semaglutide and tirzepatide, each matched to pramlintide); the exact McNemar P value is shown at right. (B) Prevalence change (percentage points) across the 6, 12, 18, and 24-month windows for selected medications in the pramlintide-, semaglutide-, and tirzepatide-matched cohorts; each cell shows the change with significance markers (* P<0.05, ** P<0.01, *** P<0.001), colored blue for decreases and red for increases (color clipped at ±12 percentage points). The study-medication labels (pramlintide, semaglutide, tirzepatide) increase after index, as expected, and are shown for reference. Patient counts below 11 are reported as <11; the index-date record is excluded from both windows.
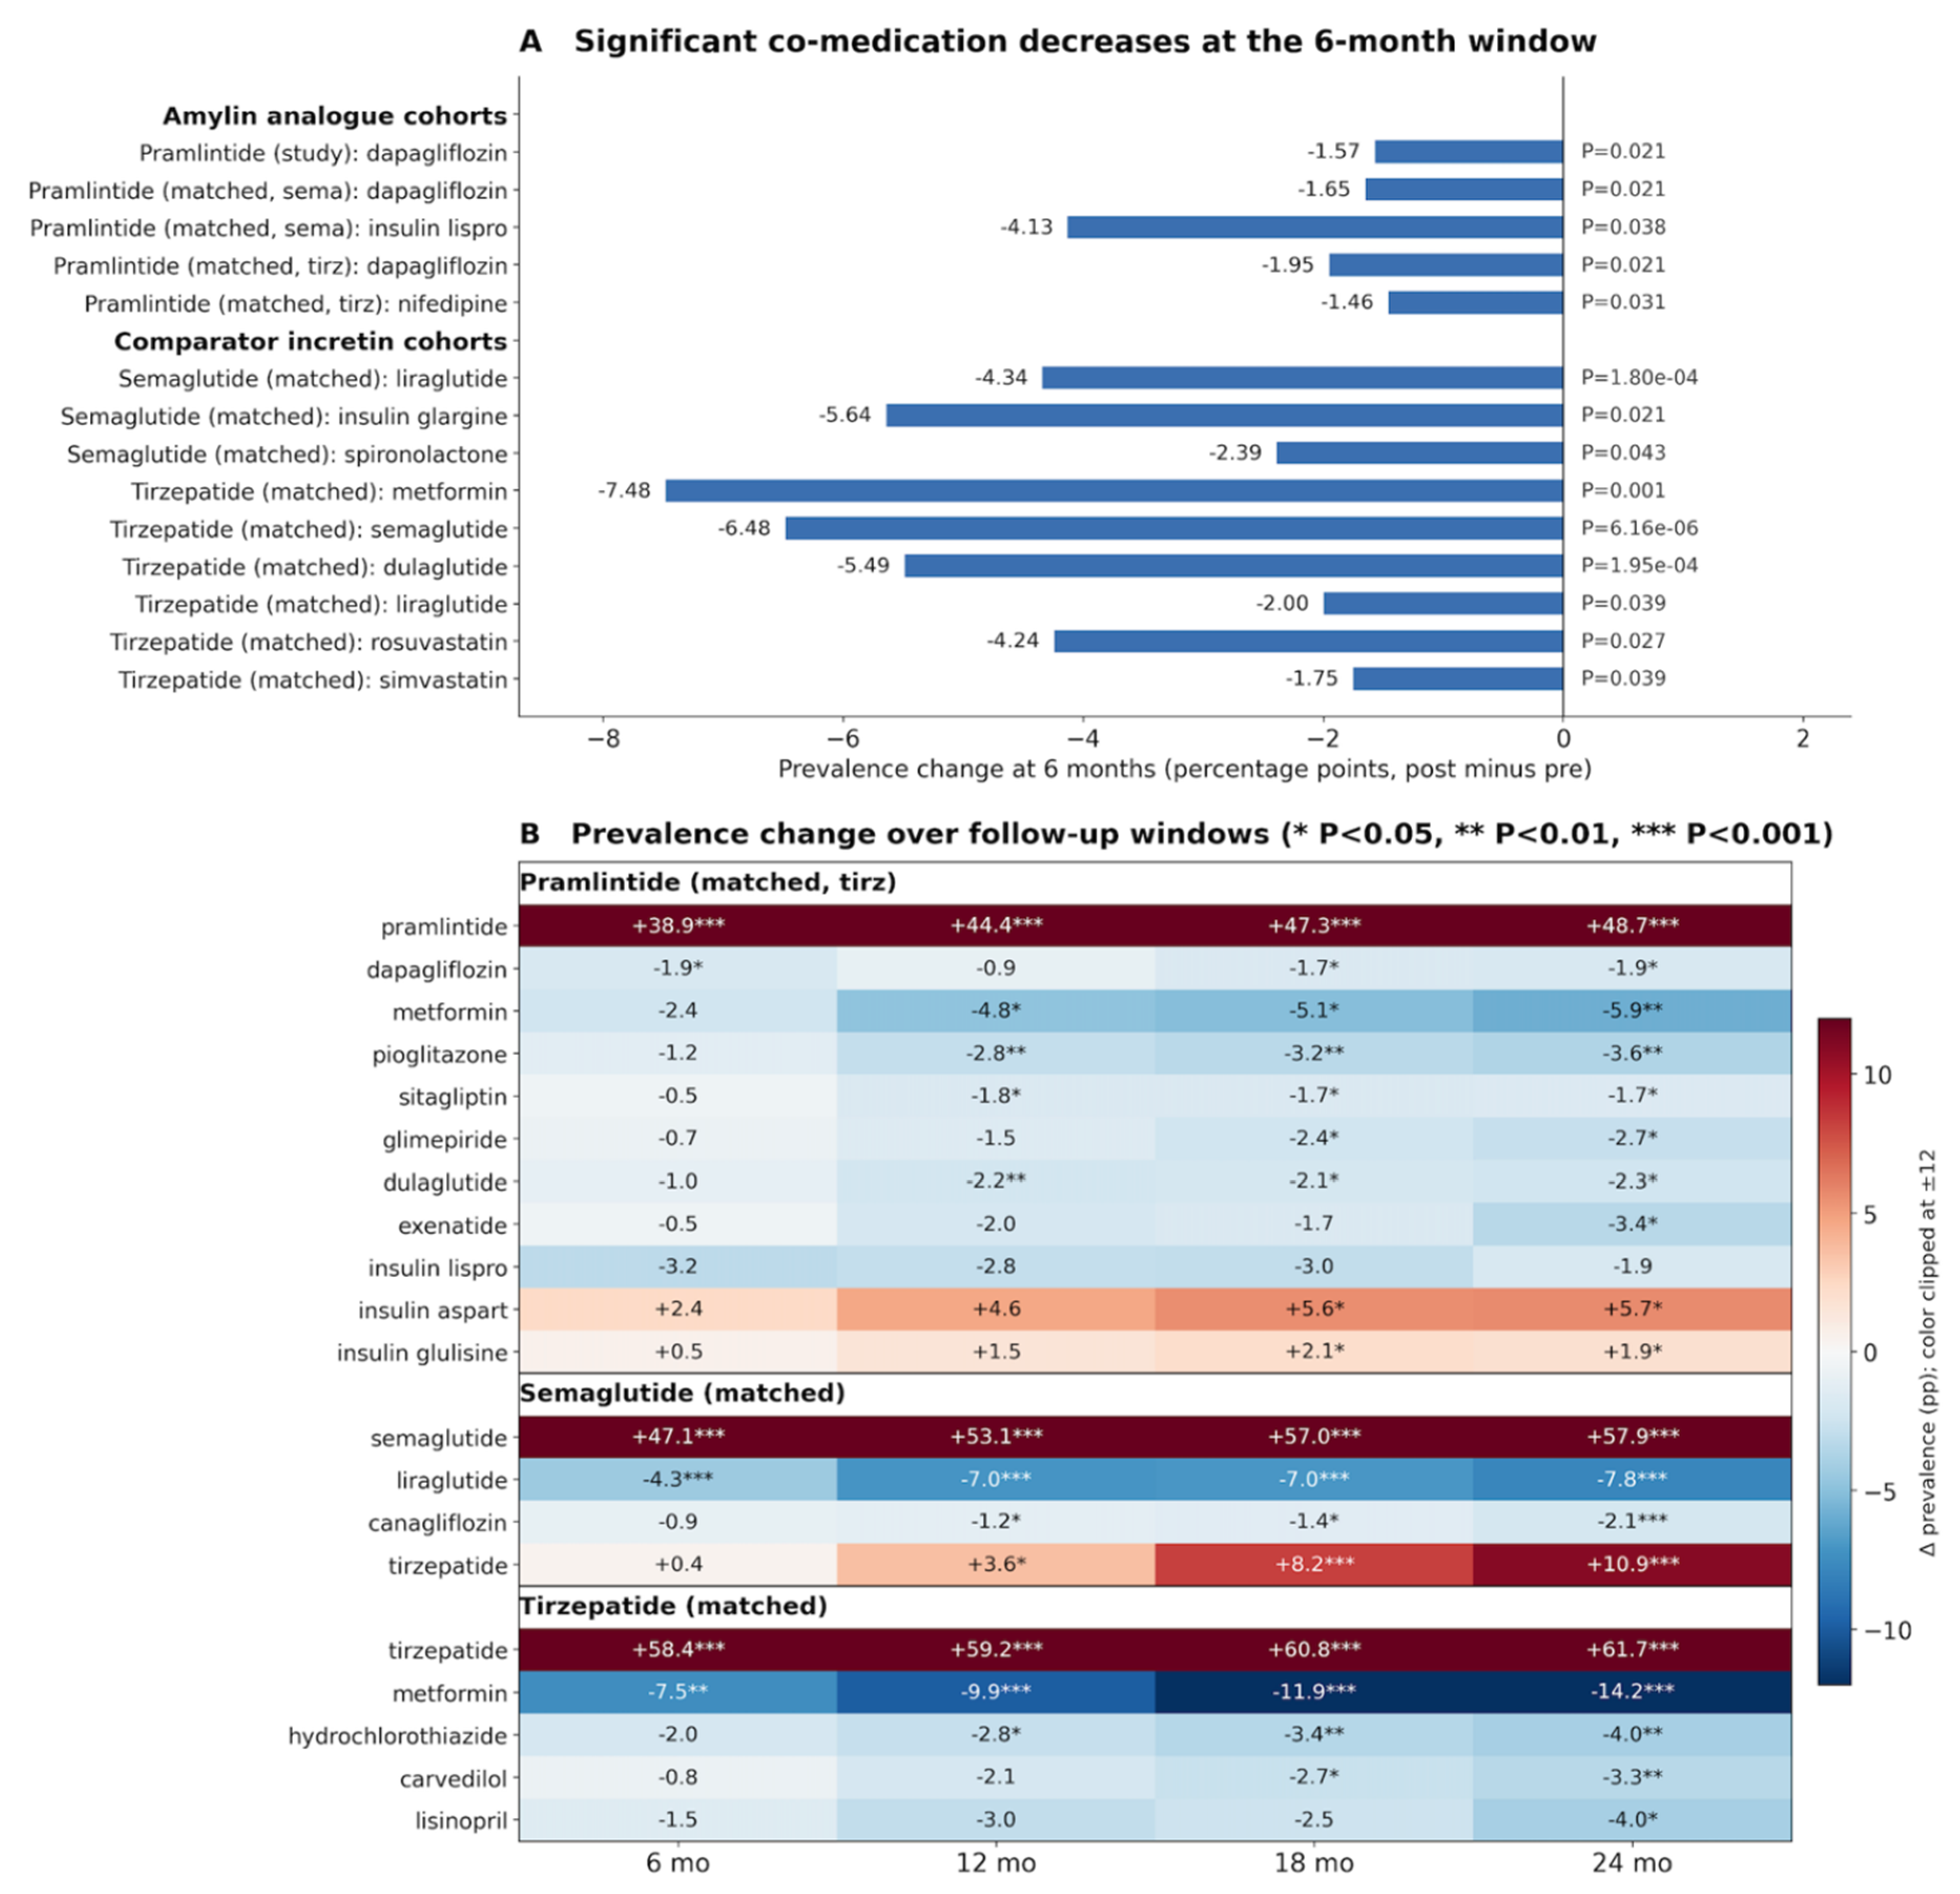
Figure 9.
Distribution of amylin receptor components and GIP receptor expression across human tissues based on single-cell transcriptomic data. a, Expression frequency of the amylin receptor components CALCR, RAMP1, RAMP2, and RAMP3, alongside GIPR and GLP1R, across human heart (298,931 cells), kidney (408,524 cells), and brain (1,728,654 cells) single-cell transcriptomic datasets obtained from CELLxGENE. Expression frequency is shown as the percentage of cells within each tissue expressing the indicated gene. Representative cell types expressing amylin receptor components are shown for each tissue. Across all three tissues, one or more amylin receptor components were expressed in a greater proportion of cells than either GIPR or GLP1R. b, Fold enrichment of amylin receptor component expression relative to GIPR (top) and GLP1R (bottom) within the same tissue. Fold enrichment was calculated as the ratio of the expression frequency of each amylin receptor component to that of the reference receptor and is displayed on a log10-scaled color scale. In kidney and brain, RAMP family members exhibited substantially higher expression frequencies than GIPR and GLP1R, whereas CALCR expression exceeded GIPR and GLP1R expression in kidney tissue. These data indicate broad tissue distribution of the molecular machinery required for amylin receptor assembly. c, Representative cell types expressing amylin receptor components, GIPR, and GLP1R across major organ systems. Cell-type annotations were derived from CELLxGENE tissue-specific single-cell datasets and are shown to illustrate the breadth of receptor-component distribution across cardiovascular, renal, neural, metabolic, and immune-associated cellular compartments. Because cell-level co-expression information was not available in the summary dataset, functional amylin receptor complexes (CALCR–RAMP heterodimers) were not directly quantified; instead, expression frequencies of the individual receptor components are shown.
Figure 9.
Distribution of amylin receptor components and GIP receptor expression across human tissues based on single-cell transcriptomic data. a, Expression frequency of the amylin receptor components CALCR, RAMP1, RAMP2, and RAMP3, alongside GIPR and GLP1R, across human heart (298,931 cells), kidney (408,524 cells), and brain (1,728,654 cells) single-cell transcriptomic datasets obtained from CELLxGENE. Expression frequency is shown as the percentage of cells within each tissue expressing the indicated gene. Representative cell types expressing amylin receptor components are shown for each tissue. Across all three tissues, one or more amylin receptor components were expressed in a greater proportion of cells than either GIPR or GLP1R. b, Fold enrichment of amylin receptor component expression relative to GIPR (top) and GLP1R (bottom) within the same tissue. Fold enrichment was calculated as the ratio of the expression frequency of each amylin receptor component to that of the reference receptor and is displayed on a log10-scaled color scale. In kidney and brain, RAMP family members exhibited substantially higher expression frequencies than GIPR and GLP1R, whereas CALCR expression exceeded GIPR and GLP1R expression in kidney tissue. These data indicate broad tissue distribution of the molecular machinery required for amylin receptor assembly. c, Representative cell types expressing amylin receptor components, GIPR, and GLP1R across major organ systems. Cell-type annotations were derived from CELLxGENE tissue-specific single-cell datasets and are shown to illustrate the breadth of receptor-component distribution across cardiovascular, renal, neural, metabolic, and immune-associated cellular compartments. Because cell-level co-expression information was not available in the summary dataset, functional amylin receptor complexes (CALCR–RAMP heterodimers) were not directly quantified; instead, expression frequencies of the individual receptor components are shown.
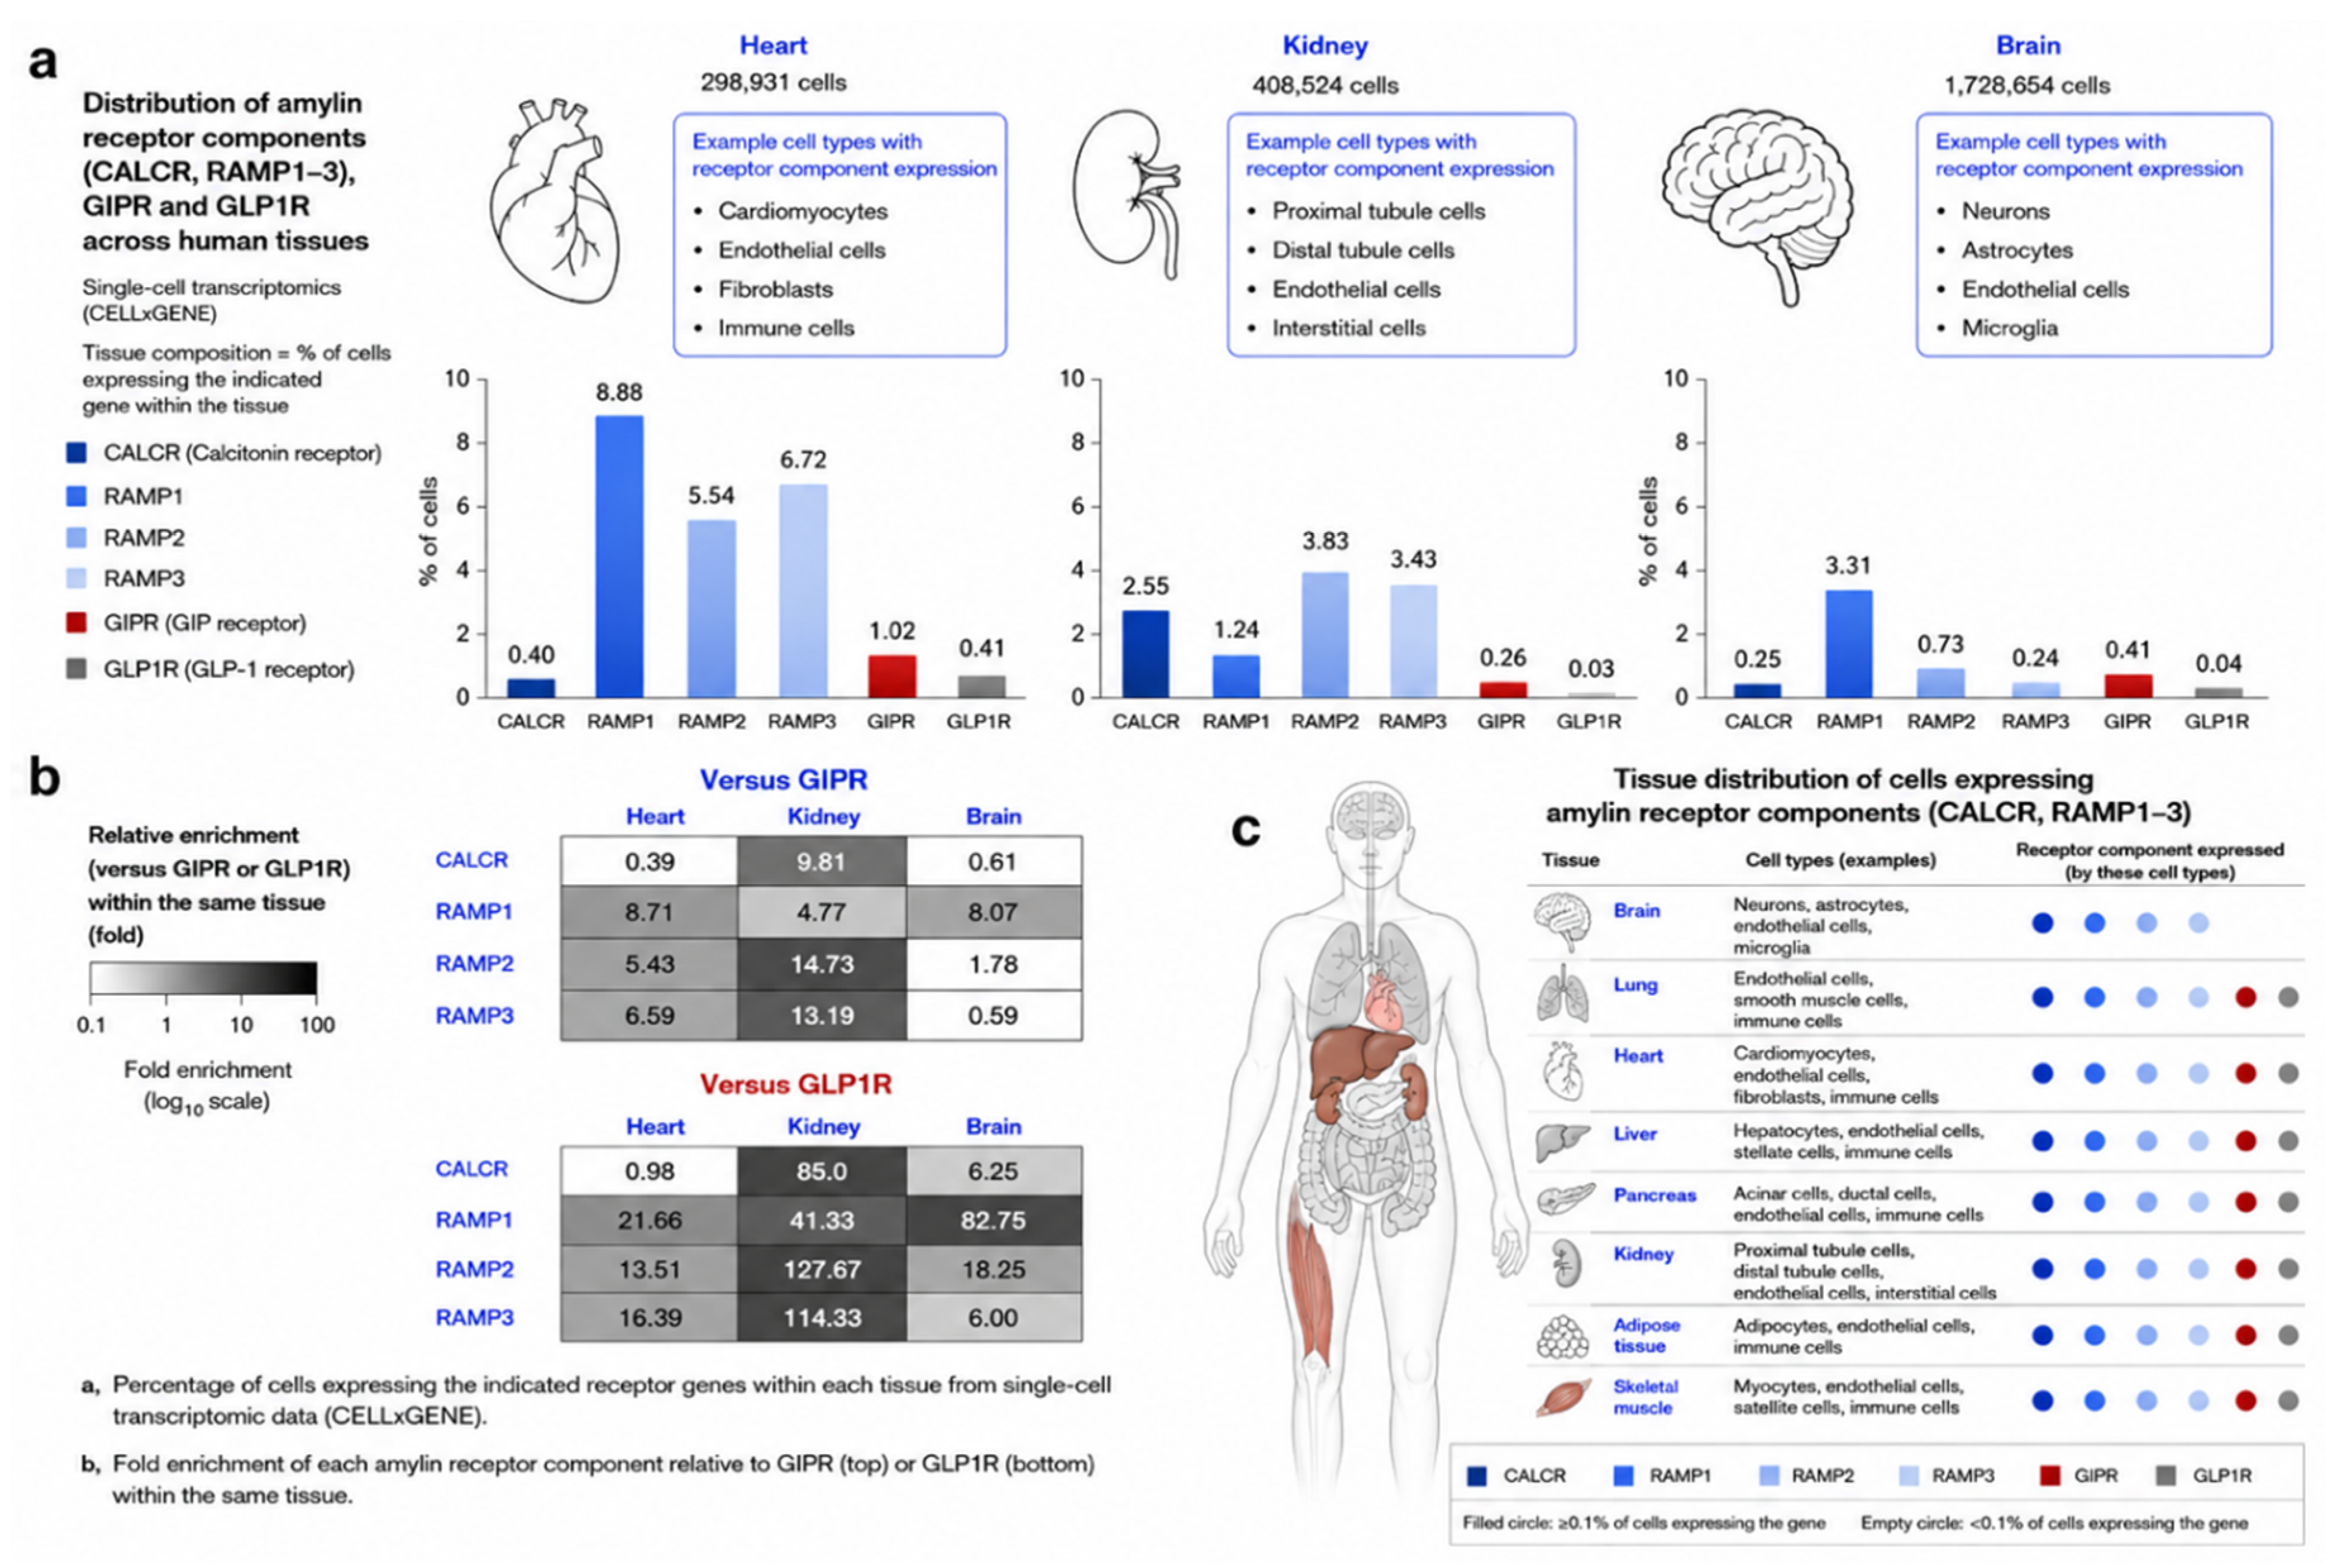

Table 1.
Baseline characteristics of the 1:5 propensity-matched CagriSema/Placebo, tirzepatide, and empagliflozin cohorts. Baseline demographic, anthropometric, laboratory, and comorbidity characteristics for the matched cohorts. Standardized mean differences (SMD) are shown for CagriSema/Placebo versus each comparator; |SMD|<0.1 indicates good balance and |SMD|<0.2 acceptable balance. BMI, body mass index; HbA1c, glycated hemoglobin; eGFR, estimated glomerular filtration rate; ASCVD, atherosclerotic cardiovascular disease; SD, standard deviation.
Table 1.
Baseline characteristics of the 1:5 propensity-matched CagriSema/Placebo, tirzepatide, and empagliflozin cohorts. Baseline demographic, anthropometric, laboratory, and comorbidity characteristics for the matched cohorts. Standardized mean differences (SMD) are shown for CagriSema/Placebo versus each comparator; |SMD|<0.1 indicates good balance and |SMD|<0.2 acceptable balance. BMI, body mass index; HbA1c, glycated hemoglobin; eGFR, estimated glomerular filtration rate; ASCVD, atherosclerotic cardiovascular disease; SD, standard deviation.
| Characteristic | CagriSema / Placebo (N=25) |
Tirzepatide (N=125) |
Empagliflozin (N=125) |
SMD vs Tirzepatide |
SMD vs Empagliflozin |
| n | 25 | 125 | 125 | ||
| Demographics | |||||
| Age, mean (SD) | 60.7 (12.9) | 60.4 (13.7) | 61.5 (10.3) | 0.02 | −0.07 |
| Female, n (%) | 13 (52.0) | 65 (52.0) | 58 (46.4) | 0.00 | 0.11 |
| Anthropometrics and laboratory | |||||
| BMI, mean (SD) | 33.0 (4.2) | 32.9 (4.0) | 32.7 (4.3) | 0.02 | 0.07 |
| HbA1c, mean (SD) | 6.5 (0.7) | 6.4 (0.9) | 6.5 (0.9) | 0.12 | 0.00 |
| eGFR, mean (SD) | 76.5 (21.0) | 75.7 (17.8) | 74.1 (21.6) | 0.04 | 0.11 |
| Weight, kg, mean (SD) | 96.3 (17.3) | 97.5 (19.5) | 96.6 (20.7) | −0.07 | −0.02 |
| Comorbidities, n (%) | |||||
| Hypertension | 13 (52.0) | 68 (54.4) | 74 (59.2) | −0.05 | −0.15 |
| Hyperlipidemia | 14 (56.0) | 67 (53.6) | 75 (60.0) | 0.05 | −0.08 |
| ASCVD | <11 | 56 (44.8) | 62 (49.6) | −0.10 | −0.19 |
| Atrial fibrillation | <11 | 15 (12.0) | 27 (21.6) | 0.12 | −0.14 |
| Diabetes complications | <11 | 11 (8.8) | 11 (8.8) | 0.10 | 0.10 |
| Chronic kidney disease | <11 | 20 (16.0) | 21 (16.8) | 0.00 | −0.02 |
| Obstructive sleep apnea | <11 | 38 (30.4) | 47 (37.6) | 0.03 | −0.12 |
Table 2.
Baseline characteristics of the 1:1 propensity-matched pramlintide and tirzepatide cohorts. Baseline demographic, anthropometric, laboratory, and comorbidity characteristics for the matched type 2 diabetes cohorts (basal-insulin background). Standardized mean differences (SMD) index covariate balance; all |SMD|<0.1, indicating good balance across covariates. Abbreviations as in Table 1.
Table 2.
Baseline characteristics of the 1:1 propensity-matched pramlintide and tirzepatide cohorts. Baseline demographic, anthropometric, laboratory, and comorbidity characteristics for the matched type 2 diabetes cohorts (basal-insulin background). Standardized mean differences (SMD) index covariate balance; all |SMD|<0.1, indicating good balance across covariates. Abbreviations as in Table 1.
| Pramlintide vs. Tirzepatide | Pramlintide vs. Semaglutide | |||||
| Characteristic |
Pramlintide (N=652) |
Tirzepatide (N=652) |
SMD | Pramlintide (N=761) | Semaglutide (N=761) | SMD |
| n | 652 | 652 | ||||
| Demographics | ||||||
| Age, mean (SD) | 55.1 (12.7) | 55.3 (12.4) | -0.017 | 54.7 (12.7) | 54.6 (13.4) | 0.013 |
| Female, n (%) | 404 (62.0) | 414 (63.5) | -0.032 | 458 (60.2) | 471 (61.9) | -0.035 |
| Anthropometrics and laboratory | ||||||
| BMI, mean (SD) | 32.2 (5.1) | 32.5 (4.7) | -0.044 | 32.2 (5.2) | 32.1 (5.0) | 0.015 |
| HbA1c, mean (SD) | 8.2 (1.6) | 8.1 (1.7) | 0.062 | 8.1 (1.6) | 8.2 (1.6) | -0.032 |
| eGFR, mean (SD) | 80.6 (25.0) | 81.6 (24.2) | -0.039 | 80.5 (25.0) | 82.3 (26.0) | -0.071 |
| Weight kg, mean (SD) | 104.3 (25.2) | 103.7 (24.6) | 0.023 | 104.6 (25.4) | 104.3 (25.6) | 0.013 |
| Comorbidities, n (%) | ||||||
| Hypertension, n (%) | 288 (44.2) | 286 (43.9) | 0.006 | 304 (39.9) | 285 (37.5) | 0.051 |
| Hyperlipidemia, n (%) | 298 (45.7) | 289 (44.3) | 0.028 | 320 (42.0) | 300 (39.4) | 0.054 |
| ASCVD, n (%) | 127 (19.5) | 119 (18.3) | 0.031 | 137 (18.0) | 130 (17.1) | 0.024 |
| Heart failure, n (%) | 46 (7.1) | 46 (7.1) | 0.000 | 53 (7.0) | 43 (5.7) | 0.054 |
| Chronic kidney disease, n (%) | 69 (10.6) | 59 (9.0) | 0.052 | 74 (9.7) | 72 (9.5) | 0.009 |
| End stage renal disease, n (%) | <11 | <11 | -0.043 | <11 | 12 (1.6) | -0.046 |
| NAFLD/MASH | 34 (5.2) | 37 (5.7) | -0.020 | 36 (4.7) | 46 (6.0) | -0.058 |
| Thyroid cancer, n (%) | <11 | <11 | 0.021 | <11 | <11 | 0.016 |
| Pancreatic cancer, n (%) | <11 | <11 | -0.078 | <11 | <11 | 0.051 |
| Depression, n (%) | 55 (8.4) | 50 (7.7) | 0.028 | 56 (7.4) | 58 (7.6) | -0.010 |
| Anxiety, n (%) | 84 (12.9) | 89 (13.7) | -0.023 | 88 (11.6) | 99 (13.0) | -0.044 |
| Eating disorder, n (%) | <11 | <11 | 0.093 | <11 | <11 | 0.047 |
| Alcohol use, n (%) | <11 | <11 | 0.035 | <11 | <11 | -0.014 |
| Tobacco use, n (%) | 28 (4.3) | 35 (5.4) | -0.050 | 29 (3.8) | 32 (4.2) | -0.020 |
| Obstructive sleep apnea, n (%) | 96 (14.7) | 88 (13.5) | 0.035 | 100 (13.1) | 100 (13.1) | 0.000 |
Table 3.
Six-month medication-transition sensitivity summary for cardiometabolic co-intervention assessment. Medication prevalence changes are shown as post-index minus pre-index prevalence in percentage points. Rows summarize selected significant medication transitions relevant to renal, blood pressure, glycemic, lipid, and index-drug interpretation. P values are two-sided exact McNemar tests without correction across all medication concepts tested. This table is intended to evaluate whether observed blood pressure or renal biomarker findings could be explained by differential post-index co-medication changes. Medication dose, indication, discontinuation reason, and biomarker-driven medication changes were not adjudicated. The exhaustive medication-transition results across all cohorts and time windows are provided in Table S3.
Table 3.
Six-month medication-transition sensitivity summary for cardiometabolic co-intervention assessment. Medication prevalence changes are shown as post-index minus pre-index prevalence in percentage points. Rows summarize selected significant medication transitions relevant to renal, blood pressure, glycemic, lipid, and index-drug interpretation. P values are two-sided exact McNemar tests without correction across all medication concepts tested. This table is intended to evaluate whether observed blood pressure or renal biomarker findings could be explained by differential post-index co-medication changes. Medication dose, indication, discontinuation reason, and biomarker-driven medication changes were not adjudicated. The exhaustive medication-transition results across all cohorts and time windows are provided in Table S3.
| Cohort | Index-drug or index-label signal at 6 months | Significant cardiorenal or metabolic co-medication changes at 6 months | Co-intervention interpretation |
| CagriSema/Placebo | Cagrilintide/semaglutide +66.67 pp, P<0.001 | No significant chronic antihypertensive, SGLT2 inhibitor, glucose-lowering, lipid, or cardiorenal co-medication increase or decrease detected. | Captures the masked CagriSema-associated EHR label without evidence of chronic cardiorenal co-medication intensification. |
| Pramlintide study cohort | Pramlintide +37.84 pp, P<0.001 | Dapagliflozin -1.57 pp, P=0.021; insulin lispro -4.51 pp, P=0.018; ezetimibe -2.35 pp, P=0.043. | Pramlintide initiation was accompanied by SGLT2 inhibitor, rapid-acting insulin, and lipid-agent prevalence decreases rather than compensatory cardiorenal intensification. |
| Pramlintide matched to semaglutide | Pramlintide +38.64 pp, P<0.001 | Dapagliflozin -1.65 pp, P=0.021; insulin lispro -4.13 pp, P=0.038. | Replicates the dapagliflozin decrease in a semaglutide-matched context, arguing against SGLT2 inhibitor initiation as an explanation for renal biomarker patterns. |
| Pramlintide matched to tirzepatide | Pramlintide +38.93 pp, P<0.001 | Dapagliflozin -1.95 pp, P=0.021; nifedipine -1.46 pp, P=0.031. | Most directly supports the amylin-pathway co-intervention argument: renal-relevant SGLT2 inhibitor and antihypertensive medication prevalence decreased rather than increased. |
| Semaglutide matched to pramlintide | Semaglutide +47.07 pp, P<0.001 | Liraglutide -4.34 pp, P<0.001; insulin glargine -5.64 pp, P=0.021; spironolactone -2.39 pp, P=0.043. | Shows expected switching away from prior GLP-1 receptor agonism and basal insulin, with modest decrease in spironolactone rather than cardiorenal medication intensification. |
| Tirzepatide matched to pramlintide | Tirzepatide +58.35 pp, P<0.001 | Metformin -7.48 pp, P=0.001; semaglutide -6.48 pp, P<0.001; dulaglutide -5.49 pp, P<0.001; liraglutide -2.00 pp, P=0.039; rosuvastatin -4.24 pp, P=0.027; simvastatin -1.75 pp, P=0.039. | Dominated by expected switching away from prior metabolic and incretin therapies after tirzepatide initiation. |
Disclaimer/Publisher’s Note: The statements, opinions and data contained in all publications are solely those of the individual author(s) and contributor(s) and not of MDPI and/or the editor(s). MDPI and/or the editor(s) disclaim responsibility for any injury to people or property resulting from any ideas, methods, instructions or products referred to in the content. |
© 2026 by the authors. Licensee MDPI, Basel, Switzerland. This article is an open access article distributed under the terms and conditions of the Creative Commons Attribution (CC BY) license (http://creativecommons.org/licenses/by/4.0/).
Copyright: This open access article is published under a Creative Commons CC BY 4.0 license, which permit the free download, distribution, and reuse, provided that the author and preprint are cited in any reuse.