

Submitted:
02 September 2026
Posted:
03 September 2026
You are already at the latest version
Abstract
Access to home-based smart charging may be unequal because smart capability becomes relevant only after households can obtain domestic charging infrastructure. This study examines where the disparity associated with private off-street parking arises across these two nested access stages. We used England’s 2024 National Travel Survey, the first NTS wave to observe both infrastructure stages within the same vehicle-questionnaire route. Stage 1 included all 478 eligible plug-in vehicle records with complete data; 342 records with domestic access and substantive smart-status data formed Stage 2. Survey-weighted logistic models, marginal standardization, and bootstrap inference clustered at the primary sampling unit were used to estimate and decompose the adjusted joint contrast. Private off-street parking was associated with a 41.1-percentage-point higher probability of reported smartcapable domestic charging access (95% confidence interval 27.5–51.8). Of this contrast, 40.6 points were allocated to domestic chargepoint access and 0.5 points to conditional smart status; the latter was imprecisely estimated and does not establish equivalence. The findings indicate that the observed parking disparity arises mainly before smart capability becomes relevant. Policies that expand smart functionality among existing home chargers may therefore leave the underlying domestic-access barrier unresolved. The NTS observes infrastructure states, not actual smart-charging behavior or electricity-system effects.
Keywords:
electric vehicles
; smart charging
; domestic chargepoint
; home charging
; off-street parking
; charging accessibility
; sustainable mobility
; National Travel Survey
; England
1. Introduction
Owning a plug-in vehicle does not automatically make home charging straightforward. For many households, the practical question is surprisingly ordinary: where does the vehicle spend the night, and can that parking space support a chargepoint? Residential charging matters because vehicles often remain parked at home for long periods, which makes routine charging convenient and creates the physical opportunity for some forms of managed or smart charging [1,2,3]. Yet that opportunity is uneven. Parking arrangements, tenure, dwelling form, electrical capacity, and the built environment can determine whether a household can turn the home into a reliable charging location [4,5,6].
This access problem has become more visible as electric mobility moves beyond early adopters. Private and nearby charging opportunities are associated with electric vehicle (EV) uptake [7,8]; renters and households with inadequate parking face greater home-charging barriers [6]; and users without convenient home charging often adapt by combining public, workplace, destination, or kerbside options [9,10,11]. A growing equity literature therefore argues that charger counts alone do not describe practical access: housing, competition for infrastructure, affordability, and institutional constraints can create a broader charging disadvantage [12,13,14,15,16,17]. In a sustainable urban-mobility context, this is an accessibility problem as much as an infrastructure-supply problem. Recent urban-accessibility research has likewise treated proximity and realistic reachability as measurable features of opportunity rather than simply the presence of facilities [18].
Smart charging adds a second gate. A user first needs compatible charging infrastructure; only then does smart functionality become relevant. That distinction is easy to blur. Smart-capable equipment does not by itself demonstrate tariff enrollment, automated control, load shifting, or participation in a flexibility program. Behavioral research shows that smart-charging engagement also depends on perceived control, trust, incentives, convenience, guaranteed mobility, and the opportunity to charge at home [19,20,21,22,23]. Recent reviews likewise emphasize that observed charging behavior reflects interacting user, vehicle, trip, price, infrastructure, and system conditions [24]. Thus, the pathway to smart charging has an infrastructure-access stage that precedes the behavioral and power-system questions usually studied in smart-charging research.
The United Kingdom (UK) provides an informative setting in which to separate these stages. The Electric Vehicles (Smart Charge Points) Regulations 2021 introduced smart-functionality requirements for covered private chargepoints, while the national Smart Charging Action Plan places managed EV charging within the country’s flexibility strategy [25,26,27]. At the same time, national infrastructure policy explicitly recognizes that households without off-street parking require credible alternatives, including public, on-street, communal, and cross-pavement solutions [28,29,30,31]. These policy streams address related but different questions: whether a viable residential charging pathway exists, and what capabilities the equipment has once it exists.
The 2024 National Travel Survey (NTS) makes those two states observable in the same branching vehicle questionnaire for the first time in the NTS series. Earlier English NTS research modeled battery electric vehicle (BEV) ownership and identified residential parking as one of the relevant adoption correlates, which helps distinguish the upstream adoption question from the post-adoption infrastructure state studied here [32]. The domestic-chargepoint item (DomCha) is followed, when a household domestic chargepoint is reported, by a smart-status item (DCSma); when no such chargepoint is reported, respondents instead describe alternative charging arrangements [33,34]. Household characteristics, the W3 survey weight, and primary sampling unit (PSU) identifiers permit adjusted, survey-weighted estimation with cluster-aware uncertainty. The Department for Transport (DfT) has already published national descriptive reporting for domestic charging-device ownership [35], and an earlier UK government survey examined off-street parking, dedicated home chargepoints, smart functionality, and smart-charging attitudes [36]. The empirical gap is therefore narrower than “home charging has not been studied.” The unanswered question is how a residential parking disparity carries through the nested domestic-access and smart-status gates when both are modeled jointly in a national post-adoption sample.
To examine this question, we use a two-stage weighted Logit framework for plug-in vehicle records in England’s 2024 NTS. The Stage-1 sample size of 478 was not chosen to meet a target: it comprises all records that entered the substantive charging-question universe and satisfied the prespecified complete-case rules. The 342 Stage-2 records arise from questionnaire routing to domestic access and a substantive smart-status response. The fitted stages are combined into a standardized probability of reaching the reported domestic-and-smart state, and the adjusted off-street-parking contrast is then divided into two algebraically defined components. This approach shows where the observed contrast is concentrated while keeping the domestic-access and conditional-smart stages conceptually distinct.
The study contributes a national post-adoption estimate of the joint infrastructure state, an exact symmetric probability-scale decomposition of its parking contrast, and a set of prespecified sensitivity analyses. These include a direct joint-outcome model, extreme assignments for unknown smart status, stricter parking coding, a single-eligible-vehicle-household restriction, and an urban-only analysis. Figure 1 summarizes the logic; its arrows represent questionnaire routing and statistical conditioning, not temporal or causal transitions.
RQ1. Among plug-in vehicle records in the 2024 NTS charging-question universe, how large is the adjusted difference in reported smart-capable domestic charging access between records with and without private off-street parking?
RQ2. How is that adjusted joint contrast distributed between the domestic-access component and the smart-status component conditional on domestic access?
These questions define a study of reported infrastructure access. Effects of assigning parking or installing a chargepoint, as well as charging behavior and grid services, remain outside its scope.
2. Literature Review and Conceptual Framework
2.1. Residential Charging as an Access Problem
Home charging has long been recognized as an enabling part of EV ownership, but not as a universal feature of it. Early studies showed that residential charging potential depends strongly on parking location and the ability to connect a vehicle at home [2,3]. Residential parking conditions also shape stated purchase preferences [4], while revealed-preference evidence finds that both private and nearby public charging are associated with the propensity to buy a chargeable car, with private charging showing the larger relationship [8]. Recent household evidence goes further by quantifying how rental status, inadequate parking, and electrical upgrades can raise home-charging barriers and constrain battery-electric-vehicle adoption [6].
Once an EV is already present, charging becomes a routine embedded in daily activity. Commuter and user studies show mixed use of home, workplace, public, destination, and fast charging rather than a single universal pattern, while recent nationwide evidence also links charging-location needs to household, garage, urbanization, and current charging behavior [9,10,37]. In urban stated-choice work, users trade off charging cost, time, comfort, and location when choosing among private and public options near home, work, or other destinations [38,39]. These findings matter for the present study because the absence of a domestic chargepoint does not mean the absence of charging; it changes the set of pathways through which charging is obtained.
Housing conditions can make those pathways markedly unequal. Multifamily properties may involve assigned parking, landlord or co-owner permission, electrical upgrades, cost-sharing rules, and coordination among multiple actors [5]. Qualitative work with renters and multi-unit residents documents the additional planning and behavioral adaptation required when home charging is limited [11]. The resulting disadvantage is not reducible to distance from the nearest public charger.
2.2. Accessibility, Equity, and Sustainable Urban Mobility
Charging accessibility has increasingly been studied as an equity problem. Research in California identified disparities in public charger access by race and income [12]; national and spatial studies have linked station distributions to socioeconomic and environmental characteristics [15]; and analytical accessibility frameworks demonstrate that competition, housing, and sociodemographic composition can alter who effectively benefits from public infrastructure [14,17]. Reviews synthesize these findings into a broader concern that an apparently expanding network can still exclude groups through physical, institutional, or economic barriers [13,16].
The sustainable urban-mobility literature provides a useful conceptual parallel. Accessibility studies show that the value of urban infrastructure depends not only on how much is supplied but on whether people can reach relevant opportunities under realistic spatial and temporal constraints [18]. Related EV research has emphasized both the breadth of charging technologies [40] and the importance of planning residential charging within urban systems [41]. Much of that literature asks how to size, allocate, or operate charging capacity. Our question is complementary: before residential charging can be optimized, which plug-in vehicle records report access to the domestic branch of that infrastructure at all?
This distinction also separates the present analysis from dense-city deployment models. For example, Wang et al. optimize charging-facility deployment in residential carparks under demand uncertainty and grid dynamics [42], while broader infrastructure reviews compare planning models and network requirements [43,44]. Such work is essential for deciding where and how much infrastructure to provide; the NTS instead allows us to observe an access state already realized by households.
2.3. From Smart Capability to Smart-Charging Behavior
A smart chargepoint can enable flexible charging, but actual smart charging is a behavioral and operational outcome. Acceptance studies show that users care about control, mobility guarantees, incentives, and perceived system benefits [19,20,21]. More recent stated-preference evidence confirms that guaranteed driving range, flexibility, price, and incentives influence willingness to adopt smart charging [22]. De Graaf et al. identify home-charging opportunity as a particularly important condition for smart-charging intention [23]. At the operational end of the literature, charging-choice and behavior models link user decisions to smart-charging services and system outcomes [24,38].
The NTS measures something earlier in this chain. It records whether a domestic chargepoint is reported and, conditionally, whether that chargepoint is described as smart. It does not observe enrollment in a smart tariff, delegated charging control, charger schedules, kWh delivered, or grid services. We therefore use the term reported smart-capable domestic access for the joint infrastructure state. The term describes a prerequisite for some forms of home-based smart charging, not participation itself.
2.4. Research Gap and Nested Access Framework
Table 1 places the study against the evidence closest to its outcome. The literature already establishes that parking matters, that charging disadvantage exists, and that smart-charging participation is behaviorally heterogeneous. The contribution here is more specific: jointly standardizing the two NTS infrastructure stages and locating the adjusted residential-parking contrast between them.
To our knowledge, searches updated through August 2026 identified no peer-reviewed national post-adoption study that examined reported domestic chargepoint access and conditional smart status within a common empirical framework. The analysis addresses this narrower gap by standardizing the joint probability and decomposing the adjusted parking contrast on the probability scale. Its novelty lies in that outcome and design, not in treating residential charging inequality, accessibility, or smart charging as previously unstudied.
Private off-street parking and the same prespecified household covariates enter both stages, after which the fitted probabilities are combined through the conditional-probability identity shown in Figure 1.
3. Materials and Methods
3.1. Data Source and Study Population
We used End User Licence (EUL) microdata from the National Travel Survey, 2002–2024, 19th Edition, distributed by the UK Data Service, and restricted the files to survey year 2024 [45]. DfT documentation records that the domestic EV charging questions were added to the Vehicle questionnaire in 2024 [33,34]; accordingly, the analytical unit is the vehicle record.
The 2024 Vehicle file contained 11,365 records. The substantive domestic-chargepoint universe was defined as DomCha_B01ID=1 (Yes) or 2 (No), yielding 480 records: 353 Yes and 127 No. The Stage-1 complete-case model retained 478 records after one non-substantive parking response and one non-substantive tenure response were excluded. These records represented 449 households and 349 PSUs. Stage 2 was restricted to Stage-1-compatible records with reported domestic access and substantive smart status, yielding 342 records (256 smart and 86 non-smart) across 263 PSUs. Nine Stage-1 records with domestic access had non-substantive smart status and were retained as unknown for analyses that did not require the Stage-2 outcome. Because DomCha and DCSma are routed through the NTS Vehicle questionnaire, the analytical unit follows the eligible vehicle record rather than redefining the outcome at household level. Some households contributed more than one eligible plug-in record; a prespecified sensitivity restricted the analysis to households contributing a single eligible vehicle record. No analytical household spanned more than one observed PSU, so PSU-level clustering retained all eligible records from the same household within a common dependence cluster.
The target population is explicitly post-adoption: plug-in vehicle records that entered the 2024 charging-question universe and satisfied the complete-case rules. The estimands are therefore conditional on a plug-in vehicle already being observed and should not be generalized to all households in England.
3.2. Variables and Notation
Stage 1 modeled reported domestic chargepoint access, when DomCha_B01ID=1 and when DomCha_B01ID=2. In the NTS, DomCha asks whether the household owns a dedicated domestic chargepoint for its own personal use; a private arrangement to share a neighboring household’s domestic chargepoint is explicitly recorded as No [34]. Throughout the paper, domestic access is shorthand for this NTS-defined household chargepoint state; it does not include access to a neighboring household’s charger, a communal charger, or a public charger. Stage 2 modeled reported smart status among records with domestic access, for DCSma_B01ID=1 and for DCSma_B01ID=2. Other smart-status codes were treated as unknown, never as non-smart.
The principal exposure was private off-street overnight parking. VehParkLoc_B01ID codes 1–2 (garage or other private-property parking) were coded ; substantive codes 3–5 were coded . The frozen adjustment vector contained household income quintile (1–5, ordinal), urban residence, owner/buyer tenure, household vehicle count, and household size. W3 is the household interview-sample weight linked to the vehicle record, and denotes the PSU containing record i.
Table 2 summarizes the notation used throughout the two-stage framework.
The analysis applies W3, the NTS interview-sample weight linked to the household and vehicle record, in model fitting and standardization. Coefficient uncertainty uses a sandwich covariance matrix clustered by the NTS primary sampling unit identifier (PSUID) to allow within-PSU score dependence, following standard cluster-robust inference logic [46]; derived joint quantities are additionally evaluated with PSU-level bootstrap resampling. The complete original NTS stratification structure was not reconstructed from the public EUL. Accordingly, the reported standard errors and confidence intervals are not presented as reproductions of official DfT design-based estimates. They support weighted adjusted-association inference within the defined post-adoption charging-question universe.
3.3. Pre-Execution Specification of the Revised Estimand
The domestic-access model and an earlier secondary smart-status model existed before the revised joint question was developed. To preserve that historical boundary, the six-covariate Stage-2 model, the joint estimand, the decomposition, the cluster bootstrap, missing-status stress tests, direct joint-outcome model, strict-parking sensitivity, single-eligible-vehicle-household sensitivity, urban-only sensitivity, and support gates were recorded in a dated pre-execution analysis amendment before the new joint estimand was executed. The dated amendment and its integrity record are retained by the corresponding author and are available upon reasonable request. This document is an analysis amendment, not an original preregistration.
A planned parking-by-tenure profile analysis was dropped before the new primary results were released because its prespecified support gate failed: one Stage-2 parking/tenure cell contained only one observation. No parking-by-tenure interaction was fitted.
3.4. Weighted Logit Estimation
Let and let denote the logistic distribution function. The two model stages are given in Equations (1) and ():
The first equation is fitted to the Stage-1 sample. The second is fitted only to records with and substantive . Both stages contain the same six predictors; no predictor was selected or removed according to its p-value.
For stage , parameters are obtained by maximizing the W3-weighted binomial log-likelihood in Equation (3):
where . The corresponding odds ratio for a coefficient is .
To allow score dependence within PSUs, coefficient uncertainty uses the cluster-sandwich form in Equation (4):
where is the PSU-level score, is the weighted observed information matrix, and the implementation uses the finite-sample factor . Model convergence, finite fitted probabilities, matrix rank, and separation were checked before the joint estimand was calculated. Both design matrices were full rank (7/7), no complete separation was detected, and all fitted coefficients and cluster-robust covariance elements were finite. Stage 2 nevertheless had limited support in the non-off-street group: only 15 records remained, comprising 11 smart and 4 non-smart outcomes. These diagnostics establish estimability, not high precision; uncertainty in the conditional-smart parking contrast is therefore carried forward explicitly.
3.5. Marginal Standardization and the Joint Access Estimand
The regression coefficients answer conditional questions, whereas the substantive target is a probability contrast averaged over the observed post-adoption population. We therefore used marginal standardization rather than prediction at a single “average” covariate profile [47]. For every Stage-1 target record, covariates remained at their observed values while parking was set in turn to and , as shown in Equations (5) and ():
Because Stage 2 is fitted among records with domestic access but standardized over the Stage-1 target population, applying the conditional model to that target distribution requires adequate overlap in the included covariates and correct specification of the conditional smart-status model. A prespecified support audit found no structural lack of covariate overlap; detailed diagnostics are reported in the Supplementary Material. These checks support model-based standardization but do not turn the resulting contrasts into causal effects.
Because B is defined conditionally on , the chain rule gives Equation (7):
Accordingly, the record-specific model probability of reaching the joint reported domestic-and-smart state is defined in Equation (8):
The Stage-1 population-standardized probability is defined in Equation (9):
Because the joint probability is averaged after multiplying the two record-specific stage probabilities, need not equal the product of the separately averaged and quantities. The primary estimand is defined in Equation (10):
This is the adjusted difference in model-based joint probability when the parking indicator is standardized to private off-street versus non-off-street parking. It is not the causal effect of providing parking.
3.6. Exact Symmetric Probability-Scale Decomposition
The product structure allows the total contrast to be decomposed without choosing an arbitrary ordering of the two stages. For each record, let , , , and . The difference in products satisfies the identity in Equations (11) and (12):
Taking the W3-weighted mean over the Stage-1 target population gives Equation (13):
with the components defined in Equations (14) and ():
is the domestic-access component and is the conditional-smart component. The equality is algebraic; the terms are not mediated or indirect causal effects.
3.7. Cluster Bootstrap and Sensitivity Analyses
Uncertainty for , , , , and was estimated by resampling PSUs with replacement so that all records from a sampled PSU moved together. Cluster-resampling methods are designed for settings in which observations within groups may be dependent [48]. Because households were nested within the observed PSUs, this resampling also kept records from the same household together. In each of 2,000 prespecified replicates, we: (1) sampled PSUs with replacement; (2) refitted both weighted Logit stages; (3) predicted over the fixed Stage-1 target covariate distribution; (4) recomputed ; and (5) checked the decomposition identity and finite probabilities. All 2,000 replicates passed the validity criteria. Percentile 95% CIs are reported.
The primary sensitivity set was specified before execution of the revised joint estimand. A direct weighted Logit modeled the observed joint binary state; unknown smart-status records were also assigned deterministically to all non-smart and all smart as extreme stress tests. The sequential analysis was repeated with the earlier four-covariate Stage-2 specification, a stricter parking definition, households contributing exactly one eligible plug-in vehicle, and urban records only. The single-eligible-vehicle restriction was included specifically to assess whether the main contrast changed materially when each contributing household supplied only one eligible vehicle record. The earlier three-state multinomial model was retained as a historical comparison rather than as the primary estimand.
Two additional pre-submission robustness checks were defined before their new results were calculated. A functional-form sensitivity replaced the linear income term with five quintile indicators and grouped household vehicle count as 1, 2, or 3 or more and household size as 1, 2, 3, or 4 or more; all other definitions were unchanged. A paired bootstrap sensitivity then recomputed each primary replicate over the Stage-1 records appearing in that PSU resample, rather than over the fixed original target, to assess whether target-distribution uncertainty materially changed the percentile interval. These later checks did not replace the frozen primary specification.
3.8. Software and Reproducibility
The frozen primary analysis was implemented in Python 3.13.5. The two additional pre-submission robustness checks were implemented in Python 3.12.13. Both environments used pandas 2.2.3, NumPy 2.3.5, SciPy 1.17.0, and statsmodels 0.14.6. A separately implemented raw-data reconstruction reproduced the two weighted Logit models, the joint contrast, and the decomposition to numerical precision. Licensed row-level NTS data are not redistributed. The analytical code, dated specifications, and aggregate verification outputs are retained by the corresponding author and are available upon reasonable request.
4. Results
4.1. Analytical Samples and the Observed Nested States
The Stage-1 complete-case sample contained 478 plug-in vehicle records: 351 with and 127 without reported domestic chargepoint access. Private off-street parking accounted for 423 records (86.0% weighted), and owner/buyer tenure for 441 records (90.4% weighted). Stage 2 contained 342 records with substantive smart status: 256 smart and 86 non-smart. Of these, 327 had off-street parking and 15 did not. The small non-off-street Stage-2 group is the main precision limitation for the conditional-smart component.
Table 3 summarizes the analytical support. The urban-only sensitivity retained 355 Stage-1 and 247 Stage-2 records, with both outcomes represented at each stage.
Before adjustment, the nested state composition already differed sharply by parking (Figure 2). Among records without private off-street parking, the W3-weighted share with no domestic chargepoint was 77.8%; among off-street records it was 21.9%. The corresponding weighted shares reporting a domestic smart chargepoint were 16.8% and 58.0%. These are descriptive percentages only; the adjusted estimand is reported below.
4.2. Stage-Specific Associations
Stage 1 reproduced the strong adjusted relationship between private off-street parking and reported domestic chargepoint access (odds ratio (OR) 11.20, 95% confidence interval (CI) 5.64–22.25; ). Owner/buyer tenure was also positively associated with domestic access (OR 2.72, 95% CI 1.17–6.29). The remaining frozen covariates were less precisely estimated.
Stage 2 tells a different, less certain story. The parking OR was 1.06 (95% CI 0.32–3.53; ), but the interval is wide because only 15 Stage-2 records lacked off-street parking; those 15 records included 11 smart and 4 non-smart outcomes. The Stage-2 design matrix was full rank (7/7), no complete separation was detected, and fitted probabilities were finite (0.209–0.941), so the model was estimable despite the limited subgroup support. These diagnostics do not make the conditional parking contrast precise. Household vehicle count was inversely associated with reported smart status and household size positively associated; these secondary coefficients were not the focus of the study. Table 4 gives the numerical estimates.
4.3. RQ1: How Large Is the Joint Smart-Capable Access Contrast?
Marginal standardization makes the two stages directly interpretable on the probability scale. Stage-1 domestic-access probabilities were 0.247 with parking standardized to absent and 0.776 with parking standardized to present. The corresponding Stage-2 probabilities of smart status conditional on domestic access were 0.762 and 0.771.
Combining the stages record by record produced a standardized joint probability of 0.185 (95% bootstrap CI 0.088–0.309) without off-street parking and 0.596 (0.543–0.644) with it. Thus,
or 41.1 percentage points (95% cluster-bootstrap CI 27.5–51.8 points; Equation (16)). The complete standardized stage probabilities, joint probabilities, and decomposition components are reported in Table 5.
Figure 5 displays the corresponding standardized joint probabilities and uncertainty intervals.
4.4. RQ2: Where Is the Joint Contrast Located?
The symmetric decomposition makes the answer transparent. Of the 41.1-point total contrast, 40.6 points (95% CI 29.6–51.4) were assigned to the domestic-access component and 0.5 points (-10.6 to 11.9) to the conditional-smart component. The identity held to machine precision.
The two components do not carry the same evidential weight. is large and its interval excludes zero. has a small point estimate but a wide interval, so it cannot support an equivalence claim. The data are compatible with a range of conditional-smart differences. On the probability scale, the point decomposition places almost all of the estimated joint contrast in the domestic-access component, while the conditional-smart component remains imprecisely estimated (Figure 6).
4.5. Robustness and Urban Sensitivity
The joint estimate was stable across the analyses fixed in the amendment. The direct joint-outcome Logit estimated 42.5 points (95% CI 31.2–53.9), only 1.5 points above the sequential estimate. Assigning every unknown smart-status record to non-smart yielded 41.3 points and assigning every one to smart yielded 43.3 points. The earlier four-covariate Stage-2 specification produced 40.8 points, the stricter parking definition 40.3 points, and restriction to single-eligible-vehicle households 41.5 points. The urban-only analysis produced 41.6 points, only 0.6 points above the national estimate. The earlier three-state multinomial Logit (MNL) yielded 41.2 points.
The additional functional-form sensitivity estimated a 39.8-point contrast (95% PSU-bootstrap CI 26.2–51.2), 1.3 points below the primary estimate. The resampled-target bootstrap gave an interval of 27.5–51.8 points, compared with 27.5–51.8 under the fixed target; the unrounded limits were 27.55–51.78 and 27.51–51.77, respectively. Thus, neither flexible covariate coding nor allowing the empirical standardization population to vary across replicates materially changed the result (Figure 7).
All 2,000 cluster-bootstrap replicates were valid. Sparse non-off-street Stage-2 resamples occasionally generated large Stage-2 coefficients, which reinforces caution about , but the total joint contrast remained stable. A separately implemented raw-data reconstruction reproduced the primary estimates to numerical precision.
For transparency, Table 6 consolidates the stage-specific model diagnostics and the principal stability checks for the adjusted joint contrast. These diagnostics are intended to show estimation support and robustness of the target estimand rather than predictive-model performance.
5. Discussion
5.1. Answers to the Research Questions
RQ1 asked how large the adjusted difference in reported smart-capable domestic charging access is between plug-in vehicle records with and without private off-street parking. The standardized probabilities were 18.5% and 59.6%, respectively, giving a 41.1-percentage-point contrast. This result concerns reported infrastructure access; tariff enrollment, automated charging, load shifting, and grid participation are beyond the NTS outcome.
RQ2 asked where that joint contrast is located within the two-stage architecture. The point decomposition placed 40.6 percentage points in the domestic-access component and 0.5 points in the conditional-smart component. Only 15 Stage-2 records lacked off-street parking, and the confidence interval for the second component spans negative and positive values; it would therefore be inappropriate to describe the groups as equivalent. The point estimate is overwhelmingly concentrated in domestic access, while the conditional-smart component is much less precise. A study restricted to existing home chargers would condition away much of the observed first-stage difference, whereas stopping at domestic access would not show how it carries into the joint smart-capable state.
5.2. How the Finding Fits the Charging Literature
The first-stage result is consistent with a broad body of evidence showing that residential context is central to EV charging. Parking and home-charging opportunities influence purchase preferences and adoption [4,6,8]; multifamily housing adds permission, electrical, financial, and governance constraints [5]; and EV users without reliable home charging adapt their routines across workplace, public, destination, and other charging locations [9,10,11]. Our contribution begins after adoption and quantifies the residential infrastructure state that has actually been reported.
The result also complements the charging-equity literature. Public-charger studies have shown that accessibility can vary with income, race, housing, competition, and spatial context even as infrastructure expands [12,13,14,15,17]. This adds a residential dimension: whether the household can access the domestic branch of the charging ecosystem at all. It complements, rather than replaces, measures of public-charger accessibility. In that sense, residential parking is not merely a vehicle-storage variable; it is part of the infrastructure interface between housing and electric mobility.
The smart-charging literature begins one step later. User acceptance depends on control, convenience, prices, incentives, trust, and mobility guarantees [19,20,21,22,23]. Charging-behavior reviews also show that these decisions are embedded in a wider set of trip, vehicle, infrastructure, and system conditions [24]. The parking result is located upstream of those behavioral choices: it identifies an access condition that must be crossed before they can operate through a domestic smart chargepoint.
5.3. Implications for Sustainable and Equitable Urban Mobility
Urban EV-charging research often focuses on optimization: where chargers should be located, how much capacity is needed, and how charging can be coordinated with energy systems [40,41,42,44]. Those questions are important, but they can begin from an implicit assumption that users can reach the infrastructure being optimized. Accessibility research reminds us that an urban service can be technically available yet unevenly usable [18].
The urban-only sensitivity is therefore informative. Restricting the data to urban records produced a 41.6-point joint contrast, essentially the same as the national estimate. Its persistence within the urban sample suggests that conventional private residential parking remains strongly associated with who reaches the domestic smart-capable branch of the charging system.
For city planners, that makes alternative residential pathways important for inclusion as well as capacity. Public residential charging, workplace charging, communal installations, kerbside facilities, and safe cross-pavement solutions can serve users for whom a driveway-based installation is not realistic [29,31,39,49,50]. Their relative importance cannot be ranked with NTS data. Even so, the findings give a reason to monitor them: if the domestic-access gate remains uneven, expanding smart functionality among existing home chargers alone would leave the first-stage disparity untouched.
5.4. UK Policy and Monitoring Implications
UK policy already separates these infrastructure gates in practice. Local Electric Vehicle Infrastructure (LEVI) funding supports local authorities delivering charging for residents without off-street parking, while current grant and cross-pavement guidance create additional residential options [30,31,51]. Smart-chargepoint regulation, by contrast, concerns the capabilities of covered private equipment [25,26]. The two-stage framework provides a simple monitoring language for these parallel policy streams: one can track whether households reach domestic access and, separately, what share of domestic equipment is reported as smart.
As a cross-sectional baseline, the 2024 wave can support future monitoring. Repeating the same estimands in later NTS waves could show whether the domestic-access component narrows as EV adoption diffuses and alternative residential solutions become more common. Causal attribution to a particular policy would require a longitudinal or quasi-experimental design.
5.5. Limitations
Several limitations set clear boundaries on the interpretation. First, the design is cross-sectional and observational. Off-street parking is entangled with dwelling type, neighborhood form, household resources, earlier residential decisions, and unobserved preferences. Neither nor or is a causal effect of assigning parking or installing a charger.
Second, the analysis conditions on a plug-in vehicle already being observed. Parking and housing conditions may have influenced adoption before a record entered the charging-question universe; the target is therefore a selected post-adoption population.
Third, Stage 2 contains only 15 records without off-street parking (11 smart and 4 non-smart). Both outcome states are present, the design matrix is full rank, and no complete separation was detected, but the conditional parking coefficient and remain necessarily imprecise. Bootstrap resampling and multiple alternative formulations demonstrate stability of the total joint contrast; they cannot create information that is absent from this small subgroup.
Fourth, smart status is self-reported rather than technically verified, and charger installation date is unavailable; the installed stock may therefore span different regulatory vintages. Fifth, the analytical unit follows the vehicle-routed NTS charging questions, so some households can contribute more than one eligible plug-in record. All analytical households were nested within a single observed PSU, allowing PSU clustering and resampling to encompass within-household record dependence. Restricting the analysis to households contributing a single eligible vehicle record produced a 41.5-point joint contrast, compared with 41.1 points in the primary analysis, showing that unequal record contributions did not materially change the estimate. Sixth, the EUL analysis applies W3 and PSU clustering but does not reconstruct the complete original stratification design, so its uncertainty estimates should not be interpreted as official DfT design-based standard errors. Seventh, the EUL lacks detailed dwelling form, electrical capacity, charger power, tariffs, charging-event timestamps, fine spatial public-charger accessibility, household load, distribution-network conditions, and bidirectional capability.
Finally, the outcome is an infrastructure state, not electricity-system behavior. The study does not estimate kWh delivered, peak load, load shifting, renewable integration, vehicle-to-grid (V2G) services, charging cost savings, or actual smart-charging participation. Those outcomes require charger-event, metering, tariff, equipment, or network data.
5.6. Future Research
The most immediate extension is replication in subsequent NTS waves, provided question wording remains comparable. Pooling waves would increase the Stage-2 non-off-street sample and allow researchers to distinguish changes in domestic access from changes in reported smart status.
A second extension is spatial. Linking appropriately protected survey information to local-authority data on LEVI deployment, public-charger accessibility, cross-pavement policies, housing type, and parking regulation could test whether alternative infrastructure compensates for limited domestic access. A third extension would connect infrastructure access to behavior: charger-event or smart-meter data could reveal whether smart-capable access translates into managed charging, tariff response, flexibility, or grid services. These are natural next questions precisely because they cannot be answered from the NTS alone.
6. Conclusions
England’s 2024 NTS allows residential EV charging to be viewed as two nested access gates rather than a single home-charger outcome. In the post-adoption plug-in vehicle sample, private off-street parking was associated with a 41.1-percentage-point higher standardized probability of reaching the joint reported domestic-and-smart state (95% cluster-bootstrap CI 27.5–51.8 points).
The probability-scale decomposition placed 40.6 points of that contrast in the domestic-access component and 0.5 points in the conditional-smart component. The second component is imprecise and does not support an equivalence claim; accordingly, the decomposition should be read as an algebraic allocation of the point contrast rather than evidence of a null second-stage association. The total joint contrast remained between 39.8 and 43.3 percentage points across all sensitivity analyses, including alternative outcome formulations, missing-status stress tests, categorical covariate coding, a resampled standardization target, alternative parking coding, the single-eligible-vehicle restriction, the earlier multinomial characterization, and the urban-only analysis.
The practical message is simple: expanding smart functionality among households that already have a domestic chargepoint addresses only the second gate. In these data, the point decomposition places most of the observed residential parking contrast in the domestic-access component. The result concerns infrastructure access; electricity demand and grid flexibility remain outside its scope. Residential charging access therefore belongs within the broader challenge of building inclusive smart-mobility systems.
Supplementary Materials
The following supporting information is submitted separately in Preprints.org: Table S1, Key support counts; Table S2, Primary bootstrap summary; Figure S1, Sensitivity analyses for the adjusted joint reported smart-capable domestic-access contrast; Table S3, Additional pre-submission robustness checks for ; and accompanying descriptions of the support audit and sensitivity analyses.
Author Contributions
Conceptualization, V.N.; methodology, V.N. and W.L.-H.; software, V.N.; validation, V.N. and W.L.-H.; formal analysis, V.N.; investigation, V.N.; data curation, V.N.; writing—original draft preparation, V.N.; writing—review and editing, V.N. and W.L.-H.; visualization, V.N.; project administration, V.N. All authors have read and agreed to the submitted version of the manuscript.
Funding
This research received no external funding. The Article Processing Charge will be funded by Universidad de las Fuerzas Armadas ESPE.
Institutional Review Board Statement
Not applicable. This study is a secondary analysis of pre-existing National Travel Survey microdata obtained under the UK Data Service End User Licence. The authors conducted no new recruitment, intervention, or direct interaction with human participants and did not access directly identifying participant information.
Informed Consent Statement
Not applicable to this secondary analysis. The authors did not recruit participants or collect new human-participant data and analyzed only licensed secondary National Travel Survey microdata.
Data Availability Statement
The National Travel Survey microdata analyzed in this study are available from the UK Data Service under the End User Licence: Department for Transport (2026), National Travel Survey, 2002–2024, 19th Edition, study number 5340, DOI: 10.5255/UKDA-SN-5340-15. Access is subject to UK Data Service registration and the applicable licence conditions. Licensed row-level microdata cannot be redistributed by the authors. The analytical code and aggregate verification outputs are available from the corresponding author upon reasonable request.
Acknowledgments
The authors acknowledge the support provided by the Departamento de Ciencias Exactas, Universidad de las Fuerzas Armadas ESPE. During the preparation of this manuscript, the authors used ChatGPT (OpenAI; GPT-5.6 Sol, web interface, accessed August 2026) and Gemini (Google; Gemini 3.1 Pro, web interface, accessed August 2026) for English-language editing and editorial assistance. The authors independently verified all methodological descriptions, numerical results, citations, and interpretations, reviewed and edited the outputs, and take full responsibility for the content of this publication.
Conflicts of Interest
The authors declare no conflicts of interest.
References
- Hardman, S.; Jenn, A.; Tal, G.; Axsen, J.; Beard, G.; Daina, N.; Figenbaum, E.; Jakobsson, N.; Jochem, P.; Kinnear, N.; et al. A Review of Consumer Preferences of and Interactions with Electric Vehicle Charging Infrastructure. Transp. Res. Part D. Transp. Environ. 2018, 62, 508–523. [Google Scholar] [CrossRef]
- Axsen, J.; Kurani, K.S. Who Can Recharge a Plug-In Electric Vehicle at Home? Transp. Res. Part D. Transp. Environ. 2012, 17, 349–353. [Google Scholar] [CrossRef]
- Traut, E.J.; Cherng, T.C.; Hendrickson, C.; Michalek, J.J. US Residential Charging Potential for Electric Vehicles. Transp. Res. Part D. Transp. Environ. 2013, 25, 139–145. [Google Scholar] [CrossRef]
- Guerra, E.; Daziano, R.A. Electric Vehicles and Residential Parking in an Urban Environment: Results from a Stated Preference Experiment. Transp. Res. Part D. Transp. Environ. 2020, 79, 102222. [Google Scholar] [CrossRef]
- Kuby, M.; Cordova-Cruzatty, A.; Parker, N.C.; King, D.A. EV Charging for Multifamily Housing: Review of Evidence, Methods, Barriers, and Opportunities. Renew. Sustain. Energy Rev. 2025, 210, 115253. [Google Scholar] [CrossRef]
- Pezeshknejad, P.; Damon, L.; Grajdura, S.; Rowangould, D. Barriers to Electric Vehicle Home Charging and Impacts on Adoption. Transp. Res. Part D. Transp. Environ. 2026, 154, 105262. [Google Scholar] [CrossRef]
- Patt, A.; Aplyn, D.; Weyrich, P.; van Vliet, O. Availability of Private Charging Infrastructure Influences Readiness to Buy Electric Cars. Transp. Res. Part A Policy Pract. 2019, 125, 1–7. [Google Scholar] [CrossRef]
- Kristoffersson, I.; Pyddoke, R.; Kristofersson, F.; Algers, S. Access to Charging Infrastructure and the Propensity to Buy an Electric Car. Transp. Res. Part D. Transp. Environ. 2025, 139, 104588. [Google Scholar] [CrossRef]
- Chakraborty, D.; Bunch, D.S.; Lee, J.H.; Tal, G. Demand Drivers for Charging Infrastructure-Charging Behavior of Plug-In Electric Vehicle Commuters. Transp. Res. Part D. Transp. Environ. 2019, 76, 255–272. [Google Scholar] [CrossRef]
- Lee, J.H.; Chakraborty, D.; Hardman, S.J.; Tal, G. Exploring Electric Vehicle Charging Patterns: Mixed Usage of Charging Infrastructure. Transp. Res. Part D. Transp. Environ. 2020, 79, 102249. [Google Scholar] [CrossRef]
- Malabanan, I.; Lavieri, P.S.; Mateo-Babiano, I.; Ahmed, W.; De Vos, J. Electric Vehicle Charging Dissonance: Exploring How Renters and Multi-Unit Dwelling Residents Navigate Limited Charging Access. J. Transp. Geogr. 2026, 130, 104453. [Google Scholar] [CrossRef]
- Hsu, C.W.; Fingerman, K. Public Electric Vehicle Charger Access Disparities across Race and Income in California. Transp. Policy 2021, 100, 59–67. [Google Scholar] [CrossRef]
- Hopkins, E.; Potoglou, D.; Orford, S.; Cipcigan, L. Can the Equitable Roll Out of Electric Vehicle Charging Infrastructure Be Achieved? Renew. Sustain. Energy Rev. 2023, 182, 113398. [Google Scholar] [CrossRef]
- Peng, Z.; Wang, M.W.H.; Yang, X.; Chen, A.; Zhuge, C. An Analytical Framework for Assessing Equitable Access to Public Electric Vehicle Chargers. Transp. Res. Part D. Transp. Environ. 2024, 126, 103990. [Google Scholar] [CrossRef]
- Ermagun, A.; Tian, J. Charging into Inequality: A National Study of Social, Economic, and Environment Correlates of Electric Vehicle Charging Stations. Energy Res. Soc. Sci. 2024, 115, 103622. [Google Scholar] [CrossRef]
- Malabanan, I.; Lavieri, P.S.; Mateo-Babiano, I. Electric Vehicle Charging Disadvantage: A Social Justice Perspective on Charging with Implications to Accessibility. Transp. Rev. 2025, 45, 696–725. [Google Scholar] [CrossRef]
- Esmaili, A.; Oshanreh, M.M.; Naderian, S.; MacKenzie, D.; Chen, C. Assessing the Spatial Distributions of Public Electric Vehicle Charging Stations with Emphasis on Equity Considerations in King County, Washington. Sustain. Cities Soc. 2024, 107, 105409. [Google Scholar] [CrossRef]
- Ferrer-Ortiz, C.; Marquet, O.; Mojica, L.; Vich, G. Barcelona under the 15-Minute City Lens: Mapping the Accessibility and Proximity Potential Based on Pedestrian Travel Times. Smart Cities 2022, 5, 146–161. [Google Scholar] [CrossRef]
- Will, C.; Schuller, A. Understanding User Acceptance Factors of Electric Vehicle Smart Charging. Transp. Res. Part C Emerg. Technol. 2016, 71, 198–214. [Google Scholar] [CrossRef]
- Lagomarsino, M.; van der Kam, M.; Parra, D.; Hahnel, U.J.J. Do I Need to Charge Right Now? Tailored Choice Architecture Design Can Increase Preferences for Electric Vehicle Smart Charging. Energy Policy 2022, 162, 112818. [Google Scholar] [CrossRef]
- Wong, S.D.; Shaheen, S.A.; Martin, E.; Uyeki, R. Do Incentives Make a Difference? Understanding Smart Charging Program Adoption for Electric Vehicles. Transp. Res. Part C Emerg. Technol. 2023, 151, 104123. [Google Scholar] [CrossRef]
- Philip, T.; Whitehead, J. Consumer Willingness to Adopt Electric Vehicle Smart Charging: A Stated Preference Analysis. Transp. Res. Part D. Transp. Environ. 2025, 146, 104867. [Google Scholar] [CrossRef]
- de Graaf, J.A.; Stok, F.M.; de Wit, J.B.F.; Bal, M. Understanding Behavioral Factors Influencing EV Smart Charging: A Mixed-Method Study of Citizens’ Capabilities, Opportunities, and Motivations. Energy Policy 2026, 210, 115060. [Google Scholar] [CrossRef]
- Shariatzadeh, M.; Lopes, M.A.R.; Antunes, C.H. Electric Vehicle Users’ Charging Behavior: A Review of Influential Factors, Methods and Modeling Approaches. Appl. Energy 2025, 396, 126167. [Google Scholar] [CrossRef]
- UK Government. The Electric Vehicles (Smart Charge Points) Regulations 2021. UK Statut. Instrum. Accessed. 2021, 2021(No. 1467). (accessed on 13 August 2026). [Google Scholar]
- Office for Product Safety and Standards. Regulations: Electric Vehicle Smart Charge Points. GOV.UK Guidance. Accessed. 2022. (accessed on 13 August 2026).
- Department for Energy Security and Net Zero and Ofgem and Department for Business; Energy; Industrial Strategy. Electric Vehicle Smart Charging Action Plan. GOV.UK Policy Paper. accessed. 2023. Published 18 January 2023. (accessed on 13 August 2026).
- Department for Transport. UK Electric Vehicle Infrastructure Strategy. GOV.UK. Published. 2022. (accessed on 13 August 2026).
- Department for Transport and Office for Zero Emission Vehicles. Public Electric Vehicle Charging Infrastructure: Drivers without Access to Off-Street Parking. GOV.UK Research and Analysis. Published. 2022. (accessed on 13 August 2026).
- Office for Zero Emission Vehicles and Department for Transport. Electric Vehicle Chargepoint Grants. GOV.UK Guidance, 2026. Grant guidance current August 2026; households with on-street parking may receive support for a chargepoint installed with an eligible cross-pavement solution.
- Department for Transport and Office for Zero Emission Vehicles. Cross-Pavement Solutions for Charging Electric Vehicles. GOV.UK Guidance, 2024. Guidance for local authorities in England on safe cross-pavement charging solutions, permissions, standards, responsibilities and benefits. accessed. 24 December 2024. (accessed on 17 August 2026).
- Yiu, J.; Pawlak, J.; Faghih Imani, A.; Sivakumar, A. Systematic Study of Battery Electric Vehicle Ownership in England. Transp. Res. Rec. J. Transp. Res. Board 2025, 2679, 1712–1724. [Google Scholar] [CrossRef]
- Department for Transport. National Travel Survey 2024: Notes and Definitions. GOV.UK. Published. 2025. (accessed on 13 August 2026).
- Department for Transport. National Travel Survey 2024 Technical Report: Appendix A2, Questionnaire Changes Made in 2024. GOV.UK, 2025. Documents the 2024 introduction, wording, routing, and response definitions for DomCha, DCSma, and DCAcc. accessed. (accessed on 21 August 2026).
- Department for Transport. NTSQ09075: Ownership of Domestic Vehicle Charging Devices, Plug-In Vehicle Owners: England, 2024. GOV.UK, Ad-hoc National Travel Survey analysis, 2025. accessed. (accessed on 17 August 2026). Published with the 2024 NTS statistical release.
- Department for Science; Innovation and Technology and Department for Business; Energy; Industrial Strategy. Electric Vehicle Smart Chargepoint Survey 2022. GOV.UK Research and Analysis. Published. 2023. (accessed on 13 August 2026).
- Naz, A.; Mashrur, S.; Hoque, I.; Mohamed, M. User-Centric Joint Modeling of EV Charging Location Preferences and Charging Needs. Transp. Res. Part D. Transp. Environ. 2026, 157, 105433. [Google Scholar] [CrossRef]
- Daina, N.; Sivakumar, A.; Polak, J.W. Electric Vehicle Charging Choices: Modelling and Implications for Smart Charging Services. Transp. Res. Part C Emerg. Technol. 2017, 81, 36–56. [Google Scholar] [CrossRef]
- Sica, L.; Carboni, A.; Deflorio, F.; Botta, C. Electric Vehicle Recharging Options in Urban Areas: Discrete Choice Modeling to Estimate User Preference. Sustain. Cities Soc. 2025, 121, 106175. [Google Scholar] [CrossRef]
- Sanguesa, J.A.; Torres-Sanz, V.; Garrido, P.; Martinez, F.J.; Marquez-Barja, J.M. A Review on Electric Vehicles: Technologies and Challenges. Smart Cities 2021, 4, 372–404. [Google Scholar] [CrossRef]
- Goli, P.; Jasthi, K.; Gampa, S.R.; Das, D.; Shireen, W.; Siano, P.; Guerrero, J.M. Electric Vehicle Charging Load Allocation at Residential Locations Utilizing the Energy Savings Gained by Optimal Network Reconductoring. Smart Cities 2022, 5, 177–205. [Google Scholar] [CrossRef]
- Wang, H.; Meng, Q.; Xiao, L. Electric-Vehicle Charging Facility Deployment Models for Dense-City Residential Carparks Considering Demand Uncertainty and Grid Dynamics. Transp. Res. Part C Emerg. Technol. 2024, 168, 104579. [Google Scholar] [CrossRef]
- Funke, S.Á.; Sprei, F.; Gnann, T.; Plötz, P. How Much Charging Infrastructure Do Electric Vehicles Need? A Review of the Evidence and International Comparison. Transp. Res. Part D. Transp. Environ. 2019, 77, 224–242. [Google Scholar] [CrossRef]
- Metais, M.O.; Jouini, O.; Perez, Y.; Berrada, J.; Suomalainen, E. Too Much or Not Enough? Planning Electric Vehicle Charging Infrastructure: A Review of Modeling Options. Renew. Sustain. Energy Rev. 2022, 153, 111719. [Google Scholar] [CrossRef]
- Department for Transport. National Travel Survey; Study number 5340; End User Licence data collection; UK Data Service, 2026. [Google Scholar] [CrossRef]
- Cameron, A.C.; Miller, D.L. A Practitioner’s Guide to Cluster-Robust Inference. J. Hum. Resour. 2015, 50, 317–372. [Google Scholar] [CrossRef]
- Muller, C.J.; MacLehose, R.F. Estimating Predicted Probabilities from Logistic Regression: Different Methods Correspond to Different Target Populations. Int. J. Epidemiol. 2014, 43, 962–970. [Google Scholar] [CrossRef] [PubMed]
- Cameron, A.C.; Gelbach, J.B.; Miller, D.L. Bootstrap-Based Improvements for Inference with Clustered Errors. Rev. Econ. Stat. 2008, 90, 414–427. [Google Scholar] [CrossRef]
- Budnitz, H.; Meelen, T.; Schwanen, T. Public Residential Charging of Electric Vehicles: An Exploration of UK User Preferences. Eur. Transp. Stud. 2024, 1, 100004. [Google Scholar] [CrossRef]
- Grote, M.; Preston, J.; Cherrett, T.; Tuck, N. Locating Residential On-Street Electric Vehicle Charging Infrastructure: A Practical Methodology. Transp. Res. Part D. Transp. Environ. 2019, 74, 15–27. [Google Scholar] [CrossRef]
- Department for Transport and Office for Zero Emission Vehicles. Local Electric Vehicle Infrastructure (LEVI) Funding Amounts and Allocation Methodology. GOV.UK, 2026. Current page states that LEVI supports local authorities in England to plan and deliver chargepoint infrastructure for residents without off-street parking. accessed. 30 July 2026. (accessed on 17 August 2026).
Figure 1.
Two-stage analytical framework for reported smart-capable domestic charging access. The joint state is defined from domestic access and smart status conditional on domestic access. Arrows indicate routing and conditioning, not causality. NTS, National Travel Survey; W3, household interview-sample weight; P, private off-street parking; X, household covariate vector; A, domestic access; B, smart status; J, joint state.
Figure 1.
Two-stage analytical framework for reported smart-capable domestic charging access. The joint state is defined from domestic access and smart status conditional on domestic access. Arrows indicate routing and conditioning, not causality. NTS, National Travel Survey; W3, household interview-sample weight; P, private off-street parking; X, household covariate vector; A, domestic access; B, smart status; J, joint state.
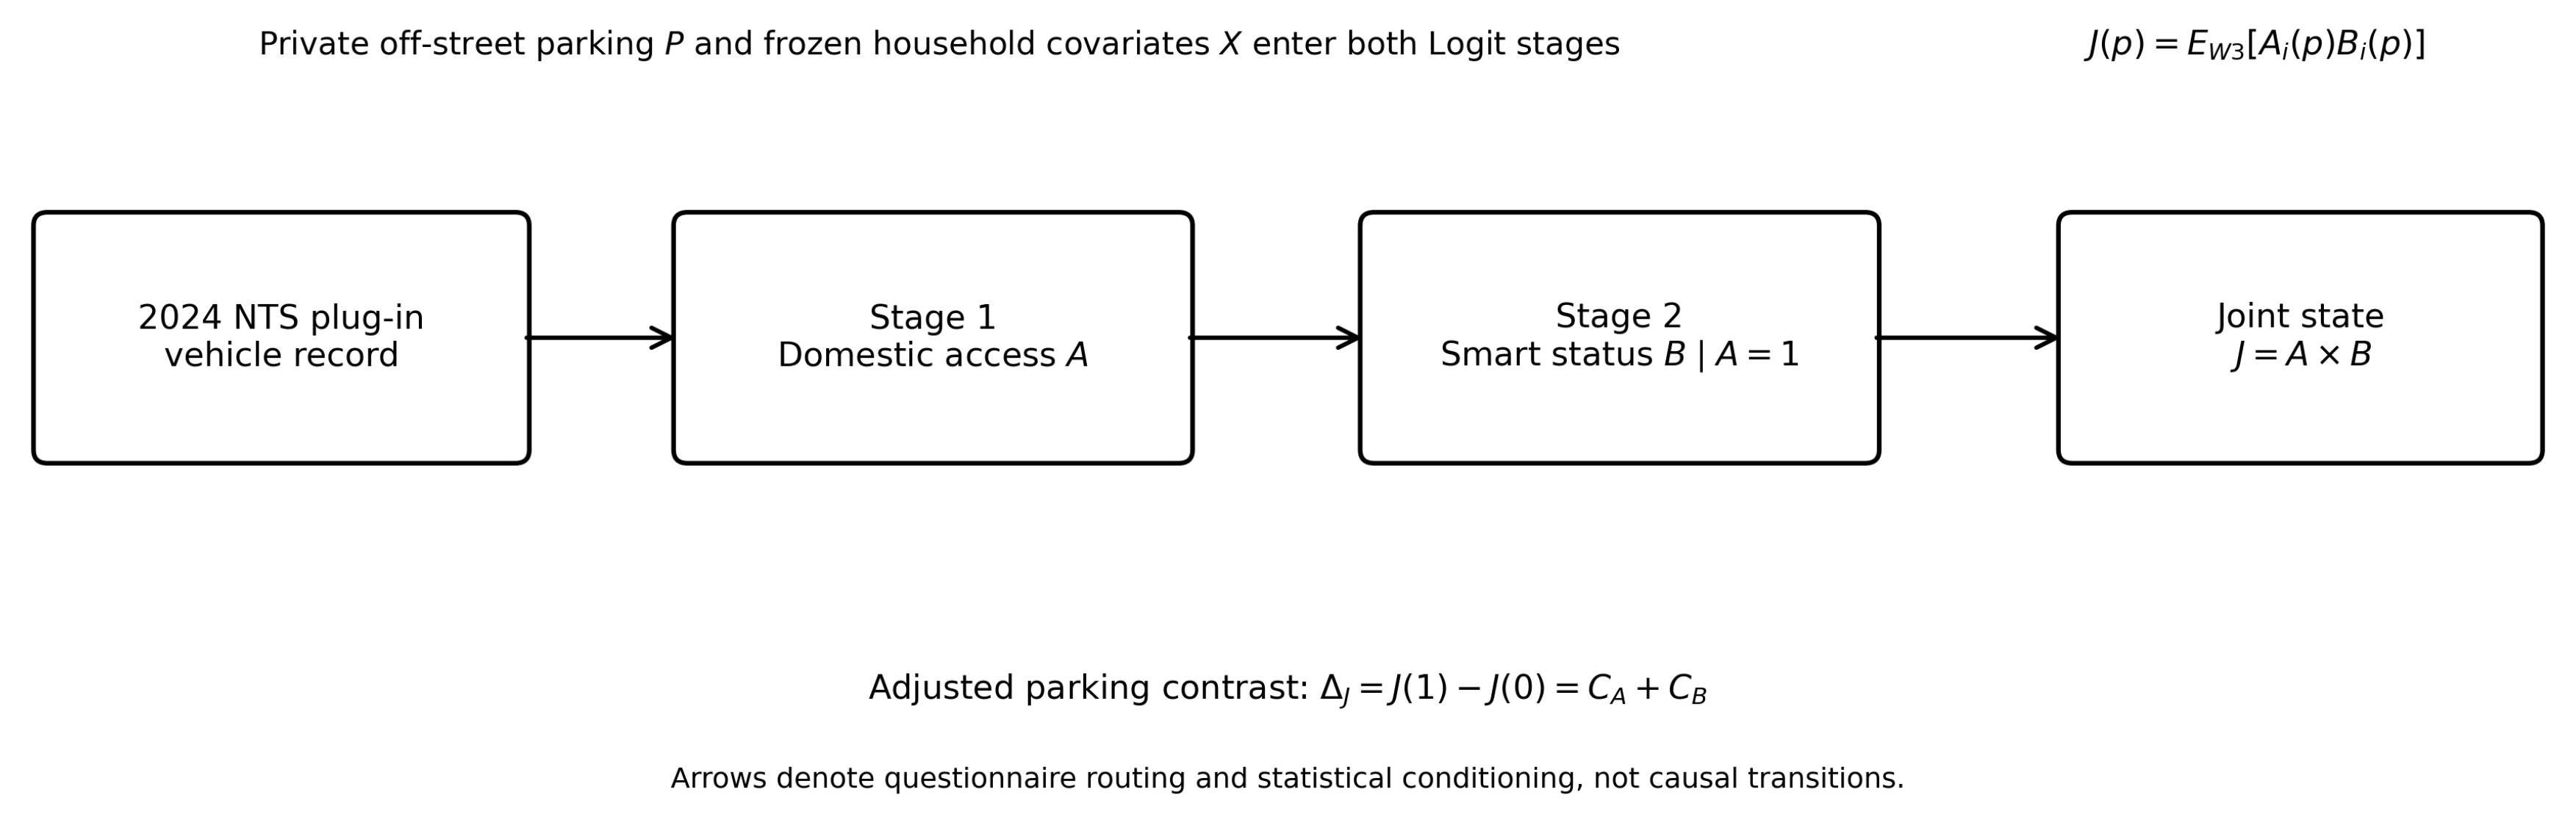
Figure 2.
Observed W3-weighted composition of domestic/smart charging states in the Stage-1 complete-case sample. Nine off-street records reported a domestic chargepoint but had unknown smart status. Percentages are descriptive and are not substitutes for the adjusted two-stage estimand.
Figure 2.
Observed W3-weighted composition of domestic/smart charging states in the Stage-1 complete-case sample. Nine off-street records reported a domestic chargepoint but had unknown smart status. Percentages are descriptive and are not substitutes for the adjusted two-stage estimand.
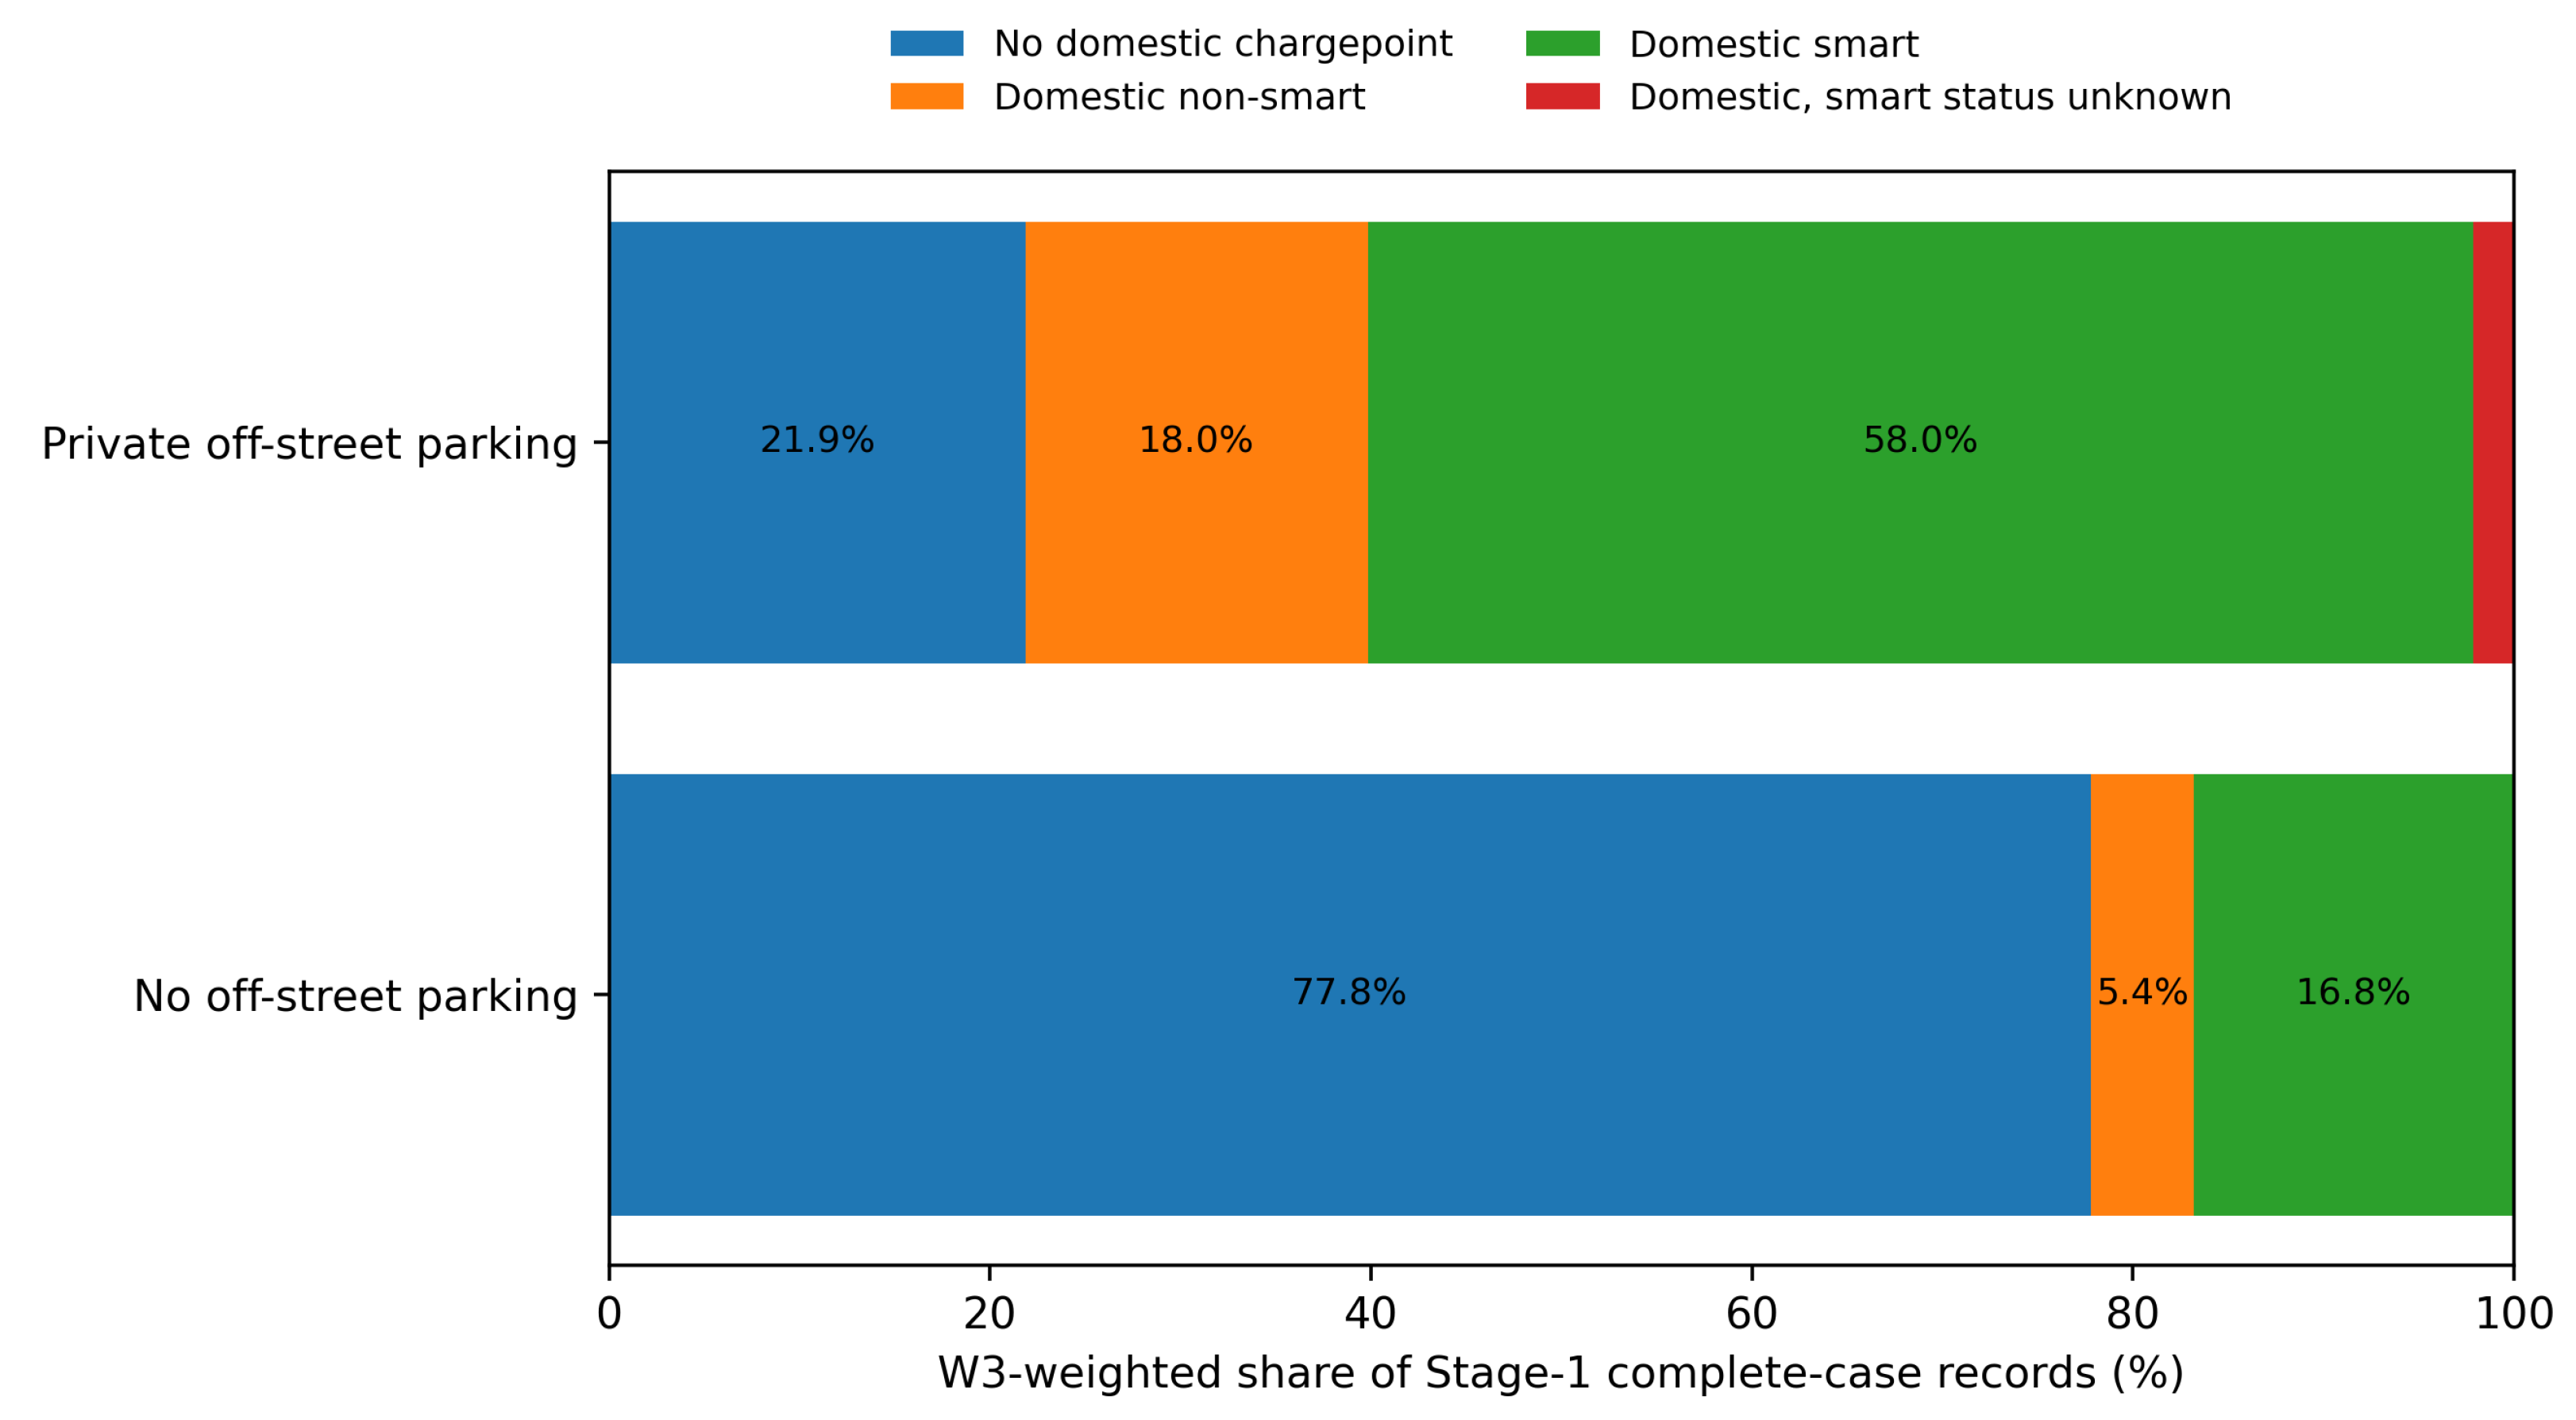
Figure 3.
Stage-1 odds ratios and 95% PSUID-cluster-robust confidence intervals for reported domestic chargepoint access. The vertical reference line is OR=1.
Figure 3.
Stage-1 odds ratios and 95% PSUID-cluster-robust confidence intervals for reported domestic chargepoint access. The vertical reference line is OR=1.
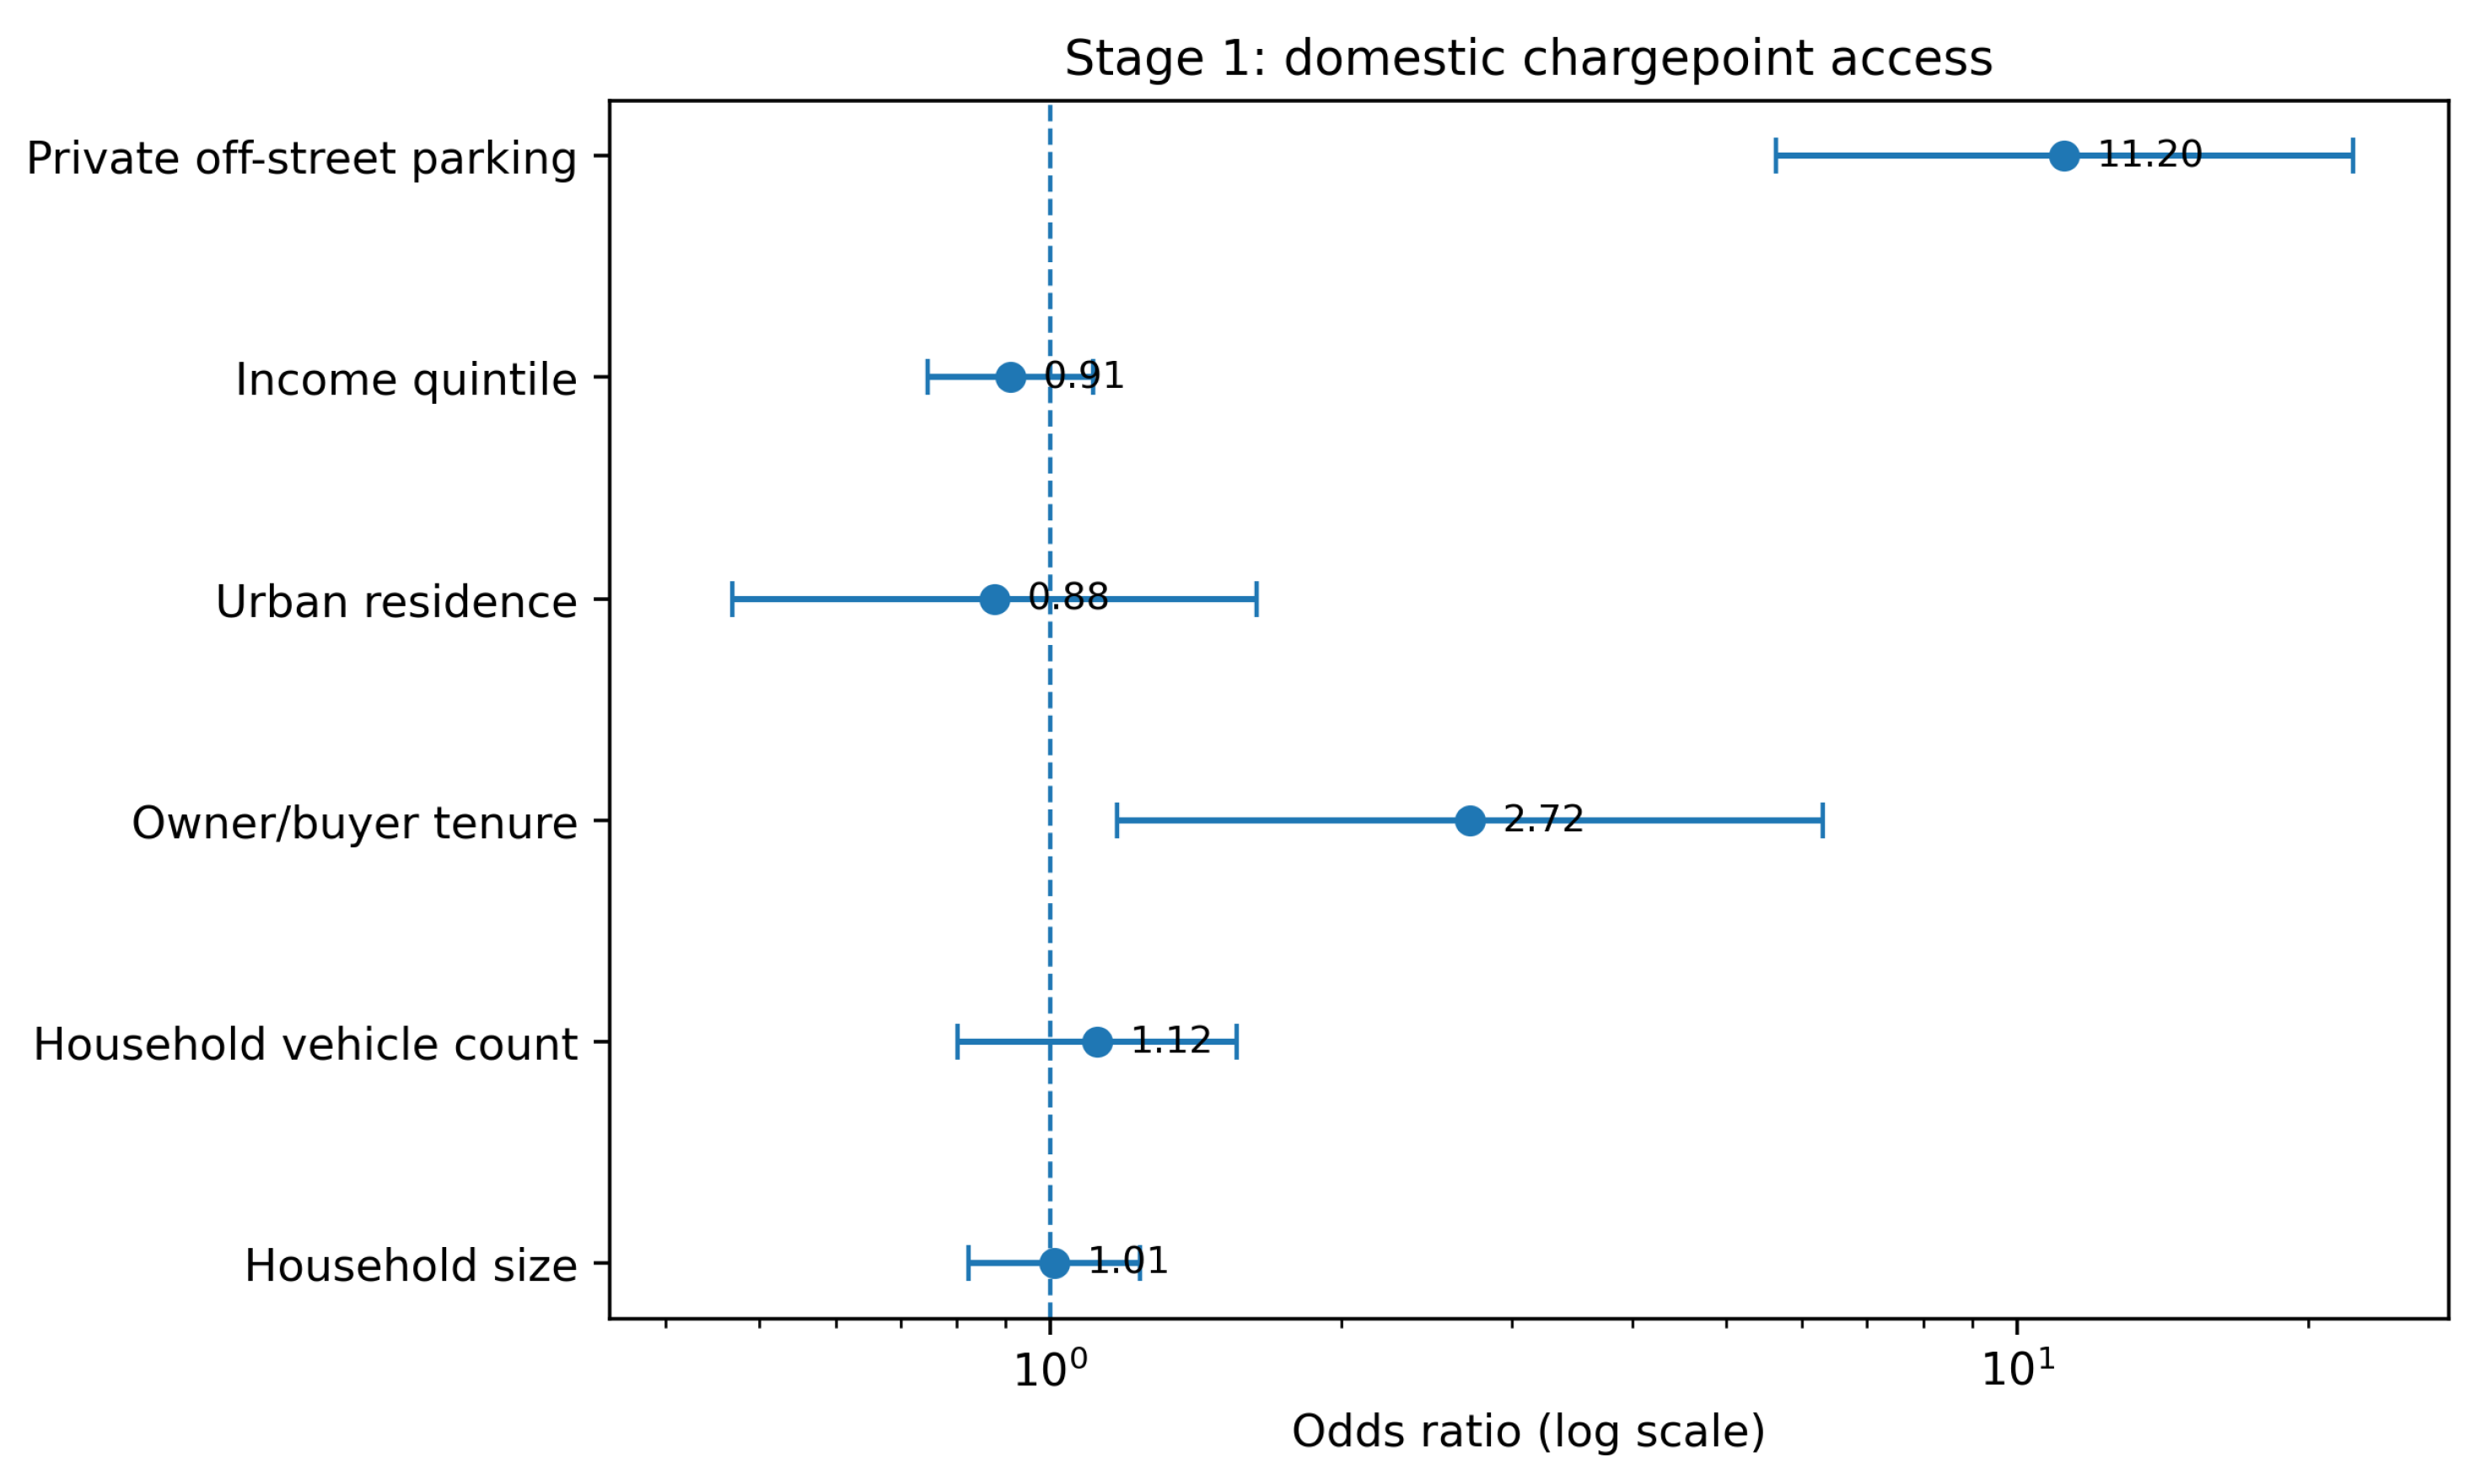
Figure 4.
Stage-2 odds ratios and 95% PSUID-cluster-robust confidence intervals for reported smart status conditional on domestic access. The wide parking interval reflects the small non-off-street Stage-2 subgroup.
Figure 4.
Stage-2 odds ratios and 95% PSUID-cluster-robust confidence intervals for reported smart status conditional on domestic access. The wide parking interval reflects the small non-off-street Stage-2 subgroup.
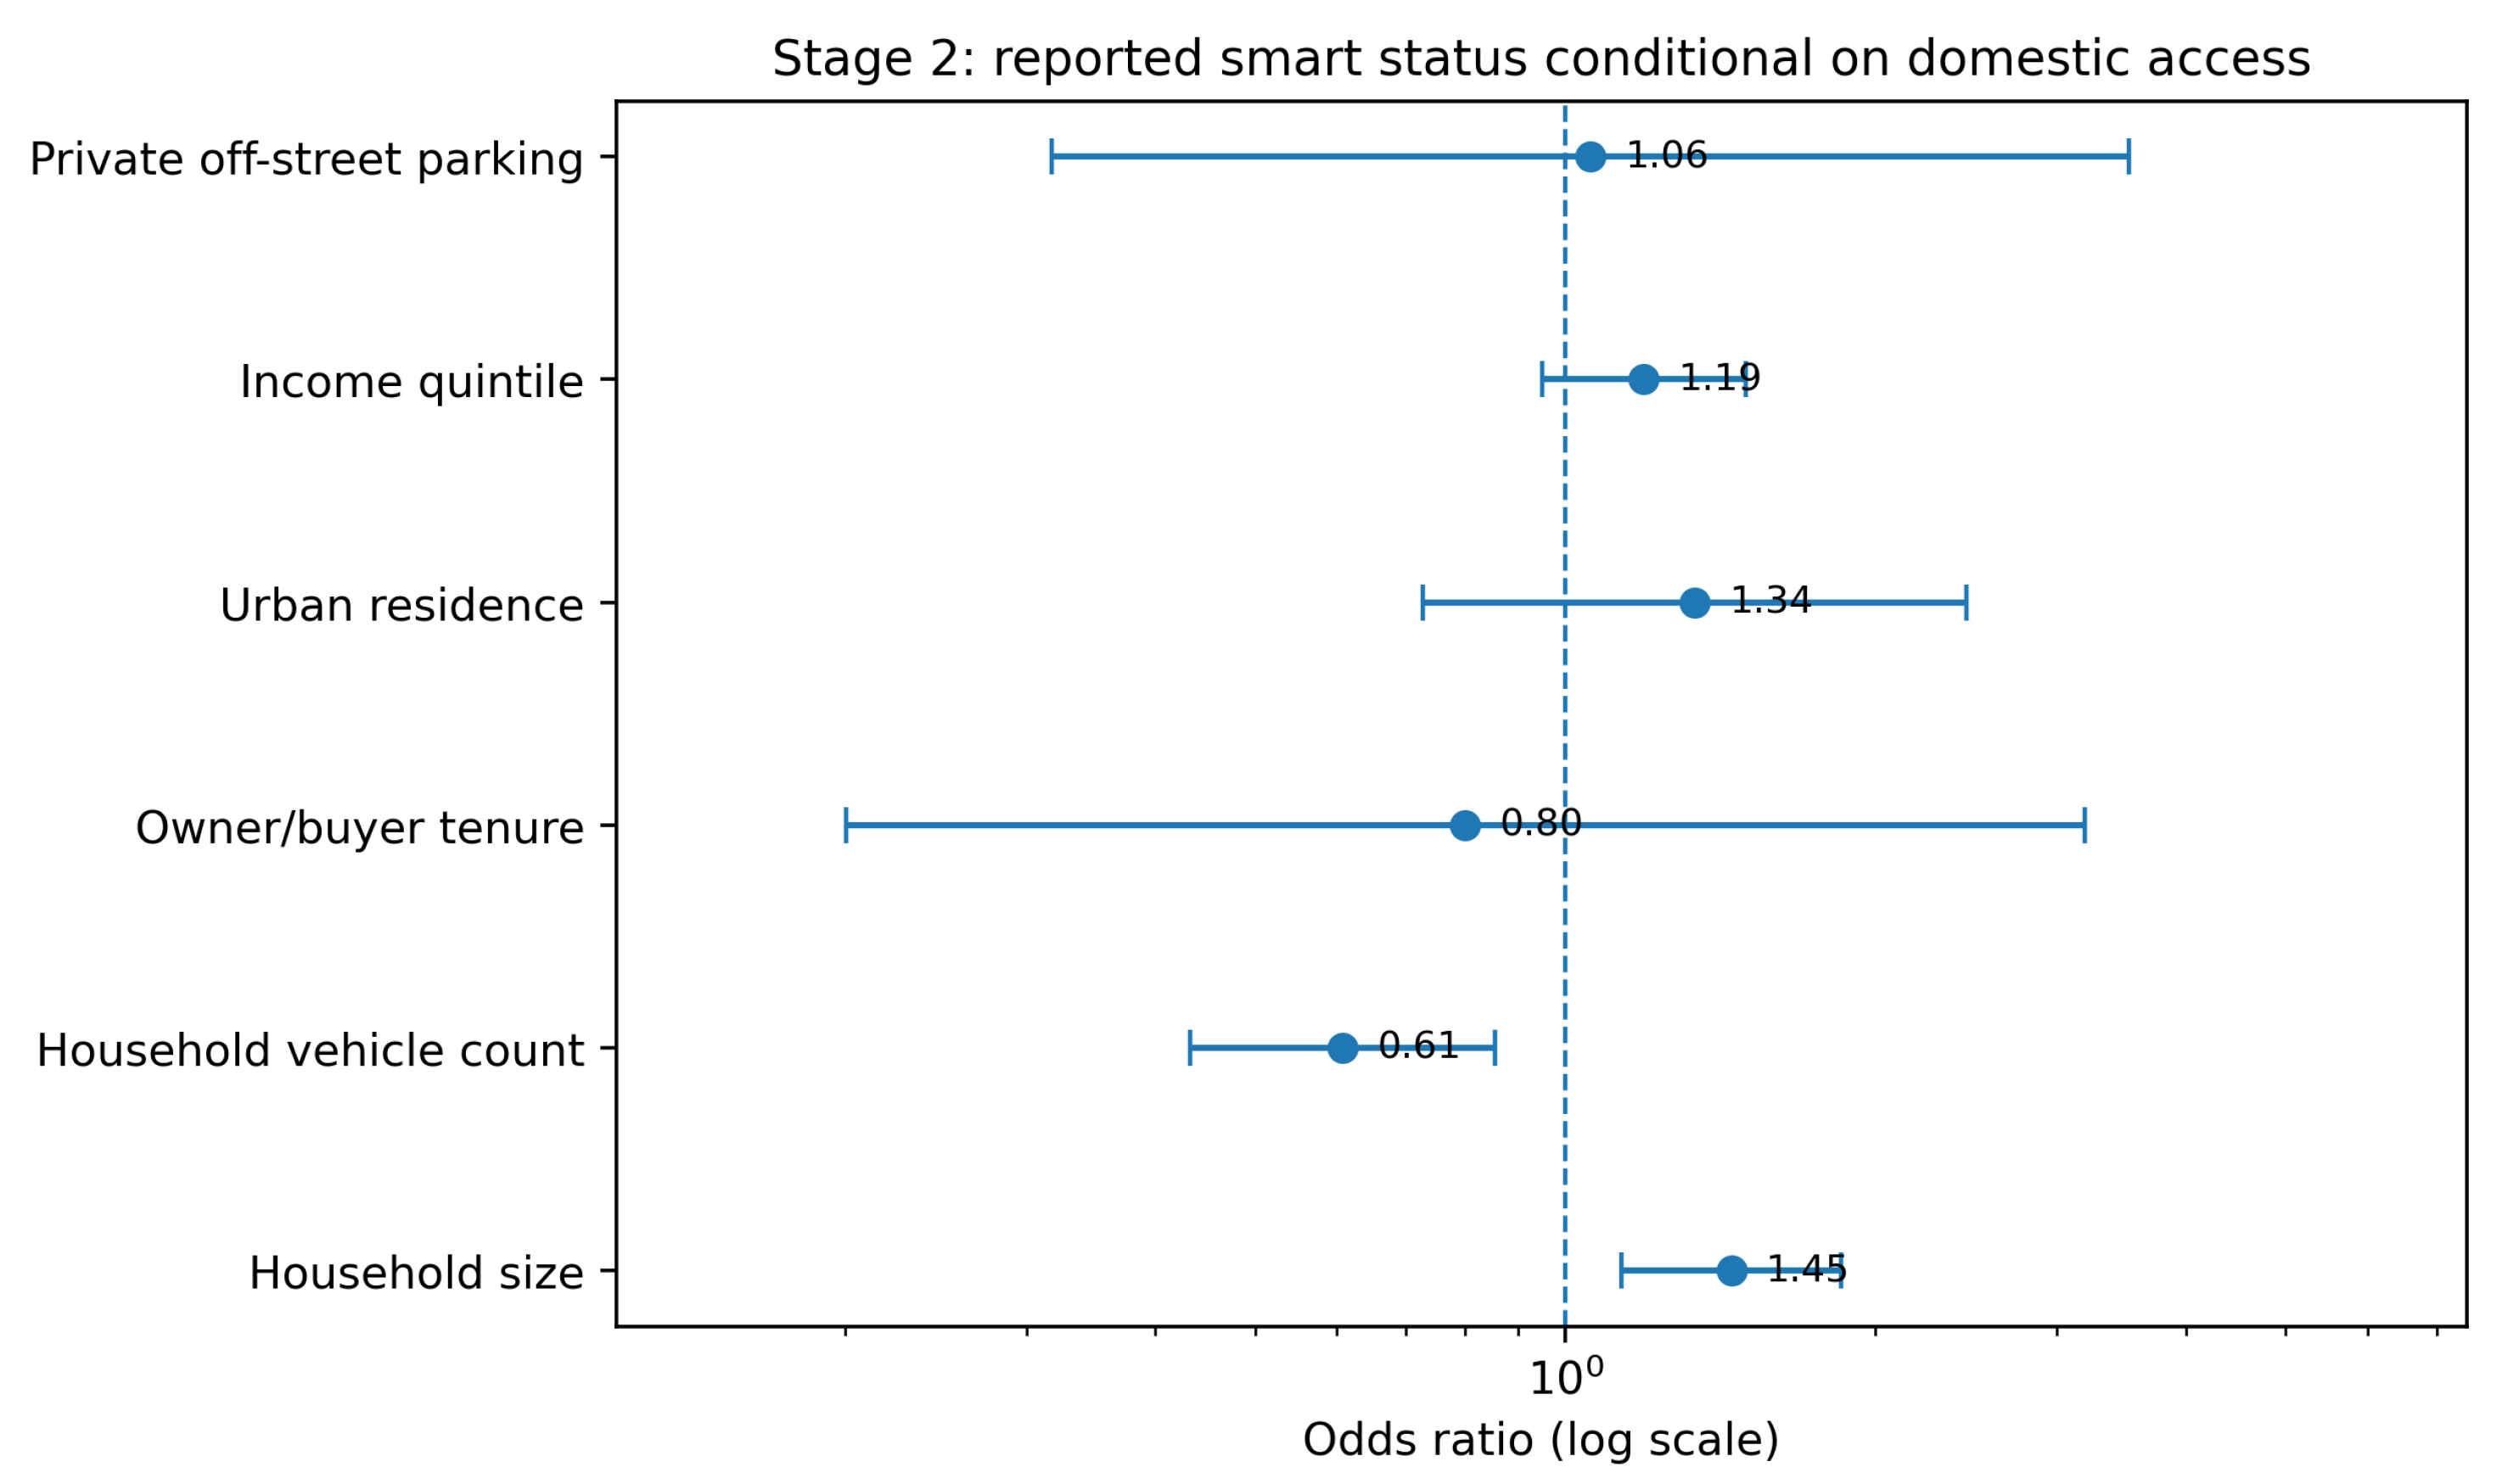
Figure 5.
W3-standardized probability of reported smart-capable domestic charging access by private off-street parking status. Error bars are 95% PSUID-cluster-bootstrap percentile confidence intervals.
Figure 5.
W3-standardized probability of reported smart-capable domestic charging access by private off-street parking status. Error bars are 95% PSUID-cluster-bootstrap percentile confidence intervals.
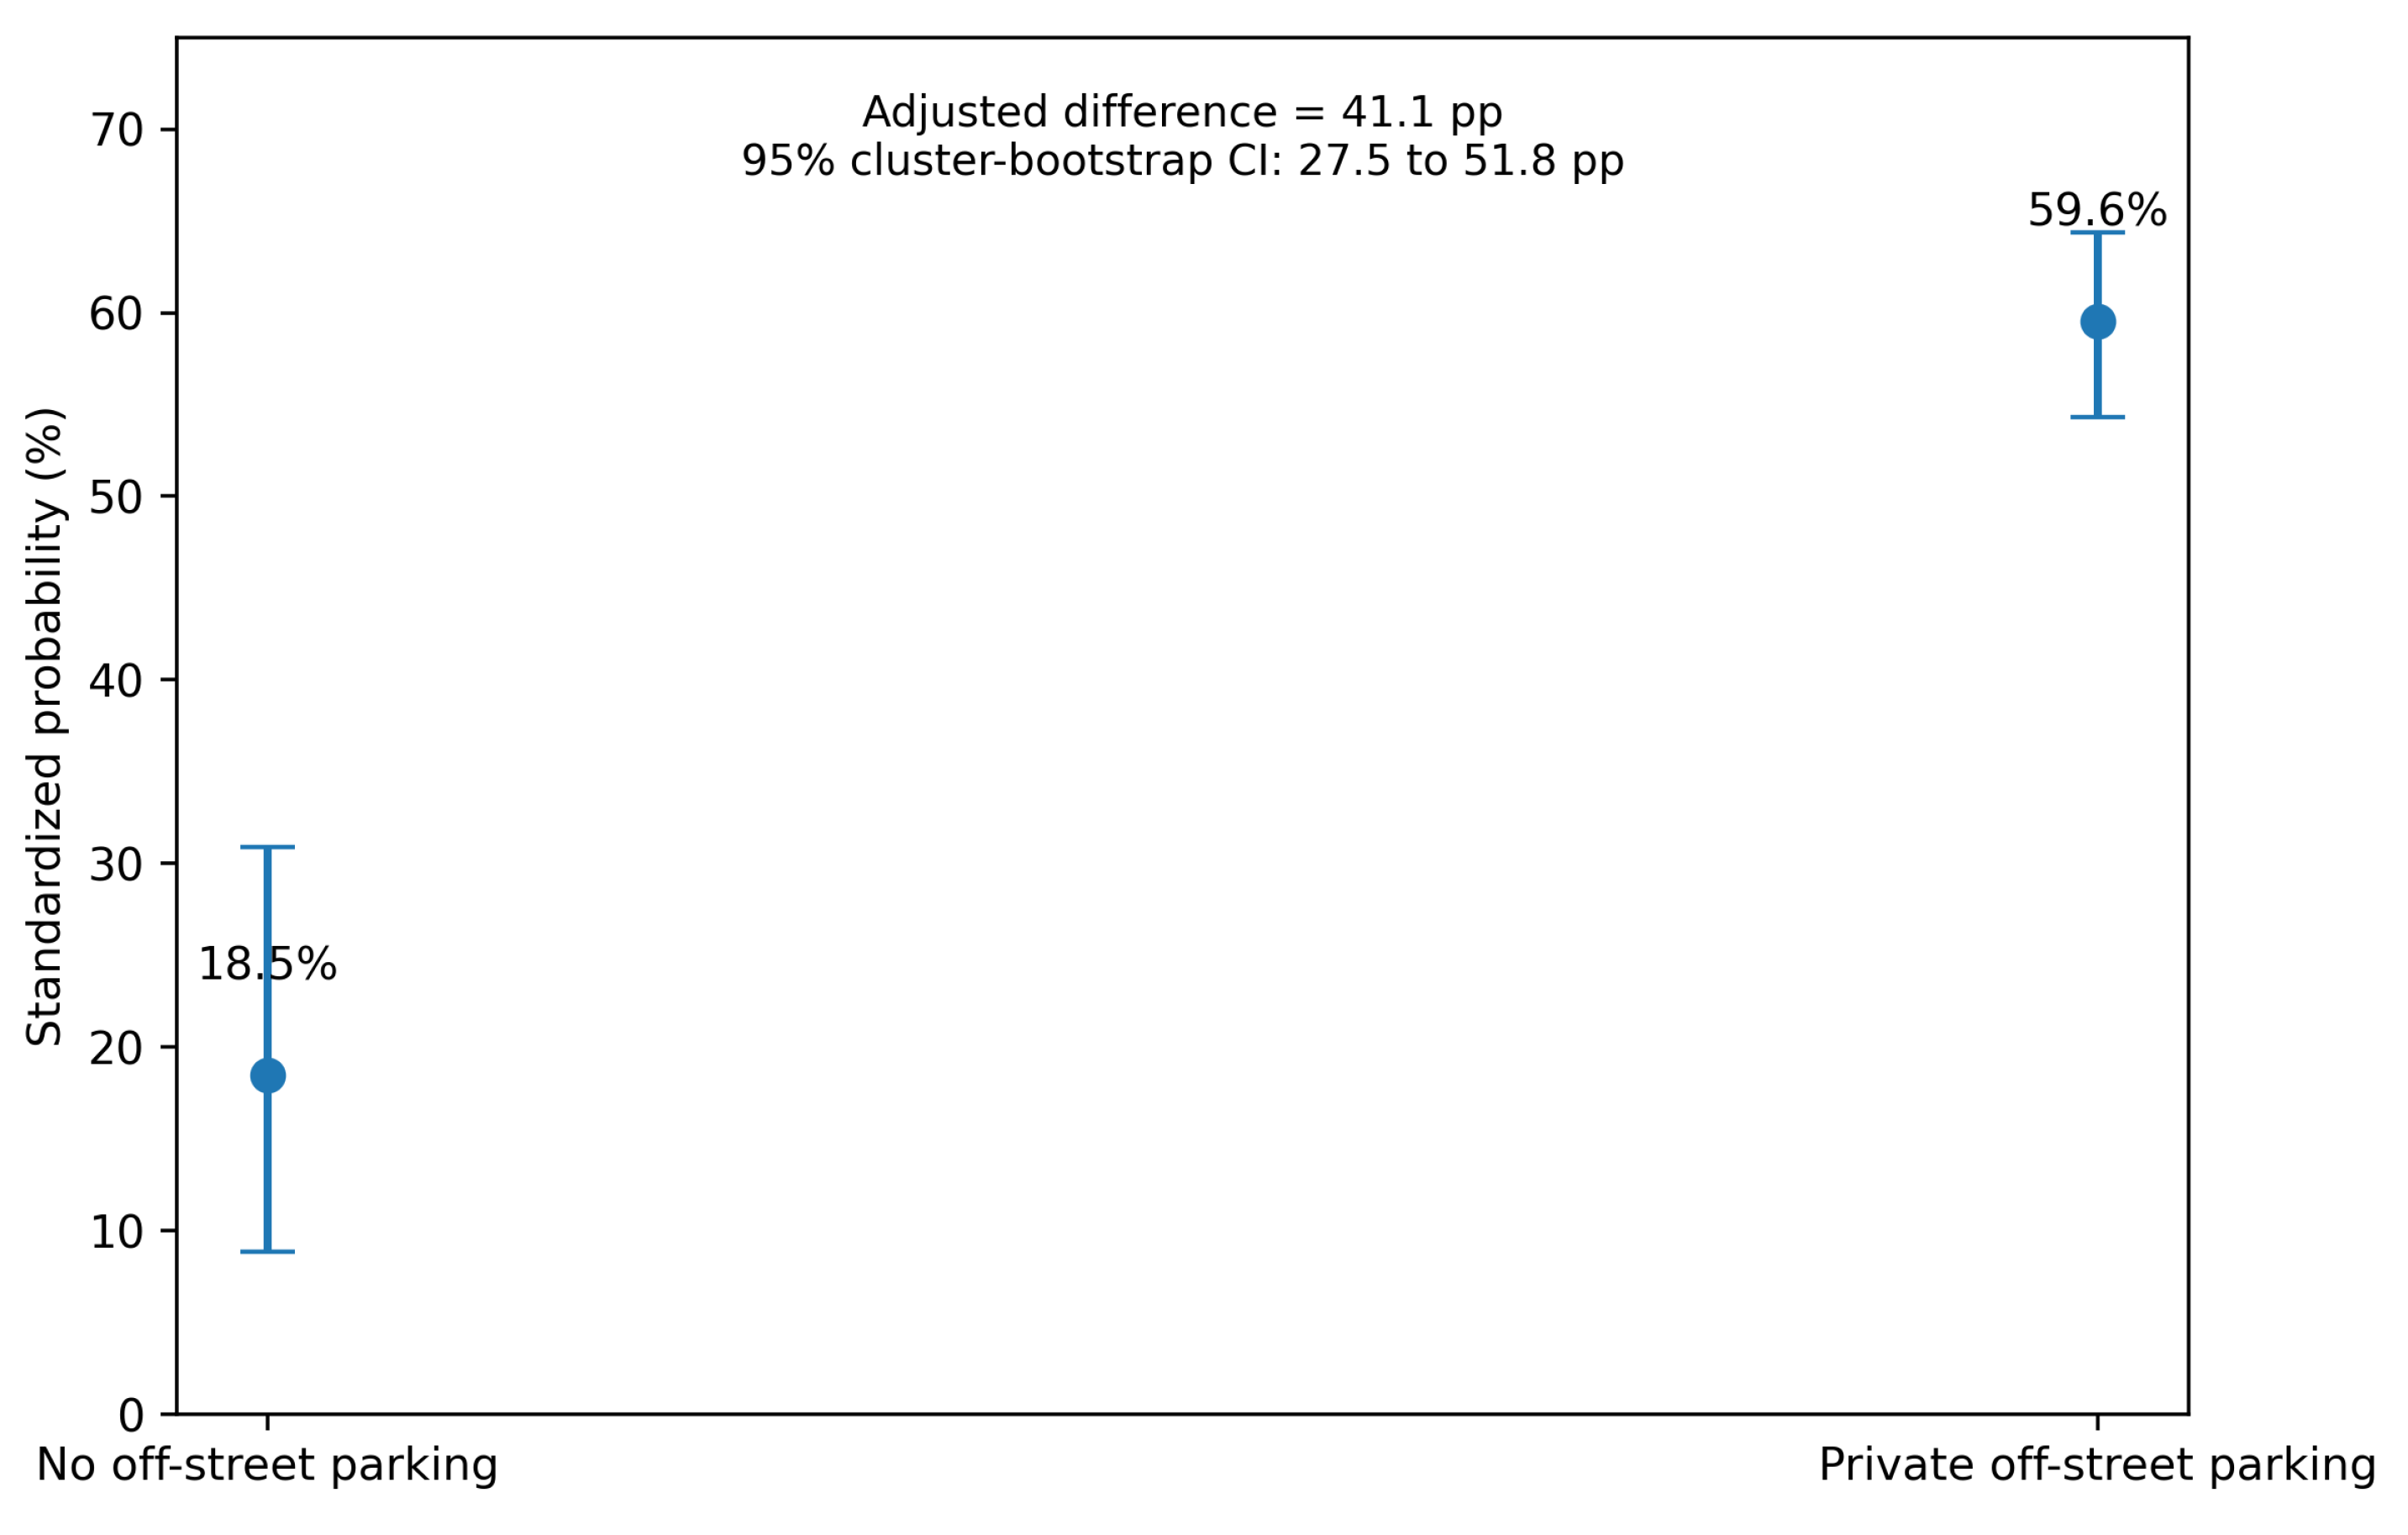
Figure 6.
Exact symmetric probability-scale decomposition of the adjusted parking contrast. Error bars are 95% PSUID-cluster-bootstrap percentile confidence intervals. The conditional-smart interval spans zero and should not be read as evidence of equivalence.
Figure 6.
Exact symmetric probability-scale decomposition of the adjusted parking contrast. Error bars are 95% PSUID-cluster-bootstrap percentile confidence intervals. The conditional-smart interval spans zero and should not be read as evidence of equivalence.
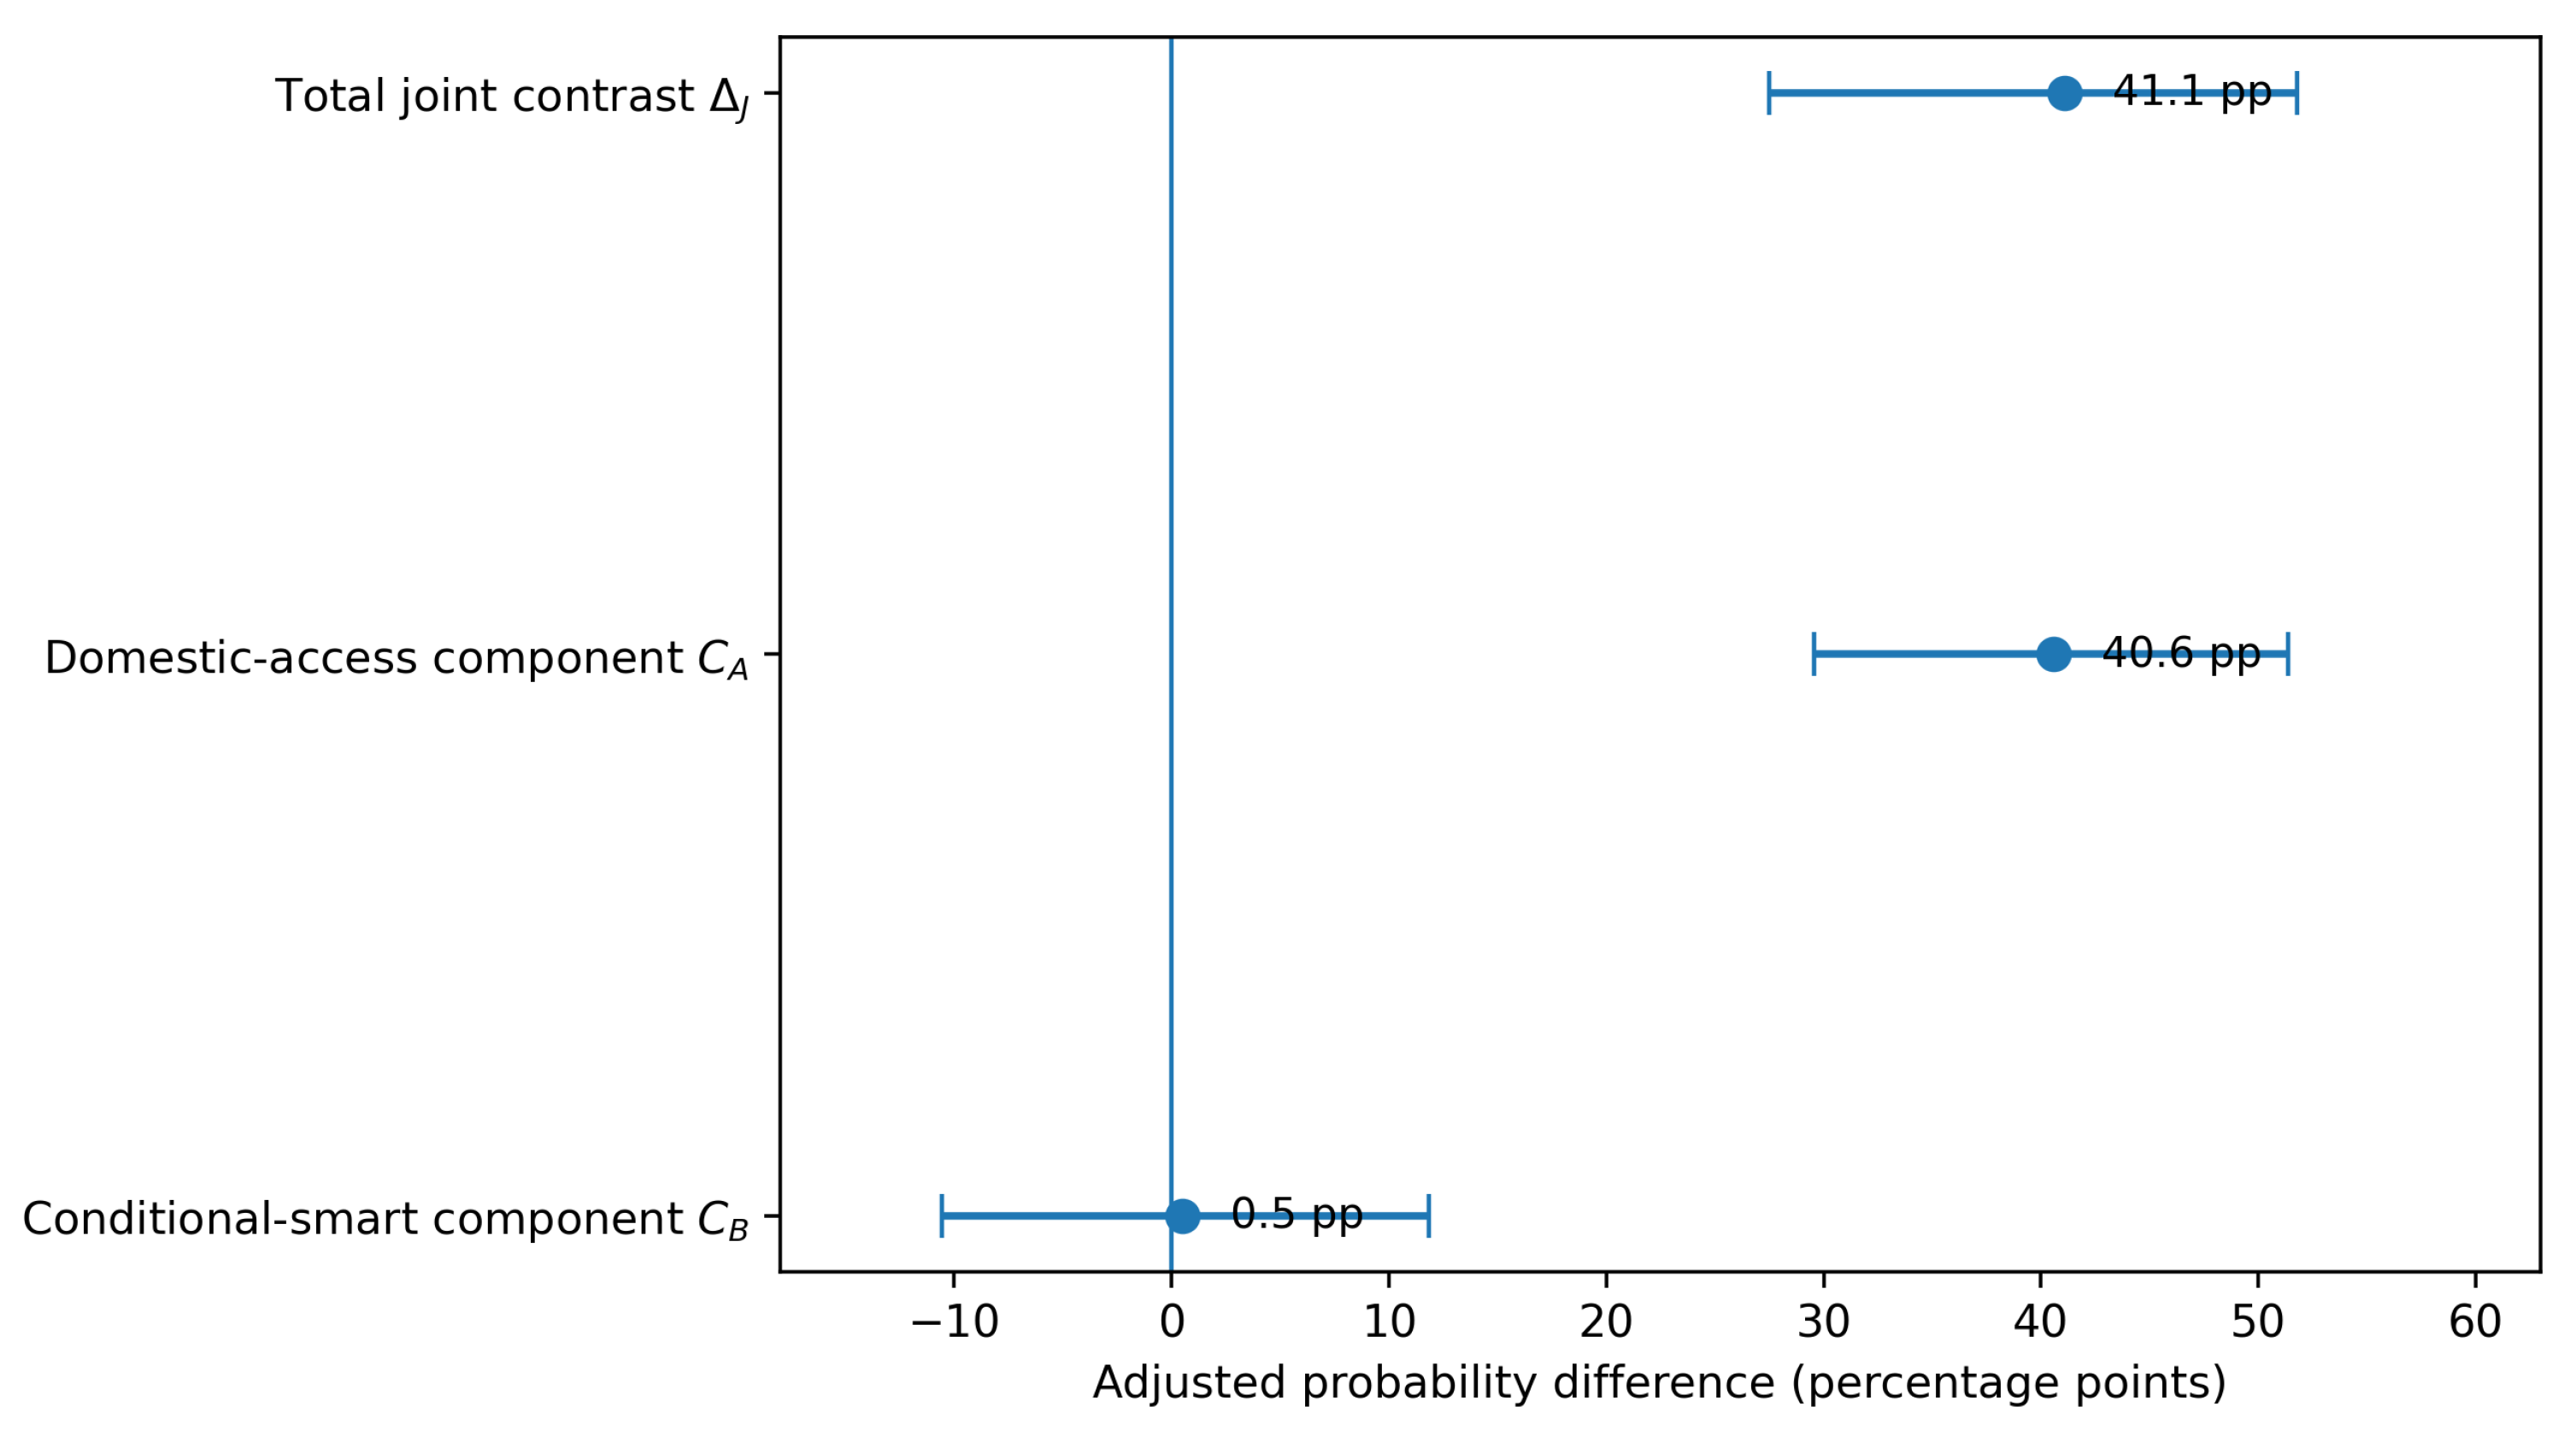
Figure 7.
Sensitivity of the adjusted joint smart-capable domestic-access contrast. Confidence intervals are shown where a directly comparable interval was available. The dashed line marks the primary sequential estimate.
Figure 7.
Sensitivity of the adjusted joint smart-capable domestic-access contrast. Confidence intervals are shown where a directly comparable interval was available. The dashed line marks the primary sequential estimate.
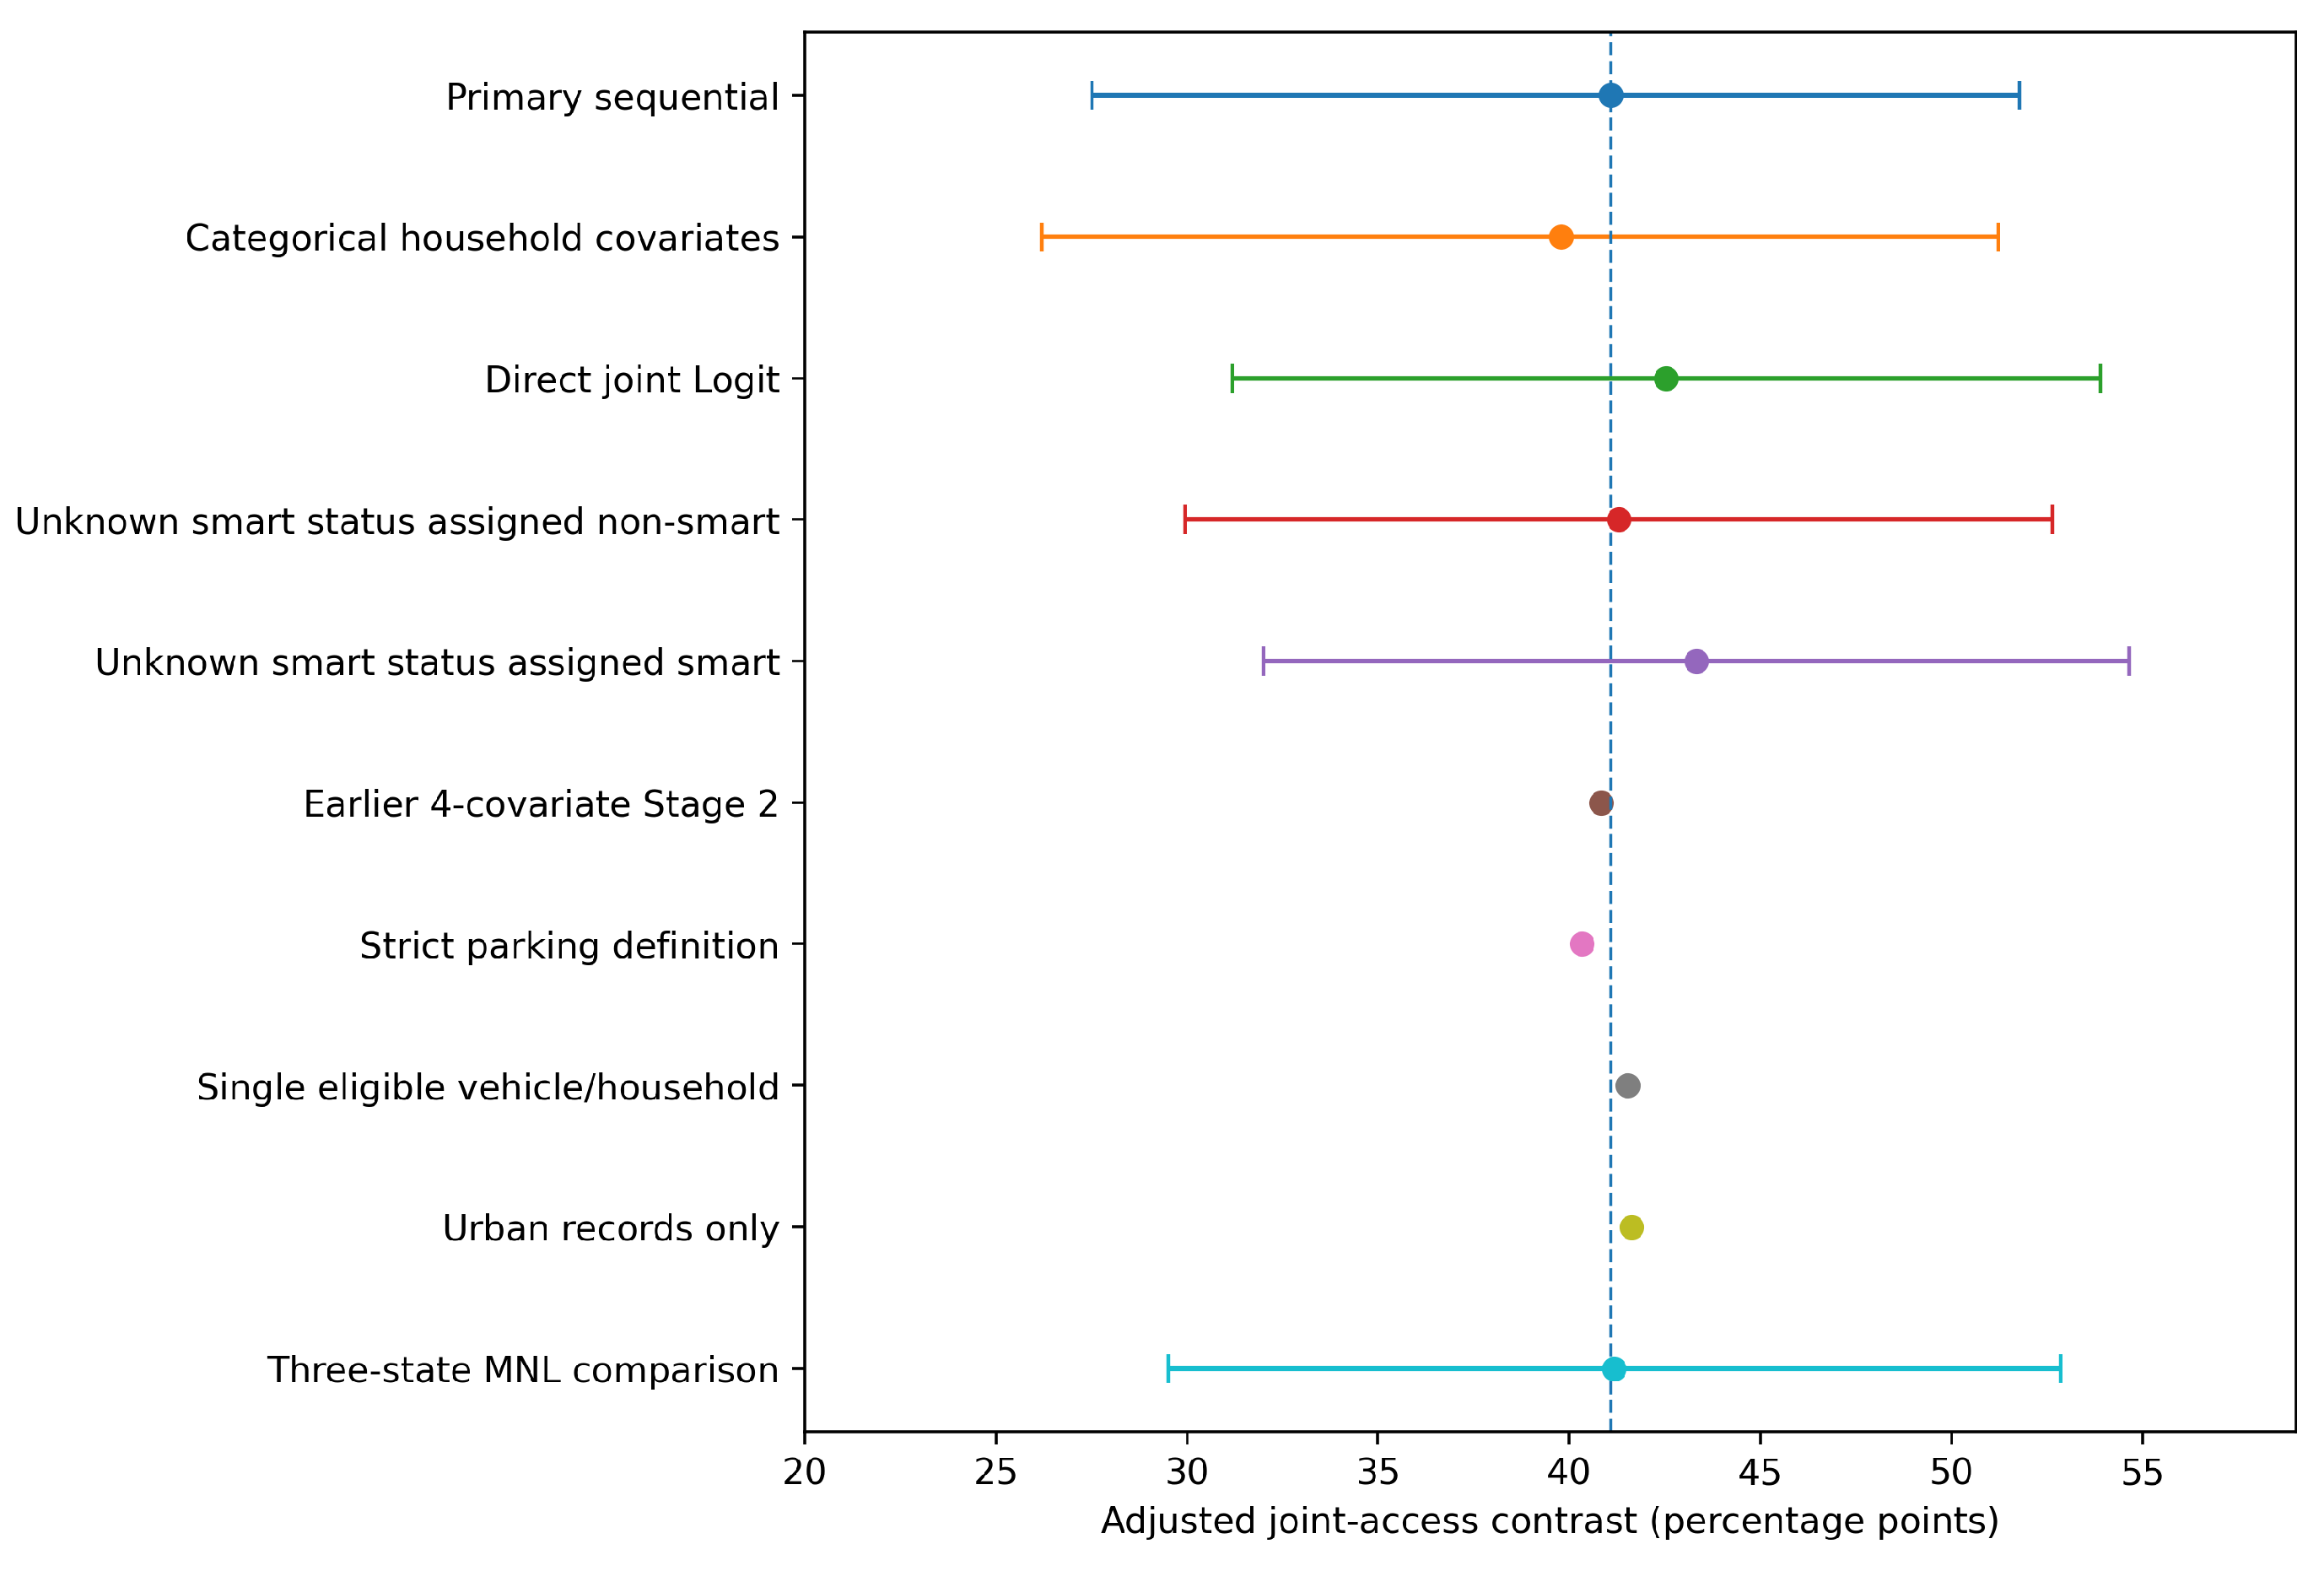

Table 1.
Positioning relative to selected closely related evidence.
| Study | Population / setting | Primary outcome | Relationship to the present study |
|---|---|---|---|
| Guerra and Daziano [4] | Prospective urban EV consumers, USA | EV purchase preferences | Links residential parking to pre-adoption EV preferences; our outcome is post-adoption infrastructure. |
| Kristoffersson et al. [8] | Private-car buyers, Sweden | Propensity to buy a chargeable car | Relates private and public charging to adoption; our sample already contains plug-in vehicles. |
| Pezeshknejad et al. [6] | Household survey, USA | EV adoption and home-charging barriers | Quantifies rental and parking barriers motivating our domestic-access stage. |
| Malabanan et al. [16] | International literature | Charging disadvantage / accessibility | Provides the charging-equity framework for our two-stage access measure. |
| Sica et al. [39] | Urban charging-choice survey, Europe | Preferences among charging locations | Models charging-location choice; our outcome is observed residential infrastructure. |
| Philip and Whitehead [22] | EV stated-preference survey, Australia | Willingness to adopt smart charging | Models smart-charging adoption preferences after access to compatible equipment. |
| de Graaf et al. [23] | EV users, Netherlands | Smart-charging intention / acceptance | Links home-charging opportunity to smart-charging engagement. |
| BEIS/DG Cities [36] | Just over 1,000 EV drivers, UK | Charging technology and attitudes/use | Provides a national policy baseline; our study adds adjusted two-stage standardization. |
| DfT NTSQ09075 [35] | Plug-in vehicle owners, England | Domestic charging-device ownership | Provides official descriptive reporting for our Stage-1 NTS domain. |
| Present study | Plug-in vehicle records, England NTS 2024 | Joint reported domestic + smart status | Uses W3-weighted two-stage standardization and exact probability-scale decomposition. |
Note: BEIS, former UK Department for Business, Energy and Industrial Strategy; DfT, Department for Transport; EV, electric vehicle; NTS, National Travel Survey; UK, United Kingdom; USA, United States of America; W3, NTS household interview-sample weight.
Table 2.
Notation used in the two-stage model.
| Symbol | Meaning |
|---|---|
| Reported domestic chargepoint access for vehicle record i. | |
| Reported smart status, observed only when . | |
| Private off-street parking indicator. | |
| Frozen vector of five household covariates. | |
| NTS interview-sample weight W3. | |
| Primary sampling unit containing record i. | |
| Model-predicted Stage-1 and Stage-2 probabilities after setting parking to p. | |
| Model-predicted joint smart-capable domestic-access probability. |
Table 3.
Analytical samples used in the two-stage framework.
| Stage 1: domestic access | Stage 2: smart status ∣ domestic | |
|---|---|---|
| Analytical N | 478 | 342 |
| PSUs | 349 | 263 |
| Outcome Yes / Smart | 351 | 256 |
| Outcome No / Non-smart | 127 | 86 |
| Private off-street parking, N | 423 | 327 |
| No off-street parking, N | 55 | 15 |
| Urban records, N | 355 | 247 |
| Owner/buyer tenure, N | 441 | 325 |
Table 4.
W3-weighted two-stage Logit models with PSUID-cluster-robust uncertainty.
| Stage 1: domestic access (N=478) | Stage 2: smart status ∣ domestic (N=342) | |||||
|---|---|---|---|---|---|---|
| Predictor | OR | 95% CI | p | OR | 95% CI | p |
| Private off-street parking | 11.20 | 5.64–22.25 | <0.001 | 1.06 | 0.32–3.53 | 0.926 |
| Income quintile | 0.91 | 0.75–1.11 | 0.351 | 1.19 | 0.95–1.50 | 0.128 |
| Urban residence | 0.88 | 0.47–1.64 | 0.678 | 1.34 | 0.73–2.45 | 0.352 |
| Owner/buyer tenure | 2.72 | 1.17–6.29 | 0.020 | 0.80 | 0.20–3.19 | 0.752 |
| Household vehicle count | 1.12 | 0.80–1.56 | 0.506 | 0.61 | 0.43–0.86 | 0.004 |
| Household size | 1.01 | 0.82–1.24 | 0.924 | 1.45 | 1.13–1.85 | 0.003 |
Note: CI, confidence interval; OR, odds ratio; PSUID, NTS primary sampling unit identifier; W3, NTS household interview-sample weight.
Table 5.
Standardized stage probabilities, joint access, and exact decomposition.
| Quantity | Point estimate | 95% bootstrap CI | Interpretation |
|---|---|---|---|
| : domestic access, no off-street | 0.247 | 0.136–0.382 | Stage-1 standardized probability |
| : domestic access, off-street | 0.776 | 0.729–0.820 | Stage-1 standardized probability |
| : smart ∣ domestic, no off-street | 0.762 | 0.538–0.960 | Stage-2 standardized probability |
| : smart ∣ domestic, off-street | 0.771 | 0.720–0.816 | Stage-2 standardized probability |
| : joint access, no off-street | 0.185 | 0.088–0.309 | Joint standardized probability |
| : joint access, off-street | 0.596 | 0.543–0.644 | Joint standardized probability |
| 0.411 | 0.275–0.518 | Total adjusted joint contrast | |
| 0.406 | 0.296–0.514 | Domestic-access component | |
| 0.005 | -0.106–0.119 | Conditional-smart component |
Note: CI, confidence interval.
Table 6.
Model diagnostics and stability assessment for the two-stage framework.
| Panel A. Stage-specific model diagnostics | ||
|---|---|---|
| Diagnostic | Stage 1: domestic access | Stage 2: smart status ∣ domestic |
| Analytical records, N | 478 | 342 |
| Unique households | 449 | 318 |
| Primary sampling units (PSUs) | 349 | 263 |
| Outcome counts | 351 Yes / 127 No | 256 Smart / 86 Non-smart |
| Non-off-street records | 55 | 15 (11 Smart / 4 Non-smart) |
| Design-matrix rank | 7/7 (full rank) | 7/7 (full rank) |
| Model convergence | Yes | Yes |
| Finite coefficients and cluster-robust covariance | Yes | Yes |
| Complete separation detected | No | No |
| In-sample fitted-probability range | 0.092–0.903 | 0.209–0.941 |
| Panel B. Stability of the adjusted joint smart-capable access contrast | ||
| Analysis | Adjusted contrast (pp) | Role in the robustness assessment |
| Primary sequential model | 41.1 | Prespecified reference estimand |
| Categorical household covariates | 39.8 | Functional-form sensitivity (95% CI 26.2–51.2) |
| Resampled standardization target | 41.1 | Target-distribution sensitivity (95% CI 27.5–51.8) |
| Direct joint-outcome Logit | 42.5 | Independent outcome formulation |
| Unknown smart status assigned non-smart | 41.3 | Lower extreme missing-status stress test |
| Unknown smart status assigned smart | 43.3 | Upper extreme missing-status stress test |
| Earlier four-covariate Stage-2 model | 40.8 | Alternative Stage-2 adjustment set |
| Strict parking coding | 40.3 | Alternative exposure definition |
| Single-eligible-vehicle households | 41.5 | Household-composition sensitivity |
| Urban-only sample | 41.6 | Urban-context sensitivity |
| Earlier three-state multinomial model | 41.2 | Historical alternative characterization |
Note: Stage-specific diagnostics were checked before calculation of the revised joint estimand. Fitted-probability ranges refer to the in-sample probabilities from each fitted Logit stage, not to the standardized and quantities. The primary PSU-cluster bootstrap produced 2,000/2,000 valid replicates; the 95% percentile CI for the 41.1-percentage-point primary contrast was 27.5–51.8 points. The two additional pre-submission checks were defined and executed after the frozen primary analysis and are reported as sensitivities. Stage 2 contains only 15 non-off-street records, so its parking coefficient and the conditional-smart decomposition component remain imprecise despite stability of the total joint contrast. CI, confidence interval; pp, percentage points; PSU, primary sampling unit.
Disclaimer/Publisher’s Note: The statements, opinions and data contained in all publications are solely those of the individual author(s) and contributor(s) and not of MDPI and/or the editor(s). MDPI and/or the editor(s) disclaim responsibility for any injury to people or property resulting from any ideas, methods, instructions or products referred to in the content. |
© 2026 by the authors. Licensee MDPI, Basel, Switzerland. This article is an open access article distributed under the terms and conditions of the Creative Commons Attribution (CC BY) license (http://creativecommons.org/licenses/by/4.0/).
Copyright: This open access article is published under a Creative Commons CC BY 4.0 license, which permit the free download, distribution, and reuse, provided that the author and preprint are cited in any reuse.