

Submitted:
02 September 2026
Posted:
03 September 2026
You are already at the latest version
Abstract
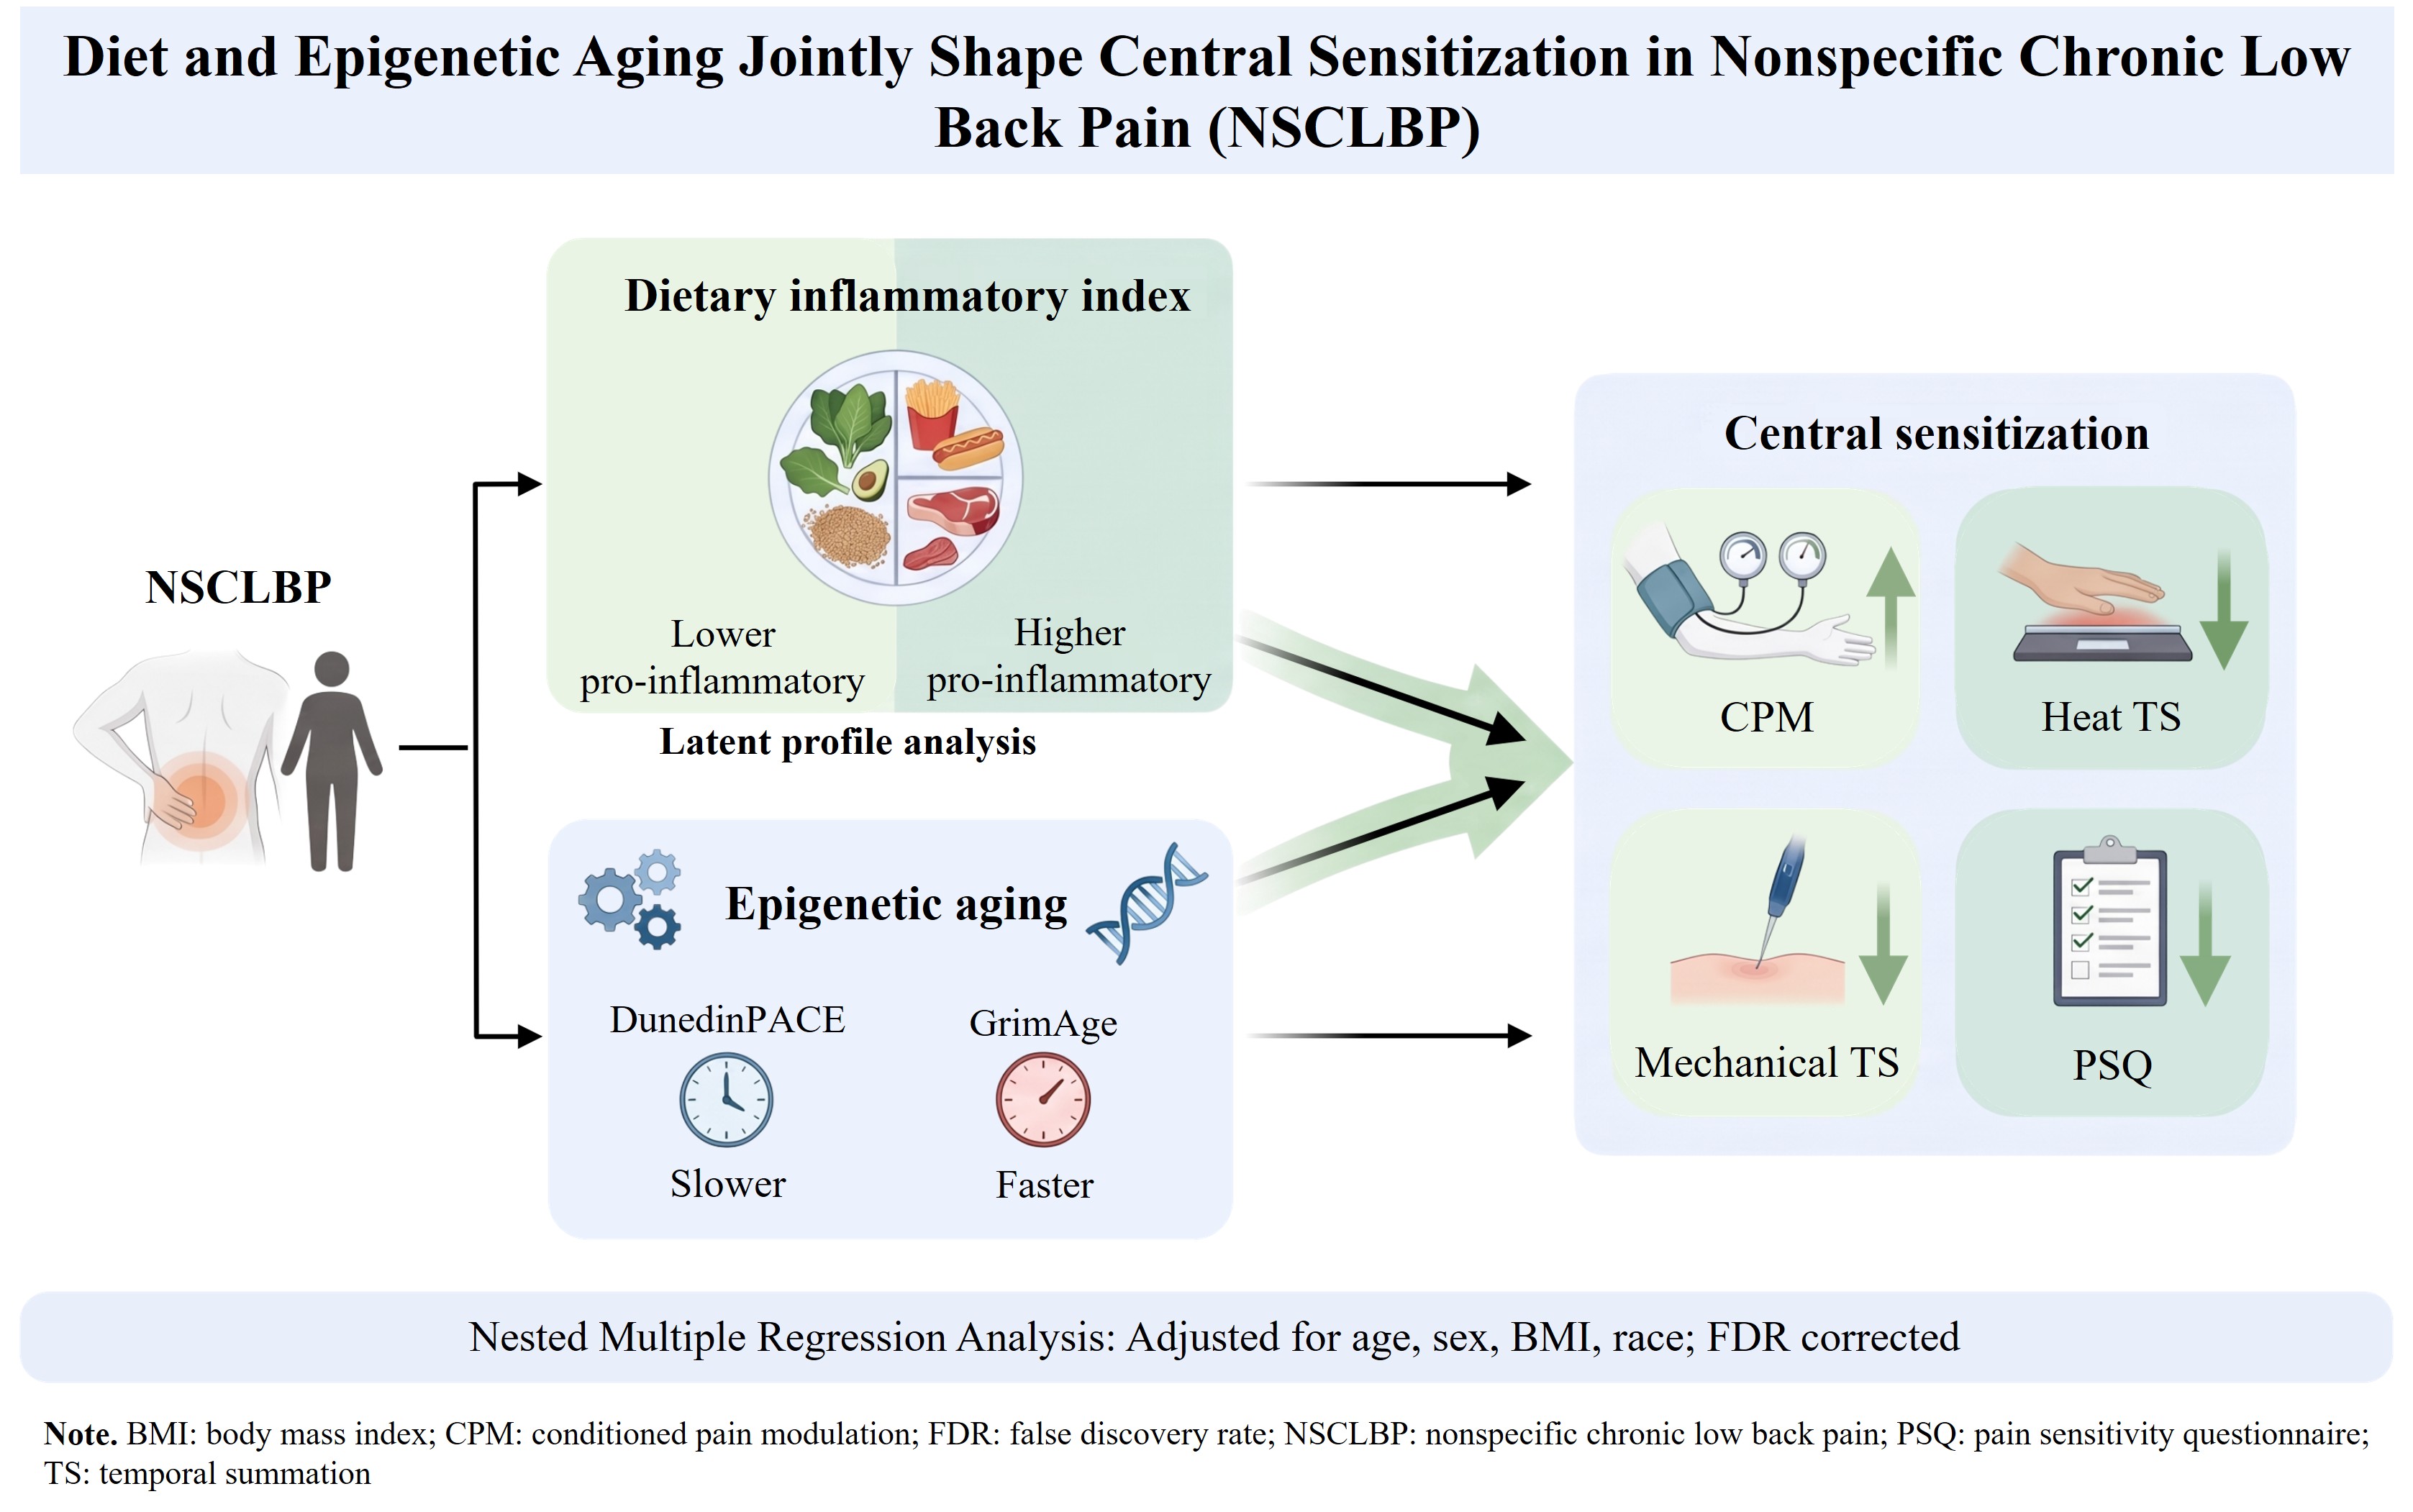
Nonspecific chronic low back pain (NSCLBP) is associated with central sensitization, and both diet quality and epigenetic aging are proposed modifiable, mechanistic contributors to this process. We examined how dietary profiles and epigenetic aging affect central sensitization in NSCLBP. Participants completed dietary, epigenetic aging (DunedinPACE, GrimAge), and central sensitization indicators, including conditioned pain modulation (CPM), heat and mechanical temporal summation (TS), and pain sensitivity questionnaire (PSQ). Dietary profiles were derived from latent profile analysis of dietary inflammatory index components. Nested regression models examined how dietary profiles and epigenetic aging predict central sensitization, adjusting for age, sex, BMI, and race, followed by Benjamini-Hochberg’s false discovery rate correction. We included 200 adults with NSCLBP: mean age 44 years; 62% African American; 55% female; mean BMI 31.33 kg/m². Five tests remained significant after Benjamini-Hochberg correction. DunedinPACE acceleration increased PSQ (β = 2.936, raw p = .034, FDR p = .034), GrimAge acceleration decreased mechanical TS (β = -0.270, raw p = .008, FDR p = .016). Increased low pro-inflammatory diet increased CPM only after accounting for DunedinPACE (β = 49.788, SE = 15.433, raw p = .002, FDR p = .013) and GrimAge (β = 52.685, SE = 15.281, raw p = .001, FDR p = .013). Increased low pro-inflammatory diet decreased heat TS facilitation in the GrimAge-adjusted model (β = -22.028, SE = 8.270, raw p = .009, FDR p = .049). Diet and epigenetic aging jointly, rather than independently, shape central pain processing in NSCLBP, suggesting protective effects of healthier diets.
Keywords:
chronic low back pain
; central sensitization
; precision nutrition
; DunedinPACE
; GrimAge
; dietary inflammatory index
; conditioned pain modulation
; temporal summation
; latent profile analysis
1. Introduction
Nonspecific chronic low back pain (NSCLBP) constitutes approximately 90% of all chronic low back pain (CLBP) cases and is distinguished by the absence of an identifiable pathoanatomical cause. [1,2,3]. Therefore, to mechanistically understand, diagnose, and clinically manage NSCLBP is complex. Central sensitization, a key contributor to this complexity, exhibits a state of amplified pain processing within the central nervous system (CNS), affects about 25% of acute low back pain (LBP) and 43.6% of CLBP individuals [4,5,6]. Central sensitization manifests as pain hypersensitivity, including spontaneous pain, allodynia, hyperalgesia, and widespread sensitivity to sensory stimuli, occurring independent of ongoing peripheral nociceptive input [7,8]. Activity-dependent neuroplastic changes in the CNS activate N-methyl-D-aspartate (NMDA) receptor which triggers and sustains central sensitization through intracellular signaling mechanisms that contribute to persistent NSCLBP severity and disability [9,10]. Central sensitization is assessed through indicators such as patient-reported measures (e.g., pain sensitivity questionnaire, [PSQ]) and quantitative sensory testing (QST), particularly conditioned pain modulation (CPM) and temporal summation (TS). CPM and TS are QST paradigms that probe complementary aspects of endogenous pain processing: CPM reflects the efficiency of descending inhibitory pathways, whereas TS reflects the sensitization of ascending facilitatory pathways [11,12,13,14]. The net balance of pain inhibition and facilitation in the CNS is quantified by applying repeated or concurrent noxious stimuli through these paradigms, which clinically relevant indicators of central sensitization in individuals with NSCLBP. Current pharmacological strategies offer limited efficacy for this central sensitization, underscoring the need for novel mechanistic insights and alternative therapeutic targets [15,16]. This therapeutic gap incites the investigation of non-pharmacologic, modifiable lifestyle factors, and diet quality stands out as a particularly accessible and clinically relevant target for understanding and addressing central sensitization in NSCLBP [5,17].
Diet quality can be quantified using several dietary indices, notably the dietary inflammatory index (DII), a validated tool developed to assess the overall inflammatory potential of an individual’s dietary pattern [18]. DII components were validated against six key inflammatory biomarkers i.e., C-reactive protein, interleukin-1 beta, interleukin-4, interleukin-6, interleukin-10, and tumor necrosis factor-alpha; making it a robust measure of dietary inflammatory potential [18]. Higher DII scores, which reflect a more pro-inflammatory diet, have been associated with increased pain severity, increased pain processing, greater movement-evoked pain, and predictive incidence in adults with NSCLBP [19,20,21,22]. Collectively, these findings suggest that diet quality may influence pain outcomes through mechanisms that extend beyond macronutrient composition or caloric intake alone.
Dietary inflammatory potential has been linked to pain outcomes and central sensitization through several established biological mechanisms, such as epigenetic aging. Epigenetic aging is a modifiable biological process by which cumulative lifestyle and environmental exposures alter gene expression patterns over time, resulting in a biological age that may diverge substantially from chronological age due to DNA modification [23,24]. Anti-inflammatory diets may cause a decreased rate of biological aging and increased healthspan by reducing chronic, low-grade systemic inflammation (called inflammaging) that damages cells and accelerates aging markers [25,26,27]. A decreased rate of biological age is associated with decreased pain severity and interference [1].
Biological age can be assessed through validated epigenetic clocks, such as DunedinPACE and GrimAge by assessing DNA methylation patterns at specific CpG sites that serve as biomarkers of aging. DunedinPACE estimates an individual’s current rate of epigenetic aging across multiple organ systems relative to chronologic age, like a speedometer [28]. In contrast, GrimAge, is a composite epigenetic biomarker that predicts morbidity and mortality risk, derived from DNA methylation surrogates for plasma protein levels and smoking pack-years [29]. GrimAge is one of the strongest epigenetic predictors of lifespan and healthspan, like an odometer. Although distinct, both clocks capture complementary dimensions of aging: DunedinPACE reflects a modifiable, current rate of epigenetic aging and may be more sensitive to recent dietary changes, whereas GrimAge reflects cumulative, long-term morbidity and mortality risk and may better capture the influence of established dietary patterns over time. These epigenetic clocks have been linked to pain outcomes, including greater NSCLBP severity [28,29,30,31].
Epigenetic aging and central sensitization are thought to mutually reinforce one another through shared neuroinflammatory pathways, whereby age-related epigenetic changes dysregulate genes governing glial activation and neuronal excitability, and central sensitization-associated inflammation may subsequently alter epigenetic regulation within the CNS [32,33,34,35]. Notably, anti-inflammatory diets are independently associated with a slower pace of biological aging and increased healthspan in other adult populations, suggesting a plausible pathway through which diet may modulate central sensitization [36,37].
Despite accumulating evidence linking diet quality, epigenetic aging, and central sensitization independently to chronic pain outcomes, to the best of our knowledge, no study has examined whether these factors jointly influence central sensitization in individuals with NSCLBP [1,15,21,31,38,39,40]. This gap represents a critical missed opportunity, as diet quality and pace of epigenetic aging may act synergistically to drive central sensitization. We therefore examined the independent and joint relationships between diet quality, epigenetic aging, and central sensitization among adults with NSCLBP.
We hypothesize that diet quality and epigenetic aging together function as interrelated determinants of central pain processing. Specifically, individuals with poorer diet quality and accelerated epigenetic aging, as reflected by higher DunedinPACE scores and GrimAge acceleration, are expected to exhibit impaired CPM and TS, consistent with greater central sensitization. We further hypothesize that combining diet quality and epigenetic aging will explain a unique variance in CPM beyond the contribution of either predictor alone, and that these associations will persist after adjustment for relevant demographic and clinical covariates.
CPM and TS served as the primary outcomes (indicators) for this study because they directly quantify endogenous pain inhibitory function and pain facilitation respectively, core mechanisms driving central sensitization. Exploratory analyses additionally examined self-reported pain sensitivity as a secondary outcome, providing complementary evidence of the broader relationships among diet quality, epigenetic aging, and central sensitization.
2. Materials and Methods
2.1. Study Participants and Setting
Data were collected as part of two cross-sectional studies R01AR079178 and R01MD010441, which evaluated psychosocial, epigenetic, and gene expression drivers of NSCLBP disparities called ERASED (Examining Racial, Socioeconomic, and Genomic Disparities). This study is a secondary analysis of data from ERASED project. The ERASED study was a single-site study conducted at the University of Alabama at Birmingham (UAB), from June 2018 to July 2024. It recruited community-dwelling non-Hispanic Black (NHB) and non-Hispanic White (NHW) adults with and without NSCLBP. The study protocol was reviewed and approved by UAB’s Institutional Review Board (IRB-170119003). Further details on this study have been published elsewhere [41].
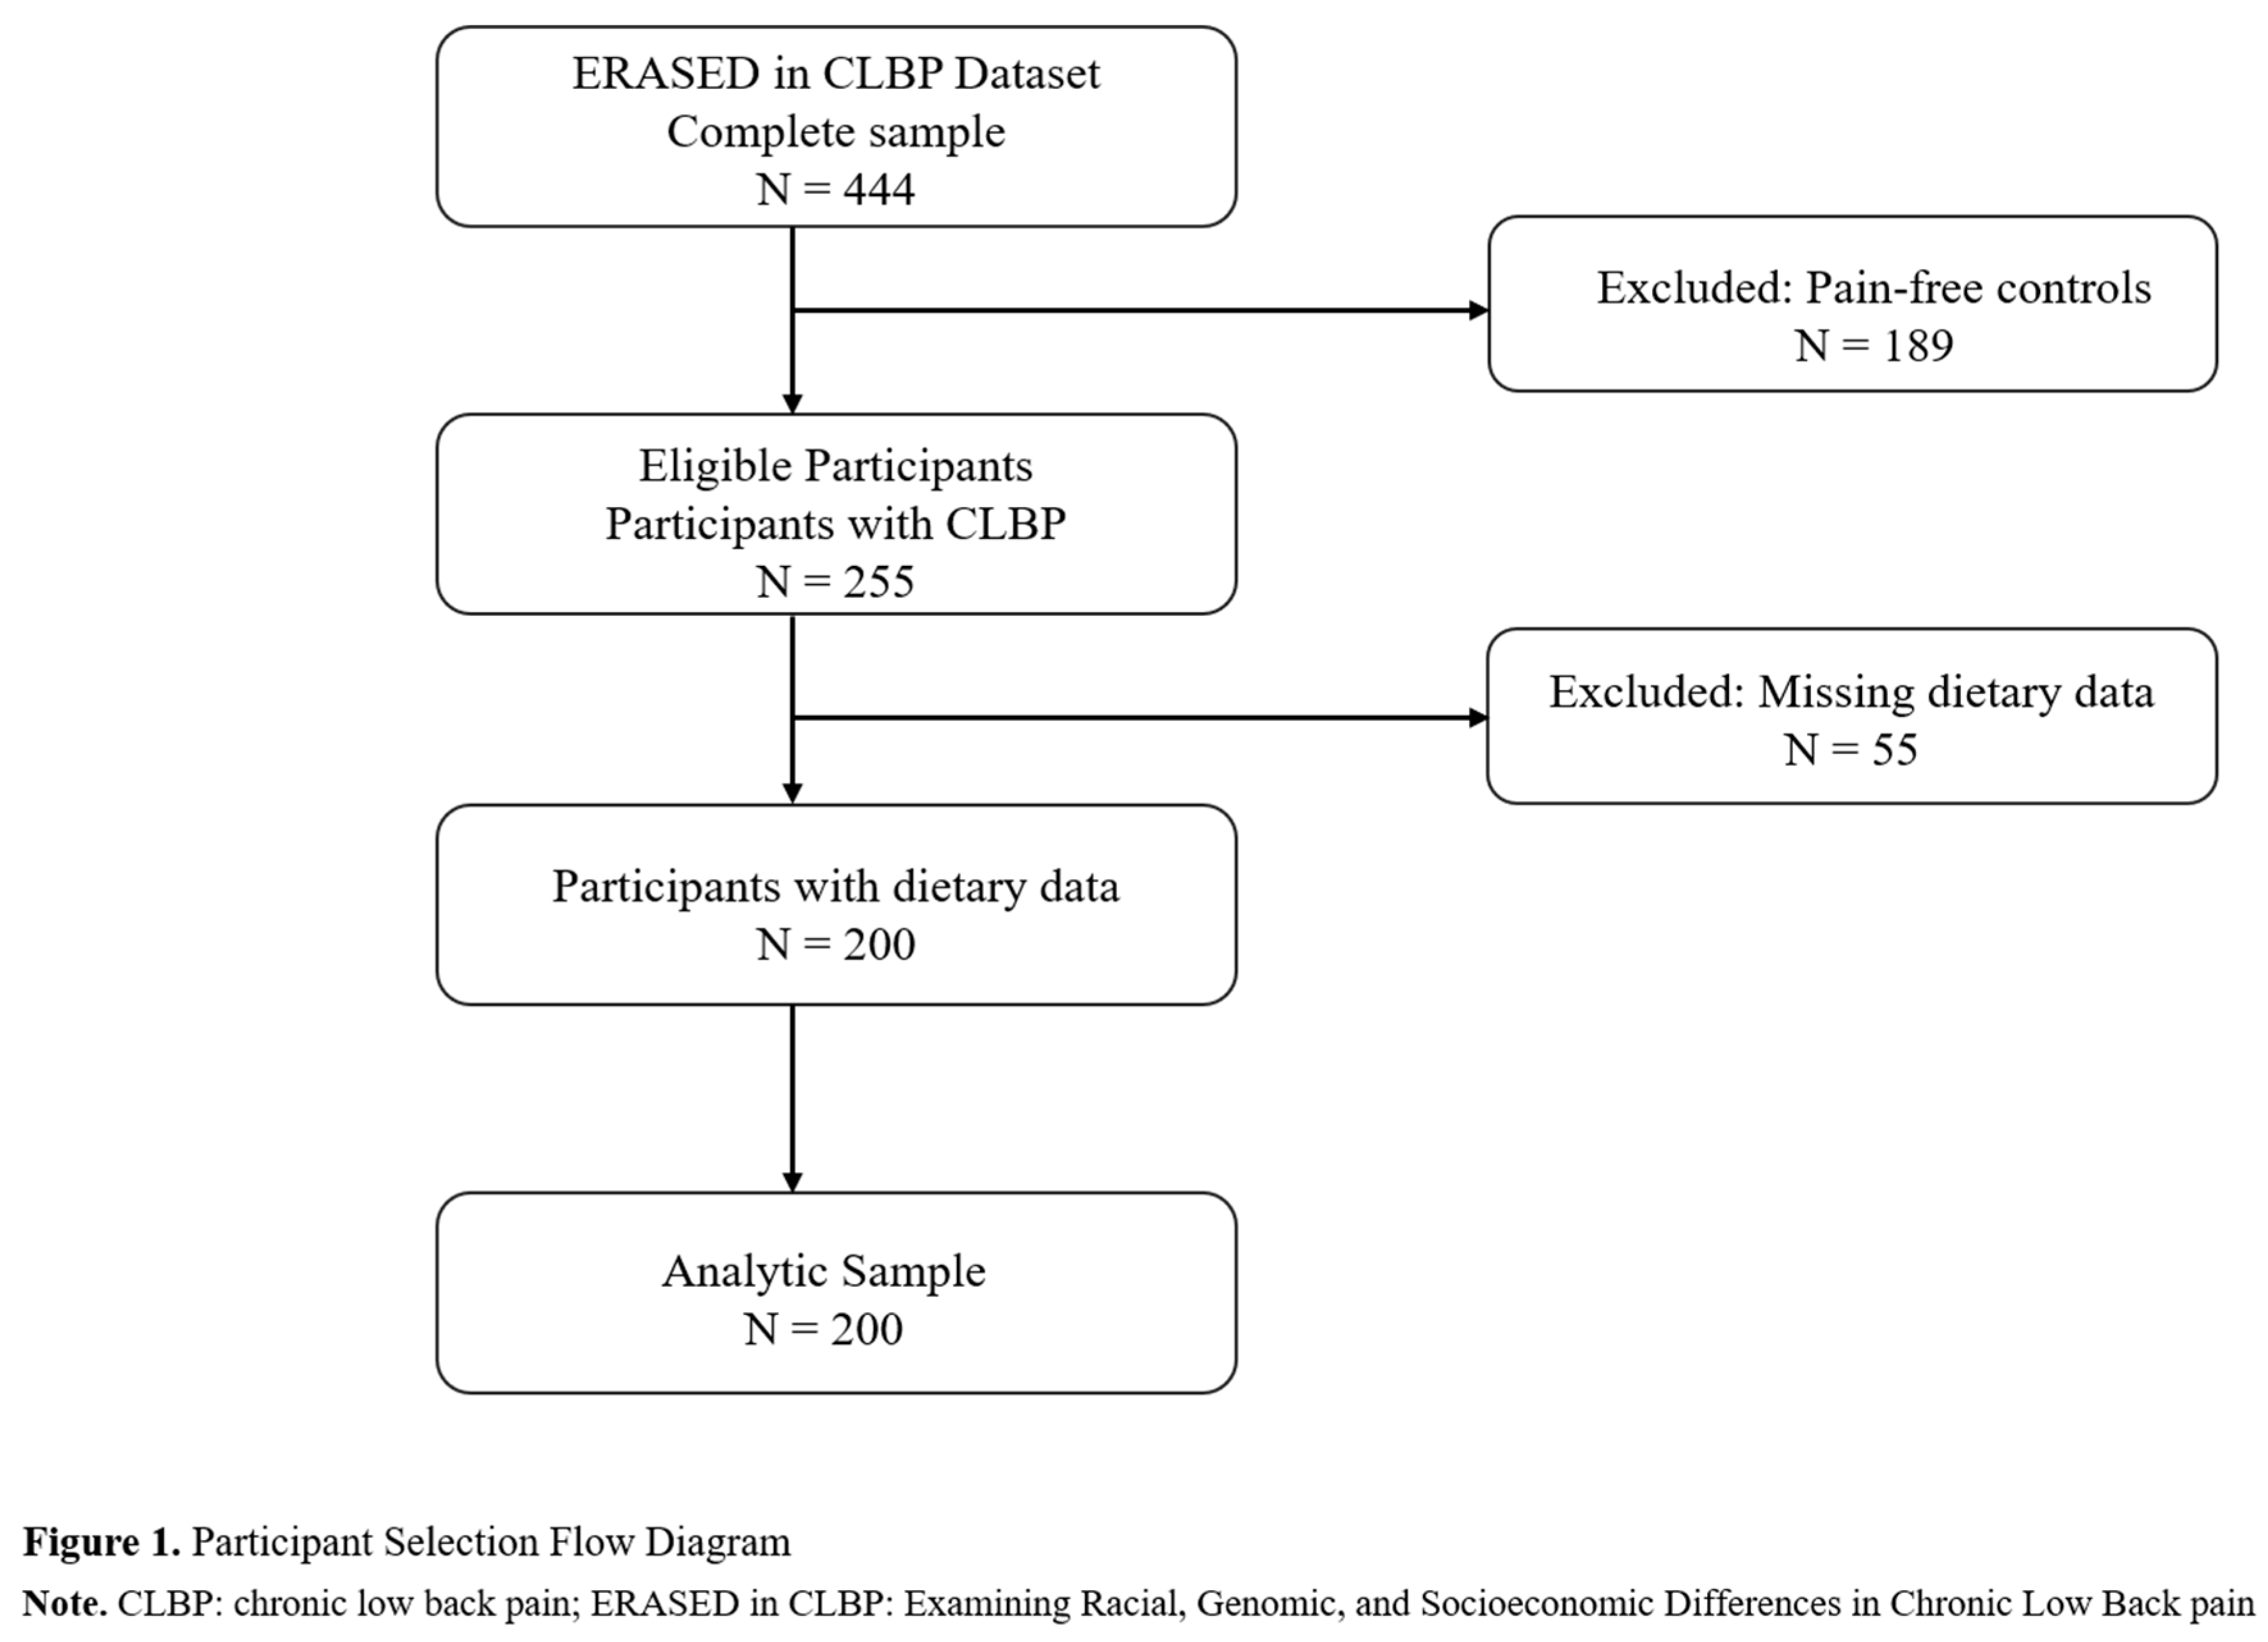
Briefly, participants were recruited in Birmingham, Alabama area including referrals from pain clinics via convenience and snowball sampling; a $10 incentive was offered for successful referrals [42]. Eligible participants were NHB or NHW adults aged 18-85 years, who reside in Alabama, with NSCLBP for ≥3 months, and proficient in spoken and written English. Pain-free controls (PFCs) with comparable demographic characteristics but no NSCLBP were also enrolled. Exclusion criteria included: (1) LBP secondary to infection, trauma, malignancy, or ankylosing spondylitis; (2) systemic infection; (3) chronic inflammatory disease; (4) poorly controlled diabetes; (5) systemic rheumatic disease (e.g., rheumatoid arthritis, systemic lupus erythematosus, fibromyalgia); (6) uncontrolled hypertension (systolic >150 mmHg and/or diastolic >90 mmHg); (7) pregnancy; and (8) neurological disorders [30,41]. These conditions were excluded given their potential to independently affect dietary patterns and biological aging, thereby confounding study outcomes [43]. This analysis included participants with NSCLBP who had complete dietary data (Figure 1). PFCs were excluded, as central sensitization reflects altered pain processing and is therefore not applicable in the absence of pain [44,45,46].
2.2. Measures
2.2.1. Sociodemographic
Participants self-reported sociodemographic characteristics, including age, sex (male/female), race (NHB or NHW), education level, after-tax household income, employment status, and marital status.
2.2.2. Dietary Intake Assessment: Dietary Inflammatory Index
Dietary intake was assessed using two 24-hour dietary recalls, administered on non-consecutive days (one week apart) to better capture habitual intake and account for within-person day-to-day variability This is consistent with recommendations from the European Food Safety Authority (EFSA) and United States Department of Agriculture (USDA) dietary surveillance protocol, since the EFSA has suggested that European Union countries implement the two 24-hour diet recall method for national dietary surveys [47]. This design supports estimation of usual intake and separation of within-person from between-person variability since collecting a recall for at least two non-consecutive days allows application of statistical techniques to estimate usual dietary intake distributions [48]. Trained research assistants (TRAs) administered dietary recalls using a multiple-pass interview structure. In the first pass, participants listed all foods and beverages consumed; TRAs then probed for additional detail through targeted follow-up questions (e.g., preparation method, bread type) to elicit a comprehensive report. For each item, TRAs recorded time of day, source, and portion size, using standardized food models and measuring guides (e.g., household measures, portion-size visual aids) to support accurate quantification, a technique shown to improve portion-size estimation and reduce recall error [47].
Reproducibility was also supported by using two 24-hour recalls, since at least two non-consecutive recall days permit estimation of usual intake distributions. The recalls were entered into the Nutrition Data System for Research (NDSR), version 2023 (University of Minnesota, Minneapolis, MN), which generated detailed dietary reports used to compute DII scores [49]. An average of the two 24-hour recalls was used to calculate the mean DII scores which improved accuracy and better captured habitual intake [21].
The DII, developed by Shivappa et al. [18], quantifies dietary inflammatory potential based on up to 45 food parameters (minimum 25 required for analysis), with scores ranging from -8.87 (maximally anti-inflammatory) to +7.98 (maximally pro-inflammatory); higher scores indicate greater pro-inflammatory potential. In this study, DII scores were derived from 31 dietary variables that included energy; macronutrients (carbohydrate, protein, total fat), lipid components (cholesterol, saturated fat, trans fat, monounsaturated fatty acids, polyunsaturated fatty acids, omega-3 fatty acids, and omega-6 fatty acids); vitamins A, C, D, E, thiamin (B1), riboflavin (B2), niacin (B3), pyridoxine (B6), cobalamin (B12), folate, folic acid, β-carotene, minerals (magnesium, iron, zinc, and selenium); calories, caffeine, isoflavones, fiber, and alcohol. Although controversies exist with respect to DII use, it is among the most widely used measures of dietary inflammatory potential. Its validity is supported by meta-analytic and primary study evidence and reliability displayed by its association with elevated high-sensitivity C-reactive protein in a Japanese cohort [20,50,51,52].
2.2.3. Epigenetic Age Measures
Peripheral venous blood was drawn from the antecubital vein, and genomic DNA was isolated following previously published procedures [53]. Briefly, DNA was extracted from the buffy coat using the Puregene Kit (Qiagen), quantified via NanoDrop, and standardized to 50 ng/µL before shipment to the University of Minnesota Genomics Center for DNA methylation assessment using the Infinium MethylationEPIC v2.0 BeadChip (Illumina), which interrogates >935,000 CpG sites. Samples were scanned on the Illumina iScan system following standard quality control procedures. Raw methylation data were processed in minfi (v1.48.0) using the EPICv2 manifest and quantile-normalized via preprocessQuantile [54,55]. Beta values, together with age and sex, were used to compute DunedinPACE and GrimAge acceleration, i.e., GrimAge score regressed on chronologic age. Epigenetic age was estimated using GrimAge (via the Horvath lab’s online DNA methylation age calculator) and DunedinPACE (via the DunedinPACE R package, v0.99.0, using default EPICv2 probe requirements) [28,29]. All estimates were adjusted for sex and chronological age.
2.2.4. Experimental Central Sensitization Indicators: Quantitative Sensory Testing
Dynamic QST measures i.e., CPM and TS were assessed at participants’ first in-person visit in a quiet room [45,56,57]. Testing was done at two sites, i.e., the forearm and lumbar region, with order determined by a coin toss (heads = forearm, tails = lumbar). TRAs seated participants upright for forearm measures and positioned them prone for lumbar measures. Participants first listened to a recorded overview of the testing process, followed by site-specific instructions from the TRAs before each test. Detailed description of these tests have been published elsewhere [39].
2.2.4.1. Conditioned Pain Modulation
Baseline Pressure Pain Threshold: The handheld pressure algometer (Medoc, Ltd., AlgoMed, Ramat Yishai, Israel) was applied to the lumbar region or dorsum of the non-dominant forearm, to determine the participant’s baseline pressure pain threshold (PPT). Applied algometer pressure was steadily increased at 30 kilopascals per second (kPa/s). Participants indicated when the increasing pressure stimulation first became painful by pressing a button on a handheld device. The baseline PPT was recorded in kilopascals (kPa). We repeated the procedure three times, and calculated the average of the three readings as the baseline PPT.
Conditioned Pain Modulation: After obtaining baseline PPT, CPM was assessed using a sequential heterotopic noxious conditioning stimulation paradigm, with algometry as the test stimulus and noxious cold water as the conditioning stimulus [58]. Participants removed jewelry and wristwatches from their non-dominant hand and immersed it up to the wrist, in a refrigerated water bath (ARCTIC A25, ThermoFisher Scientific, USA) maintained at 12 °C for 60 seconds. Participants could withdraw their hand if pain became unbearable, although no participant did so before the 60 seconds duration. Immediately after immersion, the handheld algometer was reapplied to the lumbar or forearm region, depending on the site being assessed, and participants again indicated when pressure became painful. This procedure was repeated twice, with a two-minute rest between trials, and the average pressure was calculated as the conditioned PPT. A CPM score was then calculated using Formula (1) below:
% Change in CPM = [(Conditioned PPT – Baseline PPT) / Baseline PPT] x 100
A positive percent change in CPM score reflects efficient pain modulation, meaning endogenous pain inhibition reduces test-stimulus painfulness, reflecting decreased central sensitization. A negative or zero percent change indicates deficient pain modulation, meaning absent inhibition, reflecting increased central sensitization. The forearm was used to assess CPM in this study to avoid confounding this central inhibitory measure with local or peripheral sensitization already present at the NSCLBP site. Since CPM is centrally mediated, it is expected to manifest similarly across body regions when descending inhibition is intact [13].
2.2.4.2. Temporal Summation
Heat-Induced TS: Heat-induced TS was assessed by applying heat pulses to one body site (lumbar or forearm) at three intensities: 44 °C, 46 °C, and 48 °C using the TSA-II Analyzer (Medoc Ltd., Ramat Yishai, Israel). A single initial pulse at 44 °C was applied first, with participants rating pain on a 0-100 scale (0 = no pain; 100 = most intense pain imaginable). Five consecutive pulses were then delivered at 46 °C and 48 °C, at both sites, with pain rated after each. The TS index was calculated as the difference between the highest pain rating across the five pulses at each intensity and the initial 44 °C rating [59]. Larger differences indicate greater pain facilitation and potential central sensitization, while smaller differences suggest its absence. The lumbar 48 °C measure was used to assess heat TS in this study, as it reliably activates C-fiber-mediated second pain and elicits moderate pain ratings, minimizing floor/ceiling effects and improving within-person reliability [60].
Mechanical TS: Mechanical TS was assessed at the lumbar and forearm using a weighted (256mN and 512mN) pinprick stimulator (MRC Systems, Heidelberg, Germany), applied perpendicularly until the probe fully retracted, creating standardized stimulation [14]. Participants first received a single pinprick contact and rated pain intensity on a 0-100 scale (0 = no pain; 100 = most intense pain imaginable). The stimulator was then applied 10 consecutive times at a rate of one contact per second, and participants rated the greatest pain intensity elicited across the series. The mechanical TS index was calculated as the difference between the two ratings i.e., second minus first [59]. The 256mN pinprick measure at the forearm was used to assess mechanical TS in this study, as it reliably elicits wind-up while remaining below the threshold for tissue injury, consistent with calibrated QST protocols [14].
2.2.5. Psychometric Central Sensitization Indicator: Pain Sensitivity Questionnaire
The PSQ is a validated 17-item self-report instrument developed by Ruscheweyh et al. to assess central sensitization by quantifying perceived pain intensity in response to imagined everyday stimuli [11,61]. Each item is rated on an 11-point scale from 0 (“not painful”) to 10 (“worst pain imaginable”). Consistent with the original validation study, three items (5, 9, and 13) describing non-painful stimuli were excluded from scoring. Two seven-item subscales were derived from the remaining 14 items: PSQ-minor (items 3, 6, 7, 10, 11, 12, 14) - responses to mildly painful stimuli, and PSQ-moderate (items 1, 2, 4, 8, 15, 16, 17) - responses to moderately painful stimuli. PSQ-total was computed as the mean of 14 PSQ-minor and moderate items, which yield a score from 0 to 10. Higher scores indicate greater pain sensitivity. Internal consistency in the current sample was excellent across all three scales (Cronbach’s α = 0.96, 0.91, and 0.94 for PSQ-total, PSQ-minor, and PSQ-moderate, respectively).
The PSQ has demonstrated robust reliability and validity across diverse pain conditions and populations [11,61,62,63]. Prior studies report low-to-moderate correlations between PSQ-total/PSQ-minor scores and psychological measures, and moderate correlations with QST-derived pain intensity in healthy individuals [11,61,62]. Notably, these QST correlations are stronger in individuals with chronic localized pain than in healthy controls, supporting the PSQ’s relevance as a proxy for centrally mediated pain sensitivity [11,63].
2.3. Statistical Analysis
After initial screening, data collection, and cleaning, all analyses were performed using R (v4.5.1; R Foundation for Statistical Computing, Vienna, Austria), and the manuscript was generated using Quarto (v1.9.38; Boston, MA, USA). Only samples with complete dietary variables were included.
2.3.1. Latent Profile Analysis of Individual DII Components
Latent profile analysis (LPA) classified participants into mutually exclusive dietary profiles across 31 DII components. Criteria-based metrics predetermined the best fitting latent profile model, principally Akaike information criterion (AIC), Bayesian information criterion (BIC), and entropy [64]. Vuong-Lo-Mendell-Rubin likelihood ratio test allowed a significance test of whether the inclusion of an additional profile contributed to a significantly better-fitting model, hence p < ·05 was used as the α level for nested model-fit testing [65]. Additionally dietary patterns were visualized to identify the most distinct profiles.
LPA facilitates multidimensional dietary intake, capturing naturally occurring dietary patterns while improving model parsimony and interpretability [66,67]. Classifying participants into latent profiles enables examination of central sensitization indicators at the pattern level, which better reflects the synergistic effects through which dietary constituents influence neuroinflammatory processes [65,66]. Researchers categorized dietary intake and eating styles into latent profiles, which facilitate data analysis and interpretation [65,68]. Dummy variables were created for the dietary profiles; the high pro-inflammatory profile was designated the reference group because its larger sample size provided the most stable baseline and the most precise estimates [69,70].
2.3.2. Descriptive Statistics
Descriptive analyses summarize continuous variables as mean (standard deviation [SD]) and categorical variables as frequencies and percentages. These were compared across the latent dietary profiles.
2.3.3. Bivariate Analyses
Bivariate associations among DII components, epigenetic clocks, and central sensitization indicators were examined using Spearman correlation coefficients (ρs), given their non-normal distributions.
2.3.4. Multiple Linear Regression Models
Nested multiple linear regression models were used to examine three sets of associations, all controlling for covariates (age, body mass index [BMI], sex, and race). Covariates were selected a priori based on relevant literature and significant covariates identified in prior studies using the ERASED dataset [20,30,39,71]:
- Model 1 (covariates only): Tested separate associations of (a) epigenetic aging and covariates; and (b) central sensitization indicators and covariates.
- Model 2 (covariates + predictors): Tested separate associations of (a) diet quality with central sensitization indicators; (b) diet quality with epigenetic aging, and (c) epigenetic aging with central sensitization indicators.
- Model 3 (covariates + diet quality + epigenetic aging): Tested whether diet quality and epigenetic aging were jointly associated with central sensitization indicators.
Effect sizes (adjusted R2) for all models were derived by subtracting the effect size of the covariate-only model (Model 1) from that of the predictor model, thereby isolating the effect attributable to the predictor and minimizing inflation from covariate contributions. A Benjamini-Hochberg correction was applied to adjust for multiple comparisons, and the false discovery rate (FDR) q-value was reported [72].
2.3.5. Missing Data
Since the mechanism underlying missing data could not be verified, missing values were addressed using complete case analysis (CCA) of all NSCLBP participants with dietary data, with pairwise deletion applied for bivariate analyses and listwise deletion applied for multivariate analyses [73,74]. Although CCA reduces sample size and statistical power, it yields transparent and unbiased estimates [73,74]. Statistical significance was set at a two-tailed p-value ≤ .05.
3. Results
3.1. Latent Profile Analysis: Description and Selection of Profiles
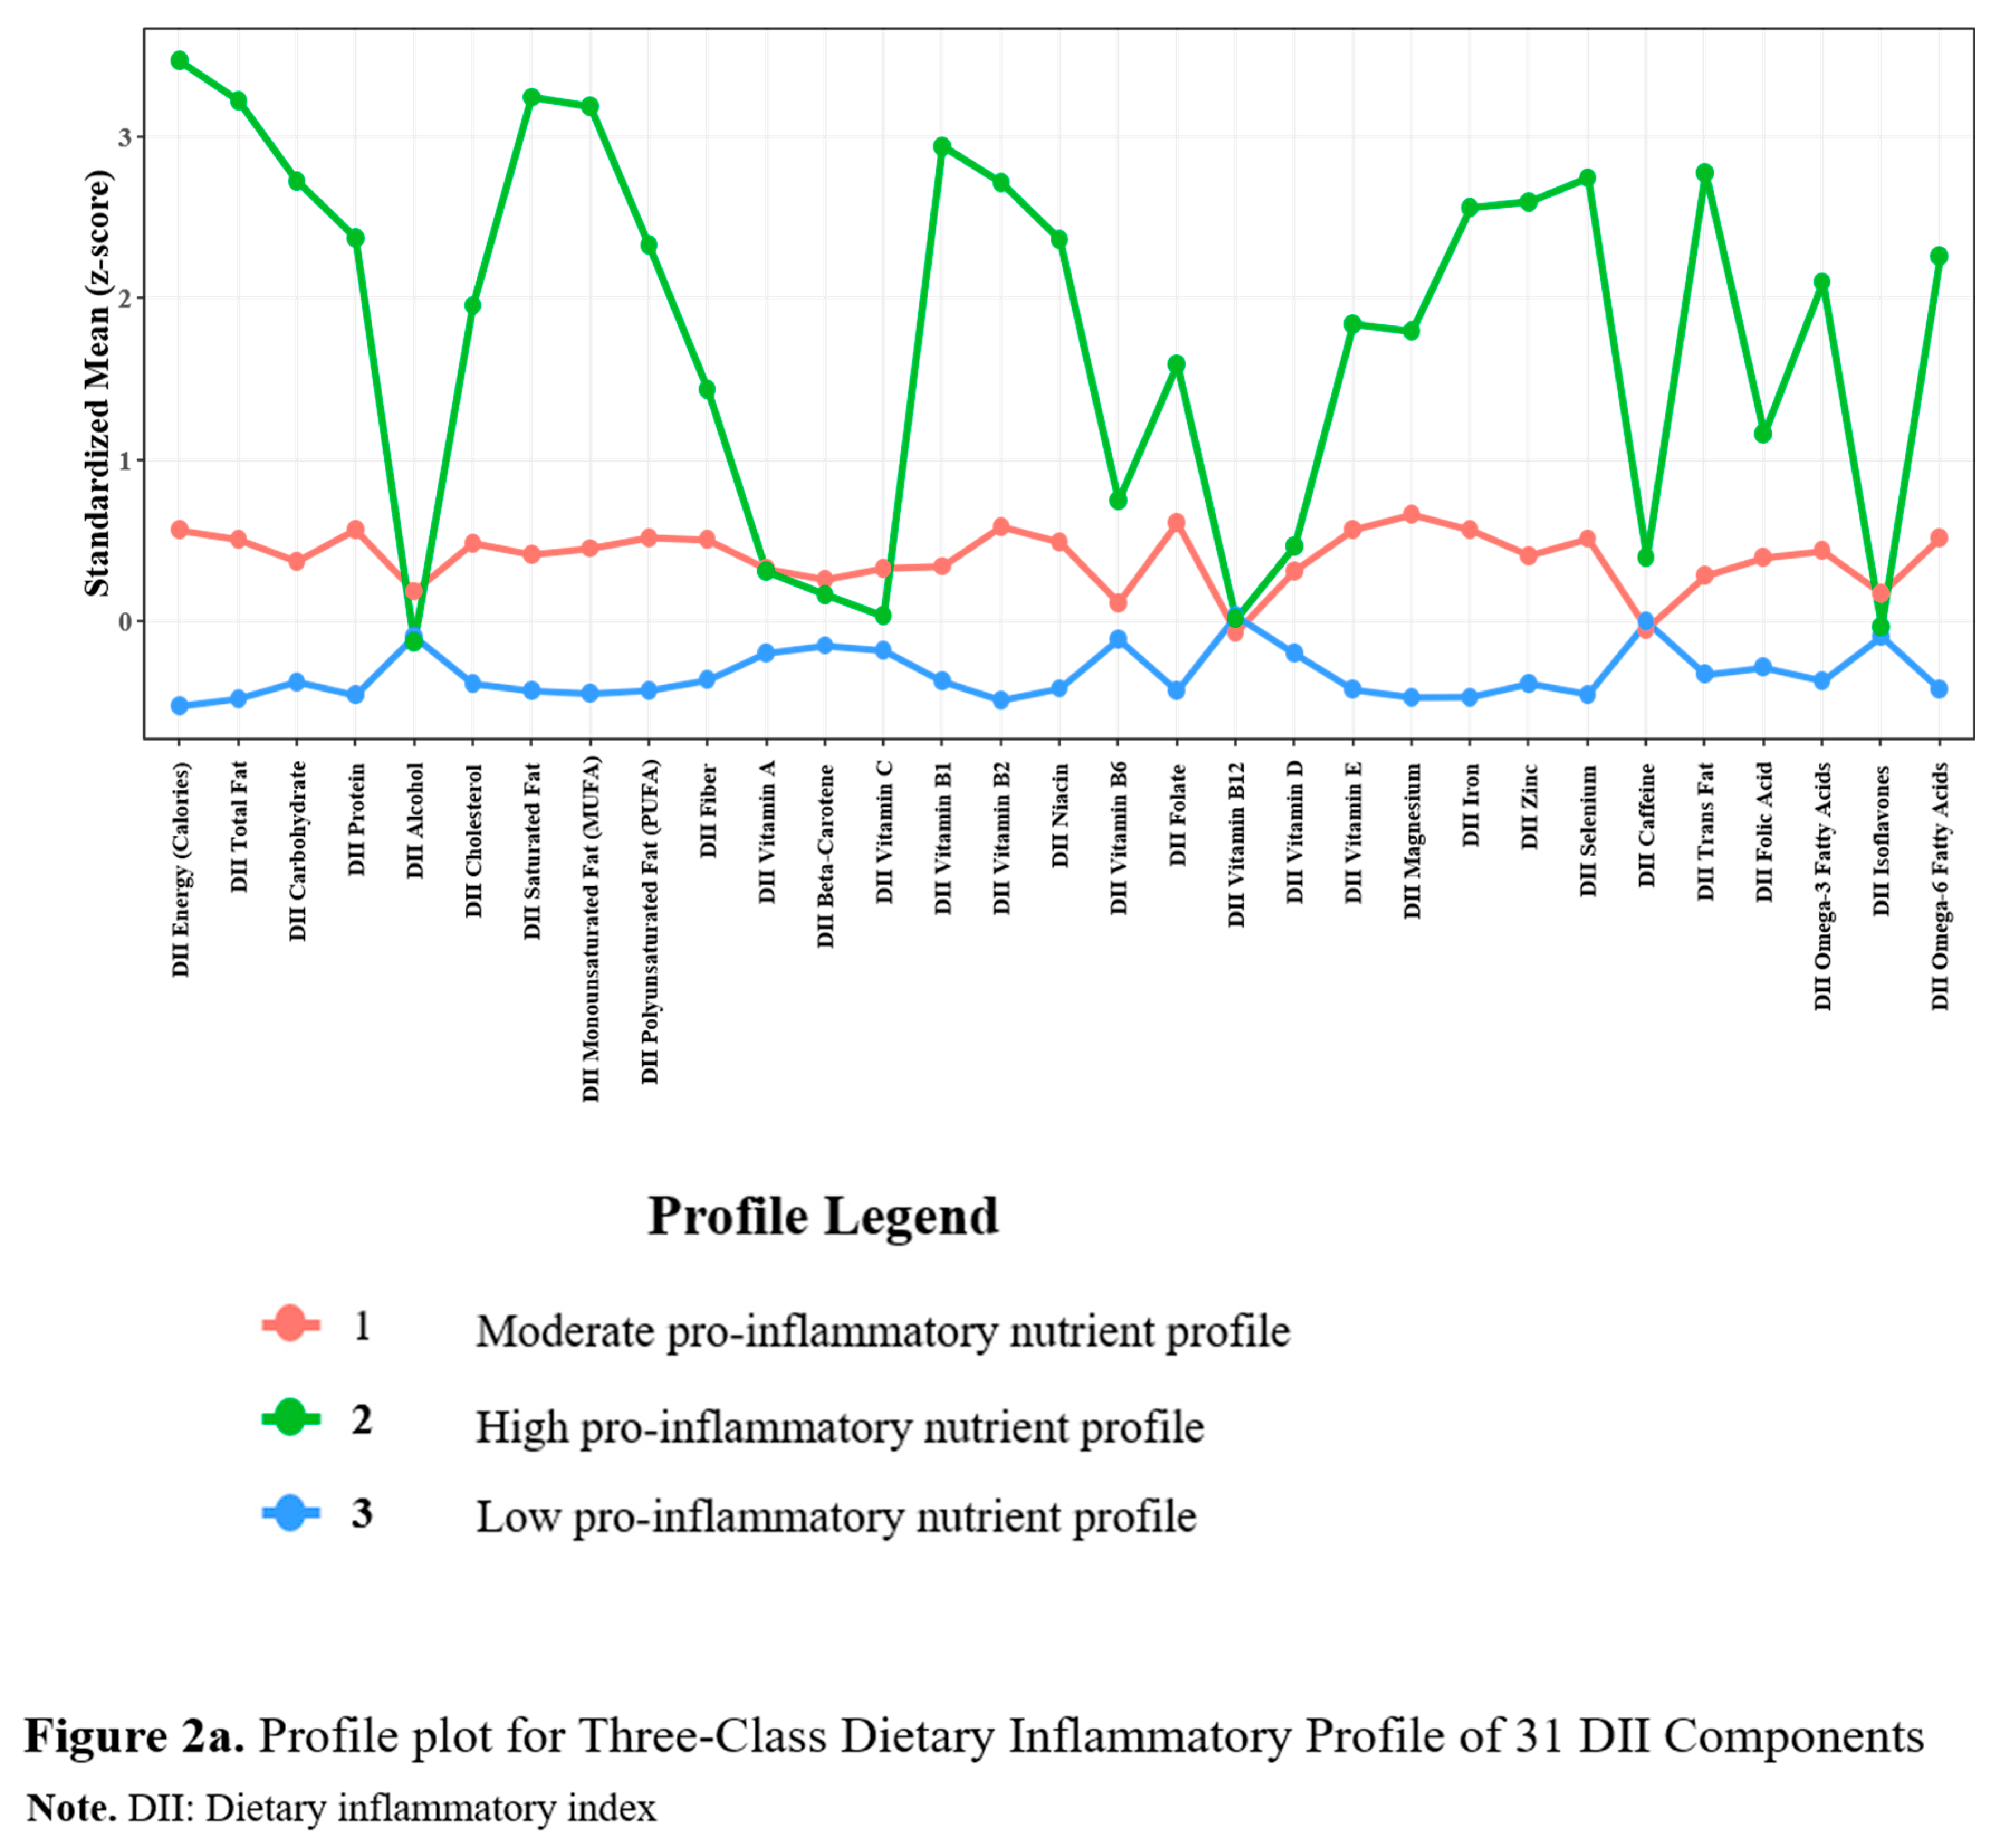
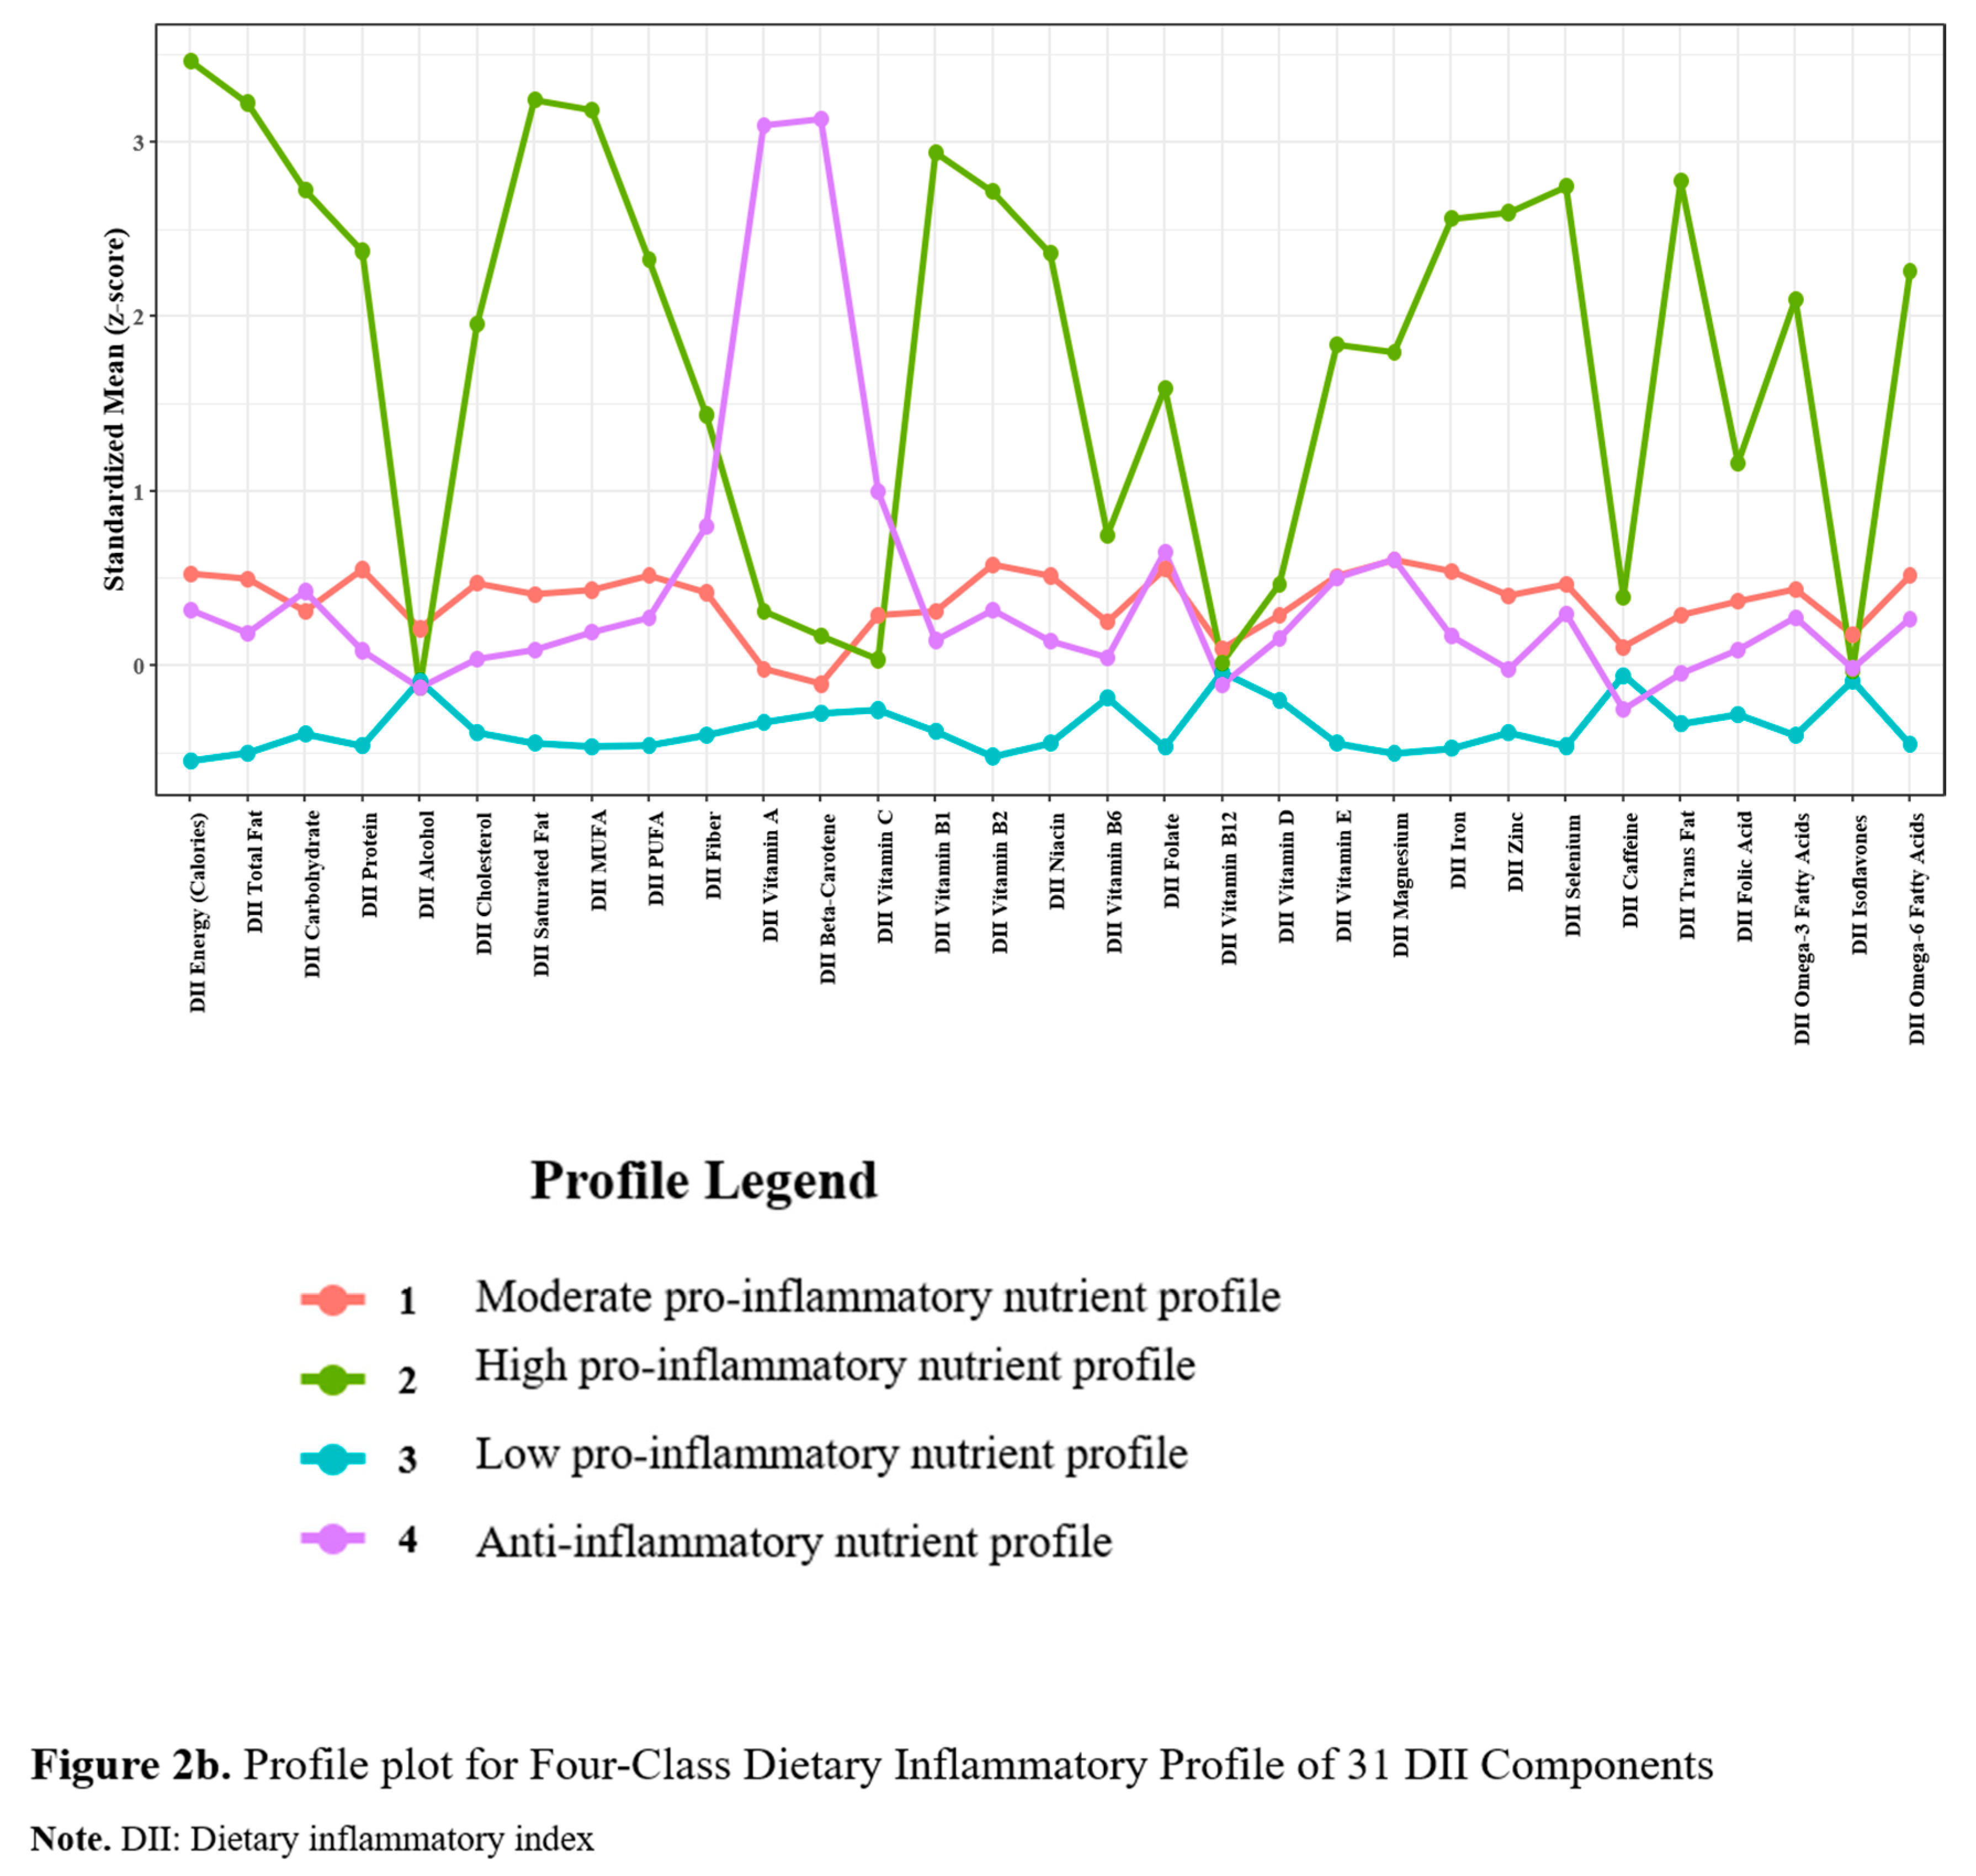
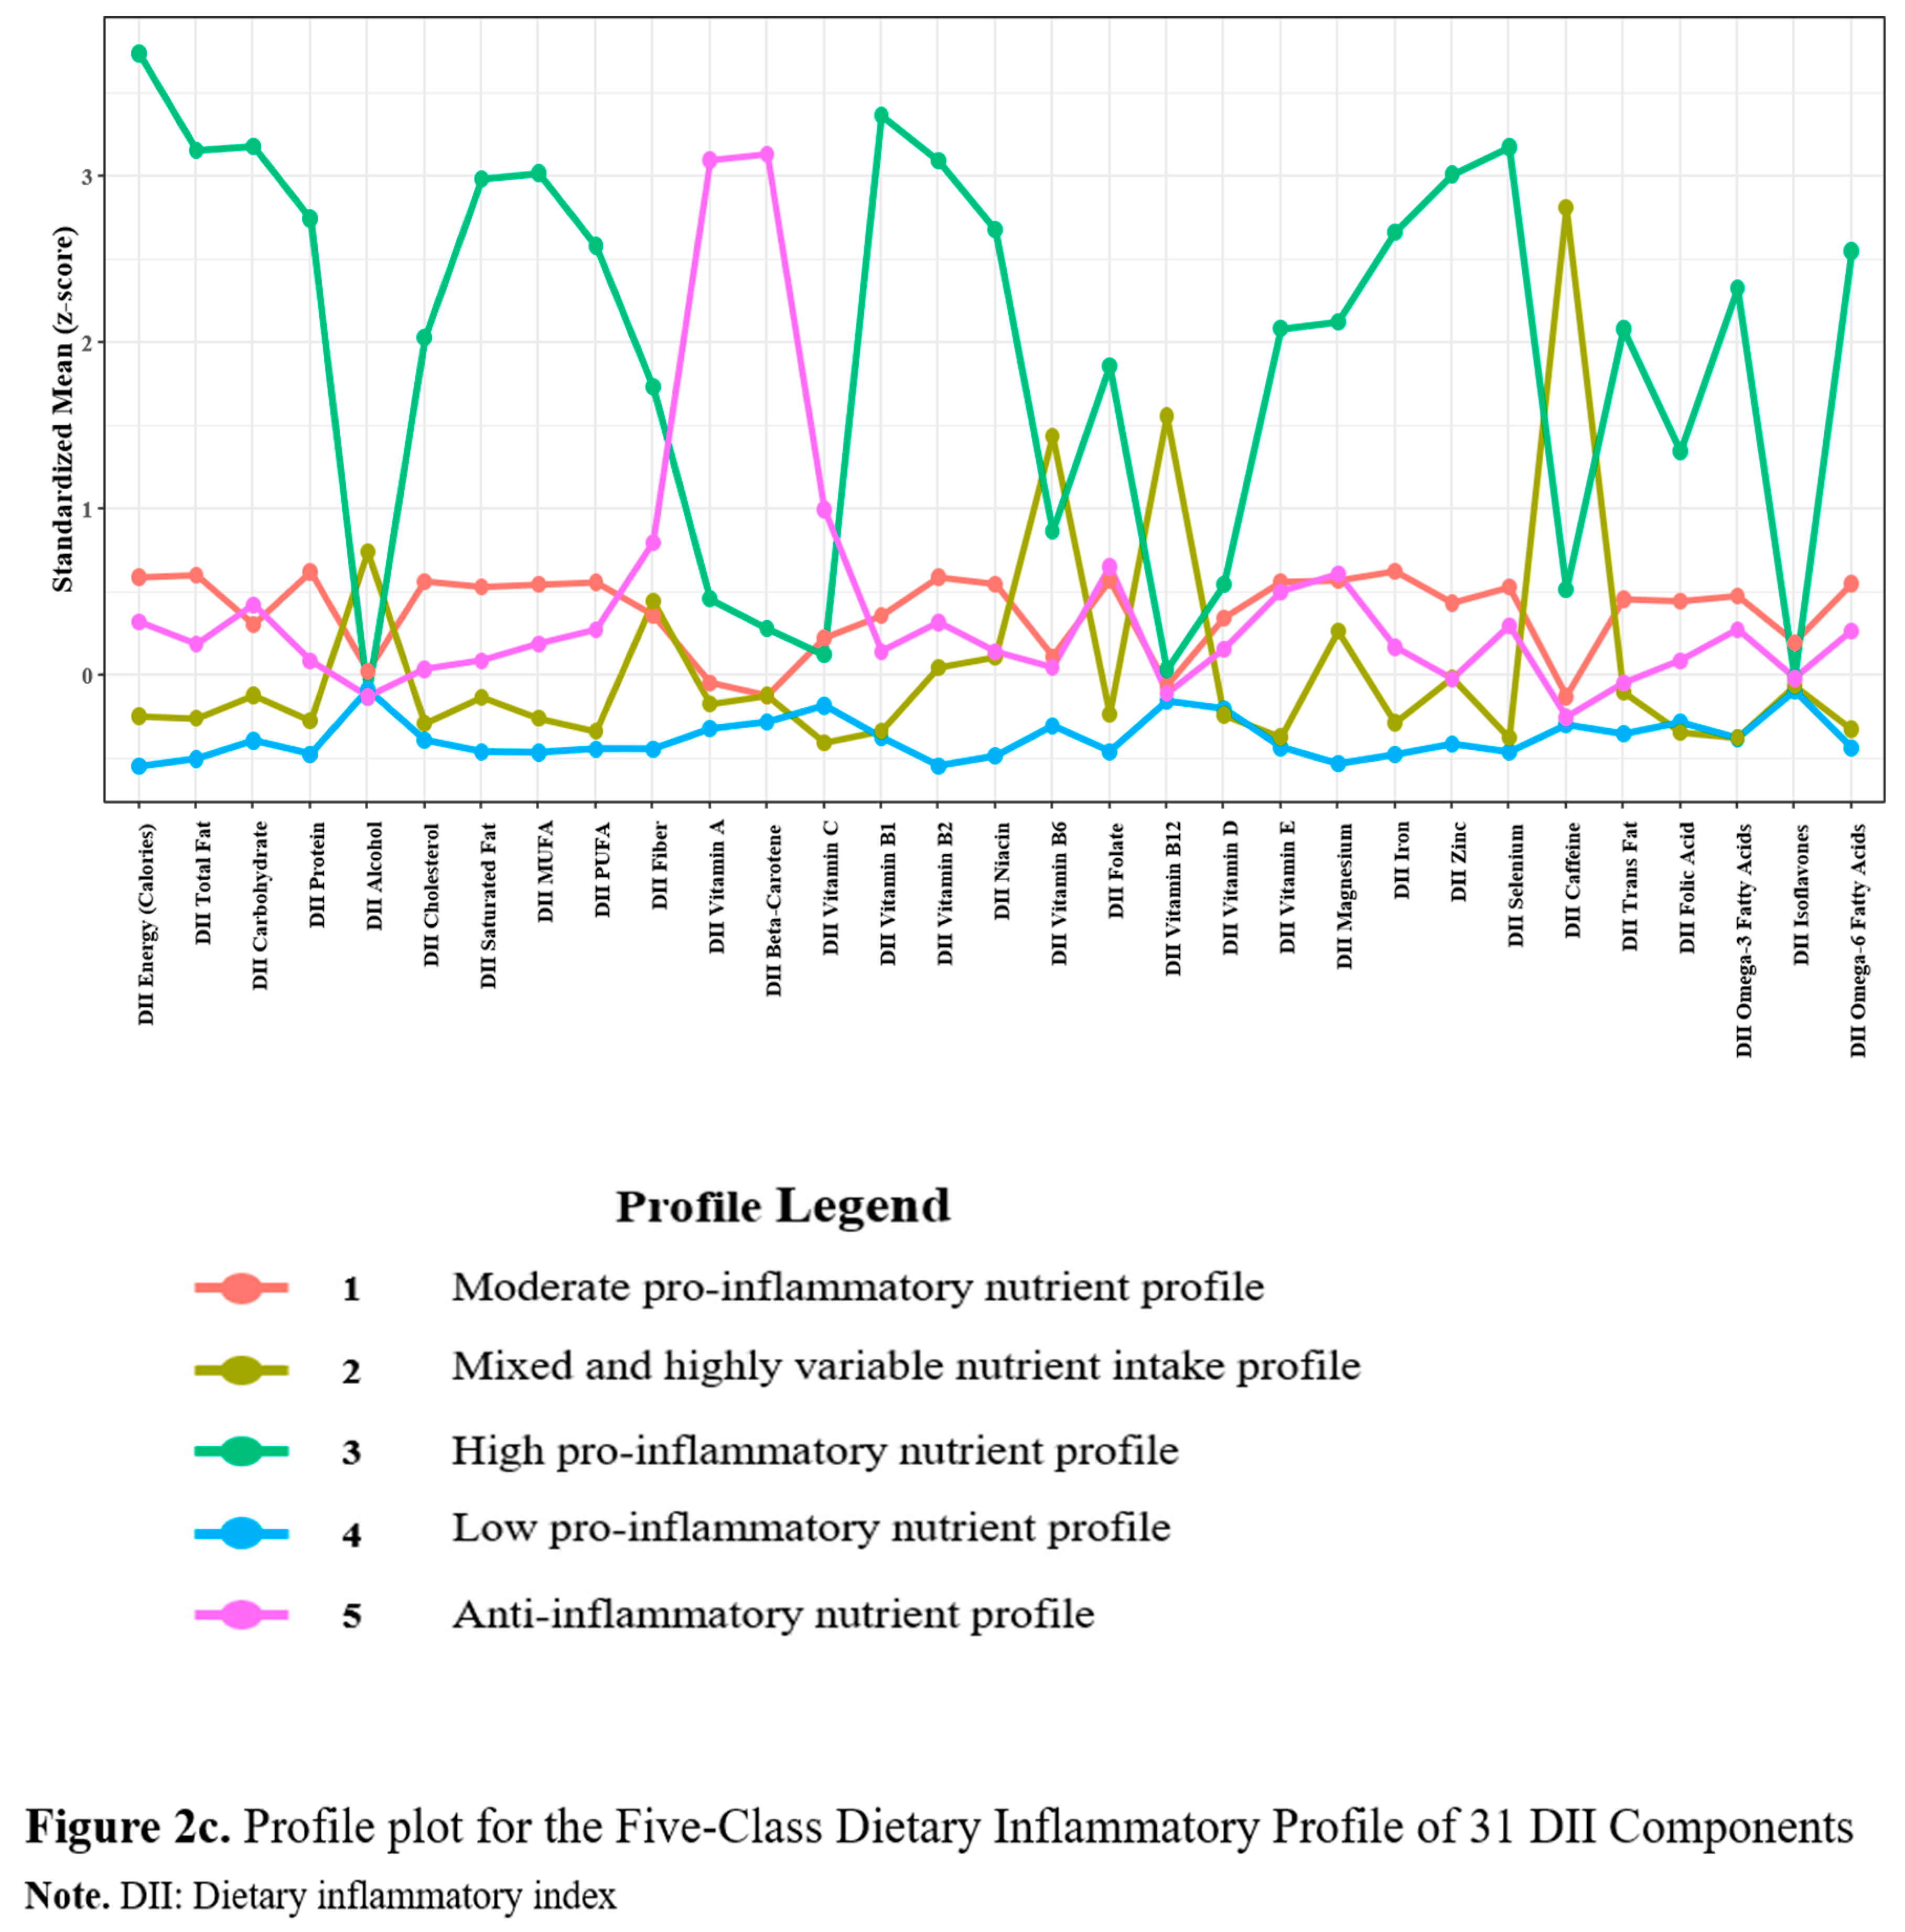
We selected dietary latent profiles based on criteria metrics, VLMR ratio test, and dietary patterns. Table 1 shows dietary latent profiles ranging from one to five. The AIC, BIC, and SABIC decreased numerically with each additional profile, but BIC drops by ~ 628 points from three to four profile, but only ~ 625 points from four to five profile, essentially plateauing. This elbow pattern suggests the four-profile solution captures most of the meaningful improvement in fit, with additional profiles adding complexity without proportional gains. Significant VLMR likelihood ratio tests indicated improved fit when moving from the two-profile to the three-profile solution (p < .001), and fit continued to improve significantly from the three-profile to the four-profile solution (p < .001), indicating that the four-profile solution fits the data significantly better than the 3-profile solution. Significant VLMR ratio tests improved when the three-profile solution (p < .001) was added and remained significant when the 4-profile solution (p < .001) was added as well, which indicates that the four-profile solution fits the data significantly better than the third. The three- to five-profile dietary patterns are shown in Figure 2a, Figure 2b and Figure 2c. The three-profile solution grouped participants into low-proinflammatory (n = 8), moderate pro-inflammatory (n = 67), and high-proinflammatory (n = 125) dietary patterns. The four-profile solution categorized participants into anti-inflammatory (n = 12), low-proinflammatory (n = 8); moderate pro-inflammatory (n = 62); and high-proinflammatory (n = 118) dietary patterns. The four-profile solution uncovered a distinct anti-inflammatory pattern, characterized by elevated antioxidant vitamin and micronutrient intake that was absent in the three-profile solution. The five-profile solution organized participants into anti-inflammatory (n = 12), low-proinflammatory (n = 7); moderate pro-inflammatory (n = 57); and high-proinflammatory (n = 110), and mixed and highly variable (n = 14) dietary patterns. This solution introduced the mixed and highly variable pattern absent in the three- and four-profile solutions. However, this additional complexity caused a small, less stable low pro-inflammatory pattern (n = 7), which suggest a possible overfit. Ultimately, we chose the four-profile solution because it offers the best balance of statistical fit and parsimony, making it more clinically and practically interpretable. Further, the four-profile solution may be particularly relevant to epigenetic aging and central sensitization due to the anti-inflammatory dietary pattern [75].
3.2. Characteristics of Study Participants.
Table 2 summarizes the socio-demographic characteristics of study participants across the four-profile solution. The final sample comprised 200 adults with NSCLBP. More than half belonged to the high pro-inflammatory dietary pattern (59%, n = 118), followed by the moderate pro-inflammatory (31%, n = 62), the anti-inflammatory (6%, n = 12), and the low pro-inflammatory, which was least represented (4%, n = 8). The mean DII score was 1.79 (SD = 1.61), indicating an overall pro-inflammatory diet quality. Mean DII scores differed significantly across the four dietary patterns (p < .001); no other significant differences were observed across socio-demographic or clinical characteristics.
More than half of participants were female (55%, n = 110) and self-identified as African American (62%, n = 123). The average chronological age was 44.43 (SD = 13.81) years, and average BMI was 31.33 (SD = 7.58) kg/m².
Accelerated DunedinPACE scores were observed across all four dietary patterns, with the highest score observed in the moderate pro-inflammatory pattern (M = 1.28, SD = 0.12). This indicates that, for each chronological year, participants in the moderate pro-inflammatory profile aged biologically 1.28 times faster than the reference rate of 1.0. GrimAge acceleration was fastest in the high pro-inflammatory (M = 2, SD = 15) followed by the anti-inflammatory (M = 2, SD = 9) dietary pattern, while decelerated GrimAge was observed in the low- (M = -3, SD = 5) and moderate (M = -2, SD = 8) pro-inflammatory dietary patterns. A positive percentage change in CPM, reflecting efficient pain inhibition, was observed in all dietary patterns, with the highest inhibition observed in the low pro-inflammatory pattern, 43 (SD = 52). The moderate pro-inflammatory pattern had the highest heat TS pain rating of 1 (SD = 20) revealing normal TS, while the anti-inflammatory pattern had the highest mechanical TS pain rating of 15 (SD = 19), revealing pain facilitation. Total PSQ score was highest in the high pro-inflammatory profile, 5.26 (SD = 2.19). Together, these results suggest that the high pro-inflammatory profile was the most common dietary pattern and was not restricted to any sociodemographic or clinical subgroup.
3.3. Bivariate Correlations: Dietary Components, Epigenetic Aging, and Central Sensitization Indicators
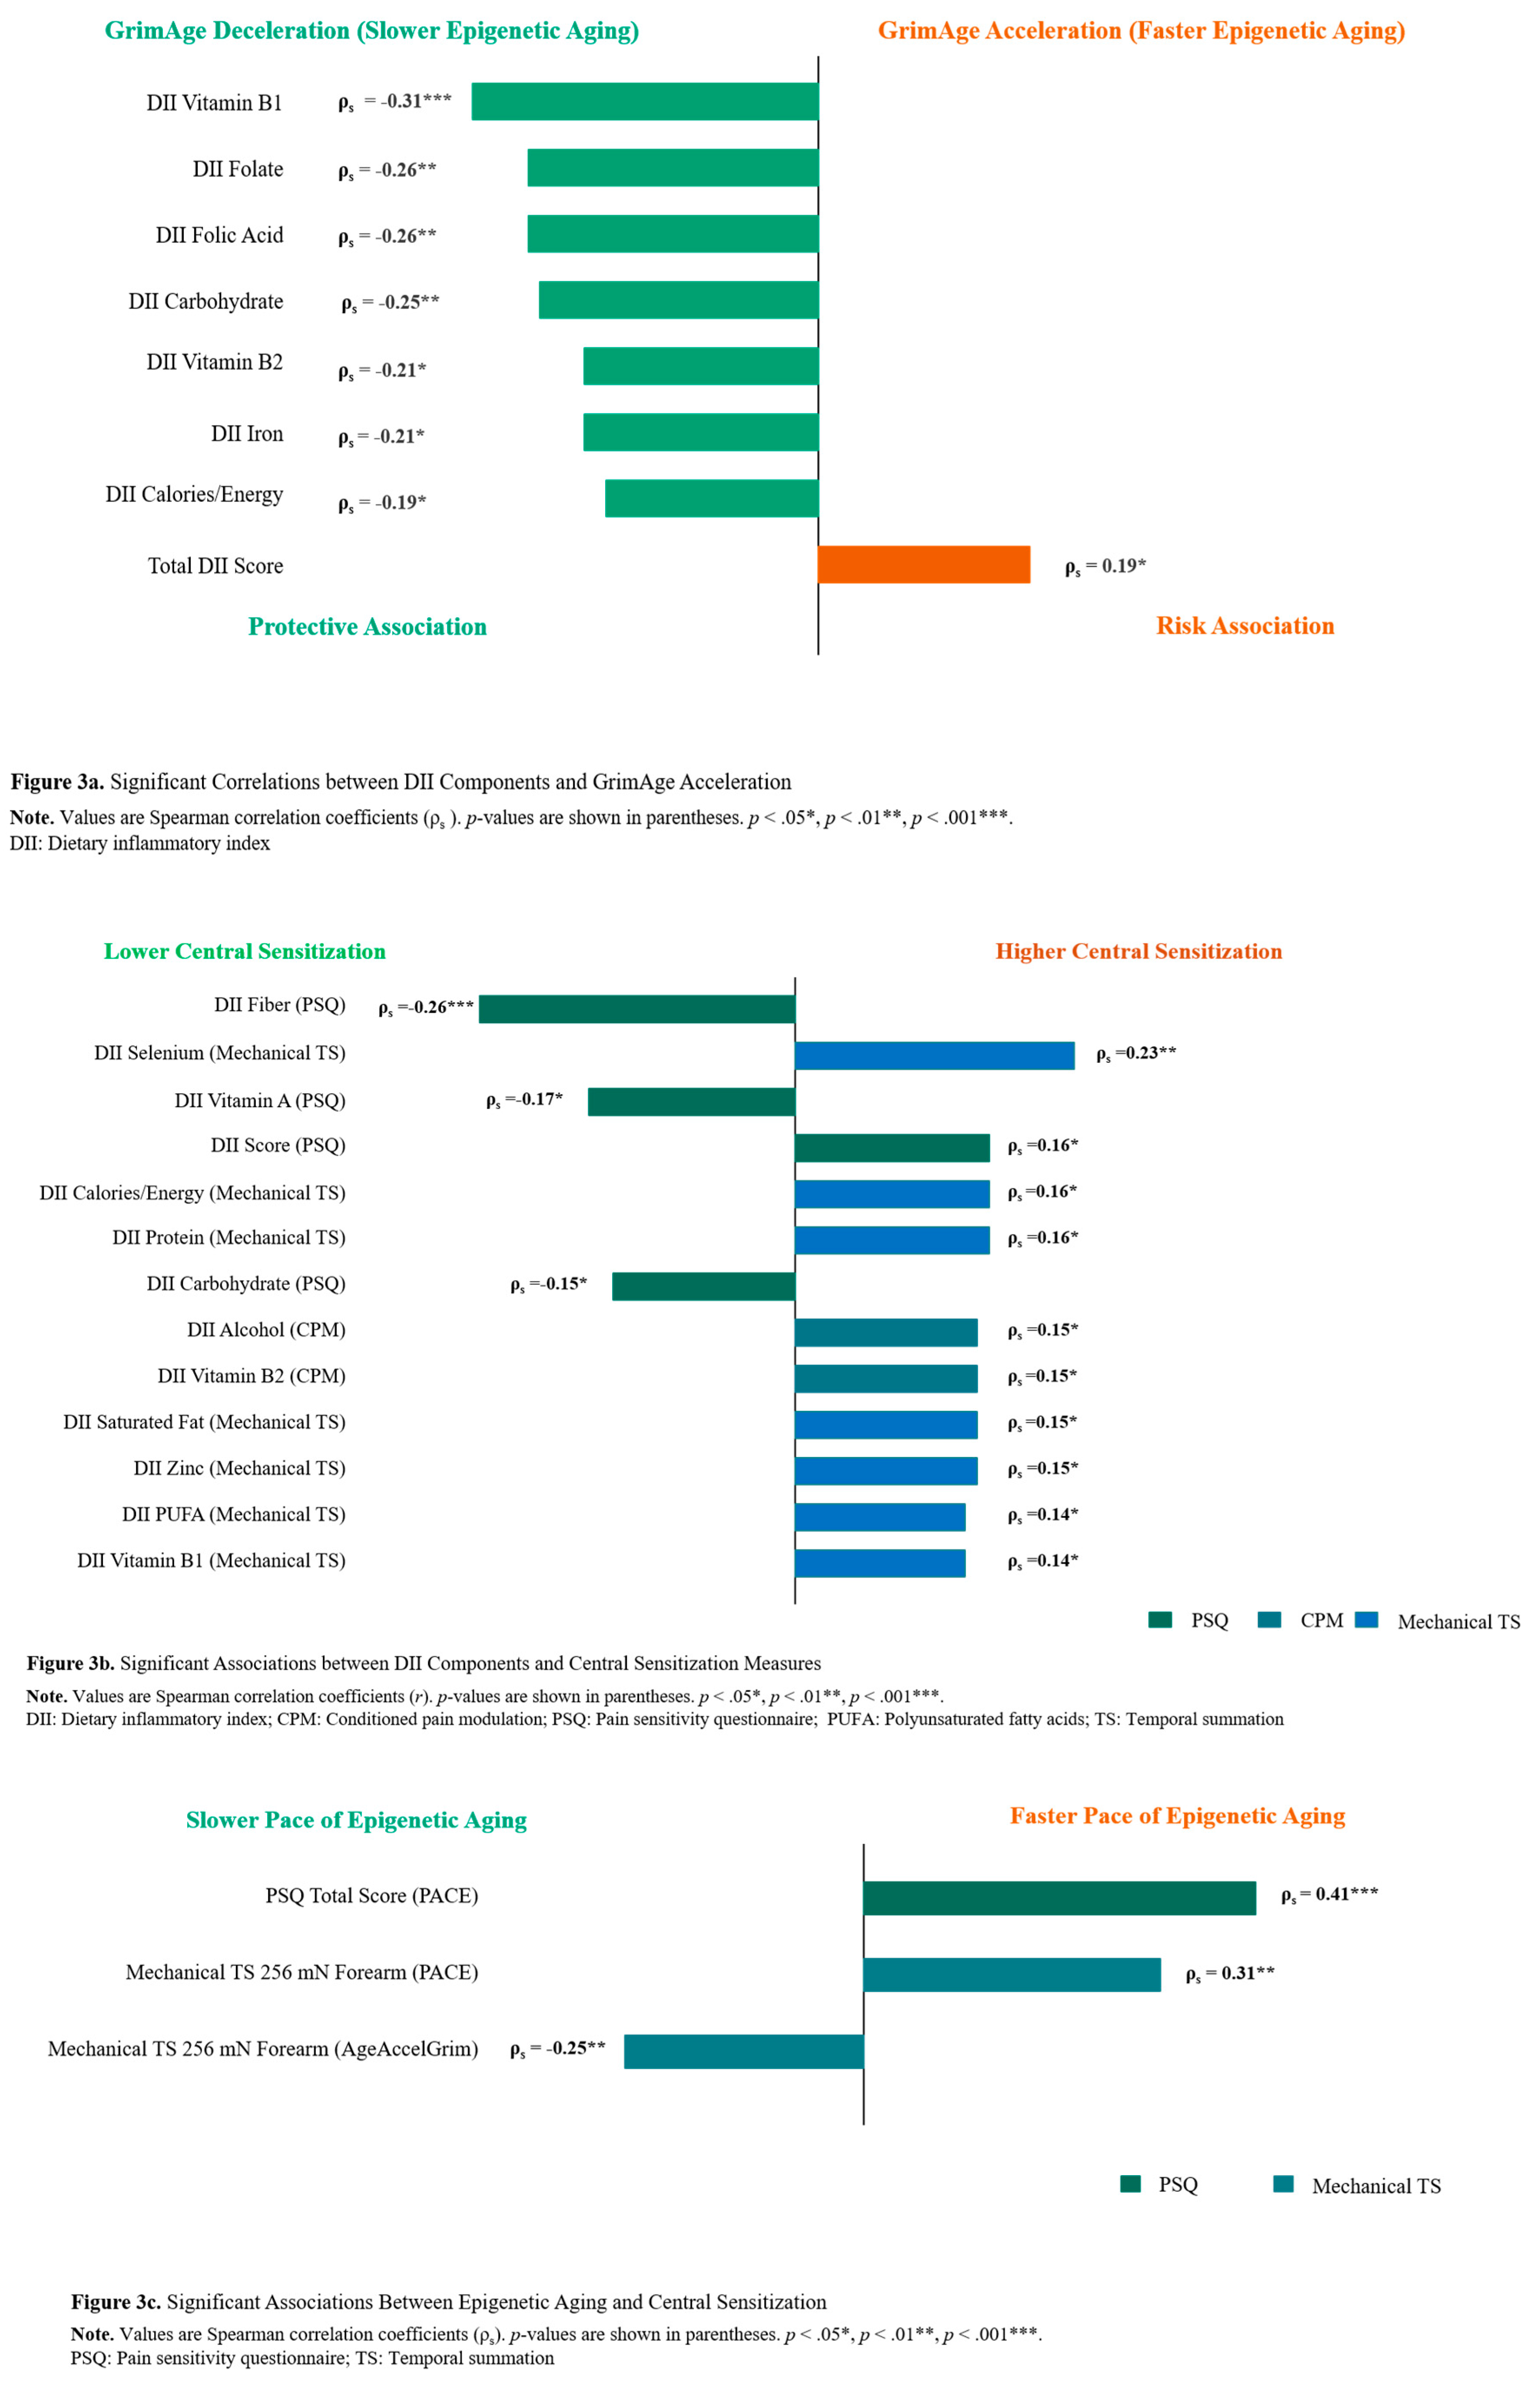
Spearman correlations characterized bivariate relationships among study variables. Most correlations were weak to moderate in magnitude (|r| ≈ 0.1-0.4), whereas stronger correlations were observed primarily within conceptually related variables (central sensitization indicators and DII components). All correlation analyses between study variables are presented in cross-correlation Table 3a, Table 3b and Table 3c, while significant correlations are depicted in Figure 3a, Figure 3b and Figure 3c.
3.3.1. Individual DII Components and Epigenetic Aging
Table 3a presents relationships between DII components and epigenetic aging markers, DunedinPACE and GrimAge acceleration, while Figure 3a depicts significant Spearman correlations. No significant correlations were observed between DII components and DunedinPACE. In contrast, the total DII score, which reflects a pro-inflammatory diet, was significantly positively correlated with GrimAge acceleration (ρs = 0.19, p = .040). Regarding individual DII components and GrimAge acceleration, a negative significant correlation was found between the pro-inflammatory calories (ρs = -0.19, p = .042) and carbohydrates (ρs = -0.25, p = .006) and anti-inflammatory nutrients vitamin B1 (ρs = -0.31, p < .001), vitamin B2 (ρs = -0.21, p = .021), folate (ρs = -0.26, p = .006), iron (ρs = -0.21, p = .022), and folic acid (ρs = -0.26, p = .005). These reveal that an increased consumption of food rich in these nutrients correlated with an increased GrimAge acceleration.

Table 3a.
Cross-Correlations between DII Components and Epigenetic Aging Measures.
| Variable | DunedinPACE, ρs (p) | GrimAge, ρs (p) |
| DII Score | 0.09 (p = 0.328) | 0.19* (p = 0.040) |
| DII Calories/Energy | -0.02 (p = 0.805) | -0.19* (p = 0.042) |
| DII Total Fat | -0.02 (p = 0.813) | -0.13 (p = 0.169) |
| DII Carbohydrate | -0.15 (p = 0.117) | -0.25** (p = 0.006) |
| DII Protein | 0.08 (p = 0.414) | -0.14 (p = 0.134) |
| DII Alcohol | -0.07 (p = 0.449) | -0.06 (p = 0.536) |
| DII Cholesterol | 0.09 (p = 0.322) | -0.01 (p = 0.905) |
| DII Saturated Fat | -0.04 (p = 0.707) | -0.07 (p = 0.476) |
| DII MUFA | -0.04 (p = 0.681) | -0.17 (p = 0.068) |
| DII PUFA | 0.03 (p = 0.742) | -0.12 (p = 0.210) |
| DII Fiber | -0.10 (p = 0.300) | -0.17 (p = 0.076) |
| DII Vitamin A | -0.13 (p = 0.177) | -0.07 (p = 0.461) |
| DII Vitamin B1 (Thiamin) | 0.06 (p = 0.549) | -0.31*** (p < 0.001) |
| DII Vitamin B2 (Riboflavin) | 0.04 (p = 0.706) | -0.21* (p = 0.021) |
| DII Trans Fat | -0.11 (p = 0.260) | 0.06 (p = 0.512) |
| DII Folate | -0.03 (p = 0.754) | -0.26** (p = 0.006) |
| DII Magnesium | -0.01 (p = 0.911) | -0.16 (p = 0.091) |
| DII Iron | 0.00 (p = 0.967) | -0.21* (p = 0.022) |
| DII Zinc | 0.05 (p = 0.601) | -0.11 (p = 0.239) |
| DII Selenium | 0.05 (p = 0.596) | -0.07 (p = 0.446) |
| DII Folic Acid | -0.03 (p = 0.764) | -0.26** (p = 0.005) |
| DII Omega-6 Fatty Acids | 0.02 (p = 0.824) | -0.11 (p = 0.228) |
Note. Values are Spearman correlation coefficients (ρs). p-values are shown in parentheses. p < .05*, p < .01**, p < .001***. DII: Dietary inflammatory index; MUFA: Monounsaturated fatty acids; PUFA: polyunsaturated fatty acids.
3.3.2. Individual DII Components and Central Sensitization Indicators
Table 3b summarizes the relationship between DII components and central sensitization indicators, while Figure 3b portrays significant correlations. Heat TS showed no significant correlations with DII components. Among all other central sensitization indicators, only total PSQ showed a weak, positive significant correlation with total DII score (ρs = 0.16, p = .021). Carbohydrates (ρs = -0.15, p = .036), fiber (ρs = -0.26, p < .001), and vitamin A (ρs = -0.17, p = .0014) were all significantly negatively correlated with PSQ total. Regarding percentage CPM change, alcohol (ρs = 0.15, p = .035) and vitamin B2 (ρs = 0.15, p = .031) were significantly correlated. Mechanical TS was significantly correlated with calories (ρs = 0.16, p = .022), protein (ρs = 0.16, p = .028), saturated fat (ρs = 0.15, p = .035), PUFA (ρs = 0.14, p = .046), vitamin B1 (ρs = 0.14, p = .044), zinc (ρs = 0.15, p = .041), selenium (ρs = 0.23, p = .001).
Table 3b.
Cross Correlations between DII Components and Central Sensitization Measures.
| Variable | PSQ Total Score, ρs (p) | CPM, ρs (p) | Heat TS, ρs (p) | Mechanical TS, ρs (p) |
| DII Score | 0.16* (p = 0.021) | -0.09 (p = 0.228) | 0.01 (p = 0.847) | -0.06 (p = 0.423) |
| DII Calories/Energy | -0.06 (p = 0.371) | 0.11 (p = 0.130) | 0.09 (p = 0.230) | 0.16* (p = 0.022) |
| DII Total Fat | -0.05 (p = 0.508) | 0.09 (p = 0.200) | 0.05 (p = 0.524) | 0.14 (p = 0.054) |
| DII Carbohydrate | -0.15* (p = 0.036) | 0.10 (p = 0.173) | 0.06 (p = 0.441) | 0.12 (p = 0.083) |
| DII Protein | 0.02 (p = 0.752) | 0.10 (p = 0.179) | 0.01 (p = 0.865) | 0.16* (p = 0.028) |
| DII Alcohol | -0.05 (p = 0.451) | 0.15* (p = 0.035) | -0.01 (p = 0.885) | -0.04 (p = 0.589) |
| DII Cholesterol | 0.12 (p = 0.083) | 0.08 (p = 0.289) | 0.06 (p = 0.401) | 0.11 (p = 0.136) |
| DII Saturated Fat | -0.07 (p = 0.308) | 0.14 (p = 0.053) | 0.08 (p = 0.278) | 0.15* (p = 0.035) |
| DII MUFA | -0.04 (p = 0.555) | 0.11 (p = 0.124) | 0.02 (p = 0.781) | 0.12 (p = 0.083) |
| DII PUFA | 0.03 (p = 0.693) | 0.00 (p = 0.997) | 0.03 (p = 0.673) | 0.14* (p = 0.046) |
| DII Fiber | -0.26*** (p < 0.001) | 0.11 (p = 0.130) | -0.04 (p = 0.617) | 0.06 (p = 0.428) |
| DII Vitamin A | -0.17* (p = 0.014) | 0.09 (p = 0.192) | -0.06 (p = 0.426) | 0.00 (p = 0.997) |
| DII Vitamin B1 (Thiamin) | -0.03 (p = 0.666) | 0.11 (p = 0.110) | 0.07 (p = 0.371) | 0.14* (p = 0.044) |
| DII Vitamin B2 (Riboflavin) | -0.11 (p = 0.126) | 0.15* (p = 0.031) | 0.04 (p = 0.572) | 0.09 (p = 0.224) |
| DII Trans Fat | -0.09 (p = 0.194) | 0.12 (p = 0.082) | 0.08 (p = 0.272) | 0.11 (p = 0.125) |
| DII Folate | -0.13 (p = 0.060) | 0.08 (p = 0.247) | 0.05 (p = 0.522) | 0.02 (p = 0.751) |
| DII Magnesium | -0.12 (p = 0.085) | 0.12 (p = 0.102) | -0.01 (p = 0.854) | 0.11 (p = 0.137) |
| DII Iron | -0.09 (p = 0.236) | 0.03 (p = 0.652) | 0.04 (p = 0.602) | 0.13 (p = 0.071) |
| DII Zinc | -0.02 (p = 0.785) | 0.13 (p = 0.074) | -0.01 (p = 0.937) | 0.15* (p = 0.041) |
| DII Selenium | 0.11 (p = 0.122) | 0.01 (p = 0.913) | 0.02 (p = 0.752) | 0.23** (p = 0.001) |
| DII Folic Acid | 0.01 (p = 0.940) | -0.04 (p = 0.541) | 0.13 (p = 0.082) | 0.07 (p = 0.332) |
| DII Omega-6 Fatty Acids | 0.04 (p = 0.602) | 0.00 (p = 0.985) | 0.03 (p = 0.719) | 0.13 (p = 0.070) |
Note. Values are Spearman correlation coefficients (ρs). p-values are shown in parentheses. p < .05*, p < .01**, p < .001***. CPM: Conditioned pain modulation; DII: Dietary inflammatory index; MUFA: Monounsaturated fatty acids; PSQ: Pain sensitivity questionnaire; PUFA: Polyunsaturated fatty acids; TS: Temporal summation.
3.3.3. Epigenetic Aging and Central Sensitization Indicators
Table 3c summarizes the relationship between epigenetic aging markers and central sensitization indicators, and Figure 3c shows significant correlations. Heat TS was not significantly correlated with any of the epigenetic markers. DunedinPACE was significantly, positively correlated with total PSQ (ρs = 0.41, p < .001) and mechanical TS (ρs = 0.31, p = .001). However, GrimAge acceleration was significantly negatively correlated with mechanical TS (ρs = -0.25, p = .008).
Table 3c.
Cross-Correlations between Epigenetic Aging and Central Sensitization Measures.
| Variable | DunedinPACE, ρs (p) | GrimAge, ρs (p) |
| PSQ Total Score | 0.41*** (p < 0.001) | -0.03 (p = 0.719) |
| CPM | 0.08 (p = 0.394) | -0.08 (p = 0.407) |
| Heat TS, Lumbar 48 °C | 0.02 (p = 0.814) | -0.05 (p = 0.627) |
| Mechanical TS, 256 mN Forearm | 0.31** (p = 0.001) | -0.25** (p = 0.008) |
Note. Values are Spearman correlation coefficients (ρs). p-values are shown in parentheses. p < .05*, p < .01**, p < .001***. CPM: Conditioned pain modulation; MUFA: Monounsaturated fatty acids; PSQ: Pain sensitivity questionnaire; PUFA: Polyunsaturated fatty acids; TS: Temporal summation.
3.4. Nested Multiple Regression Analysis Between Dietary Profiles, Epigenetic Aging, and Central Sensitization Indicators
The nested models were first built with covariates, then dietary profiles, and finally epigenetic aging markers were added. Four latent dietary profiles were used to provide a nuanced understanding of dietary associations with epigenetic aging and central sensitization indicators. We created a dummy variable for the four latent dietary profiles, setting the high pro-inflammatory intake profile as the reference group because 118 of the 200 participants included belonged to this group. Multicollinearity assessment through the variance inflation factor was not done because the models were not overfitted. Full models contained only latent dietary profiles (represented by three dummy variables), one epigenetic aging marker at a time, and the four covariates age, BMI, sex, and race.
3.4.1. Multiple Regression Analysis Between Dietary Profiles and Epigenetic Aging Markers
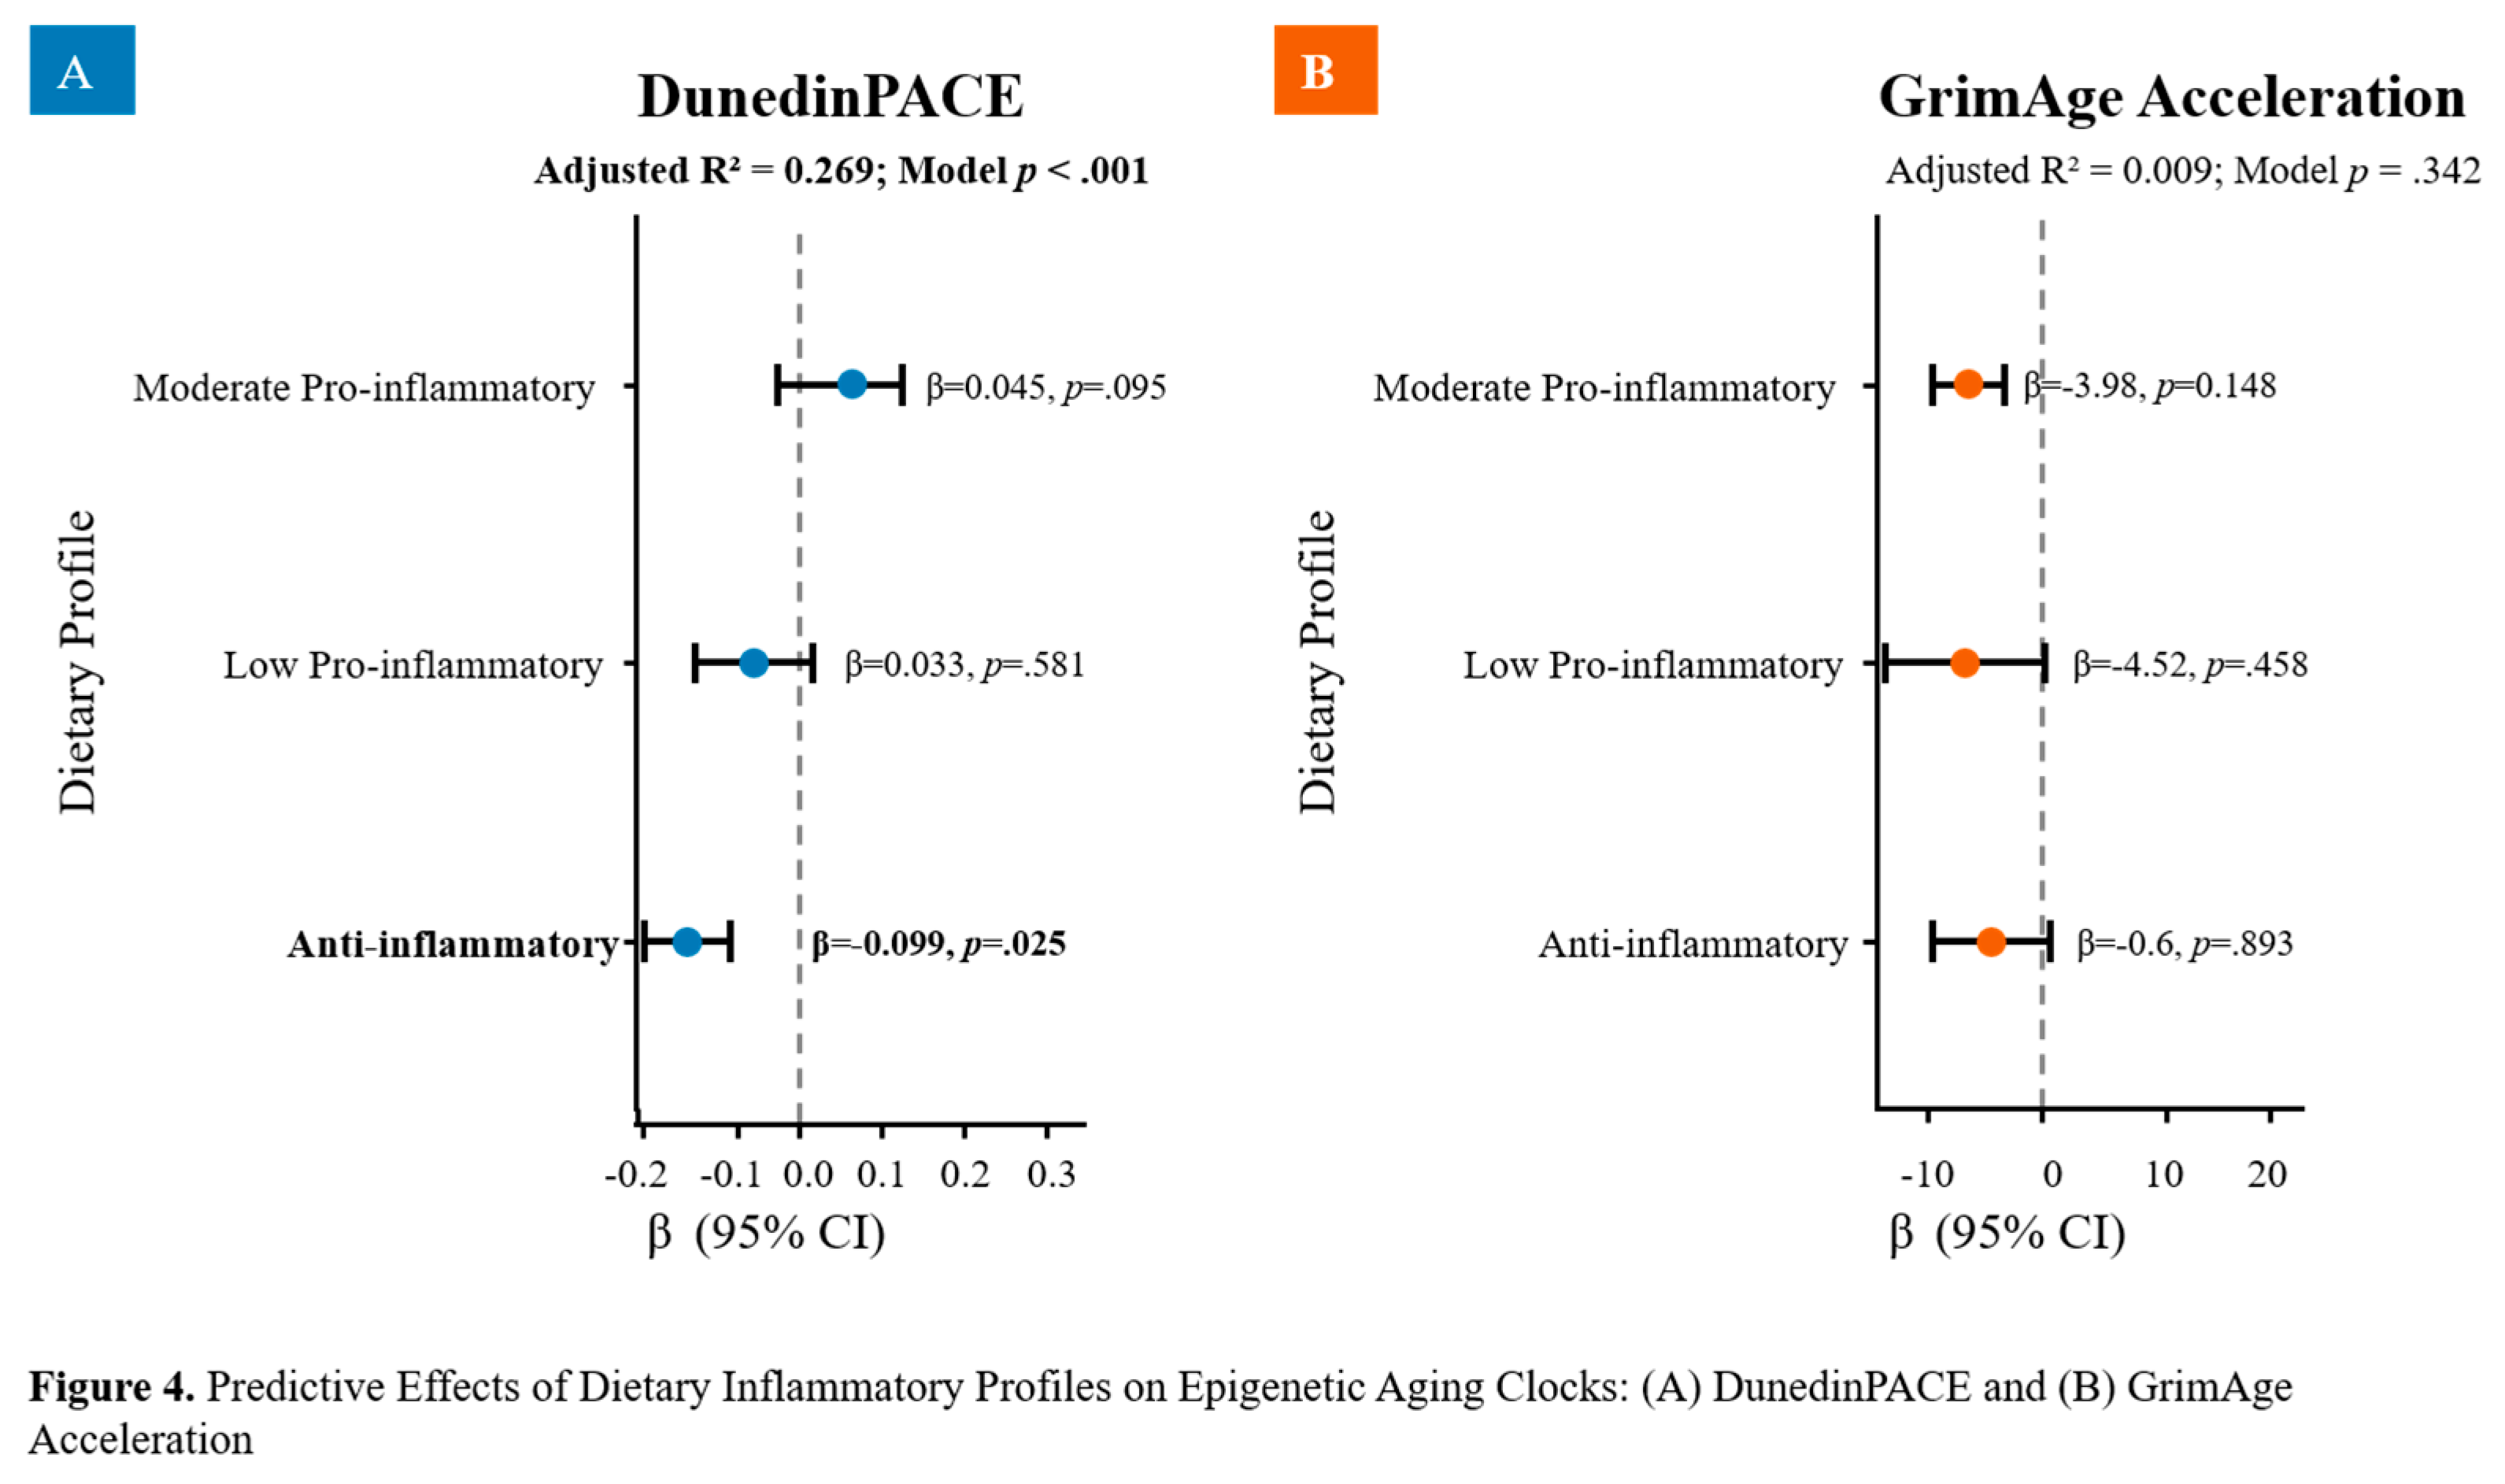
Two nested linear regression models examined the association between latent dietary profile and DunedinPACE, adjusting for age, sex, BMI, and race (Figure 4a). The base covariate-only model accounted for a significant proportion of variance in DunedinPACE (adjusted R² = 0.219, F(4,106) = 8.72, p < .001), with age (β = 0.0025, p = .005), BMI (β = 0.0047, p = .007), and race (β = -0.0656, p = .013) emerging as significant predictors. Adding dietary profile improved model fit, with adjusted R² increasing to .269 (F(7,103) = 6.79, p < .001), indicating that dietary profiles accounted for an additional ~5.0% of variance in the pace of epigenetic aging beyond covariates. In this full model, the anti-inflammatory profile was associated with significantly slower DunedinPACE (β = -.099, SE = 0.044, p = .025), suggesting that increased consumption of an anti-inflammatory diet may lead to a slower pace of epigenetic aging. Increased moderate pro-inflammatory profile was associated with an increased DunedinPACE, though this did not reach significance (β = 0.045, SE = 0.026, p = .095). Age (β = 0.0025, p = 0.037) and race (β = -0.077, p = .004) remained significant predictors, while BMI was attenuated to non-significance (β = 0.0043, p = .102). Collectively, these findings suggest that participants in the anti-inflammatory dietary profile exhibited a slower pace of aging, as measured by DunedinPACE independent of age, sex, BMI, and race.
In the GrimAge models, none of the covariates or latent dietary profiles were significantly associated with GrimAge acceleration (Figure 4b).
3.4.2. Multiple Regression Analysis Between Dietary Profiles and Central Sensitization
In multivariable linear regression models adjusted for age, sex, BMI, and race, dietary profile was not significantly associated with any of the four central sensitization outcomes (CPM, heat TS, mechanical TS, PSQ; Figure 5). For CPM, the low pro-inflammatory profile was associated with a larger CPM estimate (β = 34.90, SE = 17.93, p = .053), although this association did not reach statistical significance. The overall CPM model was not significant Similarly, latent dietary profiles were not significantly associated with heat TS, with the largest coefficient again observed for the low pro-inflammatory profile (β = -12.13, SE = 7.72, p = .118), although the overall model was not significant.
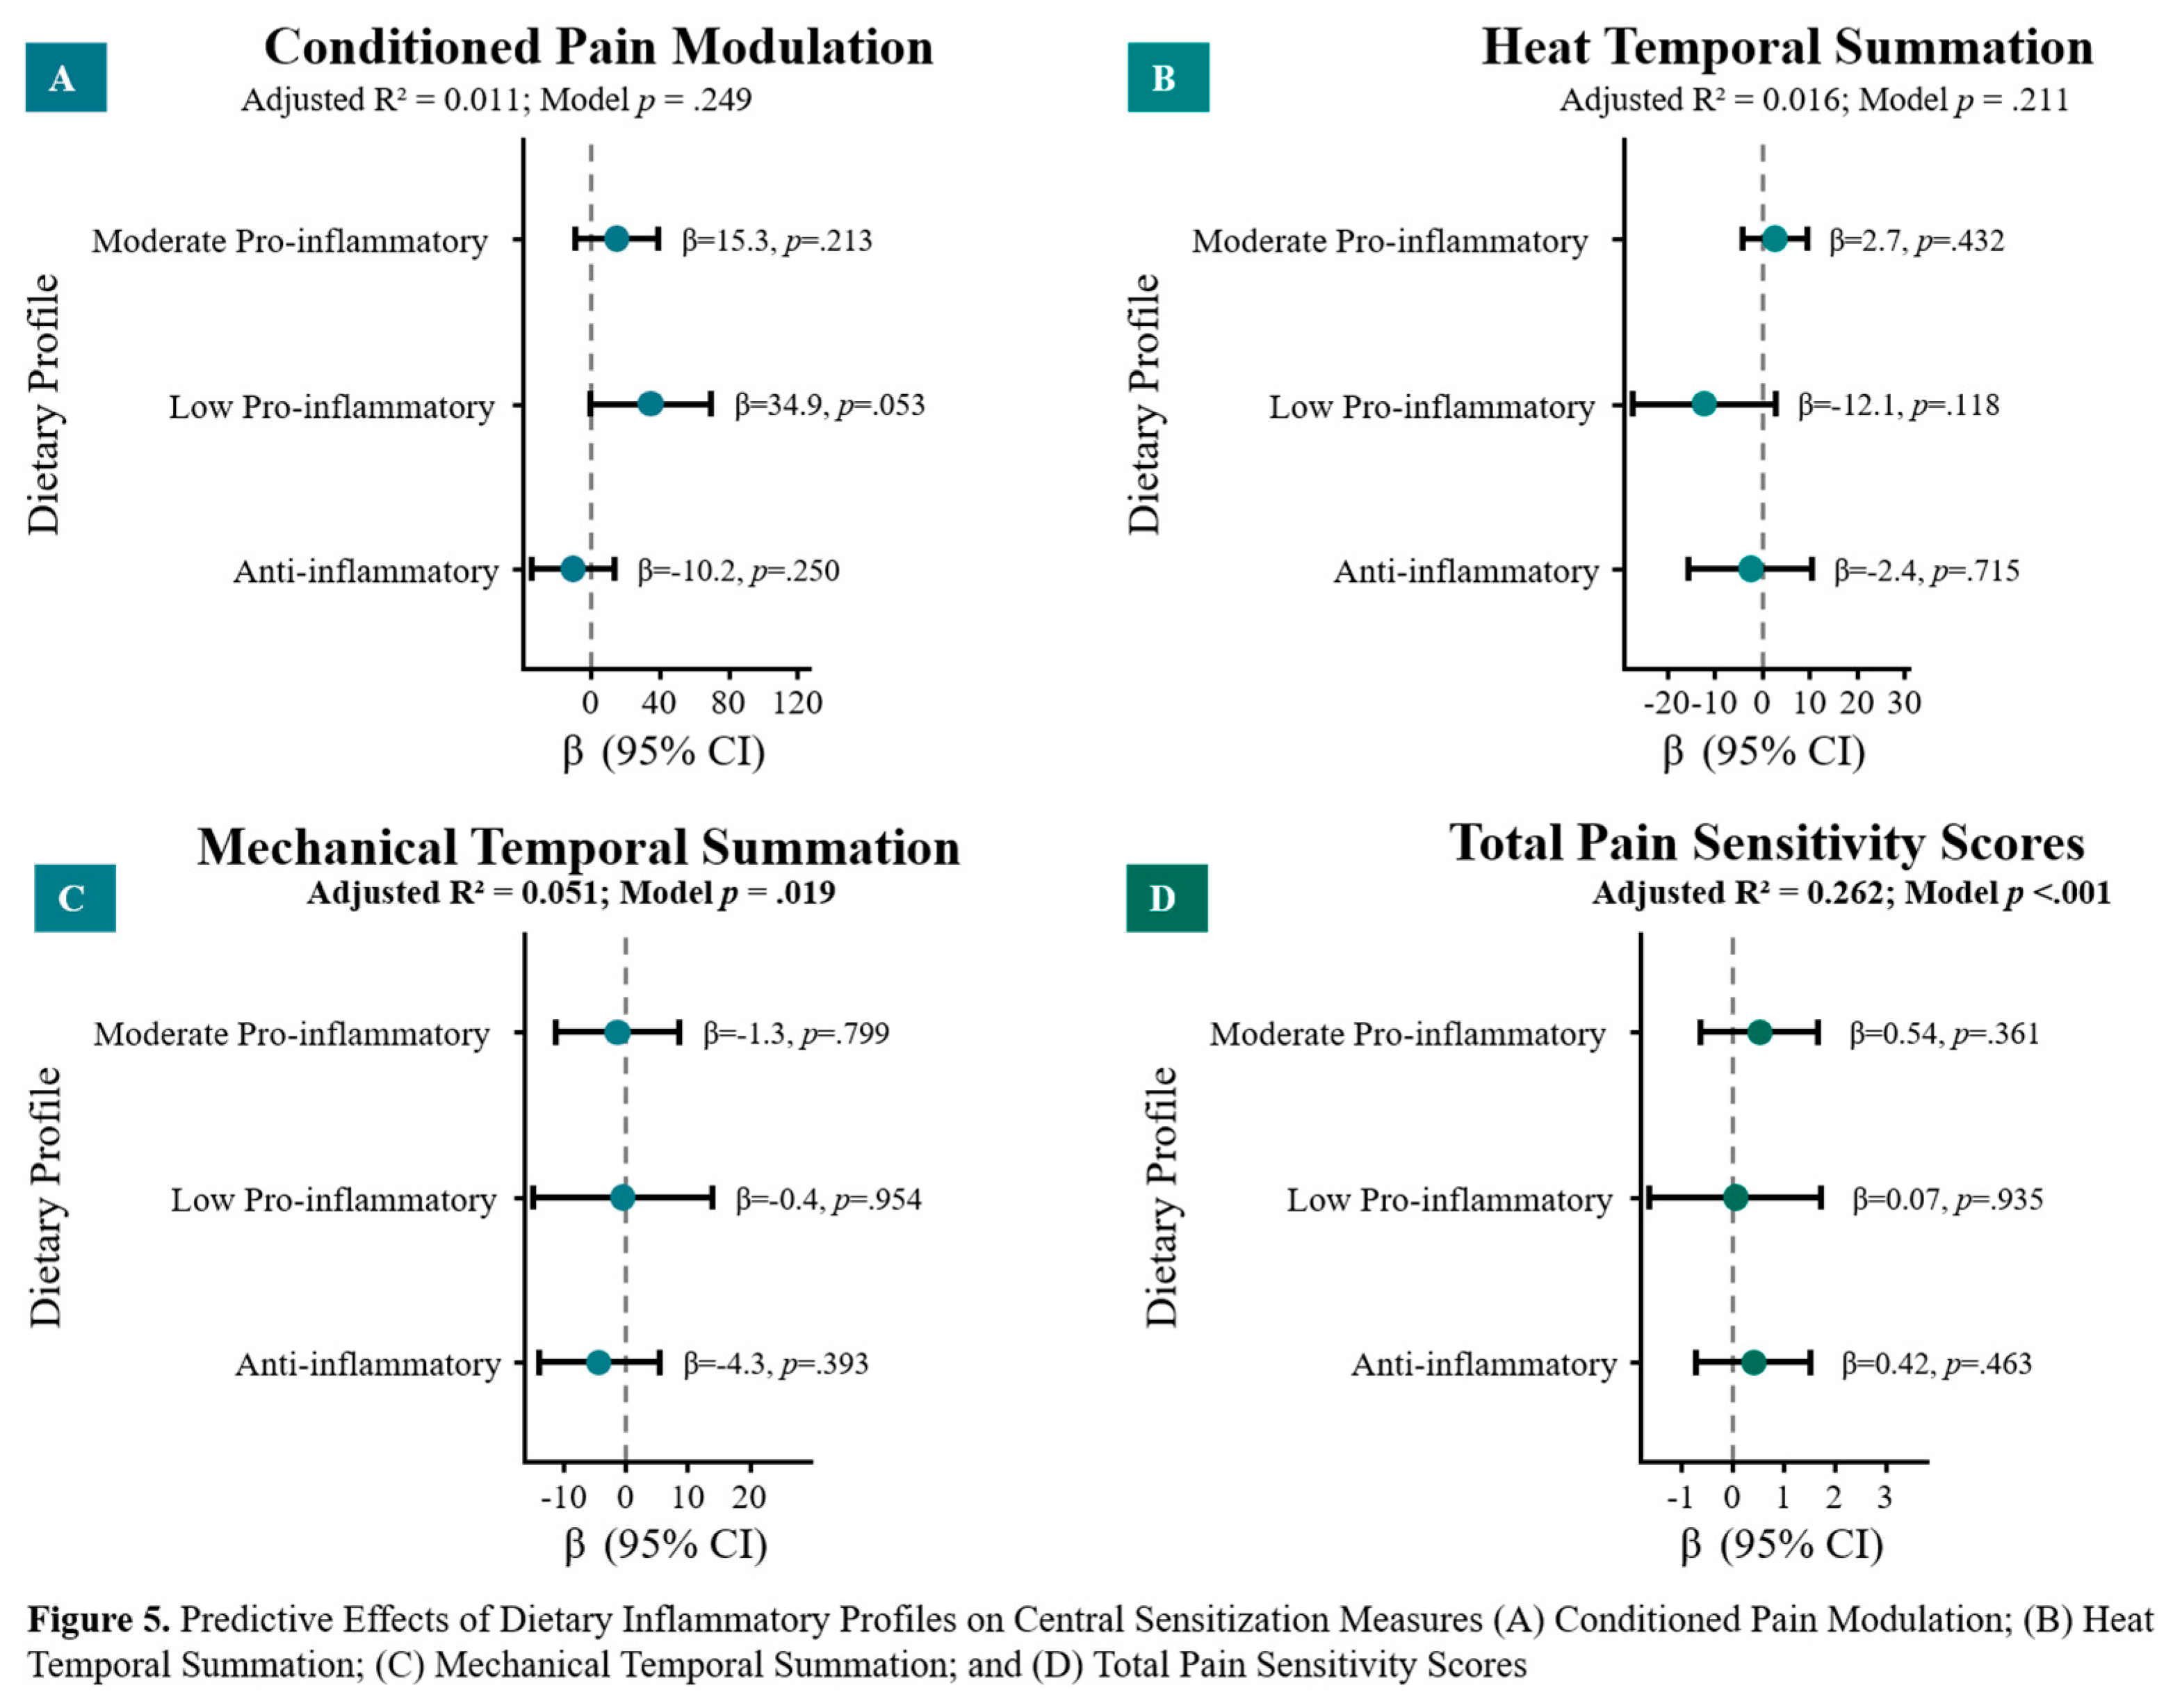
Dietary latent profiles were also not associated with mechanical TS, as none of the profile coefficients reached significance, despite the overall model being significant (F(7,183) = 2.47, p = .019; adjusted R² = 0.051). This model-level significance was attributable primarily to covariates rather than latent dietary profiles. Likewise, no dietary profile was associated with self-reported pain sensitivity, although the overall model was significant and accounted for a substantial proportion of variance (adjusted R² = 0.262, F(7,181) = 10.52, p < .001). Age and race significantly contributed to the PSQ model, whereas only race contributed significantly to the mechanical TS model. Collectively, these findings suggest that dietary latent profiles were not independently associated with central sensitization indicators after adjusting for covariates. Interpret estimates involving the low pro-inflammatory profile cautiously because of the small class size (8).
3.4.3. Multiple Regression Analysis Between Epigenetic Aging and Central Sensitization Indicators
Multiple regression models examined associations between epigenetic aging markers and central sensitization indicators, adjusting for age, sex, BMI, and race (Figure 6). Neither epigenetic aging markers were significantly associated with CPM nor heat-induced TS. Race emerged as a consistent correlate across the heat TS models. In contrast, both models predicting mechanical TS reached significance [(DunedinPACE: adjusted R² = 0.113, F(5,103) = 3.74, p = .004; GrimAge acceleration: adjusted R² = 0.154, F(5,103) = 4.92, p < .001)], with GrimAge acceleration emerging as a significant independent predictor, i.e., greater GrimAge acceleration was associated with reduced mechanical TS (β = -0.270, SE = 0.100, p = .008). In the GrimAge models, both age and race significantly correlated with heat and mechanical TS. In contrast, age was the only significant covariate in the DunedinPACE-mechanical TS model, whereas race was the only significant covariate in the DunedinPACE-heat TS model. NHWs exhibited higher heat TS than NHBs.
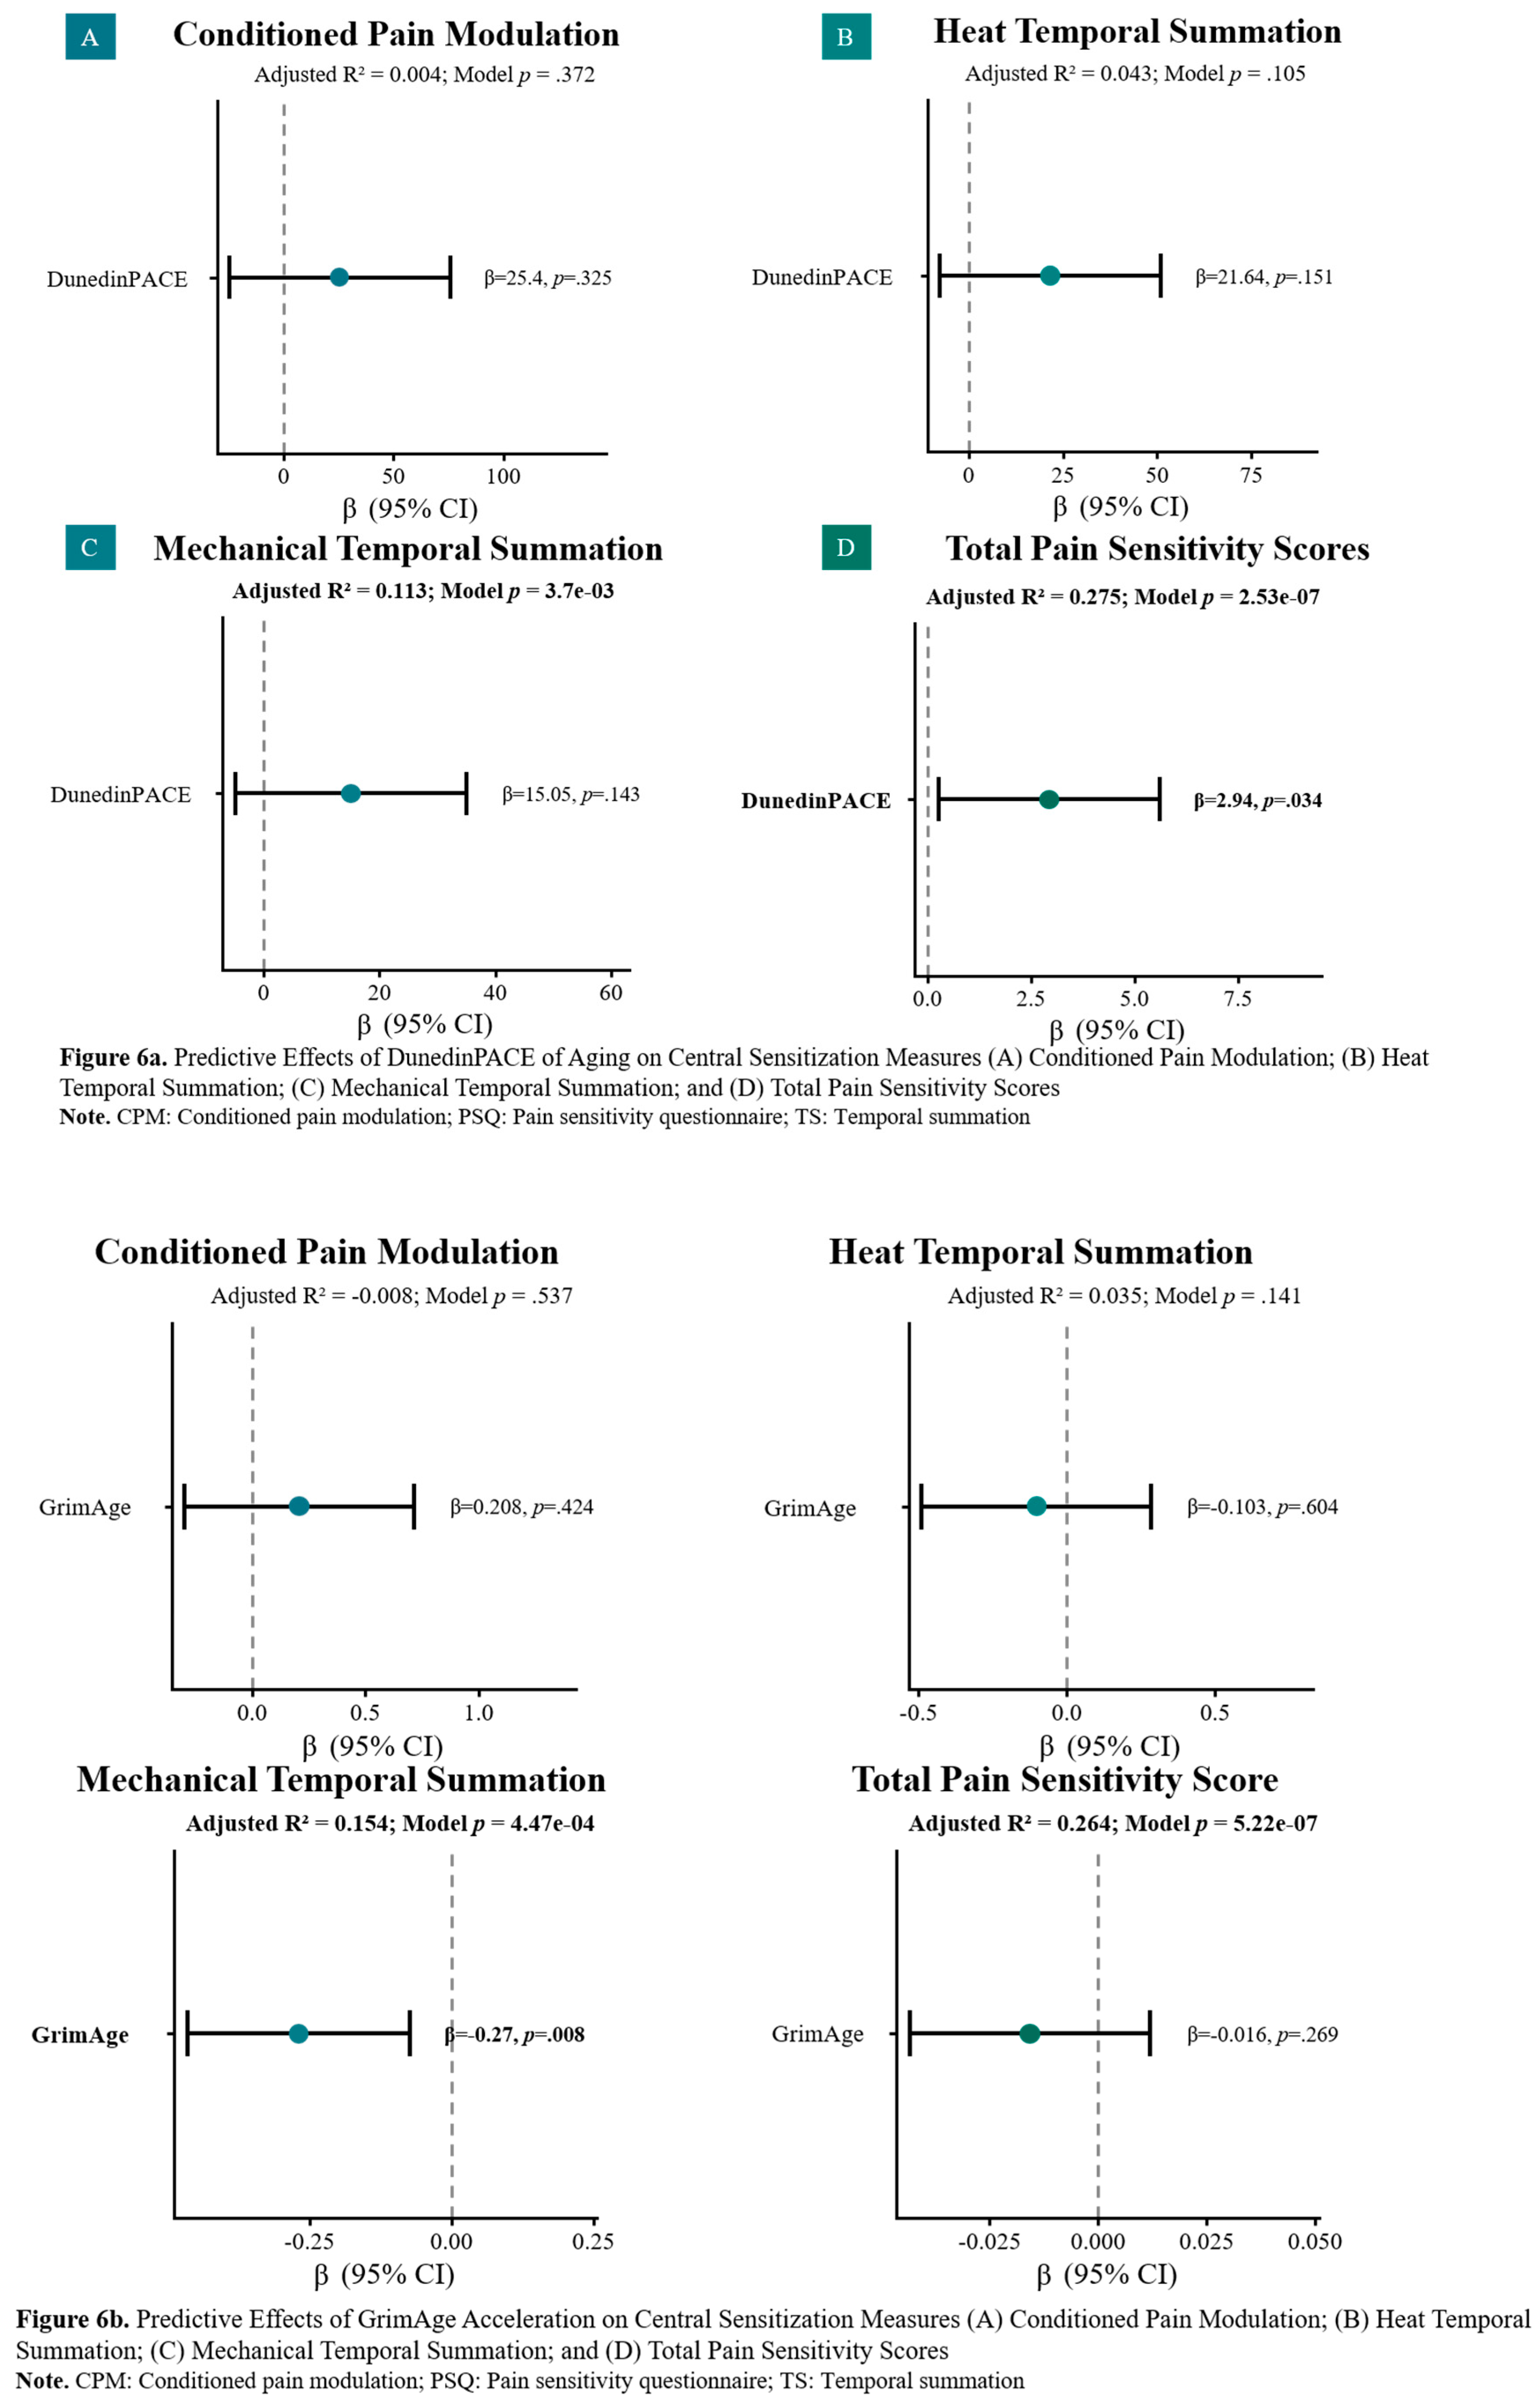
Both models predicting self-reported pain sensitivity were also overall significant and accounted for substantial variance (DunedinPACE: adjusted R² = 0.275, F(5,104) = 9.27, p < .001; GrimAge acceleration: adjusted R² = 0.264, F(5,104) = 8.83, p < .001). Notably, DunedinPACE was significantly positively associated with pain sensitivity, suggesting that a faster pace of biological aging predicted greater self-reported pain sensitivity (β = 2.94, SE = 1.36, p = .034), whereas GrimAge acceleration showed no independent association. Race was a robust predictor in both models, with NHWs showing lower pain sensitivity than NHBs. Collectively, these findings suggest that GrimAge acceleration was associated with mechanical TS, whereas DunedinPACE was associated with self-reported pain sensitivity. This suggests that GrimAge acceleration may reveal accumulated neuroinflammation which drives alter pain processing over time, while DunedinPACE is closely related to current pain sensitivity-related experiences.
3.4.4. Full Nested Multiple Regression Analyses: Examining Associations Between Dietary Latent Profiles, Epigenetic Aging Markers, and Central Sensitization Indicators
Figure 7a and Figure 7b depict full regression models for all four central sensitization indicators. For CPM, the low pro-inflammatory profile was associated with greater CPM in both the DunedinPACE-adjusted model (β = 58.63, SE = 18.58, p = .002; adjusted R² = 0.091, F(8,102) = 2.37, p = .022) and the GrimAge-adjusted model (β = 62.27, SE = 18.04, p < .001; adjusted R² = 0.100, F(8,102) = 2.53, p = .015), with effect estimates larger than in the CPM-dietary profile-only (β = 34.90, p = .053) and CPM-epigenetic aging only (DunedinPACE: β = 25.40, p = .325; GrimAge: β = 0.208, p = .424) models. In this full model, neither DunedinPACE nor GrimAge acceleration was significantly associated with CPM, indicating that dietary quality, rather than epigenetic aging, accounted for variation in endogenous pain inhibition. A similar pattern emerged for heat TS: the low pro-inflammatory dietary profile was associated with reduced heat TS in both the DunedinPACE model (β = -23.80, SE = 10.30, p = .023; adjusted R² = 0.092, F(8,89) = 2.22, p = .033) and the GrimAge model (β = -21.69, SE = 9.93, p = .032; adjusted R² = 0.090, F(8,89) = 2.20, p = .035), whereas neither DunedinPACE nor GrimAge acceleration reached significance, suggesting that associations between dietary latent profiles and heat TS persisted after adjustment for epigenetic aging markers. Although significant, these findings should be interpreted cautiously given the small size of the low pro-inflammatory subgroup (n = 8).
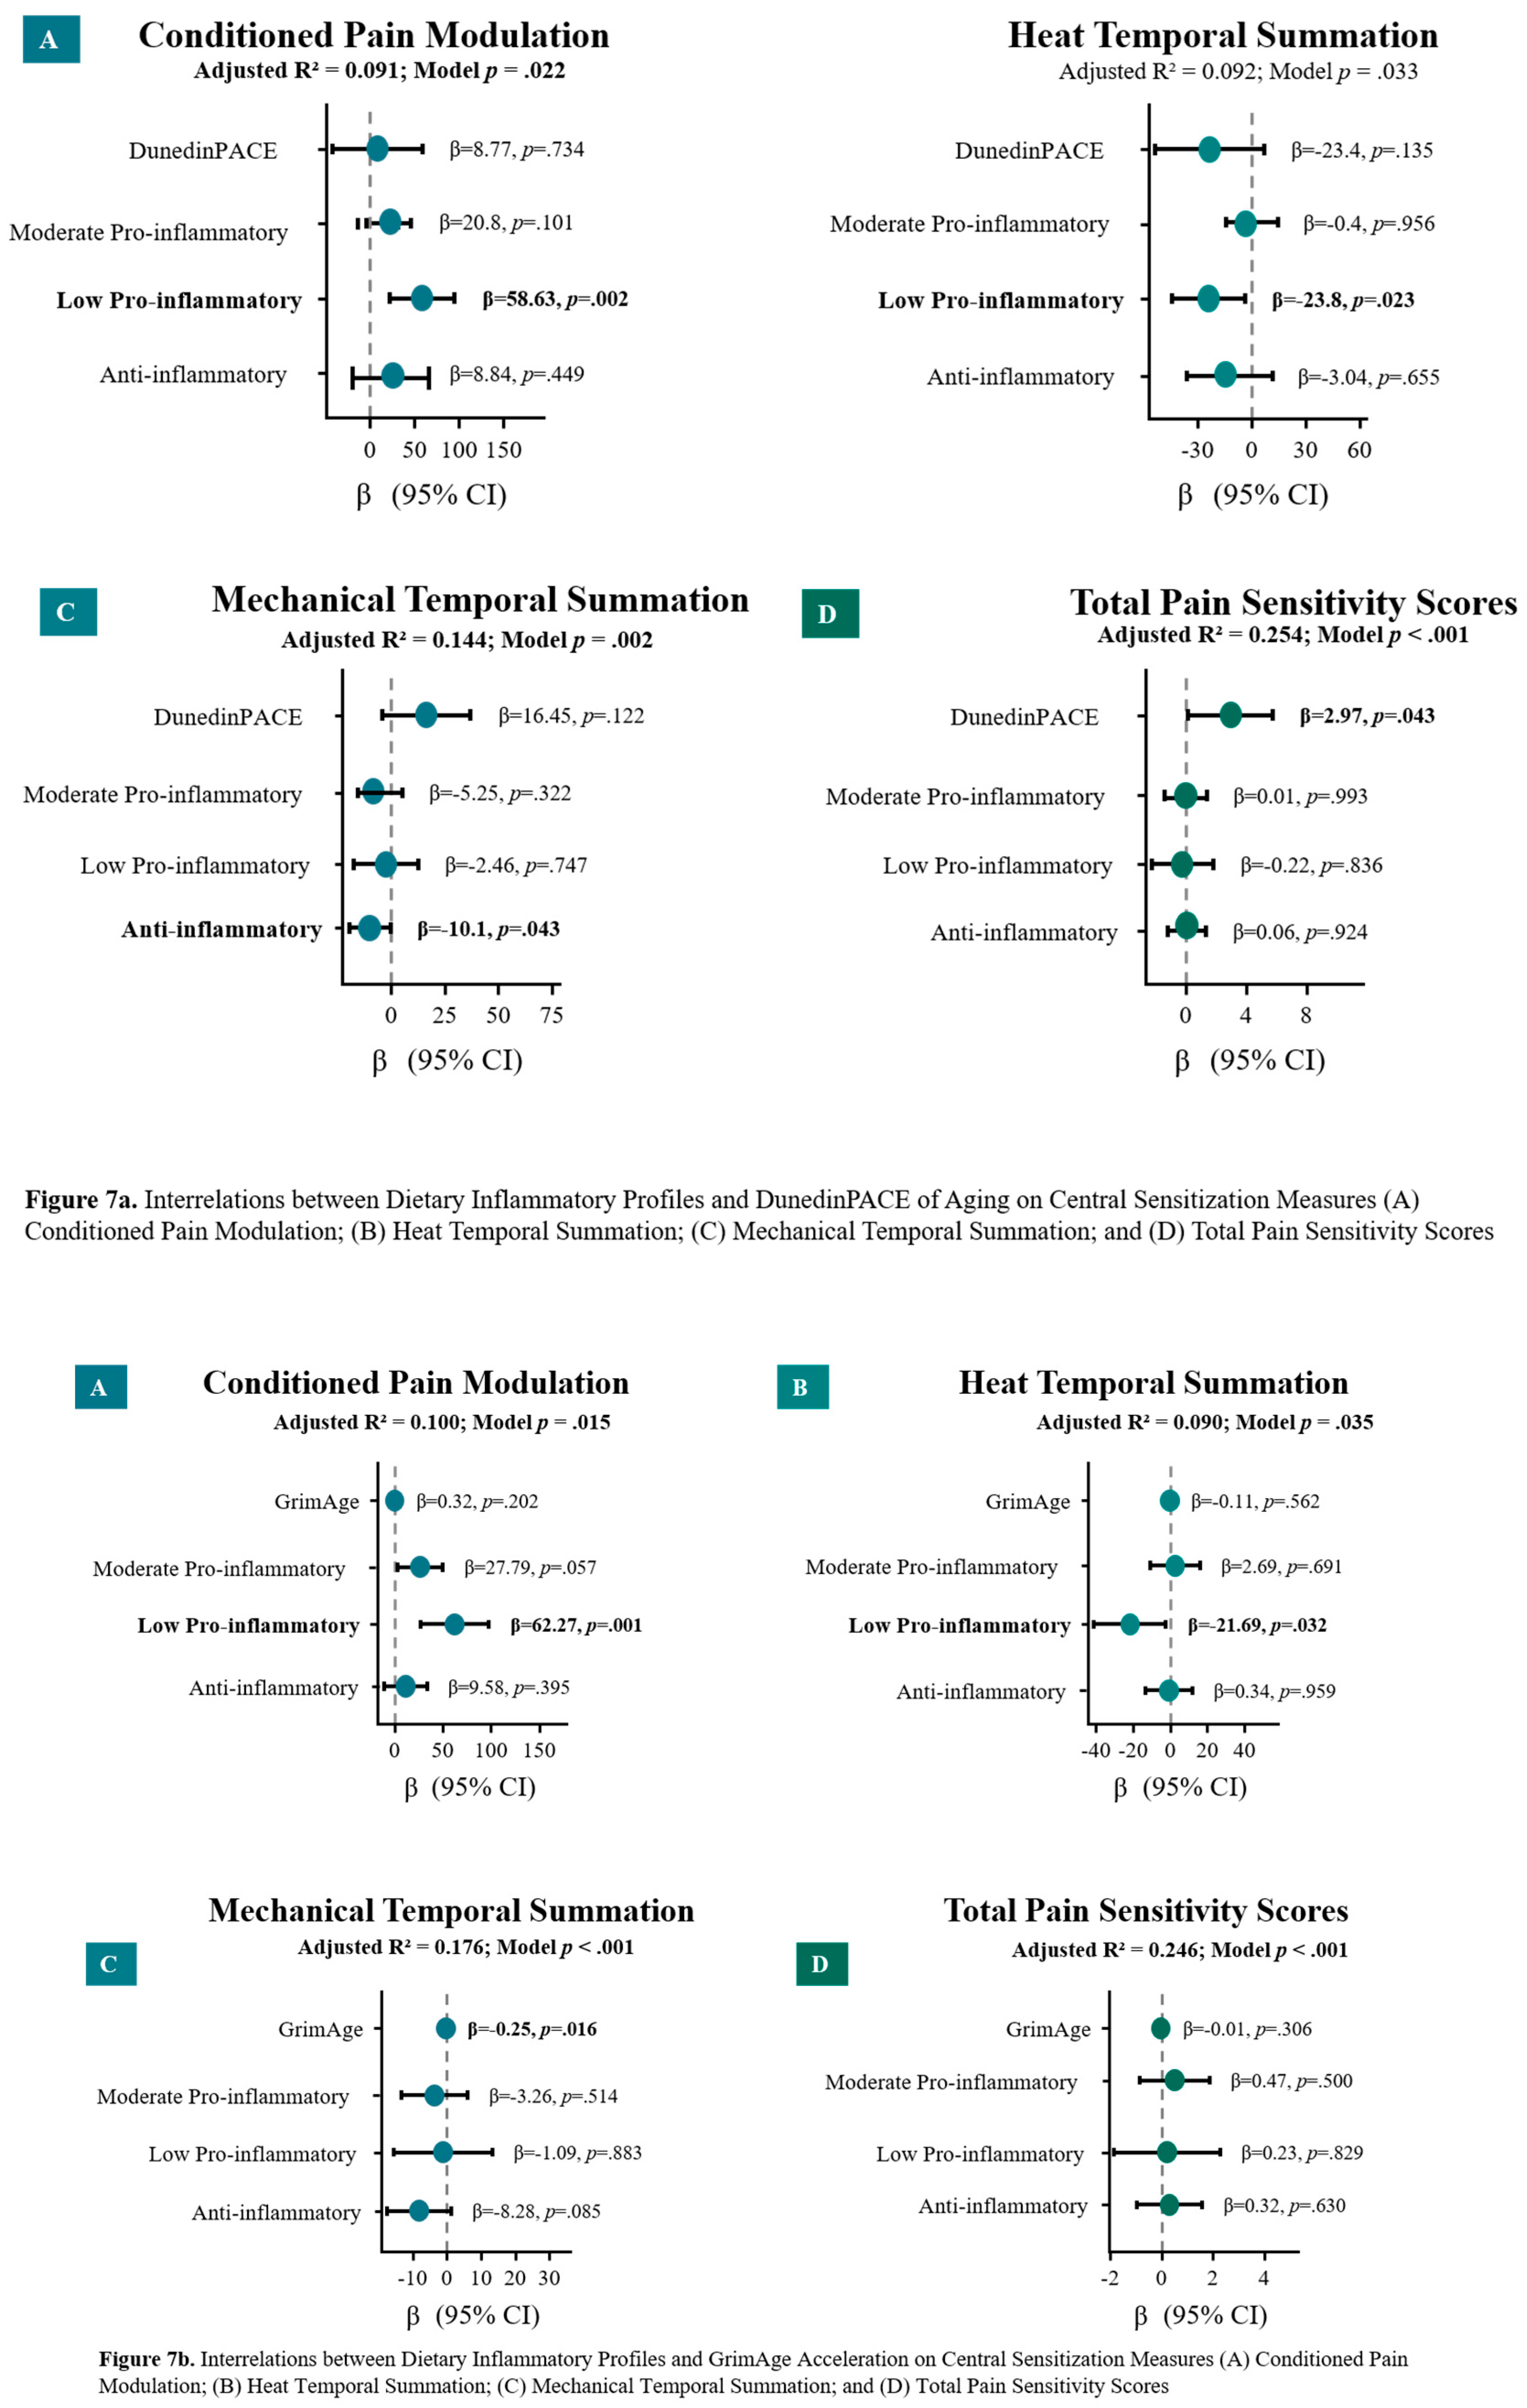
Associations with mechanical TS diverged by epigenetic clock. In the DunedinPACE- model (adjusted R² = 0.144, F(8,100) = 3.28, p = .002), the anti-inflammatory dietary profile was significantly associated with lower mechanical TS (β = -10.10, SE = 4.93, p = .043), while DunedinPACE itself was not. Notably, this dietary effect was significant only following the addition of DunedinPACE to the model, as it was not significant in the diet-mechanical TS only model. Conversely, in the GrimAge acceleration model, which explained more variance (adjusted R² = 0.176, F(8,100) = 3.88, p < .001), GrimAge acceleration was independently associated with lower mechanical TS (β = -0.25, SE = 0.10, p = .016), while dietary profile effects were attenuated, and the anti-inflammatory profile approached significance (β = 8.28, SE = 4.75, p = .085).
For self-reported pain sensitivity, DunedinPACE was the sole significant predictor of interest, with faster DunedinPACE associated with greater self-reported pain sensitivity (β = 2.97, SE = 1.45, p = .043) in a model explaining approximately 25% of outcome variance (adjusted R² = 0.254, F(8,101) = 5.65, p < .001). This association remained unchanged with the inclusion of dietary latent profiles, which were not significant. In the corresponding GrimAge model (adjusted R² = 0.246, F(8,101) = 5.45, p < .001), neither GrimAge acceleration (β = -0.01, p = .306) nor dietary profile reached significance. Collectively, these findings indicate that dietary latent profile was associated with CPM and heat TS after accounting for epigenetic aging, whereas mechanical TS and PSQ were more differentially associated with GrimAge acceleration and DunedinPACE, respectively, underscoring that distinct epigenetic aging metrics may capture unique, outcome-specific dimensions of pain-related biological vulnerability.
Among demographic and anthropometric covariates, race, age, and BMI contributed substantially to the overall variance explained in the heat TS, mechanical TS, and PSQ models. In the GrimAge models, both age and NHW were significant predictors of heat TS and mechanical TS. In the DunedinPACE models, however, race alone was a significant predictor of heat TS, mechanical TS, and pain sensitivity. Sex was not a significant covariate in any of the models.
3.5. False Discovery Rate Correction Using the Benjamini-Hochberg Procedure
Benjamini-Hochberg FDR correction was applied to reduce the likelihood of Type I errors (false-positive findings), which may be likely because we ran many statistical tests [72]. The FDR approach is widely recommended for multiple hypothesis testing because it controls the expected proportion of false discoveries while maintaining greater statistical power than more conservative procedures like Bonferroni correction [72]. Five of eight previously significant associations remained significant after correction (FDR ≤ 0.050). This reveals novel insights into the interplay between dietary profiles, epigenetic aging, and central sensitization mechanisms.
Two significant associations remained between epigenetic aging markers and central sensitization indicators. Accelerated DunedinPACE was associated with greater self-reported pain sensitivity (β = 2.936, SE = 1.364, raw p = .034, FDR p = .034) while GrimAge acceleration was associated with lower mechanical TS (β = -0.270, SE = 0.100, raw p = .008, FDR p = .016). These findings suggest that accelerated epigenetic aging may be associated with alterations in central pain processing and heightened pain sensitivity.
Three significant associations emerged linking low pro-inflammatory profiles and epigenetic aging markers to enhanced pain modulation within the full models. Participants in the low pro-inflammatory diet pattern demonstrated significantly greater CPM compared with the reference high pro-inflammatory group in models containing either GrimAge acceleration (β = 52.685, SE = 15.281, raw p = .001, FDR p = .013) or DunedinPACE (β = 49.788, SE = 15.433, raw p = .002, FDR p = .013). Similarly, the low pro-inflammatory dietary pattern was associated with lower heat TS facilitation in the GrimAge-adjusted model (β = -22.028, SE = 8.270, raw p = .009, FDR p = .049). Collectively, these findings indicate that less inflammatory dietary patterns may be associated with enhanced endogenous pain inhibition and reduced pain facilitation, whereas accelerated epigenetic aging may be associated with increased pain sensitivity and altered nociceptive processing.
4. Discussion
The relationships between diet quality and NSCLBP, as well as epigenetic aging and NSCLBP, have been well documented independently, but studies examining how these two concepts interrelate with central sensitization indicators in individuals with NSCLBP are currently lacking [1,19,20,21,22]. To our knowledge, this is the first study that examines the nested, multi-level interrelations between diet quality measured by DII latent profiles and epigenetic aging quantified by both DunedinPACE and GrimAge acceleration, and their combined predictive effect on four indicators of central sensitization CPM, heat TS, mechanical TS, and self-reported pain sensitivity.
4.1. Key Study Findings
4.1.1. Dietary Inflammatory Profiles, Epigenetic Aging Biomarkers, and Central Sensitization
Compared to a high pro-inflammatory dietary pattern, a low pro-inflammatory one significantly predicted efficient CPM once epigenetic aging markers were added to the models. These relationships were undetectable when dietary profiles were examined with CPM alone, yet became statistically significant when DunedinPACE and GrimAge acceleration were added; and they survived Benjamini-Hochberg correction for multiple testing in both cases. This pattern is consistent with statistical suppression effect, whereby the epigenetic clock absorbs shared variance related to cumulative inflammatory or metabolic burden, thereby clarifying the portion of variance in endogenous pain modulation, attributable to recent/habitual dietary inflammatory potential [76]. Rather than treating diet and epigenetic aging as parallel, independent predictors of CPM, these findings suggest their combined consideration may be necessary to detect diet’s contribution to central sensitization indicators. These findings support our hypothesis that dietary profiles and epigenetic aging jointly influence central sensitization even though the individual epigenetic clocks were not statistically significant. This interpretation is biologically plausible given the well-documented relationship between diet quality and epigenetic aging [25,26,37].
CPM, a psychophysical measure of descending pain inhibition, reflects the capacity of the CNS to modulate nociceptive input. Impaired CPM has been consistently documented in chronic pain conditions and is considered a hallmark of dysfunctional endogenous pain modulation [77]. The positive coefficients observed here indicate that individuals consuming diets lower in pro-inflammatory components exhibit more efficient inhibition, consistent with mechanistic evidence that low pro-inflammatory or anti-inflammatory dietary profiles decrease central sensitization through efficient CPM inhibition [5].
Individuals adhering to a nutrient-dense, plant-rich dietary pattern have demonstrated significantly slower epigenetic aging alongside reductions in inflammatory biomarkers relative to those following a standard, more pro-inflammatory diet [25]. Diet and epigenetic aging are significantly influenced by systemic inflammation. When using unadjusted models, the specific effects of diet on physiological outcomes, such as CPM, may be hidden. However, once we include the aging-clock predictor in the analysis, the remaining dietary effects become apparent. This reflects more immediate or diet-specific inflammatory signaling.
Mechanistically, this fits within a broader literature linking dietary inflammatory potential to pain processing. A U-shaped association between DII and chronic pain prevalence has been reported in a large NHANES sample, with both highly pro-inflammatory and (to a lesser degree) highly anti-inflammatory dietary patterns associated with elevated pain prevalence [20,21,78]. Pro-inflammatory diets are thought to elevate circulating cytokines and oxidative stress markers capable of sensitizing peripheral nociceptors and disrupting descending inhibitory circuitry, whereas anti-inflammatory dietary components (e.g., polyphenols, omega-3 fatty acids, fiber) may support the efficiency of endogenous analgesic pathways underlying CPM [22,79]. Our study adds an important finding: even less pro-inflammatory dietary patterns can protect against altered pain processing compared to high pro-inflammatory patterns.
Our team has also shown that DunedinPACE is the strongest epigenetic predictor of NSCLBP severity and interference, outperforming first- and second-generation clocks including Horvath, Hannum, and PhenoAge in a sample where participants with NSCLBP had significantly higher DunedinPACE than PFCs [1]. The same research group has also revealed that DunedinPACE statistically mediates the relationship between other pain-relevant exposures, such as insomnia, sleep apnea, internalized stigma of chronic pain, resilience, socioeconomic status, and CLBP severity and interference using DunedinPACE [30,80,81,82,83]. This supports our finding that DunedinPACE tracks self-reported, environmental constructs such as diet.
Additionally, low pro-inflammatory diet became inversely associated with heat TS after DunedinPACE and GrimAge acceleration were added to the model, reflecting the suppression effect. The negative coefficients indicate that lower dietary inflammatory load is associated with reduced TS facilitation, suggesting that low pro-inflammatory or anti-inflammatory dietary patterns may attenuate heat TS [5,84]. These findings align with emerging evidence that dietary inflammatory potential modulates pain sensitivity through neuroimmune pathways [84]. Pro-inflammatory diets, characterized by high intake of refined carbohydrates, saturated fats, and processed foods, promote systemic inflammation via increased circulating pro-inflammatory cytokines (e.g., interleukin-6, tumor necrosis factor-α, C-reactive protein), which can sensitize peripheral and central nociceptive pathways [5,21]. Conversely, anti-inflammatory dietary patterns rich in omega-3 fatty acids, polyphenols, and antioxidants may reduce neuroinflammation and enhance endogenous pain inhibition [21,84].
4.1.2. Epigenetic Aging Biomarkers and Central Sensitization Indicators
GrimAge acceleration remained significantly and inversely associated with mechanical TS even after multiple correction, indicating that greater epigenetic age acceleration was associated with less TS facilitation. This is consistent with emerging evidence linking accelerated epigenetic aging to altered somatosensory function. An older epigenome has been associated with greater experimental pain sensitivity in response to thermal and mechanical stimuli, a pattern attributed in part to epigenetic changes in nociceptive signaling pathways [85]. This suggests that DNA methylation-based aging biomarkers may index cumulative biological wear and tear that sensitizes central pain-processing systems independent of chronological age, potentially through mechanisms such as low-grade systemic inflammation, microvascular compromise, or altered nerve fiber integrity that are captured by GrimAge’s constituent methylation surrogates [29]. While few studies have examined the association between the pace of epigenetic aging and central sensitization indicators, limited research has explored the predictive capacity of epigenetic aging on chronic pain outcomes. Several studies have shown that after multiple testing correction, GrimAge acceleration remained the only significant predictor of high-impact knee pain and chronic pain among adults [31,38]. GrimAge’s association with mechanical TS in the present data is consistent with prior work identifying GrimAge, more than other clocks, as sensitive to pain-related epigenetic alterations [86]. In a national sample, high-impact chronic pain was associated with accelerated epigenetic aging across second- and third-generation clocks, and GrimAge specifically was further accelerated in high-impact pain relative to low-impact pain [31].
DunedinPACE, a measure of the pace of biological aging rather than cumulative aging burden showed a positive association with self-reported pain sensitivity [28]. DunedinPACE reflects current changes in pain processing that may be influenced by recent experiences. This finding aligns with emerging evidence that a faster pace of epigenetic aging predicts worse pain outcomes [1,30,81,82]. The positive association between DunedinPACE and self-reported pain sensitivity suggests that individuals experiencing accelerated pace of epigenetic aging may exhibit heightened pain perception, potentially driven by current age-related changes in nociceptive processing, inflammatory signaling, or descending pain modulation [85]. This could also be because the PSQ assesses pain intensity experiences, for which DunedinPACE is a significant predictor.
The divergent directions of these associations, GrimAge acceleration inversely related to mechanical TS while DunedinPACE positively related to pain sensitivity underscore the multidimensional nature of epigenetic aging biomarkers. These measures capture distinct, yet complementary aspects of the aging process: GrimAge reflects cumulative damage and mortality risk like an odometer, whereas DunedinPACE quantifies the current rate of physiological changes like a speedometer [28,29]. These observed patterns may indicate that different epigenetic aging markers relate differently with central sensitization mechanisms, with cumulative aging burden potentially triggering compensatory or adaptive responses that dampen TS, while accelerated aging rate heightens subjective pain sensitivity [87].
4.1.3. Racial Differences Across Central Sensitization Indicators
Persistent racial differences were observed in heat TS, mechanical TS, and self-reported pain sensitivity, but not in CPM. NHBs consistently showed an increased heat TS facilitation and increased self-reported pain sensitivity compared to NHWs, while NHWs showed a significantly increased mechanical TS compared to NHBs [30,82,88]. This dissociation suggests that racial differences manifest more prominently in pain facilitation (TS) than pain inhibition (CPM), potentially reflecting differential effects on spinal pain amplification mechanisms versus supraspinal inhibitory mechanisms. Another reason could be because CPM was not sensitive enough to capture racial differences. A 2017 systematic review of NHBs found higher perception of central sensitization on experimental measures, particularly for heat and mechanical TS, likewise for self-reported pain sensitivity in our study, but not for CPM [89]. Conversely, only mechanical TS revealed that NHWs may have an increased central sensitization compared to NHBs. The persistent, robust association between race and pain sensitivity across our model is well supported by the broader pain differences literature, though the underlying mechanism remains contested. Race is a well-documented predictor of pain burden and pain-related disability, and a substantial body of evidence links these differences to structural and psychosocial pathways, including unequal healthcare access, provider bias in treatment, and physiological consequences of chronic stress related to discrimination, rather than to fixed biological differences in pain processing [88,90,91,92]. Racial and ethnic differences in pain, however, have been explicitly noted in the literature as difficult to attribute definitively to undertreatment, differential reporting, true differences in pain sensitivity, or some combination of these factors, and our cross-sectional design cannot adjudicate between these explanations [93]. Nonetheless, given the consistency and magnitude of the race effect relative to every other tested predictor, our findings reinforce calls in the literature for research and clinical attention to prioritize the sociostructural drivers of pain differences, rather than treating race as a residual demographic covariate of secondary interest [92,94].
4.1.4. Regression Models That Did Not Survive Benjamini-Hochberg Multiple Correction
Some previously significant associations did not survive multiple testing correction, including the positive relationship between DunedinPACE and self-reported pain sensitivity, and none of the full models with heat TS, mechanical TS, and PSQ as outcomes. Interestingly, PSQ was part of an exploratory analysis, to buffer the primary analysis using CPM and TS as primary central sensitization indicators. Conversely, our team had earlier revealed that mechanical TS, rather than CPM predicted movement-evoked pain outcome in the same study participants [39]. However, these findings should be interpreted as hypothesis-generating rather than confirmatory, and they may warrant replication in larger participant samples rather than established effects. The divergent results observed across DunedinPACE and GrimAge acceleration markers is biologically plausible because they capture current aging rates and accumulated aging damage respectively [28,29]. These findings are best treated as candidate relationships meriting replication in a larger sample.
Taken together, the findings suggest that epigenetic aging and diet quality may represent interconnected mechanisms influencing pain processing. Specifically, a faster DunedinPACE and greater GrimAge acceleration were associated with greater pain sensitivity and altered nociceptive facilitation, whereas a low pro-inflammatory diet was associated with enhanced endogenous pain inhibition and reduced TS facilitation compared with a high pro-inflammatory diet. These results support the possibility that dietary interventions targeting inflammation could modify pain-related outcomes, potentially through pathways involving epigenetic aging and central pain modulation. Higher DII scores have been associated with higher DunedinPACE scores, while higher Healthy Eating Index (HEI) scores i.e., healthier dietary patterns have been associated with lower DunedinPACE, indicating that dietary quality makes an independent contribution to epigenetic aging [95]. Future longitudinal studies are needed to determine whether improvements in dietary quality can slow epigenetic aging and, in turn, improve pain regulation.
4.2. Implications of Study Findings
4.2.1. Clinical Implications
Clinicians managing individuals with chronic pain should consider dietary counseling through dieticians as a component of pain management for tailored dietary education. This aligns with a broader shift in pain management toward addressing modifiable lifestyle factors alongside pharmacological and physical interventions. At the same time, clinicians should be cautious about over-interpreting the exploratory epigenetic aging findings; DNA methylation clocks remain research tools, and it would be premature to use them for individual patient risk stratification or treatment decisions based on current evidence. The clinical takeaway at this stage is therefore modest but actionable: dietary quality appears relevant to pain modulation and is already a safe, low-risk target for intervention, regardless of how the epigenetic aging findings ultimately hold up in larger studies.
4.2.2. Research Implications
The finding that dietary inflammatory profile, rather than epigenetic aging, was the most robust correlate of CPM after correction points to diet as a promising and modifiable target for future mechanistic studies of endogenous pain modulation. This suggests that research designed to test whether dietary interventions can improve CPM efficiency, ideally through randomized controlled trials rather than cross-sectional designs, would be a logical next step, since our study cannot establish causality on its own. The exploratory associations involving mechanical TS and GrimAge, and PSQ and DunedinPACE, also suggest that different epigenetic clocks may be differentially sensitive to different central sensitization phenotypes; this reinforces the value of including multiple clocks, rather than a single “default” clock, in future pain and aging research, and argues for adequately powered studies designed specifically to test these clock-outcome pairings rather than relying on exploratory, correction-vulnerable analyses like ours. More broadly, our results add to a growing body of evidence that central sensitization is not a single, unified construct, and that future research should treat CPM, TS, and self-reported pain sensitivity as related but distinct outcomes, each requiring its own validation and interpretation, rather than using them interchangeably as proxies for one another.
4.2.3. Policy Implications
These findings support efforts to further enhance access to nutritious, anti-inflammatory food options, specifically for populations disproportionately affected by chronic pain, associated. Food environment, affordability, and dietary education affect dietary quality as much as individual choice. Study findings extend the broader literature on food-as-medicine and nutrition-focused reimbursement by providing domain-specific evidence, in this case for pain, supporting such policies. Because race remained a significant correlate in nearly every model, policymakers and funders should consider that structural and socioeconomic factors, rather than biology alone, may underlie this association. Further research explicitly designed to disentangle these factors is needed before drawing policy conclusions based on race. Finally, five of eight associations remained statistically significant after multiple corrections. This serves as cautionary reminder for funders and policymakers, i.e., well-powered studies must replicate and confirm single study findings before translating them into real-world practice or policy.
4.3. Study Strengths and Limitations
4.3.1. Study Strengths
This study has several strengths. (1) This study uniquely examines DII profiles across distinct central sensitization phenotypes, demonstrating that dietary and aging effects vary by pain processing mechanism rather than affecting pain uniformly; (2) Using complementary epigenetic aging metrics with distinct biological architectures, we distinguished between aging velocity (DunedinPACE) and cumulative physiological burden (GrimAge), revealing that pain processing is differentially responsive to intrinsic versus extrinsic aging mechanisms. (3) Latent profile analysis identified four empirically distinct dietary inflammatory phenotypes, capturing the heterogeneity of real-world dietary practices while providing clinically meaningful stratification for precision nutrition interventions; (4) Rather than hierarchical mediation, diet and epigenetic aging represent parallel, non-redundant biological pathways influencing pain processing, suggesting synergistic rather than overlapping intervention targets; (5) This investigation bridges nutrition, epigenetic aging biology, inflammatory immunology, and pain neuroscience through an integrated nursing science framework, demonstrating the value of interdisciplinary approaches to better understanding NSCLBP mechanisms; (6) Endogenous pain modulation (CPM) demonstrated independence from both dietary inflammatory profiles and epigenetic aging trajectories, suggesting pain inhibitory capacity represents a preserved biological mechanism accessible to intervention across diverse aging and nutritional phenotypes; (7) The rigorous statistical analyses done, including multiple testing correction alludes to the credibility and reproducibility of the study findings, minimizing the effect of noise and false-positive results; (8) Also, this study was written in accordance with the strengthening the reporting of observational studies in epidemiology (STROBE) guidelines for reporting observational studies [96].
4.3.2. Study Limitations
Study findings should be interpreted considering these limitations. First, these analyses involved a substantial number of statistical models relative to sample size, and although FDR correction was applied to guard against false positives, it cannot fully compensate for the power limitations inherent in testing multiple outcomes and predictors in some sample models as low as 90 to 110 participants. Some true associations may therefore have been missed (false negatives) rather than falsely detected. Second, our reliance on cross-sectional data precludes any causal interpretation of the surviving findings. Third, dietary intake measures are subject to recall error and misclassification, and the two assessed timepoints may not accurately capture an individual’s habitual diet, but just a snapshot. In contrast, epigenetic aging markers reflect accumulated aging pace and burden which may not fully capture currently observed dietary patterns. Fourth, distinguishing modality-specific biological signal from measurement noise remains an unresolved challenge in the broader QST literature, given the documented heterogeneity in protocols and reliability across studies [97,98]. Fifth, the presence of only two racial groups, NHBs and NHWs, limit the generalization of these findings to other racial groups. Future work with larger, racially diverse, adequately powered samples and pre-registered, modality-specific hypotheses will be needed to confirm whether the exploratory associations with heat TS, mechanical TS, and PSQ reported here reflect true, clock- and outcome-specific biological relationships or artifacts of multiple testing. Sixth, dietary estimates from two recalls remain less precise than those from three or more administrations for capturing habitual intake of episodically consumed foods and nutrients, as a larger number of 24-hour recalls may be advisable to increase accuracy in estimating usual intake distributions [47].
5. Conclusion
This study provides novel evidence that diet quality and epigenetic aging jointly, rather than independently, shape central pain processing in adults with NSCLBP. Faster DunedinPACE was associated with greater self-reported pain sensitivity, and slower GrimAge aging was associated with reduced mechanical TS, while a low pro-inflammatory dietary pattern was associated with more efficient CPM and reduced heat TS, but only after accounting for epigenetic aging. These findings suggest that diet and epigenetic aging do not act on central sensitization in isolation; rather, their interplay may better explain variability in pain processing than either factor alone. As one of the first studies to jointly model dietary inflammatory potential and epigenetic aging in relation to multiple central sensitization indicators, this work reframes diet and biological aging not as peripheral risk factors, but as modifiable, mechanistically linked contributors to central pain amplification. These results position dietary intervention as a plausible, low-risk strategy for mitigating central sensitization in NSCLBP and underscore the value of incorporating biological aging markers into future pain research, prevention, and personalized treatment planning.
Author Contributions
Conceptualization: FBATA, PL, BMB, ELS, BRG, ENA; Methodology: FBATA, PL, KWF, LJS; Software: FBATA, PL, KWF, RES; Validation: PL, BMB, ELS, RES, BRG, ENA; Formal analysis: FBATA, PL, LJS; Investigation: FBATA, RES, BRG, ENA; Data curation: FBATA, KKD, AMW, DSO, SSG, AA; Project administration: BRG, ENA, RES, FBATA, DSO, SGG, TSQ; Writing - original draft: FBATA; Writing - review and editing: All authors; Visualization: FBATA, PL, BMB, ELS, KWF, RES, BRG, ENA; Supervision: BRG, ENA, RES, TSQ; Funding acquisition: BRG and ENA. All authors have read and agreed to the published version of the manuscript.
Funding
This research was supported by two NIH grants: R01AR079178 and R01MD010441.
Institutional Review Board Statement
This study was conducted in accordance with the Declaration of Helsinki and approved by the Institutional Review Board of the University of Alabama at Birmingham (IRB-170119003, date of approval 28 January 2020).
Informed Consent Statement
Informed consent was obtained from all participants included in this study, including consent to publish this manuscript.
Data Availability Statement
The data that supported these findings are available upon request from the corresponding author. The data are not publicly available due to privacy or ethical restriction.
Acknowledgments
We thank the entire ERASED team for their support in collecting this data and their guidance in navigating the NDSR software.
Conflicts of Interest
The authors declare no conflict of interest.
Abbreviations
The following abbreviations are used in this manuscript:
| BMI | Body mass index |
| CCA | Complete case analysis |
| CLBP | Chronic low back pain |
| CPM | Conditioned pain modulation |
| DII | Dietary inflammatory index |
| EFSA | European Food Safety Authority |
| FDR | False discovery rate |
| LBP | Low back pain |
| LPA | Latent profile analysis |
| mN | milli Newton |
| NDSR | Nutrition data system for research |
| NHBs | Non-Hispanic Blacks |
| NHWs | Non-Hispanic Whites |
| NSCLBP | Nonspecific chronic low back pain |
| PSQ | Pain sensitivity questionnaire |
| QST | Quantitative sensory testing |
| SE | Standard error |
| STROBE | Strengthening the reporting of observational studies in epidemiology |
| TRAs | Trained research assistants |
| TS | Temporal summation |
| USDA | United states department of agriculture |
| ρs | Spearman correlation coefficient |
References
- Aroke, E.N.; Srinivasasainagendra, V.; Kottae, P.; Quinn, T.L.; Wiggins, A.M.; Hobson, J.; Kinnie, K.; Stoudmire, T.; Tiwari, H.K.; Goodin, B.R. The pace of biological aging predicts nonspecific chronic low back pain severity. J. Pain 2024, 25(4), 974–983. [Google Scholar] [CrossRef]
- Maher, C.; Underwood, M.; Buchbinder, R. Non-specific low back pain. Lancet 2017, 389(10070), 736–747. [Google Scholar] [CrossRef]
- Lim, Y.Z.; Wang, Y.; Cicuttini, F.M.; Hughes, H.J.; Chou, L.; Urquhart, D.M.; Ong, P.X.; Hussain, S.M. Association Between Inflammatory Biomarkers and Nonspecific Low Back Pain: A Systematic Review. Clin. J. Pain 2020, 36(5), 379–389. [Google Scholar] [CrossRef]
- Akinci, A.; Al Shaker, M.; Chang, M.H.; Cheung, C.W.; Danilov, A.; Dueñas, H. José; Kim, Y.C.; Guillen, R.; Tassanawipas, W.; Treuer, T.; Wang, Y. Predictive factors and clinical biomarkers for treatment in patients with chronic pain caused by osteoarthritis with a central sensitisation component. Int. J. Clin. Pract. 2016, 70(1), 31–44. [Google Scholar] [CrossRef]
- Curatolo, M. Cent. Sensitization Pain Pathophysiol. Clin. Insights Curr. Neuropharmacol. 2022. [CrossRef]
- Roussel, N.A.; Nijs, J.; Meeus, M.; Mylius, V.; Fayt, C.; Oostendorp, R. Central Sensitization and Altered Central Pain Processing in Chronic Low Back Pain: Fact or Myth? Clin. J. Pain 2013, 29(7). [Google Scholar] [CrossRef]
- Volcheck, M.M.; Graham, S.M.; Fleming, K.C.; Mohabbat, A.B.; Luedtke, C.A. Central sensitization, chronic pain, and other symptoms: Better understanding, better management. Clevel. Clin. J. Med. 2023, 90(4), 245. [Google Scholar] [CrossRef]
- Woolf, C.J.; Doubell, T.P. The pathophysiology of chronic pain — increased sensitivity to low threshold Aβ-fibre inputs Current Opinion in Neurobiology 1994, 4(4), 525–534.
- Latremoliere, A. C.J. Woolf, Synaptic Plasticity and Central Sensitization: Author Reply. J. Pain 2010, 11(8), 801–803. [Google Scholar] [CrossRef]
- Woolf, C.J. Evid. A Cent. Compon. Post.-Inj. Pain Hypersensitivity Nat. 1983, 306(5944), 686–688.
- Ruscheweyh, R.; Marziniak, M.; Stumpenhorst, F.; Reinholz, J.; Knecht, S. Pain sensitivity can be assessed by self-rating: Development and validation of the Pain Sensitivity Questionnaire PAIN 2009, 146(1), 65–74.
- Granovsky, Y.; Yarnitsky, D. Personalized pain medicine: the clinical value of psychophysical assessment of pain modulation profile. Rambam Maimonides Med. J. 2013, e0024. [Google Scholar] [CrossRef]
- Yarnitsky, D.; Bouhassira, D.; Drewes, A.M.; Fillingim, R.B.; Granot, M.; Hansson, P.; Landau, R.; Marchand, S.; Matre, D.; Nilsen, K.B.; Stubhaug, A.; Treede, R.D.; Wilder-Smith, O.H. Recommendations on practice of conditioned pain modulation (CPM) testing. Eur. J. Pain 2015, 19(6), 805–6. [Google Scholar] [CrossRef]
- Rolke, R.; Baron, R.; Maier, C.; Tölle, T.R.; Treede, D.R.; Beyer, A.; Binder, A.; Birbaumer, N.; Birklein, F.; Bötefür, I.C.; Braune, S.; Flor, H.; Huge, V.; Klug, R.; Landwehrmeyer, G.B.; Magerl, W.; Maihöfner, C.; Rolko, C.; Schaub, C.; Scherens, A.; Sprenger, T.; Valet, M.; Wasserka, B. Quantitative sensory testing in the German Research Network on Neuropathic Pain (DFNS): standardized protocol and reference values. Pain 2006, 123(3), 231–243. [Google Scholar] [CrossRef]
- Goodin, B.R.; Overstreet, D.S.; Penn, T.M.; Bakshi, R.; Quinn, T.L.; Sims, A.; Ptacek, T.; Jackson, P.; Long, D.L.; Aroke, E.N. Epigenome-wide DNA methylation profiling of conditioned pain modulation in individuals with non-specific chronic low back pain. Clin. Epigenet. 2022, 14(1), 1–16. [Google Scholar] [CrossRef]
- Migliorini, F.; Vaishya, R.; Pappalardo, G.; Schneider, M.; Bell, A.; Maffulli, N. Between guidelines and clinical trials: evidence-based advice on the pharmacological management of non-specific chronic low back pain BMC Musculoskelet Disord 2023, 24(1), 432.
- Nijs, J.; Malfliet, A.; Ickmans, K.; Baert, I.; Meeus, M. Treatment of central sensitization in patients with ‘unexplained’ chronic pain: an update. Expert Opin. Pharmacother. 2014, 15(12), 1671–83. [Google Scholar] [CrossRef]
- Shivappa, N.; Steck, S.E.; Hurley, T.G.; Hussey, J.R.; Hébert, J.R. Designing and developing a literature-derived, population-based dietary inflammatory index. Public Health Nutr. 2014, 17(8), 1689–96. [Google Scholar] [CrossRef]
- Shin, D.; Hong, S.J.; Lee, K.W.; Shivappa, N.; Hebert, J.R.; Kim, K. Pro-inflammatory diet associated with low back pain in adults aged 50 and older. Appl. Nurs. Res. 2022, 66, 151589. [Google Scholar] [CrossRef]
- Strath, L.J.; Sims, A.M.; Overstreet, D.S.; Penn, T.M.; Bakshi, R.J.; Stansel, B.K.; Quinn, T.L.; Sorge, R.E.; Long, D.L.; Goodin, B.R. Dietary Inflammatory Index (DII) is Associated with Movement-Evoked Pain Severity in Adults with Chronic Low Back Pain: Sociodemographic Differences. J. Pain 2022, 23(8), 1437–1447. [Google Scholar] [CrossRef]
- Elma, Ö.; Tümkaya Yılmaz, S.; Nijs, J.; Clarys, P.; Coppieters, I.; Mertens, E.; Deliens, T.; Malfliet, A. Proinflammatory dietary intake relates to pain sensitivity in chronic nonspecific low back pain: A case-control study. J. Pain 2024, 25(2), 350–361. [Google Scholar] [CrossRef]
- Agbor, F.; Vance, D.E.; Odii, C.O.; Jones, A.R.; Aroke, E.N. Healthy Diet Consumption Among Chronic Pain Populations: A Concept Analysis. Pain Manag Nurs. 2025. [Google Scholar] [CrossRef]
- Horvath, S. K. Raj. DNA methylation-based biomarkers and the epigenetic clock theory of ageing Nat Rev Genet 2018, 19(6), 371–384. [Google Scholar]
- Bird, A. Perceptions of epigenetics. Nature 2007, 447(7143), 396–8. [Google Scholar] [CrossRef]
- Ferreri, D.M.; Sutliffe, J.T.; Lopez, N.V.; Sutliffe, C.A.; Smith, R.; Carreras-Gallo, N.; Dwaraka, V.B.; Prestrud, A.A.; Fuhrman, J.H. Slower Pace of Epigenetic Aging and Lower Inflammatory Indicators in Females Following a Nutrient-Dense, Plant-Rich Diet Than Those in Females Following the Standard American Diet. Curr. Dev. Nutr. 2024, 8(12), 104497. [Google Scholar] [CrossRef]
- Kresovich, J.K.; Park, Y.-M.M.; Keller, J.A.; Sandler, D.P.; Taylor, J.A. Healthy eating patterns and epigenetic measures of biological age. Am. J. Clin. Nutr. 2022, 115(1), 171–179. [Google Scholar] [CrossRef]
- Stromsnes, K.; Correas, A.G.; Lehmann, J.; Gambini, J.; Olaso-Gonzalez, G. Anti-Inflammatory Properties of Diet: Role in Healthy Aging. Biomedicines 2021, 9(8). [Google Scholar] [CrossRef]
- Belsky, D.W.; Caspi, A.; Corcoran, D.L.; Sugden, K.; Poulton, R.; Arseneault, L.; Baccarelli, A.; Chamarti, K.; Gao, X.; Hannon, E.; Harrington, H.L.; Houts, R.; Kothari, M.; Kwon, D.; Mill, J.; Schwartz, J.; Vokonas, P.; Wang, C.; Williams, B.S.; Moffitt, T.E. DunedinPACE, a DNA methylation biomarker of the pace of aging. Elife 2022. [Google Scholar] [CrossRef]
- Lu, A.T.; Quach, A.; Wilson, J.G.; Reiner, A.P.; Aviv, A.; Raj, K.; Hou, L.; Baccarelli, A.A.; Li, Y.; Stewart, J.D.; Whitsel, E.A.; Assimes, T.L.; Ferrucci, L.; Horvath, S. DNA methylation GrimAge strongly predicts lifespan and healthspan. Aging 2019, 11(2), 303–327. [Google Scholar] [CrossRef]
- Aroke, E.N.; Nagidi, J.G.; Srinivasasainagendra, V.; Quinn, T.L.; Agbor, F.; Kinnie, K.R.; Tiwari, H.K.; Goodin, B.R. The Pace of Biological Aging Partially Explains the Relationship Between Socioeconomic Status and Chronic Low Back Pain Outcomes J Pain Res 2024, 17, 4317–4329.
- Tamargo, J.A.; Strath, L.J.; Cruz-Almeida, Y. High-Impact Pain Is Associated With Epigenetic Aging Among Middle-Aged and Older Adults: Findings From the Health and Retirement Study J Gerontol A Biol Sci Med Sci 2024, 79(8).
- Descalzi, G.; Ikegami, D.; Ushijima, T.; Nestler, E.J.; Zachariou, V.; Narita, M. Epigenetic mechanisms of chronic pain. Trends Neurosci. 2015, 38(4), 237–46. [Google Scholar] [CrossRef]
- Ji, R.R.; Nackley, A.; Huh, Y.; Terrando, N.; Maixner, W. Neuroinflammation and Central Sensitization in Chronic and Widespread Pain. Anesthesiology 2018, 129(2), 343–366. [Google Scholar] [CrossRef]
- Picca, A.; Coelho-Junior, H.J.; Calvani, R.; Marzetti, E.; Vetrano, D.L. Biomarkers shared by frailty and sarcopenia in older adults: A systematic review and meta-analysis. Ageing Res. Rev. 2022, 73, 101530. [Google Scholar] [CrossRef]
- Loggia, M.L.; Chonde, D.B.; Akeju, O.; Arabasz, G.; Catana, C.; Edwards, R.R.; Hill, E.; Hsu, S.; Izquierdo-Garcia, D.; Ji, R.R.; Riley, M.; Wasan, A.D.; Zürcher, N.R.; Albrecht, D.S.; Vangel, M.G.; Rosen, B.R.; Napadow, V.; Hooker, J.M. Evidence for brain glial activation in chronic pain patients. Brain 2015, 138 Pt 3, 604–15. [Google Scholar] [CrossRef]
- Bischoff-Ferrari, H.A.; Gängler, S.; Wieczorek, M.; Belsky, D.W.; Ryan, J.; Kressig, R.W.; Stähelin, H.B.; Theiler, R.; Dawson-Hughes, B.; Rizzoli, R.; Vellas, B.; Rouch, L.; Guyonnet, S.; Egli, A.; Orav, E.J.; Willett, W.; Horvath, S. Individual and additive effects of vitamin D, omega-3 and exercise on DNA methylation clocks of biological aging in older adults from the DO-HEALTH trial. Nat. Aging 2025, 5(3), 376–385. [Google Scholar] [CrossRef]
- Reynolds, L.M.; Houston, D.K.; Skiba, M.B.; Whitsel, E.A.; Stewart, J.D.; Li, Y.; Zannas, A.S.; Assimes, T.L.; Horvath, S.; Bhatti, P.; Baccarelli, A.A.; Tooze, J.A.; Vitolins, M.Z. Diet quality and epigenetic aging in the women’s health initiative. J. Acad. Nutr. Diet. 2024, 124(11), 1419–1430.e3. [Google Scholar] [CrossRef]
- Cruz-Almeida, Y.; Johnson, A.; Meng, L.; Sinha, P.; Rani, A.; Yoder, S.; Huo, Z.; Foster, T.C.; Fillingim, R.B. Epigenetic age predictors in community-dwelling adults with high impact knee pain. Mol. Pain 2022, 18, 17448069221118004. [Google Scholar] [CrossRef]
- Overstreet, D.S.; Michl, A.N.; Penn, T.M.; Rumble, D.D.; Aroke, E.N.; Sims, A.M.; King, A.L.; Hasan, F.N.; Quinn, T.L.; Long, D.L.; Sorge, R.E.; Goodin, B.R. Temporal summation of mechanical pain prospectively predicts movement-evoked pain severity in adults with chronic low back pain. BMC Musculoskelet. Disord. 2021, 22(1), 429. [Google Scholar] [CrossRef]
- Rodríguez-Lagos, L.; Fernández-Carnero, J.; Laguarta-Val, S.; Serrano-García, B.; Martín-Vera, D.; Runge, N.; Arribas-Romano, A. Conditioned pain modulation and temporal summation in patients with knee osteoarthritis: A systematic review and meta-analysis. J. Pain 2025, 33, 105464. [Google Scholar] [CrossRef]
- Penn, T.M.; Overstreet, D.S.; Aroke, E.N.; Rumble, D.D.; Sims, A.M.; Kehrer, C.V.; Michl, A.N.; Hasan, F.N.; Quinn, T.L.; Long, D.L.; Trost, Z.; Morris, M.C.; Goodin, B.R. Perceived Injustice Helps Explain the Association Between Chronic Pain Stigma and Movement-Evoked Pain in Adults with Nonspecific Chronic Low Back Pain. Pain Med. 2020, 21(11), 3161–3171. [Google Scholar] [CrossRef]
- Flanagan, J. C.T. Beck, Polit and Beck’s Nursing Research: Generating and Assessing Evidence for Nursing Practice, 12th ed ed.; Wolters Kluwer, 2025. [Google Scholar]
- Ricordi, C.; Garcia-Contreras, M.; Farnetti, S. Diet and Inflammation: Possible Effects on Immunity, Chronic Diseases, and Life Span. J. Am. Coll. Nutr. 2015, 34(sup1), 10–13. [Google Scholar] [CrossRef]
- Owens, M.A.; Parker, R.; Rainey, R.L.; Gonzalez, C.E.; White, D.M.; Ata, A.E.; Okunbor, J.I.; Heath, S.L.; Merlin, J.S.; Goodin, B.R. Enhanced facilitation and diminished inhibition characterizes the pronociceptive endogenous pain modulatory balance of persons living with HIV and chronic pain. J. Neurovirol 2019, 25(1), 57–71. [Google Scholar] [CrossRef]
- Harte, S.; Harris, R.; Clauw, D. The neurobiology of central sensitization. J. Appl. Biobehav. Res. 2018, 23. [Google Scholar] [CrossRef]
- Akeda, K.; Takegami, N.; Yamada, J.; Fujiwara, T.; Nishimura, A.; Sudo, A. Central sensitization in chronic low back pain: A population-based study of a Japanese mountain village. J. Pain Res. 2021, 14, 1271–1280. [Google Scholar] [CrossRef]
- National Cancer Institute [NCI]. 24-hour dietary recall (24HR) at a glance. 2025. Available online: https://epi.grants.cancer.gov/dietary-assessment-primer/profiles/recall/.
- Biltoft-Jensen, A.; Ygil, K.H.; Knudsen, L.; Matthiessen, J.; Fagt, S.; Trolle, E.; Nielsen, T.H.; Hansen, D.M.; Licht, C.L.; Martens, M.; Hambly, C.; Speakman, J.R.; Christensen, T. Validation of the 2 × 24 h recall method and a 7-d web-based food diary against doubly labelled water in Danish adults. Br. J. Nutr. 2023, 130(8), 1444–1457. [Google Scholar] [CrossRef]
- Feskanich, D.; Sielaff, B.H.; Chong, K.; Buzzard, I.M. Computerized collection and analysis of dietary intake information. Comput. Methods Programs Biomed. 1989, 30(1), 47–57. [Google Scholar] [CrossRef]
- Marx, W.; Veronese, N.; Kelly, J.T.; Smith, L.; Hockey, M.; Collins, S.; Trakman, G.L.; Hoare, E.; Teasdale, S.B.; Wade, A.; Lane, M.; Aslam, H.; Davis, J.A.; O’Neil, A.; Shivappa, N.; Hebert, J.R.; Blekkenhorst, L.C.; Berk, M.; Segasby, T.; Jacka, F. The Dietary Inflammatory Index and Human Health: An Umbrella Review of Meta-Analyses of Observational Studies. Adv. Nutr. 2021, 12(5), 1681–1690. [Google Scholar] [CrossRef]
- Xu, J.; Xie, L.; Fan, R.; Shi, X.; Xu, W.; Dong, K.; Ma, D.; Yan, Y.; Zhang, S.; Sun, N.; Huang, G.; Gao, M.; Yu, X.; Wang, M.; Wang, F.; Chen, J.; Tao, J.; Yang, Y. The role of dietary inflammatory index in metabolic diseases: the associations, mechanisms, and treatments. Eur. J. Clin. Nutr. 2025, 79(5), 397–412. [Google Scholar] [CrossRef]
- Kotemori, A.; Sawada, N.; Iwasaki, M.; Yamaji, T.; Shivappa, N.; Hebert, J.R.; Ishihara, J.; Inoue, M.; Tsugane, S. Dietary Inflammatory Index Is Associated With Inflammation in Japanese Men. Front Nutr. 2021, 604296. [Google Scholar]
- Aroke, E.N.; Jackson, P.; Meng, L.S.; Huo, Z.G.; Overstreet, D.S.; Penn, T.M.; Quinn, T.L.; Cruz-Almeida, Y.; Goodin, B.R. Differential DNA methylation in Black and White individuals with chronic low back pain enrich different genomic pathways. Neurobiol. PAIN 2022. [Google Scholar] [CrossRef]
- Touleimat, N.; Tost, J. Complete Pipeline for Infinium® Human Methylation 450K BeadChip Data Processing Using Subset Quantile Normalization for Accurate DNA Methylation Estimation Epigenomics 2012, 4(3), 325–341.
- Aryee, M.J.; Jaffe, A.E.; Corrada-Bravo, H.; Ladd-Acosta, C.; Feinberg, A.P.; Hansen, K.D.; Irizarry, R.A. Minfi: a flexible and comprehensive Bioconductor package for the analysis of Infinium DNA methylation microarrays. Bioinformatics 2014, 30(10), 1363–1369. [Google Scholar] [CrossRef]
- O’Neill, S.; Holm, L.; Filtenborg, J.B.; Arendt-Nielsen, L.; Nim, C.G. The inhibitory effect of conditioned pain modulation on temporal summation in low-back pain patients. Scand. J. Pain 2021, 21(3), 606–616. [Google Scholar] [CrossRef]
- Petersen, K.K.; O’Neill, S.; Blichfeldt-Eckhardt, M.R.; Nim, C.; Arendt-Nielsen, L.; Vægter, H.B. Pain profiles and variability in temporal summation of pain and conditioned pain modulation in pain-free individuals and patients with low back pain, osteoarthritis, and fibromyalgia Eur J Pain 2025, 29(3), e4741.
- Price, D.D.; McHaffie, J.G. Effects of heterotopic conditioning stimuli on first and second pain: a psychophysical evaluation in humans Pain 1988, 34(3), 245–252.
- Goodin, B.R.; Bulls, H.W.; Herbert, M.S.; Schmidt, J.; King, C.D.; Glover, T.L.; Sotolongo, A.; Sibille, K.T.; Cruz-Almeida, Y.; Staud, R.; Fessler, B.J.; Redden, D.T.; Bradley, L.A.; Fillingim, R.B. Temporal summation of pain as a prospective predictor of clinical pain severity in adults aged 45 years and older with knee osteoarthritis: ethnic differences. Psychosom. Med. 2014, 76(4), 302–10. [Google Scholar] [CrossRef]
- Granot, M.; Granovsky, Y.; Sprecher, E.; Nir, R.R.; Yarnitsky, D. Contact heat-evoked temporal summation: tonic versus repetitive-phasic stimulation. Pain 2006, 122(3), 295–305. [Google Scholar] [CrossRef]
- Coronado, R.A.; George, S.Z. The Central Sensitization Inventory and Pain Sensitivity Questionnaire: An exploration of construct validity and associations with widespread pain sensitivity among individuals with shoulder pain Musculoskeletal Science and Practice 2018, 36, 61–67.
- Azimi, P.; Azhari, S.; Shahzadi, S.; Aghaei, H. Nayeb; Mohammadi, H.R.; Montazeri, A. Outcome Measure of Pain in Patients with Lumbar Disc Herniation: Validation Study of the Iranian version of Pain Sensitivity Questionnaire Asian Spine J 2016, 10(3), 480–487.
- Ruscheweyh, R.; Verneuer, B.; Dany, K.; Marziniak, M.; Wolowski, A.; Çolak-Ekici, R.; Schulte, T.L.; Bullmann, V.; Grewe, S.; Gralow, I.; Evers, S.; Knecht, S. Validation of the pain sensitivity questionnaire in chronic pain patients. Pain 2012, 153(6), 1210–1218. [Google Scholar] [CrossRef]
- Sorgente, A.; Caliciuri, R.; Robba, M.; Lanz, M.; Zumbo, B.D. A systematic review of latent class analysis in psychology: Examining the gap between guidelines and research practice Behav Res Methods 2025, 57(11), 301.
- Bishop, N.J.; Zuniga, K.E.; Ramirez, C.M. Latent profile analysis of dietary intake in a community-dwelling sample of older Americans Public Health Nutr 2020, 23(2), 243–253.
- Pastor, D.A.; Barron, K.E.; Miller, B.J.; Davis, S.L. A latent profile analysis of college students’ achievement goal orientation. Contemp. Educ. Psychol. 2007, 32(1), 8–47. [Google Scholar] [CrossRef]
- Reedy, J.; Wirfält, E.; Flood, A.; Mitrou, P.N.; Krebs-Smith, S.M.; Kipnis, V.; Midthune, D.; Leitzmann, M.; Hollenbeck, A.; Schatzkin, A.; Subar, A.F. Comparing 3 dietary pattern methods--cluster analysis, factor analysis, and index analysis--With colorectal cancer risk: The NIH-AARP Diet and Health Study. Am. J. Epidemiol. 2010, 171(4), 479–87. [Google Scholar] [CrossRef]
- Peng, J.; Xu, T.; Tan, X.; He, Y.; Zeng, Y.; J. Tang, M. Sun Eating Styles Profiles and Correlates in Chinese Postpartum Women: A Latent Profile Analysis. Nutrients 2024, 16, 2299. [Google Scholar] [CrossRef]
- Hardy, M. Regression with Dummy Variables; SAGE Publications, Inc.: Newbury Park, California, 1993. [Google Scholar]
- Johfre, S.S.; Freese, J. Reconsidering the Reference Category. Sociol. Methodol. 2021, 51(2), 253–269. [Google Scholar] [CrossRef]
- Freij, K.W.; Agbor, F.B.A.T.; Domoyeri, P.; Kinnie, K.R.; Wiggins, A.M.; Overstreet, D.S.; Quinn, T.L.; Grewal, S.S.; Thomas, S.J.; Freij, W.W.; Cody, S.L.; Owens, M.A.; Sorge, R.E.; Goodin, B.R.; Aroke, E.N. Beyond restless sleep: A cross-sectional study of obstructive sleep apnea risk, aging biomarkers, and chronic low back pain. Mol. Pain 2026, 17448069261427979. [Google Scholar] [CrossRef]
- Benjamini, Y.; Hochberg, Y. Controlling the False Discovery Rate: A Practical and Powerful Approach to Multiple Testing. J. R. Stat. Soc. Ser. B (Methodological) 1995, 57(1), 289–300. [Google Scholar] [CrossRef]
- Bartlett, J.W.; Carpenter, J.R.; Tilling, K.; Vansteelandt, S. Improving upon the efficiency of complete case analysis when covariates are MNAR. Biostatistics 2014, 15(4), 719–30. [Google Scholar] [CrossRef]
- Ross, R.K.; Breskin, A.; Westreich, D. When Is a Complete-Case Approach to Missing Data Valid? The Importance of Effect-Measure Modification Am J Epidemiol 2020, 189(12), 1583–1589.
- Elmadfa, I.; Meyer, A.L. The Role of the Status of Selected Micronutrients in Shaping the Immune Function. Endocr. Metab. Immune Disord. Drug Targets 2019, 19(8), 1100–1115. [Google Scholar] [CrossRef]
- MacKinnon, D.P.; Krull, J.L.; Lockwood, C.M. Equivalence of the mediation, confounding and suppression effect. Prev. Sci. 2000, 1(4), 173–81. [Google Scholar] [CrossRef]
- Woolf, C.J. Cent. Sensitization Implic. Diagn. Treat. Pain PAIN 2011, 152(3).
- Qing, L.; Zhu, Y.; Yu, C.; Zhang, Y.; Ni, J. Exploring the association between dietary Inflammatory Index and chronic pain in US adults using NHANES 1999-2004 Sci Rep 2024, 14(1), 8726.
- Kaushik, A.S. L.J. Strath, and R.E. Sorge. Dietary Interventions for Treatment of Chronic Pain: Oxidative Stress and Inflammation Pain and Therapy 2020, 9(2), 487–498. [Google Scholar]
- Aroke, E.N.; Wiggins, A.M.; Hobson, J.M.; Srinivasasainagendra, V.; Quinn, T.L.; Kottae, P.; Tiwari, H.K.; Sorge, R.E.; Goodin, B.R. The pace of biological aging helps explain the association between insomnia and chronic low back pain. Mol. Pain 2023, 19, 17448069231210648. [Google Scholar] [CrossRef]
- Kinnie Davis, K.; Freij, K.W.; Agbor, F.B.A.T.; Wiggins, A.M.; Quinn, T.L.; Overstreet, D.S.; Grewal, S.S.; Sorge, R.E.; Goodin, B.R.; Aroke, E.N. Pain Resilience and Chronic Low Back Pain Outcomes: The Mediating Role of Pace of Biological Aging. Biol. Res. Nurs. 2025, 27(4), 620–629. [Google Scholar] [CrossRef]
- Freij, K.W.; Agbor, F.; Kinnie, K.R.; Srinivasasainagendra, V.; Quinn, T.L.; Tiwari, H.K.; Sorge, R.E.; Goodin, B.R.; Aroke, E.N. The pace of biological aging significantly mediates the relationship between internalized stigma of chronic pain and chronic low back pain severity among non-hispanic black but not non-hispanic white adults Neurobiol Pain 2024, 16, 100170.
- Freij, K.W.; Agbor, F.B.; Domoyeri, P.; Kinnie, K.R.; Wiggins, A.M.; Overstreet, D.S.; Quinn, T.L.; Grewal, S.S.; Thomas, S.J.; Freij, W.W.; Cody, S.L.; Owens, M.A.; Sorge, R.E.; Goodin, B.R.; Aroke, E.N. Beyond restless sleep: A cross-sectional study of obstructive sleep apnea risk, aging biomarkers, and chronic low back pain. Mol. Pain 2026, 22, 17448069261427979. [Google Scholar] [CrossRef]
- Eller-Smith, O.C.; Nicol, A.L.; Christianson, J.A. Potential Mechanisms Underlying Centralized Pain and Emerging Therapeutic Interventions. Front Cell Neurosci. 2018, 12, 35. [Google Scholar] [CrossRef]
- Cruz-Almeida, Y.; Sinha, P.; Rani, A.; Huo, Z.; Fillingim, R.B.; Foster, T. Epigenetic aging is associated with clinical and experimental pain in community-dwelling older adults. Mol. Pain 2019, 15, 1744806919871819. [Google Scholar] [CrossRef]
- Hackett, J.; Naugle, K.E.; Naugle, K.M. The Decline of Endogenous Pain Modulation With Aging: A Meta-Analysis of Temporal Summation and Conditioned Pain Modulation J Pain 2020, 21(5-6), 514–528.
- Kwiatkowska, K.M.; Bacalini, M.G.; Sala, C.; Kaziyama, H.; de Andrade, D.C.; Terlizzi, R.; Giannini, G.; Cevoli, S.; Pierangeli, G.; Cortelli, P.; Garagnani, P.; Pirazzini, C. Analysis of Epigenetic Age Predictors in Pain-Related Conditions. Front Public Health 2020, 172. [Google Scholar] [CrossRef]
- Aroke, E.N.; Freij, K.W.; Agbor, F.B.A.T.; Kinnie, K.R.; Domoyeri, P.; Mosley, P.J.; Wiggins, A.M.; Quinn, T.L.; Grewal, S.S.; Aurora, A.; Sorge, R.E.; Goodin, B.R. Structural and individualized racism drives racial disparities in chronic low back pain: A cross-sectional serial mediation analysis. J. Pain 2026, 106351. [Google Scholar] [CrossRef]
- Kim, H.J.; Yang, G.S.; Greenspan, J.D.; Downton, K.D.; Griffith, K.A.; Renn, C.L.; Johantgen, M.; Dorsey, S.G. Racial and ethnic differences in experimental pain sensitivity: systematic review and meta-analysis. Pain 2017, 158(2), 194–211. [Google Scholar] [CrossRef]
- Thomas, P.A.; Goodin, B.R.; Meints, S.M.; Owens, M.A.; Wiggins, A.M.; Quinn, T.; Long, L.; Aroke, E.N.; Morris, M.C.; Sorge, R.E. D.S. Overstreet, Adverse Childhood Experiences and Chronic Low Back Pain in Adulthood: The Role of Emotion Regulation. J. Pain 2024, 25(9), 104551. [Google Scholar] [CrossRef]
- Pham, T.V.; Doorley, J.; Kenney, M.; Joo, J.H.; Shallcross, A.J.; Kincade, M.; Jackson, J.; Vranceanu, A.M. Addressing chronic pain disparities between Black and White people: a narrative review of socio-ecological determinants. Pain Manag 2023, 13(8), 473–496. [Google Scholar] [CrossRef]
- Vargas, A.J.; Tobey-Moore, L.; Curran, G.M.; Elkhateb, R.; Sexton, K.W.; Bailey, B.J.; Nagel, C.; Goree, J.H. Exploring Racial Disparities in Chronic Pain Management. J. Pain Res. 2025, 18, 2901–2908. [Google Scholar] [CrossRef]
- Anderson, K.O.; Green, C.R.; Payne, R. Racial and Ethnic Disparities in Pain: Causes and Consequences of Unequal Care. J. Pain 2009, 10(12), 1187–1204. [Google Scholar]
- Knoebel, R.W.; Starck, J.V.; Miller, P. Treatment Disparities Among the Black Population and Their Influence on the Equitable Management of Chronic Pain Health Equity 2021, 5(1), 596–605.
- Shen, B.; Hooten, N. Noren; Mode, N.A.; Kuczmarski, M. Fanelli; Zonderman, A.B.; Evans, M.K. Lower diet quality accelerates DNA methylation-based age. Geroscience 2026, 48(2), 2903–2911. [Google Scholar] [CrossRef]
- Ghaferi, A.A.; Schwartz, T.A.; Pawlik, T.M. STROBE Reporting Guidelines for Observational Studies. JAMA Surg. 2021, 156(6), 577–578. [Google Scholar] [CrossRef]
- Hübscher, M.; Moloney, N.; Leaver, A.; Rebbeck, T.; McAuley, J.H.; Refshauge, K.M. Relationship between quantitative sensory testing and pain or disability in people with spinal pain—A systematic review and meta-analysis PAIN® 2013, 154(9), 1497–1504.
- Arribas-Romano, A.; Fernández-Carnero, J.; Beltran-Alacreu, H.; Alguacil-Diego, I.M.; Cuenca-Zaldívar, J.N.; Rodríguez-Lagos, L.; Runge, N.; Mercado, F. Conditioned Pain Modulation and Temporal Summation of Pain in Patients With Traumatic and Non-Specific Neck Pain: A Systematic Review and Meta-Analysis. J. Pain 2024, 25(2), 312–330. [Google Scholar] [CrossRef]
Table 1.
Model Fit Statistics and Vuong-Lo-Mendell-Rubin Ratio Test for Latent Profile Analysis.
| Model Fit Statistics | VLMR | |||||||||
| Latent Profiles | df | LL | AIC | BIC | SABIC | Entropy | Class Probabilities | Mean | SD | P-value |
| 1 | 32 | -28320.95 | 56765.91 | 56970.40 | 56773.98 | 1.000 | 1.000 | 0.987 | 3.422 | - |
| 2 | 32 | -27519.66 | 55227.32 | 55537.36 | 55239.56 | 0.992 | 0.994 | 0.958 | 1.092 | <.001 |
| 3 | 32 | -27066.51 | 54385.02 | 54800.61 | 54401.43 | 0.963 | 0.981 | 1.000 | 6.438 | <.001 |
| 4 | 32 | -26917.55 | 54151.10 | 54672.24 | 54171.68 | 0.971 | 0.968 | 0.990 | 5.007 | <.001 |
| 5 | 32 | -26770.51 | 53921.03 | 54547.71 | 53945.77 | 0.978 | 0.980 | 0.990 | 3.479 | <.001 |
Note. AIC: Akaike information criterion; BIC: Bayesian information criterion; df: degree of freedom; LL; log-likelihood, SABIC: Sample-size adjusted Bayesian information criterion, VLMR: Vuong-Lo-Mendell-Rubin likelihood ratio test.
Table 2.
Descriptive Statistics of Sociodemographic and Clinical Variables Latent Dietary Profiles.
| Characteristic |
Anti-Inflammatory N = 121 |
Low Pro-Inflammatory N = 81 |
Moderate Pro-Inflammatory N = 621 |
High Pro-Inflammatory N = 1181 |
Missing Cases (n) | *Effect Size |
** F / χ² Statistic |
P-value2 |
| Age (years) - mean (SD) | 47 (15) | 47 (18) | 45 (14) | 44 (14) | 3 | 0.006 | 0.410 | 0.7 |
| Sex n (%) | 0 | 0.129 | 6.340 | 0.10 | ||||
| Female | 6 (50%) | 1 (13%) | 35 (56%) | 68 (58%) | ||||
| Male | 6 (50%) | 7 (88%) | 27 (44%) | 50 (42%) | ||||
| Race n (%) | 0 | 0.000 | 2.810 | 0.4 | ||||
| Black or African American | 8 (67%) | 3 (38%) | 36 (58%) | 76 (64%) | ||||
| White, Caucasian, or European | 4 (33%) | 5 (63%) | 26 (42%) | 42 (36%) | ||||
| Household Income n (%) | 34 | 0.086 | 12.640 | 0.2 | ||||
| Very low income | 1 (9.1%) | 2 (25%) | 12 (24%) | 31 (32%) | ||||
| Low income | 6 (55%) | 1 (13%) | 12 (24%) | 19 (20%) | ||||
| Moderate income | 3 (27%) | 2 (25%) | 18 (35%) | 35 (36%) | ||||
| High income | 1 (9.1%) | 3 (38%) | 9 (18%) | 11 (11%) | ||||
| Highest level of Education n (%) | 3 | 0.119 | 20.360 | 0.061 | ||||
| No degree | 0 (0%) | 2 (25%) | 5 (8.1%) | 7 (6.1%) | ||||
| High School Diploma / GED | 4 (33%) | 2 (25%) | 25 (40%) | 47 (41%) | ||||
| Associate / Bachelor’s degree | 3 (25%) | 3 (38%) | 17 (27%) | 46 (40%) | ||||
| Masters or Higher / Professional | 3 (25%) | 0 (0%) | 11 (18%) | 14 (12%) | ||||
| Other | 2 (17%) | 1 (13%) | 4 (6.5%) | 1 (0.9%) | ||||
| Employment Status n (%) | 2 | 0.028 | 12.520 | 0.4 | ||||
| Employed | 5 (42%) | 4 (50%) | 42 (68%) | 70 (60%) | ||||
| Unemployed | 4 (33%) | 2 (25%) | 10 (16%) | 30 (26%) | ||||
| Student | 1 (8.3%) | 2 (25%) | 3 (4.8%) | 6 (5.2%) | ||||
| Retired | 2 (17%) | 0 (0%) | 4 (6.5%) | 7 (6.0%) | ||||
| Other | 0 (0%) | 0 (0%) | 3 (4.8%) | 3 (2.6%) | ||||
| Marital Status n (%) | 0 | 0.000 | 8.300 | 0.8 | ||||
| Married | 3 (25%) | 1 (13%) | 21 (34%) | 37 (31%) | ||||
| Single | 6 (50%) | 6 (75%) | 25 (40%) | 57 (48%) | ||||
| Relationship | 1 (8.3%) | 1 (13%) | 8 (13%) | 17 (14%) | ||||
| Widowed | 1 (8.3%) | 0 (0%) | 4 (6.5%) | 2 (1.7%) | ||||
| Other | 1 (8.3%) | 0 (0%) | 4 (6.5%) | 5 (4.2%) | ||||
| BMI (kg/m2)- mean (SD) | 34 (12) | 28 (5) | 32 (8) | 31 (7) | 4 | 0.030 | 1.980 | 0.12 |
| Total DII score - mean (SD) | -0.26 (1.10) | 0.11 (1.71) | 0.84 (1.29) | 2.62 (1.19) | 0 | 0.411 | 45.590 | < 0.001 |
| Total PSQ score | 4.88 (1.86) | 4.35 (1.78) | 5.21 (2.12) | 5.26 (2.19) | 4 | 0.008 | 0.540 | 0.7 |
| DunedinPACE (score) - mean (SD) | 1.16 (0.20) | 1.22 (0.12) | 1.28 (0.12) | 1.24 (0.14) | 85 | 0.055 | 2.140 | 0.10 |
| GrimAge acceleration (year) - mean (SD) | 2 (9) | -3 (5) | -2 (8) | 2 (15) | 85 | 0.021 | 0.800 | 0.5 |
| CPM - mean (SD) | 6 (28) | 43 (52) | 21 (38) | 16 (38) | 1 | 0.026 | 1.740 | 0.2 |
| Heat TS - mean (SD) | 1 (10) | -14 (28) | 1 (20) | -3 (21) | 20 | 0.024 | 1.450 | 0.2 |
| Mechanical TS - mean (SD) | 15 (19) | 14 (15) | 13 (15) | 11 (16) | 2 | 0.009 | 0.560 | 0.6 |
Note. 1Mean (SD); n (%); 2One-way analysis of means; Pearson’s Chi-squared test; CPM: conditioned pain modulation; DII: dietary inflammatory index; PSQ: pain sensitivity questionnaire; TS: temporal summation. *= Cramer’s V for categorical and Eta-squared continuous variables. ** = Chi-squared test for categorical and F-statistic for continuous variables.
Disclaimer/Publisher’s Note: The statements, opinions and data contained in all publications are solely those of the individual author(s) and contributor(s) and not of MDPI and/or the editor(s). MDPI and/or the editor(s) disclaim responsibility for any injury to people or property resulting from any ideas, methods, instructions or products referred to in the content. |
© 2026 by the authors. Licensee MDPI, Basel, Switzerland. This article is an open access article distributed under the terms and conditions of the Creative Commons Attribution (CC BY) license.
Copyright: This open access article is published under a Creative Commons CC BY 4.0 license, which permit the free download, distribution, and reuse, provided that the author and preprint are cited in any reuse.