

Submitted:
03 September 2026
Posted:
03 September 2026
You are already at the latest version
Abstract
White onion (Allium fistulosum L.) is an economically important crop whose productivity and commercial quality can be affected by fungal diseases. This study evaluated the in vitro sensitivity of Fusarium sp., Penicillium sp., Alternaria sp., and Ulocladium sp. to six fungicides with different modes of action: the demethylation inhibitors (DMIs) tebuconazole and mefentrifluconazole, the quinone outside inhibitors (QoIs) pyraclostrobin and azoxystrobin, and the methyl benzimidazole carbamates (MBCs) thiophanate-methyl and thiabendazole. Fungicides were incorporated into potato dextrose agar (PDA) at concentrations of 0, 0.1, 1, 10, 100, and 500 ppm, and sensitivity was assessed based on mycelial growth rate (MGR) and median effective concentration (EC₅₀). Fungicide concentration significantly affected MGR (p < 0.05) in most fungus–fungicide combinations, although the magnitude of the response varied among fungal isolates and active ingredients. Fusarium sp. was highly sensitive to tebuconazole (EC₅₀ = 0.10 µg mL⁻¹), thiophanate-methyl (0.02 µg mL⁻¹), and thiabendazole (0.11 µg mL⁻¹), whereas Alternaria sp. showed high sensitivity to mefentrifluconazole (0.019 µg mL⁻¹), azoxystrobin (0.01 µg mL⁻¹), and pyraclostrobin (0.04 µg mL⁻¹). Penicillium sp. was highly sensitive to tebuconazole (0.07 µg mL⁻¹) and azoxystrobin (0.06 µg mL⁻¹), but showed markedly reduced sensitivity to mefentrifluconazole (749.53 µg mL⁻¹). Ulocladium sp. exhibited variable responses, ranging from high sensitivity to azoxystrobin (0.10 µg mL⁻¹) and thiabendazole (0.32 µg mL⁻¹) to moderate sensitivity to tebuconazole (7.46 µg mL⁻¹), pyraclostrobin (8.81 µg mL⁻¹), and thiophanate-methyl (6.90 µg mL⁻¹). Overall, the results demonstrated substantial fungus–fungicide-specific variation, including differences between active ingredients belonging to the same FRAC group. These findings provide baseline information for fungicide sensitivity monitoring and support the rational rotation of fungicides with different modes of action for sustainable disease management in white onion production.
Keywords:
Allium fistulosum
; fungicide sensitivity
; EC50
; mycelial growth
; fungicide resistance
1. Introduction
White onion (Allium fistulosum L.), commonly known as Welsh onion, is a vegetable species native to the Far East [1] and is widely valued for its culinary and medicinal uses [2,3,4]. In 2024, the global cultivated area reached 250,443 ha, with a total production of 5,576,778.38 tons. The regional distribution of production was concentrated mainly in Africa (44.5%) and Asia (43.6%), followed by the Americas (4.9%), Oceania (4.8%), and Europe (2.2%). In Latin America, this crop is economically important because of its high demand for fresh consumption and its contribution to local agricultural systems. In Ecuador, approximately 11,111 ha were cultivated, with an estimated production of 98,846.97 tons [3]. At the local level, Santa Fe de Galán parish, in Chimborazo Province, has approximately 361.23 ha devoted to this crop [4].
Despite its economic importance, white onion production is constrained by diseases associated with phytopathogenic fungi that affect roots, foliage, and harvested tissues, potentially resulting in substantial yield and quality losses under favorable environmental conditions. Among the fungal genera associated with the crop are Fusarium, Alternaria, Penicillium, and Ulocladium, which may be involved in root deterioration, foliar lesions, and postharvest damage. In addition to reducing crop productivity and commercial quality, fungal diseases can increase production costs due to the need for repeated fungicide applications [5].
Chemical control remains an important component of fungal disease management. However, the recurrent use of fungicides with the same mode of action imposes selection pressure on fungal populations and may favor the development and establishment of resistant phenotypes. Fungicide resistance is therefore an important challenge for sustainable disease management because it can progressively reduce the efficacy of commonly used chemical groups, including demethylation inhibitors (DMIs), quinone outside inhibitors (QoIs), and methyl benzimidazole carbamates (MBCs) [6,7]. Consequently, understanding the sensitivity of fungal populations to fungicides with different modes of action is essential for designing effective resistance-management strategies.
In vitro sensitivity assays provide a useful approach for detecting differences in fungal responses to active ingredients before reduced efficacy becomes evident under field conditions. Fungal sensitivity can be quantified by evaluating parameters such as mycelial growth, spore germination, or biomass production across a range of fungicide concentrations. Dose–response data can then be used to estimate the median effective concentration (EC₅₀), defined as the concentration required to reduce fungal growth or another measured response by 50% relative to the untreated control [8,11]. EC₅₀ values provide a quantitative basis for comparing the relative sensitivity of fungal isolates and active ingredients and may contribute to the establishment of baseline sensitivity and the detection of shifts associated with fungicide resistance.
Sensitivity to fungicides can vary considerably among fungal species and isolates, even within the same population. Such variation may be influenced by genetic background, previous exposure to fungicides, selection pressure, application frequency, and resistance mechanisms such as alterations in target sites or increased activity of efflux systems [9]. Therefore, evaluating fungal isolates against fungicides belonging to different chemical groups and modes of action is important for identifying differences in sensitivity and supporting more rational fungicide use within integrated disease management programs [10].
Accordingly, the objective of this study was to evaluate the in vitro sensitivity of four fungal genera, Fusarium sp., Penicillium sp., Alternaria sp., and Ulocladium sp., associated with white onion (Allium fistulosum L.) in Santa Fe de Galán parish, Chimborazo Province, Ecuador, to fungicides with different modes of action. Mycelial growth responses and EC₅₀ values were used to characterize differences in sensitivity among the fungal isolates and active ingredients, providing baseline information to support more efficient fungicide selection and sustainable disease management in white onion production.
2. Materials and Methods
2.1. Sample Collection
Samples were collected from an established white onion crop located in Santa Fe de Galán parish, Chimborazo Province, Ecuador (1°39′05″ S, 78°41′00″ W; 2,833 m a.s.l.). A total of 50 samples, comprising root and foliar tissues, were collected from plants exhibiting disease symptoms. The samples were individually placed in sterile plastic bags, transported under refrigerated conditions, and stored at 4–8 °C until subsequent fungal isolation and laboratory analysis.
2.2. Isolation of Fungi Associated with the Crop
Root and foliar tissues, with and without visible disease symptoms, were processed for fungal isolation. Tissue fragments (approximately 4 mm) were excised from the interface between healthy and symptomatic tissue using a sterile scalpel. The fragments were surface-disinfected by immersion in 70% ethanol for 30 s, followed by 2% sodium hypochlorite for 2 min, and subsequently rinsed with sterile distilled water for 2 min. The disinfected tissue fragments were placed on Petri dishes containing potato dextrose agar (PDA) and Rose Bengal medium supplemented with ampicillin and biconcilin. The plates were sealed with Parafilm and incubated at 25 ± 2 °C for 10 days.
After incubation, fungal colonies emerging from the tissue fragments were subcultured by transferring actively growing mycelial fragments to new Petri dishes containing PDA supplemented with 100 ppm chloramphenicol.. The cultures were incubated at 25 ± 2 °C for 10 days in the dark until pure fungal cultures were obtained for subsequent morphological identification [12,13]. From the fungal isolates recovered from the 50 root and foliar samples collected in Santa Fe de Galán, four genera were selected for the in vitro fungicide sensitivity assays: Fusarium sp., Penicillium sp., and Ulocladium sp. isolated from root tissues, and Alternaria sp. isolated from foliar tissue (Table 1).
Thefungicides evaluated in this study were classified according to the Fungicide Resistance Action Committee (FRAC) classification, based on their mode and site of action. Three FRAC groups were included: G1, corresponding to demethylation inhibitors (DMIs); C3, corresponding to quinone outside inhibitors (QoIs); and B1, corresponding to inhibitors of β-tubulin assembly during mitosis. The G1 group included the triazoles tebuconazole and mefentrifluconazole; the C3 group included the strobilurins pyraclostrobin and azoxystrobin; and the B1 group included the benzimidazoles thiophanate-methyl and thiabendazole (Table 2).
2.3. Plating of Fusarium sp., Penicillium sp., Alternaria sp., and Ulocladium sp.
Mycelial discs (approximately 5.13 mm in diameter) were obtained from actively growing cultures of Fusarium sp., Penicillium sp., Alternaria sp., and Ulocladium sp. using a sterile cork borer. Each mycelial disc was placed in a Petri dish containing PDA medium amended with the corresponding fungicide concentration. The plates were labeled, sealed with plastic film, and incubated in the dark at 25 ± 2 °C until the fungal colony in the untreated control (0 ppm) completely covered the Petri dish. The percentage of mycelial growth inhibition was determined relative to the untreated control. The resulting inhibition values were classified according to the scale established by [9] into three categories: low inhibition (0–25%), moderate inhibition (25–50%), and high inhibition (>50%) (Table 3).
2.8. Estimation of the Average Effective Concentration (EC50)
The median effective concentration (EC₅₀) was estimated from the mycelial growth response of each fungal isolate to the different fungicide concentrations. Mycelial growth inhibition relative to the untreated control (0 ppm) was calculated for each fungicide concentration. The EC₅₀, defined as the fungicide concentration required to inhibit mycelial growth by 50% relative to the untreated control, was estimated from the relationship between the percentage of mycelial growth inhibition and the log₁₀-transformed fungicide concentration. EC₅₀ values were calculated in R using the ec50estimator package and were estimated separately for each fungal isolate and active ingredient.
2.9. Sensitivity Range
Fungicide sensitivity was classified according to the sensitivity ranges proposed by [15]. This classification was applied to the EC₅₀ values obtained for each fungal isolate and active ingredient, including tebuconazole, mefentrifluconazole, azoxystrobin, pyraclostrobin, thiophanate-methyl, and thiabendazole. Based on the corresponding EC₅₀ values, fungal isolates were assigned to the sensitivity categories shown in Table 4.
2.10. Classification of Fungicide Sensitivity
The sensitivity of the fungal isolates to the evaluated fungicides was classified according to the criteria proposed by [15]. The classification system establishes sensitivity categories based on predefined EC₅₀ ranges, allowing the response of each fungal isolate to be interpreted according to the concentration of active ingredient required to inhibit 50% of mycelial growth. Accordingly, lower EC₅₀ values indicate greater fungal sensitivity to the active ingredient, whereas higher values indicate a reduced sensitivity response.
This classification criterion was applied independently to each fungal isolate–fungicide combination. The evaluated active ingredients included tebuconazole, mefentrifluconazole, azoxystrobin, pyraclostrobin, thiophanate-methyl, and thiabendazole, representing different chemical groups and modes of action. Based on the EC₅₀ value obtained for each combination, the fungal isolates were assigned to the corresponding sensitivity category according to the ranges established by [15] and summarized in Table 4. This approach allowed comparison of sensitivity patterns among fungal isolates and active ingredients using a standardized classification criterion.
2.11. Statistical Analyses
Statistical analyses were performed separately for each fungal isolate–fungicide experiment. Mycelial growth rate (MGR) data were subjected to a one-way analysis of variance (ANOVA), considering fungicide concentration as the treatment factor. When significant differences were detected by ANOVA, treatment means were compared using Tukey’s honestly significant difference (HSD) test at the 5% significance level (p ≤ 0.05). All statistical analyses were performed in R (version 4.2.2) using the agricolae package. Comparisons among fungicide concentrations were conducted independently for Fusarium sp., Penicillium sp., Alternaria sp., and Ulocladium sp.; therefore, the statistical groupings represented by different letters correspond exclusively to comparisons among fungicide concentrations within each independent fungal isolate–fungicide experiment.
3. Results
3.1. Mycelial Growth Rate
The analysis of variance (ANOVA) showed that fungicide concentration had a significant effect (p < 0.05) on the mycelial growth rate (MGR) of the evaluated fungal isolates in most of the independent fungus–fungicide experiments. The magnitude of the response varied according to the fungal isolate and active ingredient. Tukey’s test (p ≤ 0.05) allowed the identification of statistically different groups among fungicide concentrations within each independent experiment (Figure 1, Figure 2, Figure 3, Figure 4, Figure 5 and Figure 6).
3.1.1. Effect of Tebuconazole on Mycelial Growth Rate
The ANOVA indicated a significant effect of tebuconazole concentration on MGR (p < 0.05). In Fusarium sp., the untreated control (0 ppm) showed the highest MGR (15.3 mm/day) and was assigned to group A. Increasing tebuconazole concentrations significantly reduced mycelial growth, with the lowest MGR (1.2 mm/day) recorded at 500 ppm, corresponding to group C. A significant reduction in MGR was also observed for Penicillium sp., Alternaria sp., and Ulocladium sp. In Ulocladium sp., the MGR decreased from approximately 8.3 mm/day in the untreated control (group A) to 1.6 mm/day at 500 ppm (group B). Overall, the highest concentrations were associated with the lowest MGR values for the four fungal isolates (Figure 1).
3.1.2. Effect of Mefentrifluconazole on Mycelial Growth Rate
The ANOVA showed a significant effect of mefentrifluconazole concentration on MGR (p < 0.05). In Fusarium sp., Tukey’s test separated the concentrations into five statistical groups. The untreated control showed the highest MGR (15.3 mm/day; group A), whereas the lowest MGR (6.7 mm/day; group E) was recorded at 500 ppm. In Penicillium sp., MGR decreased from approximately 7.5 mm/day at 0 ppm to 3.8 mm/day at 500 ppm. Significant reductions in MGR with increasing fungicide concentration were also observed for Alternaria sp. and Ulocladium sp. (Figure 2).
3.1.3. Effect of Pyraclostrobin on Mycelial Growth Rate
The ANOVA showed that pyraclostrobin concentration significantly affected MGR (p < 0.05) in Fusarium sp., Penicillium sp., and Alternaria sp. In Fusarium sp., the untreated control presented the highest MGR (17.1 mm/day; group A), while the lowest value was recorded at 500 ppm (9.4 mm/day; group C). In Penicillium sp., MGR decreased from 7.9 mm/day in the control to 5.2 mm/day at 500 ppm, with Tukey’s test separating the concentrations into groups A, AB, and B. Alternaria sp. also showed significant differences among concentrations. In contrast, no significant differences among pyraclostrobin concentrations were detected for Ulocladium sp. (p > 0.05), as indicated by the common statistical grouping across treatments (Figure 3).
3.1.4. Effect of Azoxystrobin on Mycelial Growth Rate
The ANOVA indicated a significant effect of azoxystrobin concentration on MGR (p < 0.05) for the evaluated fungal isolates. Tukey’s test showed differences among concentrations, with the untreated controls generally presenting the highest MGR values and fungicide-amended treatments showing lower growth. The response differed among Fusarium sp., Penicillium sp., Alternaria sp., and Ulocladium sp., but in all cases the lowest MGR values were associated with fungicide exposure compared with the corresponding untreated control (Figure 4).
3.1.5. Effect of Thiophanate-Methyl on Mycelial Growth Rate
The effect of thiophanate-methyl concentration on MGR differed among the evaluated fungal isolates. Significant differences among concentrations were detected for Fusarium sp., Alternaria sp., and Ulocladium sp. (p < 0.05), with reductions in MGR observed as fungicide concentration increased. In contrast, Penicillium sp. showed no significant differences among concentrations (p > 0.05), as indicated by the absence of separation among treatment means by Tukey’s test. Thus, the effect of thiophanate-methyl concentration was dependent on the fungal isolate evaluated (Figure 5).
3.1.6. Effect of Thiophanate-Methyl on Mycelial Growth Rate
The ANOVA showed a significant effect of thiabendazole concentration on MGR (p < 0.05) for the evaluated fungal isolates. Increasing concentrations were associated with significant reductions in mycelial growth. In Ulocladium sp., for example, the untreated control presented the highest MGR (7.1 mm/day; group A), whereas the lowest MGR was recorded at 500 ppm (3.9 mm/day; group C). Significant differences among concentrations were also observed for Fusarium sp., Penicillium sp., and Alternaria sp., with the higher concentrations generally belonging to statistical groups characterized by lower MGR values (Figure 6).
3.2. Estimation of the Median Effective Concentration (EC₅₀)
The EC₅₀ analysis revealed marked differences in the sensitivity of the evaluated fungal isolates to tebuconazole (Table 5). Fusarium sp. and Penicillium sp. exhibited the lowest EC₅₀ values, at 0.10 and 0.07 µg mL⁻¹, respectively. Both values were below 1.0 µg mL⁻¹ and, according to the established sensitivity ranges, these isolates were classified as highly sensitive to tebuconazole. In contrast, Ulocladium sp. showed an EC₅₀ of 7.46 µg mL⁻¹, within the 5–20 µg mL⁻¹ range, and was therefore classified as moderately sensitive. Alternaria sp. exhibited the highest EC₅₀ value (22.75 µg mL⁻¹), corresponding to the 20–100 µg mL⁻¹ range and resulting in its classification as highly resistant. Overall, the EC₅₀ values showed a clear gradient in response to tebuconazole, with Penicillium sp. and Fusarium sp. exhibiting the greatest sensitivity, followed by Ulocladium sp., whereas Alternaria sp. showed the lowest sensitivity among the evaluated fungal isolates.
The EC₅₀ analysis revealed marked differences in the sensitivity of the evaluated fungal isolates to mefentrifluconazole (Table 6). Alternaria sp. exhibited the lowest EC₅₀ value (0.019 µg mL⁻¹), which was below 1.0 µg mL⁻¹ and resulted in its classification as highly sensitive. Ulocladium sp. showed an EC₅₀ of 1.17 µg mL⁻¹, within the 1–5 µg mL⁻¹ range, and was therefore classified as sensitive. In contrast, Fusarium sp. exhibited an EC₅₀ of 43.05 µg mL⁻¹, corresponding to the 20–100 µg mL⁻¹ range and resulting in its classification as highly resistant. Penicillium sp. showed the highest EC₅₀ value (749.53 µg mL⁻¹), exceeding 500 µg mL⁻¹, and was classified as very highly resistant. Overall, the EC₅₀ values demonstrated a pronounced gradient in response to mefentrifluconazole, with Alternaria sp. showing the greatest sensitivity, followed by Ulocladium sp., whereas Fusarium sp. and particularly Penicillium sp. exhibited substantially lower sensitivity to this fungicide.
The EC₅₀ analysis revealed differences in the sensitivity of the evaluated fungal isolates to azoxystrobin (Table 7). Alternaria sp., Penicillium sp., and Ulocladium sp. exhibited EC₅₀ values of 0.01, 0.06, and 0.10 µg mL⁻¹, respectively. All three values were below 1.0 µg mL⁻¹ and, according to the established sensitivity ranges, these isolates were classified as highly sensitive to azoxystrobin. Fusarium sp. showed a comparatively higher EC₅₀ value of 1.39 µg mL⁻¹, within the 1–5 µg mL⁻¹ range, and was therefore classified as sensitive. Overall, the EC₅₀ values indicated a high level of sensitivity to azoxystrobin among the four fungal isolates, with Alternaria sp. exhibiting the greatest sensitivity, followed by Penicillium sp. and Ulocladium sp., whereas Fusarium sp. showed the lowest relative sensitivity among the evaluated isolates.
The EC₅₀ analysis revealed differences in the sensitivity of the evaluated fungal isolates to pyraclostrobin (Table 8). Alternaria sp. and Fusarium sp. exhibited the lowest EC₅₀ values, at 0.04 and 0.35 µg mL⁻¹, respectively. Both values were below 1.0 µg mL⁻¹ and, according to the established sensitivity ranges, these isolates were classified as highly sensitive to pyraclostrobin. Penicillium sp. showed an EC₅₀ value of 1.17 µg mL⁻¹, within the 1–5 µg mL⁻¹ range, and was therefore classified as sensitive. In contrast, Ulocladium sp. exhibited the highest EC₅₀ value (8.81 µg mL⁻¹), corresponding to the 5–20 µg mL⁻¹ range and resulting in its classification as moderately sensitive. Overall, the EC₅₀ values indicated that Alternaria sp. exhibited the greatest sensitivity to pyraclostrobin, followed by Fusarium sp. and Penicillium sp., whereas Ulocladium sp. showed the lowest relative sensitivity among the evaluated fungal isolates.
The EC₅₀ analysis revealed differences in the sensitivity of the evaluated fungal isolates to thiophanate-methyl (Table 9). Fusarium sp. and Alternaria sp. exhibited the lowest EC₅₀ values, at 0.02 and 0.70 µg mL⁻¹, respectively. Both values were below 1.0 µg mL⁻¹ and, according to the established sensitivity ranges, these isolates were classified as highly sensitive to thiophanate-methyl. In contrast, Ulocladium sp. and Penicillium sp. showed higher EC₅₀ values of 6.90 and 9.27 µg mL⁻¹, respectively. These values were within the 5–20 µg mL⁻¹ range, resulting in the classification of both isolates as moderately sensitive. Overall, the EC₅₀ values indicated that Fusarium sp. exhibited the greatest sensitivity to thiophanate-methyl, followed by Alternaria sp., whereas Ulocladium sp. and Penicillium sp. showed comparatively lower sensitivity, with Penicillium sp. exhibiting the lowest relative sensitivity among the evaluated fungal isolates.
The EC₅₀ analysis revealed differences in the sensitivity of the evaluated fungal isolates to thiabendazole (Table 10). Alternaria sp., Fusarium sp., and Ulocladium sp. exhibited EC₅₀ values of 0.03, 0.11, and 0.32 µg mL⁻¹, respectively. All three values were below 1.0 µg mL⁻¹ and, according to the established sensitivity ranges, these isolates were classified as highly sensitive to thiabendazole. In contrast, Penicillium sp. showed a higher EC₅₀ value of 1.17 µg mL⁻¹, within the 1–5 µg mL⁻¹ range, and was therefore classified as sensitive. Overall, the EC₅₀ values indicated a high level of sensitivity to thiabendazole among the four fungal isolates, with Alternaria sp. exhibiting the greatest sensitivity, followed by Fusarium sp. and Ulocladium sp., whereas Penicillium sp. showed the lowest relative sensitivity among the evaluated isolates.
4. Discussion
The in vitro assays demonstrated substantial variation in the response of Fusarium sp., Penicillium sp., Alternaria sp., and Ulocladium sp. to the six fungicides evaluated. This variation was evident both in the reduction of mycelial growth across fungicide concentrations and in the EC₅₀ values obtained for each fungus–fungicide combination. Overall, the results indicate that fungicide sensitivity was determined not only by the chemical group and mode of action but also by the particular fungal isolate and active ingredient. This finding is relevant because compounds belonging to the same FRAC group did not necessarily produce equivalent responses, emphasizing the importance of evaluating individual active ingredients when designing fungicide-based disease management strategies.
4.1. Response to Triazole Fungicides
The two triazole fungicides showed marked inhibitory activity, although their effects differed among the fungal isolates. At 1 ppm, tebuconazole produced 54.6% inhibition of Fusarium sp. and Penicillium sp., corresponding to high inhibition, whereas mefentrifluconazole resulted in 51.5% inhibition of Alternaria sp. and 35.3% inhibition of Ulocladium sp. These differences demonstrate that fungal responses to DMIs were dependent on both the active ingredient and the fungal isolate, rather than being uniform across the triazole group.
Triazole fungicides belong to the demethylation inhibitors (DMIs) and interfere with ergosterol biosynthesis, an essential process for maintaining fungal cell membrane integrity and function. Their activity is associated with inhibition of sterol 14α-demethylase, thereby disrupting normal sterol composition and restricting fungal growth [16]. Consequently, the reductions in mycelial growth observed in the present study are consistent with the biochemical activity expected for this fungicide group. Previous studies conducted in oregano [17], strawberry [18], and gladiolus [19] have similarly demonstrated the ability of triazole fungicides to suppress fungal development, supporting their effectiveness against several phytopathogenic fungi [20,21].
Nevertheless, the EC₅₀ results revealed substantial differences between tebuconazole and mefentrifluconazole. Fusarium sp. showed high sensitivity to tebuconazole, with an EC₅₀ of 0.10 µg mL⁻¹. This result agrees with previous evidence indicating that triazole-containing fungicides such as metconazole, prothioconazole, and tebuconazole are among the most effective chemical compounds against Fusarium spp. [31]. The strong response observed at relatively low concentrations suggests that ergosterol biosynthesis in the evaluated Fusarium isolate was effectively disrupted by tebuconazole.
Similarly, Penicillium sp. exhibited high sensitivity to tebuconazole, with an EC₅₀ of 0.07 µg mL⁻¹. The low concentration required to reduce mycelial growth by 50% is consistent with the high specificity of triazoles for sterol biosynthesis, a pathway essential for fungal membrane structure and cellular function [32]. However, this response contrasted sharply with that obtained for mefentrifluconazole, for which Penicillium sp. exhibited an EC₅₀ of 749.53 µg mL⁻¹. Such a pronounced difference between two fungicides belonging to the same FRAC group highlights the importance of evaluating active ingredients individually and suggests that sensitivity to one DMI cannot necessarily be extrapolated to another.
The response of Alternaria sp. further illustrates this active ingredient-specific pattern. This fungus exhibited an EC₅₀ of 0.019 µg mL⁻¹ for mefentrifluconazole, indicating very high sensitivity, whereas the EC₅₀ for tebuconazole was considerably higher (22.75 µg mL⁻¹). Previous research on A. alternata has reported a low risk of resistance to mefentrifluconazole, although overexpression-associated mechanisms can confer low levels of reduced sensitivity [33]. The strong contrast observed in the present study indicates that even fungicides targeting the same biochemical pathway can differ substantially in their biological activity against a particular fungal isolate.
For Ulocladium sp., the response was intermediate. Tebuconazole produced an EC₅₀ of 7.46 µg mL⁻¹, corresponding to moderate sensitivity, while mefentrifluconazole showed an EC₅₀ of 1.17 µg mL⁻¹, corresponding to sensitivity. These results are consistent with previous observations of susceptibility of dematiaceous fungi exposed to triazole fungicides [34]. Taken together, the results for DMIs demonstrate that classification based solely on fungicide group is insufficient to predict biological activity. Instead, the interaction between fungal isolate and specific active ingredient appears to be critical in determining the magnitude of the response.
4.2. Response to Strobilurin Fungicides
The QoI fungicides azoxystrobin and pyraclostrobin also reduced mycelial growth, but their inhibitory effects differed among the fungal isolates. At 1 ppm, pyraclostrobin produced 28.3% inhibition of Fusarium sp., while azoxystrobin resulted in 62.9% inhibition of Penicillium sp. In Alternaria sp., azoxystrobin and pyraclostrobin produced 31.8 and 35.9% inhibition, respectively, whereas azoxystrobin produced 48.6% inhibition of Ulocladium sp. Thus, although both fungicides belong to the same FRAC group, their relative activity varied according to the fungal isolate.
Strobilurins act primarily by binding to the quinol oxidation (Qo) site of cytochrome b in the mitochondrial cytochrome bc₁ complex. This interaction interrupts mitochondrial electron transport, reducing energy production and consequently restricting fungal growth and development [22]. The reductions in mycelial growth observed in the present study are therefore consistent with inhibition of mitochondrial respiration. Previous studies in strawberry [23,24], soursop [25], and walnut [26] have also reported effective suppression of fungal development by strobilurin fungicides.
The EC₅₀ values provided additional evidence of differences in sensitivity within this fungicide group. In Fusarium sp., azoxystrobin produced an EC₅₀ of 1.39 µg mL⁻¹, indicating sensitivity, whereas pyraclostrobin produced a lower EC₅₀ of 0.35 µg mL⁻¹, indicating high sensitivity. Previous studies have shown that azoxystrobin can reduce mycelial growth, conidial production, pathogenicity, and ATP production in Fusarium spp., supporting its potential for suppressing this fungal group [35]. However, the lower EC₅₀ obtained with pyraclostrobin in the present study suggests that, for the evaluated isolate, pyraclostrobin exerted stronger activity at lower concentrations.
Penicillium sp. also showed high sensitivity to the QoI fungicides, although the two active ingredients differed quantitatively. Azoxystrobin showed an EC₅₀ of 0.06 µg mL⁻¹, while the response to pyraclostrobin was comparatively lower. The high sensitivity to azoxystrobin is consistent with reports showing reductions in conidial germination and mycelial growth of Penicillium digitatum following azoxystrobin treatment [36]. These findings support the capacity of QoI fungicides to interfere effectively with fungal development, although sensitivity may differ among species and isolates.
The strongest overall response to the strobilurins was observed in Alternaria sp. Azoxystrobin and pyraclostrobin showed EC₅₀ values of 0.01 and 0.04 µg mL⁻¹, respectively, placing both within the highly sensitive category. Similar inhibitory effects against Alternaria spp. have been reported in citrus [37], and studies conducted in mandarin have provided additional evidence supporting the activity of these fungicides [38]. The consistently low EC₅₀ values obtained for both QoIs suggest that mitochondrial respiration represents a highly sensitive target in the Alternaria isolate evaluated in this study.
For Ulocladium sp., azoxystrobin showed an EC₅₀ of 0.10 µg mL⁻¹, indicating high sensitivity, whereas pyraclostrobin produced a considerably higher EC₅₀ of 8.81 µg mL⁻¹, corresponding to moderate sensitivity. Previous assays in garlic support the effectiveness of fungicides from this group against associated fungal pathogens [39]. Nevertheless, the marked difference between the two QoI fungicides observed here again demonstrates that a shared mode of action does not necessarily imply equivalent sensitivity.
This distinction has practical implications for resistance management. Although differences in EC₅₀ may help identify the most active compound against a particular isolate, azoxystrobin and pyraclostrobin share the same primary target site. Therefore, differences in their in vitro efficacy should not be interpreted as evidence that alternating these two active ingredients alone constitutes rotation between independent modes of action. Rather, their use should be integrated with fungicides belonging to different FRAC groups to reduce continuous selection pressure on the same biochemical target.
4.3. Response to Benzimidazole Fungicides
The benzimidazole fungicides thiophanate-methyl and thiabendazole also exhibited isolate-dependent activity. At 1 ppm, thiophanate-methyl produced 33.2% inhibition of Fusarium sp., whereas thiabendazole produced 29.4% inhibition of Penicillium sp. and 48.4% inhibition of Alternaria sp. In Ulocladium sp., inhibition at the same concentration was lower, reaching 24.2% with thiophanate-methyl and 14.9% with thiabendazole. These results demonstrate that the magnitude of inhibition at a single concentration alone does not fully describe fungicide sensitivity and should therefore be interpreted together with the complete concentration-response relationship and EC₅₀ estimates.
Benzimidazole fungicides act primarily by interfering with β-tubulin polymerization and microtubule assembly. Because microtubules are essential for chromosome segregation and other cellular processes during mitosis, disruption of their formation can inhibit cell division, hyphal development, and spore germination [27,28]. The reductions in mycelial growth observed in the present study are consistent with this mechanism of action. Previous studies in crops such as soursop [29] and bean [30] have also reported inhibition of fungal development following treatments with fungicides acting on these cellular processes.
Among the evaluated fungi, Fusarium sp. showed particularly high sensitivity to both MBC fungicides. Thiophanate-methyl and thiabendazole exhibited EC₅₀ values of 0.02 and 0.11 µg mL⁻¹, respectively. These low values indicate that relatively small concentrations were sufficient to reduce mycelial growth by 50%. Previous trials conducted in sugarcane reported 92.1% inhibition of fungal mycelial growth following treatment with thiabendazole [40], supporting the strong antifungal activity of this active ingredient.
In contrast, Penicillium sp. exhibited a markedly different response to the two benzimidazoles. Thiophanate-methyl showed an EC₅₀ of 9.27 µg mL⁻¹, corresponding to moderate sensitivity, whereas thiabendazole exhibited an EC₅₀ of 1.17 µg mL⁻¹ and was classified as sensitive. This approximately eight-fold difference between the two EC₅₀ values indicates substantially lower sensitivity to thiophanate-methyl than to thiabendazole under the experimental conditions. Previous studies have documented reduced sensitivity and resistance to benzimidazoles in Penicillium populations [41], providing a relevant context for the comparatively high EC₅₀ observed in the present study.
However, the elevated EC₅₀ observed for thiophanate-methyl should be interpreted cautiously. Because the present study evaluated in vitro sensitivity of selected isolates rather than the sensitivity distribution of a representative pathogen population, the results indicate reduced relative sensitivity but do not by themselves demonstrate field resistance. Confirmation of resistance would require a broader collection of isolates, appropriate baseline sensitivity data, and ideally complementary phenotypic or molecular evidence.
Alternaria sp. was highly sensitive to both MBC fungicides, with EC₅₀ values of 0.70 µg mL⁻¹ for thiophanate-methyl and 0.03 µg mL⁻¹ for thiabendazole. Previous research in tobacco reported a relatively low frequency (6.0%) of resistance in A. alternata populations [42]. The low EC₅₀ values obtained in the present study are consistent with a sensitive phenotype, particularly for thiabendazole. Nevertheless, continued exposure to fungicides with a single target site may increase selection pressure, making sensitivity monitoring important even when initial isolates show high susceptibility.
A similarly contrasting pattern was observed for Ulocladium sp. Thiophanate-methyl exhibited an EC₅₀ of 6.90 µg mL⁻¹, corresponding to moderate sensitivity, whereas thiabendazole showed a substantially lower EC₅₀ of 0.32 µg mL⁻¹ and was classified as highly sensitive. The effectiveness of MBC fungicides against fungal diseases has also been documented in mango [43]. The large difference between the two active ingredients in the present study suggests that their biological activity against Ulocladium sp. was not equivalent despite their shared mode of action.
4.4. Overall Implications for Fungicide Sensitivity and Disease Management
When the three fungicide groups are considered together, a central finding of this study is the heterogeneity of sensitivity among fungus–fungicide combinations. No single active ingredient exhibited the same relative activity against all four fungal isolates. Furthermore, substantial differences were observed between active ingredients belonging to the same FRAC group. This was particularly evident for mefentrifluconazole and tebuconazole in Alternaria sp. and Penicillium sp., and for thiophanate-methyl and thiabendazole in Penicillium sp. and Ulocladium sp.
The combined interpretation of MGR and EC₅₀ is therefore important. MGR measurements demonstrated how fungal growth changed at individual fungicide concentrations, whereas EC₅₀ provided an integrated quantitative measure of the concentration required to reduce growth by 50%. Consequently, isolates showing apparently moderate inhibition at a particular concentration could nevertheless exhibit low EC₅₀ values when the entire concentration-response relationship was considered. The two parameters should thus be viewed as complementary rather than interchangeable indicators of fungicide response.
From a phytosanitary perspective, the results provide baseline information on the in vitro sensitivity of fungi associated with white onion cultivation in Santa Fe de Galán. Active ingredients such as tebuconazole against Fusarium sp. and Penicillium sp.; mefentrifluconazole against Alternaria sp.; azoxystrobin and pyraclostrobin against Alternaria sp.; and thiophanate-methyl and thiabendazole against Fusarium sp. exhibited particularly low EC₅₀ values. Conversely, the high EC₅₀ observed for mefentrifluconazole in Penicillium sp. and the comparatively elevated values obtained for some MBC–fungus combinations identify responses that warrant further investigation.
Nevertheless, these findings represent in vitro sensitivity under controlled conditions and should not be directly extrapolated to field efficacy. Fungicide performance under field conditions may be influenced by application timing, dose, coverage, environmental conditions, pathogen population structure, host phenology, fungicide persistence, and previous exposure of fungal populations to particular modes of action. Similarly, an elevated EC₅₀ in an individual isolate should not automatically be considered evidence of established resistance in the local pathogen population.
Future studies should therefore expand the number of isolates collected from different white onion production areas and growing seasons to establish population-level baseline sensitivity distributions. Such studies would allow discrimination between natural variability in sensitivity and true shifts associated with selection pressure. Integrating phenotypic sensitivity assays with molecular characterization of resistance-associated mechanisms would further strengthen resistance monitoring. Ultimately, these data could support rational rotation of fungicides with different modes of action and reduce repeated selection pressure on the same fungal target, contributing to more sustainable disease management in white onion production.
5. Conclusions
The in vitro sensitivity assays demonstrated that the response of the fungal isolates associated with white onion varied according to both the active ingredient and fungicide concentration. Tebuconazole showed strong inhibitory activity at low concentrations, particularly against Fusarium sp. and Penicillium sp., whereas azoxystrobin also produced high inhibition of Penicillium sp. at low concentrations. These results confirm that the magnitude of mycelial growth inhibition was dependent on the specific fungus–fungicide combination.
The EC₅₀ analysis further demonstrated marked differences in sensitivity among the evaluated fungal isolates. Fusarium sp. was highly sensitive to tebuconazole, pyraclostrobin, thiophanate-methyl, and thiabendazole, and sensitive to azoxystrobin. Alternaria sp. showed high sensitivity to mefentrifluconazole, azoxystrobin, pyraclostrobin, thiophanate-methyl, and thiabendazole, while exhibiting substantially lower sensitivity to tebuconazole. Ulocladium sp. showed high sensitivity to azoxystrobin and thiabendazole, sensitivity to mefentrifluconazole, and moderate sensitivity to tebuconazole, pyraclostrobin, and thiophanate-methyl. In Penicillium sp., the response was particularly dependent on the active ingredient, ranging from high sensitivity to tebuconazole and azoxystrobin to moderate sensitivity to thiophanate-methyl and markedly reduced sensitivity to mefentrifluconazole.
Overall, the results demonstrate that fungicides belonging to the same FRAC group did not necessarily produce equivalent sensitivity responses, emphasizing the importance of selecting active ingredients according to the fungal target rather than solely according to their chemical group. The MGR and EC₅₀ values generated in this study provide initial baseline information on the in vitro sensitivity of fungal isolates associated with white onion production in Santa Fe de Galán, Ecuador, and may contribute to the rational selection and rotation of fungicides with different modes of action. However, because these findings were obtained under controlled in vitro conditions and from selected fungal isolates, further studies involving larger pathogen populations and field evaluations are required before extrapolating these results to resistance status or field efficacy.
Funding
This study was supported by the FIASA Project No. FIASA-CA-2024-029, “Microbioma como estrategia para mitigar futuras pandemias vegetales, buscando un mecanismo de resiliencia en papa y maíz al cambio climático en la provincia de Chimborazo”, funded by the Fondo de Investigación para la Agrobiodiversidad, Semillas y Agricultura Sustentable (FIASA), Ecuador.
Institutional Review Board Statement
Not applicable.
Informed Consent Statement
Not applicable.
Data Availability Statement
Data are available upon request to the corresponding author.
Acknowledgments
The authors thank the Fondo de Investigación para la Agrobiodiversidad, Semillas y Agricultura Sustentable (FIASA), Ecuador, for supporting this study through Project No. FIASA-CA-2024-029, “Microbioma como estrategia para mitigar futuras pandemias vegetales, buscando un mecanismo de resiliencia en papa y maíz al cambio climático en la provincia de Chimborazo”.
Conflicts of Interest
The authors declare no conflicts of interest.
References
- Padula, G.; Xia, X.; Hołubowicz, R. Welsh Onion (Allium fistulosum L.) Seed Physiology, Breeding, Production and Trade. Plants 2022, 11(3), 343. [Google Scholar] [CrossRef] [PubMed]
- Kim, H.-M.; Park, M.-K.; Mun, S.-J.; et al. Study on Volatile Profiles, Polycyclic Aromatic Hydrocarbons, and Acrylamide Formed in Welsh Onion (Allium fistulosum L.) Fried in Vegetable Oils at Different Temperatures. Foods 2022, 11(9), 1335. [Google Scholar] [CrossRef] [PubMed]
- FAOSTAT [Internet]. 16 Apr 2026. Available online: https://www.fao.org/faostat/en/#data/QCL/visualize.
- Bravo, D.A.C.; Sanchez, A.R.Á.; Barragán, A.P.A.; et al. Análisis socioeconómico de la producción de cebolla blanca y papa en la parroquia Santa Fe de Galán, cantón Guano, provincia de Chimborazo. Cienc. Lat. Rev. Científica Multidiscip. 2025, 9(1), 869–887. [Google Scholar] [CrossRef]
- Yin, Y.; Miao, J.; Shao, W.; et al. Fungicide Resistance: Progress in Understanding Mechanism, Monitoring, and Management. Phytopathology® 2023, 113(4), 707–718. [Google Scholar] [CrossRef] [PubMed]
- Lucas, J.A.; Hawkins, N.J.; Fraaije, B.A. The evolution of fungicide resistance. Adv. Appl. Microbiol. 2015, 90, 29–92. [Google Scholar] [CrossRef] [PubMed]
- Frac Code List 2024 | PDF | Fungicide | Biosynthesis [Internet]; Scribd, 6 July 2026; Available online: https://www.scribd.com/document/836470310/Frac-Code-List-2024-2.
- LIU, Xili; Jianqiang, M.; Can, Z. Fungicide resistance and the management strategies. nyxxb 2022, 24(5), 921–936. [Google Scholar]
- Fisher, M.C.; Henk, D.A.; Briggs, C.J.; et al. Emerging fungal threats to animal, plant and ecosystem health. Nature 2012, 484(7393), 186–194. [Google Scholar] [CrossRef] [PubMed]
- Zambrano-Zambrano, J.; Vélez-Zambrano, S. Effect of Fungicides That Inhibit Beta-Tubulin Formation on the In Vitro Growth of Sclerotium rolfsii. J. Agric. Nat. Resour. Res. Innov. 2025, 41. [Google Scholar]
- Anglada, M.; Cerana, J.; Elizalde, J.; et al. Bioassays for the Detection of Pesticides as Contaminants in the Components of the Soybean System: Soil and Stubble. An Interdisciplinary Approach. Sci. Teach. Technol. Suppl. [Internet] 2017, 7(7). [Google Scholar]
- ABDEL-HAFEZ, S.I.; ABO-ELYOUSR, K.A.; ABDEL-RAHIM, I.R. Leaf surface and endophytic fungi associated with onion leaves and their antagonistic activity against Alternaria porri. Czech. Mycol. [Internet] 2015, 67(1). [Google Scholar] [CrossRef]
- Silva, K.E.D. UNIVERSIDADE FEDERAL DA PARAÍBA CENTRO DE CIÊNCIAS AGRÁRIAS PROGRAMA DE PÓS-GRADUAÇÃO EM AGRONOMIA. [PubMed]
- Sinuco León, D.C.; Coconubo Guio, L.C.; Castellanos Hernández, L.; et al. Fungicidal activity of volatile organic compounds from Paenibacillus bacteria against Colletotrichum gloeosporioides. Rev. Colomb. De Quím. 2020, 49(1), 20–25. [Google Scholar] [CrossRef]
- Gudmestad, N.C.; Arabiat, S.; Miller, J.S.; et al. Prevalence and Impact of SDHI Fungicide Resistance in Alternaria solani. Plant Dis. 2013, 97(7), 952–960. [Google Scholar] [CrossRef] [PubMed]
- Dumbai Joe, A.; Liu, R.; Luo, X.; et al. Comprehensive analysis of the mechanisms conferring resistance to phenamacril in the Fusarium species. Front Cell Infect. Microbiol. 2025, 15, 1536532. [Google Scholar] [CrossRef] [PubMed]
- Yossen, V.E.; Conles, M.Y. In Vitro Efficacy of Fungicides for the Control of Fusarium oxysporum and F. proliferatum, Causative Agents of Wilt in Oregano Crops in Argentina. Tucumán Ind. Agric. J. 2014, 91(1), 19–25. [Google Scholar]
- Pérez-Rodríguez, L.R.; Pérez-Moreno, L.; Guzmán-Mendoza, R.; et al. In vitro sensitivity of plant-pathogenic fungi causing strawberry diseases to biological control agents and fungicides in the state of Guanajuato, Mexico. Univ. J. 2019. [Google Scholar]
- Michel-Aceves, A.C. In Vitro and In Situ Efficacy of Chemical and Biological Fungicides in the Control of Fusarium oxysporum f. sp. gladioli and Uromyces transversalis in Gladiolus. Agro Product. [Internet] 2014, 7(3). [Google Scholar]
- Liu, Y.; Ma, T.; Dong, Y.; et al. Bioactivity of mefentrifluconazole against different Fusarium spp. Pestic. Biochem Physiol. 2022, 186, 105169. [Google Scholar] [CrossRef] [PubMed]
- Rather, I.A.; Sabir, J.S.M.; Asseri, A.H.; et al. Triazole Derivatives Target 14α–Demethylase (LDM) Enzyme in Candida albicans Causing Ergosterol Biosynthesis Inhibition. J. Fungi 2022, 8(7), 688. [Google Scholar] [CrossRef] [PubMed]
- Feng, Y.; Huang, Y.; Zhan, H.; et al. An Overview of Strobilurin Fungicide Degradation:Current Status and Future Perspective. Front Microbiol. 2020, 11, 389. [Google Scholar] [CrossRef] [PubMed]
- Espinoza-Altamirano, D.; Silva-Rojas, H.V.; Leyva-Mir, S.G.; et al. Sensitivity of Colletotrichum acutatum isolates from strawberries to the fungicides methyl thiophanate and azoxystrobin. Mex. J. Plant Pathol. 2017, 35(2), 186–203. [Google Scholar]
- Pérez Rodríguez, L.R.; Pérez Moreno, L.; Guzmán Mendoza, R.; et al. In vitro sensitivity of plant-pathogenic fungi causing strawberry diseases to biological control agents and fungicides in the state of Guanajuato, Mexico. Univ. Minutes 2019, 29(1), 1–11. [Google Scholar]
- Cambero-Campos, O.J.; Rios-Velasco, C.; Cruz-Crespo, E.; et al. In vitro evaluation of antagonistic microorganisms and fungicides against Colletotrichum theobromicola De-lacr, the causative agent of anthracnose in soursop (Annona muricata L.) inflorescences. Bio Cienc. J. [Internet] 2019, 6. [Google Scholar]
- Achilonu, C.C.; Gryzenhout, M.; Ghosh, S.; et al. In Vitro Evaluation of Azoxystrobin, Boscalid, Fentin-Hydroxide, Propiconazole, Pyraclostrobin Fungicides against Alternaria alternata Pathogen Isolated from Carya illinoinensis in South Africa. Microorganisms 2023, 11(7), 1691. [Google Scholar] [CrossRef] [PubMed]
- Islam, T.; Danishuddin; Tamanna, N.T.; et al. Resistance Mechanisms of Plant Pathogenic Fungi to Fungicide, Environmental Impacts of Fungicides, and Sustainable Solutions. Plants 2024, 13(19), 2737. [Google Scholar] [CrossRef] [PubMed]
- Zhou, Y.; Xu, J.; Zhu, Y.; et al. Mechanism of Action of the Benzimidazole Fungicide on Fusarium graminearum: Interfering with Polymerization of Monomeric Tubulin But Not Polymerized Microtubule. Phytopathology 2016, 106(8), 807–813. [Google Scholar] [CrossRef] [PubMed]
- Cambero-Ayón, C.B.; Rios-Velasco, C.; Esquivel, G.L.; et al. In vitro suppression of fungal root pathogens in Annona muricata L. by Trichoderma strains and conventional fungicides: Suppression of soursop root pathogens. Bio Cienc. J. 2023, 10. [Google Scholar]
- Zambrano-Zambrano, J.; Santos-Ponce, L.; Cedeño-García, G.; et al. Effect of fungicides that inhibit beta-tubulin formation on the in vitro growth of Sclerotium rolfsii. J. Agric. Nat. Resour. Res. Innov. 2025, 12(2), 41–49. [Google Scholar]
- Avozani, A.; Reis, E.M.; Tonin, R.B. In vitro sensitivity reduction of Fusarium graminearum to DMI and QoI fungicides. Summa phytopathol. 2014, 40(4), 358–364. [Google Scholar] [CrossRef]
- Sharma, K.; Raj, H.; Sharma, A. In vitro evaluation of safer fungicides in management of Penicillium digitaum causing green mould of Kinnow. [PubMed]
- Li, G.; Li, X.; Zeng, Y.; et al. Three point mutations in AaCYP51 combined with induced overexpression of AaCYP51 conferred low-level resistance to mefentrifluconazole in Alternaria alternata. Pestic. Biochem Physiol. 2023, 197, 105677. [Google Scholar] [CrossRef] [PubMed]
- Altın, N.; Kurbetli, İ.; Göre, M.E. In vitro and In vivo Efficacy of some Fungicides against Phytophthora nicotianae. Int. J. Agric. Biol. 2018, 20(9). [Google Scholar]
- Song, Y.; Chen, X.; Sun, J.; et al. In Vitro Determination of Sensitivity of Fusarium fujikuroi to Fungicide Azoxystrobin and Investigation of Resistance Mechanism. J. Agric. Food Chem. 2022, 70(31), 9760–9768. [Google Scholar] [CrossRef] [PubMed]
- Kanetis, L.; Förster, H.; Adaskaveg, J.E. Baseline Sensitivities for New Postharvest Fungicides Against Penicillium spp. on Citrus and Multiple Resistance Evaluations in P. digitatum. Plant Dis. 2008, 92(2), 301–310. [Google Scholar] [CrossRef] [PubMed]
- Mondal, S.N.; Bhatia, A.; Shilts, T.; et al. Baseline Sensitivities of Fungal Pathogens of Fruit and Foliage of Citrus to Azoxystrobin, Pyraclostrobin, and Fenbuconazole. Plant Dis. 2005, 89(11), 1186–1194. [Google Scholar] [CrossRef] [PubMed]
- Chitolina, G.M.; Silva-Junior, G.J.; Feichtenberger, E.; et al. Distribution of Alternaria alternata isolates with resistance to quinone outside inhibitor (QoI) fungicides in Brazilian orchards of tangerines and their hybrids. Crop Prot. 2021. [Google Scholar] [CrossRef]
- Ramírez-Jiménez, G.; Alvarado-Gómez, O.G.; Torres-de la Cruz, M.; et al. Caracterización y sensibilidad a fungicidas de hongos causantes de deterioro postcosecha en Allium sativum, Nuevo León, México. Rev. Mex. De Fitopatol. [Internet] 2025, 43(2). [Google Scholar]
- Medina-Osti, F.; Gutiérrez-Díez, A.; Ochoa-Ascencio, S.; et al. In vitro sensitivity of Fusarium sacchari isolated from sugarcane to five fungicides. Mex. J. Plant Pathol. 2022, 40(3), 447–457. [Google Scholar] [CrossRef]
- Malandrakis, A.A.; Markoglou, A.N.; Konstantinou, S.; et al. Molecular characterization, fitness and mycotoxin production of benzimidazole-resistant isolates of Penicillium expansum. Int. J. Food Microbiol. 2013, 162(3), 237–244. [Google Scholar] [CrossRef] [PubMed]
- Wang, H.C.; Zhang, C.Q. Multi-resistance to thiophanate-methyl, diethofencarb, and procymidone among Alternaria alternata populations from tobacco plants, and the management of tobacco brown spot with azoxystrobin. Phytoparasitica 2018, 46(5), 677–687. [Google Scholar] [CrossRef]
- Dos Santos, K.M.; Tsuji, S.S.; Câmara, M.P.S.; et al. Sensitivity to methyl benzimidazole carbamate fungicides of Botryosphaeriaceae species from mango orchards in the Northeast of Brazil. Eur. J. Plant Pathol. 2019, 153(1), 209–222. [Google Scholar] [CrossRef]
Figure 1.
Mycelial growth rate (MGR) of (A) Fusarium sp., (B) Penicillium sp., (C) Alternaria sp., and (D) Ulocladium sp. in PDA medium supplemented with different concentrations of tebuconazole. Different letters indicate significant differences among concentrations according to Tukey’s test at the 5% significance level (p ≤ 0.05).
Figure 1.
Mycelial growth rate (MGR) of (A) Fusarium sp., (B) Penicillium sp., (C) Alternaria sp., and (D) Ulocladium sp. in PDA medium supplemented with different concentrations of tebuconazole. Different letters indicate significant differences among concentrations according to Tukey’s test at the 5% significance level (p ≤ 0.05).
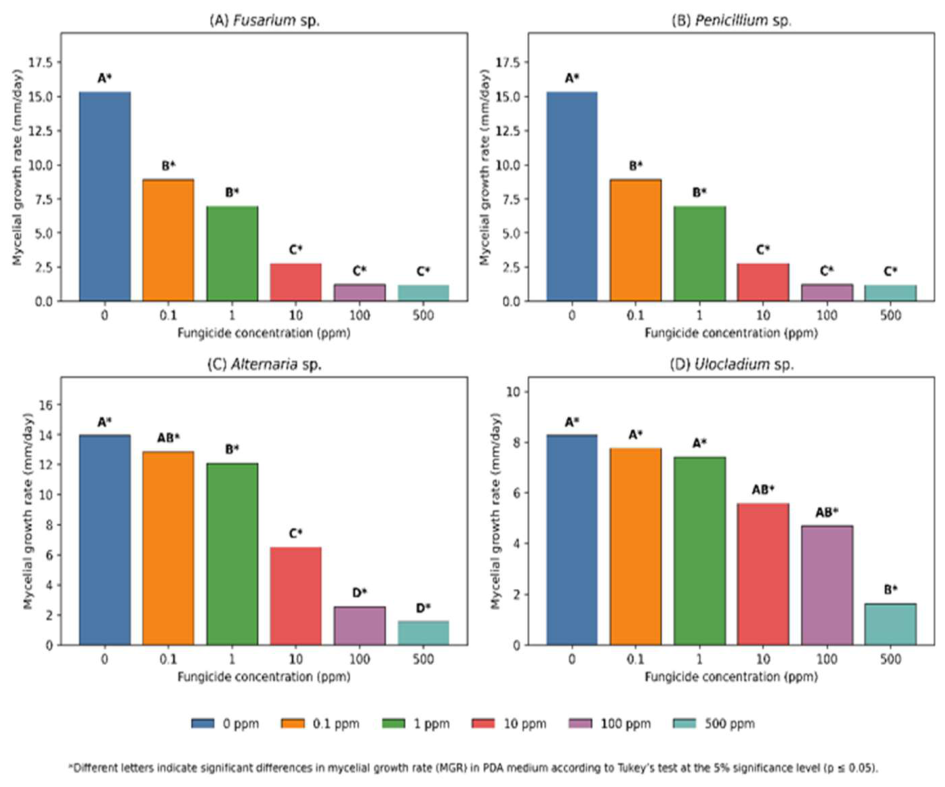
Figure 2.
Mycelial growth rate (MGR) of (A) Fusarium sp., (B) Penicillium sp., (C) Alternaria sp., and (D) Ulocladium sp. in PDA medium supplemented with different concentrations of mefentrifluconazole. Different letters indicate significant differences among concentrations according to Tukey’s test at the 5% significance level (p ≤ 0.05).
Figure 2.
Mycelial growth rate (MGR) of (A) Fusarium sp., (B) Penicillium sp., (C) Alternaria sp., and (D) Ulocladium sp. in PDA medium supplemented with different concentrations of mefentrifluconazole. Different letters indicate significant differences among concentrations according to Tukey’s test at the 5% significance level (p ≤ 0.05).
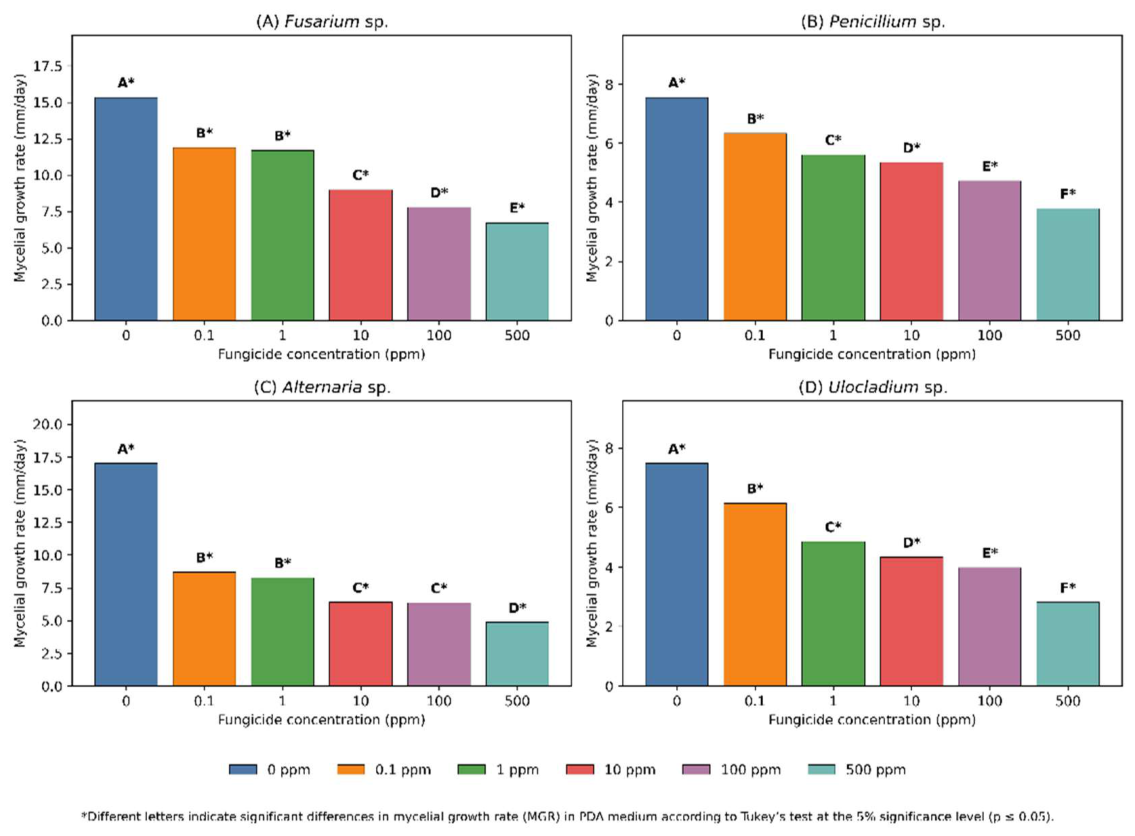
Figure 3.
Mycelial growth rate (MGR) of (A) Fusarium sp., (B) Penicillium sp., (C) Alternaria sp., and (D) Ulocladium sp. in PDA medium supplemented with different concentrations of pyraclostrobin. Different letters indicate significant differences among concentrations according to Tukey’s test at the 5% significance level (p ≤ 0.05).
Figure 3.
Mycelial growth rate (MGR) of (A) Fusarium sp., (B) Penicillium sp., (C) Alternaria sp., and (D) Ulocladium sp. in PDA medium supplemented with different concentrations of pyraclostrobin. Different letters indicate significant differences among concentrations according to Tukey’s test at the 5% significance level (p ≤ 0.05).
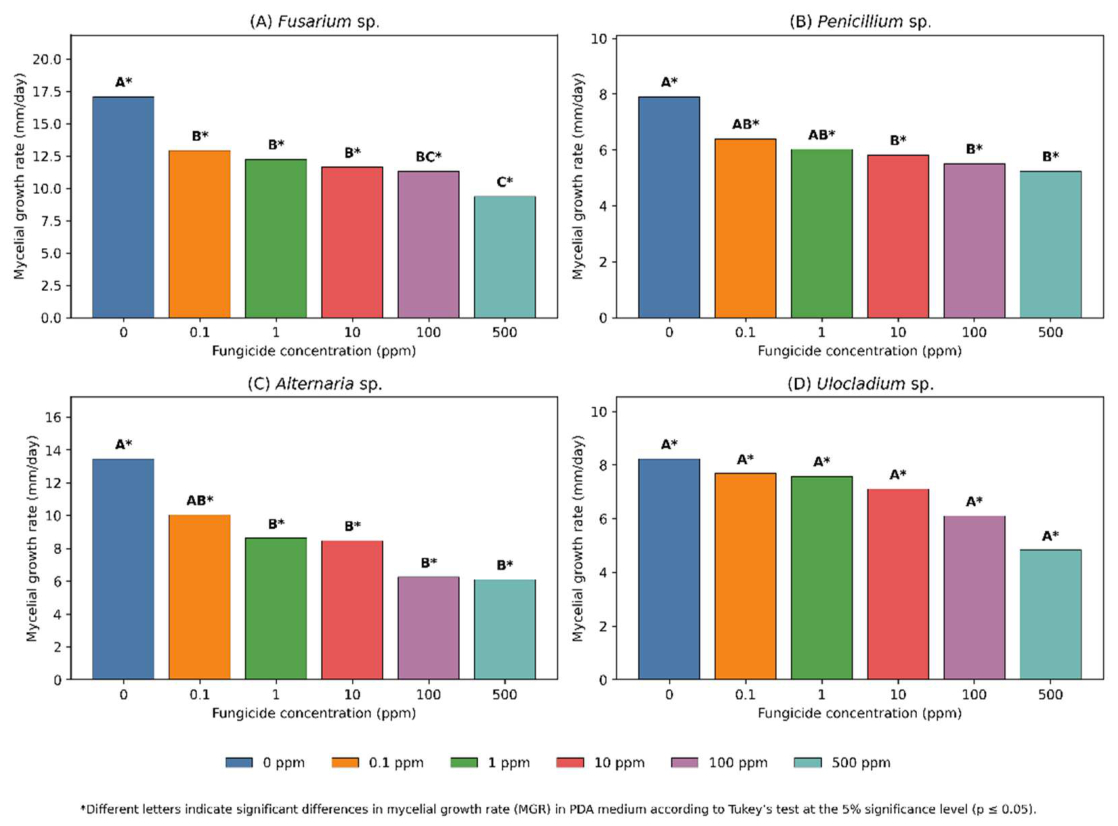
Figure 4.
Mycelial growth rate (MGR) of (A) Fusarium sp., (B) Penicillium sp., (C) Alternaria sp., and (D) Ulocladium sp. in PDA medium supplemented with different concentrations of azoxystrobin. Different letters indicate significant differences among concentrations according to Tukey’s test at the 5% significance level (p ≤ 0.05).
Figure 4.
Mycelial growth rate (MGR) of (A) Fusarium sp., (B) Penicillium sp., (C) Alternaria sp., and (D) Ulocladium sp. in PDA medium supplemented with different concentrations of azoxystrobin. Different letters indicate significant differences among concentrations according to Tukey’s test at the 5% significance level (p ≤ 0.05).
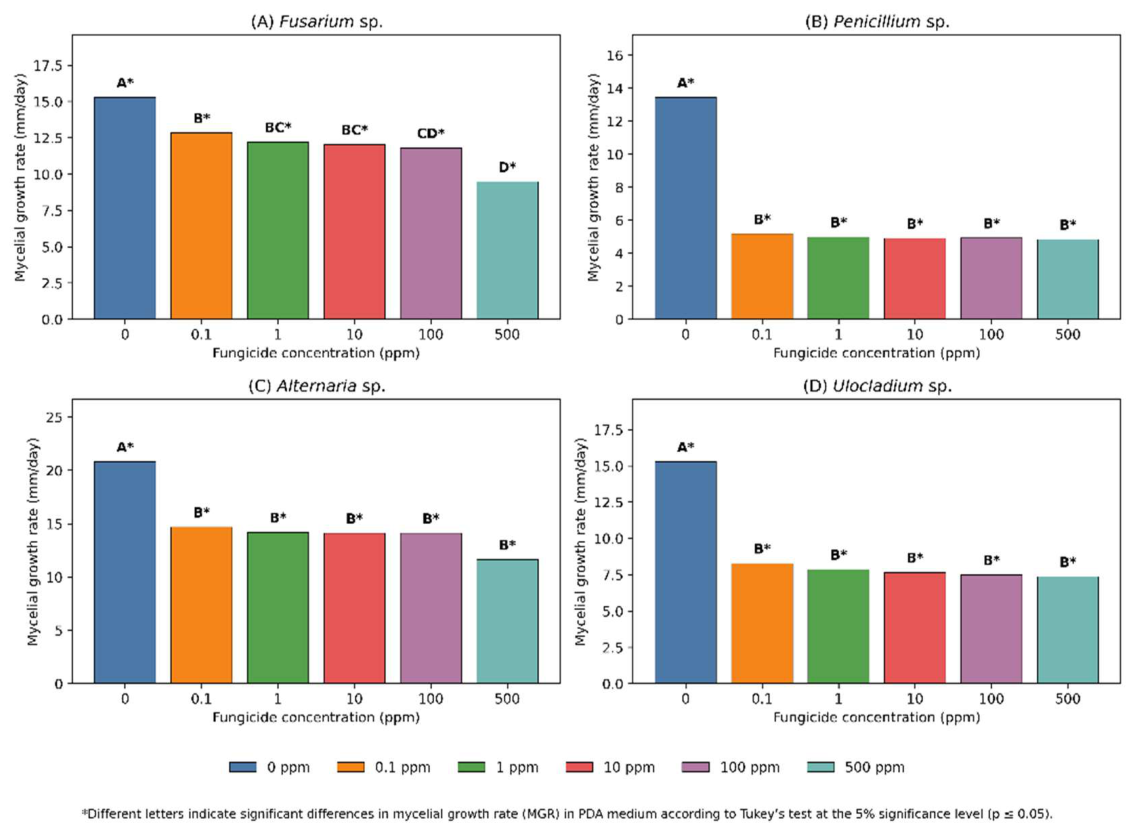
Figure 5.
Mycelial growth rate (MGR) of (A) Fusarium sp., (B) Penicillium sp., (C) Alternaria sp., and (D) Ulocladium sp. in PDA medium supplemented with different concentrations of thiophanate-methyl. Different letters indicate significant differences among concentrations according to Tukey’s test at the 5% significance level (p ≤ 0.05).
Figure 5.
Mycelial growth rate (MGR) of (A) Fusarium sp., (B) Penicillium sp., (C) Alternaria sp., and (D) Ulocladium sp. in PDA medium supplemented with different concentrations of thiophanate-methyl. Different letters indicate significant differences among concentrations according to Tukey’s test at the 5% significance level (p ≤ 0.05).
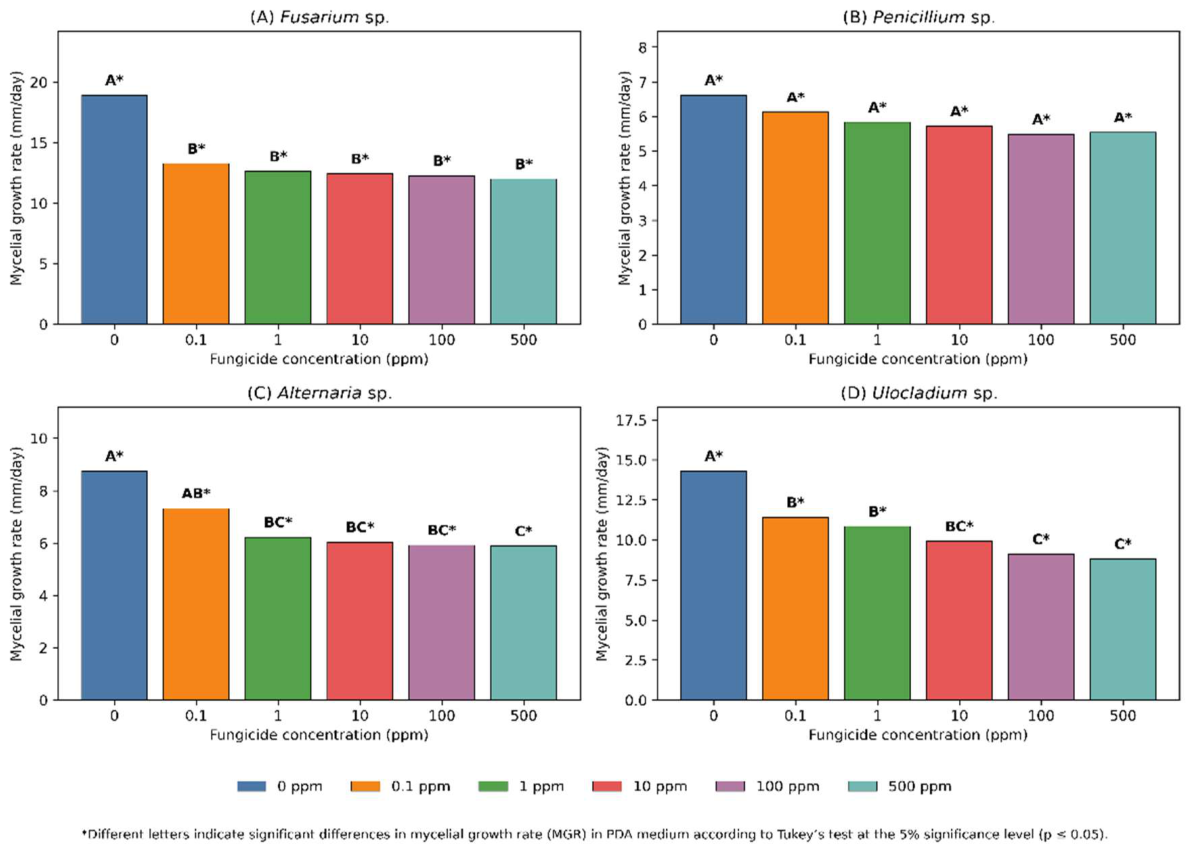
Figure 6.
Mycelial growth rate (MGR) of (A) Fusarium sp., (B) Penicillium sp., (C) Alternaria sp., and (D) Ulocladium sp. in PDA medium supplemented with different concentrations of thiabendazole. Different letters indicate significant differences among concentrations according to Tukey’s test at the 5% significance level (p ≤ 0.05).
Figure 6.
Mycelial growth rate (MGR) of (A) Fusarium sp., (B) Penicillium sp., (C) Alternaria sp., and (D) Ulocladium sp. in PDA medium supplemented with different concentrations of thiabendazole. Different letters indicate significant differences among concentrations according to Tukey’s test at the 5% significance level (p ≤ 0.05).
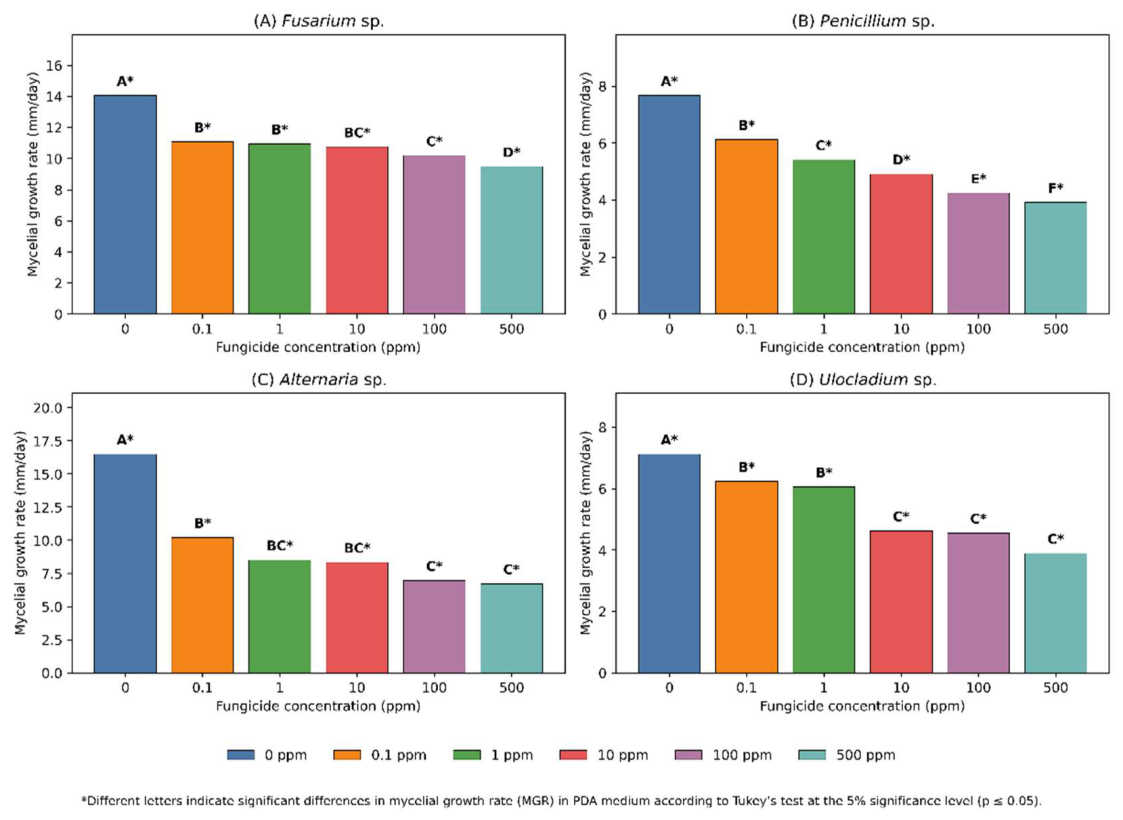

Table 1.
Fungal isolates obtained and used in the experimental trials.
| Pathogen | Site | Crop | Sample type |
| (A) Fusarium sp. | Santa Fe de Galán | White onion | Root |
| (B) Penicillium sp. | Santa Fe de Galán | White onion | Root |
| (C) Alternaria sp. | Santa Fe de Galán | White onion | Foliar |
| (D) Ulocladium sp. | Santa Fe de Galán | White onion | Root |
Table 2.
Concentration of the active ingredient for preparing the stock solution.
| Mode of action | Chemical group | Active ingredient | Trade name | Active ingredient concentration |
| G1 | Triazoles | Tebuconazole | Stratego® SC | 250 g.L-1 |
| Mefentrifluconazole | Belanty® | 400 g.L-1 | ||
| C3 | Strobirulins | Pyraclostrobin | Comet® 25 CE | 250 g.L-1 |
| Azoxystrobin | Amistar 50 WG | 500 g.kg-1 | ||
| B1 | Benzimidazoles | Thiophanate-methyl | Novak® 500 SC | 500 g.L-1 |
| Thiabendazole | Mertect 500 SC | 500 g.L-1 |
Table 3.
Percentage Inhibition Scale [14].
Table 3.
Percentage Inhibition Scale [14].
| Sensitivity | Range |
| Low inhibition | 0% - 25% |
| Moderate inhibition | 25% - 50% |
| High inhibition | > 50% |
Table 4.
Sensitivity scale proposed by [15].
Table 4.
Sensitivity scale proposed by [15].
| Sensitivity | Range |
| Very sensitive | <1,0 μg/mL |
| Sensitive | 1-5 μg/mL |
| Moderately resistant | 5-20 μg/mL |
| High resistance | 20-100 μg/mL |
| Very high resistance | >500 μg/mL |
Table 5.
Effective concentration (EC50) of tebuconazole for Fusarium sp., Penicillium sp., Alternaria sp., and Ulocladium sp.
Table 5.
Effective concentration (EC50) of tebuconazole for Fusarium sp., Penicillium sp., Alternaria sp., and Ulocladium sp.
| Code | DL50 | Phenotype | Sensitivity | |
| Tebuconazole | Fusarium sp. | 0,10 | <1,0 µg.mL-1 | Very sensitive |
| Penicillium sp. | 0,07 | <1,0 µg.mL-1 | Very sensitive | |
| Alternaria sp. | 22,75 | 20-100 µg.mL-1 | High resistance | |
| Ulocladium sp. | 7,46 | 5-20 µg.mL-1 | Moderately sensitive |
Table 6.
Effective concentration (EC50) of mefentrifluconazole for Fusarium sp., Penicillium sp., Alternaria sp., and Ulocladium sp.
Table 6.
Effective concentration (EC50) of mefentrifluconazole for Fusarium sp., Penicillium sp., Alternaria sp., and Ulocladium sp.
| Code | DL50 | Phenotype | Sensitivity | |
| Mefentrifluconazole | Fusarium sp. | 43,05 | 20-100 µg.mL-1 | High resistance |
| Penicillium sp. | 749,53 | > 500 µg.mL-1 | Very high resistance | |
| Alternaria sp. | 0,019 | <1,0 µg.mL-1 | Very sensitive | |
| Ulocladium sp. | 1,17 | 1-5 µg.mL-1 | Sensitive |
Table 7.
Effective concentration (EC50) of azoxystrobin for Fusarium sp., Penicillium sp., Alternaria sp., and Ulocladium sp.
Table 7.
Effective concentration (EC50) of azoxystrobin for Fusarium sp., Penicillium sp., Alternaria sp., and Ulocladium sp.
| Code | DL50 | Phenotype | Sensitivity | |
| Azoxystrobin | Fusarium sp. | 1,39 | 1-5 µg/ml-1 | Sensitive |
| Penicillium sp. | 0,06 | <1,0 µg/ml-1 | Very sensitive | |
| Alternaria sp. | 0,01 | <1,0 µg/ml-1 | Very sensitive | |
| Ulocladium sp. | 0,10 | <1,0 µg/ml-1 | Very sensitive |
Table 8.
Effective concentration (EC50) of pyraclostrobin for Fusarium sp., Penicillium sp., Alternaria sp., and Ulocladium sp.
Table 8.
Effective concentration (EC50) of pyraclostrobin for Fusarium sp., Penicillium sp., Alternaria sp., and Ulocladium sp.
| Code | DL50 | Phenotype | Sensitivity | |
| Pyraclostrobin | Fusarium sp. | 0,35 | <1,0 µg/ml-1 | Very sensitive |
| Penicillium sp. | 1,17 | 1-5 µg/ml-1 | Sensitive | |
| Alternaria sp. | 0,04 | <1,0 µg/ml-1 | Very sensitive | |
| Ulocladium sp. | 8,81 | 5-20 µg/ml-1 | Moderately sensitive |
Table 9.
Effective concentration (EC50) of methyl thiophanate for Fusarium sp., Penicillium sp., Alternaria sp., and Ulocladium sp.
Table 9.
Effective concentration (EC50) of methyl thiophanate for Fusarium sp., Penicillium sp., Alternaria sp., and Ulocladium sp.
| Code | DL50 | Phenotype | Sensitivity | |
| Methyl thiophanate | Fusarium sp. | 0,02 | <1,0 µg/ml-1 | Very sensitive |
| Penicillium sp. | 9,27 | 5-20 µg/ml-1 | Moderately sensitive | |
| Alternaria sp. | 0,70 | <1,0 µg/ml-1 | Very sensitive | |
| Ulocladium sp. | 6,90 | 5-20 µg/ml-1 | Moderately sensitive |
Table 10.
Effective concentration (EC50) of thiabendazole for Fusarium sp., Penicillium sp., Alternaria sp., and Ulocladium sp.
Table 10.
Effective concentration (EC50) of thiabendazole for Fusarium sp., Penicillium sp., Alternaria sp., and Ulocladium sp.
| Code | DL50 | Phenotype | Sensitivity | |
| Tiabendazole | Fusarium sp. | 0,11 | <1,0 µg/ml-1 | Very sensitive |
| Penicillium sp. | 1,17 | 1-5 µg/ml-1 | Sensitive | |
| Alternaria sp. | 0,03 | <1,0 µg/ml-1 | Very sensitive | |
| Ulocladium sp. | 0,32 | <1,0 µg/ml-1 | Very sensitive |
Disclaimer/Publisher’s Note: The statements, opinions and data contained in all publications are solely those of the individual author(s) and contributor(s) and not of MDPI and/or the editor(s). MDPI and/or the editor(s) disclaim responsibility for any injury to people or property resulting from any ideas, methods, instructions or products referred to in the content. |
© 2026 by the authors. Licensee MDPI, Basel, Switzerland. This article is an open access article distributed under the terms and conditions of the Creative Commons Attribution (CC BY) license (http://creativecommons.org/licenses/by/4.0/).
Copyright: This open access article is published under a Creative Commons CC BY 4.0 license, which permit the free download, distribution, and reuse, provided that the author and preprint are cited in any reuse.