

Submitted:
02 September 2026
Posted:
03 September 2026
You are already at the latest version
Abstract
Platelets undergo significant morphological transformations during activation influenced by chemical compounds such as zinc and milrinone. Manual classification methods are subjective, time-consuming, and prone to error. This research aimed to apply and evaluate the efficacy of different pre-trained deep learning Convolution Neural Networks, used for automated binary (treated vs. untreated) and multiclass classification (control vs. zinc vs. milrinone vs. combination) of platelet morphological changes induced by these solvents, addressing the limitations of manual classification methods. A dataset of 176 microscopic platelet images from Hull York Medical School was processed, comprising control (n=43), zinc-treated (n=45), milrinone-treated (n=40), and combination treatment (n=48) samples. Ten pre-trained CNN architectures were evaluated across 166 individual training iterations for both binary and multiclass classification tasks. Progressive optimisation strategies included contrast-limited adaptive histogram equalisation (CLAHE) enhancement, selective layer unfreezing, cross-validation, and hyperparameter tuning. For binary classification, Xception achieved optimal balanced performance (81% accuracy, 76% precision, 74% recall) with proper inter-class discrimination, despite higher numerical metrics (91% accuracy) showing classification bias. For multiclass classification, InceptionV3 and Xception demonstrated superior effectiveness with 72% accuracy. This study demonstrated that Xception and InceptionV3 architectures effectively capture subtle morphological features distinguishing treated platelets, offering reproducible alternatives to subjective manual methods.
Keywords:
deep learning
; convolution neural networks
; image classification
; platelets
; zinc
; milrinone
; Xception
1. Introduction
Platelets are small anucleate cell fragments circulating in the blood, which are derived from megakaryocytes measuring 2-3 μm in diameter, playing a crucial role in managing vascular integrity, regulating haemostasis and thrombosis [1]. These dynamic cellular elements undergo significant morphological transformations during activation, and they also form clots to arrest bleeding when blood vessels sustain damage [2]. The comprehensive understanding of platelet function and activation mechanisms has far-reaching implications for cardiovascular disease management, stroke prevention, and treatment of bleeding disorders [3]. The functional properties and morphological characteristics of platelets are influenced by various chemical compounds, with zinc (Zn2+) playing a particularly significant role in this complex biological system. Approximately 17.3% of the global population experiences inadequate zinc intake, leading to various physiological effects that include bleeding disorders [3]. The significance of zinc in haemostasis is demonstrated by bleeding disorders in zinc-deficient organisms [4] and platelets’ response to Zn2+ elevation [5]. Another important compound affecting platelet function is milrinone, a phosphodiesterase-3 inhibitor that increases cyclic adenosine monophosphate (cAMP) levels, thereby inhibiting platelet activation through complex intracellular signalling pathways [6]. The interplay between pro-activating factors like zinc and inhibitory agents like milrinone represents a complex regulatory system that maintains the delicate balance of platelet activity necessary for normal haemostasis while preventing pathological thrombosis. Also, the associated morphological and behavioural changes could signal a defect or pathological condition, making them important for diagnostic purposes [7,8].
Beyond their primary haemostatic function, platelets participate in immune modulation, inflammatory signalling, and wound healing, further broadening the clinical relevance of accurate morphological characterisation [1]. Calaminus et al. identified novel actin-rich structures emerging during the early stages of platelet spreading, illustrating the morphological complexity against which treatment-induced changes must be assessed [9]. Computer-aided systems for blood cell classification have been explored to partially address the limitations of manual analysis [10], however their sensitivity to subtle treatment-induced morphological variation in platelets has remained limited without the representational power of deep learning architectures.
The use of traditional methods to identify these changes could be quite subjective, dependent on human expertise, prone to error and time consuming [2], however, in recent years, artificial intelligence (AI) and deep learning have transformed medical image analysis, providing sophisticated tools for automated classification of microscopic blood cell images [11]. Within this technological evolution, Convolutional Neural Networks (CNNs) have emerged as particularly effective, demonstrating remarkable performance advantages over traditional machine learning approaches [12]. These advanced deep learning architectures possess the unique capability to extract hierarchical features and learn complex patterns from complex images without human intervention, enabling accurate classification even when confronted with intricate cellular morphologies and subtle structural variations, such as we see in treated platelets [10,13]. In the application of CNN for classification, transfer learning has become an indispensable technique in medical image analysis, effectively addressing the persistent challenges of limited dataset availability by leveraging knowledge embedded in pre-trained models [13]. This approach has yielded promising results across diverse medical imaging applications, including the nuanced domain of blood cell classification [11]. Transfer learning approach has proven particularly valuable as it reduces the need for extensive labelled data while potentially improving performance through knowledge transfer from broader image recognition tasks [13,14].
In the application of deep learning models for blood cell classification, several studies have employed various architectures with promising results: Hemalatha et al. achieved 95% accuracy with enhanced CNN models for blood cell classification [12], while Kumar et al. showed U-Net significantly outperformed FCN for platelet segmentation with Dice scores of 0.99 and accuracy of 98% [15]. Notably, Abidoye et al. demonstrated remarkable improvements with data augmentation, where DenseNet121 achieved 81% accuracy on original datasets, while InceptionV3 and DenseNet201 reached 99% and 98% accuracy respectively with enhanced augmentation [8]. For other platelet-specific analysis, Kempster et al. developed CNNs that eliminated manual annotation challenges [2], while Poschkamp and Bekeschus achieved 98.4% accuracy in platelet aggregate classification [16]. Chemical influences on platelet morphology have been explored by Coupland et al., who demonstrated zinc’s role as a platelet agonist [3], and Calaminus et al., who identified novel actin-rich structures during platelet spreading [9]. Zhou et al. showed that IPAC (Intelligent Platelet Aggregate Classifier) and CNN with encoder-decoder architecture can be used to classify platelet aggregates using their distinct morphological features [17]. In distinguishing between Covid-19 and non-Covid-19 thrombosis, a CNN with four convolutional layers was used to phenotypically differentiate non-aggregated platelets, aggregated platelets and WBCs with 96% accuracy [18], and using a hybrid approach of deep learning and image processing techniques via incremental learning, Al-qudah and Suen improved platelet classification accuracy from 82.6% to 98.6% [19]. Ram et al. compared multiple architectures including DenseNet-121, MobileNetV2, and ResNet-50, providing insights into their relative strengths in medical image analysis tasks [20]. Litjens et al. provided a comprehensive survey of deep learning in medical image analysis, documenting strong performance across segmentation, detection, and classification tasks and establishing the methodological foundation upon which platelet-specific applications now build [21]. Ker et al. similarly demonstrated the breadth of deep learning applications in medical imaging, contextualising the expanding scope of automated image analysis in clinical settings [22]. The choice of optimiser is consequential in low-data medical imaging settings: Singh et al. demonstrated that the Adam optimiser provides superior performance for blood cell classification tasks compared to alternatives such as Adadelta and SGD, owing to its adaptive learning rate adjustments and momentum properties [23]. Hutter et al. advocated for progressive hyperparameter refinement rather than exhaustive grid search as best practice for computationally intensive deep learning models, a principle directly applicable to transfer learning workflows in medical imaging [24]. In a comprehensive study, Asghar et al. evaluated the performance of various pre-trained CNN architectures, including VGG16, VGG19, ResNet-50, ResNet-101, ResNet-152, InceptionV3, MobileNetV2, and DenseNet-201 for blood cell classification. Their results demonstrated accuracy rates ranging from 91.375% to 94.72% across different architectures, with ResNet-50 achieving the highest performance. Furthermore, they proposed a custom CNN model that achieved an impressive 99.91% accuracy, highlighting the potential benefits of designing specialized architectures for specific cell classification tasks [10].
This work is supported by the broader context of blood cell classification research. Durant et al. applied very deep CNNs to morphological classification of erythrocytes, demonstrating the generalisability of deep learning across blood cell types [25]. Xu et al. demonstrated a deep CNN for classification of red blood cells in sickle cell anaemia, highlighting the clinical value of automated morphological assessment in haematological disorders [26]. Devi et al. and Ali-Bagido et al. explored white blood cell classification using deep learning, contributing to the growing evidence base for automated haematological image analysis [27,28]. Xia et al. demonstrated automated blood cell detection and counting via deep learning for microfluidic point-of-care medical devices, illustrating the translational potential of these approaches beyond laboratory settings [29]. Naruenatthanaset et al. explored red blood cell segmentation using fuzzy c-means and region growing techniques, further contextualising the methodological progression toward fully automated deep learning solutions in haematological imaging [30].
The role of data augmentation in medical image classification warrants specific consideration in the context of platelet morphology. Shorten and Khoshgoftaar provided a comprehensive survey documenting the general benefits of augmentation for model generalisation [31]. However, Taylor and Nitschke noted that augmentation can introduce artefacts that obscure discriminative features in biological specimens with intricate structural elements [32]. Tellez et al. quantified the effects of augmentation and stain colour normalisation in CNNs for computational pathology, demonstrating that augmentation strategies must be carefully matched to the specific imaging domain [33]. Frid-Adar et al. demonstrated that GAN-based synthetic medical image augmentation provides more effective data enrichment than conventional techniques by learning the underlying data distribution, an approach that may be particularly relevant for specialised microscopic imaging tasks [34]. The challenge of class imbalance further complicates augmentation strategies: Buda et al. conducted a systematic study of the class imbalance problem in CNNs, establishing that standard accuracy metrics are unreliable under imbalance and that confusion matrix analysis is essential for assessing genuine discriminative performance [35]. Japkowicz and Stephen provided a systematic study confirming that models trained on imbalanced datasets tend to minimise loss by defaulting to the majority class, producing misleadingly high accuracy [36]. He and Garcia demonstrated that learning from imbalanced data requires class weighting, specialised loss functions, and careful evaluation metrics [37]. Johnson and Khoshgoftaar further identified that high accuracy can mask significant classification bias in biomedical tasks when evaluation relies solely on aggregate metrics [38].
The architectural properties of specific CNN designs are relevant to their suitability for microscopic platelet image classification. Simonyan and Zisserman established that very deep sequential convolutional networks with 3×3 filters achieve strong performance on image classification tasks [39]. He et al. demonstrated that residual skip connections address the vanishing gradient problem, enabling effective training of very deep architectures [40]. Szegedy et al. introduced the Inception architecture employing parallel convolutional paths for multi-scale feature extraction [41]. Huang et al. demonstrated that dense connectivity enabling feature reuse across layers provides strong classification performance [42]. Chollet introduced Xception, leveraging depth wise separable convolutions for efficient feature extraction [43]. Sandler et al. introduced MobileNetV2 with inverted residuals and linear bottlenecks [44]. Tan and Le introduced EfficientNet, demonstrating that compound scaling of network depth, width, and resolution improves performance systematically [45]. Kornblith et al. demonstrated that maintaining input dimensions consistent with pre-training configurations preserves learned feature hierarchies in early layers [46]. Yosinski et al. established that features in deep neural networks transfer across domains with varying effectiveness depending on layer depth, with earlier layers encoding more generalisable and later layers more task-specific representations [47]. Soleimani et al. demonstrated that selective layer unfreezing provides superior model stability compared to fully frozen or completely fine-tuned approaches [48].
Despite advances in deep learning for blood cell classification, significant gaps persist in platelet-specific applications. Research has focused primarily on general blood cell classification and platelet aggregation detection, with limited exploration of treatment-induced morphological changes in platelets. The comparative performance of different CNN architectures for platelet classification remains underexplored, particularly regarding combinations of agents like zinc and milrinone. To address these gaps, this study quantitatively evaluates and compares the efficacy of ten pre-trained CNN architectures for both binary (treated vs. untreated) and multiclass (control vs. zinc vs. milrinone vs. milrinone + zinc) classification of microscopic platelet images subjected to zinc, milrinone, and their combination. The research investigates the impact of various data augmentation techniques, regularisation methods, and hyperparameter settings on model performance, with the aim of establishing a reproducible methodology for automated platelet classification that could potentially be applied in clinical and research settings. This research addresses several key questions: how effectively different deep learning architectures can classify platelet morphological changes induced by zinc, milrinone, and their combination; the comparative performances of pre-trained CNN models for binary versus multiclass platelet classification; which CNN architecture provides the optimal balance of accuracy metrics; and how data augmentation and transfer learning techniques affect model performance with limited dataset size. While contributing to AI-assisted medical image analysis and platelet biology, this work acknowledges persistent challenges including dataset imbalance [36], limited ability to detect diverse abnormalities [49], and poor robustness to image variations.
2. Materials and Methods
2.1. Dataset
The dataset comprised 176 microscopic platelet images from Hull York Medical School, distributed across four experimental conditions: untreated control platelets (n=43), zinc-treated platelets (n=45), milrinone-treated platelets (n=40), and platelets treated with combination of both agents (n=48). These treatment conditions were selected to investigate morphological changes induced by compounds known to modulate platelet function through distinct signalling pathways.
For binary classification, images were grouped as ‘Untreated’ (control) versus ‘Treated’ (all treatment conditions) as seen in Figure 1. For multiclass classification, images maintained individual treatment categories as seen in Figure 1. Original images in Carl Zeiss Image (CZI) format were converted to Joint Photographic Experts Group (JPEG) and resized from 747×600 pixels to 224×224 pixels with 3 channels, normalised to a range of [0,1].
2.2. Data Preprocessing
The dataset was split into training (70%), validation (15%), and test (15%) sets with stratification to maintain class distribution. Image augmentation was performed at scales of 150, 200, 500, and 1000 images per class, incorporating 30-degree rotation, width/height shifts (factor 0.2), horizontal/vertical flipping, zoom (factor 0.2), and brightness adjustments (range 0.8-1.2) with ‘nearest’ fill mode.
2.3. Model Architecture and Training
Ten pre-trained CNN models were fine-tuned: Inception-v3 [41], DenseNet-201 [42], MobileNet-v2 [44], ResNet-50 [40], ResNet-101 [40], Xception [43], Inception-ResNet-v2 [51], EfficientNet-b0 [45], VGG-16 [39], and VGG-19 [39]. These architectures differ significantly: VGG models employ sequential designs [39]; ResNet variants implement skip connections [40]; Inception models use parallel convolutional paths [41]; DenseNet-201 enables feature reuse [42]; Xception utilises depth wise separable convolutions [43]; MobileNet-v2 utilises inverted residuals [44]; and EfficientNetB0 optimises scaling [45].
2.3.1. Binary Classification Architecture
The binary classification was applied to separate platelets in the control group from all the images of the different treatment solvents. For this binary classification task, architectures used global average pooling layers followed by dense layers (512 and 256 neurons) with ReLU activation, dropout (0.3), and sigmoid output activation using binary cross-entropy loss. The scheme of the applied methods to the binary classification can be seen in
Figure 2
.
2.3.2. Multiclass Classification Architecture
In the multiclass classification task, the goal was to be able to classify all the different solvent groups as separate classes. Here, similarly to what was done for the binary classification, the architectures were applied had a similar structure to the ones used in the binary classification; however, with categorical cross-entropy loss and SoftMax activation for a four-class output. The scheme of the applied methods for the multiclass classification can be seen in
Figure 3
.
2.3.3. Additional Classification Approach
This classification approach was implemented to investigate treatment agent effects on the classification, in particular on the models that struggled with it. This approach aimed to use the training architectures that have performed well for binary and multiclass classification to determine whether morphological changes caused by specific treatment agents were similar and undetectable, resulting in less discrimination by models, or distinct. For this, two approaches were tested. One where 2-fold binary classification uses combined control/zinc-treated platelets as one class versus milrinone/milrinone + zinc treated platelets, and the second one where is applied a 3-fold multiclass classification with combined control/zinc-treated platelets as one class versus standalone milrinone-treated versus zinc/milrinone combination was applied. In the first of these approaches the zinc is maintained constant in both classes, so any difference will arise from the difference between control and milrinone, in the second approach zinc images were combined with control images, and the other groups with milrinone remain independent. This second approach considered the finding of Coupland (2023) where platelets treated with Zinc demonstrated great similarity with the control ones [3].
2.3.4. Progressive Optimisation
Models underwent 19 architectural iterations incorporating class weight adjustment, focal loss integration, hyperparameter optimisation, L2 regularisation, batch normalisation, selective layer unfreezing, cross-validation, contrast limited adaptive histogram equalisation (CLAHE) enhancement [53], custom resolutions (224×224/299×299), and adaptive thresholding, resulting in 166 individual training configurations for binary classification presented in Table 1.
2.4. Evaluation Metrics
Models were evaluated using accuracy, precision, recall, F1-score, and confusion matrices implemented through scikit-learn.
2.5. Hardware and Software
Models were trained using Python 3.11 with TensorFlow (v2.18.0) and Keras (v3.8.0) on systems equipped with Intel® Core i7-8550U CPU, 12GB RAM, and Nvidia GeForce MX 150 GPU, with additional support from high-performance computers featuring 4x Nvidia Tesla K40m GPUs.
3. Results
3.1. Binary Classification Results
Initially, the models achieved 74% accuracy but demonstrated severe classification bias predicting all samples as the majority ‘Treated’ class as seen in Table 2. Class weight integration improved performance, with MobileNetV2 achieving 78% accuracy as well as proper classification of both classes.
The introduction of L2 regularisation (0.001), batch normalisation, and increased dropout (0.5) yielded positive results. DenseNet201 and Xception performed best with 78% and 81% accuracy, respectively as seen in Table 3. Data augmentation unexpectedly degraded performance, likely distorting subtle morphological differences critical for classification.
Architectural refinements incorporating CLAHE enhancement, custom resolutions, 5-fold cross-validation, and 30% deep layer unfreezing achieved the highest metrics. Xception in particulardemonstrated very positive performance, as it reached 91% accuracy, 91% precision, and 87% recall, which represented the peak numerical performance achieved. The comparison between these models can be seen in Table 4.
Despite these good results in the measuring metrics, a persistent single-class prediction bias is visible in the confusion matrix presented in Figure 4a. Xception configuration from iteration 7 achieved optimal discrimination with 81% accuracy, 76% precision, and 74% recall while maintaining proper inter-class classification as seen in Table 3. This represented the best balance between numerical performance and actual discriminative capability as seen in Figure 4b.
3.2. Multiclass Classification Results
Initial models showed poor performance, with InceptionResNet V2 achieving the highest accuracy at 37%. The addition of class weights and augmentation provided limited improvement. Significant improvements occurred with architectural refinements in iterations 16 and 18 as seen in Table 1. Custom image loading (224×224 for DenseNet201/VGG16, 299×299 for Xception/InceptionV3) matched each architecture to its native input size, preventing the distortion that occurs when images are resized incorrectly for a given model, 5-fold cross-validation was used to reduce the impact of the small dataset size, giving a more reliable estimate of model performance across different data splits rather than relying on a single train-test division, and selective layer unfreezing (20-30%) which allowed the pretrained models to adjust their higher-level features to the specific characteristics of platelet images, while keeping the early, more general layers unchanged, proved critical. Collectively, these methodological refinements addressed distinct sources of limitations resulting in marked improvement in performance.
Inception V3 and Xception consistently achieved 70-72% accuracy across multiple optimization iterations. Iteration 16 delivered the best performance for Xception’s with an accuracy of 72% accuracy as seen in Table 5.
InceptionV3’s best results were achieved on iteration 18 with CLAHE enhancement also with an accuracy of 72% as seen in Table 6. These were the best performing compositions.
3.3. Additional Classification Approaches
On the additional 3-fold classification, by combining control/zinc-treated as one class versus milrinone/combination treatments, achieved 70% accuracy with Xception, VGG16, InceptionV3, and DenseNet201, suggesting some morphological similarity between control and zinc-treated platelets. Meanwhile in the 2-fold alternative binary task, the different binary groupings achieved 89% accuracy with InceptionV3, but similarly to what happened in the original binary classification tasks confusion matrices revealed single-class classification bias.
4. Discussion
This comprehensive study demonstrates that automated platelet classification using deep learning approaches can effectively distinguish morphological changes induced by chemical treatments, with important implications for both research and clinical applications.
Xception and InceptionV3 architecture consistently demonstrated superior performance across both binary and multiclass tasks. Xception’s depth wise separable convolutions and InceptionV3’s multi-scale feature extraction capabilities appear well-suited for capturing subtle platelet morphological features. The consistent performance of these architectures across different classification scenarios establishes them as optimal choices for platelet classification [10,41,43,51].
Binary classification achieved higher numerical accuracy (up to 91%), but faced significant discrimination challenges due to dataset imbalance. The 81% value of accuracy with proper discrimination represents a more clinically relevant achievement than the peak accuracy due to imbalanced data.
Multiclass classification, while achieving lower overall accuracy (72%), provided more valuable clinical insights by distinguishing specific treatment effects, highlighting the importance of aligning model development with research objectives. Multiclass classification represented advancement over binary approaches by distinguishing between specific individual treatments (Control vs. Zinc vs. Milrinone vs. Zinc + Milrinone). Iterations 18 and 19 showed promising performance with InceptionV3 and Xception consistently achieving higher than 70% accuracy.
Progressive architectural refinements proved essential for overcoming initial classification bias [24,35]. CLAHE enhancement addressed the specific challenges of microscopic imaging by improving local contrast without amplifying noise [53]. Selective layer unfreezing (30%) enabled adaptation to platelet-specific features while maintaining beneficial pre-trained representations [47,54]. Cross-validation provided robust performance assessment across multiple data splits [55,56]. This targeted optimization strategy follows best practices outlined by Hutter et al., who advocate for progressive refinement rather than exhaustive grid search when working with computationally intensive deep learning models [24].
Contrary to literature expectations [31,57], traditional data augmentation degraded performance, likely due to distortion of subtle morphological differences critical for platelet classification [58]. This finding aligns with Taylor and Nitschke (2018), who noted that augmentation can obscure discriminative features in specialized medical imaging tasks. The small dataset size (176 images) and class imbalance (43 control vs. 133 treated) presented significant challenges requiring careful optimization strategies [35]. Unlike macroscopic images, where augmentation helps models to learn invariant features, microscopic platelet images contain subtle morphological differences that may be distorted by standard augmentation techniques [31].
The ability to automatically distinguish platelet responses to zinc (agonist) and milrinone (inhibitor) treatments has potential applications in cardiovascular research and drug development [3]. Automated platelet classification could streamline assessment of antiplatelet medication effectiveness and identify platelet function disorders more efficiently than manual methods [3,59]. Dataset size and potential unrepresentativeness limit generalisability [35,49,50]. The original 747×600 to 224×224 pixels resizing may have eliminated critical morphological details that cropping approaches could preserve. Future work should explore custom CNN architectures based on Xception/InceptionV3 designs, and ensemble approaches combining multiple top-performing architectures; as explainability grows in importance in the field of healthcare, it would be interesting to include in further studies attention mechanisms for identifying discriminative features.
5. Conclusion
This research establishes a comprehensive methodological foundation for automated platelet classification under different solvent conditions using deep learning approaches. Using ten pre-trained CNN architectures across 166 training experiments, it was demonstrated that Xception and InceptionV3 architectures achieve superior performance for both binary and multiclass classification of platelet morphological changes induced by zinc, milrinone, and their combination.
More particularly it became evident that Xception achieved optimal balanced binary classification (81% accuracy) with proper inter-class discrimination, while Inception V3 and Xception demonstrated consistent multiclass performance (72% accuracy). Preprocessing of the images was revealed to be crucial with CLAHE enhancement and selective layer unfreezing proving to be critical optimisation strategies, while traditional data augmentation unexpectedly degraded performance in this specialised application.
This automated approach of using CNNs for platelet classification offers reproducible alternatives to subjective manual classification methods, potentially advancing both research applications in platelet biology and clinical diagnostics. While challenges remain regarding dataset limitations and generalisability, this work provides a solid foundation for future development of automated platelet analysis systems that could improve diagnostic efficiency and advance understanding of platelet function in health and disease.
The primary limitation of this study is the modest dataset size of 176 images across four treatment conditions. While transfer learning, 5-fold cross-validation, and regularisation techniques were employed to mitigate overfitting risk, the findings should be interpreted as a methodological proof of concept rather than a clinically validated classifier. Future work should prioritise dataset expansion through multi-site image collection and generative augmentation strategies to improve model robustness and generalisability.
The methodology demonstrated here could be extended to other cellular classification tasks in haematology and adapted for clinical implementation with appropriate validation studies. Future research should focus on expanding datasets, exploring custom architectures, and validating performance across diverse patient populations to fully realise the clinical potential of automated platelet analysis.
Author Contributions
Conceptualization, V.O.D. S.D.J.C. and E.S.; methodology, V.O.D. and E.S.; software, V.O.D. validation, V.O.D. and E.S.; formal analysis, V.O.D.; resources, C.A.C. and S.D.J.C; data curation, V.O.D., S.D.J.C. and C.A.C.; writing—original draft preparation, V.O.D. and E.S.; writing—review and editing, V.O.D., E.S., J.M., N.S.; visualization, V.O.D.; supervision, E.S and S.D.J.C.; project administration,V.O.D. and E.S.; funding acquisition, , C.A.C. and S.D.J.C; All authors have read and agreed to the published version of the manuscript.
Funding
This research was funded by the British Heart Foundation PhD studentships Grant Number: FS/19/38/34441 (to C.A.C. and S.D.J.C).
Institutional Review Board Statement
Platelet images are from the study completed by Coupland et al. [5]. Briefly, platelets were obtained from blood samples donated by consenting adults under ethics authorisation by the Hull York Medical School Ethics Committee for “The study of platelet activation, signalling and metabolism” and the National Health Service (NHS) Research Ethics Committee (REC) study “Investigation of blood cells for research into cardiovascular disease” (21/SC/0215). Informed Consent Statement: Not applicable.
Data Availability Statement
The raw data supporting the conclusions of this article will be made available by the authors on request.
Acknowledgments
We gratefully acknowledge the Centre of Excellence for Data Science, Artificial Intelligence and Modelling at the University of Hull for technical support. We also thank colleagues at the Centre for Biomedicine, Hull York Medical School.
Conflicts of Interest
The authors declare no conflicts of interest.
Abbreviations
The following abbreviations are used in this manuscript:
| AI | Artificial Intelligence |
| cAMP | Cyclic Adenosine Monophosphate |
| CLAHE | Contrast-Limited Adaptive Histogram Equalisation |
| CNN | Convolutional Neural Network |
| CNNs | Convolutional Neural Networks |
| CPU | Central Processing Unit |
| CZI | Carl Zeiss Image |
| FCN | Fully Convolutional Network |
| GAN | Generative Adversarial Network |
| GB | Gigabyte |
| GPU | Graphics Processing Unit |
| GPUs | Graphics Processing Units |
| IPAC | Intelligent Platelet Aggregate Classifier |
| JPEG | Joint Photographic Experts Group |
| L2 | L2 Regularisation |
| LR | Learning Rate |
| RAM | Random Access Memory |
| ReLU | Rectified Linear Unit |
| SGD | Stochastic Gradient Descent |
| WBCs | White Blood Cells |
References
- Ghoshal, K.; Bhattacharyya, M. Overview of platelet physiology: its haemostatic and non-haemostatic role in disease pathogenesis. Sci. World J. 2014, 2014, 781857. [Google Scholar] [CrossRef]
- Kempster, C.; Butler, G.; Kuznecova, E.; Taylor, K.A.; Kriek, N.; Little, G.; Sowa, M.A.; Sage, T.; Johnson, L.J.; Gibbins, J.M.; Pollitt, A.Y. Fully automated platelet differential interference contrast image analysis via deep learning. Sci. Rep. 2022, 12, 4614–4628. [Google Scholar] [CrossRef]
- Coupland, C.A.; Naylor-Adamson, L.; Booth, Z.; Price, T.W.; Gil, H.M.; Firth, G.; Avery, M.; Ahmed, Y.; Stasiuk, G.J.; Calaminus, S.D.J. Platelet zinc status regulates prostaglandin-induced signalling, altering thrombus formation. J. Thromb. Haemost. 2023, 21, 2545–2558. [Google Scholar] [CrossRef]
- Watson, B.R.; White, N.A.; Taylor, K.A.; Howes, J.M.; Malcor, J.D.; Bihan, D.; Sage, S.O.; Farndale, R.W.; Pugh, N. Zinc is a transmembrane agonist that induces platelet activation in a tyrosine phosphorylation-dependent manner. Metallomics 2016, 8, 91–100. [Google Scholar] [CrossRef]
- Kuravi, S.J.; Ahmed, N.S.; Taylor, K.A.; Capes, E.M.; Bye, A.; Unsworth, A.J. Delineating Zinc Influx Mechanisms during Platelet Activation. Int. J. Mol. Sci. 2023, 24, 11689–11704. [Google Scholar] [CrossRef]
- Francis, G.S.; Bartos, J.A.; Adatya, S. Inotropes. J. Am. Coll. Cardiol. 2014, 63, 2069–2078. [Google Scholar] [CrossRef]
- Qiu, X.; Nair, M.G.; Jaroszewski, L.; Godzik, A. Deciphering Abnormal Platelet Subpopulations in COVID-19, Sepsis and Systemic Lupus Erythematosus through Machine Learning and Single-Cell Transcriptomics. Int. J. Mol. Sci. 2024, 25, 5941. [Google Scholar] [CrossRef]
- Abidoye, I.; Ikeji, F.; Coupland, C.A.; Calaminus, S.D.J.; Sander, N.; Sousa, E. Platelets Image Classification Through Data Augmentation: A Comparative Study of Traditional Imaging Augmentation and GAN-Based Synthetic Data Generation Techniques Using CNNs. J. Imaging 2025, 11, 183. [Google Scholar] [CrossRef]
- Calaminus, S.D.J.; Thomas, S.; McCarty, O.J.T.; Machesky, L.M.; Watson, S.P. Identification of a novel, actin-rich structure, the actin nodule, in the early stages of platelet spreading. J. Thromb. Haemost. 2023, 6, 1944–1952. [Google Scholar]
- Asghar, R.; Kumar, S.; Hynds, P. Automatic classification of 10 blood cell subtypes using transfer learning via pre-trained convolutional neural networks. Inform. Med. Unlocked 2024, 49, 101542–101556. [Google Scholar] [CrossRef]
- Asghar, R.; Kumar, S.; Hynds, P.; Mahfooz, A. Classification of All Blood Cell Images using ML and DL Models. J. Appl. Soft Comput. 2023. [Google Scholar] [CrossRef]
- Hemalatha, B.; Karthik, B.; Krishna Reddy, C.V.; Latha, A. Deep learning approach for segmentation and classification of blood cells using enhanced CNN. Meas. Sens. 2022, 24, 100582. [Google Scholar] [CrossRef]
- Kim, H.E.; Cosa-Linan, A.; Santhanam, N.; Jannesari, M.; Maros, M.E.; Ganslandt, T. Transfer learning for medical image classification: a literature review. BMC Med. Imaging 2022, 22, 69–82. [Google Scholar] [CrossRef]
- Ailyn, D.; Celic, M. Enhancing Blood Cell Detection and Classification with Transfer Learning and Data Augmentation. ResearchGate 2024. [Google Scholar] [CrossRef]
- Kumar, A.; Coupland, C.A.; Vaz, T.F.; Jones, W.; Valcarce-Dineiro, R.; Calaminus, S.D.J.; Sousa, E. UNet as a deep learning-based method for platelets segmentation in microscopic images. bioRxiv 2024. [Google Scholar] [CrossRef]
- Poschkamp, B.; Bekeschus, S. Convolutional neuronal network for identifying single-cell-platelet-platelet-aggregates in human whole blood using imaging flow cytometry. Cytometry 2024, 105, 356–367. [Google Scholar] [CrossRef]
- Zhou, Y.; Yasumoto, A.; Lei, C.; Huang, C.J.; Kobayashi, H.; Wu, Y.; Yan, S.; Sun, C.W.; Yatomi, Y.; Goda, K. Intelligent classification of platelet aggregates by agonist type. eLife 2020, 9, 52938–52952. [Google Scholar] [CrossRef]
- Zhang, Z.; Chen, P.; McGough, M.; Xing, F.; Wang, C.; Bui, M.; Xie, Y.; Sapkota, M.; Cui, L.; Dhillon, J.; Ahmad, N. Pathologist-level interpretable whole-slide cancer diagnosis with deep learning. Nat. Mach. Intell. 2017, 1, 236–245. [Google Scholar]
- Al-qudah, M.; Suen, C.Y. Enhanced deep learning approach for blood cells platelet classification. Int. J. Pattern Recognit. Artif. Intell. 2021, 35, 2150004. [Google Scholar]
- Ram, S.; Vinoth, S.; Gopalakrishnan, R.N.; Balakumar, A.A.; Kalinathan, L.; Velankanni, T.A.J. Leveraging Diverse CNN Architectures for Medical Image Captioning: DenseNet-121, MobileNetV2, and ResNet50 in ImageCLEF 2024. CLEF Work. Notes 2024, 2024, 1720–1728. [Google Scholar]
- Litjens, G.; Kooi, T.; Bejnordi, B.E.; Setio, A.A.A.; Ciompi, F.; Ghafoorian, M.; Van Der Laak, J.A.; Van Ginneken, B.; Sánchez, C.I. A survey on deep learning in medical image analysis. Med. Image Anal. 2017, 42, 60–88. [Google Scholar] [CrossRef]
- Ker, J.; Wang, L.; Rao, J.; Lim, T. Deep learning applications in medical image analysis. IEEE Access 2017, 6, 9375–9389. [Google Scholar] [CrossRef]
- Singh, R.; Mahajan, A.; Sachan, M.; Kumar, A. Impact of Adam, Adadelta, SGD on CNN for White Blood Cell Classification. In Proceedings of the 2020 IEEE International Symposium on Signal Processing and Information Technology, 2020; pp. 1–6. [Google Scholar]
- Hutter, F.; Kotthoff, L.; Vanschoren, J. Automated Machine Learning: Methods, Systems, Challenges; Springer Nature, 2019. [Google Scholar]
- Durant, T.J.; Olson, E.M.; Schulz, W.L.; Torres, R. Very deep convolutional neural networks for morphologic classification of erythrocytes. Clin. Chem. 2017, 63, 1847–1855. [Google Scholar] [CrossRef]
- Xu, M.; Papageorgiou, D.P.; Abidi, S.Z.; Dao, M.; Zhao, H.; Karniadakis, G.E. A deep convolutional neural network for classification of red blood cells in sickle cell anaemia. PLoS Comput. Biol. 2017, 13, e1005746. [Google Scholar] [CrossRef]
- Devi, S.S.; Singh, N.H.; Devi, K.D. A novel approach to white blood cell classification. In Proceedings of the International Conference on Computing, Communication and Networking Technologies, 2018; pp. 1–6. [Google Scholar]
- Ali-Bagido, R.; Alzahrani, M.; Arif, M. White Blood Cell Types Classification Using Deep Learning Models. IJCSNS Int. J. Comput. Sci. Netw. Secur. 2021, 21, 223–230. [Google Scholar]
- Xia, T.; Jiang, R.; Fu, Y.Q.; Jin, N. Automated Blood Cell Detection and Counting via Deep Learning for Microfluidic Point-of-Care Medical Devices; Lancaster University, 2020. [Google Scholar]
- Naruenatthanaset, K.; Chalidabhongse, T.H.; Palasuwan, D.; Anantrasirichai, N. Red blood cells segmentation using fuzzy c-means and region growing. In Proceedings of the IEEE 3rd Global Conference on Life Sciences and Technologies, 2021; pp. 269–273. [Google Scholar]
- Shorten, C.; Khoshgoftaar, T.M. A survey on Image Data Augmentation for Deep Learning. J. Big Data 2019, 6. [Google Scholar] [CrossRef]
- Taylor, L.; Nitschke, G. Improving deep learning with generic data augmentation. In Proceedings of the 2018 IEEE Symposium Series on Computational Intelligence, 2018; pp. 1542–1547. [Google Scholar]
- Tellez, D.; Litjens, G.; Bándi, P.; Bulten, W.; Bokhorst, J.M.; Ciompi, F.; Van Der Laak, J. Quantifying the effects of data augmentation and stain colour normalisation in convolutional neural networks for computational pathology. Med. Image Anal. 2019, 58, 101544. [Google Scholar] [CrossRef]
- Frid-Adar, M.; Diamant, I.; Klang, E.; Amitai, M.; Goldberger, J.; Greenspan, H. GAN-based synthetic medical image augmentation for increased CNN performance in liver lesion classification. Neurocomputing 2018, 321, 321–331. [Google Scholar] [CrossRef]
- Buda, M.; Maki, A.; Mazurowski, M.A. A systematic study of the class imbalance problem in convolutional neural networks. Neural Netw. 2018, 106, 249–259. [Google Scholar] [CrossRef]
- Japkowicz, N.; Stephen, S. The class imbalance problem: A systematic study. Intell. Data Anal. 2002, 6, 429–449. [Google Scholar] [CrossRef]
- He, H.; Garcia, E.A. Learning from imbalanced data. IEEE Trans. Knowl. Data Eng. 2009, 21, 1263–1284. [Google Scholar] [CrossRef]
- Johnson, J.M.; Khoshgoftaar, T.M. Survey on deep learning with class imbalance. J. Big Data 2019, 6, 1–54. [Google Scholar] [CrossRef]
- Simonyan, K.; Zisserman, A. Very Deep Convolutional Networks for Large-Scale Image Recognition. International Conference on Learning Representations, 2015; pp. 1–14. [Google Scholar]
- He, K.; Zhang, X.; Ren, S.; Sun, J. Deep Residual Learning for Image Recognition. In Proceedings of the IEEE Conference on Computer Vision and Pattern Recognition, 2016; pp. 770–778. [Google Scholar]
- Szegedy, C.; Vanhoucke, V.; Ioffe, S.; Shlens, J.; Wojna, Z. Rethinking the Inception Architecture for Computer Vision. In Proceedings of the IEEE Conference on Computer Vision and Pattern Recognition, 2016; pp. 2818–2826. [Google Scholar]
- Huang, G.; Liu, Z.; Van Der Maaten, L.; Weinberger, K.Q. Densely Connected Convolutional Networks. In Proceedings of the IEEE Conference on Computer Vision and Pattern Recognition, 2017; pp. 4700–4708. [Google Scholar]
- Chollet, F. Xception: Deep Learning with Depthwise Separable Convolutions. In Proceedings of the IEEE Conference on Computer Vision and Pattern Recognition, 2017; pp. 1251–1258. [Google Scholar]
- Sandler, M.; Howard, A.; Zhu, M.; Zhmoginov, A.; Chen, L.C. MobileNetV2: Inverted Residuals and Linear Bottlenecks. In Proceedings of the IEEE Conference on Computer Vision and Pattern Recognition, 2018; pp. 4510–4520. [Google Scholar]
- Tan, M.; Le, Q. EfficientNet: Rethinking Model Scaling for Convolutional Neural Networks. International Conference on Machine Learning, 2019; pp. 6105–6114. [Google Scholar]
- Kornblith, S.; Shlens, J.; Le, Q.V. Do better ImageNet models transfer better? In Proceedings of the IEEE/CVF Conference on Computer Vision and Pattern Recognition, 2019; pp. 2661–2671. [Google Scholar]
- Yosinski, J.; Clune, J.; Bengio, Y.; Lipson, H. How transferable are features in deep neural networks? Adv. Neural Inf. Process. Syst. 2014, 27. [Google Scholar]
- Soleimani, M.; Ismail, N.A.; Talib, M.A. Frozen or Fine-tuned? Analysing Deep Learning Models and Training Strategies for Optimising Big Five Personality Traits Prediction from Text. Comput. Methods Programs Biomed. 2023, 233, 107472. [Google Scholar]
- Hegde, R.B.; Prasad, K.; Hebbar, H.; Singh, B.M.K. Development of a robust algorithm for detection of nuclei and classification of white blood cells in peripheral blood smear images. J. Med. Syst. 2018, 42, 1–8. [Google Scholar] [CrossRef]
- Wong, A.; Anantrasirichai, N.; Chalidabhongse, T.H.; Palasuwanc, D.; Palasuwand, A.; Bull, D. Analysis of Vision-based Abnormal Red Blood Cell Classification. ResearchGate 2021. [Google Scholar] [CrossRef]
- Szegedy, C.; Ioffe, S.; Vanhoucke, V.; Alemi, A. Inception-v4, Inception-ResNet and the Impact of Residual Connections on Learning. arXiv. 2016. Available online: http://arxiv.org/abs/1602.0726</u>1.
- Khened, M.; Kollerathu, V.A.; Krishnamurthi, G. Fully convolutional multi-scale residual DenseNets for cardiac segmentation and automated cardiac diagnosis using ensemble of classifiers. Med. Image Anal. 2019, 51, 21–45. [Google Scholar] [CrossRef]
- Pizer, S.M.; Johnston, R.E.; Ericksen, J.P.; Yankaskas, B.C.; Muller, K.E. Contrast-Limited Adaptive Histogram Equalization: Speed and Effectiveness. In Proceedings of the First Conference on Visualization in Biomedical Computing, 1990. [Google Scholar]
- Guo, Y.; Shi, H.; Kumar, A.; Grauman, K.; Rosing, T.; Feris, R. SpotTune: Transfer Learning through Adaptive Fine-tuning. arXiv 2018. [Google Scholar] [CrossRef]
- Wilimitis, D.; Walsh, C.G. Practical Considerations and Applied Examples of Cross-Validation for Model Development and Evaluation in Health Care: Tutorial. JMIR AI 2023, 2. [Google Scholar] [CrossRef]
- Kohavi, R. A Study of Cross-Validation and Bootstrap for Accuracy Estimation and Model Selection. In Proceedings of the 14th International Joint Conference on Artificial Intelligence, 1995. [Google Scholar]
- Perez, L.; Wang, J. The Effectiveness of Data Augmentation in Image Classification using Deep Learning. arXiv. 2017. Available online: http://arxiv.org/abs/1712.0462</u>1.
- Yang, S.; Xiao, W.; Zhang, M.; Guo, S.; Zhao, J.; Shen, F. Image Data Augmentation for Deep Learning: A Survey. arXiv. 2023. Available online: http://arxiv.org/abs/2204.0861</u>0.
- Yoon, I.; Han, J.H.; Jeon, H.J. Advances in Platelet-Dysfunction Diagnostic Technologies. Biomolecules 2024. [Google Scholar] [CrossRef]
Figure 1.
Figure 1. Platelets microscopic images showing (a.) control (untreated platelets) (b.) zinc - treated (c.) milrinone - treated (d.) zinc and milrinone - treated.
Figure 1.
Figure 1. Platelets microscopic images showing (a.) control (untreated platelets) (b.) zinc - treated (c.) milrinone - treated (d.) zinc and milrinone - treated.
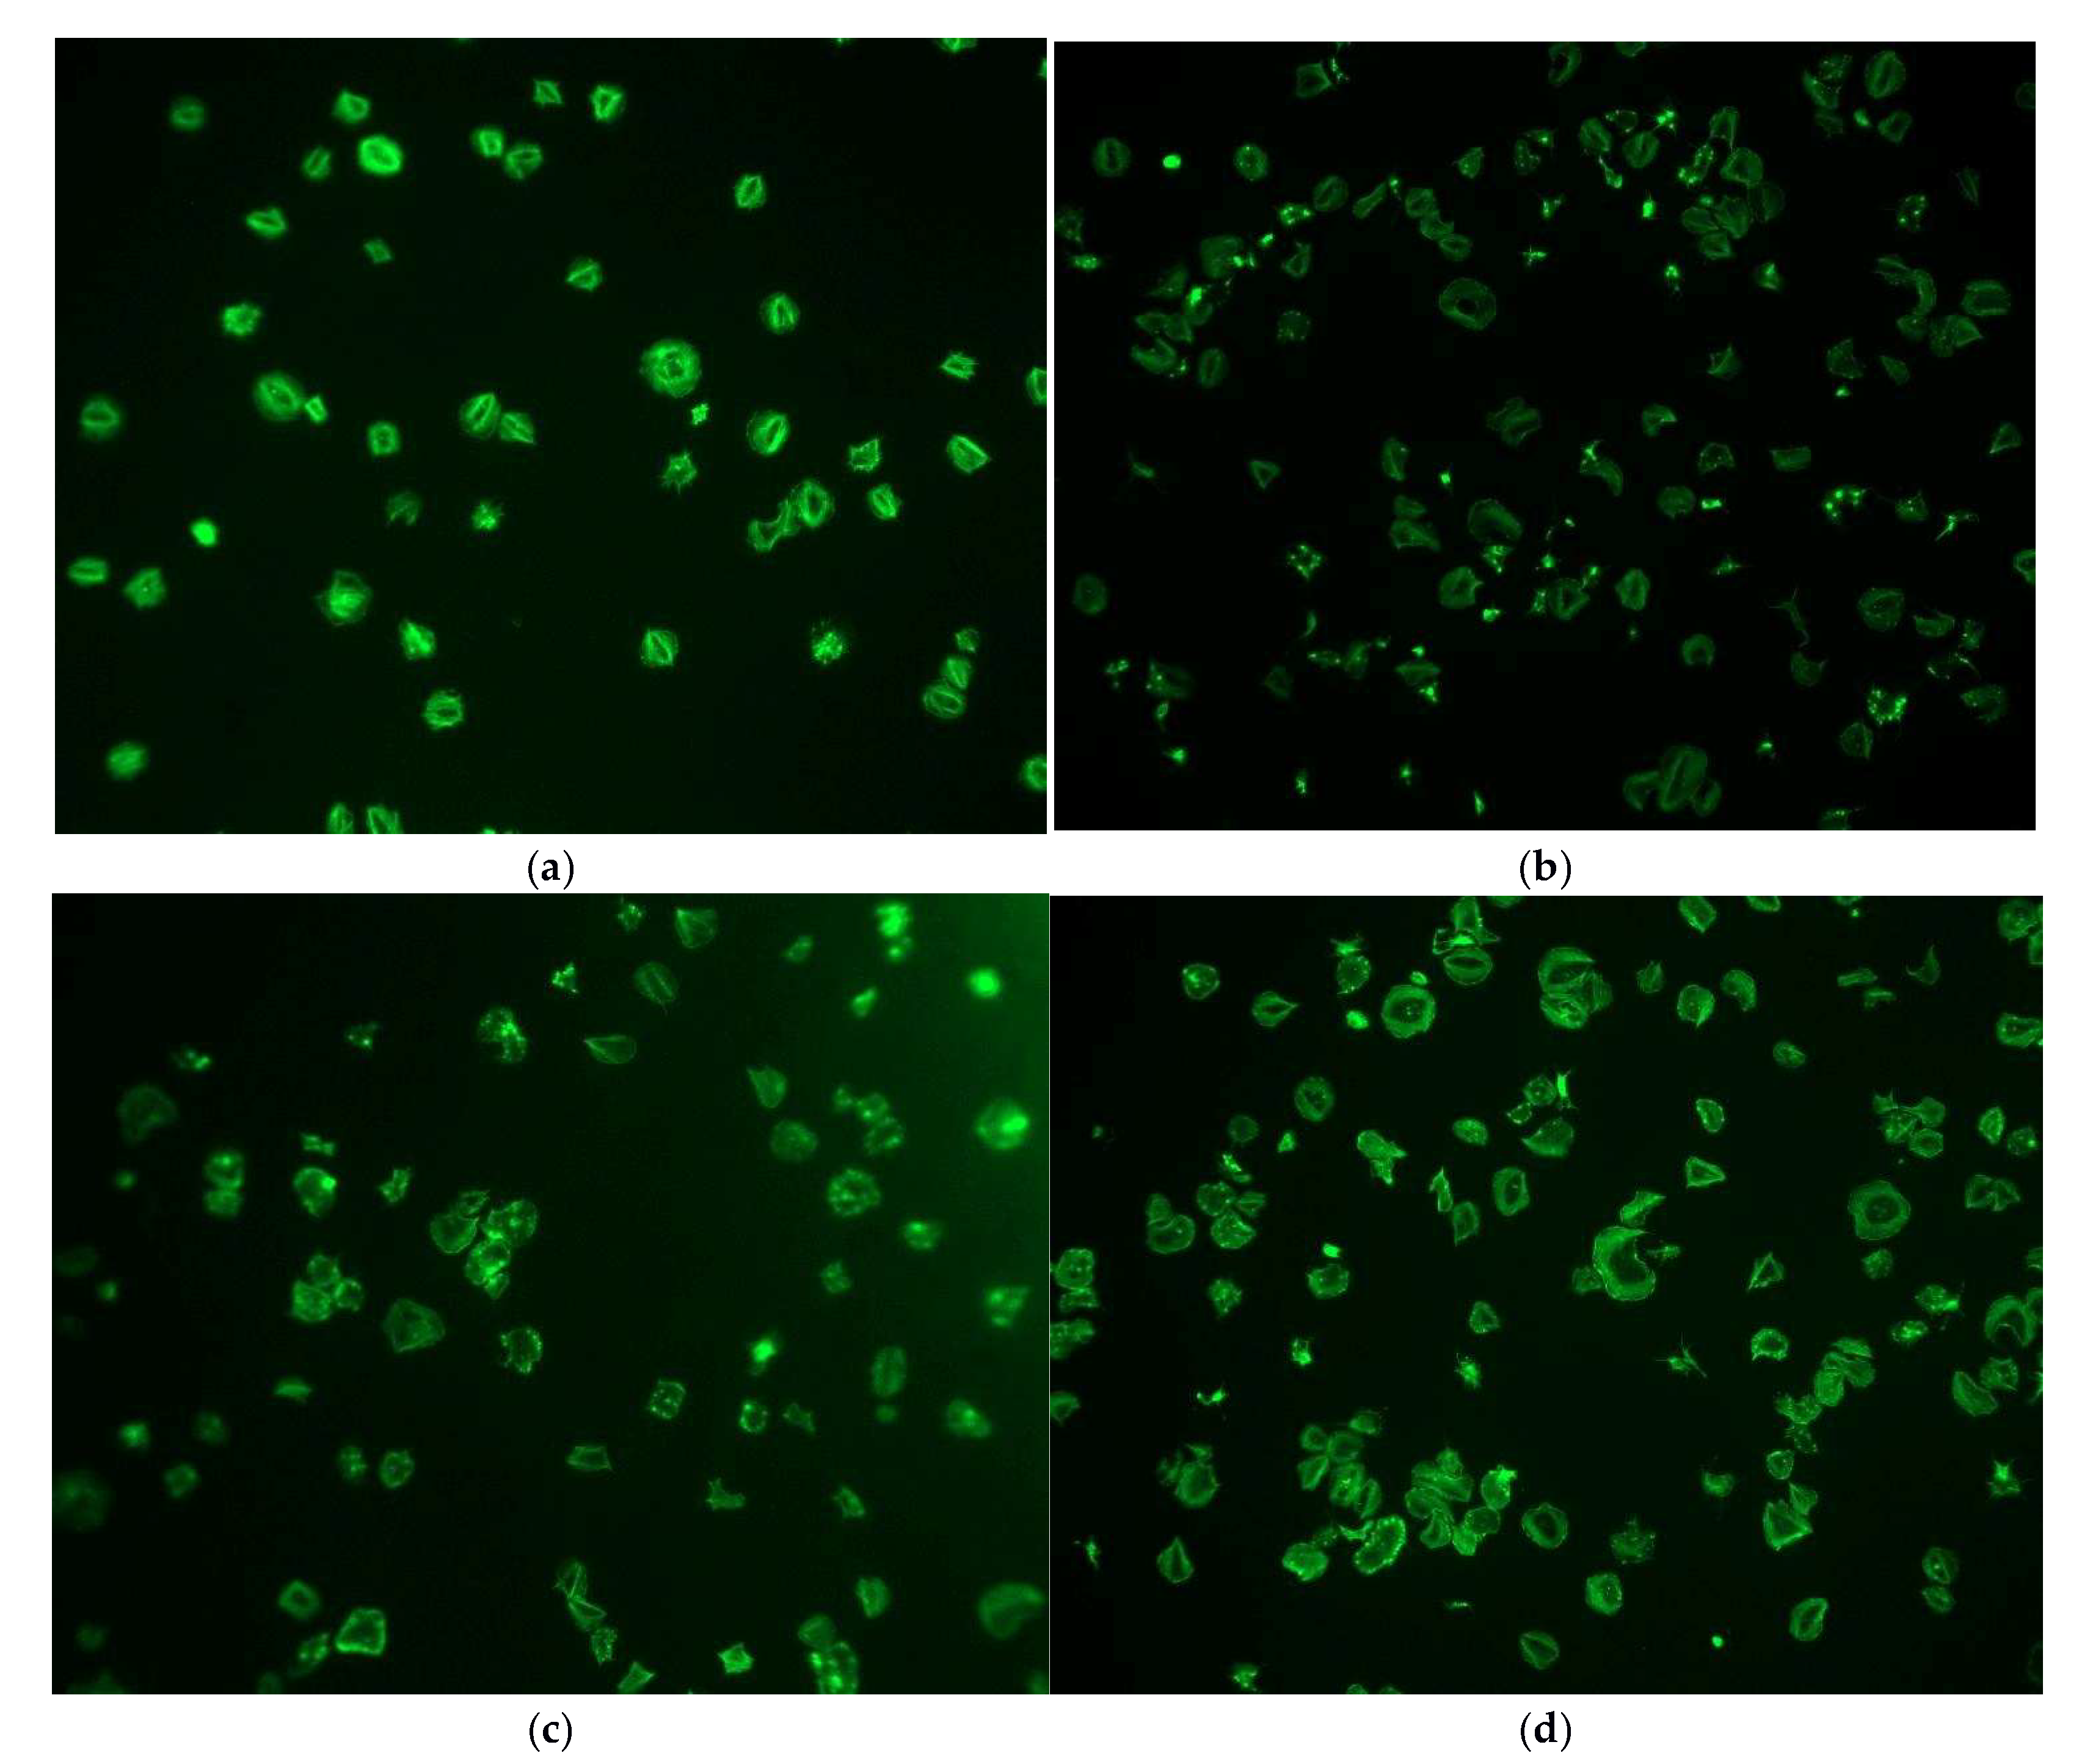
Figure 2.
Schematic presentation of the models applied for the binary classification task.
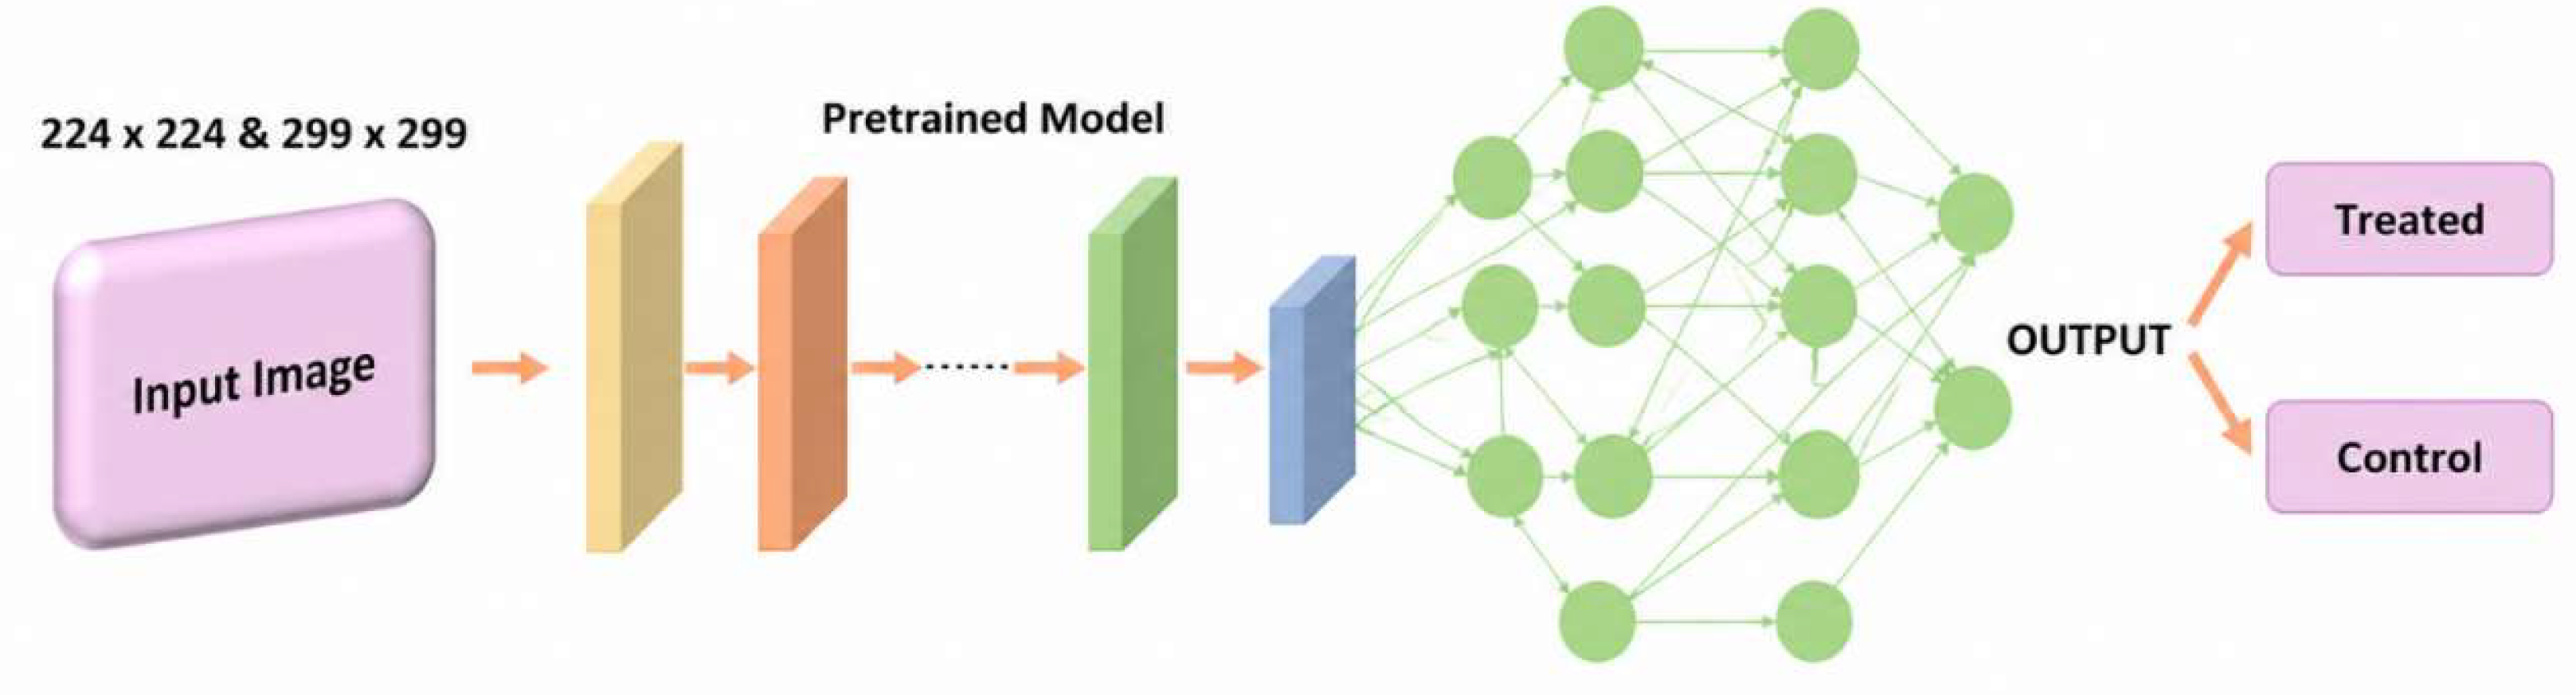
Figure 3.
Schematic presentation of the models applied for the multiclass classification task.
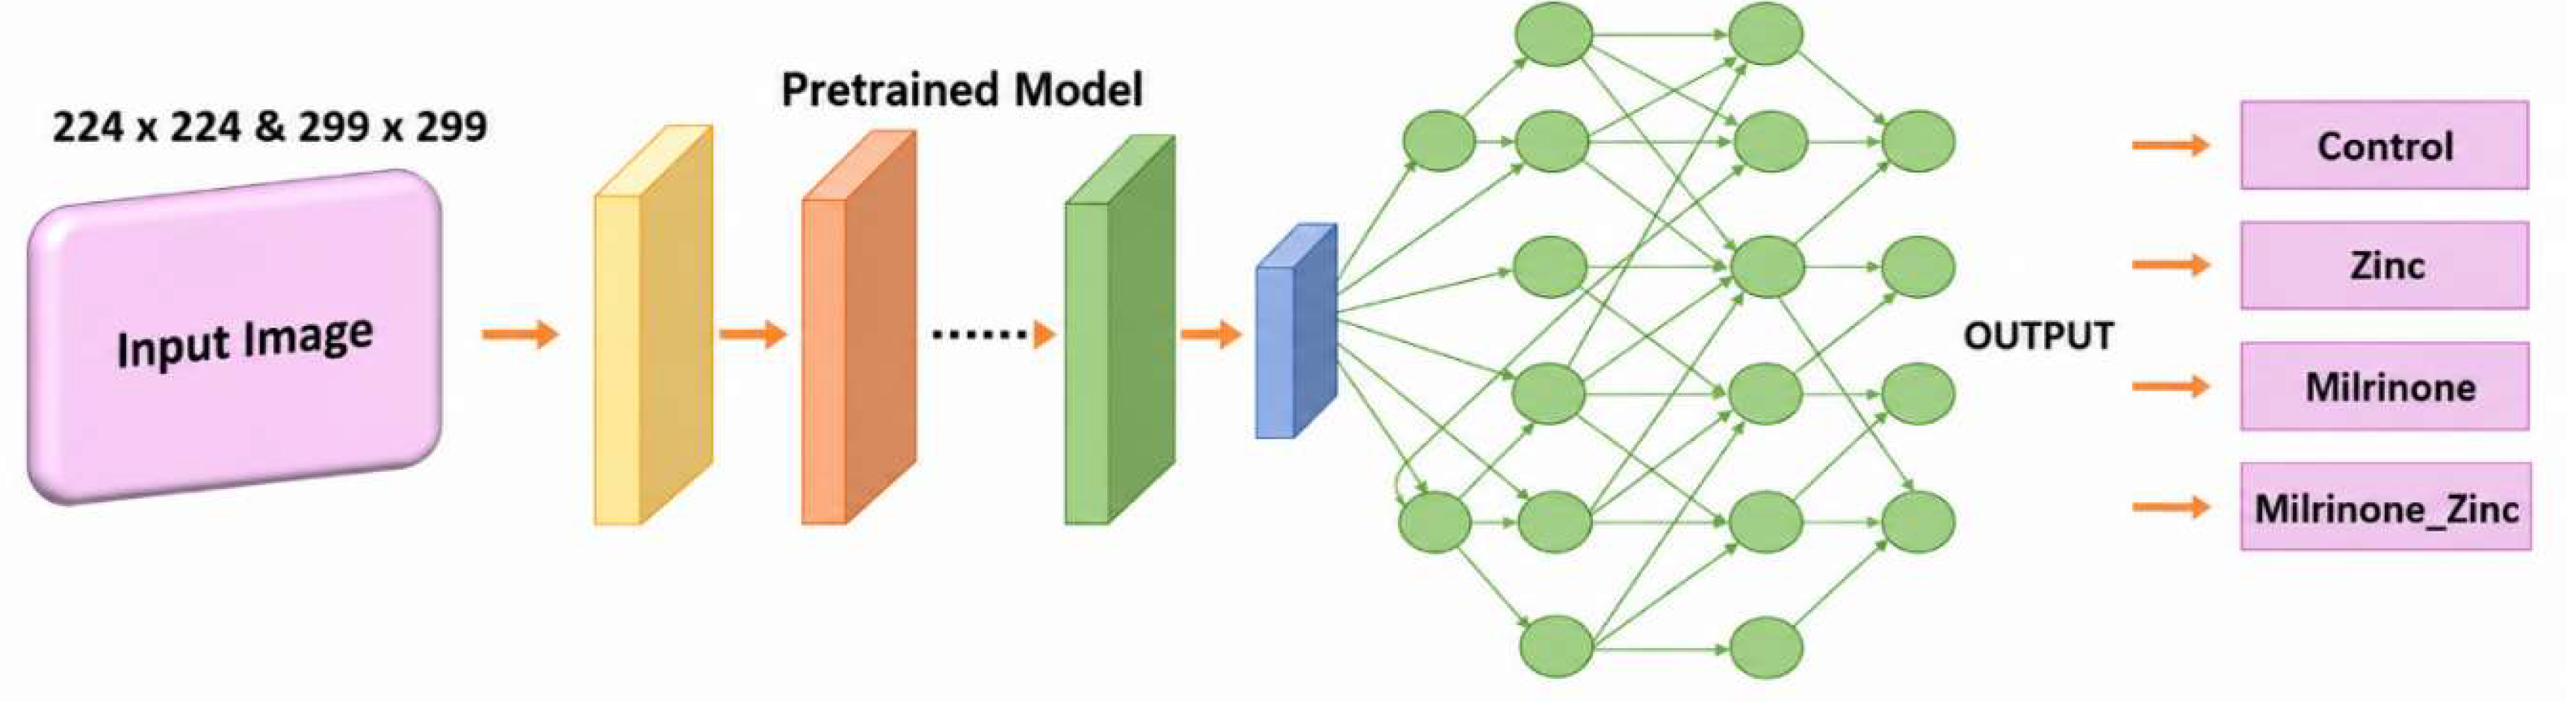
Figure 4.
a) Confusion matrix for Xception with single-class prediction bias and b) Confusion matrix for Xception with discriminative capacity.
Figure 4.
a) Confusion matrix for Xception with single-class prediction bias and b) Confusion matrix for Xception with discriminative capacity.
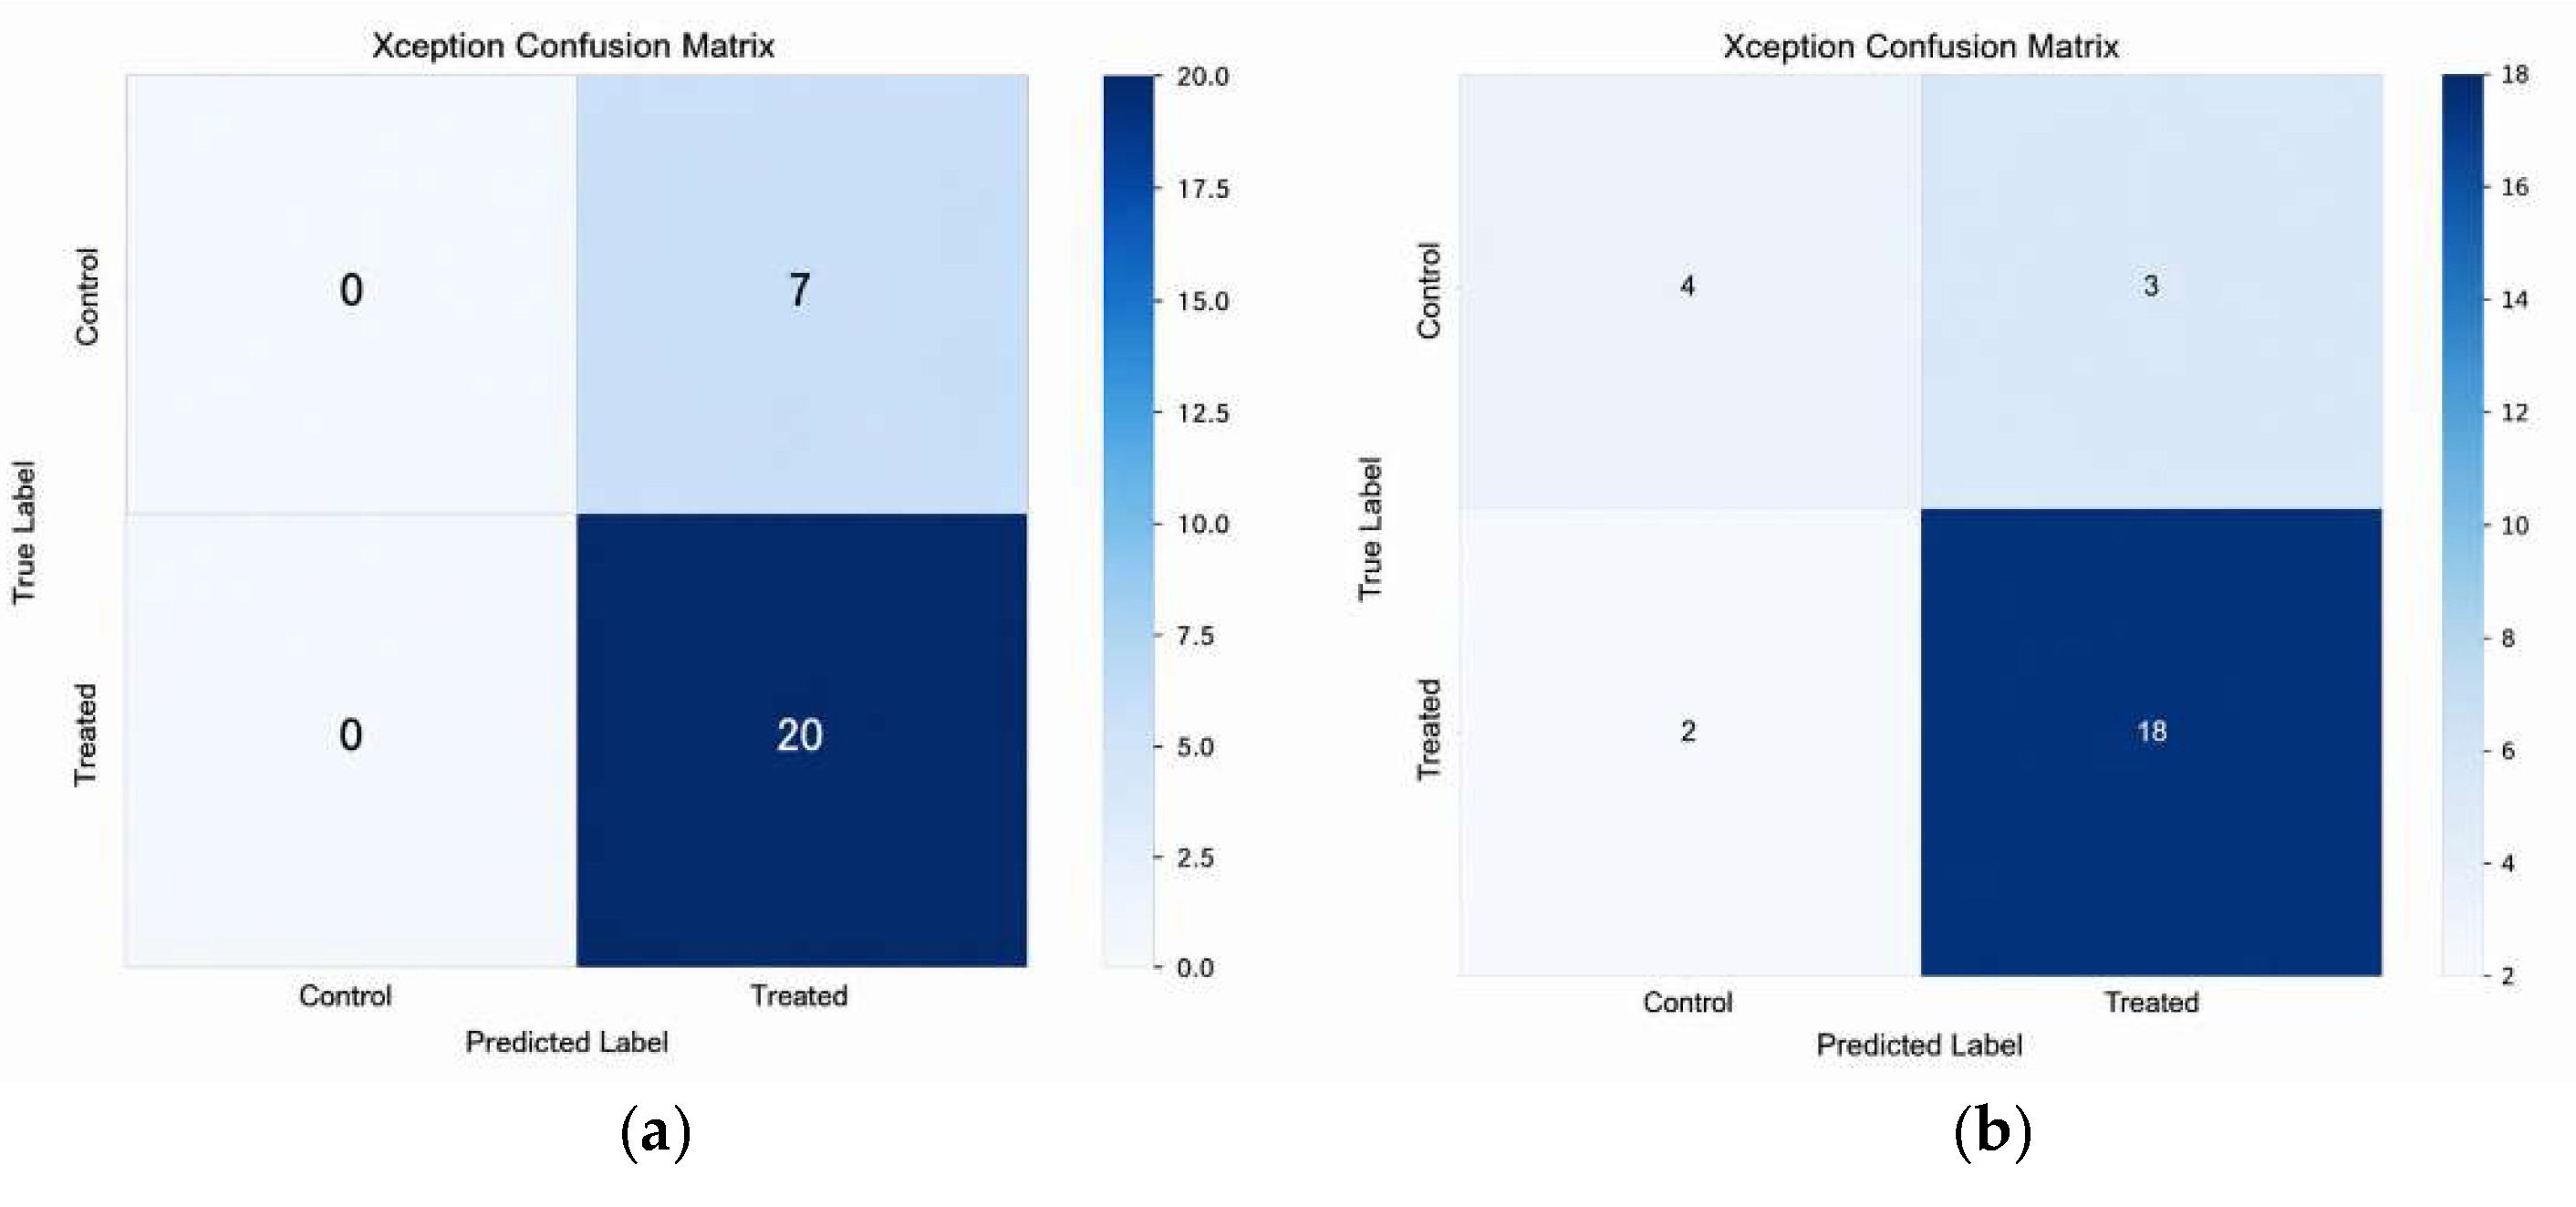

Table 1.
Training criteria of all model training iterations for binary and multiclass classification.
Table 1.
Training criteria of all model training iterations for binary and multiclass classification.
| Iteration | Image loading | Optimiser | Learning rate | L2 Regularisation (Strength) | Dense Dropout rate | Batch size | Epochs | Normalisation | Augmentation (per class) | Class Weight | Batch Normalisation | Cross Validation |
Unfreeze layer | Focal Loss | Optimal Threshold | CLAHE | |
|---|---|---|---|---|---|---|---|---|---|---|---|---|---|---|---|---|---|
| 1 | 224 * 224 | Adam | 0.0001 | No | 0.3 | 32 | 50 | [0, 1] | No | No | No | No | No | No | No | No | |
| 2 | 224 * 224 | Adam | 0.0001 | No | 0.3 | 32 | 50 | [0, 1] | No | Yes | No | No | No | No | No | No | |
| 3 | 224 * 224 | Adam | 0.0001 | No | 0.3 | 32 | 50 | [0,1] | 150 | Yes | No | No | No | No | No | No | |
| 4 | 224 * 224 | Adam | 0.0001 | No | 0.3 | 32 | 50 | [0,1] | 200 | Yes | No | No | No | No | No | No | |
| 5 | 224 * 224 | Adam | 0.0001 | No | 0.3 | 32 | 50 | [0,1] | 500 | Yes | No | No | No | No | No | No | |
| 6 | 224 * 224 | Adam | 0.0001 | No | 0.3 | 32 | 50 | [0,1] | 1000 | Yes | No | No | No | No | No | No | |
| 7 | 224 * 224 | Adam | 0.0001 | 0.001 | 0.5 | 32 | 50 | [0,1] | No | Yes | Yes | No | No | No | No | No | |
| 8 | 224 * 224 | Adam | 0.0001 | 0.001 | 0.5 | 32 | 50 | [0,1] | 150 | Yes | Yes | No | No | No | No | No | |
| 9 | 224 * 224 | Adam | 0.0001 | 0.001 | 0.5 | 32 | 50 | [0,1] | 200 | Yes | Yes | No | No | No | No | No | |
| 10 | 224 * 224 | Adam | 0.0001 | 0.001 | 0.5 | 32 | 50 | [0,1] | 500 | Yes | Yes | No | No | No | No | No | |
| 11 | 224 * 224 | Adam | 0.0001 | 0.001 | 0.5 | 32 | 50 | [0,1] | 1000 | Yes | Yes | No | No | No | No | No | |
| 12 | 224 * 224 | Adam | 0.0005 | 0.001 | 0.5 | 16 | 50 | [-1, 1] | No | Yes | Yes | 5-fold | 15% | No | No | No | |
| 13 | 224 * 224 | Adam | 0.0005 | 0.001 | 0.5 | 16 | 50 | [-1, 1] | 150 | Yes | Yes | 5-fold | 15% | No | No | No | |
| 14 | 224 * 224 | Adam | 0.0005 | 0.001 | 0.5 | 16 | 50 | [-1, 1] | 500 | Yes | Yes | 5-fold | 15% | No | No | No | |
| 15 | 224 * 224 | Adam | 0.0005 | 0.001 | 0.5/0.4 | 8 | 75 | [-1, 1] | No | Yes | Yes | 5-fold | Architecture specific layer freezing* | Yes | Yes | No | |
| 16 | 224 * 224 / 299 * 299 | Adam | 0.0001/ 0.0002 |
0.1 | 0.6 | 16 | 80 | [-1, 1] | No | Yes | Yes | 5-fold | 20% | No | No | No | |
| 17 | 224 * 224 / 299 * 299 | Adam | 0.0001/ 0.0002 |
0.1 | 0.6 | 16 | 80 | [-1, 1] | 150 | Yes | Yes | 5-fold | 20% | No | No | No | |
| 18 | 224 * 224 / 299 * 299 | Adam | 0.0001/ 0.0002 |
0.1 | 0.6 | 16 | 100 | [-1, 1] | No | Yes | Yes | 5-fold | 30% | No | No | Yes | |
| 19 | 224 * 224 / 299 * 299 | Adam | 0.0001/ 0.0002 |
0.1 | 0.6 | 16 | 100 | [-1, 1] | 150 | Yes | Yes | 5-fold | 30% | Yes | Yes | Yes | |
| 20 | 224 * 224 | Adam | 0.0005 | 0.001 | 0.5 | 16 | 50 | [-1, 1] | No/150 | Yes | Yes | 5-fold | 15% | No | No | No | |
| 21 | 224 *224 | Adam | 0.0005 | 0.001 | 0.5 | 8 | 75 | [-1, 1] | No/150 | Yes | Yes | 5-fold | 15% | Yes | No | No | |
| 22 | 224 *224 | Adam | 0.0005 | 0.001 | 0.5 | 16 | 50 | [-1, 1] | No/150 | Yes | Yes | 5-fold | 15% | No | No | No | |
| 23 | 224 * 224 / 299 * 299 | Adam | 0.001 | 0.001 | 0.5 | 8 | 100 | [-1, 1] | No/150 | Yes | Yes | 5-fold | 15% | Yes | No | No | |
| 24 | 224 * 224 / 299 * 299 | Adam | 0.0001/ 0.0002 |
0.1 | 0.6 | 16 | 100 | [-1, 1] | None | Yes | Yes | 5-fold | 30% | Yes | Yes | Yes | |
| 25 | 224 * 224 / 299 * 299 | Adam | 0.0001/ 0.0002 |
0.1 | 0.6 | 16 | 100 | [-1, 1] | None | Yes | Yes | 5-fold | 30% | Yes | No | Yes | |
*The proportion of layers unfrozen for fine-tuning has been adjusted based on each architecture’s total depth, rather than using a fixed number of layers across all models.
Table 2.
Evaluation metrics for iteration 1 showing all pretrained models for binary classification.
Table 2.
Evaluation metrics for iteration 1 showing all pretrained models for binary classification.
| ITERATION 1 = ORIGINAL ARCHITECTURE | ||||
|---|---|---|---|---|
| Model | Accuracy | Precision | Recall | F1 Score |
| BINARY CLASSIFICATION | ||||
| Inception V3 | 0.7407 | 0.3704 | 0.5000 | 0.4255 |
| DenseNet 201 | 0.7407 | 0.3704 | 0.5000 | 0.4255 |
| MobileNet V2 | 0.7407 | 0.3704 | 0.5000 | 0.4255 |
| ResNet 50 | 0.7407 | 0.3704 | 0.5000 | 0.4255 |
| ResNet 101 | 0.7407 | 0.3704 | 0.5000 | 0.4255 |
| Xception | 0.7407 | 0.3704 | 0.5000 | 0.4255 |
| InceptionResNet V2 | 0.7407 | 0.3704 | 0.5000 | 0.4255 |
| EfficientNet B0 | 0.7407 | 0.3704 | 0.5000 | 0.4255 |
| VGG16 | 0.7407 | 0.3704 | 0.5000 | 0.4255 |
| VGG19 | 0.7407 | 0.3704 | 0.5000 | 0.4255 |
Table 3.
Evaluation metrics for iteration 7 showing all pretrained models for binary classification.
Table 3.
Evaluation metrics for iteration 7 showing all pretrained models for binary classification.
| Model | Accuracy | Precision | Recall | F1 Score |
|---|---|---|---|---|
| ITERATION 7 | ||||
| BINARY CLASSIFICATION | ||||
| Inception V3 | 0.7407 | 0.3704 | 0.5000 | 0.4255 |
| DenseNet 201 | 0.7778 | 0.8846 | 0.5714 | 0.5598 |
| MobileNet V2 | 0.4444 | 0.4533 | 0.4393 | 0.4156 |
| ResNet 50 | 0.7407 | 0.3704 | 0.5000 | 0.4255 |
| ResNet 101 | 0.7407 | 0.3704 | 0.5000 | 0.4255 |
| Xception | 0.8148 | 0.7619 | 0.7357 | 0.7467 |
| Inception-ResNet V2 | 0.7407 | 0.3704 | 0.5000 | 0.4255 |
| EfficientNet B0 | 0.7407 | 0.3704 | 0.5000 | 0.4255 |
| VGG16 | 0.7407 | 0.3704 | 0.5000 | 0.4255 |
| VGG19 | 0.7407 | 0.3704 | 0.5000 | 0.4255 |
Table 4.
Evaluation metrics for iteration 19 showing the best performing models for binary classification.
Table 4.
Evaluation metrics for iteration 19 showing the best performing models for binary classification.
| Model | Accuracy | Precision | Recall | F1 Score |
|---|---|---|---|---|
| ITERATION 19 = ITERATION 18 + FOCAL LOSS + ADAPTIVE THRESHOLD (for Binary classification) + AUGMENTATION (with new parameter values) | ||||
| BINARY CLASSIFICATION | ||||
| Inception V3 | 0.8635 | 0.8946 | 0.7355 | 0.7557 |
| DenseNet 201 | 0.8862 | 0.8859 | 0.8323 | 0.8178 |
| Xception | 0.9148 | 0.9059 | 0.8732 | 0.8806 |
| VGG16 | 0.8071 | 0.6818 | 0.6185 | 0.6080 |
Table 5.
Evaluation metrics for iteration 16 showing focused pretrained models for multiclass classification.
Table 5.
Evaluation metrics for iteration 16 showing focused pretrained models for multiclass classification.
| Model | Accuracy | Precision | Recall | F1 Score |
|---|---|---|---|---|
| ITERATION 16 = CUSTOM MODEL IMAGE LOADING + CROSS VALIDATION + UNFREEZE 20% + OPTIMAL LR | ||||
| MULTICLASS CLASSIFICATION | ||||
| Inception V3 | 0.6990 | 0.7243 | 0.6978 | 0.6906 |
| DenseNet 201 | 0.5905 | 0.6152 | 0.5926 | 0.5882 |
| Xception | 0.7216 | 0.7581 | 0.7199 | 0.7130 |
| VGG16 | 0.6249 | 0.6967 | 0.6303 | 0.6177 |
Table 6.
Evaluation metrics for iteration 18 showing focused pretrained models for multiclass classification.
Table 6.
Evaluation metrics for iteration 18 showing focused pretrained models for multiclass classification.
| Model | Accuracy | Precision | Recall | F1 Score |
|---|---|---|---|---|
| ITERATION 18 = CUSTOM MODEL IMAGE LOADING + CLAHE + CROSS VALIDATION + UNFREEZE 30% + OPTIMAL LR | ||||
| MULTICLASS CLASSIFICATION | ||||
| Inception V3 | 0.7216 | 0.7543 | 0.7238 | 0.7187 |
| DenseNet 201 | 0.6703 | 0.6882 | 0.6681 | 0.6616 |
| Xception | 0.6476 | 0.7167 | 0.6472 | 0.6444 |
| VGG16 | 0.4900 | 0.4166 | 0.4821 | 0.4021 |
Disclaimer/Publisher’s Note: The statements, opinions and data contained in all publications are solely those of the individual author(s) and contributor(s) and not of MDPI and/or the editor(s). MDPI and/or the editor(s) disclaim responsibility for any injury to people or property resulting from any ideas, methods, instructions or products referred to in the content. |
© 2026 by the authors. Licensee MDPI, Basel, Switzerland. This article is an open access article distributed under the terms and conditions of the Creative Commons Attribution (CC BY) license (http://creativecommons.org/licenses/by/4.0/).
Copyright: This open access article is published under a Creative Commons CC BY 4.0 license, which permit the free download, distribution, and reuse, provided that the author and preprint are cited in any reuse.