

Submitted:
02 September 2026
Posted:
03 September 2026
You are already at the latest version
Abstract
Patient-specific dressings for diabetic foot ulcers (DFUs) must follow the individual lesion, yet pub- lished image-to-fabrication pipelines rely on depth sensing and seldom report the accuracy of the fabricated object. We present IMTOP, a low-cost pipeline that turns a single calibrated RGB photograph into a printable patient-specific patch, with a validation framework centred on the patch itself. Abso- lute scale is recovered from two operator-placed points on a reference of known length; the wound contour is offset by a perilesional margin and extruded to a watertight STL solid. The patch error is decomposed into segmentation, scale and printing terms, measured on 149 public clinical DFU images (uncalibrated, in pixel units) with three segmenters and on 18 printed phantoms of known geometry, the scale term coming from a Monte Carlo simulation of calibration-point placement. By mean magnitude segmentation was the largest term (6.4% for the Segment Anything Model, against 5.0% for scale at an assumed 3 px placement noise and 0.69% for printing; combined 8.1%), whereas by variance scale prevailed for two of three segmenters; phantoms were reconstructed to 0.32% area error, pointing to wound-border ambiguity as the main clinical error source. Mask overlap correlated with, but did not determine, the patch error, and the residual under-coverage sized a segmenter-specific perilesional offset covering the wound in 95% of the evaluated cases.
Keywords:
diabetic foot ulcer
; patient-specific wound dressing
; image segmentation
; Segment Anything Model
; additive manufacturing
; error budget
; uncertainty propagation
; decision support
1. Introduction
Chronic skin wounds, and diabetic foot ulcers (DFUs) in particular, are a growing clinical and economic burden [1]. The lifetime incidence of a foot ulcer in people with diabetes is high, and its consequences are severe, including lower-limb amputation and a post-ulceration mortality comparable to that of several common cancers [2,3]. A recurring cause of poor healing is non-personalized treatment: standardized protocols and pre-shaped dressings ignore wound-specific features such as contour, area and local tissue condition [1], and pre-shaped dressings conform poorly to irregular morphologies even though close contact with the wound bed is considered important for efficacy [4].
This has motivated personalized wound care. Hydrogel dressings are widely used because they keep the wound moist, a condition that accelerates epithelialization [5], while absorbing exudate, allowing gas exchange and releasing therapeutics locally [6]. To match the dressing to the individual lesion, additive manufacturing has been used to fabricate patient-specific shapes, from 3D-scanned antimicrobial patches to printed functional hydrogels [4,7,8]. The geometric step, turning a clinical image of the wound into a fabricable object, has so far relied mainly on RGB-D pipelines that acquire depth and reconstruct a three-dimensional model before generating printable instructions [9]. Two limitations follow: (i) Such pipelines raise the hardware requirement and are ill-suited to point-of-care acquisition, where only a consumer camera may be available [9]; (ii) accuracy is usually reported on the segmentation mask with region-overlap metrics, as throughout the wound-segmentation literature [10,11], not on the object that is finally fabricated, a gap shared with other patient-specific printed devices, such as surgical guides, whose fabricated geometry is rarely validated against the CAD model [12].
Diabetic foot ulcers range from superficial partial- or full-thickness lesions to deep wounds that reach tendon or bone [13]. This work targets the superficial class treated with conformal dressings, for which a patch that reproduces the wound contour and carries a parametric thickness is a reasonable design choice; deep or undermined wounds fall outside its scope. For this class we argue that a single RGB photograph is geometrically sufficient: absolute scale is recovered from a physical reference in the field of view, as in image-based wound planimetry [14], with no depth sensor and no reconstruction of the wound-bed topography. The contribution of such a low-cost, depth-free pipeline is not the patch itself, which is a simple geometric transformation, but the characterization of how the upstream errors reach the fabricated object and the conversion of that characterization into a design rule. Manufacturing metrology routinely decomposes the deviation of a produced part into contributions from successive process stages and recombines them into an error budget, following the Guide to the Expression of Uncertainty in Measurement (GUM) [15] and the dimensional-tolerance studies of additive manufacturing [16]; to our knowledge this perspective has not been applied to image-to-print wound dressings.
We organize the study around three research questions:
- RQ1
- How does the fabricated-patch error distribute across the segmentation, scale and printing stages, in both magnitude and variance?
- RQ2
- Is mask overlap a sufficient predictor of fabricated-patch accuracy, or are boundary and coverage measures also required?
- RQ3
- Can the residual segmentation uncertainty be turned into a perilesional offset that covers the wound at a target level?
We address them through three contributions:
- a stage-wise error budget that splits the fabricated-patch error into segmentation (), scale () and printing () terms, each measured against a known reference on a dedicated experiment (RQ1);
- a fabrication-aware evaluation that complements region overlap with boundary metrics and with clinically asymmetric coverage metrics, separating under-coverage, which leaves wound exposed, from over-coverage onto healthy skin, which is less harmful but not cost-free (RQ2);
- an uncertainty-driven sizing of the perilesional offset, yielding the margin that covers the wound at a target level, on the evaluated data, for a chosen segmentation back-end (RQ3).
Seen as an intelligent system for complex clinical data, IMTOP is a human-in-the-loop decision-support tool: for every candidate segmentation it presents the operator with overlap, boundary and coverage metrics together with the resulting patch, and it converts the uncertainty of the automatic stage into an actionable design parameter, the perilesional offset, under an explicit and clinically asymmetric cost. The stage-wise error budget is an interpretable attribution of that uncertainty, indicating which stage is responsible for the error of the fabricated object and therefore where an intervention would pay off.
The pipeline, including the interactive application used to produce the manual reference segmentations and the patches, will be released to support reproducibility (Data Availability Statement). The rest of the paper presents related work (Section 2), the system and methods (Section 3), the results (Section 4), a discussion with the study limitations (Section 5) and the conclusions (Section 6).
2. Related Work
As noted in Section 1, additive manufacturing has been used to give engineered dressings a patient-specific shape [4,7,8]; since conformal contact with the wound bed matters for efficacy [4], the geometric fidelity of the patch is itself a design target. In situ bioprinting deposits the biomaterial directly on the wound bed [17,18] and removes the patch altogether, at the cost of dedicated hardware at the bedside; the image-to-print route addressed here instead fabricates the dressing off-line from an image of the wound.
Extracting geometry from a clinical image follows two routes. The first stays on plain RGB: planimetry recovers wound area from a photograph with a physical scale reference [14], mobile apps standardize acquisition on a smartphone [19], deep models segment wound tissue on-device [20], and phone photographs predict ulcer healing [21]; these report area, tissue or prognosis but not a fabricable object. The second reconstructs three-dimensional geometry: robot-mounted RGB-D rigs reconstruct the wound surface [22] and derive measurements [23], Cavazzana et al. add a three-dimensional analysis for objective assessment [24], and Chae et al. [9] reconstruct an RGB-D surface to print bioprintable DFU patches. This route needs a depth sensor or a controlled rig, ill-suited to point-of-care capture, and validates a measurement or surface rather than a fabricated object, including Chae et al. [9], who reach a printable patch but validate the segmentation and the reconstructed surface. IMTOP keeps the depth-free acquisition of the first route while reaching the patch, and is conceived as the fabrication step that can follow an assessment pipeline such as that of Cavazzana et al. [24].
The segmentation feeding these pipelines has a large literature. Classical region methods, Otsu thresholding [25], marker-controlled watershed [26] and GrabCut [27], were superseded by deep learning: fully convolutional networks [28], U-Net [29], applied to DFUs by Goyal et al. [11], to general wounds by Wang et al. [10] and through CNN ensembles [30], with self-configuring nnU-Net [31]; public challenges rank clinician-delineated masks by overlap [32,33]. Promptable foundation models, the Segment Anything Model (SAM) [34], its medical adaptation MedSAM [35] and its successor SAM 2 [36], segment from a box or point prompt without task-specific training. In almost all of this work accuracy is scored on the mask. IMTOP uses three such segmenters only as interchangeable inputs to its geometric chain, the smallest SAM checkpoint being chosen to keep the memory footprint compatible with ordinary hardware, and the two classical methods being retained because they run on a CPU without downloaded weights, which matters at the point of care.
That scoring relies mainly on region overlap, the Dice coefficient [37] and the intersection over union, sometimes complemented by precision and recall or by false-negative and false-positive rates [10,32]. Overlap is an incomplete descriptor: two masks with identical Dice can differ in boundary placement, captured by the Hausdorff distance [38]; and although recall and precision separate missed wound from excess skin, to our knowledge no study has propagated this asymmetry to the fabricated dressing or used it to size the margin. Both limitations become concrete once the mask becomes a physical patch, which motivates boundary and coverage measures and measuring the error on the fabricated object.
On the fabrication side, the deviation of a produced part is routinely split across process stages and recombined into an error budget, following the GUM [15] and experimental studies of dimensional accuracy in fused deposition modelling (FDM) [16,39]; similar metrological protocols address fabricated medical devices such as surgical guides [12]. To our knowledge this perspective has not been applied to image-to-print wound dressings, where the stages are segmentation, scale recovery and printing.
Table 1 places IMTOP among these methods. It propagates the segmentation, scale and printing errors to the fabricated patch, complements overlap with boundary and coverage metrics, and turns the residual segmentation uncertainty into a perilesional offset, thus extending mask-only segmentation studies [10,11,32] and depth-based reconstruction pipelines [9,22,23] toward a depth-free, fabrication-aware route validated on the produced object.
3. Materials and Methods
Figure 1 summarizes the IMTOP pipeline, which turns a single RGB photograph into a printable patch in six stages grouped in three phases. In the acquisition phase the image is loaded and the metric scale s (px/mm) is set from two points placed on a reference of known length. In the segmentation and analysis phase the operator delineates the reference contour, an automatic back-end (SAM, GrabCut or watershed) produces the mask under evaluation, and the two are compared with mask-level, patch-level and coverage metrics. In the output phase the selected contour is offset by the perilesional margin, extruded and finished at the edge into a watertight mesh exported as STL. Each stage is unlocked by a completion event of the previous one. The following subsections describe the geometric and evaluation methods behind these stages (Section 3.1, Section 3.2, Section 3.3, Section 3.4 and Section 3.5), the experiments and the statistical analysis (Section 3.6 and Section 3.7), and the software that implements the pipeline (Section 3.8).
3.1. Metric Scale Calibration from a Physical Reference
Absolute scale is recovered from two points placed by the operator on a reference of known length d visible in the photograph, such as a caliper jaw opening or a ruler segment. Given the pixel coordinates and of the endpoints, the scale factor, in pixels per millimetre, is
and every downstream geometric quantity is expressed in millimetres through s. Because s is the only source of absolute dimension, its uncertainty is isolated and characterized separately (Section 4.3). The formulation needs neither camera intrinsics nor a depth sensor, which makes the method independent of the capture device; its single assumption is that the reference and the wound lie in a common plane approximately parallel to the image plane (a fronto-parallel view), discussed in Section 5.
3.2. From Contour to Printable Patch
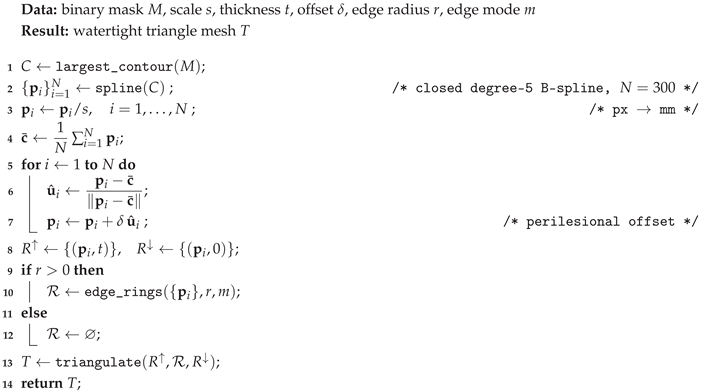
The mask is converted to a printable patch through a deterministic geometric chain (Algorithm 1). The largest external contour is extracted and fitted with a closed periodic B-spline of degree five resampled to points, which removes the pixel staircasing of the raster boundary while preserving the overall shape. The contour is converted to millimetres through s and offset outward, along the radial direction from its centroid, by a perilesional margin that extends the patch over the surrounding healthy skin; is not fixed a priori but derived from the coverage analysis of Section 3.5. The offset contour is extruded to a user-set thickness t (3 mm by default) with a flat top, and the bottom rim is optionally finished with a chamfer or a circular fillet of radius r sampled over rings, with r clamped to the thickness and leaving a square edge. Because the caps and the lateral wall share their boundary vertices, the mesh is watertight (closed and manifold, without holes), as required for STL export and slicing, and its volume follows from the divergence theorem,
with the oriented triangular faces and the vertices of face f. The patch is therefore a planar solid of parametric thickness with a finished edge: conformability to the wound bed is delegated to the flexibility of the thin dressing rather than to a built-in curvature, and the wound-bed topography is not reconstructed, a scope limit stated in Section 5. For the manual reference, steps 1 and 2 of Algorithm 1 are replaced by a closed cubic interpolating spline through the operator control points (Section 3.3); the remaining steps are identical, so the two patches are built by the same operator and are directly comparable.
| Algorithm 1: Mask-to-patch geometric chain. |
 |
3.3. Segmentation Back-Ends and Reference
The automatic stage offers three interchangeable back-ends, a promptable foundation model and two classical region methods, so the geometric pipeline can be exercised independently of any single segmenter. For a fair comparison the three are seeded from the same manual reference, isolating the boundary-refinement behaviour of each under a common initialization rather than its ability to localize the wound unaided. When no manual delineation is available, a reference-free prompt is derived automatically by Otsu thresholding [25], a border-based polarity check and selection of the largest interior connected component while discarding border-touching blobs, so the tool also runs without an operator; this reference-free mode was not evaluated in the present study.
The reference is delineated by an operator who places a variable number of control points, depending on the wound complexity, interpolated by a closed periodic cubic interpolating spline resampled to points, then rasterized by polygon filling. This is the same sample count and resampling as the automatic contour, so manual and automatic masks pass through the identical operator of Algorithm 1. The delineation was performed by a single operator, a point revisited in Section 5.
The first back-end, and the default one, is SAM with the ViT-B image encoder [34], prompted with the axis-aligned bounding box of the reference contour and a single positive point placed at the maximum of the distance transform rather than at the centroid, since for concave contours the centroid can fall outside the mask whereas the distance-transform maximum is interior by construction; multiple-mask output is disabled. The second is GrabCut [27], initialized with probable foreground inside the reference region, certain foreground on a core eroded by two iterations and certain background outside a band dilated by two iterations, run for five iterations and restricted to the dilated band. The third is the marker-controlled watershed of Meyer [26], with the eroded core as foreground markers and the region outside a dilated band as background, the intervening band resolved by flooding. In all cases the morphological radius of the erosion and dilation is tied to the image size, px with the image size in pixels, and the raw output is cleaned by an opening and closing with an elliptical kernel of size px forced odd, followed by retention of the largest connected component, before entering the geometric chain.
3.4. Evaluation Metrics
The manual and automatic results are compared at two levels, mask agreement and clinical coverage. Areas and distances are expressed in millimetres through s where a physical reference is available; the clinical images carry no such reference, so s is undefined there and the clinical metrics (Table 2, including the Hausdorff distance) are reported in pixels, while millimetre quantities are reported only for the calibrated phantom experiments. Let G and S be the reference and automatic masks, with boundaries , and the pixel count. Region overlap is summarized by the Dice coefficient [37] and the intersection over union (IoU), a monotone transform of Dice reported for comparability with the literature,
Size agreement is the relative area error on the calibrated areas,
The worst-case boundary deviation is the symmetric Hausdorff distance [38], built from the directed distance ,
Finally, because the dressing must cover the wound, the disagreement is split into the clinically unsafe under-coverage (wound left exposed) and the conservative over-coverage (excess on healthy skin), with coverage fraction c,
as illustrated in Figure 2d. In the results and are reported relative to the reference area, and , so that ; c coincides with the recall (sensitivity) of S with respect to G. For the uncalibrated clinical images px/px in Equations (5)–(11), so the patch area error, a ratio, is scale-free and Algorithm 2 runs unchanged. Overlap alone is an incomplete predictor of geometric fidelity, since two masks with equal Dice can differ markedly in boundary deviation, and hence in the fabricated patch (Figure 2b,c); overlap and boundary measures are therefore reported jointly and their relationship to the patch error is examined in Section 4.4. The released tool also reports shape descriptors and further boundary measures (perimeter error and average symmetric surface distance), omitted here for compactness.
3.5. Error Budget and Offset Sizing
The fabricated-patch error is decomposed into three terms, each measured against a known reference at its stage: (i) a segmentation term (relative patch-area error of the automatic mask against the reference at fixed scale), (ii) a scale term (relative area error from calibration-point placement, Section 4.3) and (iii) a printing term (relative in-plane area error of the part against its STL, Section 4.2). The segmentation term is computed on the outlier-removed clinical set of Table 2, so that the budget and the per-back-end accuracy are reported on the same data. Assuming the three terms to be independent, they are combined in quadrature (root sum of squares),
The three terms are obtained from separate, dedicated experiments, each against its own reference, rather than from a single wound carried through the whole pipeline, in keeping with the GUM, which evaluates the uncertainty of each input quantity separately and combines the components through the law of propagation of uncertainty, reduced to a sum in quadrature for uncorrelated inputs (clauses 4 and 5.1 of [15]).
A real wound has no physical ground-truth patch, so the manual reference is taken as the proxy ground truth and quantifies agreement with that delineation rather than with the true wound boundary. In the per-image patch-area error the scale cancels, because the reference and automatic patches are built with the same s (Algorithm 2); therefore measures the automatic-versus-reference shape discrepancy at a fixed, assumed scale, the absolute-scale error of the calibration, and the part-versus-STL printing error. Their root-sum-of-squares is thus a first-order, independence-assuming estimate of the fabricated-patch error rather than a single end-to-end measurement, and it omits terms not exercised here, notably the operator-versus-true-boundary error and any departure from planarity (Section 5). Equation (12) combines the mean magnitudes of the three terms (Table 4) and is therefore a representative combination under independence; the variance propagation proper, in the sense of the GUM [15], is the first-order decomposition of Figure 8, in which the share of each term is its variance divided by the sum of the three variances, and the per-image total of Figure 9 combines each image’s segmentation error with the scale and printing terms. The complete data flow is shown in Figure 3 and the evaluation loop over images and back-ends in Algorithm 2, in which Metrics returns Dice, IoU, , H, and (Equations (3)–(11)), is the in-plane area and Chain is Algorithm 1. Because under-coverage is the unsafe error, the offset is sized from its empirical distribution rather than fixed arbitrarily: for each image i, is the maximum inward deviation of the automatic contour with respect to the reference, that is the smallest uniform normal margin that would fully cover the wound (the radial offset of Algorithm 1 approximates it for near-convex contours, Section 5), and the offset achieving coverage in a fraction of cases is the empirical -quantile of these margins,
evaluated per back-end, with as a conventional coverage level; other levels follow from the same quantile.
| Algorithm 2: Dataset evaluation across segmentation back-ends. |
|
Data: image set , reference length d, back-end set , parameters Result: per-image, per-back-end record set
|
3.6. Experimental Design
The pipeline was evaluated in three experiments and a calibration-sensitivity analysis, each isolating one stage of the budget.
Experiment A (clinical segmentation and propagation). A set of 149 clinical DFU photographs was assembled from two public sources, the Lower Limb and Feet Wound Image Dataset [40] and a public diabetic foot ulcer image dataset [41], retaining superficial, single and clearly delineable wounds acquired in an approximately fronto-parallel view. Each image was manually delineated by a single operator to give the reference, then segmented by the three back-ends; the mask-level metrics and the propagated patch-level area error were computed (RQ1, RQ2), with the perilesional offset set to so that the offset, derived in Section 3.5 and applied in RQ3, does not enter the segmentation-error characterization.
Experiment B (absolute geometric accuracy). Six planar shapes of known CAD geometry, each printed in three replicates (18 parts), were photographed under the same calibrated protocol, and the reconstructed in-plane geometry was regressed against the nominal CAD size. This measures the photograph-to-geometry error (segmentation plus calibration) on objects of known nominal geometry; because the printed parts are compared with the nominal CAD, the comparison also contains the printing deviation quantified in Experiment C.
Experiment C (printing accuracy). The same 18 parts were measured against their source STL files to isolate , separating the in-plane area error from the out-of-plane thickness, which is a user-set parameter rather than a reconstructed quantity.
Scale-calibration sensitivity. A 500-sample Monte Carlo perturbation, run on the calibrated phantom photographs, displaced the two calibration points by Gaussian noise of standard deviation and recorded the relative area error, characterizing ; because the repeatability of point placement was not measured in this study, px was assumed as a representative value (Section 5), and the dependence of the scale term on is shown in Figure 8. The relative scale error grows in proportion to , with the reference length in pixels, so is reported in absolute pixels and the resulting scale term reflects the reference lengths present in the dataset rather than a single fixed physical reference.
Phantoms were fabricated by FDM in polylactic acid (PLA) on a Creality K1C printer at 0.2 mm layer height; planar reference dimensions were measured with a digital caliper. All clinical references were delineated by a single operator, a limitation discussed in Section 5.
3.7. Statistical Analysis
The statistical analysis addressed three objectives: comparing the per-image mask-level and patch-level metrics across the three back-ends, assessing the association between mask overlap and fabricated-patch error, and evaluating the absolute geometric accuracy of the phantom reconstructions. The procedures used for each objective are described below.
Normality was assessed with the Shapiro–Wilk test; the per-image scores departed from normality (Shapiro–Wilk, ), so non-parametric tests were used throughout. Per-image outliers were removed before Table 2 by Tukey’s rule, discarding values beyond from the quartiles of the per-image patch-area error; the same cases are excluded from the overlap and boundary columns so that all metrics of Table 2 describe one image set. Differences across the three back-ends are evaluated with the Friedman omnibus test on the per-image scores of the cases segmented without outliers by all three back-ends, followed by post hoc Wilcoxon signed-rank tests with Bonferroni correction for the three pairwise comparisons. The relationship between mask overlap and the fabricated-patch error (RQ2) is summarized by the Spearman rank correlation, pooled and per back-end; each image contributes one observation per back-end, so the pooled coefficient is descriptive. Absolute geometric accuracy on the phantoms is reported by linear regression of reconstructed against nominal size. The significance level is , and the analyses use Python with standard scientific libraries. The reference is delineated by a single operator, so no inter-operator agreement is reported (Section 5).
3.8. Software Architecture
IMTOP is a desktop application built around a Python back-end and an HTML and JavaScript front-end embedded in a Qt WebEngine view, the two sides communicating through a Qt WebChannel bridge (Figure 4). The front-end provides an interactive image canvas, a two-point scale tool, a segmenter selector, a parameter panel, a per-metric overlay list and a three-dimensional patch viewer; the patch mesh is built and rendered on the client with Three.js, and its STL representation is generated from the displayed mesh and passed to the back-end for writing. The back-end performs image input and output, scale computation, segmentation with three interchangeable back-ends together with mask post-processing, and metric computation, and it writes all output files (reference mask, STL and metric records in JSON). The pipeline of Figure 1 is governed by a state machine whose stages are unlocked by specific back-end events, the automatic-segmentation event unlocking both the metrics and the patch stages; backward navigation is always available and loading a new image resets the pipeline. The mapping from the conceptual pipeline to the implemented interface is shown in Figure 5. Communication between the two sides is asynchronous, through named slots and signals (Figure 4). The segmentation model is loaded once, on first use, on a worker thread so that the interface never blocks; only the per-image encoding pass is repeated for a new image. At the metrics stage the operator sees, for the selected back-end, the overlap, boundary and coverage metrics overlaid on the image before accepting the segmentation, and at the patch stage the thickness, offset and edge parameters are set interactively; this is the decision loop that the error budget of Section 3.5 is meant to inform. The application will be released to support reproducibility (Data Availability Statement).
4. Results
Findings are reported in the order of the three research questions; their interpretation is deferred to Section 5. The per-image overlap and patch-area scores of Section 4.1 are the inputs to the error budget (RQ1, Section 4.3) and to the overlap-versus-error analysis (RQ2, Section 4.4).
4.1. Segmentation Accuracy Across Back-Ends
Watershed failed to return a valid mask on three images (2%); SAM and GrabCut returned a mask on all 149. Per-image scores (per-back-end outliers removed as defined in Section 3.7: 5, 14 and 10 cases for SAM, GrabCut and watershed) are summarized in Table 2 and Figure 6. Because the three back-ends are seeded from the reference, these overlap values describe boundary refinement under a common initialization and are not comparable with the unseeded values reported in the literature. All Friedman omnibus tests were significant (; for Dice, ). In the post hoc comparisons SAM and GrabCut did not differ in Dice or IoU (Bonferroni-adjusted paired Wilcoxon, ); GrabCut exceeded watershed (Dice and IoU, ), and SAM and watershed did not differ. For the patch area error GrabCut was lower than both SAM and watershed (), which did not differ from each other; for the Hausdorff distance only the GrabCut–watershed pair reached significance (). The patch area error and the Hausdorff distance were right-skewed (for SAM, medians and px against means of and px).
4.2. Absolute Geometric and Printing Accuracy
On the 18 phantoms (six planar CAD shapes printed in three replicates, Figure 7) the reconstructed in-plane size regressed against the nominal CAD with slope and (Table 3): mean dimensional error , area error , Dice , with a worst-case minor-axis underestimate of on the crescent. Measured against the source STL, the parts had a mean in-plane area error of and a dimensional error of ; the out-of-plane thickness deviated by and is reported apart from the in-plane budget.
4.3. Dominant Error Source (RQ1)
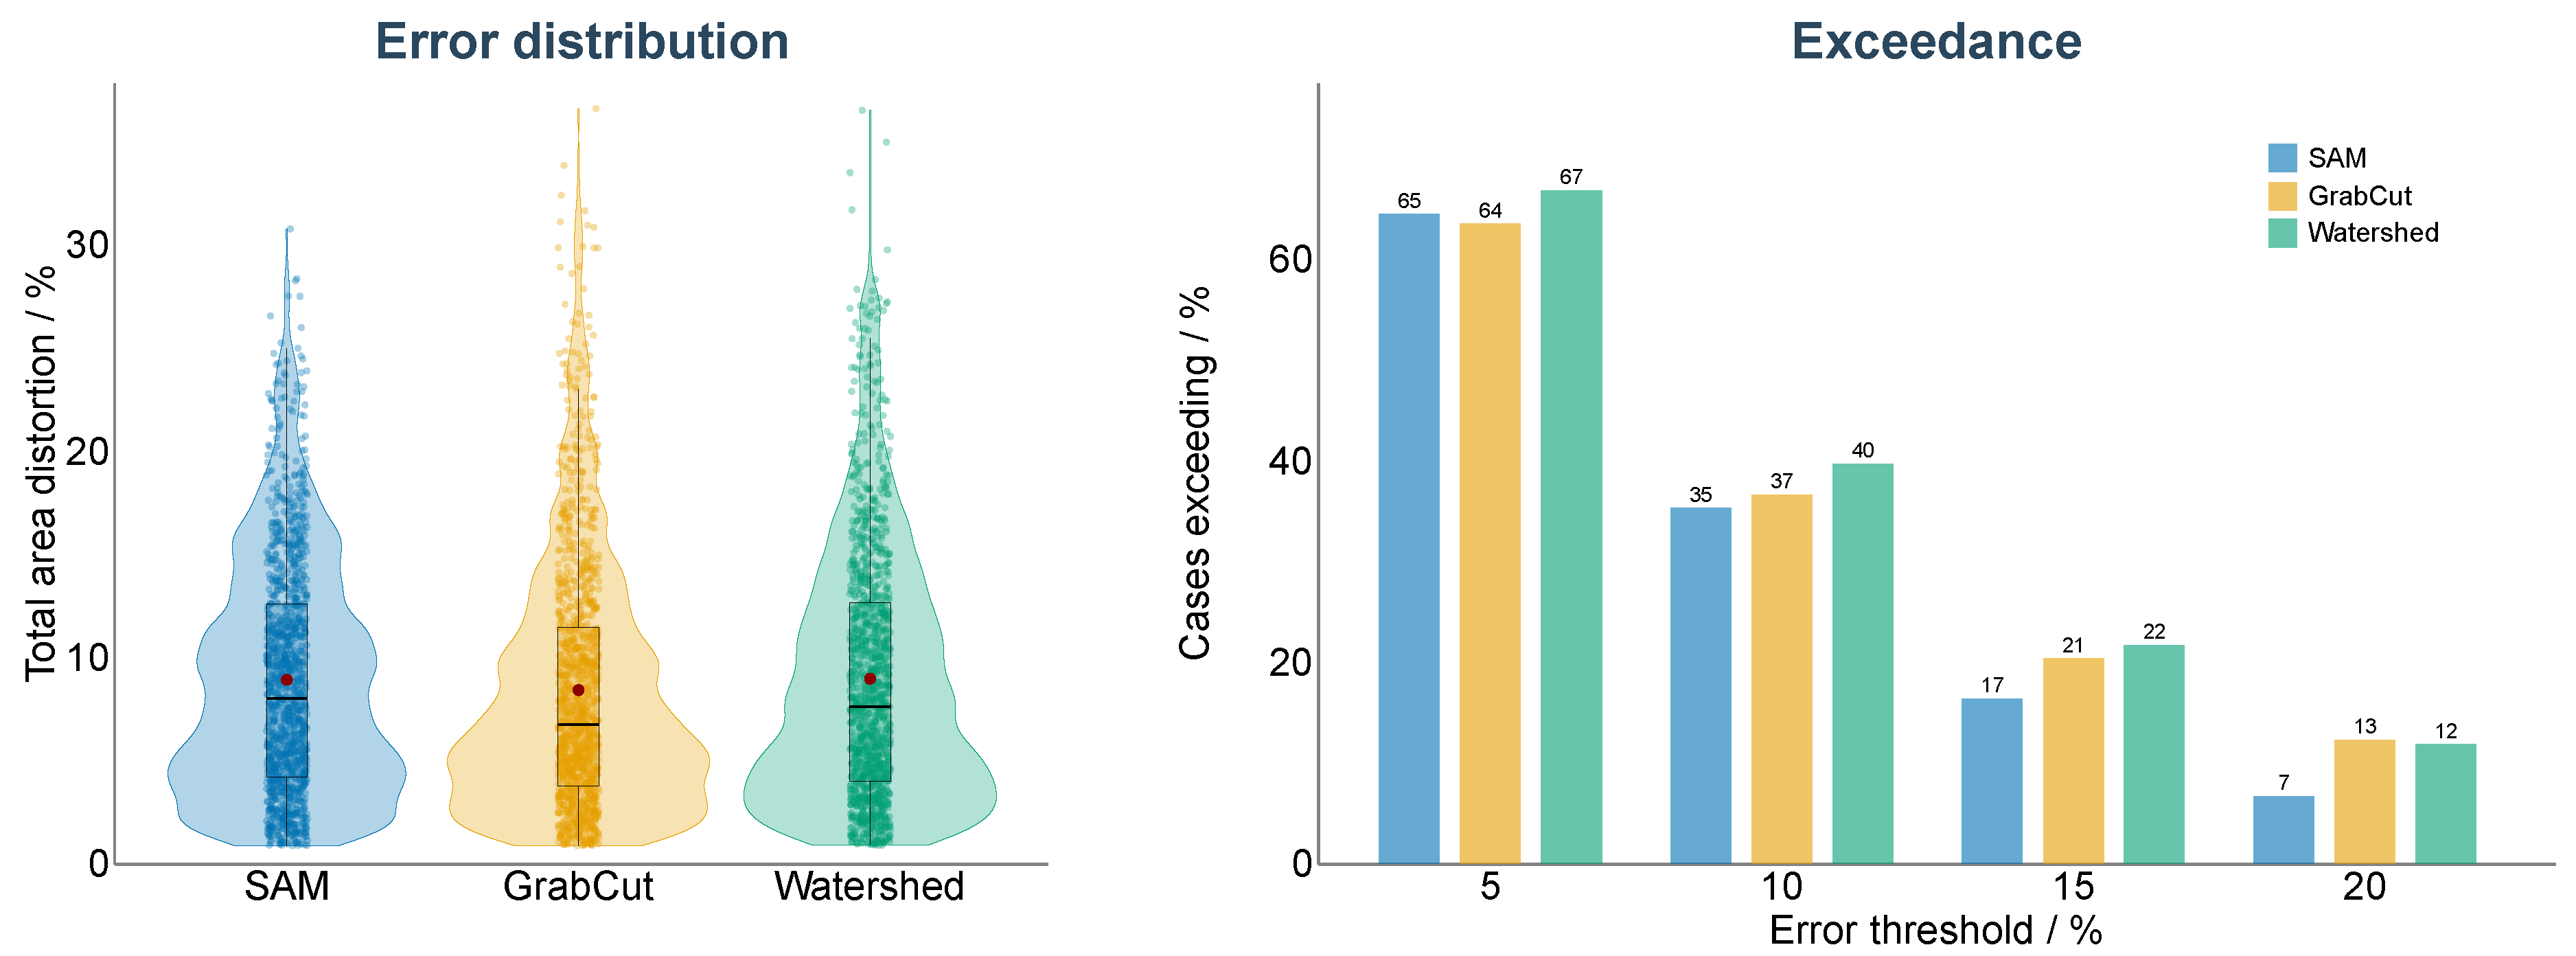
The stage magnitudes and their root-sum-of-squares combination are in Table 4: the segmentation term was , and (the outlier-removed means of Table 2), while the scale term ( at px) and the printing term (), which do not depend on the segmentation back-end, are the same for the three rows, giving a combined error of , and . In the scale-calibration sensitivity analysis the relative area error grew about twice as fast as the relative scale error implied by , as expected from the quadratic dependence of area on scale (Figure 8, right). In the first-order variance decomposition (Figure 8, left) the printing term was negligible (); the scale term was the largest contributor for SAM () and GrabCut (), and the segmentation term for watershed (). The total fabricated-patch area error was right-skewed, with a median near (Figure 9, left), exceeding in roughly two thirds of cases and in roughly a third (Figure 9, right).

Table 4.
Stage error magnitudes (relative area error) and their root-sum-of-squares combination. Scale calibration and printing do not depend on the segmentation back-end (the scale factor is set by the operator’s two points and applied identically to every mask, and printing acts on the final STL), so the same independently estimated (Monte Carlo, px) and (Experiment C) values are used for the three rows.
Table 4.
Stage error magnitudes (relative area error) and their root-sum-of-squares combination. Scale calibration and printing do not depend on the segmentation back-end (the scale factor is set by the operator’s two points and applied identically to every mask, and printing acts on the final STL), so the same independently estimated (Monte Carlo, px) and (Experiment C) values are used for the three rows.
| Back-End | (%) | (%) | (%) | Combined (%) |
|---|---|---|---|---|
| SAM | ||||
| GrabCut | ||||
| Watershed |
Figure 8.
(Left) First-order variance contribution of the segmentation, scale and printing terms to the fabricated-patch area error, per back-end. (Right) Scale-calibration sensitivity (relative area error against the placement uncertainty of the calibration points).
Figure 8.
(Left) First-order variance contribution of the segmentation, scale and printing terms to the fabricated-patch area error, per back-end. (Right) Scale-calibration sensitivity (relative area error against the placement uncertainty of the calibration points).
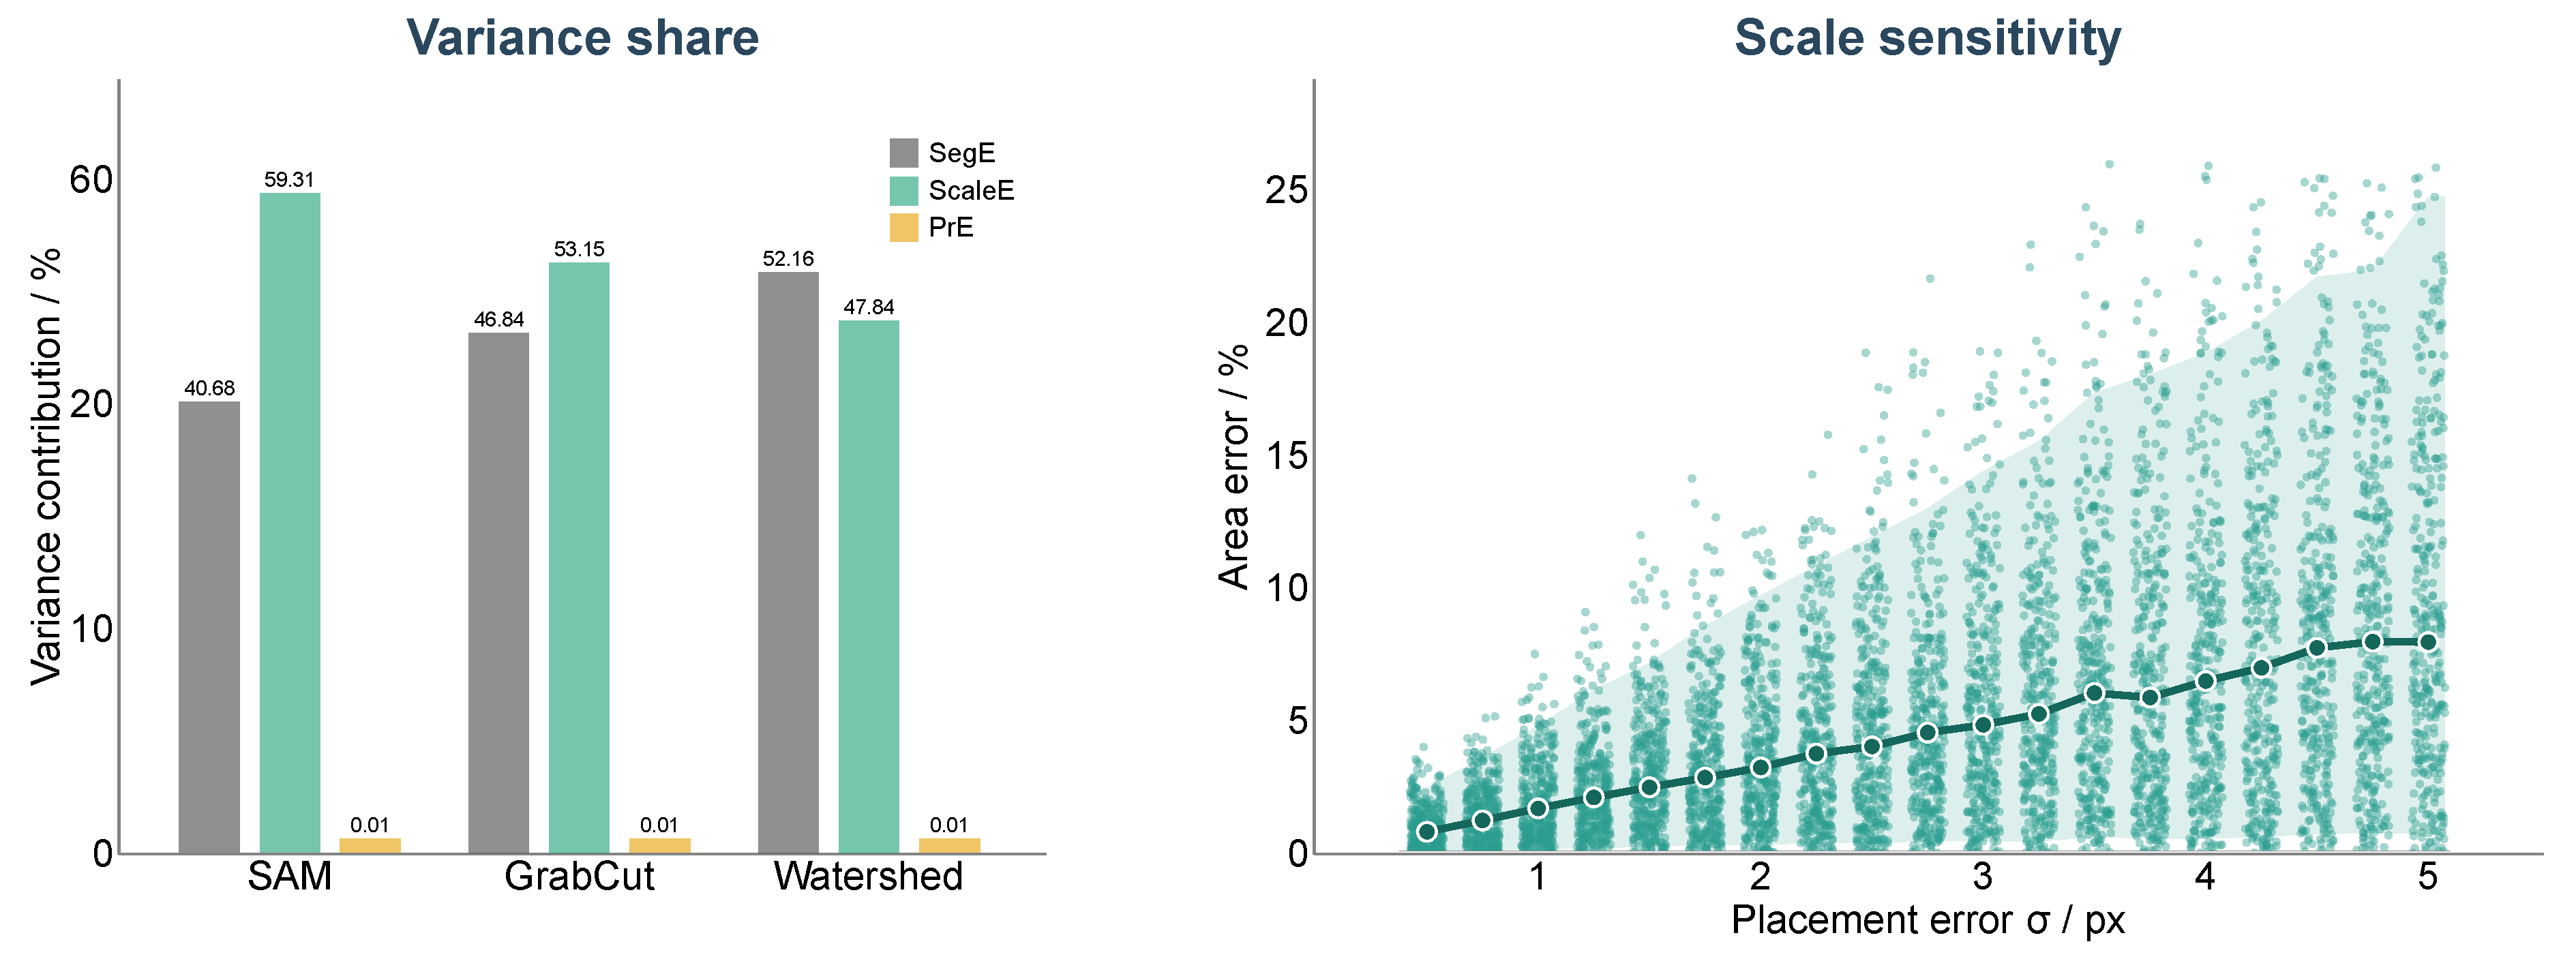
Figure 9.
(Left) Distribution of the total fabricated-patch area error (labelled total area distortion in the plot) per back-end. (Right) Fraction of cases in which the total error exceeds a given threshold. Because the clinical images are uncalibrated and carry no per-image scale error, the per-image total combines each image’s clinical segmentation error in quadrature with the scale term from the phantom-based Monte Carlo calibration and the printing term (); its empirical per-image median therefore lies below the combined value of Table 4, which combines the mean magnitudes.
Figure 9.
(Left) Distribution of the total fabricated-patch area error (labelled total area distortion in the plot) per back-end. (Right) Fraction of cases in which the total error exceeds a given threshold. Because the clinical images are uncalibrated and carry no per-image scale error, the per-image total combines each image’s clinical segmentation error in quadrature with the scale term from the phantom-based Monte Carlo calibration and the printing term (); its empirical per-image median therefore lies below the combined value of Table 4, which combines the mean magnitudes.
4.4. Overlap as a Predictor of Fabricated-Patch Error (RQ2)
This analysis pools all valid cases () without the outlier removal of Table 2, so that the correlation is not conditioned on the outcome variable and the high-error cases are retained. Mask overlap was correlated with, but did not determine, the fabricated-patch area error. The Dice coefficient and the patch area error were negatively and monotonically associated (Spearman , ), and the association held within each back-end (, and for SAM, GrabCut and watershed; Figure 10). At a fixed overlap the patch error still varied over a wide range: among the 235 cases with Dice the patch area error spanned 0 to (median , IQR –). For a given Dice D the relative area disagreement is bounded above by , about at , so the observed spread covers most of the feasible range: Dice constrains the magnitude of the disagreement but not its sign. Consistently, the two back-ends with statistically indistinguishable Dice (SAM and GrabCut, Section 4.1) differed significantly in patch area error (), and the back-end ordering by overlap (GrabCut and SAM highest, watershed lowest) did not match the ordering by patch area error (GrabCut lowest, SAM and watershed not differing).
4.5. Coverage and Perilesional Offset (RQ3)
At zero offset the mean areal coverage c was , and for SAM, GrabCut and watershed, and almost no case was already fully covered (at most of cases above coverage), so an outward margin is needed in essentially every case. The disagreement was clinically asymmetric (Figure 11): under-coverage (, exposed wound, mean over images) was , and and over-coverage (, excess healthy skin) , and ; under-coverage exceeded over-coverage for SAM and watershed (paired Wilcoxon, ) but not for GrabCut (). The difference of the two means shows that the automatic masks were on average smaller than the reference, by , and of the reference area, a systematic component of the segmentation term. From the per-image maximum inward deviations of the automatic contour with respect to the reference, the perilesional offset of Equation (13) covering the wound in of the evaluated cases was taken as their 95th percentile, evaluated separately for each back-end; because the clinical images carry no physical reference, its absolute value in millimetres awaits a calibrated sizing run (Section 5).
5. Discussion
IMTOP turns a single calibrated RGB photograph into a watertight, printable patient-specific patch geometry without depth sensing. Its accuracy was evaluated on fabricated planar phantoms of known geometry. For the clinical images, for which no physical ground-truth wound geometry was available, accuracy was assessed through the patch-area error propagated along the processing chain. The phantom experiments indicated that the contribution of the PLA printing process to the overall error was negligible. On 149 clinical DFU images and 18 printed phantoms the pipeline reconstructed the planar geometry accurately (phantom area error , Dice ), and the combined fabricated-patch area error was for SAM, the default back-end. The three research questions, whose results were reported without interpretation in Section 4, are addressed in turn below.
RQ1 asked how the fabricated-patch error distributes across the segmentation, scale and printing stages, in magnitude and in variance. Printing is negligible by both magnitude () and variance (), so the budget is governed by segmentation and scale. By typical magnitude the segmentation term is the largest ( against for scale), whereas in the variance decomposition the scale term, despite its smaller representative magnitude, dominates for SAM and GrabCut because of its right-skewed upper tail, segmentation dominating only for watershed. This variance ranking is contingent on the assumed calibration-placement noise px, which is expressed in absolute pixels and is therefore resolution-dependent; at a smaller the scale variance would shrink and segmentation would dominate, so the ranking should be read as conditional on rather than absolute. That the joint segmentation-and-scale error is small on phantoms with sharp, high-contrast borders () while the segmentation term is large on clinical images suggests that the latter originates mainly in the ambiguity of the wound boundary rather than in the segmentation algorithms or the scale recovery, although the two experiments differ in reference (nominal CAD against a single operator) and in imaging conditions. Stage-wise error propagation of this kind follows the GUM [15] and the dimensional-tolerance studies of FDM by Lieneke et al. [16] and Abas et al. [39]; to our knowledge it has not been applied to image-to-print wound dressings.
RQ2 asked whether mask overlap suffices to predict the fabricated-patch error. It does not, and part of the reason is analytic: for a given Dice the magnitude of the area disagreement is bounded but its sign is not, so two masks with equal overlap can leave the wound exposed or extend onto healthy skin by the same amount. Empirically, Dice was correlated with but did not determine the patch area error (Spearman ), the error among the cases with Dice spanned most of the feasible range, the two back-ends with statistically indistinguishable Dice differed significantly in patch area error, and the overlap and patch-error rankings disagreed. Region overlap is therefore necessary but insufficient: the sign of the disagreement, captured by the coverage split, and its localization, captured by the boundary distance, are needed to characterize the fabricated object, since a scalar area error is itself blind to a displaced mask of equal area. This qualifies the common practice of ranking wound and DFU segmentation by overlap alone, from Goyal et al. [11] and Wang et al. [10] to the DFU segmentation challenge [32] and self-configuring nnU-Net [31], and is consistent with the insensitivity of Dice to boundary placement noted by Huttenlocher et al. [38].
RQ3 asked how the residual segmentation uncertainty should set the perilesional margin. Because the disagreement is clinically asymmetric, under-coverage of the wound being the unsafe error and exceeding over-coverage for SAM and watershed, the offset is sized from the empirical distribution of inward deviations as their per-back-end 95th percentile, which covers the wound in of the evaluated cases by construction. With a mean coverage of 92 to at zero offset and almost no case already fully covered, such a margin is needed in essentially every case. This percentile is computed in-sample, on the same 149 images and a single-operator reference and without fixing its value in millimetres, so it is a constructive sizing rule rather than a guarantee, and an out-of-sample, calibrated validation is left to future work. In decision-support terms, it converts an uncertainty estimate into a design parameter under an explicit, asymmetric cost, while the error budget attributes the residual error to the stage responsible for it; the rule is complementary to the assessment and monitoring step that precedes fabrication [24].
Set against the existing routes, IMTOP is a deliberate trade-off rather than a strict improvement. Image-based planimetry recovers wound geometry from a single photograph but stops at a measurement: Foltynski reports area [14], Yap et al. standardize smartphone acquisition [19], and Kim et al. predict healing [21], none producing a fabricable object, whereas IMTOP carries the same depth-free image through to a printable patch. At the other end, Chae et al. [9] also reach a printed DFU patch, but from a reconstructed RGB-D surface: their depth capture recovers the true wound-bed relief that our planar assumption gives up, while our single-photograph input removes their depth sensor. Filko et al. [22,23] likewise reconstruct and measure the wound from a robot-mounted RGB-D rig, validating on the reconstructed surface rather than, as here, on the fabricated part. Cavazzana et al. [24], from the same group, segment and analyse the ulcer in three dimensions for objective assessment; IMTOP is complementary to this, the fabrication step that can follow such an assessment rather than an alternative to it. Finally, the three back-ends are seeded from the same manual reference and therefore refine a common initialization rather than localizing the wound independently. Their close agreement in overlap, with SAM [34] and GrabCut [27] differing little, is thus partly a consequence of the shared seed. The observation that the choice of segmenter matters less than the wound-border ambiguity common to all of them is correspondingly qualified and would require a reference-free comparison to be established.
Some limitations bound these results. First, the reference was delineated by a single operator with a geometric rather than clinical background; because is measured against this single reference, it cannot separate the intrinsic wound-border ambiguity from the idiosyncrasy of one tracer, so the attribution of the dominant error to border ambiguity is provisional until multi-annotator, clinician-validated references are available. Second, the error budget is partial: it omits the operator-versus-true-boundary term just noted and any departure from planarity, since the pipeline assumes an approximately fronto-parallel view and the phantoms are planar, so the phantom area error is a planar best case and does not bound the error on a curved foot. Third, the clinical images were uncalibrated, so the clinical metrics are in pixels and the offset is reported as a method whose absolute millimetre value awaits a calibrated sizing run; the three error terms are also treated as independent, and the segmentation term contains the systematic under-segmentation noted in Section 4.5, which a signed budget would treat as a bias to be corrected rather than as a random term. Fourth, the per-back-end outlier removal of Tukey’s rule discards only upper-tail cases of the very outcome under test, so the back-end ranking of Table 2 and the segmentation terms of Table 4 are conditional on that exclusion, whereas the pooled analysis of Section 4.4 is not. Fifth, the printing term was measured for PLA parts made by FDM: an extruded hydrogel dressing is expected to deviate more, so must be re-measured for the final ink and the conclusion that printing is negligible is specific to the phantom process. Sixth, the printed thickness deviated by : although it is a user-set parameter excluded from the in-plane budget, for a hydrogel the dispensed volume scales with thickness, so this deviation is functionally relevant to local drug dosing. Seventh, the offset of Algorithm 1 is applied radially from the centroid and therefore approximates a uniform normal margin only for near-convex contours; on elongated or concave wounds the achieved normal margin is smaller than . Finally, no established clinical threshold for acceptable patch-area error exists, unlike tracking accuracy in augmented surgery, where tolerance ranges reported in the literature allow a measured error to be judged directly [42], so the reported combined error of about cannot yet be declared adequate or inadequate for treatment. Future work will (i) add multi-annotator, clinician-validated references; (ii) measure the repeatability of calibration-point placement to ground , with accuracy and precision estimated under controlled influence factors as in our metrological assessment of augmented-reality tooltip tracking [43]; (iii) fix the offset in millimetres on calibrated images, replace the radial offset with a normal one and validate the rule prospectively; (iv) bound the planarity error on curved or obliquely viewed targets; (v) incorporate depth where available without sacrificing the frugal default; and (vi) integrate the patch geometry with the printable hydrogel ink under development within the same project, toward a dressing tested on the wound.
6. Conclusions
A single RGB photograph with a physical scale reference can be turned, without depth sensing or camera intrinsics, into a watertight printable patch geometry for superficial DFUs, and the accuracy of the result can be budgeted stage by stage. On the evaluated data the largest error term by mean magnitude was segmentation, which the comparison with the phantom experiment attributes mainly to the ambiguity of the wound border, whereas by variance the scale term prevailed for two of the three segmenters at the assumed placement noise; printing was negligible for the PLA phantoms. Mask overlap alone did not determine fabricated-patch accuracy, and the residual under-coverage yielded a segmenter-specific perilesional offset that covers the wound in of the evaluated cases. Clinician-validated multi-annotator references, a calibrated clinical set and a prospective test of the offset are needed before the sizing rule can be adopted in practice. The application will be released to support reproducibility (Data Availability Statement), and ongoing work targets integration with a printable hydrogel ink developed within the same project.
Author Contributions
Conceptualization, F.S. and R.L.; methodology, F.S. and L.U.; software, F.S. and G.A.; validation, F.S. and S.M.; formal analysis, F.S. and J.S.; investigation, F.S., L.U., S.M. and E.V.; resources, S.M. and E.V.; data curation, F.S. and G.A.; writing—original draft preparation, F.S. and L.U.; writing—review and editing, J.S., G.A., R.L., S.M. and E.V.; visualization, F.S.; supervision, S.M. and E.V.; project administration, R.L., J.S. and L.U.; funding acquisition, R.L., J.S. and L.U. All authors have read and agreed to the published version of the manuscript.
Funding
This research was funded by the PERSEUS project (Patient-specific engineering of smart responsive wound dressings for enhanced diabetic foot ulcer management through AI- and XR-technologies) with the support of Politecnico di Torino and Fondazione CRT.
Institutional Review Board Statement
Not applicable. The study did not involve new human participants: the clinical images were drawn from publicly available, anonymized datasets released by their creators for research use, and no new patient data were collected.
Informed Consent Statement
Not applicable.
Data Availability Statement
The IMTOP application, the analysis scripts, the phantom CAD models, the STL files and the dimensional measurements will be made publicly available on GitHub (https://github.com/federicosalerno-phd/IMTOP) and archived on Zenodo with a permanent DOI upon publication. The clinical images are drawn from two public datasets, the Lower Limb and Feet Wound Image Dataset [40] (DOI 10.17632/hsj38fwnvr.3) and a public diabetic foot ulcer image dataset [41], and are not redistributed here. The SAM ViT-B checkpoint (sam_vit_b_01ec64.pth) is distributed by its original authors [34] and is not redistributed here.
Acknowledgments
This work was financed by PERSEUS project (Patient-specific engineering of smart responsive wound dressings for enhanced diabetic foot ulcer management through AI- and XR-technologies) with the support of Politecnico di Torino and Fondazione CRT.
Conflicts of Interest
The authors declare no conflicts of interest. The funders had no role in the design of the study; in the collection, analyses, or interpretation of data; in the writing of the manuscript; or in the decision to publish the results.
Abbreviations
The following abbreviations are used in this manuscript:
| CAD | Computer-aided design |
| DFU | Diabetic foot ulcer |
| FDM | Fused deposition modelling |
| GT | Ground truth (the manual reference, in figures) |
| GUM | Guide to the Expression of Uncertainty in Measurement |
| IoU | Intersection over union |
| IQR | Interquartile range |
| PLA | Polylactic acid |
| RGB-D | Red, green, blue and depth |
| RQ | Research question |
| SAM | Segment Anything Model |
| SD | Standard deviation |
| STL | Stereolithography (mesh file format) |
| ViT-B | Vision Transformer, base variant |
References
- Armstrong, D.G.; Tan, T.W.; Boulton, A.J.M.; Bus, S.A. Diabetic foot ulcers: a review. JAMA 2023, 330, 62–75. [CrossRef]
- McDermott, K.; Fang, M.; Boulton, A.J.M.; Selvin, E.; Hicks, C.W. Etiology, epidemiology, and disparities in the burden of diabetic foot ulcers. Diabetes Care 2023, 46, 209–221. [CrossRef]
- Chen, L.; Sun, S.; Gao, Y.; Ran, X. Global mortality of diabetic foot ulcer: a systematic review and meta-analysis of observational studies. Diabetes, Obesity and Metabolism 2023, 25, 36–45. [CrossRef]
- Muwaffak, Z.; Goyanes, A.; Clark, V.; Basit, A.W.; Hilton, S.T.; Gaisford, S. Patient-specific 3D scanned and 3D printed antimicrobial polycaprolactone wound dressings. International Journal of Pharmaceutics 2017, 527, 161–170. [CrossRef]
- Winter, G.D. Formation of the scab and the rate of epithelization of superficial wounds in the skin of the young domestic pig. Nature 1962, 193, 293–294. [CrossRef]
- Laurano, R.; Boffito, M.; Ciardelli, G.; Chiono, V. Wound dressing products: a translational investigation from the bench to the market. Bioactive Materials 2021, 6, 3013–3024. [CrossRef]
- Tsegay, F.; Hisham, M.; Elsherif, M.; Schiffer, A.; Butt, H. 3D printing of pH indicator auxetic hydrogel skin wound dressing. Molecules 2023, 28, 1339. [CrossRef]
- Murphy, S.V.; Atala, A. 3D bioprinting of tissues and organs. Nature Biotechnology 2014, 32, 773–785. [CrossRef]
- Chae, H.J.; Lee, S.; Son, H.; Han, S.; Lim, T. Generating 3D bio-printable patches using wound segmentation and reconstruction to treat diabetic foot ulcers. In Proceedings of the IEEE/CVF Conference on Computer Vision and Pattern Recognition (CVPR), New Orleans, LA, USA, 18–24 June, 2022; pp. 2539–2549.
- Wang, C.; Anisuzzaman, D.M.; Williamson, V.; Dhar, M.K.; Rostami, B.; Niezgoda, J.; Gopalakrishnan, S.; Yu, Z. Fully automatic wound segmentation with deep convolutional neural networks. Scientific Reports 2020, 10, 21897. [CrossRef]
- Goyal, M.; Yap, M.H.; Reeves, N.D.; Rajbhandari, S.; Spragg, J. Fully convolutional networks for diabetic foot ulcer segmentation. In Proceedings of the 2017 IEEE International Conference on Systems, Man, and Cybernetics (SMC), Banff, AB, Canada, 5–8 October, 2017; pp. 618–623. [CrossRef]
- Salerno, F.; Moos, S.; Ulrich, L.; Novaresio, A.; Vezzetti, E. A Methodology for the Dimensional and Mechanical Analysis of Surgical Guides. In Proceedings of the International Conference of the Italian Association of Design Methods and Tools for Industrial Engineering (ADM 2023), Florence, Italy, 6–8 September, 2023; pp. 184–193. Lecture Notes in Mechanical Engineering; Springer: Cham, Switzerland, 2024, . [CrossRef]
- Armstrong, D.G.; Lavery, L.A.; Harkless, L.B. Validation of a diabetic wound classification system: the contribution of depth, infection, and ischemia to risk of amputation. Diabetes Care 1998, 21, 855–859. [CrossRef]
- Foltynski, P. Ways to increase precision and accuracy of wound area measurement using smart devices: advanced app Planimator. PLoS ONE 2018, 13, e0192485. [CrossRef]
- JCGM. Evaluation of measurement data—Guide to the expression of uncertainty in measurement (GUM). Technical Report JCGM 100:2008, Joint Committee for Guides in Metrology (JCGM), BIPM, Sèvres, France, 2008.
- Lieneke, T.; Denzer, V.; Adam, G.A.O.; Zimmer, D. Dimensional tolerances for additive manufacturing: experimental investigation for fused deposition modeling. Procedia CIRP 2016, 43, 286–291. [CrossRef]
- Hakimi, N.; Cheng, R.; Leng, L.; Sotoudehfar, M.; Ba, P.Q.; Bakhtyar, N.; Amini-Nik, S.; Jeschke, M.G.; Günther, A. Handheld skin printer: in situ formation of planar biomaterials and tissues. Lab on a Chip 2018, 18, 1440–1451. [CrossRef]
- Albanna, M.; Binder, K.W.; Murphy, S.V.; Kim, J.; Qasem, S.A.; Zhao, W.; Tan, J.; El-Amin, I.B.; Dice, D.D.; Marco, R.A.; et al. In situ bioprinting of autologous skin cells accelerates wound healing of extensive excisional full-thickness wounds. Scientific Reports 2019, 9, 1856. [CrossRef]
- Yap, M.H.; Chatwin, K.E.; Ng, C.C.; Abbott, C.A.; Bowling, F.L.; Rajbhandari, S.; Boulton, A.J.M.; Reeves, N.D. A new mobile application for standardizing diabetic foot images. Journal of Diabetes Science and Technology 2018, 12, 169–173. [CrossRef]
- Ramachandram, D.; Ramirez-GarciaLuna, J.L.; Fraser, R.D.J.; Martínez-Jiménez, M.A.; Arriaga-Caballero, J.E.; Allport, J. Fully automated wound tissue segmentation using deep learning on mobile devices: cohort study. JMIR mHealth and uHealth 2022, 10, e36977. [CrossRef]
- Kim, R.B.; Gryak, J.; Mishra, A.; Cui, C.; Soroushmehr, S.M.R.; Najarian, K.; Wrobel, J.S. Utilization of smartphone and tablet camera photographs to predict healing of diabetes-related foot ulcers. Computers in Biology and Medicine 2020, 126, 104042. [CrossRef]
- Filko, D.; Marijanović, D.; Nyarko, E.K. Automatic robot-driven 3D reconstruction system for chronic wounds. Sensors 2021, 21, 8308. [CrossRef]
- Filko, D.; Nyarko, E.K. 2D/3D wound segmentation and measurement based on a robot-driven reconstruction system. Sensors 2023, 23, 3298. [CrossRef]
- Cavazzana, R.; Faccia, A.; Cavallaro, A.; Giuranno, M.; Becchi, S.; Innocente, C.; Marullo, G.; Ricci, E.; Secco, J.; Vezzetti, E.; et al. Enhancing clinical assessment of skin ulcers with automated and objective convolutional neural network-based segmentation and 3D analysis. Applied Sciences 2025, 15, 833. [CrossRef]
- Otsu, N. A threshold selection method from gray-level histograms. IEEE Transactions on Systems, Man, and Cybernetics 1979, 9, 62–66. [CrossRef]
- Meyer, F. Topographic distance and watershed lines. Signal Processing 1994, 38, 113–125. [CrossRef]
- Rother, C.; Kolmogorov, V.; Blake, A. “GrabCut”: interactive foreground extraction using iterated graph cuts. ACM Transactions on Graphics 2004, 23, 309–314. [CrossRef]
- Long, J.; Shelhamer, E.; Darrell, T. Fully convolutional networks for semantic segmentation. In Proceedings of the 2015 IEEE Conference on Computer Vision and Pattern Recognition (CVPR), Boston, MA, USA, 7–12 June, 2015; pp. 3431–3440. [CrossRef]
- Ronneberger, O.; Fischer, P.; Brox, T. U-Net: convolutional networks for biomedical image segmentation. In Proceedings of the Medical Image Computing and Computer-Assisted Intervention (MICCAI 2015), Munich, Germany, 5–9 October, 2015; pp. 234–241. Lecture Notes in Computer Science, Volume 9351; Springer: Cham, Switzerland, 2015, . [CrossRef]
- Mahbod, A.; Schaefer, G.; Ecker, R.; Ellinger, I. Automatic foot ulcer segmentation using an ensemble of convolutional neural networks. In Proceedings of the 2022 26th International Conference on Pattern Recognition (ICPR), Montreal, QC, Canada, 21–25 August, 2022; pp. 4358–4364. [CrossRef]
- Isensee, F.; Jaeger, P.F.; Kohl, S.A.A.; Petersen, J.; Maier-Hein, K.H. nnU-Net: a self-configuring method for deep learning-based biomedical image segmentation. Nature Methods 2021, 18, 203–211. [CrossRef]
- Yap, M.H.; Cassidy, B.; Byra, M.; Liao, T.y.; Yi, H.; Galdran, A.; Chen, Y.H.; Brüngel, R.; Koitka, S.; Friedrich, C.M.; et al. Diabetic foot ulcers segmentation challenge report: benchmark and analysis. Medical Image Analysis 2024, 94, 103153. [CrossRef]
- Wang, C.; Mahbod, A.; Ellinger, I.; Galdran, A.; Gopalakrishnan, S.; Niezgoda, J.; Yu, Z. FUSeg: the foot ulcer segmentation challenge. Information 2024, 15, 140. [CrossRef]
- Kirillov, A.; Mintun, E.; Ravi, N.; Mao, H.; Rolland, C.; Gustafson, L.; Xiao, T.; Whitehead, S.; Berg, A.C.; Lo, W.Y.; et al. Segment Anything. In Proceedings of the 2023 IEEE/CVF International Conference on Computer Vision (ICCV), Paris, France, 2–6 October, 2023; pp. 3992–4003. [CrossRef]
- Ma, J.; He, Y.; Li, F.; Han, L.; You, C.; Wang, B. Segment anything in medical images. Nature Communications 2024, 15, 654. [CrossRef]
- Ravi, N.; Gabeur, V.; Hu, Y.T.; Hu, R.; Ryali, C.; Ma, T.; Khedr, H.; Rädle, R.; Rolland, C.; Gustafson, L.; et al. SAM 2: segment anything in images and videos. arXiv 2024, arXiv:2408.00714. [CrossRef]
- Dice, L.R. Measures of the amount of ecologic association between species. Ecology 1945, 26, 297–302. [CrossRef]
- Huttenlocher, D.P.; Klanderman, G.A.; Rucklidge, W.J. Comparing images using the Hausdorff distance. IEEE Transactions on Pattern Analysis and Machine Intelligence 1993, 15, 850–863. [CrossRef]
- Abas, M.; Habib, T.; Noor, S.; Salah, B.; Zimon, D. Parametric investigation and optimization to study the effect of process parameters on the dimensional deviation of fused deposition modeling of 3D printed parts. Polymers 2022, 14, 3667. [CrossRef]
- Islam, M.M. Lower Limb and Feet Wound Image Dataset for Medical Analysis. Mendeley Data, V3, 2026. [CrossRef]
- laithjj. Diabetic Foot Ulcer (DFU) dataset. Kaggle. Available online: https://www.kaggle.com/datasets/laithjj/diabetic-foot-ulcer-dfu (accessed on 24 August 2026).
- Salerno, F.; Contenti, A.; Ulrich, L.; Moos, S.; Fiandrotti, A.; Vezzetti, E. A Low-Cost Benchmarking Platform for Tracking Systems to Enable Augmented Surgery Tools in Clinical Practice. SN Computer Science 2026, 7, 437. [CrossRef]
- Salerno, F.; Ulrich, L.; Maculotti, G.; Moos, S.; Genta, G.; Vezzetti, E.; Galetto, M. A metrological approach for Augmented Reality tooltip tracking assessment. Computers in Industry 2026, 175, 104430. [CrossRef]
Figure 1.
Six-stage pipeline from a single RGB photograph to a printable dressing; the automatic-segmentation event unlocks the metric and patch stages.
Figure 1.
Six-stage pipeline from a single RGB photograph to a printable dressing; the automatic-segmentation event unlocks the metric and patch stages.

Figure 2.
Concept of the fabrication-aware evaluation: (a) all back-ends are initialized from the operator’s reference mask (dashed box: SAM box prompt; dot: positive point at the distance-transform maximum; the classical back-ends use an eroded core of the same mask); (b,c) two masks with the same Dice differ in boundary deviation H; (d) the coverage split into under-coverage and over-coverage .
Figure 2.
Concept of the fabrication-aware evaluation: (a) all back-ends are initialized from the operator’s reference mask (dashed box: SAM box prompt; dot: positive point at the distance-transform maximum; the classical back-ends use an eroded core of the same mask); (b,c) two masks with the same Dice differ in boundary deviation H; (d) the coverage split into under-coverage and over-coverage .
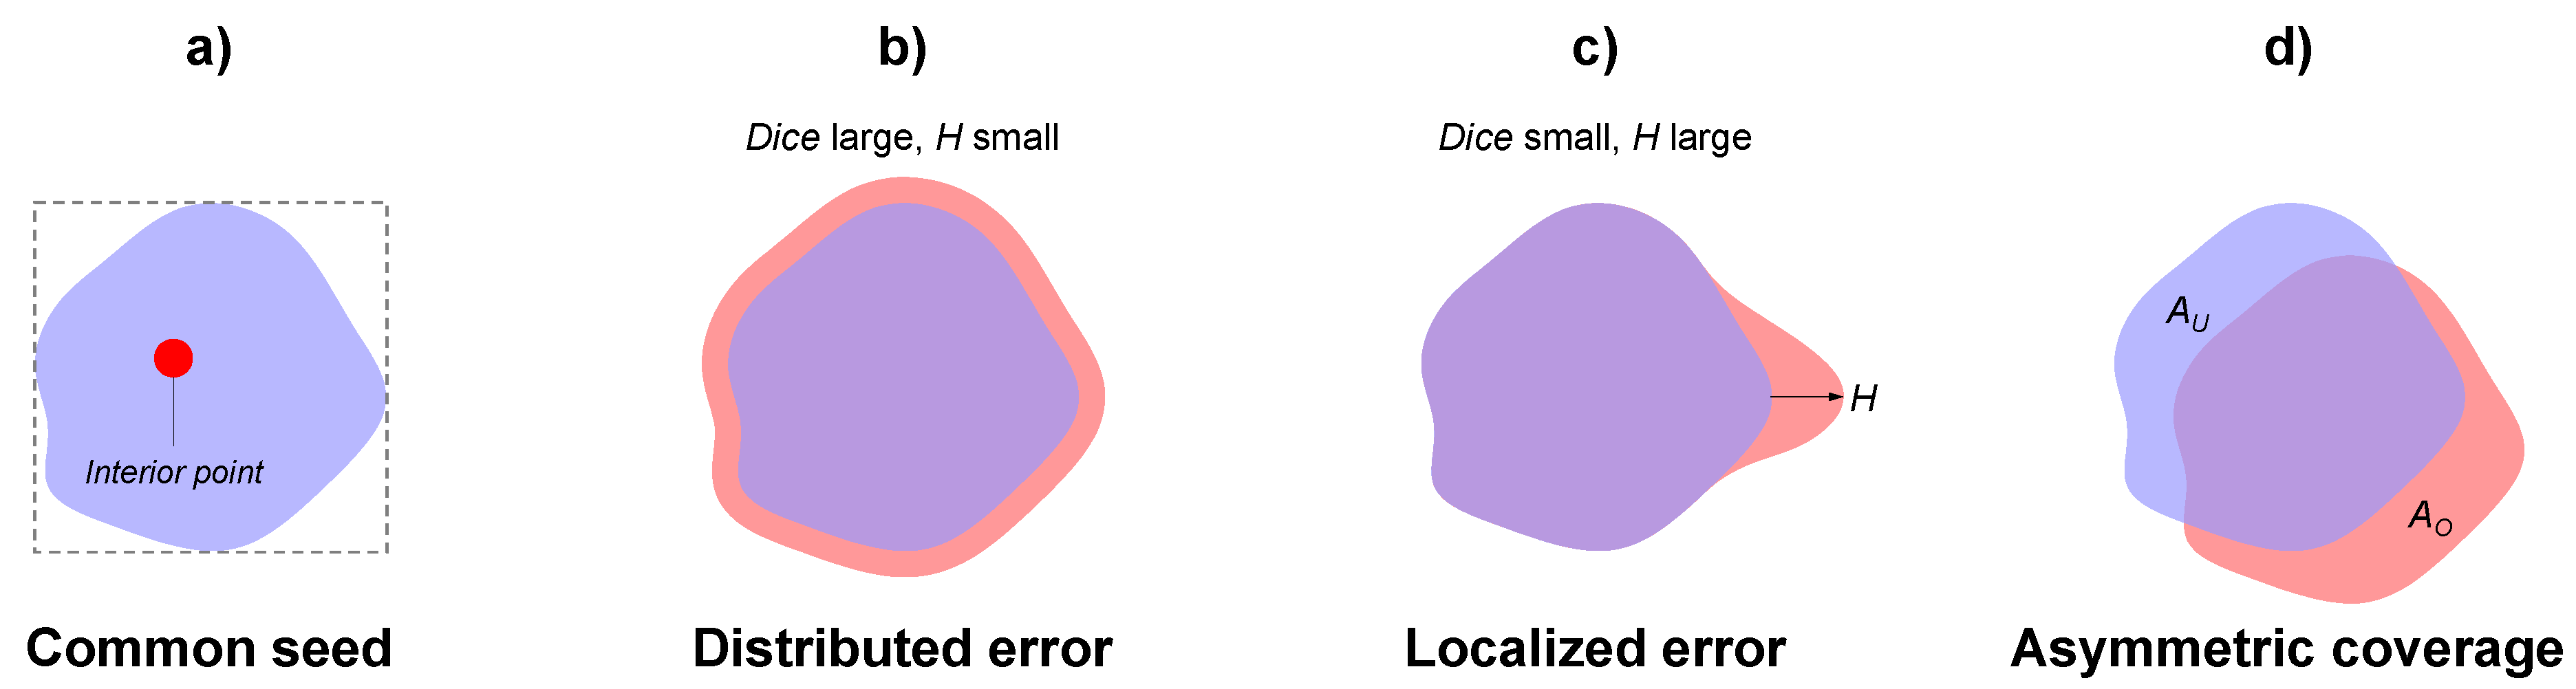
Figure 3.
Data flow of the stage-wise error budget (schematic): the three terms , and are measured on separate experiments (Section 3.6), not on a single image carried through the chain, and combined into the fabricated-patch error (Equation (12)).
Figure 3.
Data flow of the stage-wise error budget (schematic): the three terms , and are measured on separate experiments (Section 3.6), not on a single image carried through the chain, and combined into the fabricated-patch error (Equation (12)).
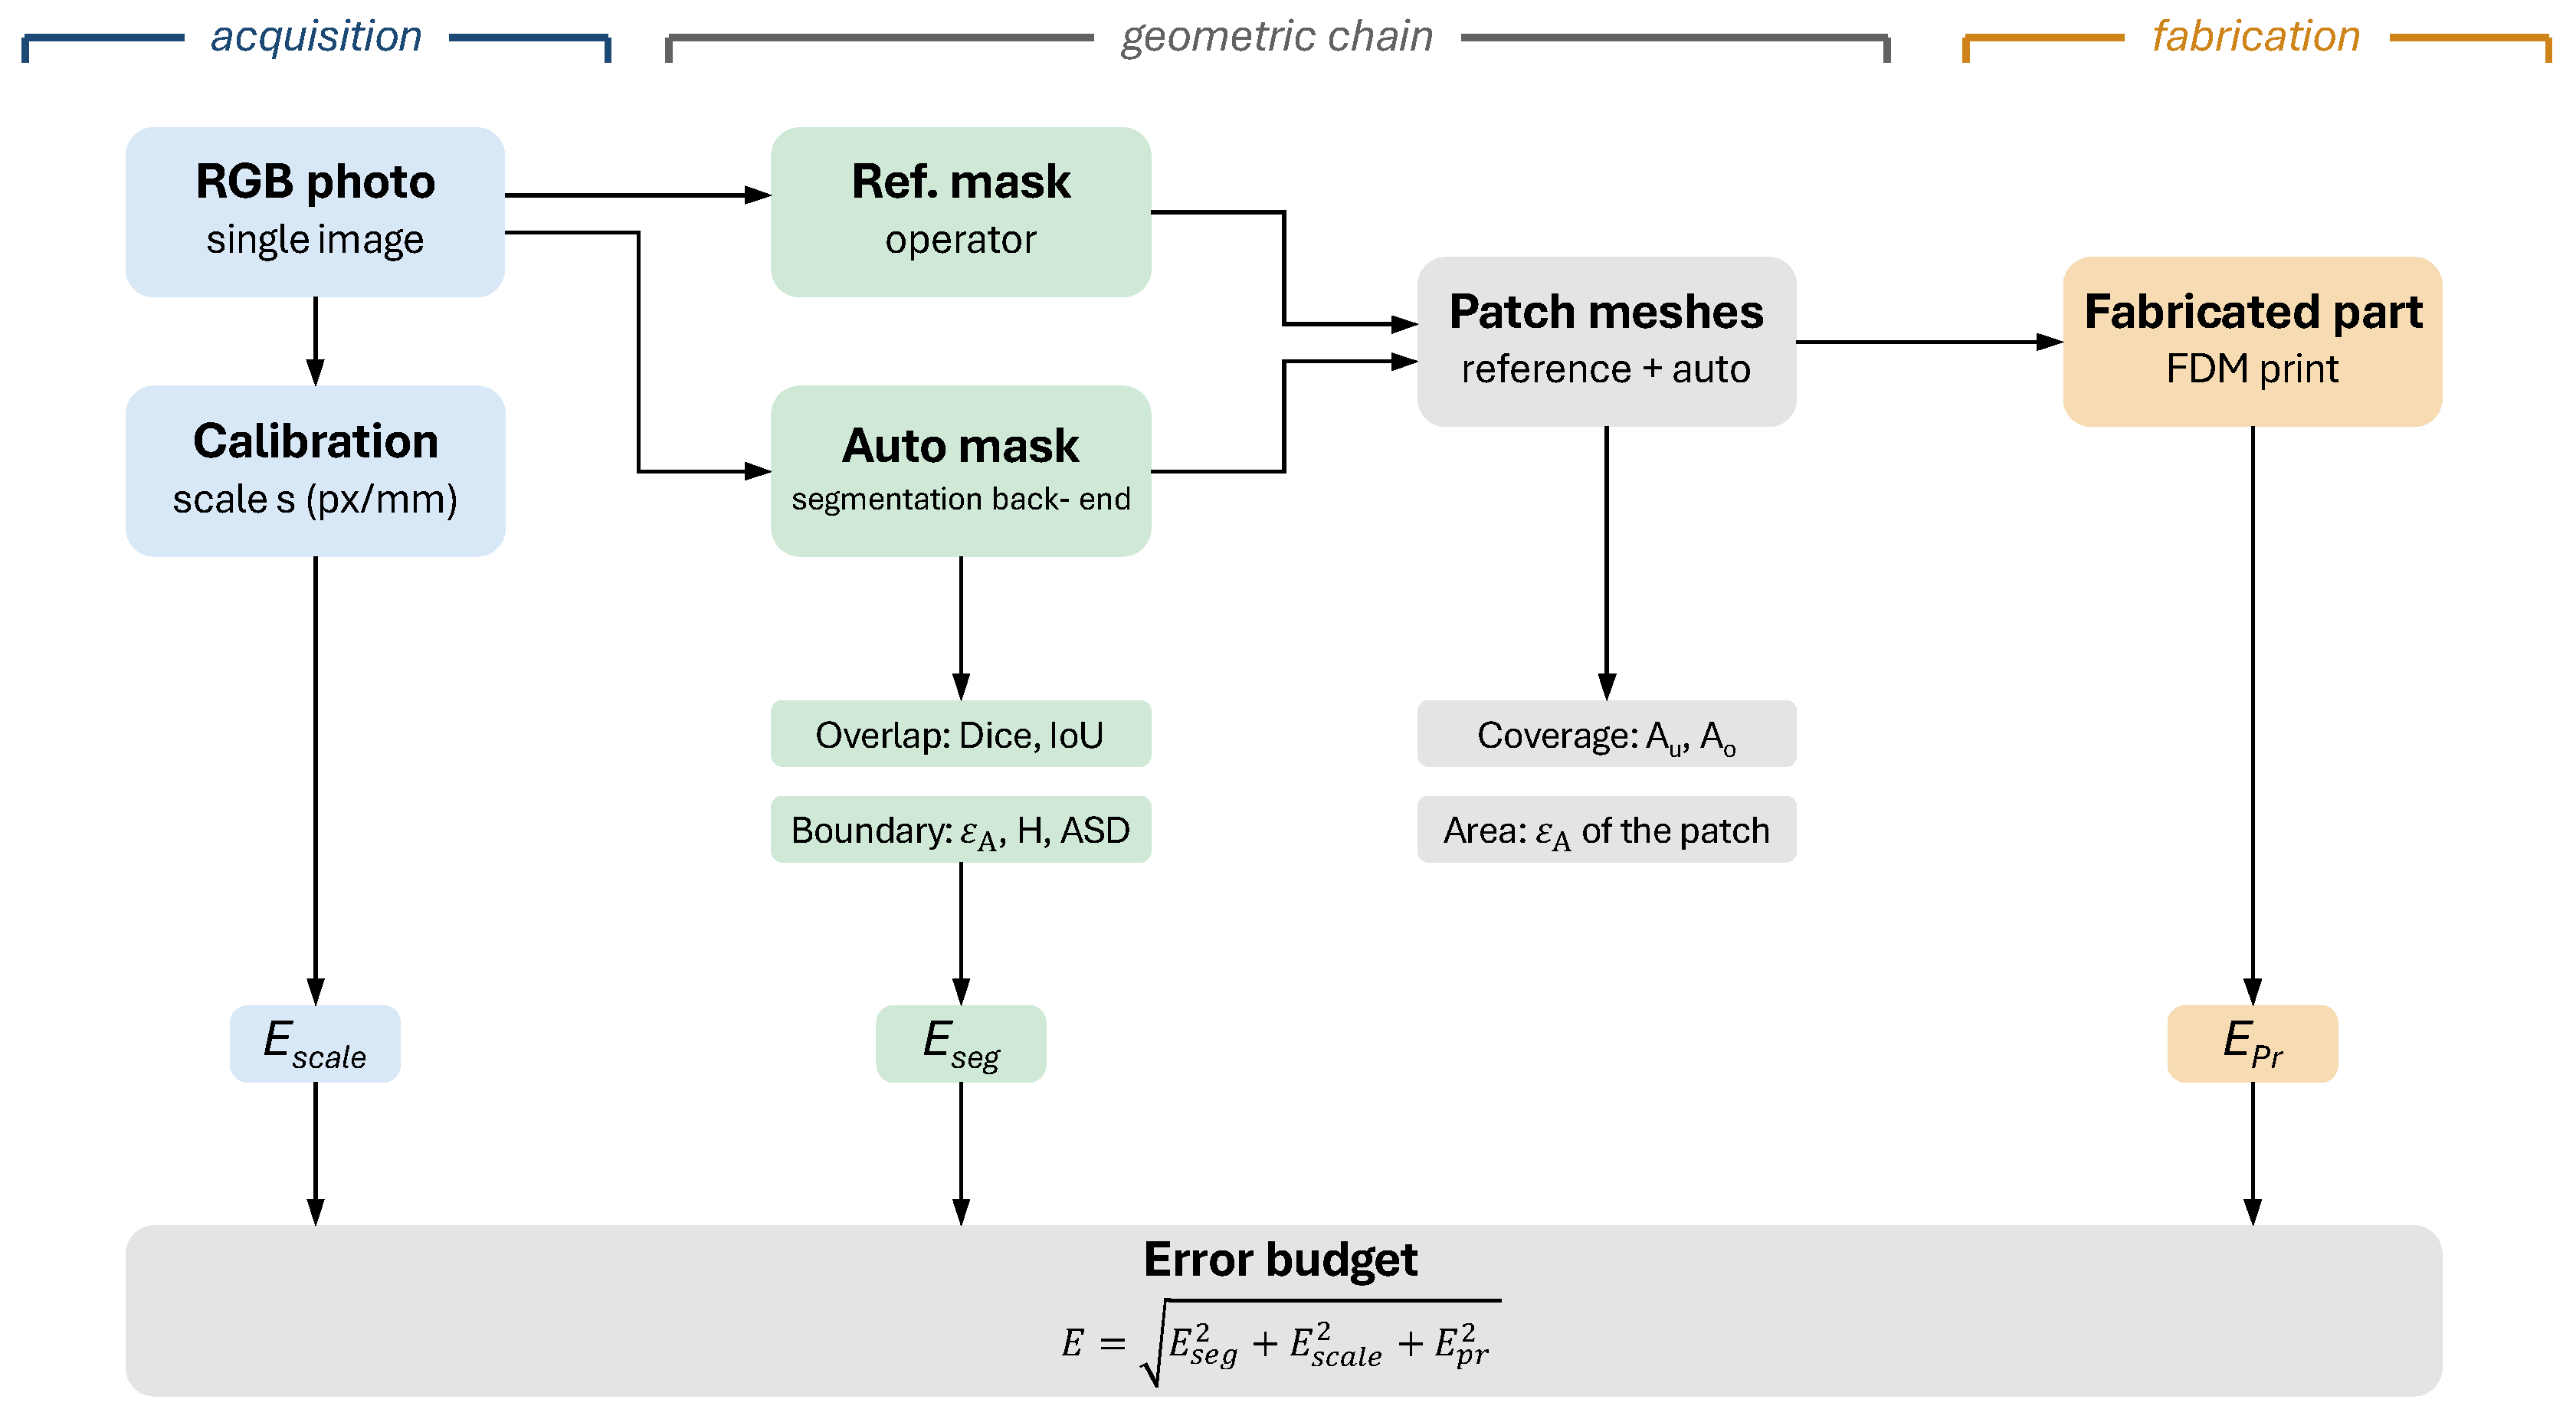
Figure 4.
Software architecture: an HTML/JavaScript front-end and a Python back-end over a Qt WebChannel bridge, with the implemented slots and signals on the bus.
Figure 4.
Software architecture: an HTML/JavaScript front-end and a Python back-end over a Qt WebChannel bridge, with the implemented slots and signals on the bus.
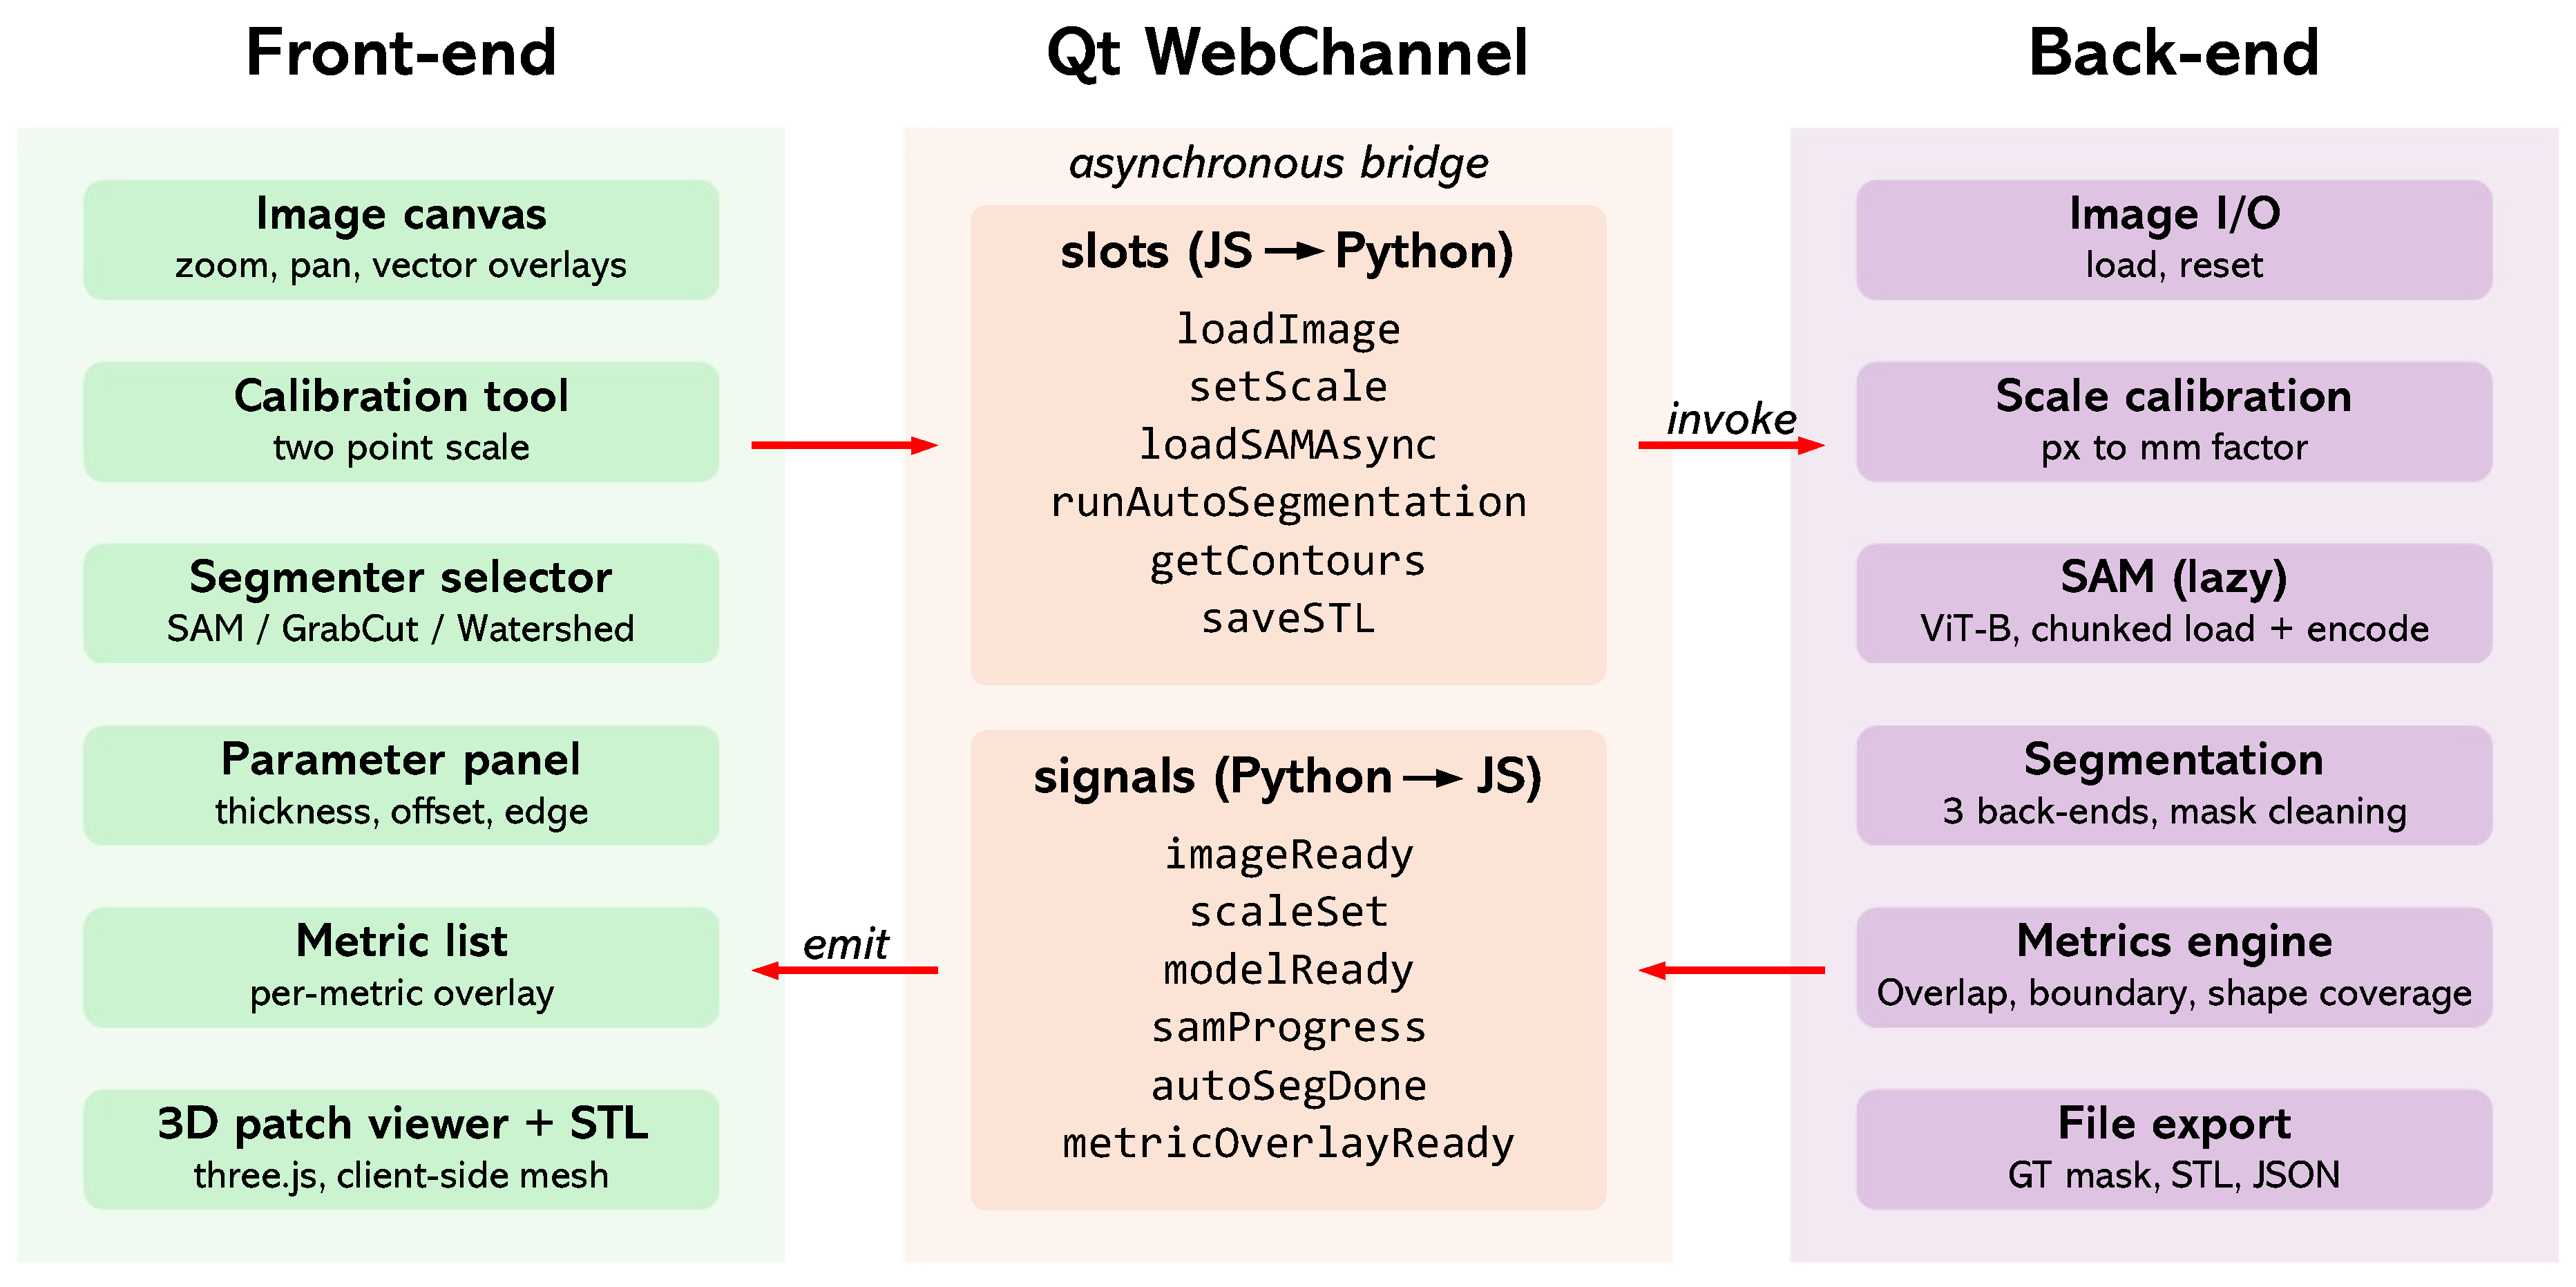
Figure 5.
From pipeline concept to implemented interface. The central row sketches each stage as an interface mock-up, and the screenshots above and below show the corresponding view in the released application (whose window is titled Wound Annotator); the numbers 1 to 6 correspond to the six stages of Figure 1.
Figure 5.
From pipeline concept to implemented interface. The central row sketches each stage as an interface mock-up, and the screenshots above and below show the corresponding view in the released application (whose window is titled Wound Annotator); the numbers 1 to 6 correspond to the six stages of Figure 1.
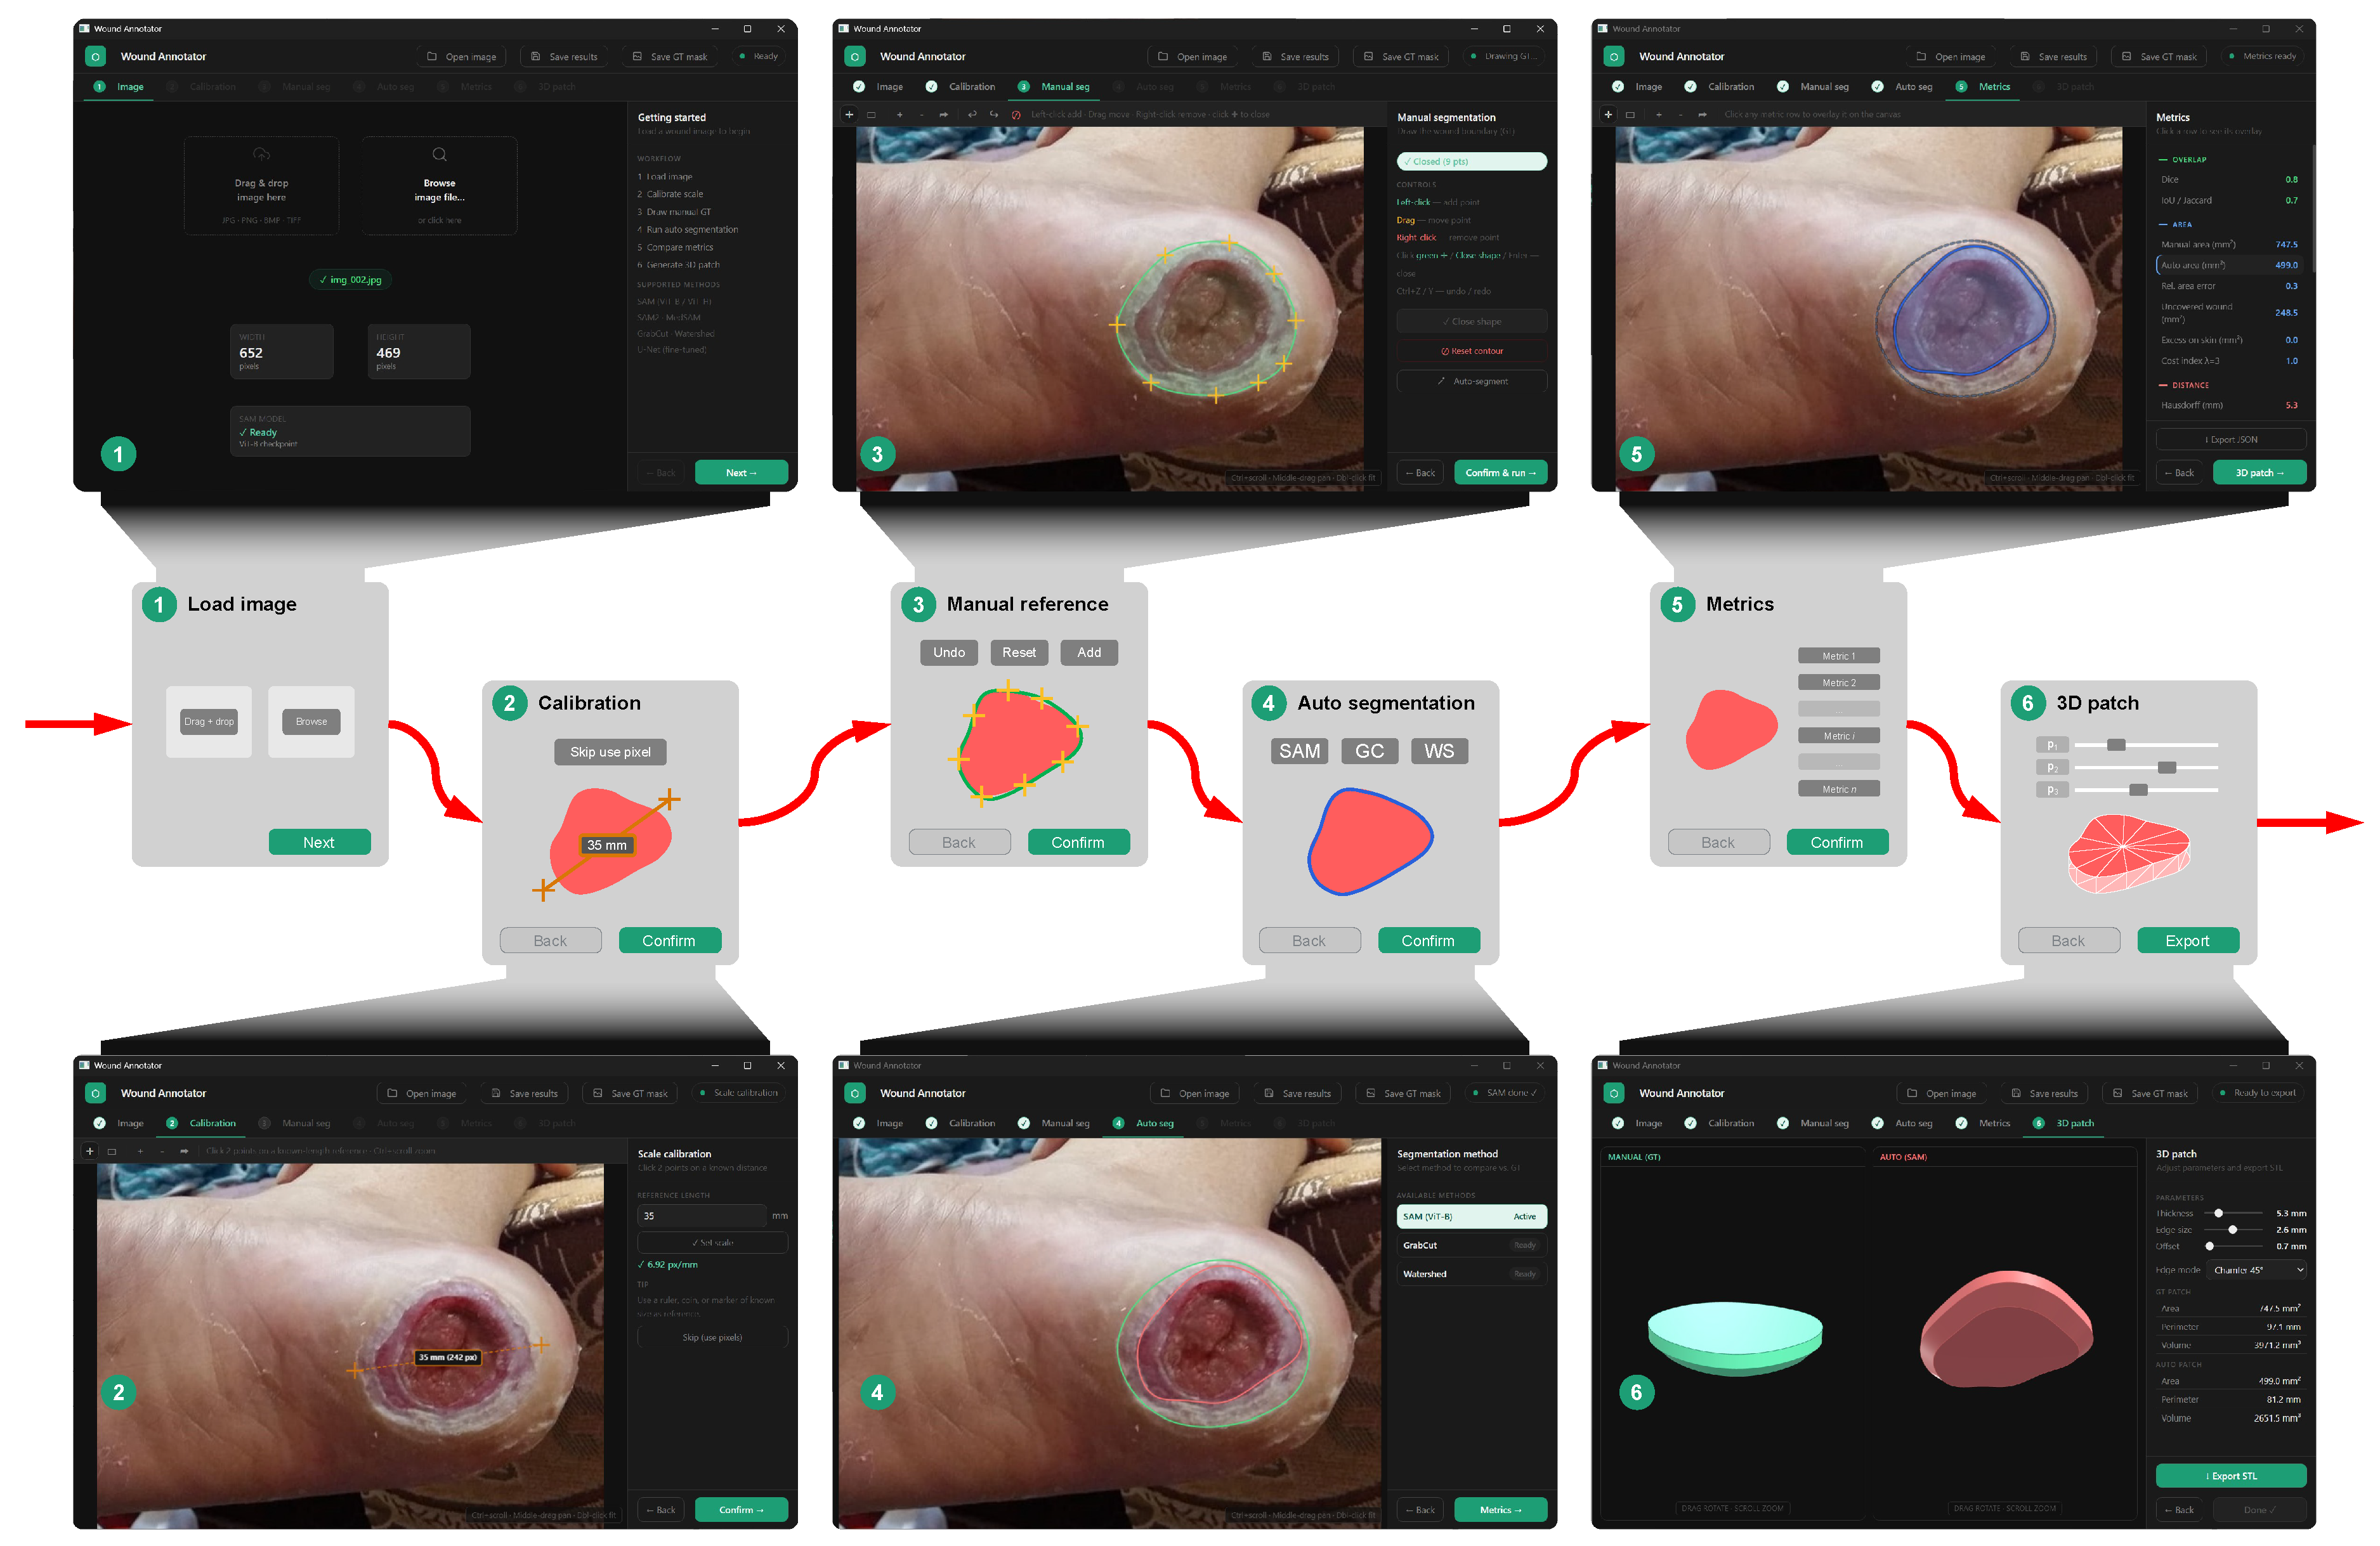
Figure 6.
Per-image Dice, IoU, patch area error and Hausdorff distance per back-end (). Red dots are means; brackets give Bonferroni-adjusted paired Wilcoxon results on the images segmented without outliers by all three back-ends (ns; ** ; *** ; **** ).
Figure 6.
Per-image Dice, IoU, patch area error and Hausdorff distance per back-end (). Red dots are means; brackets give Bonferroni-adjusted paired Wilcoxon results on the images segmented without outliers by all three back-ends (ns; ** ; *** ; **** ).
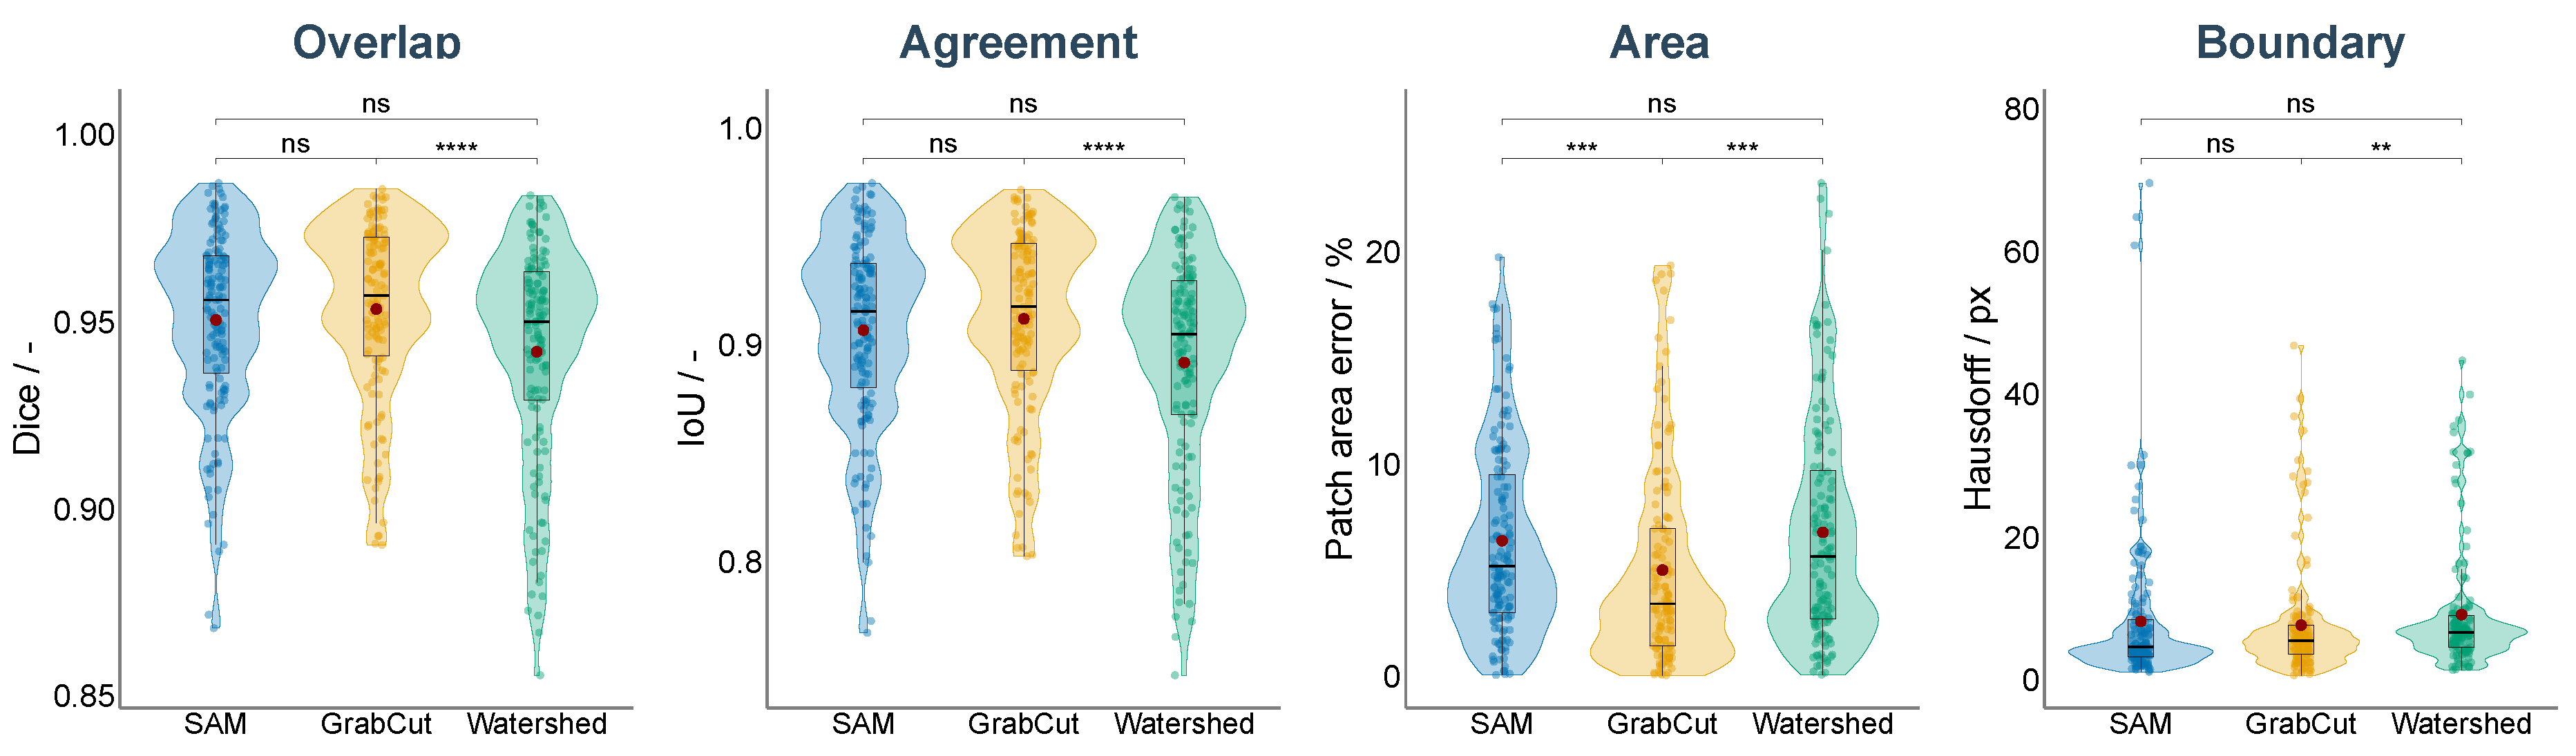
Figure 7.
Nominal CAD geometries of the six phantom shapes, numbered 1 to 6 (disc, ellipse, trefoil, bean, crescent and freeform), with the nominal in-plane size in millimetres.
Figure 7.
Nominal CAD geometries of the six phantom shapes, numbered 1 to 6 (disc, ellipse, trefoil, bean, crescent and freeform), with the nominal in-plane size in millimetres.

Figure 10.
Fabricated-patch area error against Dice per back-end (, 149 and 146 for SAM, GrabCut and watershed; pooled); the curve is a smoothed trend of the error against Dice with its confidence band. The few points above are clipped from the view only.
Figure 10.
Fabricated-patch area error against Dice per back-end (, 149 and 146 for SAM, GrabCut and watershed; pooled); the curve is a smoothed trend of the error against Dice with its confidence band. The few points above are clipped from the view only.
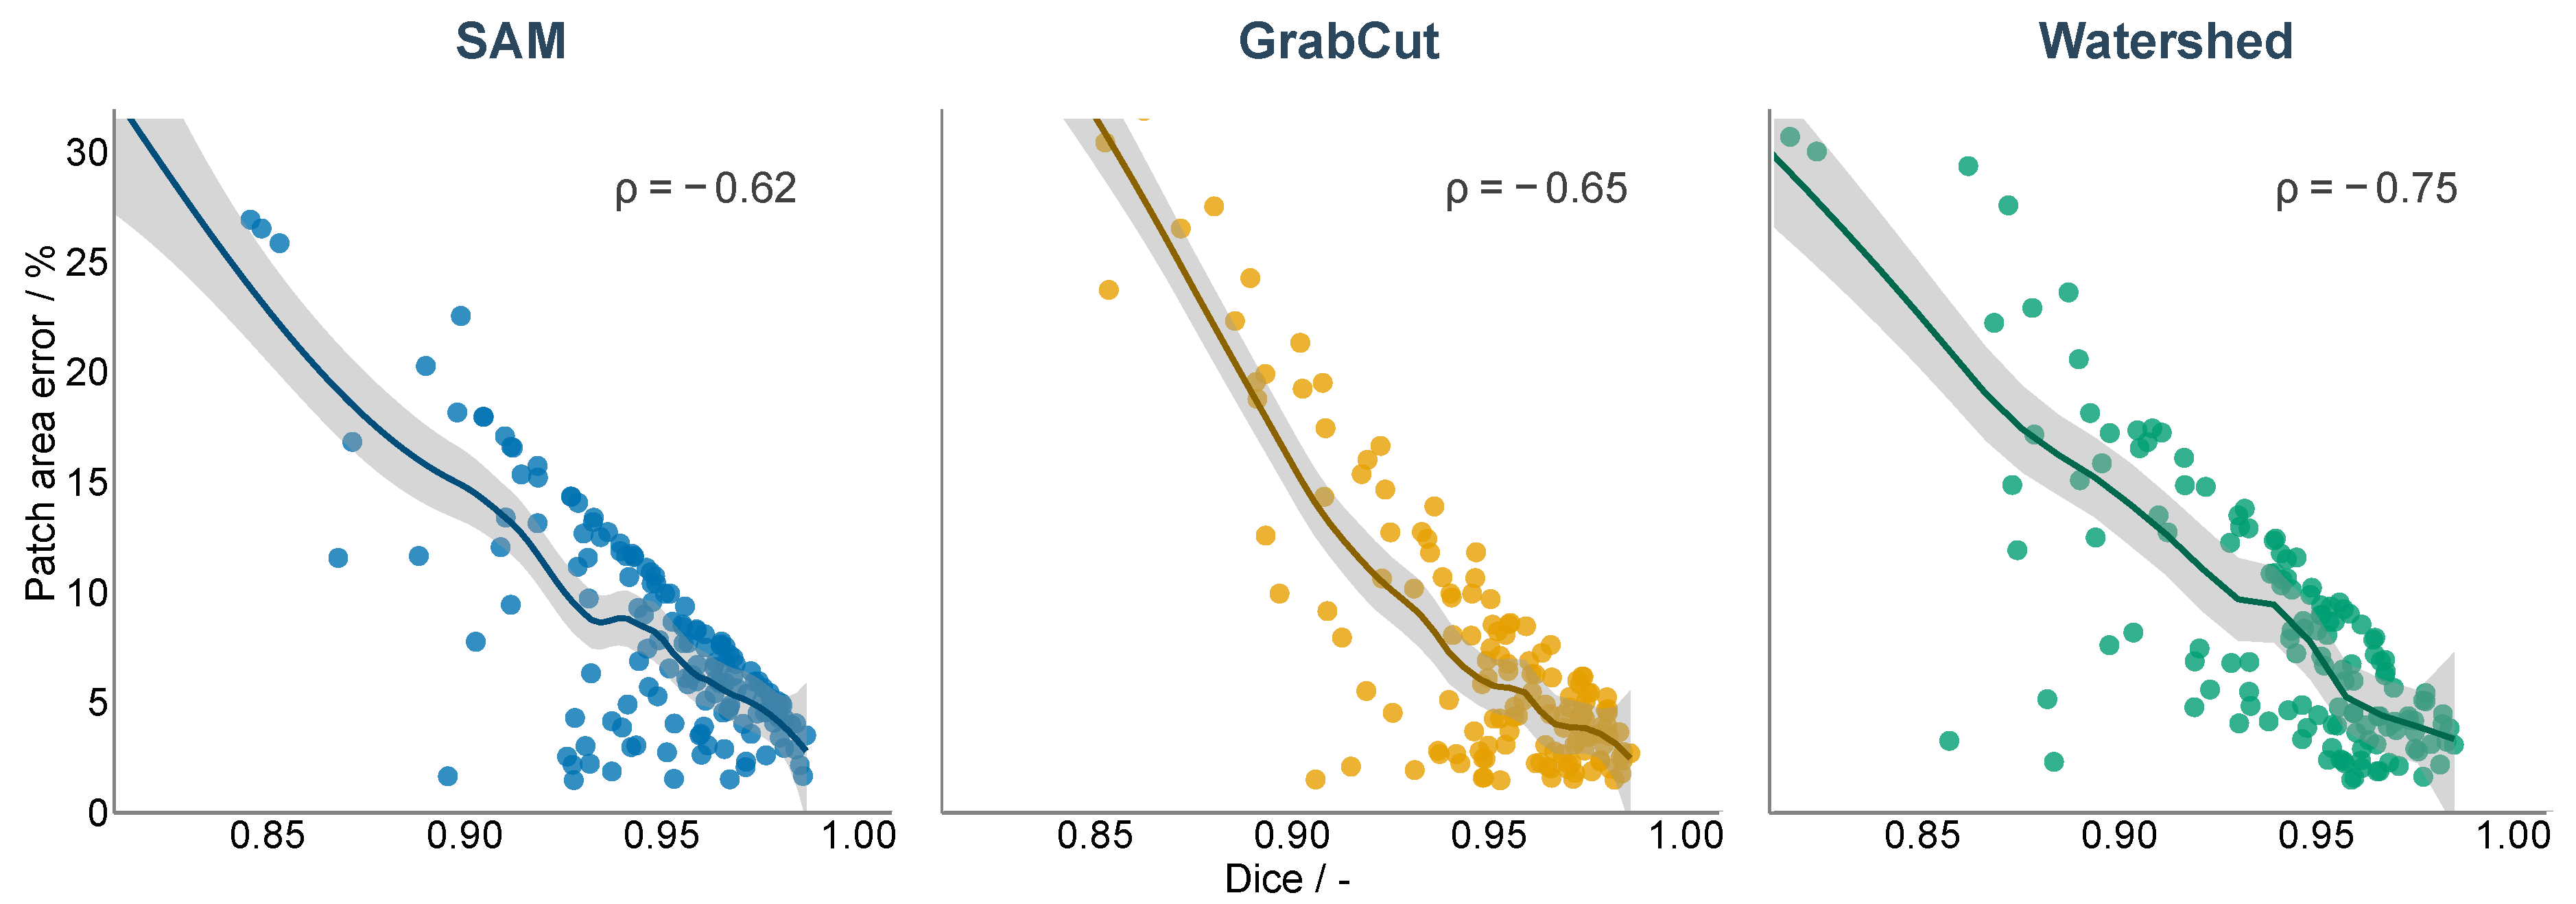
Figure 11.
Under-coverage (exposed wound, ) and over-coverage (excess on healthy skin, ) at zero offset, per back-end, as percentages of the reference area. Red dots are means.
Figure 11.
Under-coverage (exposed wound, ) and over-coverage (excess on healthy skin, ) at zero offset, per back-end, as percentages of the reference area. Red dots are means.
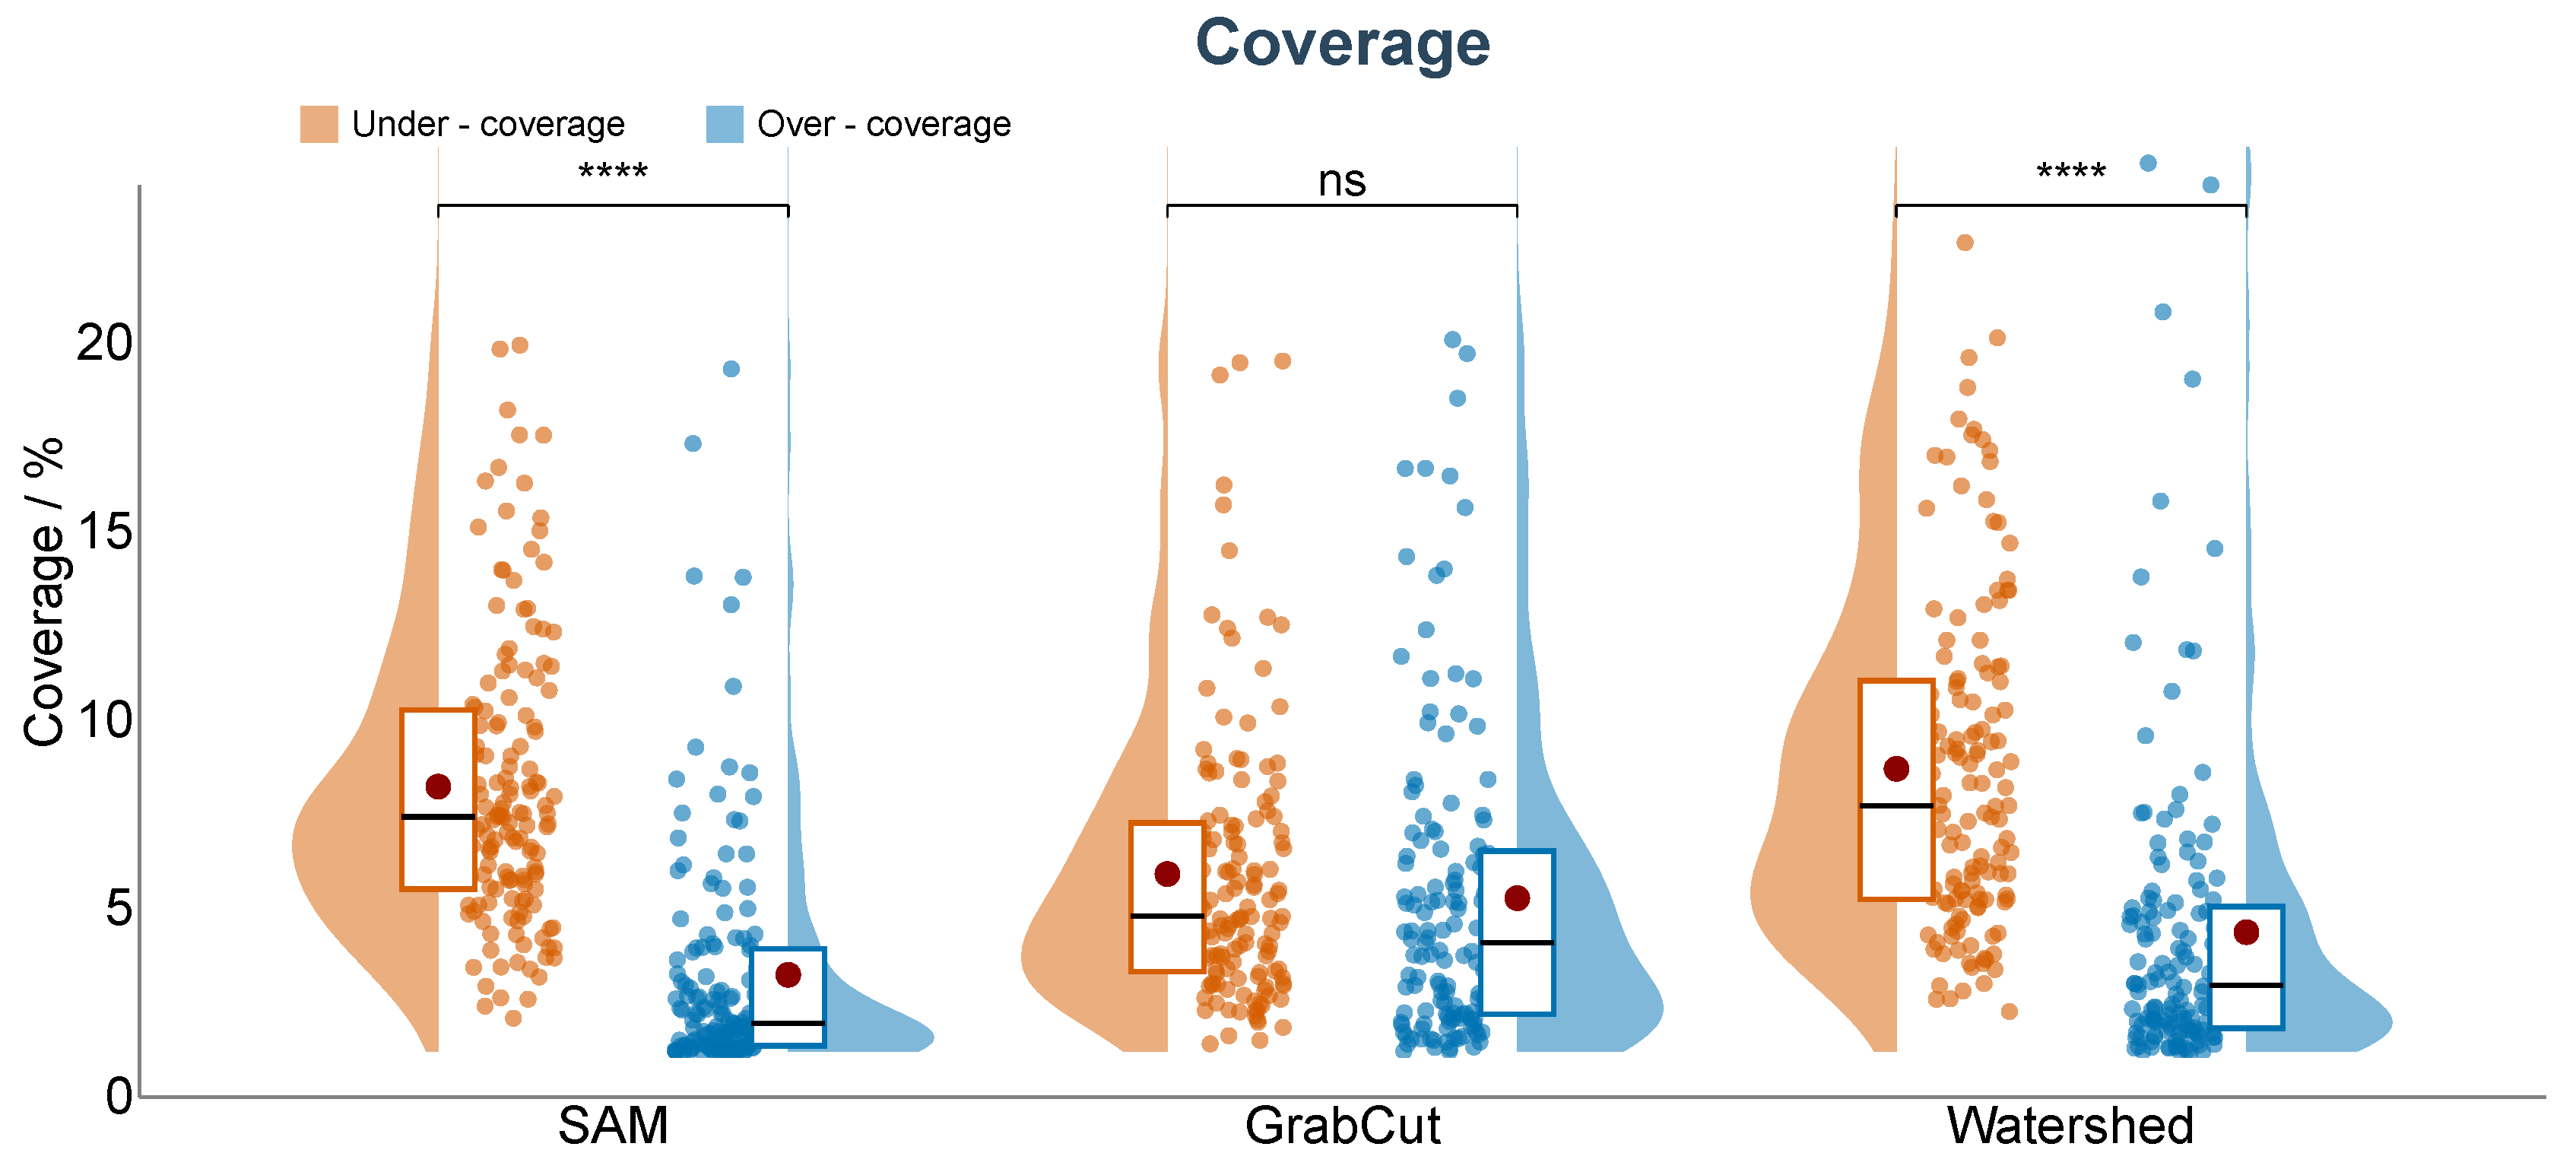
Table 1.
Methods and pipelines relevant to image-based wound geometry, grouped from general-purpose segmentation to fabrication. Among the listed works, only IMTOP reaches a printable patch from a single RGB photograph without depth; it measures the accuracy of the fabricated object on phantoms of known geometry and propagates the segmentation and scale errors to the patch for clinical images. In the Depth column a filled circle (•) marks methods that require a depth sensor or a 3D rig, an open circle (∘) image-only methods.
Table 1.
Methods and pipelines relevant to image-based wound geometry, grouped from general-purpose segmentation to fabrication. Among the listed works, only IMTOP reaches a printable patch from a single RGB photograph without depth; it measures the accuracy of the fabricated object on phantoms of known geometry and propagates the segmentation and scale errors to the patch for clinical images. In the Depth column a filled circle (•) marks methods that require a depth sensor or a 3D rig, an open circle (∘) image-only methods.
| Work | Year | Depth | Output | Validated on |
|---|---|---|---|---|
| General-purpose segmentation | ||||
| Long et al. [28] | 2015 | ∘ | mask | overlap |
| Ronneberger et al. [29] | 2015 | ∘ | mask | overlap |
| Isensee et al. [31] | 2021 | ∘ | mask | overlap |
| Kirillov et al. [34] | 2023 | ∘ | promptable | overlap |
| Ma et al. [35] | 2024 | ∘ | promptable | overlap |
| Wound and DFU segmentation | ||||
| Goyal et al. [11] | 2017 | ∘ | mask | overlap |
| Wang et al. [10] | 2020 | ∘ | mask | overlap |
| Mahbod et al. [30] | 2022 | ∘ | mask | overlap |
| Ramachandram et al. [20] | 2022 | ∘ | tissue | overlap |
| Yap et al. [32] | 2024 | ∘ | mask | overlap |
| Planimetry, mobile and monitoring | ||||
| Yap et al. [19] | 2018 | ∘ | std. image | repeatability |
| Foltynski [14] | 2018 | ∘ | area | clinical area |
| Kim et al. [21] | 2020 | ∘ | healing risk | clinical outcome |
| 3D reconstruction and fabrication | ||||
| Filko et al. [22] | 2021 | • | 3D surface | reconstruction |
| Chae et al. [9] | 2022 | • | patch (print) | 3D surface |
| Filko and Nyarko [23] | 2023 | • | mask + 3D | measurement |
| Cavazzana et al. [24] | 2025 | • | mask + 3D | assessment |
| IMTOP (this work) | 2026 | ∘ | patch (print) | printed phantoms; propagated patch |
Table 2.
Mask-level agreement with the single-operator reference and propagated patch area error on the per-back-end outlier-free subsets (, 135 and 136) of the 149 clinical DFU images (mean ± SD; the subsets differ between back-ends).
Table 2.
Mask-level agreement with the single-operator reference and propagated patch area error on the per-back-end outlier-free subsets (, 135 and 136) of the 149 clinical DFU images (mean ± SD; the subsets differ between back-ends).
| Back-End | n | Dice | IoU | Patch Area Error (%) | Hausdorff (px) |
|---|---|---|---|---|---|
| SAM | 144 | ||||
| GrabCut | 135 | ||||
| Watershed | 136 |
Table 3.
Absolute geometric accuracy on the 18 phantoms (Experiment B) and printing accuracy against the STL (Experiment C).
Table 3.
Absolute geometric accuracy on the 18 phantoms (Experiment B) and printing accuracy against the STL (Experiment C).
| Quantity | Value |
|---|---|
| Regression slope (reconstructed vs. nominal) | |
| Mean dimensional error (Experiment B) | |
| Mean area error (Experiment B) | |
| Mean Dice (Experiment B) | |
| Worst-case minor-axis underestimate (crescent) | |
| Printing in-plane area error (Experiment C) | |
| Printing dimensional error (Experiment C) |
Disclaimer/Publisher’s Note: The statements, opinions and data contained in all publications are solely those of the individual author(s) and contributor(s) and not of MDPI and/or the editor(s). MDPI and/or the editor(s) disclaim responsibility for any injury to people or property resulting from any ideas, methods, instructions or products referred to in the content. |
© 2026 by the authors. Licensee MDPI, Basel, Switzerland. This article is an open access article distributed under the terms and conditions of the Creative Commons Attribution (CC BY) license.
Copyright: This open access article is published under a Creative Commons CC BY 4.0 license, which permit the free download, distribution, and reuse, provided that the author and preprint are cited in any reuse.