

Submitted:
02 September 2026
Posted:
03 September 2026
You are already at the latest version
Abstract
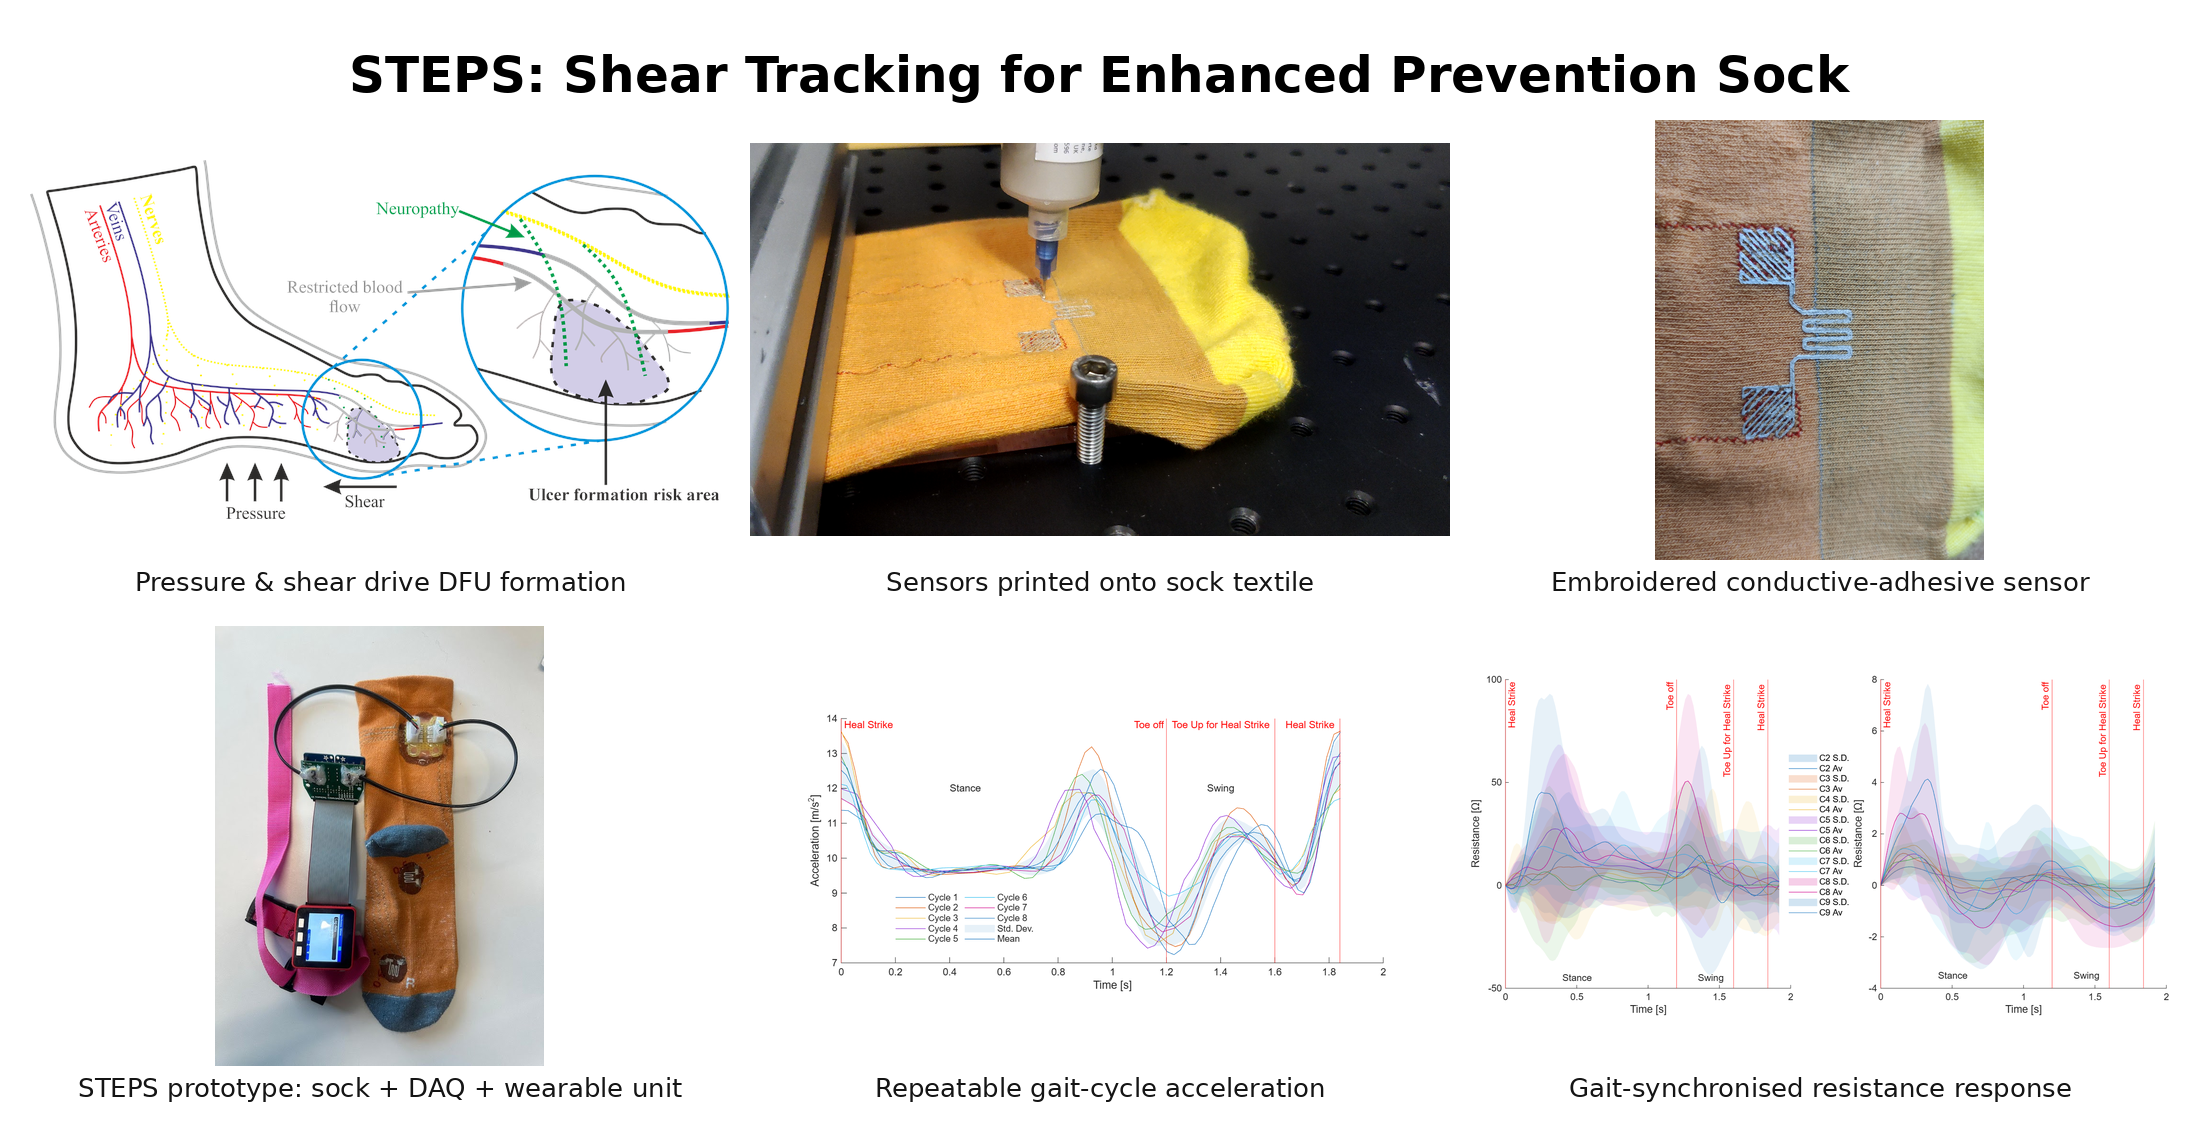
Diabetic Foot Ulcers (DFUs) pose a serious health risk to people with diabetes, with a high risk of recurrence following the first DFU and a risk of foot amputation or death. It greatly impacts patient quality of life and costs the NHS up to 1% of its annual budget. Over the last 20 years, work has highlighted the link between DFU formation and normal forces. More recently, work has highlighted the importance of strain/shear forces, which are inherently coupled with normal forces. While limited lab-based in-shoe systems have been produced to detect shear, they alter the shoe-foot interface and are not commercially available. Additionally, consultation with people with diabetes highlighted that they may not wear shoes around the house, leaving long periods where in-shoe solutions cannot track forces. We, therefore, present the development of a novel plantar shear measuring system, the Shear Tracking for Enhanced Prevention Sock (STEPS), an instrumented garment to provide an accessible tool for people at risk with DFU. Integrating sensors within the sock provides a solution that seamlessly integrates within the foot-shoe environment, is suitable for shoeless use, and helps mitigate adherence issues. A prototype STEPS was produced, successfully integrating printed resistive strain sensors (proxy for shear) within custom-designed socks using conductive embroidery for flexible connectivity. The strain sensor has a low profile (<0.5 mm thickness) and remains unobtrusive. Preliminary testing shows the capacity for strain measurement of 12+%, with a resolution of 0.013 Ω across a 20 Ω range, demonstrating good sensitivity over 90 cycles. Proof-of-concept testing characterised the system’s ability to measure plantar strain. A single-participant pilot study demonstrated that STEPS captures repeatable, gait-synchronised strain signals during walking, with a signal-to-noise ratio exceeding 30 dB and between-repeat correlations of up to R=0.77, supporting its potential to detect strain (as proxy for shear) during daily activity.
Keywords:
diabetic foot ulcer
; shear
; strain
; sensors
; wearables
1. Introduction
Diabetes is a globally prevalent chronic condition, with numbers expected to reach 537 million and 783 million by 2030 and 2045, respectively [1]. Up to 25% of people with diabetes develop diabetic foot ulcers (DFUs), with infected ulcers increasing the risk of amputation [2]. A population cohort study by Walsh et al. identified a mortality rate of 5% within the first 12 months for those with new ulcers [3]. Within three years 60% of people that have had a DFU experience recurrence [2,4]. Furthermore, DFU has a five-year mortality rate estimated at 42% [3,5]. DFUs drastically reduce patient quality of life and cost the UK approximately 10% of the NHS budget£962 million annually [6]. The social cost of DFU is even greater, estimated at up to £13.9 billion in the UK alone [7]. An estimated 450,000 people with diabetes develop a DFU in their lifetime [8]. This patient group is particularly susceptible to changes in shoe environment with tissue structural changes observed due to diabetes [9].
DFUs are the result of foot tissue pathology and its response to external forces. Chronic hyperglycemia in diabetes alters tissue structure [10,11,12], damages blood vessels in the extremities and reduces oxygen supply, and damages nerve endings, causing diabetic peripheral neuropathy [2,13]. These structural and physiological changes increase tissue sensitivity to forces and worsen loading, further exacerbating the condition [14,15].
In diabetic peripheral neuropathy, oxidative stress and inflammation damage nerve endings, causing loss of sensation [16]. Typically prolonged pressure exposure triggers subconscious postural adjustments that relieves discomfort from local tissue ischemia and fatigue [17,18]. Without this feedback, neuropathic patients do not adjust their position with prolonged ischemia that leads to tissue necrosis and formation of DFU (Figure 1).
Structural changes [9] and prolonged exposure to forces normal to the skin has been associated with the formation of pressure ulcers [19,20,21]. Over recent years, research has identified an important role for both normal and shear forces in the formation of DFU [22], as highlighted in a recent systematic review and meta-analysis [23].
The current guidance on the prevention and management of DFUs is based on identifying at-risk patients, assessing the skin for at-risk regions, including checking for broken skin, managing skin moisture [24], and managing nutrition and hydration [7]. Regular offloading removes pressure and shear from vulnerable areas, supporting sufficient blood flow to the region [7,24,25,26]. In some cases, the application of supportive materials such as insoles and orthotics redistribute pressure, with extra attention paid to the bony regions [24]. Although effective methods for preventing DFU formation, they lack any form of feedback other than visual inspections being performed manually. This type of guidance can be provided in clinical settings by trained professionals as standard practice, but ensuring that guidance is followed by patients once they have returned home remains a challenge. Therefore, additional tools are required to further support patients managing their condition in their daily lives. Where regular social care is impractical, wearable technologies may provide solutions.
Measurement of normal forces related to the formation of DFU is a key opportunity for DFU prevention. Currently, one of the most established methods for achieving real-time feedback is the implementation of instrumented insoles or insoles with sensors embedded within them. The technology is well-established sensing methods established in the 1980s [27] released as products such as Novel Pedar [Munich, Germany] in 1986 and TekSCAN F-SCAN [MA, USA] in the early 1990s [27,28]. Since then, products such as the Nurvv Run and SurroSense Rx [Orpyx Medical Technologies Inc., Calgary, Canada] have been released. [29]. It should be noted that Nurvv has since gone into liquidation, highlighting some of the difficulties facing companies developing these products [30].
In the literature, researchers have proposed alternative pressure mapping methods such as multimodal piezo resistive systems using a range of materials [31,32], capacitive sensors [33], and fibre optic systems [34,35]. These methods focus on the pressure perpendicular to the plantar surface. Progress has been made in the detection of shear stress in insoles with proposed methods including, but not limited to, inductive arrays [36,37], hall-effect sensors [38,39], microelectromechanical [40] and capacitive [41]. Alternative clinic-based solutions have been implemented, such as the STAMPS insole, where insole deformation provides a cumulative shear strain measure through Digital Image Correlation (DIC), helping to detect regions of the foot prone to strain [42]. Although helpful in identifying areas of high risk, real-time feedback is required for daily use.
As part of funded research, the authors coordinated patient and public involvement and engagement (PPIE) and clinical engagement sessions to better understand the requirements for fitting DFU-related measurement technology into daily life. The full findings of this research topic were published in Corser et al. [43]. A key challenge to the use of insoles is their inherent limitation to in-shoe tracking. PPIE and clinical engagement identified that patients prefer to remove their shoes for comfort in their homes, despite clinical guidance for fotwear use even in the home. In the case of insoles, this interrupts foot health monitoring. In addition, insoles limit the selection of shoes available to patients due to the required depth and, in many cases, will not be compatible with prescribed orthotics. These two factors directly impact patient therapeutic adherence. Recognising that patients are likely to remove shoes inside, clinicians recommend patients wear socks to protect their feet [43].
In recent years, sensor technology has been developed, and instrumented socks, or "smart socks", have been commercially released. DANU Sports [Dublin, Ireland] and Sensoria [Sensoria Fitness, WA, USA] monitor vertical plantar pressure, focusing primarily on athletic performance. Similar approaches have been implemented with research settings, using various piezo-resistive materials bonded to the plantar surface of the sock [44,45,46,47]; these focused on gait monitoring. The Palarum [OH, USA] uses e-textiles in its fall prevention system, which reports contact with the floor. Other technologies implemented in socks include early warning systems for DFU formation using temperature measurement [48], such as Siren socks (CA, USA) and Milbotix (Bristol, UK). Many factors and physical conditions give rise to DFU formation, including temperature and pressure. to the best of our knowledge, no sock-based system has been designed and developed to detect shear or strain for research or commercial use. Given the importance of shear strain in DFU formation, our research has focused on developing a system capable of measuring plantar shear.
This paper proposes the Shear Tracking for Enhanced Prevention Sock (STEPS). A wearable system to assess DFU risk factors and thus prevent their formation, where the strain is taken as a proxy of the shear on the skin. In Section 2, we describe the development of the design of the wearable system. In Section 3, we evaluate system performance during a proof-of-concept case study. In Section 4, we reflect on system performance and explore areas for further research before highlighting the benefits of our approach compared to systems currently available in Section 5.
2. Materials and Methods
This section sets out the design and system development process used in the production of the STEPS wearable system.
2.1. Design Process
The SOCKSESS project set out to produce a wearable device to prevent DFU formation. The team used a human-centered approach which embraced design thinking and co-design [49]. In parallel to exploratory system conceptual development, the authors participated in a series of PPIE workshops, the key findings of which are: there is a clear appetite for this technology among patient groups; the importance of accessible information related to the formation of DFU and how to act in response to symptoms; the adoption of STEPS would depend on the perceived "burden" of use; and details on what makes a sock comfortable to wear for someone with diabetes (See Section 2.4). The detailed report by Corser et al. is available at [43].
During clinical engagement, podiatrists responded postively to the concept and highlighted a clear need for the technology. The workshop identified essential requirements for the final system, including biocompatibility due to the risk of fissures in feet; a low profile due to the risk of inducing skin damage that might lead to DFU formation due to increased applied pressure and the need for the system to be washable [43]. During engagement, clinicians identified the need for localised measurement of areas with a high risk of DFU formation on the foot (Figure 2), 1) Toe apices (tips of the toe), 2) interphalangeal joints, which cover the metatarsal phalangeal joints, the proximal interphalangeal joints (PIP), and distal interphalangeal joints (DIP). (Toe joints), 3) metatarsal head (toe base), 4) plantar metatarsal (bones behind toes), 5) heel pad, 6) Achilles heel, and 7) malleolus medial (ankle bony prominence). During the discussion, clinicians identified a potential interest in the technology, with particular interest in providing information on regions where tracking is not available through insoles, such as 8) foot dorsum (top of the foot) and 9) toe dorsum (top of the toes). Monitoring dorsal foot strain could help identify the degree to which the shoe laces have been tightened and whether action needs to be taken to change the tightness. The Achilles heel (6) and malleolus (7) of the high-risk regions cannot be tracked using current technologies. In this study, the metatarsal head (3) and heel pad (4) were selected to aid comparison to other technologies. Future development would increase the array size to cover the dorsal surface.
In addition to the biocompatibility, localisation and a low profile, three key principles were selected to guide decision-making during the system development: Technology Readiness To fast-track potential patient impact solutions, we prioritised the implementation of commercially available technology. Production Compatibility To ensure the designed system could be applied to real-world settings, we ensured the final design was compatible with industrial textile production techniques. Scalability In addition to compatibility with textile production, we set out to ensure the overall solution was scalable. By including this during our early stage research, we hope it will aid in reducing the per unit cost and, therefore, the associated "burden" of using STEPS.
2.2. The STEPS Concept
A recent study linked pressure-induced damage with inactivity due to the prolonged exposure experienced, while shear is typyically associated with activity and fit of shoes [50]. Having defined our design approach and user requirements, we set out to design a system capable of detecting shear that could integrate seamlessly within a mass-produced textile structure, in this case a sock. In line with the production-compatibility and scalability requirement set out above, sock production was undertaken on the Sangiacomo Star-D (Santoni SPA, Brescia, Italy), an industrial circular knitting machine representative of the equipment used for commercial-scale sock manufacture. The sensors detecting the applied shear would be read by a data acquisition unit placed at the hem of the socks. The sensors detecting the applied shear would be read by a microprocessor-based data acquisition unit placed at the hem of the socks. In future development, the microprocessor could then be used to determine risk status and transmit this to a mobile communication device or app to notify the patient of the detected conditions (Figure 3).
At this stage, the research focuses on the data acquisition system and wearable development, with future work required to identify the risk status and investigate how this is communicated to the user. As highlighted in our design process, further PPIE will be necessary to identify the format this should take to gain the most benefit for the user. The following section will explore different aspects of the STEPS system in greater detail.
In our earlier work investigating sensor design, we explored various sensing methodologies that could be implemented to detect shear [51]. In line with the requirements set out above, the final design implemented infers shear detection through the proxy of textile (sock) strain. The textile stretches in response to a shear force applied to the sock’s surface. Due to the applied load coupled to the observed shear, it can be expected that the resulting movement would occur in both the textile and the underlying tissue. The assumption is that the strain measured due to shear will be similar for the textile and tissue. Therefore, textile properties are fundamental for STEPS performance.
2.3. Sock Textile Design and Evaluation
The sock substrate of STEPS must meet the needs of people with diabetes at risk of DFU formation. Although a range of products on the market advertise themselves as "diabetic socks", at the time of writing they are not considered medical devices, although a medical benefit is implied by often including the term "diabetic" in the name. They are therefore exempt from regulation by bodies such as the EU MDR or the US FDA. The result is no clear definition of what constitutes a "diabetic sock". A recent systematic review by Venkatraman et al. [52] analysed the current literature and commercially available products. Informed by PPIE work [43], their review and testing, Venkatraman et al. [52] set out technical requirements for a "diabetic sock". The findings of these two studies were reviewed with clinical experts and used to develop the sock design used to produce STEPS.
Sock design improvements include a tapered profile to ensure a close but not tight fit, as people with diabetes identified that they often have swollen lower extremities, where a tight welt (top of the sock) further reduces blood flow and comfort and therefore adherence. The toes and heel cup use terry knit structures for additional comfort, and the welt was enlarged to distribute pressure over a greater area. The knit structure is otherwise homogeneous along the length of the sock, with no banded reinforcement zones.
Because STEPS infers shear from textile strain, the mechanical response of that structure directly conditions sensor output, and any directional dependence in the knit would propagate into the measured signal. Three sample socks underwent destructive mechanical stress-strain tested n a tensile testing machine [Instron 5943, High Wycombe, UK] to understand their strain properties in vertical (along the leg) and horizontal (circumferential) orientations. The Instron 5943 was equipped with 250 N pneumatic jaws [Instron 2712-052] and a 500 N load cell [Instron 2580-500N]. Custom jaw faces were produced to secure the sock samples and remove slip between the jaws. Five samples per sock per orientation were tested in tension to failure (n = 15 per orientation), giving the stress–strain response shown in Figure 4.
The socks were manufactured using commercial production equipment, resulting in a low inter-sample variation. Mean stiffness over the sensor operating range differed by 2.4% between the three socks in the vertical orientation (0.509, 0.497 and 0.500 MPa; one-way ANOVA p = 0.86) and by 10.3% in the horizontal orientation (0.341, 0.368 and 0.332 MPa; p = 0.53), with no statistical difference between socks in either case.
The two orientations, however, are not equivalent. Over the 0–12% strain range accessible to the sensor, the vertical orientation was stiffer than the horizontal (0.502 ± 0.033 MPa versus 0.347 ± 0.049 MPa, a ratio of 1.45; Welch’s t-test p < 0.001), with no overlap between the two distributions (minimum vertical specimen 0.448 MPa, maximum horizontal 0.399 MPa). Expressed as applied load, reaching 12% strain required 0.73 ± 0.05 N vertically compared to 0.49 ± 0.08 N horizontally, a 49% difference. The horizontal orientation exhibited greater variation with a coefficient of variation 14.2% compared to the verticals 6.5%. The knit structure therefore homogeneous in construction but mechanically anisotropic in response.
This has a direct consequence for STEPS: an identical applied shear would produce a different textile strain, and hence a different sensor output, depending on the orientation of the sensor relative to the knit structure. Consequently silicone reinforcement was applied at the sensing sites to impose a defined and repeatable local stiffness region, decoupling sensor response from knit direction and from the specimen-to-specimen variation observed in the more compliant orientation. Additionally the silicone provides protection to the sensor during a wash cycle.
It should be noted that although the socks were stretched to failure, the fabric structure and elasticity lent by the Lycra yarns mean the total extension achieved is far greater than the sensor will experience in use. Failure occurred at 496 ± 32% vertically and 1100 ± 118% horizontally, some 41 and 92 times the sensor’s 12% measurement range, respectively, so the textile is never the strain-limiting element of the system.
2.4. Sensor Design and Manufacture
The sensor design adopts a typical strain gauge format, with six turns and traces of 10 mm. The sensor was 3D printed with conductive silver adhesive [Dycotec DM-SAS-10010, Dycotec Materials Ltd., Calne, UK] and manufactured using a CNC [WorkBee Z1+ CNC, Ooznest, Brentwood, UK], connected to a precision syringe dispenser [Ultimus V High Precision Dispenser, Nordson, Westlake, OH, USA] (Figure 5 a)). Details on the development and characterisation of these sensing elements can be seen in previous work by the authors [51]. This paper focuses on integration of the sensing element into a prototype wearable device, together with evaluation in a proof-of-concept study (Figure 5 b)).
2.5. Electronics and Data Acquisition
Sensor readings were captured through repurposed platinum resistance temperature detectors [MAX31865, Adafruit, NY, USA] which provide resistance measurement at a resolution of 0.013 for ranges of 0 and 438 .
To bridge the gap between the sensor and the data acquisition unit at the socks welt, several methods were investigated, including: silver ink traces, embroidered conductive yarns, and ceramic-coated copper. Ceramic-coated copper wires were used during early prototyping and for the proof-of-concept. Although this does not meet our requirements for removing ridges from the device, we have focused on healthy participant training at this stage. The RTD chip enables paired connectivity so that the resistance of the linking wire can be measured and accounted for, in resistance readings (Figure 5.c) R1 and R2), accounting for the conductivity changes observed between the copper wire and the conductive yarns.
Activities of daily living typically exhibit a frequency of 0.5 to 2 Hz [53], with peak motion shown to reach 10 Hz [54]. Nyquist theory dictates that a sampling frequency of sufficiently samples a signal. Therefore, tracking human motion is typically above 100 Hz to account for faster movements. Given that our application relates to DFU-prone people with diabetes, it is unlikely that they will achieve movements at 10 Hz. Natively, the MAX31856 runs at ; however, code optimisation achieved a sampling frequency of 40 Hz for the two-sensor configuration used in the case study reported in Section 3. Future system development will investigate custom measurement amplifier setups that support higher sampling rates. The DAQ unit is connected to a microcontroller [Core3, M5Stack Technology Co. Ltd, Shenzhen, China], which provides data logging and a user interface (Figure 5.c). The microcontroller has an inertial measurement unit (IMU) which was used to collect acceleration data. Synced with sensor data collection, the acceleration data supports the identification of gait cycles and the interpretation of the sensor response.
Sensor resistance was not converted to a physical strain value in this study. Bench characterisation of the sensing element [51] indicated that the resistance-strain response is sensor-specific rather than following a single generalisable relationship. A per-sensor calibration is further complicated by the resistance drift reported in [51] where it was identified to be caused by micro-fractures. As the sensor’s resistance-strain relationship shifts as it drifts, a calibration curve established prior to use cannot be assumed to remain valid over the sensor’s service life.
In this proof-of-concept development stage, breakout boards were implemented. A custom PCB provided a compact connection between the DAQ unit and the microcontroller. Future work will investigate miniaturisation to reduce the unit’s dimensions, weight, and inertial properties to improve user comfort.
In electronics, a common challenge is the transition from flexible to rigid structures. In this instance, from the wire termination point at the welt to the data acquisition unit. Currently, there are limited connectors available for textile-electronics interfaces, therefore the authors designed their own. A few factors are ensuring user comfort and minimal rubbing or sharp edges, as this could damage the user’s skin. Therefore, the authors opted to avoid adhesives that would cause the textile to stiffen. A custom PCB was designed that aligned with the termination points of the embroidered yarn (Figure 5.d). Small quantities of the same Dycotec adhesive [DM-SAS-10010, Dycotec Materials Ltd., Calne, UK] used for the sensors was used to provide a flexible coupling between PCB and embroidered trace. Over such short distances the silver adhesive provides excellent connectivity with minimal resistance. Silicone [Ecoflex 30-00, Smoothon Inc., Macungie, PA, USA] was poured over the connector to provide mechanical reinforcement (Figure 5.e), a matrix of through holes on the PCB aided silicone ingress to ensure a secure connection.
On the basis of the PPIE feedback, the ability to wash the system was identified as a key factor of long-term usability. STEPS was designed for disassembly to facilitate the removal of components incompatiable with the typical wash cycle. In this case, all components above the welt connector (Figure 5.e)
3. Case Study
A single-participant proof-of-concept case study of wearing teh STEPS sock was conducted to evaluate the ability of STEPS to measure strain during gait.
3.1. Methods
The case study undertaken for this article received approval from the Ethics Review Committee of the Faculty of Engineering and Physical Sciences of the University of Leeds under EPS FREC 2025-2201-3414. Eligibility criteria included being years old, capable of walking without assistance and having not been diagnosed with diabetes or any other foot health condition. Participants completed a screening questionaire prior to acceptance into the study. As a proof-of-concept study, a single participant was recruited, common practice in the development of wearable systems. The participant was a 188 cm male in their 30s with a BMI of 29.7, size 12 feet and no underlying medical conditions. The participant received a custom STEPS prototype sock and a corresponding non-sensing sock, both properly sized to fit their foot. The participant completed a series of ten gait cycles on a flat walkway at a self-selected pace, starting with the STEPS foot, repeated over ten repetitions. Resistance was sampled from two independently sited sensor channels (Sensor 1 and Sensor 2) at 40 Hz, with triaxial acceleration from the microcontroller’s onboard IMU collected in sync with STEPS sensor output to aid in the identification of gait cycle stages. A brief standing period was included between repeats to establish an inactive baseline for drift correction.
The STEPS sensor data were low-pass filtered (4th-order Butterworth, = 5 Hz). The magnitude of acceleration data was analysed to identify gait markers (e.g. heel-strike) and segment each repetition into individual gait cycles; the first and last cycles of each repetition were discarded, leaving eight steady-state cycles per repetition (80 cycles per sensor in total). In each repeat, a standing baseline was subtracted to correct for sensor drift before cycles were time-normalised to 100 points to allow direct comparison.
3.2. Results
The acceleration magnitude showed strong repeat-to-repeat consistency (between-repeat SD = 6.6% of range, mean correlation R = 0.91, moving-window correlation R = 0.71) - consistent with the expected reliability of a mass-produced IMU and supporting its use as a stable reference for gait-cycle segmentation throughout this analysis (Figure 6).
Sensor 1 produced a larger strain response per gait cycle (62.8 ± 43.0 ) than Sensor 2 (4.10 ± 3.46 ). Sensors 1 and 2 functioned over a signal range of 213.6 and 26.2 respectively (Figure 7). The standard deviation was 5.91 for Sensor 1 and 0.35 for Sensor 2, against overall dynamic ranges of 213.6 and 26.2 , respectively. When normalised by range, this equates to 2.8% and 1.3% respectively. The high standard deviation relative to the mean for both sensors reflects the natural cycle-to-cycle variability inherent to overground walking rather than a fixed, repeatable amplitude. The higher absolute noise observed for Sensor 1 reflects its substantially larger dynamic range rather than a difference in measurement quality (Table 1).
Consistent with the dynamic drift previously reported for the sensor during bench-top cyclic loading [51], both sensors exhibited an upward drift in baseline resistance over the course of ten repeats (Figure 7). Sensor 1 drifted by 1.59 /repeat (62.1% of its initial baseline, = 0.55), while Sensor 2 drifted by 0.75 /repeat (153.3% of its initial baseline, = 0.98). Although the proportional drift for Sensor 2 is larger, its smaller absolute baseline means this remains a modest 6.4 change, spanning 2.5% of the DAQ’s 0–430 measurable range, compared with 8.2% for Sensor 1. Extrapolating the linear drift trend, Sensor 1 and Sensor 2 would not be expected to saturate the data acquisition chip’s measurable range for a further 247 and 562 gait cycles, respectively - broadly consistent with, albeit lower than, the 2275 (±562) cycle service life estimated for the bench-characterised sensor [51]. The comparatively poor linear fit for Sensor 1 ( = 0.55, compared with 0.98 for Sensor 2) suggests its drift behaviour during gait is less predictable than under controlled loading, so this saturation estimate should be treated as indicative rather than precise.
Sensitivity is determined for each sensor as the peak-to-peak resistance change within each gait cycle i (Equation 1).
reported in Table 1 as the mean and standard deviation throughout all N = 80 gait cycles (8 cycles × 10 repetitions).
For Sensor 1, the 5.91 noise floor is 9.4% of the 62.8 mean per-cycle response; for Sensor 2, the 0.35 noise floor is 8.4% of the 4.10 mean per-cycle response. In both cases the noise floor is roughly an order of magnitude smaller than the typical per-cycle strain response, indicating that individual strain events are resolvable above the noise floor for both sensors.
Cycle-to-cycle (within-repeat) variability exceeded repeat-to-repeat (between-repeat) variability for both sensors, corresponding to 72.6% vs. 26.0% of Sensor 1’s dynamic range, and 41.0% vs. 27.7% of Sensor 2’s dynamic range (Figure 8. Indicating that both sensors reproduce a consistent response throughout the ten repetitions performed, Sensor 2 showing the stronger repeat-to-repeat consistency (mean pairwise correlation R = 0.77, moving-window correlation R = 0.67) compared to Sensor 1 (R = 0.39 and R = 0.21, respectively). The moving-window correlation, which assesses repeatability at each point of the normalised gait cycle rather than as a single whole-cycle value, followed the same pattern, suggesting Sensor 1’s reduced repeatability is distributed across the gait cycle rather than localised to a specific phase (e.g. heel-strike or toe-off).
Comparing the two sensor channels directly, resistance responses showed negligible correlation (R = 0.002, RMSE = 23.0 , bias = 8.10 , 95% limits of agreement −34.1 to +50.3 ). This is expected given the two channels correspond to independent sensor sites on the sock and demonstrates that each channel captures a distinct, location-specific loading pattern during gait. In the absence of an independent calibrated reference standard as set out in Section 2.5 (e.g. a load cell), this comparison reflects inter-sensor consistency rather than absolute measurement accuracy; establishing traceable accuracy against a reference remains a priority for future calibration work.
4. Discussion
This proof-of-concept case study demonstrates that the STEPS prototype can measure repeatable gait induced strain (via resistance change) through two independently sited resistive sensors integrated within a sock. For both channels, the noise floor was small relative to the typical per-cycle strain response (9.4% and 8.4% of the mean cycle amplitude for Sensor 1 and Sensor 2, respectively), and both showed repeatability within the gait-cycle. It is noted that there has been a reduction in repeatability in the transition from bench top testing to wearable integration [51]. This reduction in repeatability, particularly for Sensor 1 (mean between-repeat correlation R = 0.39, compared with = 0.98 for Sensor 2’s drift trend), likely reflects the additional variability inherent to overground gait relative to a single-axis bench loading regime, including natural intra-stride variation, donning effects, and the coupling of shear with normal load and skin-textile friction that cannot be isolated on the bench. Given the challenges of flexible sensing and the in-shoe environment, this is to be expected and the reduction in repeatability is deemed acceptable at this stage of development.
In the literature, the magnitudes of plantar shear stress during gait range from approximately 18 to 158 kPa depending on the measurement site and population [23], with higher values associated with a history of DFU (135.3±60.6 kPa) compared to diabetic neuropathy alone (86.4±30.3 kPa) [55]. Comparable in-shoe wearable shear sensors have reported peak shear stresses of 66.5–152.6 kPa (anteroposterior) and 28.4–128 kPa (mediolateral) during walking [56]. A direct quantitative comparison with the resistance changes reported here is not yet possible, as resistance has not been converted to a calibrated strain or stress value (Section 2.5).
Reflecting on the three guiding principles (readiness, production compatibility and scalability) set out in Section 2, the case study supports technology readiness: built from commercially available components, the system successfully collected strain data outside the bench setting used in prior characterisation [51]. Production compatibility and scalability are not directly assessed by this single-participant proof-of-concept. The influence of textile performance on sensor output (Section 2) requires characterisation to support future calibration work ahead of longer-duration wear trials.
It should be emphasised that strain, as measured here, is not itself the direct cause of DFU formation; rather, it is used as a proxy for the shear component of the coupled normal-shear loading regime implicated in ulcer formation [22,23]. The results presented demonstrate that STEPS can resolve gait-induced strain events, supporting its use as a shear proxy, but do not on their own establish a link to the normal (pressure) component also relevant to DFU risk; combined shear and pressure sensing remains a target for future development.
Several issues specific to the application in diabetic foot assessment warrant discussion in light of the results presented. First, the sustained upward drift observed here, 1.59 and 0.75 per repeat for Sensor 1 and Sensor 2, consuming 8.2% and 2.5% of the DAQ’s usable range within just ten repeats, is consistent with bench testing [51]. Additional materials development is required for reliable long-term deployment and prior to callibration work, particularly given that people with diabetes may wear STEPS for considerably longer and more variable periods than tested here. Calibration routines may need to accommodate site-specific or non-linear drift behaviour.
Second, differences in foot shape: the negligible correlation observed between the two sensor channels (R = 0.002) indicates that each captures an independent, site-specific loading signature during gait. While desirable for the localisation goals of STEPS, this also implies that sensor response cannot be assumed to generalise across sock locations, or, by extension, across the atypical foot shapes and deformities (e.g. claw foot) common in the target patient group [14]. This suggests that a baseline specific to each individual is likely necessary rather than using a single global calibration applied across users.
Several areas of future work have been identified from this proof-of-concept evaluation. Foremost, the single-participant test reported here should be extended to the full multi-participant case study. Ongoing work investigating the optimisation of textile-based connectivity through embroidery or inline knitting by an industrial knitting machine will need to be implemented in future work before deployment with any at-risk populations.
Given the observed micro-fracture-linked drift behaviour [51], establishing a robust calibration approach, potentially incorporating drift compensation or periodic recalibration, remains a priority for future work. In parallel material development is required to address the micro-fractures, increasing the sensor lifespan. Establishing measurement accuracy against an independent calibrated reference standard (e.g. a load cell) is also required, since the present validation could only assess consistency between the two sensor channels rather than absolute accuracy. Longer-duration wear studies, beyond the ten repetitions reported here, are needed to validate the projected sensor lifespan under continuous daily use and to characterise drift and saturation behaviour over realistic wear periods.
Data acquisition miniaturisation will reduce wearable, weight, and inertial impact on user comfort, alongside further development of textile-based connectivity to replace the ceramic-coated copper wiring used in this proof of concept, and evaluation of the durability of silver-ink-based traces through repeated washing cycles. The terry-loop sections incorporated into the sock design will be evaluated for their potential to mechanically buffer sensor regions without compromising strain transmission. Further PPIE work is required to define the format of patient-facing feedback and risk communication.
5. Conclusion
This paper presents the development and proof-of-concept evaluation of STEPS, a strain-sensing sock for the prevention of diabetic foot ulcers. Building on the sensor characterised in previous bench work [51], the sensor was successfully integrated into the wearable device comprising a bespoke knitted sock, embroidered connectivity, and a data acquisition system. A single-participant proof-of-concept test demonstrated that the resulting prototype can capture repeatable, gait-synchronised strain signals from two independently sited sensor channels on the bottom of the foot, with a noise floor below 10% of the typical per-cycle strain response for both sensors and between-repeat correlations of up to R = 0.77. Baseline drift was present but remained modest relative to the data acquisition system’s measurable range, spanning 2.5–8.2% of the available range over ten repeats, giving an estimated 247–562 gait cycles before recalibration would be required based on the observed trend. The two sensor channels showed negligible correlation with one another, confirming that each captures an independent, location-specific loading signature, a key requirement for the localisation goals of STEPS. Together, these results represent a promising first step toward a wearable system capable of continuous, out-of-shoe plantar shear monitoring, meeting the technology-readiness principle set out for this work while highlighting the calibration, wear, and validation work still required ahead of clinical deployment.
Author Contributions
Conceptualisation, N.D.R., K.B., I.Y., and P.C.; methodology, R.P.T. and P.C.; software, R.P.T.; validation, R.P.T., R.M, F.S.; formal analysis, R.P.T.; investigation, R.P.T., R.M, F.S.; resources, J.C., G.O., and P.D.V.; data curation, R.P.T. and P.C.; writing—original draft preparation, R.P.T.; writing—review and editing, R.P.T., R.M, F.S., J.C., I.Y., G.O., P.D.V., K.B., N.D.R., and P.C.; visualisation, R.P.T.; supervision, N.D.R., K.B., I.Y., and P.C.; funding acquisition, N.D.R., K.B., I.Y., and P.C. All authors have read and agreed to the published version of the manuscript.
Funding
This research was funded by EPSRC grant number EP/X001059/1, Digital Health: ‘SOCKSESS’—Smart Sensing Socks For Monitoring Diabetic Feet And Preventing Ulceration.
Institutional Review Board Statement
The study was conducted in accordance with the Declaration of Helsinki, and approved by the University of Leeds Faculty of Engineering and Physical Sciences Ethics Committee (protocol code EPS FREC-2025-2201-3414 on 26th March 2025)
Informed Consent Statement
Informed consent was obtained from all subjects involved in the study.
Data Availability Statement
The original data presented in the study are openly available at INSERT URL.
Acknowledgments
The authors would like to thank James Roscoe, Technician at Manchester Fashion Institute, Man. Met. University for his support in textile production. This study was supported by the National Institute for Health and Care Research ARC Wessex. The views expressed in this publication are those of the author(s) and not necessarily those of the National Institute for Health and Care Research or the Department of Health and Social Care.
Conflicts of Interest
The authors declare no conflicts of interest. The funders had no role in the design of the study; in the collection, analyses, or interpretation of data; in the writing of the manuscript; or in the decision to publish the results.
Abbreviations
The following abbreviations are used in this manuscript:
| DAQ | Data Acquisition |
| DFU | Diabetic Foot Ulcer |
| DIC | Digital Image Correlation |
| DIP | Distal Interphalangeal Joint |
| FDA | Food and Drug Administration |
| IMU | Inertial Measurement Unit |
| MDR | Medical Device Regulation |
| NHS | National Health Service |
| PCB | Printed Circuit Board |
| PIP | Proximal Interphalangeal Joint |
| PPIE | Patient and Public Involvement and Engagement |
| RMSE | Root Mean Square Error |
| SD | Standard Deviation |
| STEPS | Shear Tracking for Enhanced Prevention Sock |
References
- Magliano, D.; Boyko, E.J. IDF diabetes atlas, 10th edition ed.; International Diabetes Federation: Brussels, 2021. [Google Scholar]
- Tresierra-Ayala, M.A.; García Rojas, A. Association between peripheral arterial disease and diabetic foot ulcers in patients with diabetes mellitus type 2. Med. Univ. 2017, 19, 123–126. [Google Scholar] [CrossRef]
- Walsh, J.W.; Hoffstad, O.J.; Sullivan, M.O.; Margolis, D.J. Association of diabetic foot ulcer and death in a population-based cohort from the United Kingdom. Diabet. Med. 2016, 33, 1493–1498. [Google Scholar] [CrossRef] [PubMed]
- Dubský, M.; Jirkovská, A.; Bem, R.; Fejfarová, V.; Skibová, J.; Schaper, N.C.; Lipsky, B.A. Risk factors for recurrence of diabetic foot ulcers: prospective follow-up analysis in the Eurodiale subgroup. International Wound Journal tex.copyright: © 2012 The Authors. International Wound Journal © 2012. 2013, 10, 555–561. [Google Scholar] [CrossRef] [PubMed]
- Everett, E.; Mathioudakis, N. Update on management of diabetic foot ulcers. Ann. N. Y. Acad. Sci. 2018, 1411, 153–165. Available online: https://onlinelibrary.wiley.com/doi/pdf/10.1111/nyas.13569. [CrossRef] [PubMed]
- Kerr, M.; Barron, E.; Chadwick, P.; Evans, T.; Kong, W.M.; Rayman, G.; Sutton-Smith, M.; Todd, G.; Young, B.; Jeffcoate, W.J. The cost of diabetic foot ulcers and amputations to the National Health Service in England. Diabetic Medicine 2019, 36, 995–1002. [Google Scholar] [CrossRef] [PubMed]
- Wounds. Best practice recommendations for the implementation of a DFU treatment pathway. In Technical report; 2018, Wounds UK: London.
- Mackenzie, Paul. North West Coast Strategic Clinical Network: Diabetes Footcare Pathway Blueprint (2017); Technical report; NHS Englabd, 2017. [Google Scholar]
- White, S.; McCullough, M.B.A.; Akangah, P.M. The Structural Effects of Diabetes on Soft Tissues: A Systematic Review. Crit. Rev. Biomed. Eng. 2021, 49, 11–27. [Google Scholar] [CrossRef] [PubMed]
- Huijberts, M.S.P.; Schaper, N.C.; Schalkwijk, C.G. Advanced glycation end products and diabetic foot disease. Diabetes/Metabolism Res. Rev. 2008, 24 Suppl 1, S19–24. [Google Scholar] [CrossRef] [PubMed]
- Wang, Q.; Markopoulos, P.; Yu, B.; Chen, W.; Timmermans, A. Interactive wearable systems for upper body rehabilitation: A systematic review. J. Neuroeng. Rehabil. 2017, 14, 1–21. [Google Scholar] [CrossRef] [PubMed]
- Deng, H.; Li, B.; Shen, Q.; Zhang, C.; Kuang, L.; Chen, R.; Wang, S.; Ma, Z.; Li, G. Mechanisms of diabetic foot ulceration: A review. J. Diabetes 2023, 15, 299–312. [Google Scholar] [CrossRef] [PubMed]
- Strand, N.; Anderson, M.A.; Attanti, S.; Gill, B.; Wie, C.; Dawodu, A.; Pagan-Rosado, R.; Harbell, M.W.; Maloney, J.A. Diabetic Neuropathy: Pathophysiology Review. Curr. Pain Headache Rep. 2024, 28, 481–487. [Google Scholar] [CrossRef] [PubMed]
- Zhou, J.; Xu, B.; Chen, W. Influence of hallux valgus deformity on forefoot pressure distribution of Chinese diabetic patients. Int. J. Diabetes Dev. Ctries. 2015, 35, 129–134. [Google Scholar] [CrossRef]
- Armstrong, D.G.; Boulton, A.J.M.; Bus, S.A. Diabetic Foot Ulcers and Their Recurrence. N. Engl. J. Med. 2017, 376, 2367–2375. [Google Scholar] [CrossRef] [PubMed]
- Hicks, C.W.; Selvin, E. Epidemiology of Peripheral Neuropathy and Lower Extremity Disease in Diabetes. Curr. Diabetes Rep. 2019, 19, 86. [Google Scholar] [CrossRef] [PubMed]
- Duarte, M.; Zatsiorsky, V.M. Patterns of Center of Pressure Migration during Prolonged Unconstrained Standing. Mot. Control 1999, 3, 12–27. [Google Scholar] [CrossRef] [PubMed]
- Ringheim, I.; Austein, H.; Indahl, A.; Roeleveld, K. Postural strategy and trunk muscle activation during prolonged standing in chronic low back pain patients. Gait Posture 2015, 42, 584–589. [Google Scholar] [CrossRef] [PubMed]
- Veves, A.; Murray, H.J.; Young, M.J.; Boulton, A.J.M. The risk of foot ulceration in diabetic patients with high foot pressure: a prospective study. Diabetologia 1992, 35, 660–663. [Google Scholar] [CrossRef] [PubMed]
- Chatwin, K.E.; Abbott, C.A.; Boulton, A.J.; Bowling, F.L.; Reeves, N.D. The role of foot pressure measurement in the prediction and prevention of diabetic foot ulceration—A comprehensive review. Diabetes/Metabolism Res. Rev. 2019, 36, e3258. [Google Scholar] [CrossRef] [PubMed]
- Luger, E.; Nissan, M.; Karpf, A.; Steinberg, E.; Dekel, S. Dynamic Pressures on the Diabetic Foot. Foot Ankle Int. 2001, 22, 715–719. [Google Scholar] [CrossRef] [PubMed]
- Perry, J.E.; Hall, J.O.; Davis, B.L. Simultaneous measurement of plantar pressure and shear forces in diabetic individuals. Gait Posture 2002, 15, 101–107. [Google Scholar] [CrossRef] [PubMed]
- Jones, A.D.; De Siqueira, J.; Nixon, J.E.; Siddle, H.J.; Culmer, P.R.; Russell, D.A. Plantar shear stress in the diabetic foot: A systematic review and meta-analysis. Diabet. Med. 2022, 39, e14661. [Google Scholar] [CrossRef] [PubMed]
- Booth, S.; Chadwick, P.; Cooper, R.; Kingsley, A.; Ousey, K.; Tickle, J.; White, R. Consensus Document: Management of hyperkeratosis in the lower limb. In Technical report; 2015, Wounds UK: London.
- EPUAP; NPIAP; PPPIA. Prevention and Treatment of Pressure Ulcers/Injuries: Clinical Practise Guidelines; Technical report; 2019. [Google Scholar]
- NICE. Pressure ulcers: Prevention and management. Technical report 2019. [Google Scholar] [CrossRef] [PubMed]
- Pitei, D.L.; Ison, K.; Edmonds, M.E.; Lord, M. Time-dependent behaviour of a force-sensitive resistor plantar pressure measurement insole. In Proceedings of the Institution of Mechanical Engineers, Part H: Journal of Engineering in Medicine; 1996; Volume 210, pp. 121–125. ISBN 0954-4119. [Google Scholar] [CrossRef] [PubMed]
- Hsiao, H.; Guan, J.; Weatherly, M. Accuracy and precision of two in-shoe pressure measurement systems. Ergonomics 2002, 45, 537–555. [Google Scholar] [CrossRef] [PubMed]
- Orpyx Medical Technolgies Inc. Orpyx SI® Sensory Insole.
- Companies House. NURVV LIMITED insolvency - Find and update company information - GOV.UK. 2023. [Google Scholar] [PubMed]
- McKnight, M.; Tabor, J.; Agcayazi, T.; Fleming, A.; Ghosh, T.K.; Huang, H.; Bozkurt, A. Fully Textile Insole Seam-Line for Multimodal Sensor Mapping. IEEE Sens. J. Conf. Name IEEE Sens. J. 2020, 20, 10145–10153. [Google Scholar] [CrossRef]
- Tan, Y.; Ivanov, K.; Mei, Z.; Li, H.; Li, H.; Lubich, L.; Wang, C.; Wang, L. A Soft Wearable and Fully-Textile Piezoresistive Sensor for Plantar Pressure Capturing. Micromachines 2021, 12, 110, Number: 2. [Google Scholar] [CrossRef] [PubMed]
- Aqueveque, P.; Osorio, R.; Pastene, F.; Saavedra, F.; Pino, E. Capacitive Sensors Array for Plantar Pressure Measurement Insole fabricated with Flexible PCB. In Proceedings of the 2018 40th Annual International Conference of the IEEE Engineering in Medicine and Biology Society (EMBC), Honolulu, HI, USA, 2018; pp. 4393–4396. [Google Scholar] [CrossRef] [PubMed]
- Guignier, C.; Camillieri, B.; Schmid, M.; Rossi, R.M.; Bueno, M.A. E-Knitted Textile with Polymer Optical Fibers for Friction and Pressure Monitoring in Socks. Sensors 2019, 19, 3011. [Google Scholar] [CrossRef] [PubMed]
- Leal-Junior, A.G.; Frizera, A.; Avellar, L.M.; Marques, C.; Pontes, M.J. Polymer Optical Fiber for In-Shoe Monitoring of Ground Reaction Forces During the Gait. IEEE Sens. J. Conference Name: IEEE Sensors Journal. 2018, 18, 2362–2368. [Google Scholar] [CrossRef]
- Du, L.; Zhu, X.; Zhe, J. An Inductive Sensor for Real-Time Measurement of Plantar Normal and Shear Forces Distribution. IEEE Trans. Biomed. Eng. Conf. Name IEEE Trans. Biomed. Eng. 2015, 62, 1316–1323. [Google Scholar] [CrossRef] [PubMed]
- Wang, L.; Jones, D.; Chapman, G.J.; Siddle, H.J.; Russell, D.A.; Alazmani, A.; Culmer, P. Design of a Digital Triaxial Force Sensor for Plantar Load Measurements. In Proceedings of the 2019 IEEE SENSORS, Montreal, QC, Canada, 2019; pp. 1–4. [Google Scholar] [CrossRef]
- Lord, M.; Hosein, R. A study of in-shoe plantar shear in patients with diabetic neuropathy. Clin. Biomech. 2000, 15, 278–283. [Google Scholar] [CrossRef] [PubMed]
- Mori, T.; Hamatani, M.; Noguchi, H.; Oe, M.; Sanada, H. Insole-Type Simultaneous Measurement System of Plantar Pressure and Shear Force During Gait for Diabetic Patients. J. Robot. Mechatron. 2012, 24, 766–772. [Google Scholar] [CrossRef]
- Amemiya, A.; Noguchi, H.; Oe, M.; Takehara, K.; Ohashi, Y.; Suzuki, R.; Yamauchi, T.; Kadowaki, T.; Sanada, H.; Mori, T. Factors Associated with Callus Formation in the Plantar Region through Gait Measurement in Patients with Diabetic Neuropathy: An Observational Case-Control Study. Sensors 2020, 20, 4863, Number: 17. [Google Scholar] [CrossRef] [PubMed]
- Tang, J.; Bader, D.L.; Moser, D.; Parker, D.J.; Forghany, S.; Nester, C.J.; Jiang, L. A Wearable Insole System to Measure Plantar Pressure and Shear for People with Diabetes. Sensors 2023, 23, 3126, Number: 6. [Google Scholar] [CrossRef] [PubMed]
- Jones, Alexander D.; Crossland, Sarah R.; Nixon, Jane E.; Siddle, Heidi J.; Russell, David A.; Culmer, Peter R. STrain Analysis and Mapping of the Plantar Surface (STAMPS) - A novel technique of plantar load analysis during gait Data Set. 2023. [Google Scholar] [CrossRef] [PubMed]
- Corser, J.; Yoldi, I.; Reeves, N.D.; Culmer, P.; Venkatraman, P.D.; Orlando, G.; Turnbull, R.P.; Boakes, P.; Woodin, E.; Lightup, R.; et al. Developing a Smart Sensing Sock to Prevent Diabetic Foot Ulcers: Qualitative Focus Group and Interview Study. J. Particip. Med. 2025, 17, e59608, tex.copyright: All rights reserved. [Google Scholar] [CrossRef] [PubMed]
- Oks, A.; Katashev, A.; Eizentals, P.; Rozenstoka, S.; Suna, D. Smart socks: new effective method of gait monitoring for systems with limited number of plantar sensors. Health Technol. 2020, 10, 853–860. [Google Scholar] [CrossRef]
- Eizentals, P.; Katashev, A.; Oks, A.; Pavare, Z. DAid pressure socks system: Performance evaluation. Gait Posture 2021, 84, 368–376. [Google Scholar] [CrossRef] [PubMed]
- Amitrano, F.; Coccia, A.; Ricciardi, C.; Donisi, L.; Cesarelli, G.; Capodaglio, E.M.; D’Addio, G. Design and Validation of an E-Textile-Based Wearable Sock for Remote Gait and Postural Assessment. Sensors 2020, 20, 6691, Number: 22. [Google Scholar] [CrossRef] [PubMed]
- Lin, X.; Seet, B.C. Battery-Free Smart Sock for Abnormal Relative Plantar Pressure Monitoring. IEEE Trans. Biomed. Circuits Syst. 2017, 11, 464–473. [Google Scholar] [CrossRef] [PubMed]
- Najafi, B.; Reeves, N.D.; Armstrong, D.G. Leveraging smart technologies to improve the management of diabetic foot ulcers and extend ulcer-free days in remission. Diabetes/Metabolism Research and Reviews 2020, 36, e3239. [Google Scholar] [CrossRef] [PubMed]
- Vargas, C.; Whelan, J.; Brimblecombe, J.; Allender, S. Co-creation, co-design, co-production for public health – a perspective on definition and distinctions. Public Health Res. Pract. 2022, 32. [Google Scholar] [CrossRef] [PubMed]
- Bus, S.A.; Armstrong, D.G.; Crews, R.T.; Gooday, C.; Jarl, G.; Kirketerp-Moller, K.; Viswanathan, V.; Lazzarini, P.A. Guidelines on offloading foot ulcers in persons with diabetes (IWGDF 2023 update). Diabetes/Metabolism Res. Rev. 2024, 40, e3647. [Google Scholar] [CrossRef] [PubMed]
- Turnbull, R.P.; Corser, J.; Orlando, G.; Venkatraman, P.; Yoldi, I.; Bradbury, K.; Reeves, N.D.; Culmer, P. Development of a Body-Worn Textile-Based Strain Sensor: Application to Diabetic Foot Assessment. Sensors 2025, 2025, 2057. [Google Scholar] [CrossRef]
- Venkatraman, P.D.; Orlando, G.; Culmer, P.R.; Turnbull, R.P.; Bradbury, K.; Yoldi, I.; Corser, J.; Russell, D.A.; Boulton, A.J.M.; Reeves, N.D. Diabetic Socks: A Systematic Review of the Literature and Commercially Available Products. Diabetes/Metabolism Res. Rev. 2026, 42, e70138. [Google Scholar] [CrossRef] [PubMed]
- Oberg, T.; Karsznia, A.; Oberg, K. Basic gait parameters: reference data for normal subjects, 10-79 years of age. J. Rehabil. Res. Dev. arXiv: Thesis/Parasitic Fauna. 1993, 30, 210–23. [Google Scholar] [CrossRef]
- Hamill, J.; Derrick, T.R.; Holt, K.G. Shock attenuation and stride frequency during running. Hum. Mov. Sci. 1995, 14, 45–60. [Google Scholar] [CrossRef]
- Yavuz, M.; Ersen, A.; Hartos, J.; Schwarz, B.; Garrett, A.G.; Lavery, L.A.; Wukich, D.K.; Adams, L.S. Plantar Shear Stress in Individuals With a History of Diabetic Foot Ulcer: An Emerging Predictive Marker for Foot Ulceration. Diabetes Care 2017, 40, e14–e15. [Google Scholar] [CrossRef] [PubMed]
- Haron, A.H.; Li, L.; Shuang, J.; Lin, C.; Dawes, H.; Mansoubi, M.; Crosby, D.; Massey, G.; Reeves, N.; Bowling, F.; et al. In-shoe plantar shear stress sensor design, calibration and evaluation for the diabetic foot. PLoS ONE 2024, 19, e0309514. [Google Scholar] [CrossRef] [PubMed]
Figure 1.
Demonstration of the conditions that lead to diabetic foot ulcer formation.
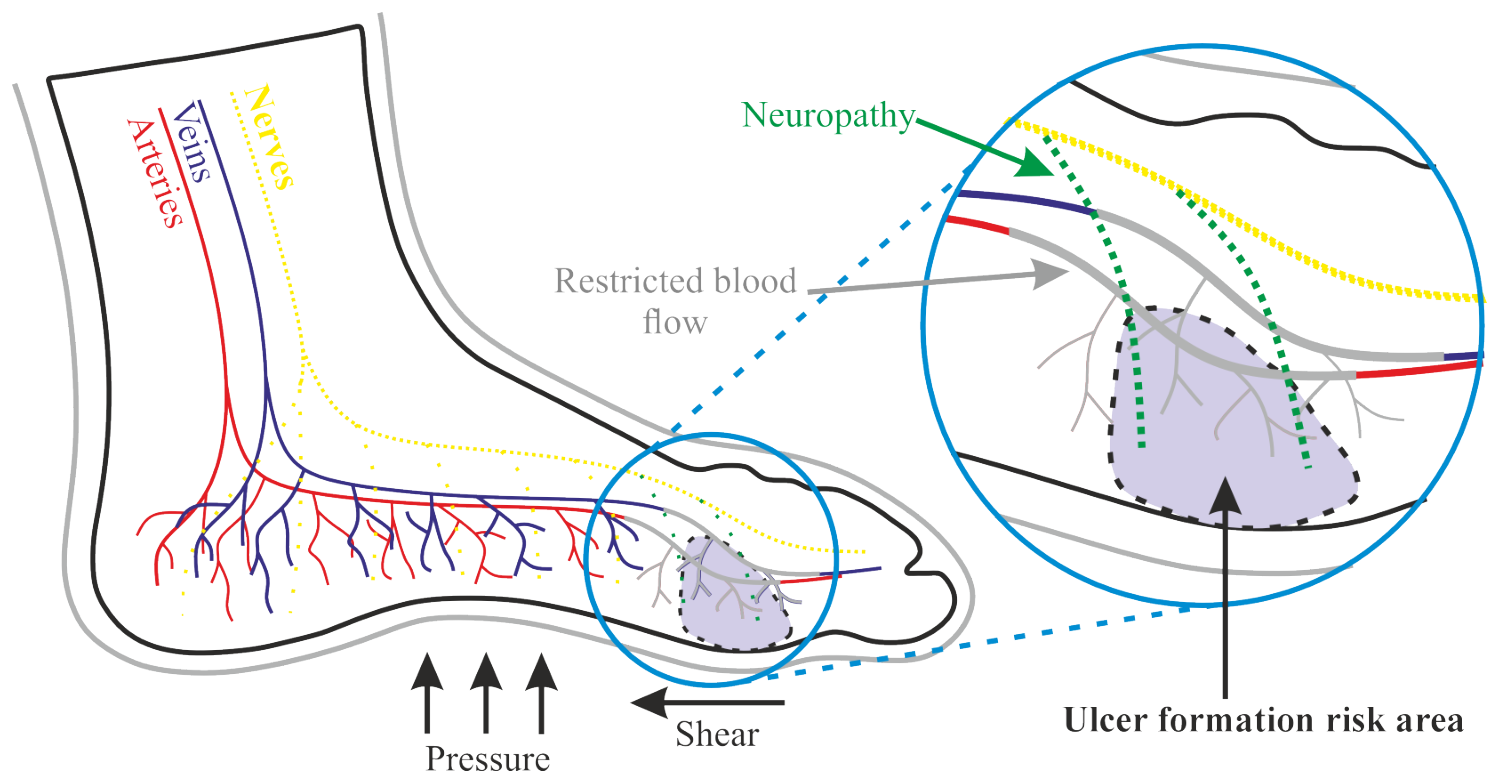
Figure 2.
Locations on the foot at high risk of developing pressure ulcers. 1) Toe apices, 2) Inter Phalangeal Joints, 3) metatarsal head, 4) plantar metatarsal, 5) heel pad, 6) Achilles heel, and 7) malleolus medial, 8) foot dorsum and 9) toe dorsum.
Figure 2.
Locations on the foot at high risk of developing pressure ulcers. 1) Toe apices, 2) Inter Phalangeal Joints, 3) metatarsal head, 4) plantar metatarsal, 5) heel pad, 6) Achilles heel, and 7) malleolus medial, 8) foot dorsum and 9) toe dorsum.
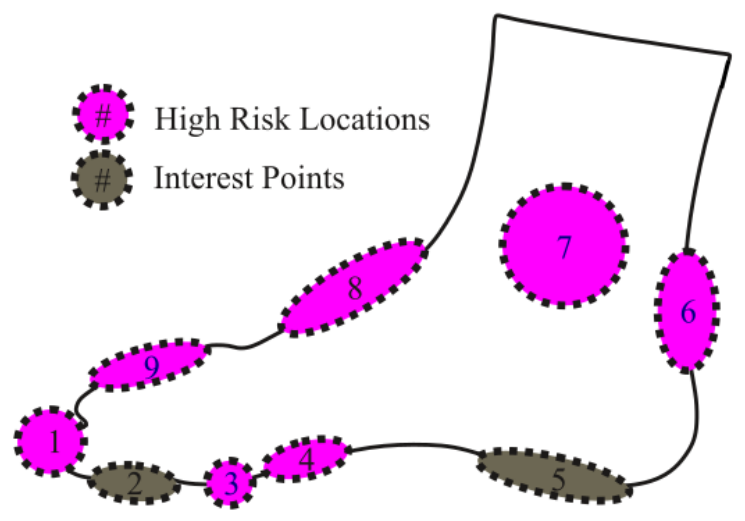
Figure 3.
Shear Tracking for Enhanced Prevention Sock (STEPS) Concept
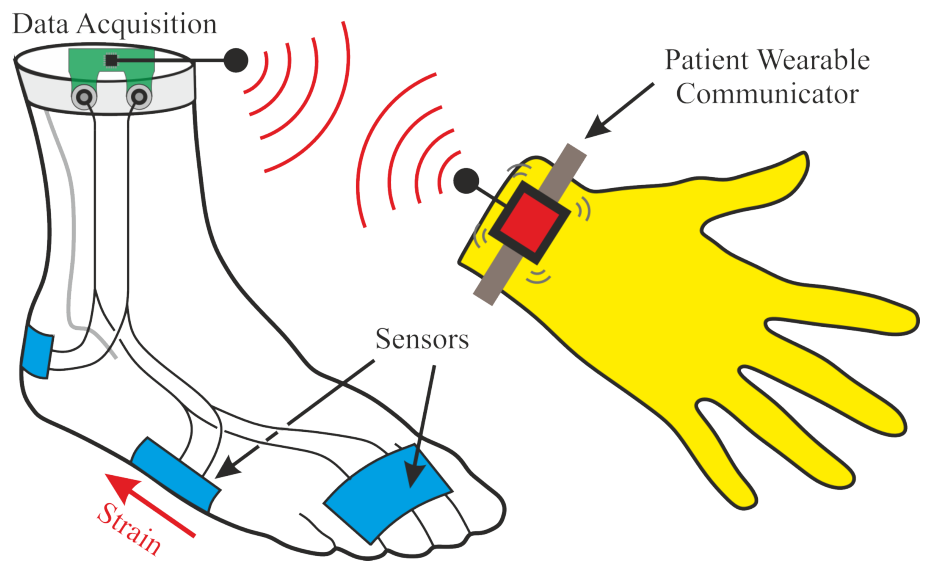
Figure 4.
Sock mechanical performance for different orientations, shown as the mean of n = 15 specimens with ±1 standard deviation bands. (a) full response to failure; (b) the expected sensor operating range (0–12% strain, shaded red), over which the vertical orientation is 1.45× stiffer than the horizontal.
Figure 4.
Sock mechanical performance for different orientations, shown as the mean of n = 15 specimens with ±1 standard deviation bands. (a) full response to failure; (b) the expected sensor operating range (0–12% strain, shaded red), over which the vertical orientation is 1.45× stiffer than the horizontal.
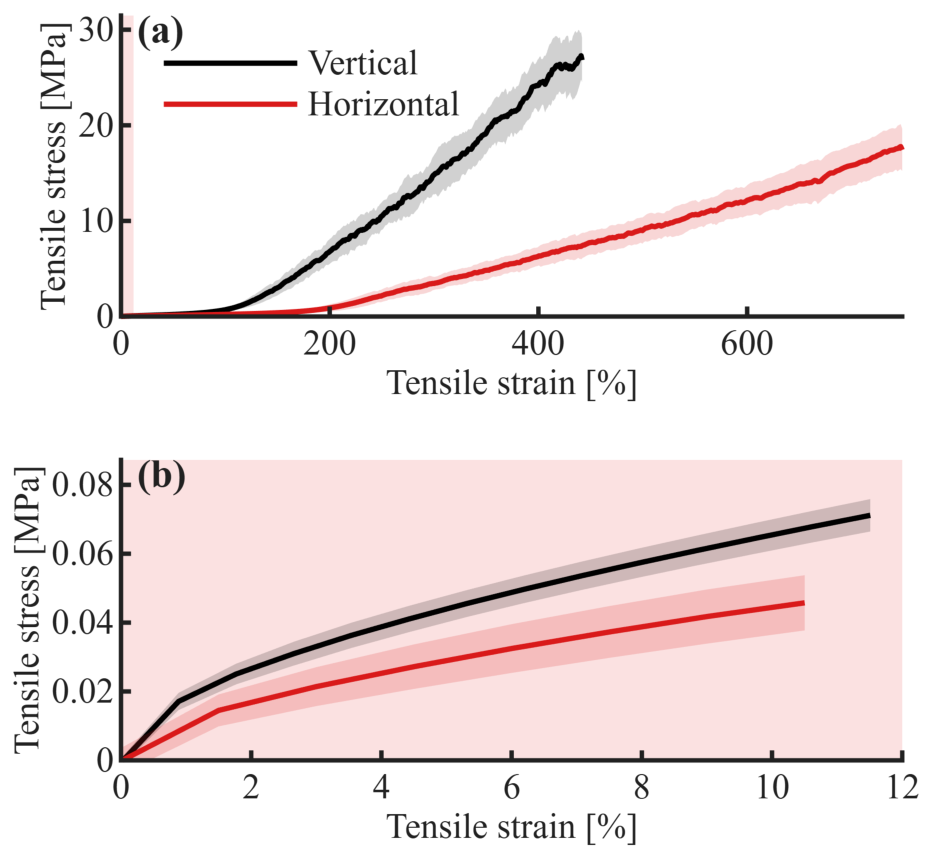
Figure 5.
Prototype of the STEPS smart sock. Highighting a) The sensor production process, b) Printed silver sensor, c) Schematic diagram of the sock connectivity, d) welt connector and sensor paired link wires connection to and e) STEPS prototype showing two strain sensors and connected electronics.
Figure 5.
Prototype of the STEPS smart sock. Highighting a) The sensor production process, b) Printed silver sensor, c) Schematic diagram of the sock connectivity, d) welt connector and sensor paired link wires connection to and e) STEPS prototype showing two strain sensors and connected electronics.
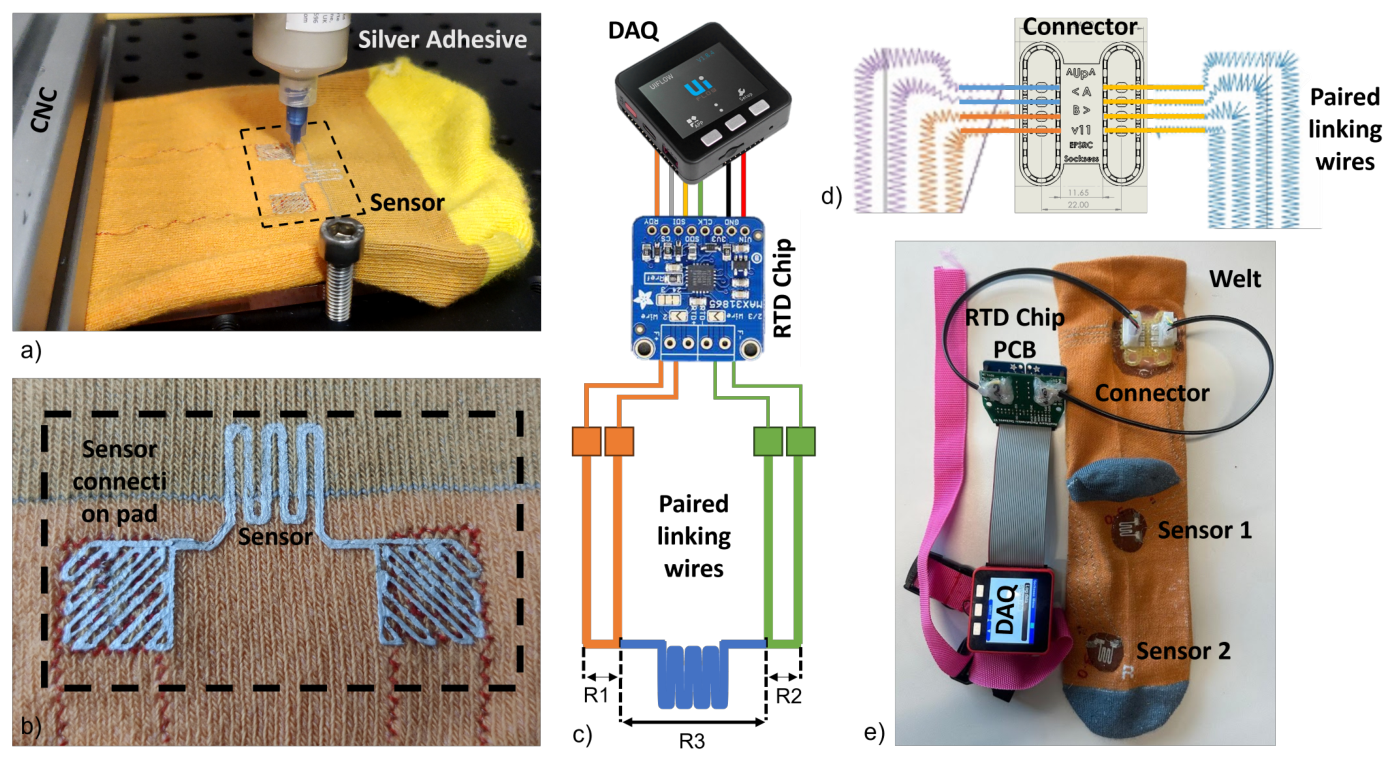
Figure 6.
Accelerometer data from data aquisition unit across a single repeat showing the 8 gait cycles (Cycle 2-9) with a mean and standard deviation.
Figure 6.
Accelerometer data from data aquisition unit across a single repeat showing the 8 gait cycles (Cycle 2-9) with a mean and standard deviation.
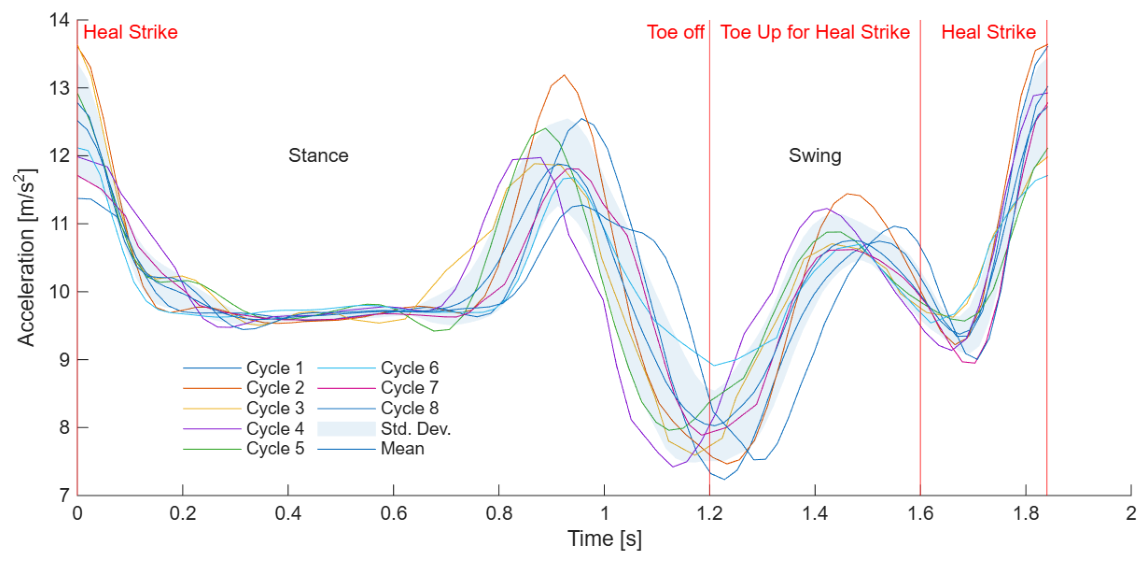
Figure 7.
Filtered resistance response for Sensor 1, Sensor 2 and Acceleration across the ten repeats, illustrating baseline drift and noise characteristics.
Figure 7.
Filtered resistance response for Sensor 1, Sensor 2 and Acceleration across the ten repeats, illustrating baseline drift and noise characteristics.
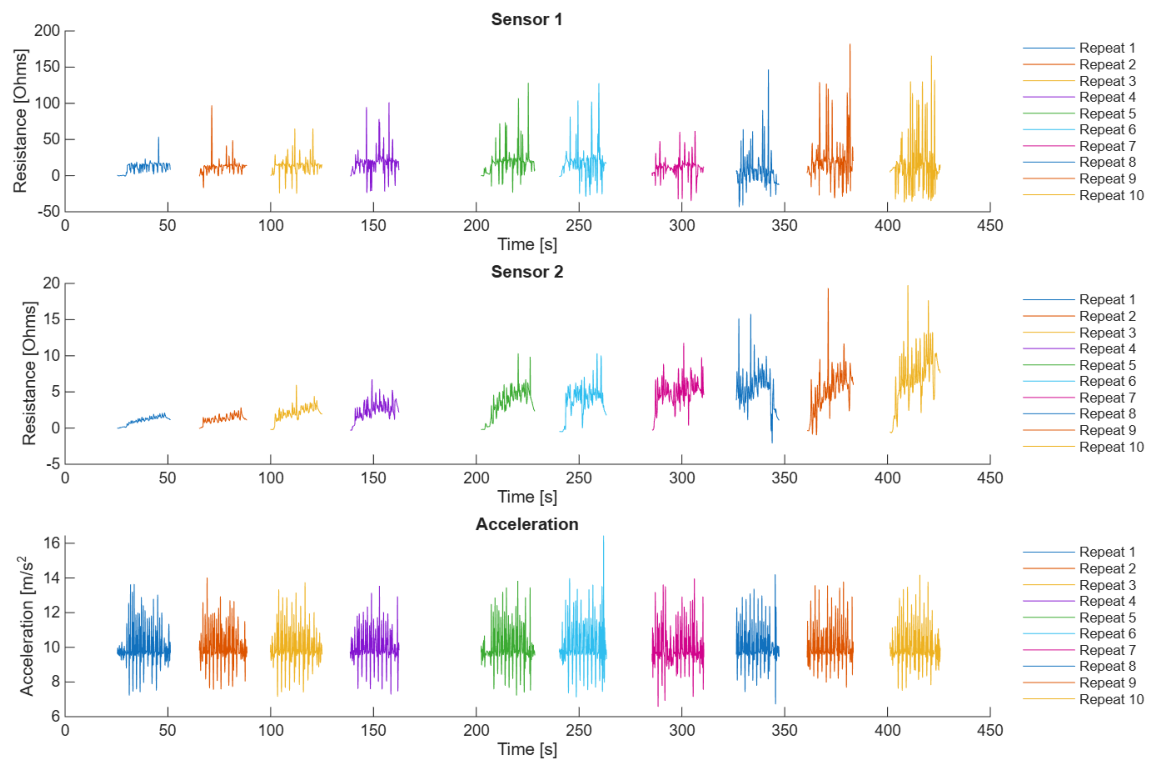
Figure 8.
Mean(±SD) gait-cycle-normalised resistance response for each sensor across the ten repeats, illustrating within- and between-repeat variability.
Figure 8.
Mean(±SD) gait-cycle-normalised resistance response for each sensor across the ten repeats, illustrating within- and between-repeat variability.
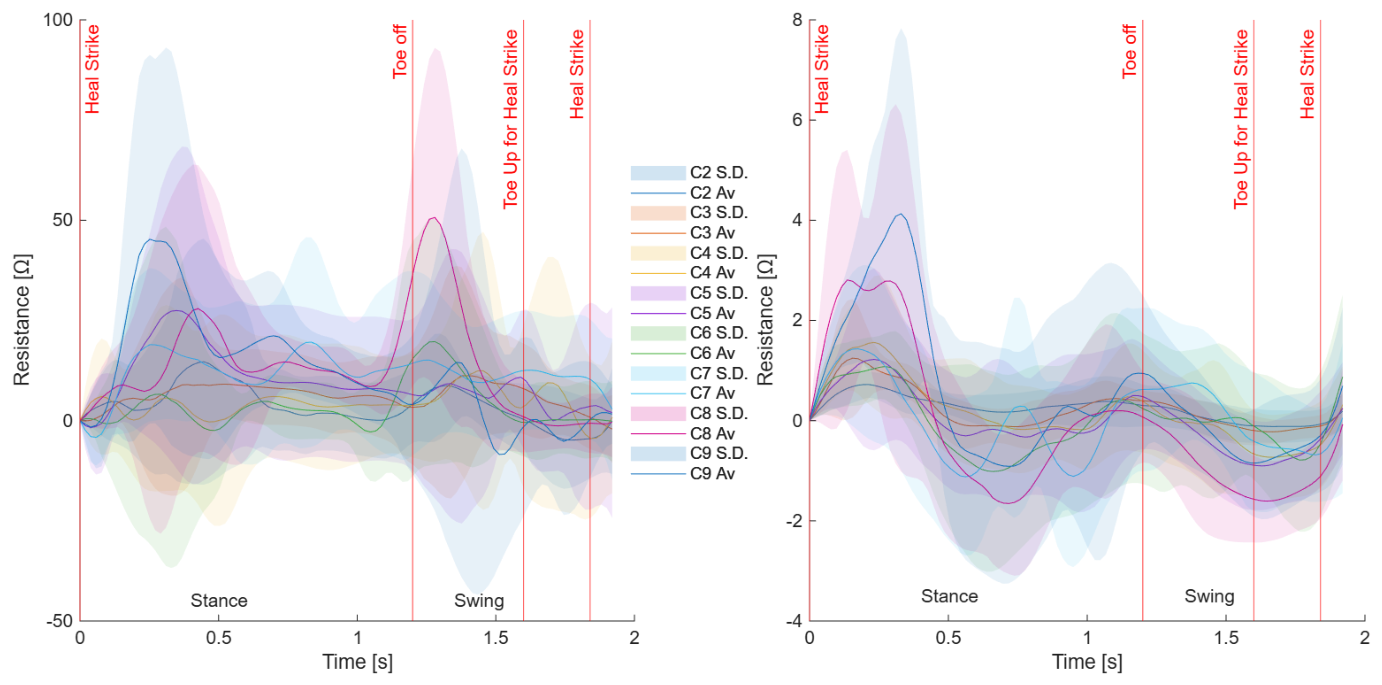

Table 1.
Summary of sensor validation metrics from the single-participant proof-of-concept gait test (10 repeats, 8 gait cycles per repeat).
Table 1.
Summary of sensor validation metrics from the single-participant proof-of-concept gait test (10 repeats, 8 gait cycles per repeat).
| Metric | Sensor 1 | Sensor 2 |
|---|---|---|
| Signal range () | 213.6 | 26.2 |
| Noise, std. dev. () | 5.91 | 0.35 |
| Drift rate (/repeat) | 1.59 | 0.75 |
| Total drift (% of initial baseline) | 62.1 | 153.3 |
| Drift trend fit () | 0.55 | 0.98 |
| Chip range consumed by drift (%) | 8.2 | 2.5 |
| Est. cycles to chip saturation (0–430 ) | 247 | 562 |
| Within-repeat variability (% of range) | 72.6 | 41.0 |
| Between-repeat variability (% of range) | 26.0 | 27.7 |
| Between-repeat correlation (mean R) | 0.39 | 0.77 |
| Moving-window correlation (mean R) | 0.21 | 0.67 |
| Sensitivity (/gait cycle) | 62.8 ± 43.0 | 4.10 ± 3.46 |
| Noise (% of mean cycle amplitude) | 9.4 | 8.4 |
Disclaimer/Publisher’s Note: The statements, opinions and data contained in all publications are solely those of the individual author(s) and contributor(s) and not of MDPI and/or the editor(s). MDPI and/or the editor(s) disclaim responsibility for any injury to people or property resulting from any ideas, methods, instructions or products referred to in the content. |
© 2026 by the authors. Licensee MDPI, Basel, Switzerland. This article is an open access article distributed under the terms and conditions of the Creative Commons Attribution (CC BY) license (http://creativecommons.org/licenses/by/4.0/).
Copyright: This open access article is published under a Creative Commons CC BY 4.0 license, which permit the free download, distribution, and reuse, provided that the author and preprint are cited in any reuse.