

Submitted:
01 September 2026
Posted:
03 September 2026
You are already at the latest version
Abstract
Sulfated chitosan (ChS) is a chemically modified chitosan derivative with structural and electrostatic features that mimic selected properties of heparan sulfate (HS) and has emerged as a promising antimicrobial biomaterial. Piscirickettsia salmonis, the etiological agent of salmonid rickettsial septicemia (SRS), is a major bacterial pathogen in salmon aquaculture and a principal driver of antibiotic use in Chile. In this study, we evaluated the in vitro antibacterial and antibiofilm activity of ChS against P. salmonis EM-90 and its interaction with florfenicol (FF) and oxytetracycline (OTC). ChS exhibited a minimum inhibitory concentration (MIC) of 750 µg/mL. Checkerboard assays showed a synergistic interaction between ChS and OTC (ΣFIC = 0.313) and an additive interaction between ChS and FF (ΣFIC = 0.703). Re-inoculation assays indicated predominantly reversible growth inhibition for several inhibitory combinations. LIVE/DEAD™ fluorescence analysis revealed a time-dependent increase in membrane permeabilization following ChS exposure, with a significant 37–63% reduction in the Green/Red fluorescence ratio between 5 and 48 h (p < 0.05). Consistently, scanning electron microscopy (SEM) revealed morphological alterations in ChS-treated bacteria, including irregular and eroded cell surfaces and focal depressions, which were more pronounced than those observed with chitosan without chemical modifications. ChS also significantly inhibited biofilm formation, with reductions exceeding 80% at day 6 and 57% at day 8 (p < 0.05), and altered biofilm architecture, abundance, and spatial distribution at days 6 and 10. Collectively, these findings demonstrate that ChS exerts antibacterial and antibiofilm effects against P. salmonis EM-90 and enhances its in vitro susceptibility to OTC and FF. The membrane alterations induced by ChS provide a plausible mechanistic basis for its antibiotic-potentiating activity, although enhanced intracellular antibiotic uptake was not directly demonstrated. These results support further investigation of ChS as an HS-mimetic biopolymer and complementary antimicrobial strategy for SRS control.
Keywords:
sulfated chitosan
; Piscirickettsia salmonis
; salmonid rickettsial septicemia
; heparan sulfate mimetic
; biofilm
; membrane permeabilization
; oxytetracycline
; florfenicol
; antimicrobial synerg
; FICI
1. Introduction
Chile is the world’s second-largest producer of farmed salmon after Norway and represents one of the major contributors to global salmon aquaculture [1]. Among the infectious diseases affecting the Chilean salmon industry, salmonid rickettsial septicemia (SRS), caused by Piscirickettsia salmonis, remains one of the most important bacterial diseases because of its high prevalence, associated mortality, and economic impact [2,3,4]. SRS is also a major driver of antimicrobial use in Chilean salmon farming. Although overall antibiotic consumption has decreased in recent years, treatments directed against SRS continue to account for a substantial proportion of the antimicrobials used in salmon production [2,4,5,6,7,8]. This sustained dependence on antibiotic therapy raises concerns regarding antimicrobial resistance (AMR) and environmental impact and highlights the need for complementary strategies capable of improving pathogen control while reducing antimicrobial use [8,9,10,11,12,13].
P. salmonis is a facultative intracellular Gram-negative bacterium capable of forming biofilms, two biological features that may contribute to bacterial persistence and reduced treatment efficacy [9,10,11,14]. Florfenicol (FF) and oxytetracycline (OTC) are among the antimicrobials used for the control of SRS in Chilean aquaculture. However, therapeutic success can be limited by several factors, including antimicrobial susceptibility, pathogen localization, biofilm-associated growth, and effective drug exposure at the site of infection [9,10,11]. Consequently, compounds capable of affecting bacterial surface integrity or biofilm development could potentially complement authorized antibiotics therapy.
Chitosan (Ch) is a polysaccharide obtained by the deacetylation of chitin and has been extensively investigated because of its antimicrobial activity, biocompatibility, biodegradability, and low toxicity [15,16,17,18]. Its biological activity is strongly influenced by physicochemical parameters such as molecular weight, degree of deacetylation, charge density, chemical substitution, environmental pH, and the target microorganism [17,19,20,21,22,23]. Chemical modification of commercial chitosan (ChC) or native can substantially alter these properties and improve its solubility and biological activity, thereby expanding its potential biomedical and biotechnological applications [17,19,23,24,25,26,27,28,29]. In particular, sulfation of the ChC structure introduces negatively charged sulfate groups into the ChC backbone, generating sulfated chitosan derivatives with enhanced aqueous solubility and distinct biological properties, including antimicrobial activity [20,21,23,24,30,31,32,33].
Sulfated chitosan (ChS) is particularly interesting because its high density of negatively charged sulfate groups reproduces selected structural and electrostatic features of heparan sulfate (HS), a sulfated glycosaminoglycan present on cell surfaces and within the extracellular matrix [34,35]. HS participates in numerous biological interactions and can also be exploited by viruses and bacteria during attachment, colonization, or host-cell entry [27,34,35,36,37,38,39,40,41]. Accordingly, sulfated polymers that mimic selected properties of HS have been investigated as competitive or multivalent interfaces capable of interfering with pathogen-host interactions. However, the biological activity of ChS is not necessarily restricted to HS-dependent interactions, as its charge density and polymeric architecture may also promote interactions with microbial surface components through electrostatic and other non-covalent forces [24,25,28,31,42,43,44,45].
Our group previously developed a low-molecular-weight ChS with controlled deacetylation and sulfation degree for biomedical and biotechnological applications (US Patent 11,246,839 B2). This material exhibits physicochemical and biological properties distinct from those of native ChC [46], and we have also shown that ChS can interfere with viral and bacterial interactions in systems in which HS-like molecular recognition may contribute to its biological activity [38,39,40,46]. More recently, we demonstrated that ChS increases membrane permeability, promotes bacterial aggregation, and inhibits biofilm formation in the P. salmonis LF-89 genogroup [47]. These findings provided initial evidence that ChS can directly affect P. salmonis physiology and suggested that the bacterial envelope and biofilm-associated phenotype may represent relevant targets of its antibacterial activity.
Nevertheless, P. salmonis comprises genetically and phenotypically distinct genogroups, and whether the antibacterial effects observed against LF-89 are conserved in the EM-90 genogroup remains unclear. Moreover, the potential interaction between ChS and antibiotics used against SRS has not yet been fully established. Determining whether ChS can modify bacterial susceptibility to these antimicrobials is particularly relevant because membrane alterations and inhibition of biofilm development could potentially influence the antibacterial activity of authorized antimicrobial drugs.
Based on these observations, we propose that ChS would alter membrane integrity and biofilm formation in P. salmonis EM-90 and thereby modify its susceptibility to OTC and FF. We further hypothesized that membrane permeabilization induced by ChS could contribute to the interaction with these antibiotics, although antibiotic uptake was not directly evaluated in this study. Accordingly, we evaluated in vitro antibacterial activity of ChS against P. salmonis EM-90, including its effects on membrane integrity, cellular morphology, bacterial recovery, and biofilm formation, and determined its interaction with OTC and FF using checkerboard assay.
2. Results
2.1. Antibacterial Activity: Combined Antibacterial Activity of ChS with Oxytetracycline (OTC) and Florfenicol (FF) Against Piscirickettsia salmonis (EM-90) Evaluated by the Checkerboard Assay
The combined antibacterial activity of ChS with OTC and FF against Piscirickettsia salmonis EM-90 was evaluated using a checkerboard assay. The interaction profiles were determined by visual assessment of bacterial growth inhibition and calculation of the fractional inhibitory concentration index (FICI, expressed as ΣFIC). The results obtained for both antibiotic combinations revealed distinct interaction patterns, with a synergistic effect observed for ChS combined with OTC and an additive interaction for ChS combined with FF.
2.2. Checkerboard Analysis and Fractional Inhibitory Concentration Index (FICI) Determination
The previously determined individual MIC values were 750 μg/mL for ChS, 0.24 μg/mL for OTC, and 0.25 μg/mL for FF. Reconstruction of the checkerboard matrices using the final concentrations present in each well allowed the identification of the minimum inhibitory combinations across four independent biological replicates (Table 1). For the ChS–OTC combination, the lowest inhibitory concentration identified in biological replicate 1 corresponded to 23.44 μg/mL ChS combined with 0.06 μg/mL OTC. In biological replicates 2, 3, and 4, the minimum inhibitory combination corresponded to 46.88 μg/mL ChS combined with 0.06 μg/mL OTC. The calculated ΣFIC values were 0.281, 0.313, 0.313, and 0.313 for biological replicates 1–4, respectively, resulting in a mean ΣFIC value of 0.305 ± 0.017. According to conventional FIC interpretation criteria, all values were within the synergistic range (ΣFIC ≤ 0.5), indicating an in vitro synergistic interaction between ChS and OTC.
The synergistic interaction resulted in a 16- to 32-fold reduction in the effective ChS concentration compared with its individual MIC and a fourfold reduction in the effective OTC concentration compared with the individual antibiotic MIC. For the ChS–FF combination, the minimum inhibitory concentration varied among biological replicates. The lowest inhibitory combinations corresponded to 93.75 μg/mL ChS plus 0.125 μg/mL FF in biological replicates 1 and 3 (Table 1). It was observed 375 μg/mL ChS plus 0.125 μg/mL FF in replicate 2, and 46.88 μg/mL ChS plus 0.125 μg/mL FF in replicate 4.
The ΣFIC values obtained for the ChS–FF combination was 0.625, 1.000, 0.625, and 0.563 for biological replicates 1–4, respectively, with a mean value of 0.703 ± 0.196 (Table 1). These values corresponded to an additive interaction profile (ΣFIC > 0.5 to ≤ 1.0). The combination reduced the effective ChS concentration by 2- to 16-fold compared with its individual MIC, while the effective FF concentration was reduced twofold, from 0.25 μg/mL to 0.125 μg/mL. Overall, checkerboard analysis demonstrated that ChS exhibited different interaction profiles depending on the antibiotic evaluated, producing a synergistic effect when combined with OTC and an additive effect when combined with FF (Figure 1A).
2.3. Quantitative Growth Inhibition Analysis Based on OD₆₃₀ Measurements
Quantitative analysis based on optical density measurements (OD₆₃₀) was performed to confirm the inhibition patterns identified by visual assessment of the checkerboard matrices and to define the inhibition boundaries for both ChS–OTC and ChS–FF combinations. The percentage of inhibition was calculated from OD₆₃₀ values after correction using the corresponding treatment blanks and normalization against growth controls from each biological replicate.
ChS–OTC Combination
The inhibition matrix obtained for the ChS–OTC combination showed a well-defined region of high antibacterial activity, mainly associated with OTC concentrations ranging from 0.24 to 0.06 μg/mL (Figure 1B). Within this region, mean inhibition values ranged from approximately 88% to 98%, depending on the ChS concentration evaluated. The combinations containing 46.88–750 μg/mL ChS with 0.06 μg/mL OTC produced mean inhibition values between approximately 90% and 95%. The lowest inhibitory combination identified by checkerboard analysis (23.44 μg/mL ChS plus 0.06 μg/mL OTC) showed slightly lower inhibition (~88%) but remained within the high-inhibition region.
When OTC concentration was reduced to 0.03 μg/mL, an intermediate transition zone was observed, with inhibition values ranging approximately from 75% to 87%. Further reduction of OTC concentrations (≤ 0.015 μg/mL) resulted in a marked decrease in antibacterial activity, with inhibition values generally close to or below 50%. The heatmap generated from the mean inhibition percentages revealed a clearly defined transition boundary between bacterial growth inhibition and reduced inhibitory activity (Figure 1B). This boundary consisted of the MIC combinations identified through visual checkerboard evaluation and corresponded to the region associated with the synergistic ΣFIC values.
ChS–FF Combination
The OD₆₃₀-based inhibition analysis confirmed the growth inhibition pattern observed visually for the ChS–FF checkerboard matrix (Figure 1B). The highest FF concentrations evaluated (0.50 and 0.25 μg/mL) produced very high inhibition levels (approximately 98–100%) regardless of the ChS concentration.
At 0.125 μg/mL FF, inhibition values remained elevated, ranging approximately from 92% to 95% depending on the ChS concentration. In contrast, the 0.0625 μg/mL FF concentration represented a transition region, with mean inhibition values ranging from approximately 46% to 64%, coinciding with the boundary identified through combined visual MIC evaluation. At FF concentrations ≤ 0.0313 μg/mL, antibacterial activity decreased markedly, with inhibition values below 18%. The heatmap generated from the mean inhibition values showed a clear separation between regions of high inhibition and bacterial growth (Figure 1B). This transition was consistent with the inhibition boundary observed in the checkerboard matrix and with the combinations used for ΣFIC calculation.
- A.
- Bacterial viability assessed by re-inoculation assay
To determine whether the absence of visible bacterial growth observed in checkerboard wells was associated with irreversible loss of viability or transient growth inhibition, wells classified as growth-negative (score 0) were subjected to re-inoculation in culture medium. This approach allowed the assessment of bacterial recovery after exposure to ChS combined with OTC or FF.
For the ChS–OTC combinations, bacterial regrowth was observed after re-inoculation in most of the evaluated combinations, indicating that the inhibitory effect observed during the checkerboard assay was predominantly reversible. However, no bacterial recovery was detected in wells containing OTC at 0.24 μg/mL combined with ChS concentrations of 750, 375, 187.5, 93.75, and 46.88 μg/mL (Figure 1C). These combinations corresponded to the region with the highest inhibitory activity identified by OD₆₃₀ analysis, with inhibition values ranging from approximately 92% to 98%. The absence of regrowth after re-inoculation in this specific region indicates a marked reduction in bacterial viability under these treatment conditions, while the recovery observed in the remaining combinations suggests that growth inhibition alone did not necessarily result in complete loss of viability or bacteriostatic effect.
For the ChS-FF combinations, no bacterial regrowth was detected after reinoculation in all wells classified as negative for growth, corresponding to the highest concentration of FF evaluated (0.50 μg/mL), regardless of the concentration of ChS analyzed. This was also observed in the combination of 0.25 μg/mL of FF with 1500 μg/mL of ChS. (Figure 1C). In contrast, all combinations containing FF concentrations equal to or below 0.125 μg/mL showed bacterial recovery after re-inoculation despite the absence of visible growth during the checkerboard assay. These results were consistent with the OD₆₃₀ inhibition profiles, where the highest antibacterial activity was observed at the upper FF concentrations. Therefore, the ChS–FF combination produced a strong inhibitory effect and reduced bacterial recovery at the highest antibiotic concentrations, whereas lower FF concentrations were associated with reversible inhibition or bacteriostatic effect.
The re-inoculation assay provided complementary evidence to the checkerboard and OD₆₃₀ analyses, identifying the treatment regions associated with the greatest reduction in bacterial viability for both antibiotic combinations.
Overall, the convergence of visual, spectrophotometric, and re-inoculation analyses demonstrates that ChS potentiated the antibacterial activity of both antibiotics against P. salmonis (EM-90). However, the interaction was consistently stronger with OTC than with FF under the experimental conditions evaluated.
2.4. Bacterial Viability and Bacterial Membrane Permeability
Bacterial membrane permeability after exposure to ChS was evaluated using LIVE/DEAD fluorescence staining, which quantifies the ratio of green fluorescence (SYTO9, intact cell membranes) to red fluorescence (propidium iodide, damaged membranes). A higher Green/Red fluorescence ratio indicates a normal cell membrane structure and function. In contrast, lower values reflect increased membrane permeabilization and can be used to assess decreases in viability, as observed in other studies (e.g., SEM in bacteria and inoculation into culture media to demonstrate the absence of bacterial growth). During the early exposure phase (10–30 min), no statistically significant differences (p > 0.05) were detected between the Ch polymer’s treatments and the untreated control (Figure 2). In contrast, ethanol used as a positive control for membrane disruption produced a rapid and significant reduction in Green/Red fluorescence ratio within the first 10 min (0.17 h) of exposure (p < 0.05), which became more evident as the exposure period progressed (p < 0.01).
After 1 hour of exposure, the group treated with ChS showed a significant decrease in the fluorescence ratio (p < 0.05) compared to the inoculum control, indicating greater permeabilization of the bacterial membrane in the initial phase of exposure. In contrast, the bacteria treated with ChC maintained values (p > 0.05) close to the inoculum control during this exposure period. At 5 hours, both polymer’s treatments showed significant reductions in the fluorescence ratio compared to the control (p < 0.05). However, ChS showed a more significant effect on membrane permeabilization in this early phase than ChC.
At 24 hours, exposure of bacteria to ChS increased membrane permeabilization (p < 0.05) more markedly compared to the inoculum control. Then, between 48 and 72 hours of exposure to ChS, the decrease in fluorescence values was constant (p < 0.05), consistent with the 24-hour exposure. A greater decrease in fluorescence values was then observed between 72 and 120 hours of exposure to the sulfated polymer (Figure 2). Conversely, between 24 and 120 hours, cultures exposed to ChC showed increasing Green/Red ratio values, which were not statistically different from the inoculum control between 96 and 120 hours of ChC exposure.
The sustained reduction in fluorescence values observed in the ChS group indicates a more potent and persistent effect on the membrane integrity of P. salmonis, which is relevant because ChC has a MIC (1500 µg/mL) that is twice the MIC (750 µg/mL) of ChS. Overall, ChS formulations induced a time-dependent increase in membrane permeability in P. salmonis (EM-90). ChS produced a significantly earlier, more consistent, and more pronounced effect on membrane permeabilization compared to ChC, especially during the initial and final exposure periods of the assay, supporting the idea that polymer sulfation enhances antibacterial efficiency.
2.5. Fluorescence Microscopy Analysis
Fluorescence microscopy with LIVE/DEAD staining was used to assess the integrity of the membrane in P. salmonis after exposure to Ch polymers. This staining method uses two fluorophores: SYTO9, which penetrates all cells and emits green fluorescence, and propidium iodide (PI), which only penetrates cells with compromised membranes and emits red fluorescence. When both dyes are intracellular, PI displaces SYTO9, resulting in predominant red fluorescence, indicating membrane damage. In the untreated control group, bacterial cells displayed predominantly green fluorescence with minimal red signal (Figure 3 A). The cells were mostly isolated and distributed homogeneously, with no evident bacterial microaggregates, indicating preserved membrane integrity during the experiment. Exposure to 50% ethanol, used as a positive control for membrane disruption, resulted in a rapid increase in red fluorescence, accompanied by a reduction in green fluorescence. This result is consistent with the known mechanism of ethanol in Gram-negative bacteria, which involves disruption of the bacterial membrane.
After 5 hours of exposure to ChC, a reduction in green fluorescence was observed, accompanied by an increase in red fluorescence with a diffuse signal in some areas compared to the control (Figure 3 B.1 and B.2), indicating increased permeabilization of the bacterial cell membrane. The bacteria were observed dispersed, with a slight tendency to form aggregations at a low frequency. At 24 hours, cells with green fluorescence were still observed (Figure 3 C.1 and C.2). However, red fluorescence continued to increase in the field with greater sharpness or evidence of intracellular PI influx, compared to the 5-hour exposure period, suggesting a further increase in membrane permeability. The bacteria were frequently observed dispersed, with little aggregate formation.
In contrast, the cultures exposed to ChS, fluorescence microscopy observations were consistent with quantitative fluorescence data. After 1 hour of exposure, notable alterations were observed in both fluorescence patterns and cell distribution, compared to the untreated control (Figure 4). While green fluorescence (SYTO 9) continued to predominate, indicating that a substantial fraction of the bacterial population retained membrane integrity, a clear increase in red fluorescence (intracellular PI) was observed, suggesting increased membrane permeability in the early phase. Importantly, the bacterial cells were no longer homogeneously dispersed, but rather formed discrete microaggregates, as evidenced by the localized clusters of green fluorescence (Figure 4 A.1 and A.2). The red signal appeared more diffuse and heterogeneously distributed compared to the control group, which could reflect partial membrane damage consistent with the significant reduction in the green/red ratio.
After 5 hours of exposure to ChS, green fluorescence persisted, while red fluorescence (PI) increased. Notably, bacterial cells formed small, but more defined and compact cell aggregates in both the green and red signals, in comparison of the dispersed pattern observed in the control and the ChC-exposed group. At 24 hours, these microaggregates became more evident, and localized regions exhibiting both green and red fluorescence were detected, suggesting the coexistence of cells with different membrane permeability states within the same bacterial clusters (Figure 4 B.1 and B.2).
During this period, it is noteworthy that the bacterial cells formed dense aggregates with a diffuse red signal, and individual bacterial cells were no longer clearly distinguishable. The red signal was observed both as intense, localized fluorescence associated with damaged cells and as a diffuse background. This, along with the decrease in green fluorescence, suggests greater bacterial membrane compromise or a decrease in the bacterial population compared to previous periods.
At 48 hours, the fluorescence pattern and bacterial aggregates were like those at 24 hours and acquired a more defined structure. However, the number of individual cells decreased in the green signal compared to previous periods. Red fluorescence was observed within or near some regions of bacterial aggregates, but also with a diffuse signal and a lower number of individual cells, suggesting bacterial reorganization or a decrease in bacterial numbers (Figure 4 C.1 and C.2).
Between 72-120 hours of exposure to ChS, similar characteristics to the 48 hours period were observed, with few variations in the fluorescence pattern, which is compatible with the quantitative Green/Red Ratio in these time periods. In general, these qualitative observations are consistent with the quantitative membrane cell permeability data obtained through fluorescence measurements.
Merged fluorescence images (Figure 4) revealed the progressive appearance of yellow-to-orange signals after exposure to ChS. These intermediate fluorescence patterns likely resulted from the overlap of SYTO 9 and PI staining and are consistent with heterogeneous membrane permeability states within the bacterial population.
The frequency and intensity of these mixed fluorescence signals gradually increased starting at 5 hours, supporting a progressive disruption of cell envelope integrity. However, this disruption was most clearly detected starting at 24 hours of ChS exposure in bacterial aggregates. Figure 4 (A.3, B.3 and C.3), shows the merge image during the 1 hour ChS exposure, green fluorescence predominated over red fluorescence. After 24-48 hours of ChS exposure the bacterial aggregate with a predominantly red signal was observed, accompanied by areas with a yellow/orange signal resulting from the overlap of both fluorophores, suggesting intermediate states of cell damage or a transition in membrane integrity. The presence of co-localized signals (yellow/orange) further suggests a progressive membrane damage process, rather than a transition between states of no membrane disruption and membrane disruption. These observations are supported by quantitative fluorescence analysis, which shows an important decrease in the Green/Red fluorescence ratio after exposure to ChS of 61.73%, and 63.49% at 24 and 48 hours respectively, compared with the untreated control (Figure 5).
2.6. Scanning Electron Microscopy (SEM) Analysis
Scanning electron microscopy (SEM) was used to examine morphological alterations in P. salmonis cultures exposed to the MICs of ChS and ChC for 24 hours (Figure 6). Control cultures of P. salmonis without chitosan polymer derivatives displayed spherical to coccoid bacterial cells with relatively smooth surfaces, well-defined cellular boundaries and morphological homogeneity (Figure 6 A). The bacteria were observed as isolated cells, and cells close to each other. The cell morphology appeared intact, with no visible surface depressions or structural alterations. These structurally conserved cells match the fluorescence microscopy images of the control group, where a homogeneous distribution of bacteria with green fluorescence and little red fluorescence signal was observed.
Cultures exposed to the MIC of ChC showed moderate morphological changes compared to the control (Figure 6 B). More compact microcolonies were observed, and several bacteria appeared to be immobilized and aggregated within amorphous structures due to continuity between cells and matrix, which was not observed in the control group without polymers. This suggests a bacteria-polymer association, but the recognizable spherical and coccobacillary morphology was frequently maintained, with only slight to moderate loss of the smooth cell surface.
In contrast, cultures exposed to the ChS MIC exhibited more pronounced and distinct structural changes in cells compared to the inoculum control and ChC groups. (Figure 6 C). Cells associated with amorphous extracellular material surrounding the bacterial aggregates were observed. These aggregates contained cells of varying sizes, with a rough appearance, and did not always maintain their coccobacillary shape (Figure 6 C.1).
Additionally, some cells groups remained spherical, but with an increase in size and others remained smaller, clustered, with a preserved oval outline, but a depressed surface with loss of normal convexity, irregular edges, and partial collapse. Bacteria with rough outer surfaces and a localized eroded appearance, consistent with lesions of the outer envelope, were frequently identified (Figure 6 C.2). In certain bacteria, peripheral regions with greater electron intensity and apparent relief were detected, suggesting topographic modifications of the cell surface and possible accumulation of material associated with the outer envelope and cells with significant size changes (Figure 6 C.1 and C.3).
Overall, SEM analysis indicates that exposure to ChS induces substantial structural damage in P. salmonis after 24 hours of incubation, consistent with membrane disruption observed by fluorescence microscopy and with the reduction in the Green/Red ratio (Increased intracellular PI uptake) in fluorescence assays. Also, the P. salmonis cells cultured in Austral-SRS medium to evaluate bacterial recovery showed no detectable growth after 120 hours of incubation under the treatments. It is consistent with a possible mechanism of action of ChS (Time-dependent) based on disruption of the cell membrane, which could irreversibly compromise bacterial viability.
2.7. Evaluation of Biofilm Production
Figure 7 shows the results of the biofilm evaluation experiment in the EM-90 strain. After correction with specific controls for each condition, it was observed after 4 days of incubation that the untreated inoculum control presented a mean optical density (OD) of 0.386 (± 0.0621). According to the Stepanović method, for this experimental period the strain was classified as a weak biofilm producer. Treatments with ChS at 750 µg/mL (MIC) and 375 µg/mL (Sub-MIC) significantly reduced biofilm formation to 0.103 ± 0.039 (73.6%) and 0.132 ± 0.026 (65.8%), respectively. These reductions were comparable to those observed with the OTA control with inhibition percentages of 76.2% (OD = 0.092 ± 0.012) and no statistically significant differences were detected between the ChS treatments and the antibiotic control, indicating similar antibiofilm efficacy in the initial stages of its formation.
Biofilm formation by P. salmonis after 6 days of incubation showed an average value of 0.487 ± 0.057 in the inoculum control, demonstrating greater biofilm production. According to the Stepanović method, this classifies the strain as a moderate biofilm producer, indicating an increase in biofilm formation capacity compared to the previous experimental period.
After 6 days, exposure to the treatments resulted in a significant decrease in biofilm formation compared to the control. ChS at sub-MIC levels showed (OD = 0.327 ± 0.061) a non-significant reduction (p > 0.05), while at MIC levels it showed (OD = 0.095 ± 0.021) significant reductions (p < 0.05). The greatest reductions observed were with OTA (OD = 0.067 ± 0.008) and ChS at 750 µg/mL, suggesting greater efficacy of the ChS MIC (80.5%) compared to the sub-MIC (32.9%), demonstrating a concentration-dependent effect on biofilm formation. Furthermore, the percentage reduction in biofilm formation due to exposure to the ChS MIC was like that of the antibiotic control (86.2%).
After 8 days of incubation, the culture showed an increase in biofilm formation (0.497 ± 0.065), and the strain was classified as moderate in biofilm production, according to the Stepanovic method. ChS significantly reduced biofilm formation, with very similar OD values between the sub-MIC and MIC of ChS, corresponding to very similar inhibition percentages of 58% for both concentrations. No mathematically or statistically significant differences were observed between these concentrations during this experimental period. The OTA treatment resulted in a significantly more effective inhibitory effect, with an average OD of 0.074 ± 0.012 and an inhibition percentage of 85.1%, significantly lower than that of the ChS treatments.
Biofilm formation on day 10 of incubation was classified, according to the Stepanović method, as moderate biofilm production. However, unlike in previous periods, the biofilm biomass of the inoculum control increased substantially (0.701 ± 0.083), reflecting biofilm maturation over time. Exposure to sub-MIC ChS and MIC-ChS resulted in OD values of 0.547 ± 0.104 and 0.485 ± 0.074, equivalent to reductions of 22.0% and 30.8%, respectively. However, these decreases were not statistically different from the control (p > 0.05), suggesting a progressive recovery of biofilm biomass during prolonged incubation. In contrast, OTA maintained a strong antibiofilm effect throughout the experiment, yielding an OD of 0.094 ± 0.013 and a reduction of 86.6% relative to the control (p < 0.01).
Overall, despite the partial biofilm reduction observed with ChS, the persistence of biofilm formation suggests that the strain analyzed maintains a moderate biofilm production phenotype under prolonged incubation conditions for this assay. The results demonstrate that ChS exerts an antibiofilm effect against P. salmonis EM-90 during the early and intermediate stages of biofilm development. In contrast, OTA demonstrated significant and sustained inhibitory activity as experimental control.
Biofilm Scanning Electron Microscopy Analysis
SEM analysis was used to evaluate the effects of ChS on the architecture of P. salmonis (EM-90) biofilms after 6 and 10 days of incubation and to compare these observations with untreated control biofilms. Figure 8 shows the image after 6 days, untreated cultures exhibited well-developed biofilms composed of densely packed bacterial microcolonies embedded within an extracellular matrix (EPS). Bacterial cells remained closely associated, forming compact three-dimensional aggregates interconnected by structured filaments and extracellular material. The biofilm displayed continuous architecture on the surface and well-defined multicellular organization, consistent with the active biofilm maturation process.
In contrast, cultures exposed to ChS for 6 days exhibited a marked disruption of biofilm development (Figure 8 B). SEM micrographs revealed a drastic reduction in the number and size of bacterial aggregates, with most cells appearing as isolated individuals or very small clusters scattered across the surface. The EPS network observed in untreated biofilms was largely absent, and only sparse residual material remained attached to the substrate. Large areas without cells, with residual extracellular matrix lacking connections or structured filaments, indicating impaired bacterial adhesion and failure to establish mature biofilm architecture. These morphological observations are consistent with the approximately 80% reduction in biofilm biomass determined by crystal violet staining in this experimental period.
Following 10 days of incubation (Figure 9), the untreated control cultures developed mature biofilms characterized by extensive regions of continuous extracellular matrix, with bacteria in communities and highly organized of structures. The biofilm exhibited extensive substrate colonization, with compact EPS-rich regions and bacterial cells embedded throughout the matrix, indicative of advanced biofilm maturation.
In contrast, biofilms exposed to ChS for 10 days displayed a markedly altered architecture despite evidence of partial recolonization (Figure 9 D). Residual adherent structures were fragmented and discontinuous, with irregular margins and numerous empty spaces interrupting the continuity of the biofilm. Higher-magnification images revealed porous matrix remnants containing multiple cavities and perforation-like openings, producing a reticulated morphology suggestive of partial collapse or degradation of the extracellular polymeric matrix. Instead of the compact bacterial communities observed in untreated controls, only small aggregates and dispersed cells remained associated with these residual structures. ChS prevented the re-establishment of the highly organized architecture characteristic of mature untreated biofilms. These observations agree with the approximately 30% reduction in biofilm measured by crystal violet assay after 10 days.
Overall, SEM analyses demonstrated that ChS progressively altered biofilm organization by reducing bacterial aggregation, limiting extracellular matrix accumulation, and disrupting the structural integrity of mature biofilms. Although partial biofilm recovery was observed after prolonged incubation, the architecture remained substantially less organized than in untreated controls, supporting a sustained antibiofilm effect of ChS.
3. Discussion
The present study demonstrates that ChS exerts antibacterial and antibiofilm activity against P. salmonis EM-90 and importantly modifies the antibacterial activity of two antibiotics used for SRS control. Checkerboard analysis showed a synergistic interaction between ChS and OTC (mean ΣFIC = 0.305 ± 0.017), reducing the effective OTC concentration fourfold relative to its individual MIC, whereas the interaction between ChS and FF was additive (mean ΣFIC = 0.703 ± 0.196), with a twofold reduction in the effective FF concentration. These findings were supported by spectrophotometric measurements showing marked inhibition of bacterial growth. Re-inoculation experiments further indicated that several inhibitory combinations allowed bacterial recovery after transfer to medium, suggesting predominantly reversible growth inhibition rather than irreversible bacterial killing.
Although ChS required substantially higher concentrations than conventional antibiotics to inhibit bacterial growth when used alone, its interaction with OTC and FF suggests a potential role as an antibiotic-potentiating biomaterial rather than as a replacement for authorized antimicrobial therapy. This distinction is relevant because polymer-based antimicrobial strategies may provide complementary mechanisms of action that differ from those of authorized antibiotics. In the present study, ChS exhibited a 50% lower MIC than ChC, indicating that sulfation modifies the antibacterial properties of the parental polymer. A similar antibacterial phenotype was previously observed by our group in the LF-89 genogroup of P. salmonis [47], suggesting that the activity of ChS is not restricted to a single P. salmonis genogroup, however, the observation of bacterial aggregates in this EM-90 strain was less frequent and compared with the LF-89 strain exposed to the same ChS polymer, with greater sensitivity to ChS (a lower MIC), compared to genogroup LF-89. These differences in susceptibility may be due to variations between genogroups [48].
Despite, Ch derivatives with sulfur have demonstrated antibacterial activity through mechanisms associated with membrane disruption [49,50,51], the reports evaluating combinations of sulfur-modified Ch derivatives with authorized antibiotics remain limited. To our knowledge, checkerboard-based studies specifically evaluating ChS in combination with FF or OTC against P. salmonis have not previously been reported.
Nevertheless, other chitosan-derived materials (sulfur-free) have been shown to enhance antibiotic activity. Chitooligosaccharides have potentiated FF activity against avian pathogenic Escherichia coli [52, while chitosan-based nanogels and antibiotic-loaded formulations have shown enhanced antibacterial activity in other bacterial models [53,54,55]. Similarly, modified Ch derivatives have been reported to enhance the activity of OTC in experimental animal models and on other fish pathogens [56,57]. The previous reports of FF and OTC associations with sulfur-free modified Ch support the broader concept that chitosan-based polymers can modify bacterial susceptibility to authorized antimicrobial agents, although these materials differ chemically and structurally from the ChS evaluated here.
However, it should be noted that antimicrobial combinations do not necessarily produce synergistic effects, even when the individual agents act on different cellular processes. Depending on the antimicrobial pair, bacterial species, strain background, physiological state, culture conditions/environment and drug/compound combinations may result in synergy, additivity, indifference, or antagonism.
It is about respect, experimental with FF or OTC, it is described that antagonistic interactions between FF and enrofloxacin and lincomycin in P. multocida and E coli. However, other combinations (kanamycin) with FF showed additive effects depending on the bacterial species [58]. Comparable results have been reported for OTC with antagonistic interactions with enrofloxacin in E. coli, while other combinations (amoxicillin y gentamicin) with OTC have produced indifference effects [59].
On the other hand, the combination of FF with OTC demonstrated synergistic activity against a proportion (44%) of P. aeruginosa isolate and observed increased intracellular uptake of OTC in the presence of FF. The authors proposed that FF could enhance the activity of the second antimicrobial through alterations in bacterial membrane permeability or efflux-associated processes [60]. Similar results with additive and synergistic interactions were reported in other trials (FF + OTC) on M. haemolytica and P. multocida [61,62].
Additionally, experiments with the combination of FF with thiamphenicol showed synergy on 17% of A. pleuropneumoniae and 24% of P. multocida isolates [62], even though FF and thiamphenicol share bacterial 50S ribosomal subunit as their primary target or closely related binding sites [63]. Therefore, this variability in results suggests that the presence of distinct antibacterial targets alone is insufficient to predict the pharmacodynamic outcome of an antimicrobial combination.
Taking together, the coexistence of synergistic, additive, indifferent, and antagonistic interactions reported for FF and/or OTC containing combinations emphasizes that antimicrobial combination effects are highly context dependent. In our experiment, the absence of antagonism and the distinct synergistic versus additive profiles of ChS with OTC and FF, respectively, are consistent with a membrane-sensitization model rather than with a generalized potentiating effect.
Within this framework, the synergistic interaction observed in this investigation between ChS and OTC, compared with the additive interaction observed between ChS and FF, should not be interpreted simply as a consequence of combining agents with different antibacterial targets. Importantly, ChS should not necessarily be regarded as acting through a single defined membrane target. As a sulfated, polyanionic polymer, ChS may engage in multiple ionic, electrostatic, hydrogen-bonding, and other non-covalent interactions [24,25,31] with different components of the bacterial envelope, including surface-exposed proteins and other membrane-associated structures.
In this context, another finding of the present study was the effect of ChS on the bacterial envelope. LIVE/DEAD™ fluorescence analysis revealed a progressive increase in PI-associated fluorescence and a significant time-dependent decrease in the Green/Red fluorescence ratio following ChS exposure. Because PI uptake primarily reflects loss of membrane integrity, these results indicate progressive membrane permeabilization rather than bacterial death per se. Consistent with this interpretation, SEM revealed pronounced morphological alterations in ChS-treated cells, including irregular surfaces, focal depressions, increased roughness, and altered cell morphology. These changes were more pronounced than those observed with ChC, further supporting the conclusion that chemical modification of Ch alters its interaction with the P. salmonis cell envelope, which we also demonstrated in the LF-89 genogroup [47].
The physicochemical properties of ChS provide a plausible basis for these interactions. Sulfation introduces a high density of negatively charged groups into the polymer, while also modifying polymer conformation, solubility, and intermolecular interactions [22,24,28,30,31,32,33,49,51]. The ChS used in this research exhibited a high degree of sulfation (0.92–0.95), and previous physicochemical characterization confirmed sulfate incorporation and reduced crystallinity relative to ChC [46,47]. These features reproduce selected structural and electrostatic properties of sulfated glycosaminoglycans [27,28,41,64] such as HS. However, although this HS-mimetic architecture may contribute to the biological behavior of ChS, the present experiments do not demonstrate that its antibacterial activity against P. salmonis depends on a specific HS-like molecular recognition mechanism. The observed membrane effects are therefore more conservatively interpreted as resulting from interactions between the sulfated polymer and bacterial surface components.
The membrane phenotype observed following ChS exposure provides a plausible mechanistic link with the enhanced antibacterial activity observed in combination with OTC and FF. Membrane permeability, porin-mediated transport and efflux systems are important determinants of antibiotic susceptibility in P. salmonis and other Gram-negative pathogens as adaptation strategies to decrease their exposure to antimicrobials [41,48]. In P. salmonis, genomic and functional studies have identified membrane-associated transport systems, including AcrAB-related efflux mechanisms and genes such as tetE and ompF, that may contribute to the response to FF and OTC [10,65,66,67]. Alteration of bacterial envelope organization by ChS could therefore modify the physicochemical environment in which these transport processes operate and consequently influence antibiotic susceptibility, possibly directly or indirectly.
In this regard, previous studies reported that the expression levels of abeM efflux pumps in A. baumannii and mexY efflux pumps in P. aeruginosa decreased after exposing to sub-inhibitory concentrations of Ch, Ch-NPs(Ag), and their combination with ciprofloxacin and gentamicin [68]. Similarly, the combination of chitosan and ciprofloxacin was reported to produce a greater reduction in the expression of efflux pump genes (mexA and mexB) in resistant P. aeruginosa compared to ciprofloxacin alone [69]. These findings indicate that chitosan exposure can influence efflux-associated responses at the transcriptional level, although they do not demonstrate direct inhibition or the binding of chitosan to the corresponding transport proteins.
Taking together, these studies indicate that chitosan-based materials can modulate efflux-associated resistance in Gram-negative bacteria and enhance antibiotic activity, but the available evidence does not establish a direct binding of chitosan to efflux transporters. However, this interpretation should be considered a mechanistic hypothesis rather than a demonstrated molecular mechanism. The present study did not measure intracellular concentrations of OTC or FF, efflux activity, transporter function, or transcriptional responses following ChS exposure. Consequently, the synergistic interaction observed with OTC and the additive interaction observed with FF cannot currently be attributed directly to increased antibiotic uptake or inhibition of efflux systems. Future studies combining intracellular antibiotic quantification with efflux assays, membrane-protein analysis, and transcriptomic approaches will be required to establish whether ChS directly or indirectly modifies antibiotic transport in P. salmonis.
In addition to its effects on the bacterial envelope, ChS significantly affected biofilm formation. The strongest inhibition was observed during the early and intermediate stages of biofilm development, with reductions of approximately 70–81% at days 4–6 and >57% at day 8 relative to untreated controls. By day 10, the reduction was no longer statistically significant, indicating that the inhibitory activity of ChS decreased during prolonged incubation. SEM imagens observations were consistent with these quantitative findings: ChS-treated cultures showed markedly reduced surface colonization and limited matrix-associated material at day 6, whereas localized recolonization and matrix deposition became evident by day 10. Nevertheless, the resulting biofilm remained morphologically less organized than that of untreated controls (Figure 8 and Figure 9).
These findings indicate that ChS primarily interferes with biofilm establishment and development rather than eradicating a pre-existing mature biofilm. This distinction is important because ChS was present during biofilm formation in experimental design. Similar inhibition of biofilm formation was previously observed in the LF-89 genogroup using crystal violet quantification [47], whereas the present SEM observations provide additional morphological evidence of altered biofilm organization in EM-90. The reduced effect observed on day 10 may reflect progressive adaptation, increased extracellular matrix production, reduced effective polymer availability, or other time-dependent changes in the biofilm microenvironment; these possibilities require further investigation.
Additionally, the activity of sulfur-free chitosans against biofilms has been reported [70,71,72,73,74] and it has been described that sulfur-modified chitosans with a net negative charge decrease or alter biofilm formation in Gram-negative bacterial models (E. coli and P. aeruginosa) [50,75,76,77]. These reports did not investigate P. salmonis, but this contributes to supporting the antibiofilm results in this experiment, possibly because the ChS would contribute to greater exposure of P. salmonis to the antibiotics evaluated in vitro.
The relationship between membrane alterations and biofilm inhibition is also biologically plausible. Biofilm development in P. salmonis involves surface-associated structures and extracellular components, including outer membrane vesicles, adhesion-associated proteins, and extracellular polysaccharides [78,79,80,81,82,83,84,85,86]. Alteration of the bacterial envelope by ChS could therefore interfere with cell–cell interactions, surface attachment, or matrix organization. Nevertheless, the present experiments do not identify which specific surface component is targeted by ChS, and direct interactions with OMVs, pili, OmpA-like proteins, extracellular polysaccharides, or other envelope structures remain to be experimentally demonstrated.
Taken together, the results support a model in which ChS interacts with the bacterial envelope of P. salmonis EM-90, leading to increased membrane permeability, morphological alterations, and impaired biofilm development. These effects occur in parallel with enhanced antibacterial activity of OTC and FF, particularly the synergistic interaction observed with OTC.
The convergence of these phenotypes identifies the bacterial envelope as a plausible central target of ChS activity and provides a mechanistic framework for its antibiotic-potentiating effect. However, direct causality between membrane permeabilization and antibiotic potentiation remains to be established.
From an applied perspective, these findings support further evaluation of ChS as a complementary antimicrobial biomaterial for SRS control. Such an approach could potentially reduce the effective concentrations of authorized antibiotics required to inhibit P. salmonis, although this possibility must be demonstrated in vivo. The current investigation was conducted exclusively under in vitro conditions and therefore does not address pharmacokinetics, polymer stability, host toxicity or therapeutic efficacy in salmon. Future studies should determine whether the ChS–antibiotic interactions observed here are maintained under physiologically relevant conditions and in experimental infection models.
In this context, ChS within the One Health approach, could help offset the negative impact of microbiological, pharmacological, immunological and husbandry-related stressors variables that contribute to the clinical-therapeutic ineffectiveness of antibiotics authorized in national aquaculture against SRS. This is because ChS could likely contribute to the mechanisms of action of FF and OTC by probably promoting greater exposure to bacterial targets, which is usually restricted by their intracellular location and the presence of biofilms [9,14,87,88]. This further limits the low bioavailability of OTC [13,89] and the bacteriostatic therapeutic efficacy (dependent on the immunocompetence of the salmonid), of both FF and OTC, whose effective therapeutic concentrations in fish are generally reported, with time-dependent action in OTC (T > MIC) and in FF (AUC0-24h/MIC) during the indicated therapeutic period [90,91].
Overall, this study extends previous observations in the LF-89 genogroup and demonstrates that ChS also affects the EM-90 genogroup of P. salmonis. ChS induced membrane-associated alterations, inhibited biofilm development, and showed a synergistic interaction with OTC and an additive interaction with FF. These findings provide a foundation for investigating ChS as an antibiotic-potentiating biomaterial while identifying membrane–polymer interactions and antibiotic transport as priority mechanisms for future investigation.
4. Materials and Methods
4.1. Evaluation of the Interaction of ChS and Antibiotics on Antibacterial Activity Against P. salmonis
Bacterial culture: The P. salmonis strain from genogroup EM-90 was donated by Universidad Austral, Chile [48]. P. salmonis strain EM-90 was cultured in Austral-SRS medium prepared in the laboratory, as described by the authors and supplemented with 1% NaCl and 0.1% L-cysteine [92,93]. Cultures were incubated at 18 °C with gentle agitation (150 rpm) until reaching the logarithmic growth phase (OD630 ≈ 0.2). Bacterial suspensions were then adjusted to approximately (0.5 McFarland standard ~1.5 × 10⁸ CFU/mL) for all assays.
The Information on biopolymers: the calculations and studies on estimation of the degree of sulfation (ds), elemental analysis, structural / morphological characterization and x-ray diffraction (XRD) of ChS, were carried out according to the methods previously reported [47]. The procedures for obtaining minimum inhibitory concentration (MIC) from biopolymers (ChS and ChC) and from antibiotics authorized against P. salmonis were carried out using the microdilution method described in CLSI M07 (M07-Ed12) [94], with modifications adapted for slow-growing fish pathogens [1], according to a previously published report [47].
The interaction between ChS and authorized antibiotics (FF and OTC) against Piscirickettsia salmonis was evaluated using independent assays. The analysis was conducted at three complementary levels: a) Visual determination of the combined minimum inhibitory concentration (MIC) using the checkerboard method and calculation of the fractional inhibitory concentration index (ΣFIC). b) Quantification of the percentage of inhibition using optical density (OD630). c) Evaluation of bacterial viability by re-inoculation.
a.1 Development of checkerboard assay between ChS and antibiotics against Piscirickettsia salmonis
The interaction between ChS and OTC/FF against P. salmonis was evaluated using a microdilution plate checkerboard assay, adapted from methodologies [95,96].
Four independent biological replicates (n = 4) were performed for each antibiotic combined with ChS. The individual MIC previously determined for each compound was 750 µg/mL for ChS. An MIC of 0.24 µg/mL was obtained for OTC and 0.25 µg/mL for FF in the strain used (EM-90). These concentrations were used as a reference for the design of the checkerboard matrix and for the subsequent calculation of the fractional inhibitory concentration (FIC).
For the preparation of the assay, 50 µL of ChS solution, 50 µL of the respective antimicrobial solution (FF or OTC), and 100 µL of bacterial suspension were placed in each well of a 96-well microplate, resulting in a final volume of 200 µL per well. The final concentrations evaluated were 1500, 750, 375, 187.5, 93.75, 46.88, and 23.44 µg/mL for ChS, and 0.24, 0.12, 0.06, 0.03, 0.015, 0.0075, and 0.00375 µg/mL for OTC. In the case of FF, the final concentrations per well were 0.50, 0.25, 0.125, 0.0625, 0.0313, 0.0156, and 0.0078 µg/mL. The plates were incubated under the established conditions for the growth of P. salmonis [47]. Subsequently, bacterial growth was evaluated by visual inspection and spectrophotometric quantification at 630 nm using a microplate reader for OD measurements were performed using an Accuris SmartReader™ 96 (MR9600; Accuris Instruments/Benchmark Scientific, Edison, NJ, USA). In addition, the following internal controls were included in each microplate: Growth control (culture medium + bacterial inoculum without antimicrobial compound), sterility control (culture medium without bacteria) and polymer blank (turbidity controls ChS without bacteria), according to the consideration of changes in turbidity by Ch polymers, previously reported [47].
a.2 Visual Determination of Combined MIC
The visual evaluation of each well was performed according to CLSI protocol and previous reports [95,96,97], and using a semi-quantitative scale based on observed turbidity and supported by optical density (OD₆₃₀) measurements. The wells were e classified into three categories: score 0: no visible growth (OD₆₃₀ < 0.13), score 0.5: partial inhibition or slight turbidity (OD₆₃₀ between 0.13 and 0.30), score 1: evident growth (OD₆₃₀ > 0.30). Therefore, the combined MIC was defined as the lowest concentration combination of both compounds that produced complete visual inhibition of bacterial growth (score 0).
a.3 Calculation of the fractional inhibitory concentration index (FICI) and ΣFIC
The interaction between ChS and antibiotics was evaluated using the fractional inhibitory concentration index (FICI). Individual FICI values were calculated for each replicate according to the following equations:
where
The interpretation of the results was performed using the conventionally accepted criteria for checkerboard tests according to the ΣFIC [95,96] results: Synergy (FIC ≤ 0.5), Additivity (FIC > 0.5 ‒ ≤ 1), Indifference (FIC > 1 ‒ ≤ 4), Antagonism (FIC > 4).
b. Quantification of the Percentage of Inhibition Using Optical Density
Bacterial growth inhibition was quantified by measuring optical density (OD) at 630 nm. For each replicate, the percentages of inhibition were calculated by individually correcting each well for the OD corresponding to the bacteria-free ChC control of the same concentration, due to the slight increase in the optical density of Ch polymers, as previously described and reported [47].
The average values OD of the growth controls (inoculum) and sterile medium controls (SRS) were used to normalize the data. The percentage of inhibition was calculated using the following equation:
The values within the equation correspond to: ODtreatment = ChS well + FF + bacteria; ODblank ChS = ChS well without bacteria from the same row; ODinoculum = growth control from the same replicate; ODSRS = sterile control from the same replicate.
c. Bacterial Viability Assessment by Re-inoculation
To distinguish between bacteriostatic and bactericidal effects, a viability assessment was performed by re-inoculation of the wells visually classified as inhibited (score 0). The analysis was carried out for each biological replicate. The contents of each well were inoculated into Austral medium and incubated for 14 days under the culture conditions used for P. salmonis, as previously described and the presence or absence of bacterial growth was then recorded according to the methodology reported [47]. The recovery of growth after re-inoculation was interpreted as evidence of bacterial survival consistent with bacteriostatic activity, while the absence of growth was considered indicative of loss of viability consistent with possible bactericidal activity.
4.2. Biofilm Formation Inhibition Assay
Biofilm formation by P. salmonis exposed to ChS was evaluated with protocol described by Santibañez et al. [98] was used, with some modifications. The bacteria were cultured in sterile, 96-well, flat-bottom polystyrene microplates (JET BIOFIL). Austral-SRS medium was used, prepared in the same manner as for obtaining the MIC in this study. All wells had a final volume of 200 µL, prepared as follows: each control inoculum well was first filled with 180 µL of sterile Austral-SRS medium, while the Ch-S treatment wells were filled with 180 µL of a solution containing two Ch-S concentrations: the MIC (750 µg/mL) and a sub-MIC (375 µg/mL), using the same sterile Austral-SRS medium as the solvent.
Similarly, the control antibiotic (oxytetracycline) was added to the corresponding wells in a solution volume of 180 µL, at a concentration of 5 µg/mL (higher than the MIC of the bacterial strain (0.24 µg/mL) to provide positive antibiofilm control. Once all the microplates contained the volumes described above, the volume was brought up to 200 µL with 20 µL of bacterial inoculum (0.5 McFarland standard ~1.5 × 10⁸ CFU/mL) per well.
In addition, sterile Austral-SRS broth (200 µL) and ChS solution (200 µL) without inoculum at the two experimental concentrations (750 and 375 µg/mL) were used as negative controls and to correct the ODblanks measurements due to the increased background signal caused by the nonspecific interaction of the CV with polymeric matrices [99,100] like ChS. The microplates were capped and covered at the edges with permeable parafilm. They were incubated at 18 °C without shaking for up to 10 days.
Biofilm formation was quantified at 4, 6, 8 and 10 days of culture by crystal violet (CV) staining, following a standardized protocols [98,101] with modifications, according to the previously reported procedure [47]. Biofilm production was calculated according to the method of Stepanovic et al. [101], and the OD values obtained in the experiment were calculated according to the equation and procedure previously described [47,101].
- A.
- Biofilm Formation and Scanning Electron Microscopy Analysis
Biofilm formation by Piscirickettsia salmonis strain EM-90 was evaluated in the presence and absence of ChS using 24-well tissue culture plates containing sterile glass coverslips as adhesion substrates. Based on previous biofilm quantification essays, two incubation periods were selected for structural analysis: 6 and 10 days.
For each incubation period, an independent 24-well plate was prepared. Each plate was divided into two experimental groups consisting of 12 wells per treatment. The control group contained bacterial inoculum without ChS, whereas the treated group contained bacterial inoculum supplemented with ChS at its minimum inhibitory concentration (MIC = 750 µg/mL).
Each well contained a final volume of 1 mL and Bacterial suspensions of inoculum were then adjusted to approximately (0.5 McFarland standard ~1.5 × 10⁸ CFU/mL) for all assays. In treated wells, ChS was added to achieve a final concentration of 750 µg/mL, resulting in a final composition of 100 µL inoculum, 75 µL ChS stock solution (10mg/mL) and 825 µL SRS medium. Control wells contain 100 µL inoculum and 900 µL SRS medium. All cultures were incubated under the same conditions used for routine cultivation of P. salmonis. The plates were capped and covered at the edges with permeable parafilm. They were incubated at 18 °C without shaking for 6 or 10 days.
After 6 or 10 days of incubation, coverslips were carefully removed and gently washed with sterile phosphate-buffered saline (PBS) 1X solution to eliminate non-adherent cells. Biofilms were subsequently fixed in 2.5% glutaraldehyde prepared in PBS for 24 hours at 4°C, according to methods previously described [102]. SEM observations focused on qualitative comparisons of biofilm organization, spatial distribution of bacterial aggregates, extracellular polymeric matrix development, and structural alterations induced by ChS treatment relative to untreated controls.
4.3. Bacterial Viability and Membrane Permeability by Fluorescence Microscopy (LIVE/DEAD Imaging)
Membrane integrity of P. salmonis (EM-90) cells exposed to ChS was evaluated using the LIVE/DEAD BacLight bacterial viability kit (Thermo Fisher Scientific, USA). Bacterial suspensions (0.5 McFarland standard ~1.5 × 10⁸ CFU/mL) were exposed to ChS at its MIC (750 µg/mL) and the same culture without polymers was used as a negative control, and ethanol at 50% concentration was used with the culture as a positive control for rapid membrane permeabilization, as it is known to disrupt bacterial membrane structure, increase membrane fluidity, and induce leakage of intracellular contents, leading to loss of membrane integrity and uptake of membrane-impermeable dyes such as PI [103] and incubated at 18 °C with agitation (150 rpm). Samples were stained with SYTO9 (6 µM) and PI (30 µM) following the manufacturer’s instructions and based on previous reports [87]. Samples were taken for vital staining at 10 min, 30 min, 1 hour, 5 hours, 24 hours, 48 hours, 72 hours, 96 hours, and 120 hours of experimental exposure to the polymers and controls. Following experimental exposure to the biopolymers, the samples analyzed using the fluorescence ratio assay were subsequently cultured in Austral-SRS medium to evaluate bacterial recovery after 120 hours of incubation with the treatments.
Fluorescence images were obtained according to the procedure described above [47]. Images correspond to independent fields obtained from separate samples at each time point. Post-acquisition image processing and merging were performed using Fiji (ImageJ distribution). Individual green and red channel images were imported into the software and combined using the “Merge Channels” function to generate composite (overlay) images. Merged images (Green/Red overlays) were used to enable accurate visualization of membrane integrity and signal co-localization within the same field. Representative images were selected from replicate experiments to illustrate consistent patterns observed across independent experiments.
4.4. Scanning Electron Microscopy (SEM) of Bacteria
Morphostructural analysis was carried out using a Microscope (JEOL instrument model JSM-IT300LV, Pleasanton, CA, USA) located at the Faculty of Dentistry of the University of Chile. To examine by SEM images the changes in the morphology of bacteria exposed to biopolymers, samples were taken from bacterial cultures of P. salmonis exposed to ChS, ChC and from the culture without exposure to the polymers as a control. Before evaluation, the samples were lyophilized and metallized with gold, according to methods previously described [104].
4.5. Statistical Analysis
All experiments were performed in triplicate. Results are expressed as mean ± standard deviation (SD) and in the case of corrected OD in biofilm measurement tests, the standard error of the mean was used. Statistical significance between treatments was determined using one-way analysis of variance (ANOVA) followed by Tukey’s post hoc test using GraphPad Prism version 9.0. Differences were considered statistically significant when p < 0.05.
5. Conclusions
This study constitutes the first report describing the antibacterial activity in vitro of an HS-mimetic ChS against P. salmonis, together with the first demonstration of its additive interaction with FF and synergistic interaction with OTC, while subculture assays confirmed that these combinations exerted a bacteriostatic effect under the evaluated conditions.
Complementary experimental approaches consistently indicated that the bacterial envelope is a primary target of ChS. Progressive membrane permeabilization evidenced by LIVE/DEAD™ fluorescence imaging, together with the severe ultrastructural alterations observed by SEM. In parallel, the significant reduction in biofilm formation and the marked disruption of biofilm ultrastructure further supports the capacity of ChS to interfere with fundamental processes associated with bacterial persistence and antimicrobial tolerance. The integration of these experimental findings with current knowledge on membrane-associated resistance mechanisms in P. salmonis provides a biologically plausible explanation for the enhanced activity of FF and OTC observed in combination with ChS. These findings identify ChS as a promising antibiotic-sensitizing biomaterial with dual antibacterial and antibiofilm activity, suggesting its possible application as an antibiotic alternative strategy to improve antimicrobial therapy against salmonid rickettsial septicemia, with approach One Health.
Author Contributions
Conceptualization, S.A.B., A.A.H. and A.N.-C.; methodology, S.A.B., D.A.M.; software, S.A.B.; validation, S.A.B. and A.N.-C.; formal analysis, S.A.B. and A.N.-C.; investigation, S.A.B. and D.A.M.; resources, A.A.H. and A.N.-C.; data curation, D.A.M.; writing—original draft preparation, S.A.B. and D.A.M.; writing—review and editing, S.A.B. and A.N.-C.; visualization, S.A.B., D.A.M.; supervision, S.A.B. and A.N.-C.; project administration, S.A.B.; funding acquisition, A.A.H. and A.N.-C. All authors have read and agreed to the published version of the manuscript.
Funding
This research received no external funding.
Institutional Review Board Statement
Not applicable.
Informed Consent Statement
Not applicable.
Data Availability Statement
The data presented in this study is available on request from the corresponding author.
Acknowledgments
A. N.-C. thanks the ANID for financial support through Regular Fondecyt Project No. 1250931, which partially funded this work. D. Arrieta-Mendoza is grateful for the funding provided by postgraduate program: Doctorado en Ciencias Silvoagropecuarias y Veterinarias, Universidad de Chile, for the fee exemption scholarship from this accredited program.
Conflicts of Interest
The authors declare no conflicts of interest.
References
- SERNAPESCA. SERVICIO NACIONAL DE PESCA Y ACUICULTURA; DEPARTAMENTO DE SALUD ANIMAL Programa Sanitario General para la Vigilancia de la Susceptibilidad a Antimicrobianos en la Salmonicultura: Procedimiento de toma de muestras para aislamiento de Piscirickettsia salmonis y análisis para determinación de concentración mínima inhibitoria (CMI), mediante microdilución en caldo. In NORMA TÉCNICA No4; Servicio Nacional de Pesca y Acuicultura (SERNAPESCA): Santiago, Chile, 2020; p. 16. [Google Scholar]
- Rozas-Serri, M. Why Does Piscirickettsia Salmonis Break the Immunological Paradigm in Farmed Salmon? Biological Context to Understand the Relative Control of Piscirickettsiosis. Front. Immunol. 2022, 13, 856896. [Google Scholar] [CrossRef]
- Price, D.; Sánchez, J.; McClure, J.; McConkey, S.; Ibarra, R.; St-Hilaire, S. Assessing Concentration of Antibiotics in Tissue during Oral Treatments against Piscirickettsiosis. Prev. Vet. Med. 2018, 156, 16–21. [Google Scholar] [CrossRef]
- Diethelm-Varela, B.; Atero, N.; Córdova-Bührle, F.; Rezende, E.L.; Gelcich, S.; Sandoval, O.; Navarro, C.; Mardones, F.O. Epidemiology of Salmonid Rickettsial Septicemia ( SRS ) in Farmed Salmon: The Role of Sea Lice Infestations in Mortality Risk. J. Fish. Dis. 2025, e70097. [Google Scholar] [CrossRef]
- Cabello, F.C.; Godfrey, H.P.; Tomova, A.; Ivanova, L.; Dölz, H.; Millanao, A.; Buschmann, A.H. Antimicrobial Use in Aquaculture Re-examined: Its Relevance to Antimicrobial Resistance and to Animal and Human Health. Environ. Microbiol. 2013, 15, 1917–1942. [Google Scholar] [CrossRef]
- Millanao, A.R.; Barrientos-Schaffeld, C.; Siegel-Tike, C.D.; Tomova, A.; Ivanova, L.; Godfrey, H.P.; Dölz, H.J.; Buschmann, A.H.; Cabello, F.C. Resistencia a Los Antimicrobianos En Chile y El Paradigma de Una Salud: Manejando Los Riesgos Para La Salud Pública Humana y Animal Resultante Del Uso de Antimicrobianos En La Acuicultura Del Salmón y En Medicina. Rev. chil. infectol. 2018, 35, 299–308. [Google Scholar] [CrossRef]
- Souto Cavalli, L.; Tapia-Jopia, C.; Ochs, C.; López Gómez, M.A.; Neis, B. Salmon Mass Mortality Events and Occupational Health and Safety in Chilean Aquaculture. All. Life 2023, 16, 2207772. [Google Scholar] [CrossRef]
- Farias, D.R.; Ibarra, R.; Tucca, F.; Jaramillo-Torres, A.; Cornejo, J.; Ibieta, P.; Mardones, F.O.; Avendaño-Herrera, R. Insights and Lessons from Chilean Salmon Aquaculture on Antimicrobial Use. Antibiotics 2025, 14, 1177. [Google Scholar] [CrossRef]
- Rozas, M.; Enríquez, R. Piscirickettsiosis and P Iscirickettsia Salmonis in Fish: A Review. J. Fish. Dis. 2014, 37, 163–188. [Google Scholar] [CrossRef]
- Escalona, C.E.; Santibañez, N.; Cortés, M.; Arriagada, V.; Ruiz, P.; Fuentes, D.; Romero, A.; Oliver, C. Sub-Inhibitory Concentrations of Florfenicol Modulate the Expression of Biofilm Formation and Antibiotic Resistance-Associated Genes in Biofilm-Embedded Piscirickettsia Salmonis. J. Fish. Dis. 2026, e70166. [Google Scholar] [CrossRef]
- San Martín, B.; Fresno, M.; Cornejo, J.; Godoy, M.; Ibarra, R.; Vidal, R.; Araneda, M.; Anadón, A.; Lapierre, L. Optimization of Florfenicol Dose against Piscirickettsia Salmonis in Salmo Salar through PK/PD Studies. PLoS ONE 2019, 14, e0215174. [Google Scholar] [CrossRef]
- Bondad-Reantaso, M.G.; MacKinnon, B.; Karunasagar, I.; Fridman, S.; Alday-Sanz, V.; Brun, E.; Le Groumellec, M.; Li, A.; Surachetpong, W.; Karunasagar, I.; et al. Review of Alternatives to Antibiotic Use in Aquaculture. Rev. Aquac. 2023, 15, 1421–1451. [Google Scholar] [CrossRef]
- Trincado, L.; Wacyk, J.; Cáceres, S.; Rodriguez, M.E.; Fuentes, C.; Maddaleno, A.; Pokrant, E.; Flores, A.; Salgado, P.; Oyarzun-Ampuero, F.; et al. Oxytetracycline Dose Reduction in Salmon Farming: Assessing a Micro Encapsulated Novel Formulation in an in Vivo Model. Aquaculture 2024, 593, 741260. [Google Scholar] [CrossRef]
- Oliver, C.; Céspedes, C.; Santibañez, N.; Ruiz, P.; Romero, A. Subinhibitory Concentrations of Florfenicol Increase the Biofilm Formation of Piscirickettsia Salmonis. J. Fish. Dis. 2023, 46, 591–596. [Google Scholar] [CrossRef]
- Kotenkova, E.; Kotov, A.; Nikitin, M. Polysaccharide-Based Nanocarriers for Natural Antimicrobials: A Review. Polymers 2025, 17, 1750. [Google Scholar] [CrossRef]
- Li, X.; Fan, Y.; Li, J.; Yan, C.; Wang, P.; Jia, C. Antibacterial Hydrogels for Skin Infected Wounds: Frontier Approaches as Antibiotic Alternatives Therapy. Front. Cell. Infect. Microbiol. 2026, 16, 1769669. [Google Scholar] [CrossRef]
- Ardean, C.; Davidescu, C.M.; Nemeş, N.S.; Negrea, A.; Ciopec, M.; Duteanu, N.; Negrea, P.; Duda-Seiman, D.; Musta, V. Factors Influencing the Antibacterial Activity of Chitosan and Chitosan Modified by Functionalization. IJMS 2021, 22, 7449. [Google Scholar] [CrossRef]
- Hallmann, L.; Gerngroß, M.D. Antibacterial Polysaccharides in Dental Implantology. Mar. Drugs 2025, 23, 321. [Google Scholar] [CrossRef]
- Mania, S.; Banach-Kopeć, A.; Staszczyk, K.; Kulesza, J.; Augustin, E.; Tylingo, R. An Influence of Molecular Weight, Deacetylation Degree of Chitosan Xerogels on Their Antimicrobial Activity and Cytotoxicity. Comparison of Chitosan Materials Obtained Using Lactic Acid and CO2 Saturation. Carbohydr. Res. 2023, 534, 108973. [Google Scholar] [CrossRef]
- Ke, C.-L.; Deng, F.-S.; Chuang, C.-Y.; Lin, C.-H. Antimicrobial Actions and Applications of Chitosan. Polymers 2021, 13, 904. [Google Scholar] [CrossRef]
- Confederat, L.G.; Tuchilus, C.G.; Dragan, M.; Sha’at, M.; Dragostin, O.M. Preparation and Antimicrobial Activity of Chitosan and Its Derivatives: A Concise Review. Molecules 2021, 26, 3694. [Google Scholar] [CrossRef]
- Si, Z.; Hou, Z.; Vikhe, Y.S.; Thappeta, K.R.V.; Marimuthu, K.; De, P.P.; Ng, O.T.; Li, P.; Zhu, Y.; Pethe, K.; et al. Antimicrobial Effect of a Novel Chitosan Derivative and Its Synergistic Effect with Antibiotics. ACS Appl. Mater. Interfaces 2021, 13, 3237–3245. [Google Scholar] [CrossRef]
- Egorov, A.R.; Kirichuk, A.A.; Rubanik, V.V.; Rubanik, V.V.; Tskhovrebov, A.G.; Kritchenkov, A.S. Chitosan and Its Derivatives: Preparation and Antibacterial Properties. Materials 2023, 16, 6076. [Google Scholar] [CrossRef]
- Dimassi, S.; Tabary, N.; Chai, F.; Blanchemain, N.; Martel, B. Sulfonated and Sulfated Chitosan Derivatives for Biomedical Applications: A Review. Carbohydr. Polym. 2018, 202, 382–396. [Google Scholar] [CrossRef]
- Doncel-Pérez, E.; Aranaz, I.; Bastida, A.; Revuelta, J.; Camacho, C.; Acosta, N.; Garrido, L.; Civera, C.; García-Junceda, E.; Heras, A.; et al. Synthesis, Physicochemical Characterization and Biological Evaluation of Chitosan Sulfate as Heparan Sulfate Mimics. Carbohydr. Polym. 2018, 191, 225–233. [Google Scholar] [CrossRef]
- Muñoz-Bonilla, A.; Echeverria, C.; Sonseca, Á.; Arrieta, M.P.; Fernández-García, M. Bio-Based Polymers with Antimicrobial Properties towards Sustainable Development. Materials 2019, 12, 641. [Google Scholar] [CrossRef]
- Revuelta, J.; Rusu, L.; Frances-Gomez, C.; Trapero, E.; Iglesias, S.; Pinilla, E.C.; Blázquez, A.-B.; Gutiérrez-Adán, A.; Konuparamban, A.; Moreno, O.; et al. Synthetic Heparan Sulfate Mimics Based on Chitosan Derivatives Show Broad-Spectrum Antiviral Activity. Commun. Biol. 2025, 8, 360. [Google Scholar] [CrossRef]
- Revuelta, J.; Fraile, I.; Monterrey, D.T.; Peña, N.; Benito-Arenas, R.; Bastida, A.; Fernández-Mayoralas, A.; García-Junceda, E. Heparanized Chitosans: Towards the Third Generation of Chitinous Biomaterials. Mater. Horiz. 2021, 8, 2596–2614. [Google Scholar] [CrossRef]
- Pérez-Pacheco, Y.; Parajuli, D.; García-Valls, R. Emerging Nanomedicine Strategies for Chronic Disease Management Based on Chitosan. IJMS 2026, 27, 1387. [Google Scholar] [CrossRef]
- Khan, S.; Faisal, S.; Shams, D.F.; Zia, M.; Nadhman, A. Photo-inactivation of Bacteria in Hospital Effluent via Thiolated Iron-doped Nanoceria. IET Nanobiotechnology 2019, 13, 875–879. [Google Scholar] [CrossRef]
- Federer, C.; Kurpiers, M.; Bernkop-Schnürch, A. Thiolated Chitosans: A Multi-Talented Class of Polymers for Various Applications. Biomacromolecules 2021, 22, 24–56. [Google Scholar] [CrossRef]
- Schmitz, T.; Hombach, J.; Bernkop-Schnürch, A. Chitosan-N-Acetyl Cysteine Conjugates: In Vitro Evaluation of Permeation Enhancing and P-Glycoprotein Inhibiting Properties. Drug Deliv. 2008, 15, 245–252. [Google Scholar] [CrossRef]
- Alfinaikh, R.S.; Alamry, K.A.; Hussein, M.A. Sustainable and Biocompatible Hybrid Materials-Based Sulfated Polysaccharides for Biomedical Applications: A Review. RSC Adv. 2025, 15, 4708–4767. [Google Scholar] [CrossRef]
- Zehr, E.P.; Erzen, C.L.; Oshima, K.; Langouet-Astrie, C.J.; LaRiviere, W.B.; Shi, D.; Zhang, F.; McCollister, B.D.; Windham, S.L.; Rizzo, A.N.; et al. Bacterial Pneumonia-Induced Shedding of Epithelial Heparan Sulfate Inhibits the Bactericidal Activity of Cathelicidin in a Murine Model. Am. J. Physiol.-Lung Cell. Mol. Physiol. 2024, 326, L206–L212. [Google Scholar] [CrossRef]
- Valcarcel, J.; Novoa-Carballal, R.; Pérez-Martín, R.I.; Reis, R.L.; Vázquez, J.A. Glycosaminoglycans from Marine Sources as Therapeutic Agents. Biotechnol. Adv. 2017, 35, 711–725. [Google Scholar] [CrossRef]
- Rajan, A.; Robertson, M.J.; Carter, H.E.; Poole, N.M.; Clark, J.R.; Green, S.I.; Criss, Z.K.; Zhao, B.; Karandikar, U.; Xing, Y.; et al. Enteroaggregative E. Coli Adherence to Human Heparan Sulfate Proteoglycans Drives Segment and Host Specific Responses to Infection. PLoS Pathog. 2020, 16, e1008851. [Google Scholar] [CrossRef]
- Sanchez, H.; Hopkins, D.; Demirdjian, S.; Gutierrez, C.; O’Toole, G.A.; Neelamegham, S.; Berwin, B. Identification of Cell-Surface Glycans That Mediate Motility-Dependent Binding and Internalization of Pseudomonas Aeruginosa by Phagocytes. Mol. Immunol. 2021, 131, 68–77. [Google Scholar] [CrossRef]
- Arrieta-Mendoza, D.; Garces, B.; Hidalgo, A.A.; Neira, V.; Ramirez, G.; Neira-Carrillo, A.; Bucarey, S.A. Design of a New Vaccine Prototype against Porcine Circovirus Type 2 (PCV2), M. Hyopneumoniae and M. Hyorhinis Based on Multiple Antigens Microencapsulation with Sulfated Chitosan. Vaccines 2024, 12, 550. [Google Scholar] [CrossRef]
- Jiménez-Arriagada, D.; Hidalgo, A.A.; Neira, V.; Neira-Carrillo, A.; Bucarey, S.A. Low Molecular Weight Sulfated Chitosan Efficiently Reduces Infection Capacity of Porcine Circovirus Type 2 (PCV2) in PK15 Cells. Virol. J. 2022, 19, 52. [Google Scholar] [CrossRef]
- Bucarey, S.A.; Ramos, V.; Hidalgo, A.A.; Neira, V.; Neira-Carrillo, A.; Ferrer, P. Low-Molecular-Weight Sulfated Chitosan Microparticles Efficiently Bind HIV-1 In Vitro: Potential for Microbicide Applications. Molecules 2026, 31, 395. [Google Scholar] [CrossRef]
- Dessenne, C.; Mariller, C.; Vidal, O.; Huvent, I.; Guerardel, Y.; Elass-Rochard, E.; Rossez, Y. Glycan-Mediated Adhesion Mechanisms in Antibiotic-Resistant Bacteria. BBA Adv. 2025, 7, 100156. [Google Scholar] [CrossRef]
- Sahariah, P.; Másson, M. Antimicrobial Chitosan and Chitosan Derivatives: A Review of the Structure–Activity Relationship. Biomacromolecules 2017, 18, 3846–3868. [Google Scholar] [CrossRef]
- Cesari, A.; Fabiano, A.; Piras, A.M.; Zambito, Y.; Uccello-Barretta, G.; Balzano, F. Binding and Mucoadhesion of Sulfurated Derivatives of Quaternary Ammonium-Chitosans and Their Nanoaggregates: An NMR Investigation. J. Pharm. Biomed. Anal. 2020, 177, 112852. [Google Scholar] [CrossRef]
- Žigrayová, D.; Mikušová, V.; Mikuš, P. Advances in Chitosan Derivatives: Preparation, Properties and Applications in Pharmacy and Medicine. Gels 2024, 10, 701. [Google Scholar] [CrossRef]
- Sousa, V.; Monteiro, L.P.G.; Rocha, D.H.A.; Rodrigues, J.M.M.; Borges, J.; Mano, J.F. Marine-Origin Polysaccharides and Their Chemically Modified Derivatives as Sources of Advanced Biofunctional Materials for Biomedical Applications. Biomacromolecules 2025, 26, 4735–4772. [Google Scholar] [CrossRef]
- Bucarey Vivanco, S.A.; Neira Carrillo, A.; Neira Ramirez, V.M. US20210059951 Vaccine Treatment and Control Infectious against Viral Pathogens Utilizing Heparan Sulfate (HS) as Cellular Receptor. 2022. [Google Scholar]
- Arrieta-Mendoza, D.; Hidalgo, A.A.; Neira-Carrillo, A.; Bucarey, S.A. Sulfated Chitosan Induces Membrane Disruption, Aggregation, and Antibiofilm Activity in Piscirickettsia Salmonis: A Biomimetic Strategy as an Antimicrobial Alternative in Aquaculture. Antibiotics 2026, 15, 435. [Google Scholar] [CrossRef]
- Schober, I.; Bunk, B.; Carril, G.; Freese, H.M.; Ojeda, N.; Riedel, T.; Meier-Kolthoff, J.P.; Göker, M.; Spröer, C.; Flores-Herrera, P.A.; et al. Ongoing Diversification of the Global Fish Pathogen Piscirickettsia Salmonis through Genetic Isolation and Transposition Bursts. ISME J. 2023, 17, 2247–2258. [Google Scholar] [CrossRef]
- Manik, E.R.; Kaban, J. Synthesis of Sulfated Chitosan Through Sulfation Reaction of Chitosan with Chlorosulfonic Acid in N, N-Dimethylformamide, and Antibacterial Activity Test. JCNaR 2022, 4, 1–8. [Google Scholar] [CrossRef]
- Sun, Z.; Shi, C.; Wang, X.; Fang, Q.; Huang, J. Synthesis, Characterization, and Antimicrobial Activities of Sulfonated Chitosan. Carbohydr. Polym. 2017, 155, 321–328. [Google Scholar] [CrossRef]
- Fatoni, A.; Ahmad, I.N.; Utami, H.; Erjon; Rendowaty, A.; Hidayati, N. Synthesis, Characterization of Chitosan Sulfate Nanoparticles and Their Activity against Bacterial; Bogor, Indonesia, 2023; p. 020007. [Google Scholar]
- Zhang, M.; Li, Z.-E.; Duan, M.-H.; Dai, Y.; Jin, Y.-G.; Liu, Y.; Zhang, Y.-N.; Li, X.-P.; Yang, F. Effects of Chitooligosaccharide on the in Vitro Antibacterial Activity against Avian Escherichia Coli and the Pharmacokinetics of Florfenicol in Healthy Chickens. Poult. Sci. 2024, 103, 103373. [Google Scholar] [CrossRef]
- Luo, W.; Liu, J.; Zhang, M.; Jiang, Y.; Sun, B.; Xie, S.; Sobhy Dawood, A.; Attia Algharib, S.; Gao, X. Florfenicol Core–Shell Composite Nanogels as Oral Administration for Efficient Treatment of Bacterial Enteritis. Int. J. Pharm. 2024, 662, 124499. [Google Scholar] [CrossRef]
- Yuan, X.; Liu, J.; Li, R.; Zhou, J.; Wei, J.; Jiao, S.; Wang, Z.A.; Du, Y. Chitosan Oligosaccharides Coupling Inhibits Bacterial Biofilm-Related Antibiotic Resistance against Florfenicol. Molecules 2020, 25, 6043. [Google Scholar] [CrossRef]
- Liu, J.; Ju, M.; Wu, Y.; Leng, N.; Algharib, S.A.; Luo, W. Antibacterial Activity of Florfenicol Composite Nanogels against Staphylococcus Aureus Small Colony Variants. J. Vet. Sci. 2022, 23, e78. [Google Scholar] [CrossRef]
- Grosu, O.-M.; Dragostin, O.-M.; Gardikiotis, I.; Chitescu, C.L.; Lisa, E.L.; Zamfir, A.-S.; Confederat, L.; Dragostin, I.; Dragan, M.; Stan, C.D.; et al. Experimentally Induced Burns in Rats Treated with Innovative Polymeric Films Type Therapies. Biomedicines 2023, 11, 852. [Google Scholar] [CrossRef]
- Charway, G.N.A.; Park, S.; Yu, D.; Je, J.-Y.; Kim, D.-H.; Jung, W.-K.; Kim, Y.-M. In Vitro Antibacterial and Synergistic Effect of Chitosan-Phytochemical Conjugates Against Antibiotic Resistant Fish Pathogenic Bacteria. Indian J. Microbiol. 2019, 59, 116–120. [Google Scholar] [CrossRef]
- Yang, B.; Lei, Z.; Zhao, Y.; Ahmed, S.; Wang, C.; Zhang, S.; Fu, S.; Cao, J.; Qiu, Y. Combination Susceptibility Testing of Common Antimicrobials in Vitro and the Effects of Sub-MIC of Antimicrobials on Staphylococcus Aureus Biofilm Formation. Front. Microbiol. 2017, 8, 2125. [Google Scholar] [CrossRef]
- Shafique, L.; Wu, S.; Aqib, A.I.; Ali, M.M.; Ijaz, M.; Naseer, M.A.; Sarwar, Z.; Ahmed, R.; Saleem, A.; Qudratullah; et al. Evidence-Based Tracking of MDR E. Coli from Bovine Endometritis and Its Elimination by Effective Novel Therapeutics. Antibiotics 2021, 10, 997. [Google Scholar] [CrossRef]
- Wei, C.-F.; Shien, J.-H.; Chang, S.-K.; Chou, C.-C. Florfenicol As a Modulator Enhancing Antimicrobial Activity: Example Using Combination with Thiamphenicol against Pasteurella Multocida. Front. Microbiol. 2016, 7. [Google Scholar] [CrossRef]
- Cameron, A.; Zaheer, R.; McAllister, T.A. Emerging Variants of the Integrative and Conjugant Element ICEMh1 in Livestock Pathogens: Structural Insights, Potential Host Range, and Implications for Bacterial Fitness and Antimicrobial Therapy. Front. Microbiol. 2019, 10, 2608. [Google Scholar] [CrossRef]
- Rattanapanadda, P.; Kuo, H.-C.; Vickroy, T.W.; Sung, C.-H.; Rairat, T.; Lin, T.-L.; Yeh, S.-Y.; Chou, C.-C. In Vitro and in Vivo Synergistic Effects of Florfenicol and Thiamphenicol in Combination Against Swine Actinobacillus Pleuropneumoniae and Pasteurella Multocida. Front. Microbiol. 2019, 10, 2430. [Google Scholar] [CrossRef]
- Fostier, C.R.; Monlezun, L.; Ousalem, F.; Singh, S.; Hunt, J.F.; Boël, G. ABC-F Translation Factors: From Antibiotic Resistance to Immune Response. FEBS Lett. 2021, 595, 675–706. [Google Scholar] [CrossRef]
- Day, C.J.; Tran, E.N.; Semchenko, E.A.; Tram, G.; Hartley-Tassell, L.E.; Ng, P.S.K.; King, R.M.; Ulanovsky, R.; McAtamney, S.; Apicella, M.A.; et al. Glycan:Glycan Interactions: High Affinity Biomolecular Interactions That Can Mediate Binding of Pathogenic Bacteria to Host Cells. Proc. Natl. Acad. Sci. U.S.A. 2015, 112. [Google Scholar] [CrossRef]
- Sandoval, R.; Oliver, C.; Valdivia, S.; Valenzuela, K.; Haro, R.E.; Sánchez, P.; Olavarría, V.H.; Valenzuela, P.; Avendaño-Herrera, R.; Romero, A.; et al. Resistance-Nodulation-Division Efflux Pump acrAB Is Modulated by Florfenicol and Contributes to Drug Resistance in the Fish Pathogen Piscirickettsia Salmonis. FEMS Microbiol. Lett. 2016, 363, fnw102. [Google Scholar] [CrossRef]
- Cartes, C.; Isla, A.; Lagos, F.; Castro, D.; Muñoz, M.; Yañez, A.; Haussmann, D.; Figueroa, J. Search and Analysis of Genes Involved in Antibiotic Resistance in Chilean Strains of Piscirickettsia Salmonis. J. Fish. Dis. 2017, 40, 1025–1039. [Google Scholar] [CrossRef]
- Figueroa, J.; Castro, D.; Lagos, F.; Cartes, C.; Isla, A.; Yáñez, A.J.; Avendaño-Herrera, R.; Haussmann, D. Analysis of Single Nucleotide Polymorphisms (SNPs) Associated with Antibiotic Resistance Genes in Chilean Piscirickettsia Salmonis Strains. J. Fish. Dis. 2019, 42, 1645–1655. [Google Scholar] [CrossRef]
- Madhi, M.; Hasani, A.; Mojarrad, J.S.; Rezaee, M.A.; Zarrini, G.; Davaran, S. Nano-Strategies in Pursuit of Efflux Pump Activeness in Acinetobacter Baumannii and Pseudomonas Aeruginosa. Gene Rep. 2020, 21, 100915. [Google Scholar] [CrossRef]
- Faridi, F.; Abbasi, S.; Shoja, S.; Bahador, N. Antibacterial Activity of Chitosan and PAβN on MexAB Expression in Clinical Isolates of Ciprofloxacin Resistant Pseudomonas Aeruginosa. Jundishapur J. Microbiol. 2021, 14. [Google Scholar] [CrossRef]
- Yan, D.; Li, Y.; Liu, Y.; Li, N.; Zhang, X.; Yan, C. Antimicrobial Properties of Chitosan and Chitosan Derivatives in the Treatment of Enteric Infections. Molecules 2021, 26, 7136. [Google Scholar] [CrossRef]
- Nag, M.; Lahiri, D.; Mukherjee, D.; Banerjee, R.; Garai, S.; Sarkar, T.; Ghosh, S.; Dey, A.; Ghosh, S.; Pattnaik, S.; et al. Functionalized Chitosan Nanomaterials: A Jammer for Quorum Sensing. Polymers 2021, 13, 2533. [Google Scholar] [CrossRef]
- Limayem, A.; Patil, S.B.; Mehta, M.; Cheng, F.; Nguyen, M. A Streamlined Study on Chitosan-Zinc Oxide Nanomicelle Properties to Mitigate a Drug-Resistant Biofilm Protection Mechanism. Front. Nanotechnol. 2020, 2, 592739. [Google Scholar] [CrossRef]
- Sahariah, P.; Papi, F.; Merz, K.L.; Sigurjonsson, O.E.; Meyer, R.L.; Nativi, C. Chitosan–Saccharide Conjugates for Eradication of Pseudomonas Aeruginosa Biofilms. RSC Appl. Polym. 2024, 2, 461–472. [Google Scholar] [CrossRef]
- Riahi, A.; Mabudi, H.; Tajbakhsh, E.; Roomiani, L.; Momtaz, H. Optimizing Chitosan Derived from Metapenaeus Affinis: A Novel Anti-Biofilm Agent against Pseudomonas Aeruginosa. AMB Expr. 2024, 14, 77. [Google Scholar] [CrossRef]
- Patel, K.K.; Surekha, D.B.; Tripathi, M.; Anjum, Md.M.; Muthu, M.S.; Tilak, R.; Agrawal, A.K.; Singh, S. Antibiofilm Potential of Silver Sulfadiazine-Loaded Nanoparticle Formulations: A Study on the Effect of DNase-I on Microbial Biofilm and Wound Healing Activity. Mol. Pharm. 2019, 16, 3916–3925. [Google Scholar] [CrossRef]
- Huang, J.; Liu, Y.; Yang, L.; Zhou, F. Synthesis of Sulfonated Chitosan and Its Antibiofilm Formation Activity against E. Coli and S. Aureus. Int. J. Biol. Macromol. 2019, 129, 980–988. [Google Scholar] [CrossRef]
- Sun, J.; Shen, H.-L.; Pan, J.-N.; Yu, T.; Zhou, W.-W. Ferrous Sulfate/Carboxymethyl Chitosan Agar-Based Film Triggers Ferroptosis in Pseudomonas Aeruginosa Planktonic and Biofilm Cells for Antibacterial Preservation of Fruits and Vegetables. Int. J. Biol. Macromol. 2025, 308, 142697. [Google Scholar] [CrossRef]
- Sánchez, P.; Oliver, C.; Hernández, M.; Cortés, M.; Cecilia Rauch, M.; Valenzuela, K.; Garduño, R.A.; Avendaño-Herrera, R.; Yáñez, A.J. In Vitro Genomic and Proteomic Evidence of a Type IV Pili-like Structure in the Fish Pathogen Piscirickettsia Salmonis. FEMS Microbiol. Lett. 2018, 365. [Google Scholar] [CrossRef]
- Levipan, H.A.; Irgang, R.; Yáñez, A.; Avendaño-Herrera, R. Improved Understanding of Biofilm Development by Piscirickettsia Salmonis Reveals Potential Risks for the Persistence and Dissemination of Piscirickettsiosis. Sci. Rep. 2020, 10, 12224. [Google Scholar] [CrossRef]
- Gerlach, R.; Hensel, M. Protein Secretion Systems and Adhesins: The Molecular Armory of Gram-Negative Pathogens. Int. J. Med. Microbiol. 2007, 297, 401–415. [Google Scholar] [CrossRef]
- Valenzuela-Aviles, P.; Torrealba, D.; Figueroa, C.; Mercado, L.; Dixon, B.; Conejeros, P.; Gallardo-Matus, J. Why Vaccines Fail against Piscirickettsiosis in Farmed Salmon and Trout and How to Avoid It: A Review. Front. Immunol. 2022, 13, 1019404. [Google Scholar] [CrossRef]
- Oliver, C.; Sánchez, P.; Valenzuela, K.; Hernández, M.; Pontigo, J.P.; Rauch, M.C.; Garduño, R.A.; Avendaño-Herrera, R.; Yáñez, A.J. Subcellular Location of Piscirickettsia Salmonis Heat Shock Protein 60 (Hsp60) Chaperone by Using Immunogold Labeling and Proteomic Analysis. Microorganisms 2020, 8, 117. [Google Scholar] [CrossRef]
- Oliver, C.; Hernández, M.A.; Tandberg, J.I.; Valenzuela, K.N.; Lagos, L.X.; Haro, R.E.; Sánchez, P.; Ruiz, P.A.; Sanhueza-Oyarzún, C.; Cortés, M.A.; et al. The Proteome of Biologically Active Membrane Vesicles from Piscirickettsia Salmonis LF-89 Type Strain Identifies Plasmid-Encoded Putative Toxins. Front. Cell. Infect. Microbiol. 2017, 7, 420. [Google Scholar] [CrossRef]
- Herrera, V.; Olavarría, N.; Saavedra, J.; Yuivar, Y.; Bustos, P.; Almarza, O.; Mancilla, M. Complete Lipopolysaccharide of Piscirickettsia Salmonis Is Required for Full Virulence in the Intraperitoneally Challenged Atlantic Salmon, Salmo Salar, Model. Front. Cell. Infect. Microbiol. 2022, 12, 845661. [Google Scholar] [CrossRef]
- Marshall, S.H.; Gómez, F.A.; Ramírez, R.; Nilo, L.; Henríquez, V. Biofilm Generation by Piscirickettsia Salmonis under Growth Stress Conditions: A Putative in Vivo Survival/Persistence Strategy in Marine Environments. Res. Microbiol. 2012, 163, 557–566. [Google Scholar] [CrossRef]
- Chukwu-Osazuwa, J.; Cao, T.; Vasquez, I.; Gnanagobal, H.; Hossain, A.; Machimbirike, V.I.; Santander, J. Comparative Reverse Vaccinology of Piscirickettsia Salmonis, Aeromonas Salmonicida, Yersinia Ruckeri, Vibrio Anguillarum and Moritella Viscosa, Frequent Pathogens of Atlantic Salmon and Lumpfish Aquaculture. Vaccines 2022, 10, 473. [Google Scholar] [CrossRef]
- Levipan, H.A.; Irgang, R.; Opazo, L.F.; Araya-León, H.; Avendaño-Herrera, R. Collective Behavior and Virulence Arsenal of the Fish Pathogen Piscirickettsia Salmonis in the Biofilm Realm. Front. Cell. Infect. Microbiol. 2022, 12, 1067514. [Google Scholar] [CrossRef]
- Ahmad, M.; Aduru, S.V.; Smith, R.P.; Zhao, Z.; Lopatkin, A.J. The Role of Bacterial Metabolism in Antimicrobial Resistance. Nat. Rev. Microbiol. 2025, 23, 439–454. [Google Scholar] [CrossRef]
- Trincado, L.; Wacyk, J.; Fuentes, C.; Sánchez, V.; Maddaleno, A.; Vargas, M.B.; Zavala, S.; Castro, S.; Álvarez-Acevedo, G.; Oyarzun-Ampuero, F.; et al. Oxytetracycline Delivery in Rainbow Trout (Oncorhynchus Mykiss) Using Zinc-Alginate Microparticles: Formulation Optimization, Release Kinetics, and Relative Bioavailability. Aquac. Rep. 2026, 50, 103782. [Google Scholar] [CrossRef]
- Rigos, G.; Smith, P. A Critical Approach on Pharmacokinetics, Pharmacodynamics, Dose Optimisation and Withdrawal Times of Oxytetracycline in Aquaculture. Rev. Aquac. 2015, 7, 77–106. [Google Scholar] [CrossRef]
- Toutain, P.; Pelligand, L.; Lees, P.; Bousquet-Mélou, A.; Ferran, A.A.; Turnidge, J.D. The Pharmacokinetic/Pharmacodynamic Paradigm for Antimicrobial Drugs in Veterinary Medicine: Recent Advances and Critical Appraisal. Vet. Pharm. Ther. 2021, 44, 172–200. [Google Scholar] [CrossRef]
- Mikalsen, J.; Skjærvik, O.; Wiik-Nielsen, J.; Wasmuth, M.A.; Colquhoun, D.J. Agar Culture of Piscirickettsia Salmonis , a Serious Pathogen of Farmed Salmonid and Marine Fish. FEMS Microbiol. Lett. 2008, 278, 43–47. [Google Scholar] [CrossRef]
- Vera, T.; Isla, A.; Cuevas, A.; Figueroa, J. Un Nuevo Medio de Cultivo Líquido Para El Patógeno Piscirickettsia Salmonis. Arch. med. vet. 2012, 44, 273–277. [Google Scholar] [CrossRef]
- CLSI Clinical and Laboratory Standards Institute. Methods for Dilution Antimicrobial Susceptibility Tests for Bacteria That Grow Aerobically; M07. 2024. [Google Scholar]
- Yi, L.; Cao, M.; Chen, X.; Bai, Y.; Wang, W.; Wei, X.; Shi, Y.; Zhang, Y.; Ma, T.; Zhu, Z.; et al. In Vitro Antimicrobial Synergistic Activity and the Mechanism of the Combination of Naringenin and Amikacin Against Antibiotic-Resistant Escherichia Coli. Microorganisms 2024, 12, 1871. [Google Scholar] [CrossRef]
- Bentley, D.J. Revisiting the Checkerboard to Inform Development of β-Lactam/β-Lactamase Inhibitor Combinations. Antibiotics 2024, 13, 337. [Google Scholar] [CrossRef]
- Bidaud, A.-L.; Schwarz, P.; Herbreteau, G.; Dannaoui, E. Techniques for the Assessment of In Vitro and In Vivo Antifungal Combinations. JoF 2021, 7, 113. [Google Scholar] [CrossRef]
- Santibañez, N.; Vega, M.; Pérez, T.; Yáñez, A.; González-Stegmaier, R.; Figueroa, J.; Enríquez, R.; Oliver, C.; Romero, A. Biofilm Produced In Vitro by Piscirickettsia Salmonis Generates Differential Cytotoxicity Levels and Expression Patterns of Immune Genes in the Atlantic Salmon Cell Line SHK-1. Microorganisms 2020, 8, 1609. [Google Scholar] [CrossRef]
- Peeters, E.; Nelis, H.J.; Coenye, T. Comparison of Multiple Methods for Quantification of Microbial Biofilms Grown in Microtiter Plates. J. Microbiol. Methods 2008, 72, 157–165. [Google Scholar] [CrossRef]
- Amador, C.I.; Stannius, R.O.; Røder, H.L.; Burmølle, M. High-Throughput Screening Alternative to Crystal Violet Biofilm Assay Combining Fluorescence Quantification and Imaging. J. Microbiol. Methods 2021, 190, 106343. [Google Scholar] [CrossRef]
- Stepanović, S.; Vuković, D.; Hola, V.; Bonaventura, G.D.; Djukić, S.; Ćirković, I.; Ruzicka, F. Quantification of Biofilm in Microtiter Plates: Overview of Testing Conditions and Practical Recommendations for Assessment of Biofilm Production by Staphylococci. APMIS 2007, 115, 891–899. [Google Scholar] [CrossRef]
- Pavez, V.B.; Pacheco, N.; Castro-Severyn, J.; Pardo-Esté, C.; Álvarez, J.; Zepeda, P.; Krüger, G.; Gallardo, K.; Melo, F.; Vernal, R.; et al. Characterization of Biofilm Formation by Exiguobacterium Strains in Response to Arsenic Exposure. Microbiol. Spectr. 2023, 11, e02657-23. [Google Scholar] [CrossRef]
- Loison, P.; Gervais, P.; Perrier-Cornet, J.-M.; Kuimova, M.K. Effect of Ethanol Perturbation on Viscosity and Permeability of an Inner Membrane in Bacillus Subtilis Spores. Biochim. Et. Biophys. Acta (BBA) -Biomembr. 2016, 1858, 2060–2069. [Google Scholar] [CrossRef]
- Bucarey, S.A.; Pujol, M.; Poblete, J.; Nuñez, I.; Tapia, C.V.; Neira-Carrillo, A.; Martinez, J.; Bassa, O. Chitosan Microparticles Loaded with Yeast-Derived PCV2 Virus-like Particles Elicit Antigen-Specific Cellular Immune Response in Mice after Oral Administration. Virol. J. 2014, 11, 149. [Google Scholar] [CrossRef]
Figure 1.
Comparative checkerboard analysis of ChS-MIC (750 μg/mL) combined with OTC-MIC (0.24 μg/mL) or FF-MIC (0.25 μg/mL) against Piscirickettsia salmonis EM-90. (A) Summary of checkerboard-derived MIC reductions, mean fractional inhibitory concentration index (ΣFIC), and interaction classification. (B) Heatmaps representing the mean percentage growth inhibition calculated from OD₆₃₀ measurements of four independent biological replicates. Values were corrected using treatment-specific blanks and normalized against the corresponding growth controls. (C) Bacterial recovery following re-inoculation of growth-negative wells (score 0). Filled circles indicate absence of bacterial regrowth, whereas open circles indicate bacterial recovery after transfer to fresh culture medium.
Figure 1.
Comparative checkerboard analysis of ChS-MIC (750 μg/mL) combined with OTC-MIC (0.24 μg/mL) or FF-MIC (0.25 μg/mL) against Piscirickettsia salmonis EM-90. (A) Summary of checkerboard-derived MIC reductions, mean fractional inhibitory concentration index (ΣFIC), and interaction classification. (B) Heatmaps representing the mean percentage growth inhibition calculated from OD₆₃₀ measurements of four independent biological replicates. Values were corrected using treatment-specific blanks and normalized against the corresponding growth controls. (C) Bacterial recovery following re-inoculation of growth-negative wells (score 0). Filled circles indicate absence of bacterial regrowth, whereas open circles indicate bacterial recovery after transfer to fresh culture medium.
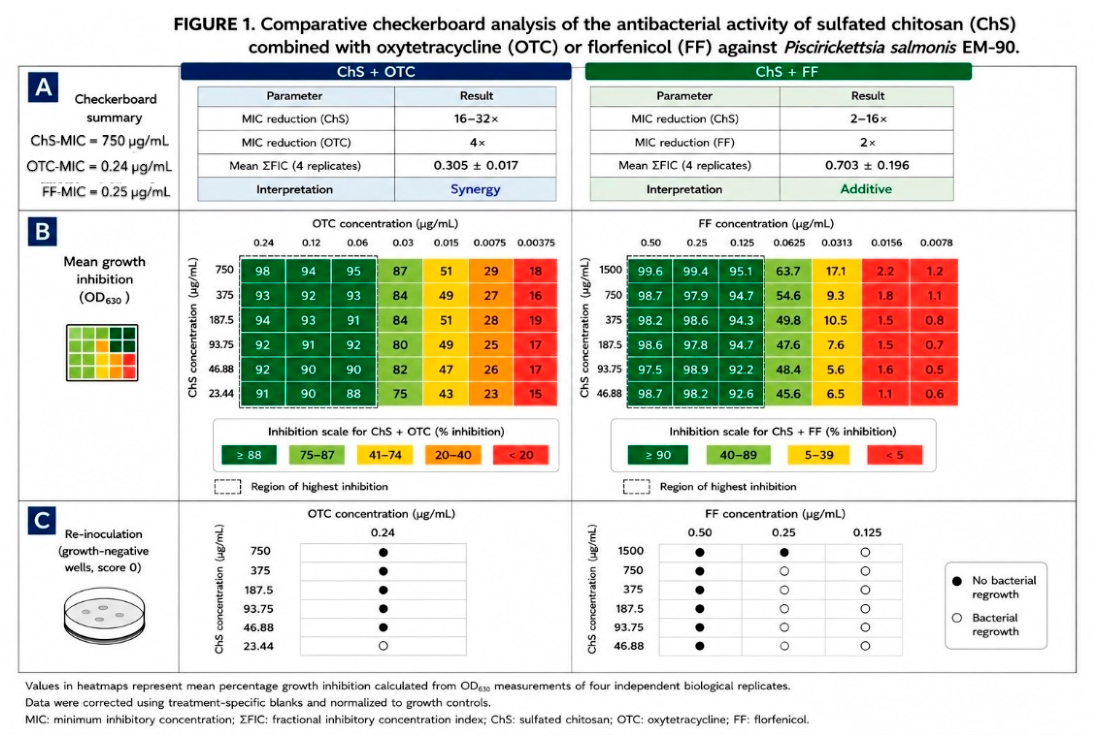
Figure 2.
Changes in bacterial membrane permeability of P. salmonis (EM90) are shown following exposure to ChS, ChC, and ethanol for 5 days (120 hours of incubation), compared with the inoculum control. Cell membrane permeability was assessed using LIVE/DEAD fluorescence staining based on the ratio between green fluorescence (SYTO9, intact membranes) and red fluorescence (propidium iodide, membrane damaged cells). The decrease in the Green/Red ratio indicated greater intracellular propidium iodide (PI) uptake and, therefore, greater alteration of the bacterial cell membrane. Cultures were exposed to MIC of ChS (750 µg/mL) and ChC (1500 µg/mL). Ethanol (50%) was used as a positive control for membrane disruption. A significant decrease in the Green/Red ratio of cultures was observed after 1 hour of exposure to ChS and after 5 hours of exposure to ChC, compared to the untreated control. The decrease was more pronounced and consistent with ChS, indicating greater bacterial membrane permeabilization. The data represents the mean fluorescence ratio obtained from three independent replicates over a 5-day period. Asterisks (*) indicate statistically significant relative to the untreated control (p < 0.05), whereas double asterisks (**) indicate stronger significance relative to the untreated control (p < 0.01) of ethanol after 30 min.
Figure 2.
Changes in bacterial membrane permeability of P. salmonis (EM90) are shown following exposure to ChS, ChC, and ethanol for 5 days (120 hours of incubation), compared with the inoculum control. Cell membrane permeability was assessed using LIVE/DEAD fluorescence staining based on the ratio between green fluorescence (SYTO9, intact membranes) and red fluorescence (propidium iodide, membrane damaged cells). The decrease in the Green/Red ratio indicated greater intracellular propidium iodide (PI) uptake and, therefore, greater alteration of the bacterial cell membrane. Cultures were exposed to MIC of ChS (750 µg/mL) and ChC (1500 µg/mL). Ethanol (50%) was used as a positive control for membrane disruption. A significant decrease in the Green/Red ratio of cultures was observed after 1 hour of exposure to ChS and after 5 hours of exposure to ChC, compared to the untreated control. The decrease was more pronounced and consistent with ChS, indicating greater bacterial membrane permeabilization. The data represents the mean fluorescence ratio obtained from three independent replicates over a 5-day period. Asterisks (*) indicate statistically significant relative to the untreated control (p < 0.05), whereas double asterisks (**) indicate stronger significance relative to the untreated control (p < 0.01) of ethanol after 30 min.
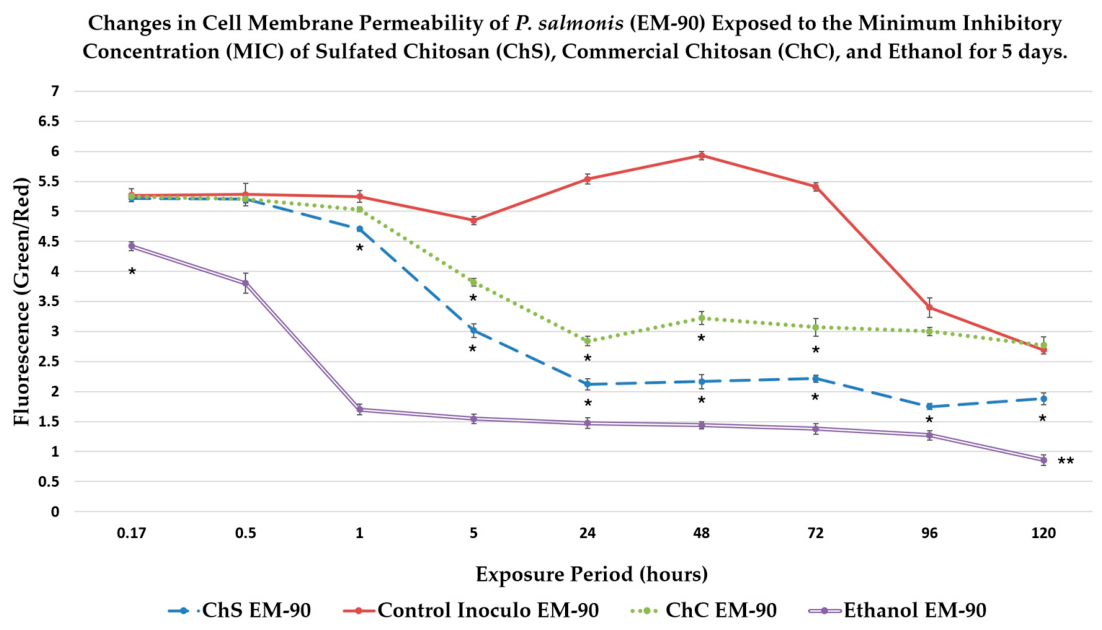
Figure 3.
Fluorescence microscopy of P. salmonis (×10) after exposure to ChC. Fluorescence microscopy of P. salmonis (EM-90) stained with LIVE/DEAD dyes (SYTO9: green, intact membranes; PI: red, membrane-damaged cells). Panels A–C) correspond to untreated control (A), 5 hours (B), and 24 hours (C) exposure to ChC at MIC (1500 µg/mL). Panels .1 and .2 show SYTO9 and PI channels, respectively. Images A.1 and A.2: The untreated control (> 24 hours) exhibits predominantly green fluorescence, indicating intact membranes and dispersed cells. Images B.1 and B.2: show bacteria after 5 hours of exposure to ChC at the MIC, where less green fluorescence and greater red fluorescence are observed, but with a diffuse signal in some areas and a slight increase in bacterial aggregates. Images C.1 and C.2: correspond to 24 hours of exposure to ChC. Green fluorescence persists with evidence intracellular, while red fluorescence increases with a less diffuse signal and more evidence of intracellular PI, compared to the 5-hour period, suggesting partial membrane permeabilization. No obvious bacterial aggregates are observed. Scale bar = 100 µm.
Figure 3.
Fluorescence microscopy of P. salmonis (×10) after exposure to ChC. Fluorescence microscopy of P. salmonis (EM-90) stained with LIVE/DEAD dyes (SYTO9: green, intact membranes; PI: red, membrane-damaged cells). Panels A–C) correspond to untreated control (A), 5 hours (B), and 24 hours (C) exposure to ChC at MIC (1500 µg/mL). Panels .1 and .2 show SYTO9 and PI channels, respectively. Images A.1 and A.2: The untreated control (> 24 hours) exhibits predominantly green fluorescence, indicating intact membranes and dispersed cells. Images B.1 and B.2: show bacteria after 5 hours of exposure to ChC at the MIC, where less green fluorescence and greater red fluorescence are observed, but with a diffuse signal in some areas and a slight increase in bacterial aggregates. Images C.1 and C.2: correspond to 24 hours of exposure to ChC. Green fluorescence persists with evidence intracellular, while red fluorescence increases with a less diffuse signal and more evidence of intracellular PI, compared to the 5-hour period, suggesting partial membrane permeabilization. No obvious bacterial aggregates are observed. Scale bar = 100 µm.
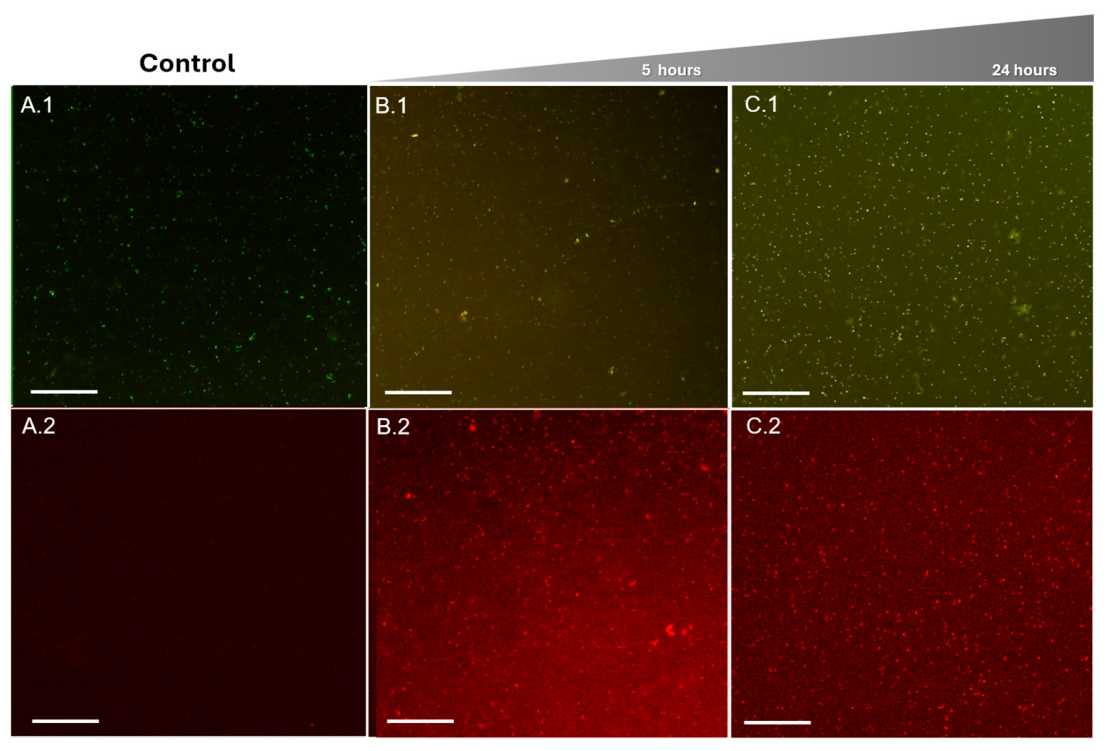
Figure 4.
Fluorescence microscopy of P. salmonis EM-90 (×10) after exposure to ChS for 1, 24, and 48 hours. Fluorescence microscopy of bacterial stained with LIVE/DEAD dyes (SYTO9: green, intact membranes; PI: red, membrane-damaged cells). The upper row (A.1–C.1) shows the SYTO 9 (green) fluorescence channel, indicating cells with preserved membrane integrity. The middle row (A.2–C.2) shows the propidium iodide (PI, red) fluorescence channel, corresponding to cells with compromised membrane permeability. The lower row (A.3–C.3) presents merged green/red overlay images generated using Fiji (ImageJ). At 1 hour, the merged image is predominantly green, consistent with limited PI incorporation. After 24 and 48 hours of ChS exposure, an increase in red fluorescence is observed together with localized yellow–orange regions within bacterial aggregates, indicating spatial co-localization of SYTO 9 and PI signals. It can be observed that as the exposure period increases, bacterial organization into cell aggregates increases. Furthermore, the signal shows a decrease in individual cells after 24 hours, associated with an increase in red fluorescence (greater intracellular IP due to alteration of the outer membrane). White arrows indicate representative bacterial aggregates. Scale bars = 100 μm.
Figure 4.
Fluorescence microscopy of P. salmonis EM-90 (×10) after exposure to ChS for 1, 24, and 48 hours. Fluorescence microscopy of bacterial stained with LIVE/DEAD dyes (SYTO9: green, intact membranes; PI: red, membrane-damaged cells). The upper row (A.1–C.1) shows the SYTO 9 (green) fluorescence channel, indicating cells with preserved membrane integrity. The middle row (A.2–C.2) shows the propidium iodide (PI, red) fluorescence channel, corresponding to cells with compromised membrane permeability. The lower row (A.3–C.3) presents merged green/red overlay images generated using Fiji (ImageJ). At 1 hour, the merged image is predominantly green, consistent with limited PI incorporation. After 24 and 48 hours of ChS exposure, an increase in red fluorescence is observed together with localized yellow–orange regions within bacterial aggregates, indicating spatial co-localization of SYTO 9 and PI signals. It can be observed that as the exposure period increases, bacterial organization into cell aggregates increases. Furthermore, the signal shows a decrease in individual cells after 24 hours, associated with an increase in red fluorescence (greater intracellular IP due to alteration of the outer membrane). White arrows indicate representative bacterial aggregates. Scale bars = 100 μm.
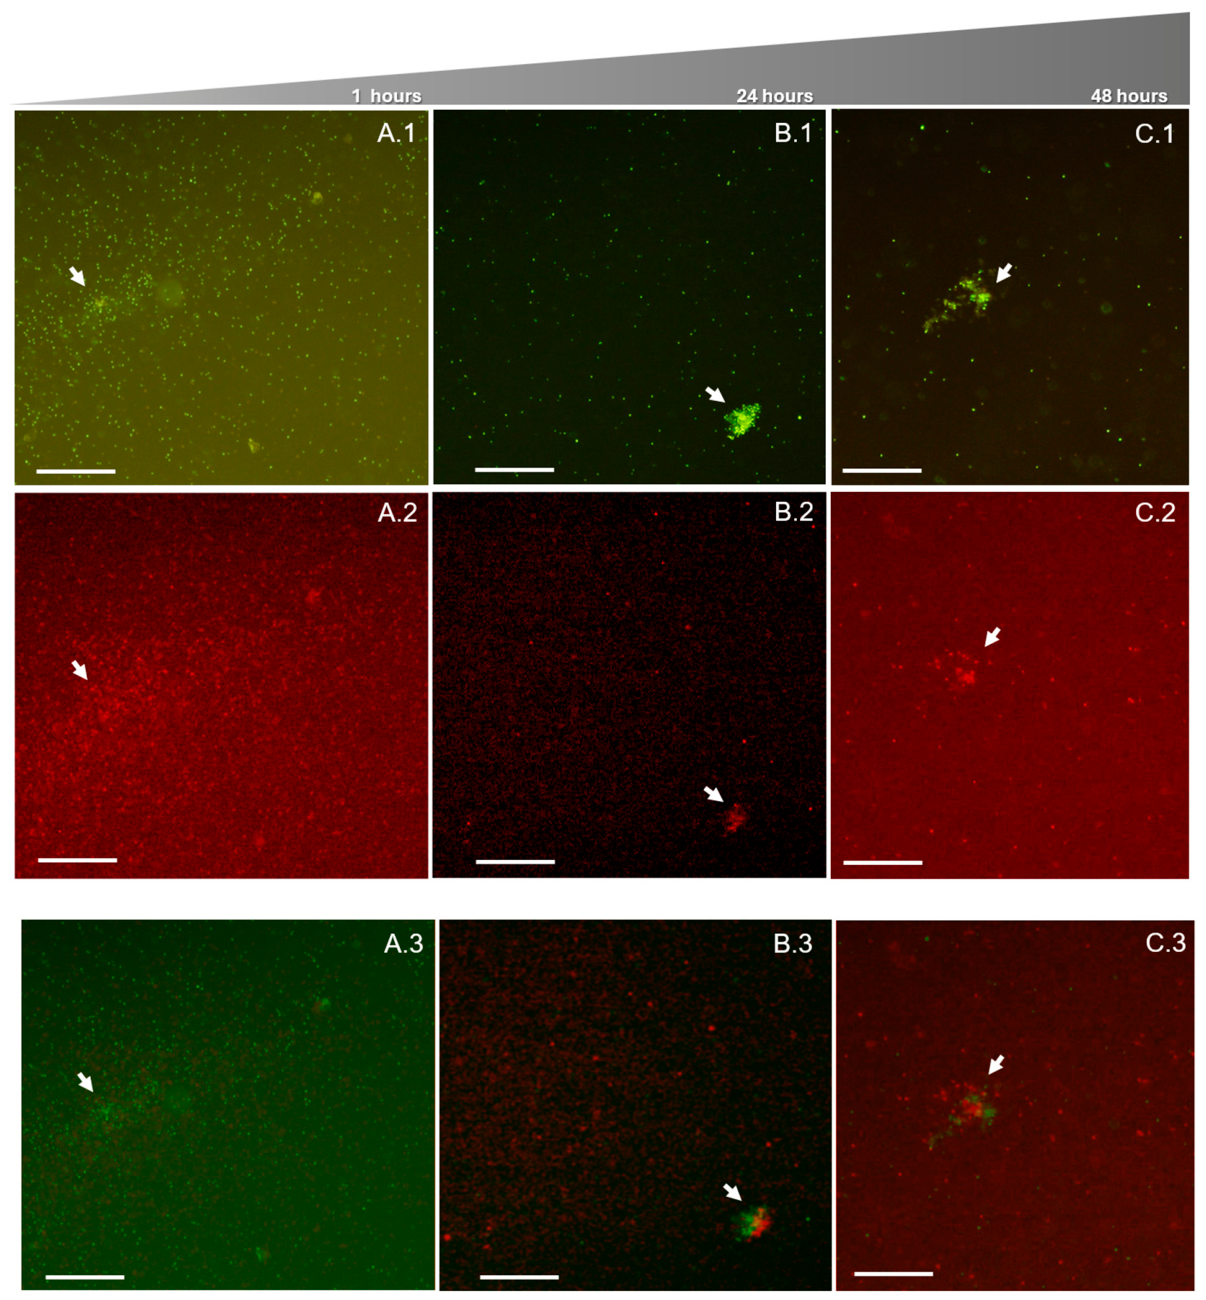
Figure 5.
Decrease in Green/Red ratio of P. salmonis after exposure to ChS-MIC (750 μg/mL). Bacterial membrane permeability was assessed using LIVE/DEAD staining and expressed as the Green/Red fluorescence ratio. Cultures were exposed to ChS at its MIC and data are shown of 1, 24 and 48 hours. ChS reduced *(p < 0.05) the Green/Red ratio compared with the untreated control. The decrease in the Green/Red ratio indicated greater intracellular PI uptake and, therefore, greater alteration of the bacterial cell membrane.
Figure 5.
Decrease in Green/Red ratio of P. salmonis after exposure to ChS-MIC (750 μg/mL). Bacterial membrane permeability was assessed using LIVE/DEAD staining and expressed as the Green/Red fluorescence ratio. Cultures were exposed to ChS at its MIC and data are shown of 1, 24 and 48 hours. ChS reduced *(p < 0.05) the Green/Red ratio compared with the untreated control. The decrease in the Green/Red ratio indicated greater intracellular PI uptake and, therefore, greater alteration of the bacterial cell membrane.
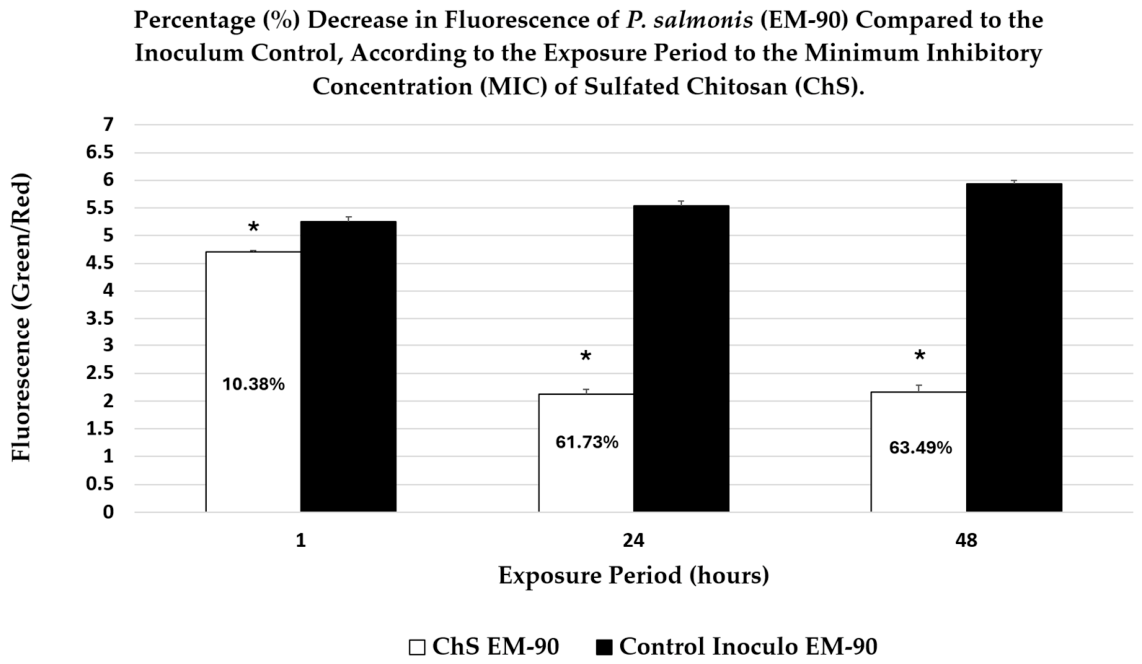
Figure 6.
Scanning electron microscopy of P. salmonis (EM-90) was exposed to polymers. Morphological comparison of cultures after 24 hours exposure to the MIC of ChC and ChS. (A) Micrograph (×430): Untreated control showing spherical and coccoid bacteria with morphological homogeneity, intercellular demarcation is distinguishable and with little bacterial aggregate formation. (A1) Micrograph (×750): Untreated control showing spherical bacteria, smooth surfaces, well-defined cell boundaries, and cells are close together or dispersed with few aggregates formed by a few cells (arrow) (B) Micrograph (×1500): Cultures exposed to ChC (1500 µg/mL). Bacterial aggregates embedded in an amorphous matrix are observed (arrows), with frequent evidence of intercellular boundaries and a spherical appearance, but with a rough surface in some bacteria, maintaining homogeneity between cells. Isolated cells are shown (lower left corner), with a spherical morphology and smooth surface. (C1) Micrograph (×1700): Cultures exposed to ChS (750 µg/mL). The image shows bacterial aggregate embedded within an amorphous extracellular matrix. Cells within the aggregate display marked morphological heterogeneity. Several bacteria exhibit irregular contours with a roughened appearance. (C2) Micrograph (×1200): Cultures exposed to ChS. The image shows greater cellular heterogeneity. Arrows indicate bacteria exhibiting increased surface roughness, focal depressions, spherical structures associated with the cell envelope, with significant variation in cell size. (C3) Magnification of micrograph C2 (×3500): Arrowed cells exhibit surface alterations characterized by irregular topography, focal depressions, and loss of convexity of the cell surface. Furthermore, adjacent bacteria exhibit rounded structures associated with the surface, and less distinction is observed between cell borders.
Figure 6.
Scanning electron microscopy of P. salmonis (EM-90) was exposed to polymers. Morphological comparison of cultures after 24 hours exposure to the MIC of ChC and ChS. (A) Micrograph (×430): Untreated control showing spherical and coccoid bacteria with morphological homogeneity, intercellular demarcation is distinguishable and with little bacterial aggregate formation. (A1) Micrograph (×750): Untreated control showing spherical bacteria, smooth surfaces, well-defined cell boundaries, and cells are close together or dispersed with few aggregates formed by a few cells (arrow) (B) Micrograph (×1500): Cultures exposed to ChC (1500 µg/mL). Bacterial aggregates embedded in an amorphous matrix are observed (arrows), with frequent evidence of intercellular boundaries and a spherical appearance, but with a rough surface in some bacteria, maintaining homogeneity between cells. Isolated cells are shown (lower left corner), with a spherical morphology and smooth surface. (C1) Micrograph (×1700): Cultures exposed to ChS (750 µg/mL). The image shows bacterial aggregate embedded within an amorphous extracellular matrix. Cells within the aggregate display marked morphological heterogeneity. Several bacteria exhibit irregular contours with a roughened appearance. (C2) Micrograph (×1200): Cultures exposed to ChS. The image shows greater cellular heterogeneity. Arrows indicate bacteria exhibiting increased surface roughness, focal depressions, spherical structures associated with the cell envelope, with significant variation in cell size. (C3) Magnification of micrograph C2 (×3500): Arrowed cells exhibit surface alterations characterized by irregular topography, focal depressions, and loss of convexity of the cell surface. Furthermore, adjacent bacteria exhibit rounded structures associated with the surface, and less distinction is observed between cell borders.
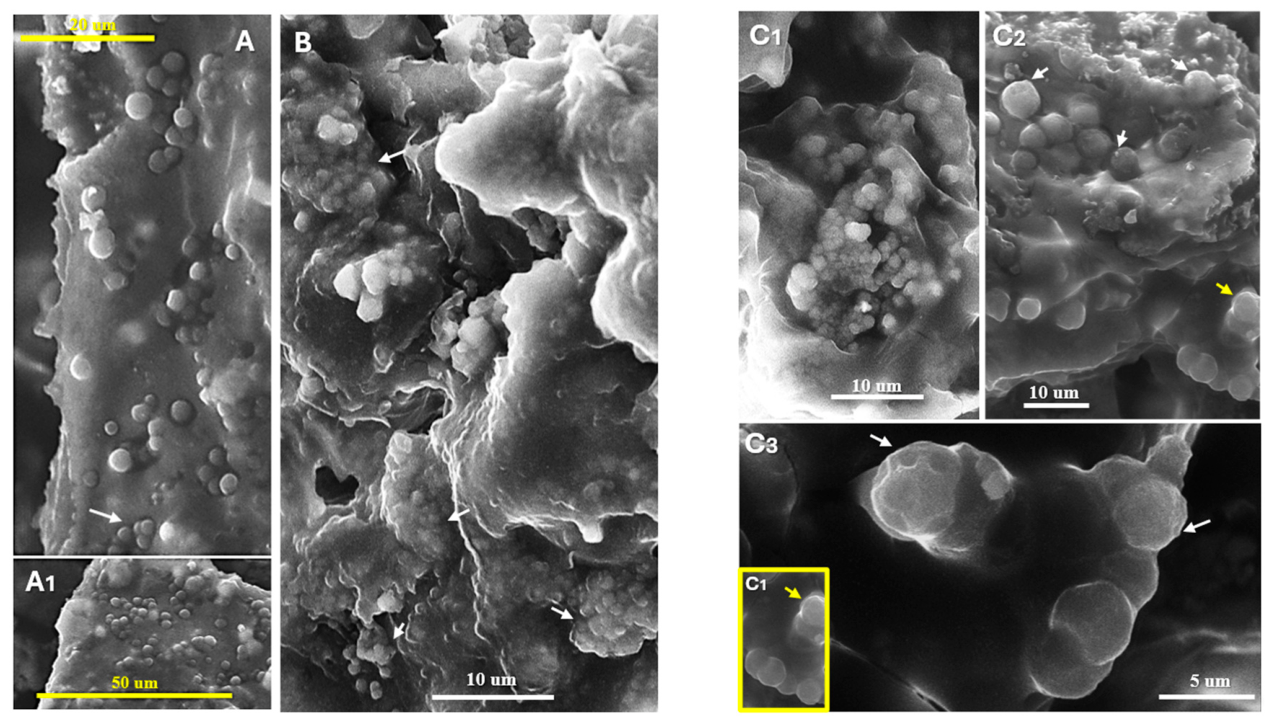
Figure 7.
Percentage reduction in biofilm in P. salmonis cultures exposed to ChS MIC (750 µg/mL), Sub-MIC (375 µg/mL), and OTA (5 µg/mL) as a positive control, compared to the untreated control, according to the number of days of experimental incubation. A significant reduction in biofilm formation was observed when bacteria were exposed to ChS on days 4, 6, 8, and 10 compared to the control. The percentage of biofilm reduction varied according to the incubation period, being least evident on day 10. The crystal violet staining method allowed for the identification of statistically significant differences (* p < 0.05; ** p < 0.01) between treatments based on the corrected optical density (OD) reading.
Figure 7.
Percentage reduction in biofilm in P. salmonis cultures exposed to ChS MIC (750 µg/mL), Sub-MIC (375 µg/mL), and OTA (5 µg/mL) as a positive control, compared to the untreated control, according to the number of days of experimental incubation. A significant reduction in biofilm formation was observed when bacteria were exposed to ChS on days 4, 6, 8, and 10 compared to the control. The percentage of biofilm reduction varied according to the incubation period, being least evident on day 10. The crystal violet staining method allowed for the identification of statistically significant differences (* p < 0.05; ** p < 0.01) between treatments based on the corrected optical density (OD) reading.
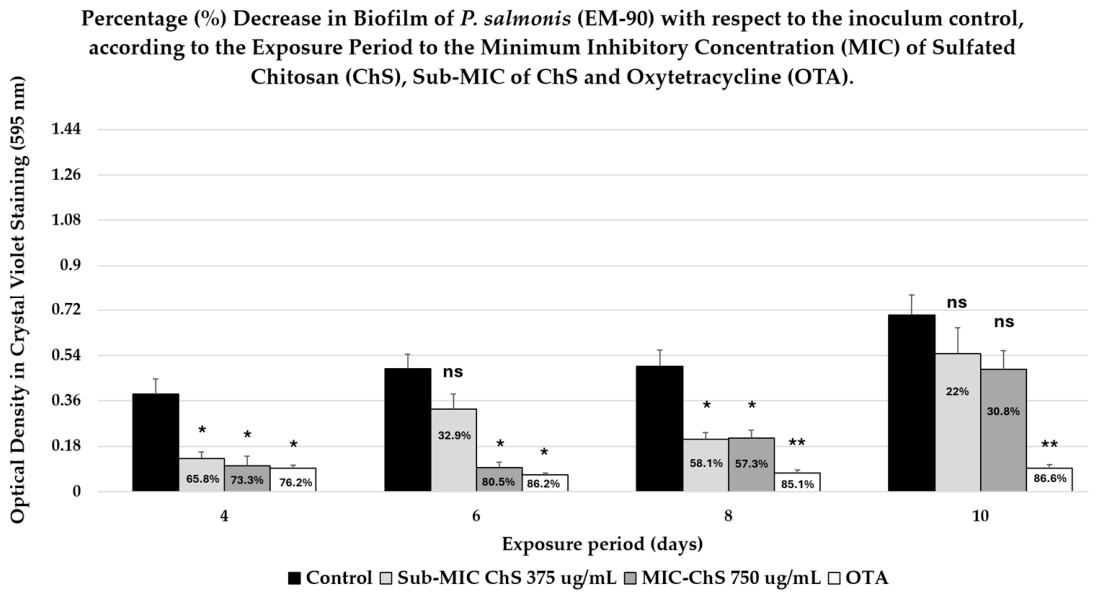
Figure 8.
Scanning electron microscopy of biofilm (P. salmonis EM-90), comparison of cultures after 6 days exposure to the MIC (750 g/mL) of ChS. Imagens A: Untreated control (A1) Micrograph (×1500): show bacterial cells with spherical and coccoid morphology, closely associated, forming microaggregates (yellow Arrow). (A2) Micrograph (×4000): Image A1, indicated by the yellow arrow, is shown at higher magnification that a microaggregate of cells interconnected by extracellular material is observed. (A3) Micrograph (×4000): The image shows developed biofilms composed of densely packed bacterial microcolonies embedded in an extracellular matrix. The bacteria are closely associated, forming compact aggregates, and are interconnected to adjacent cells by filamentous extracellular material (arrow). Imagens B: Culture exposed to ChS. (B1) Micrograph (×2500): The image shows residual material adhered to the substrate, with little compaction and areas devoid of cells with few aggregates, replaced by extracellular material with a particulate appearance. (B2) Micrograph (×2000): The image shows large cell-free areas, with few individual cells of spherical appearance lacking connections by structured filaments. (B3) Micrograph (×5000): Magnification of micrograph B1 showing residual material with few features of polymeric or cellular organization.
Figure 8.
Scanning electron microscopy of biofilm (P. salmonis EM-90), comparison of cultures after 6 days exposure to the MIC (750 g/mL) of ChS. Imagens A: Untreated control (A1) Micrograph (×1500): show bacterial cells with spherical and coccoid morphology, closely associated, forming microaggregates (yellow Arrow). (A2) Micrograph (×4000): Image A1, indicated by the yellow arrow, is shown at higher magnification that a microaggregate of cells interconnected by extracellular material is observed. (A3) Micrograph (×4000): The image shows developed biofilms composed of densely packed bacterial microcolonies embedded in an extracellular matrix. The bacteria are closely associated, forming compact aggregates, and are interconnected to adjacent cells by filamentous extracellular material (arrow). Imagens B: Culture exposed to ChS. (B1) Micrograph (×2500): The image shows residual material adhered to the substrate, with little compaction and areas devoid of cells with few aggregates, replaced by extracellular material with a particulate appearance. (B2) Micrograph (×2000): The image shows large cell-free areas, with few individual cells of spherical appearance lacking connections by structured filaments. (B3) Micrograph (×5000): Magnification of micrograph B1 showing residual material with few features of polymeric or cellular organization.
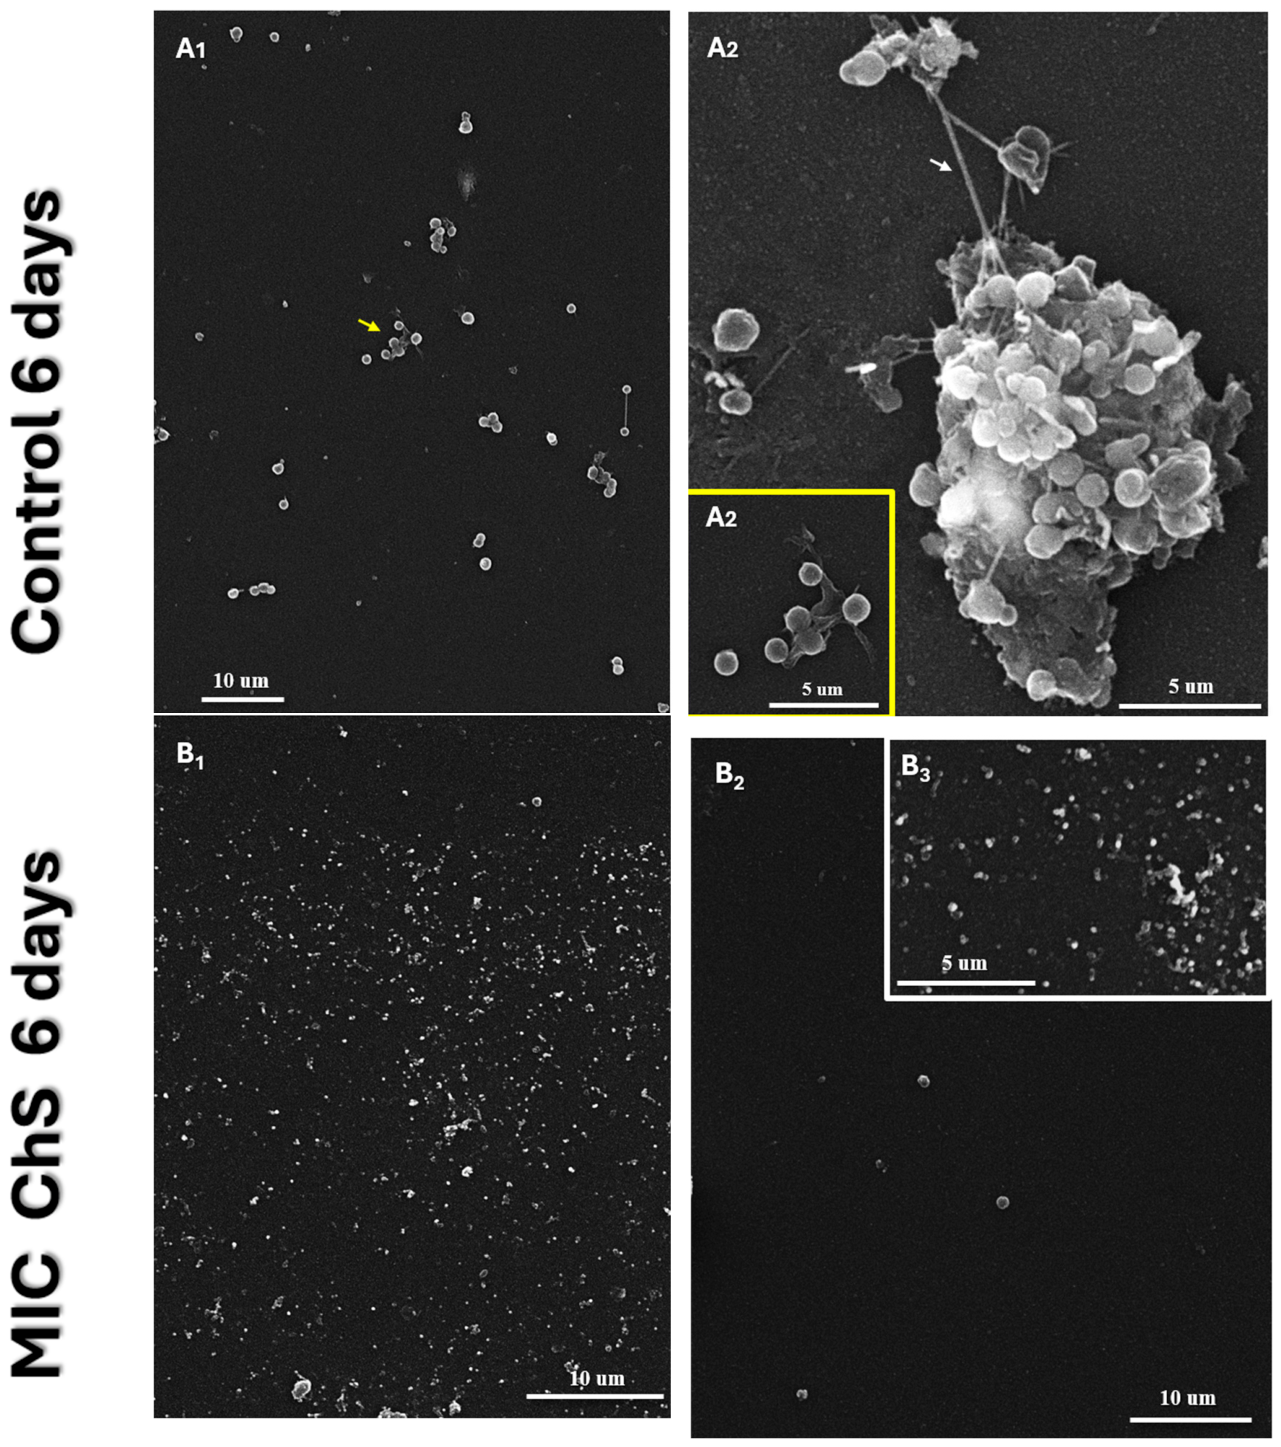
Figure 9.
Scanning electron microscopy of biofilm (P. salmonis EM-90), comparison of cultures after 10 days exposure to the MIC (750 μg/mL) of ChS. Imagens C: Untreated control (C1) Micrograph (×2500): The image shows extensive areas of raised structures covering the substrate, with compact regions rich in extracellular matrix, frequently with a continuous distribution and no interruptions. (C2) Micrograph (×3700): A raised area is observed with a dense extracellular matrix containing embedded bacterial. (C3) Micrograph (×5500): In the higher magnification image, an area with compact extracellular matrix of biofilm is observed. Filamentous-appearing projections of extracellular material are visible at the periphery. Imagens D: Culture exposed to ChS. (D1) Micrograph (×2500): The image shows raised structures of the biofilm matrix, interrupted by areas of lesser relief or absence of a dense matrix. (D2) Micrograph (×2000): The higher magnification image shows a porous or network-like biofilm matrix with several perforations, with an absence or scarcity of cells. (D3) Micrograph (×5000): Biofilm matrix showed perforations and interruptions in the continuous distribution due to areas devoid of extracellular matrix. At the periphery of the structure, significant reduction of the matrix was observed, with residual material appearing particulate and poorly compacted.
Figure 9.
Scanning electron microscopy of biofilm (P. salmonis EM-90), comparison of cultures after 10 days exposure to the MIC (750 μg/mL) of ChS. Imagens C: Untreated control (C1) Micrograph (×2500): The image shows extensive areas of raised structures covering the substrate, with compact regions rich in extracellular matrix, frequently with a continuous distribution and no interruptions. (C2) Micrograph (×3700): A raised area is observed with a dense extracellular matrix containing embedded bacterial. (C3) Micrograph (×5500): In the higher magnification image, an area with compact extracellular matrix of biofilm is observed. Filamentous-appearing projections of extracellular material are visible at the periphery. Imagens D: Culture exposed to ChS. (D1) Micrograph (×2500): The image shows raised structures of the biofilm matrix, interrupted by areas of lesser relief or absence of a dense matrix. (D2) Micrograph (×2000): The higher magnification image shows a porous or network-like biofilm matrix with several perforations, with an absence or scarcity of cells. (D3) Micrograph (×5000): Biofilm matrix showed perforations and interruptions in the continuous distribution due to areas devoid of extracellular matrix. At the periphery of the structure, significant reduction of the matrix was observed, with residual material appearing particulate and poorly compacted.
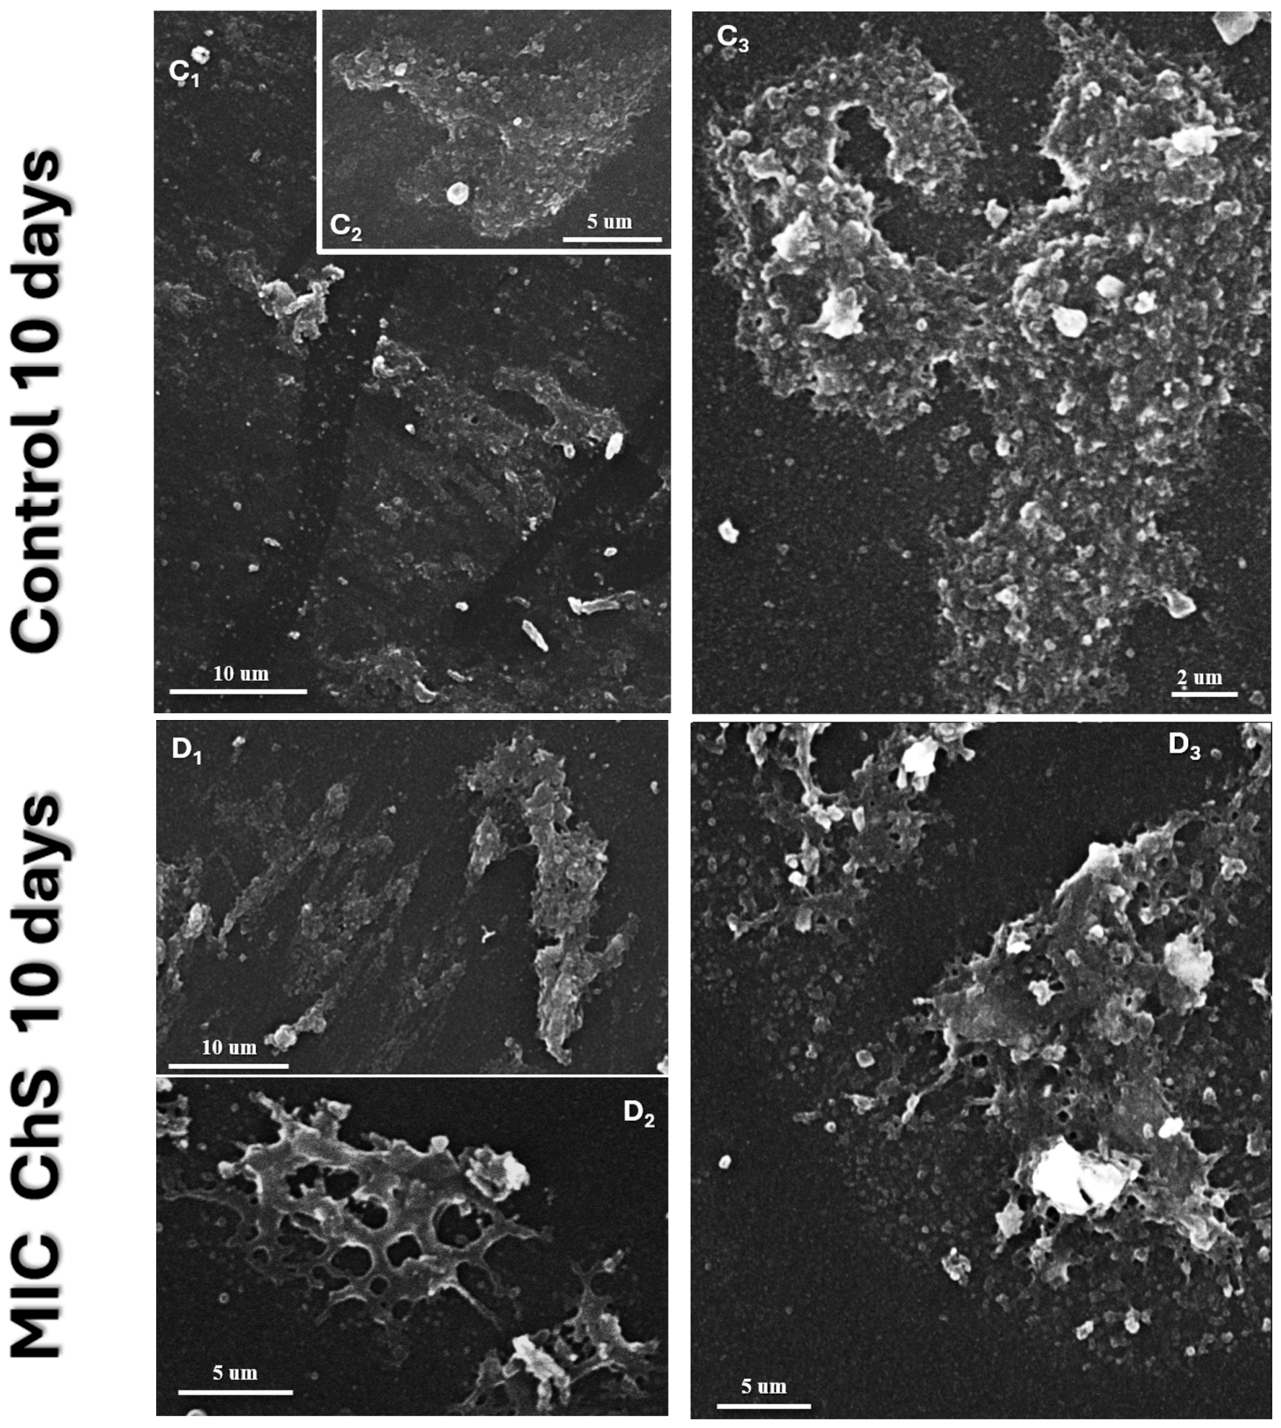

Table 1.
Checkerboard analysis and fractional inhibitory concentration index (ΣFIC) of ChS combined with oxytetracycline or florfenicol against Piscirickettsia salmonis (EM-90).
Table 1.
Checkerboard analysis and fractional inhibitory concentration index (ΣFIC) of ChS combined with oxytetracycline or florfenicol against Piscirickettsia salmonis (EM-90).
|
Antibiotic combination |
Biological replicate |
Combined MIC ChS |
Combined MIC antibiotic |
FICChS | FICantibiotic | ΣFIC | Interaction |
| ChS + OTC | 1 | 23.44 | 0.06 | 0.031 | 0.250 | 0.281 | Synergy |
| ChS + OTC | 2 | 46.88 | 0.06 | 0.063 | 0.250 | 0.313 | Synergy |
| ChS + OTC | 3 | 46.88 | 0.06 | 0.063 | 0.250 | 0.313 | Synergy |
| ChS + OTC | 4 | 46.88 | 0.06 | 0.063 | 0.250 | 0.313 | Synergy |
| ChS + OTC | Mean ± SD | — | — | 0.055 ± 0.016 | 0.250 ± 0.000 | 0.305 ± 0.017 | Synergy |
| ChS + FF | 1 | 93.75 | 0.125 | 0.125 | 0.500 | 0.625 | Additive |
| ChS + FF | 2 | 375.00 | 0.125 | 0.500 | 0.500 | 1.000 | Additive |
| ChS + FF | 3 | 93.75 | 0.125 | 0.125 | 0.500 | 0.625 | Additive |
| ChS + FF | 4 | 46.88 | 0.125 | 0.063 | 0.500 | 0.563 | Additive |
| ChS + FF |
Mean ± SD |
— | — | 0.203 ± 0.197 | 0.500 ± 0.00 | 0.703 ± 0.196 | Additive |
Individual MIC values used for FIC calculations were 750 μg/mL for ChS, 0.24 μg/mL for OTC, and 0.25 μg/mL for FF. ΣFIC values were interpreted according to conventional criteria: synergy (≤ 0.5), additive interaction (>0.5–1.0), indifference (>1.0–4.0), and antagonism (>4.0).
Disclaimer/Publisher’s Note: The statements, opinions and data contained in all publications are solely those of the individual author(s) and contributor(s) and not of MDPI and/or the editor(s). MDPI and/or the editor(s) disclaim responsibility for any injury to people or property resulting from any ideas, methods, instructions or products referred to in the content. |
© 2026 by the authors. Licensee MDPI, Basel, Switzerland. This article is an open access article distributed under the terms and conditions of the Creative Commons Attribution (CC BY) license.
Copyright: This open access article is published under a Creative Commons CC BY 4.0 license, which permit the free download, distribution, and reuse, provided that the author and preprint are cited in any reuse.