

Submitted:
02 September 2026
Posted:
03 September 2026
You are already at the latest version
Abstract
Background: Cannabidiol (CBD), isolated from hemp (Cannabis sativa or Cannabis indica), is receiving increasing attention for its potential against different pathologies, including viral infections. CBD has been reported to alter lateral membrane diffusion and cholesterol accessibility. Therefore, it remains unclear which signaling pathways are affected by CBD treatment. Here, we sought to determine the effect of CBD treatment on human cell lines and primary human cells. Methods: We performed bioinformatics analysis to identify differentially expressed genes (DEGs) in published RNA-seq datasets of CBD-treated cells, including A549, THP-1, normal human epidermal keratinocytes (NHEK), monocyte-derived dendritic cells (DC), and monocyte-derived macrophages (MDM). We then performed RT-qPCR to validate A549, THP-1, and MDM sequencing data. Results: Comparative transcriptional analysis across five CBD-treated cell types identified 21 genes shared across all cell types, 142 among four, and 694 among three, enriched in ER stress, lipid metabolism, and cholesterol metabolism pathways. Transcription factor activity analysis identified ATF4, ATF6, XBP1, SREBF1, and SREBF2, which encode key regulators of the ER stress response and cholesterol metabolism. Conclusions: Results highlight CBD’s pivotal role in regulating transcription factor expression, which is crucial for controlling gene expression involved in ER stress, lipid, and cholesterol metabolism. Consequently, CBD treatment modulates gene expression programs in a cell-dependent manner and promotes lipotoxicity by dysregulation ER stress signaling pathways.
Keywords:
cannabis
; lipotoxicity
; unfolded protein response
; cholesterol metabolism
; human cell lines
; primary human cells
1. Introduction
Plant-derived compounds are gaining attention as potential therapeutic agents due to their broad availability and diverse biological activities. These compounds include cannabinoids, a heterogeneous group of active substances produced naturally in our bodies (endocannabinoids) or found in the Cannabis sativa or Cannabis indica (phytocannabinoids) plants [1]. Cannabidiol (CBD) is the major phytocannabinoid, accounting for up to 40% of a cannabis plant’s extract [2]. Currently, the U.S. Food and Drug Administration (FDA) has approved several prescription drugs derived from or related to cannabis. For instance, Epidiolex®, a pharmaceutical form of cannabidiol (99% CBD; 0.1% trans-9-tetrahydrocannabinol), is the first and only FDA-approved CBD due to its potential to treat seizures [3]. Nabilone and dronabinol, both containing THC, are used to prevent weight loss in AIDS patients and alleviate persistent nausea and vomiting associated with chemotherapy [4]. However, the mechanisms underlying the therapeutic effects of phytocannabinoids have only recently begun to emerge.
In plants of the cannabis genus, the production of sterols (e.g., cholesterol) and non-sterols (e.g., CBD) is homeostatically regulated in the endoplasmic reticulum (ER) [5,6]. Both CBD and cholesterol are hydrophobic molecules. Cholesterol is found in large quantities in the plasma membrane and, depending on the cell type, accounts for up to 50% of the lipids [7]. Like cholesterol, CBD can change membrane elasticity and is considered a class of phytoestrogens known as “nuisance compounds” with a bilayer membrane-mediated mechanism [8,9]. For instance, CBD in animal cells can induce lipotoxicity, affecting cholesterol homeostasis and altering the function of transmembrane proteins in the ER [10,11,12].
The ER is a membrane-bound organelle of eukaryotic cells that promotes protein production and lipid synthesis required for other cellular organelles. Smooth ER is mainly involved in lipid biosynthesis, while rough ER is involved in protein processing [11]. The ER is susceptible to various stress stimuli, including changes in N-linked glycosylation, calcium pump inhibition, protein overload, glucose and asparagine depletion, viral infection, heme deficiency, and changes in lipid membrane composition. These stimuli can trigger the unfolded protein response (UPR). Activation of the UPR is commonly referred to as ER stress, and depending on the type of stressor, it is known as proteotoxicity, lipotoxicity, or glucotoxicity [12,13]. The UPR has three main transmembrane sensors: protein kinase R (PKR)-like endoplasmic reticulum kinase (PERK), which belongs to the integrated stress response (ISR); inositol-requiring transmembrane kinase/endoribonuclease 1α (IRE1α); and activator of transcription 6 (ATF6), which are involved in the ER-associated degradation (ERAD) system [14]. Therefore, the ER plays a critical role in maintaining cellular homeostasis [15].
Lipid metabolic pathways can indirectly trigger the UPR by regulating protein folding or ER trafficking. Both IRE1α and PERK regulate lipid metabolism by sensing lipid perturbations through their common conserved transmembrane domains (TM) [16]. IRE1α cleaves unspliced X-box protein 1 (uXBP1) to generate a functionally spliced XBP1 variant (sXBP1) [17]. The IRE1α-XBP1s axis has been shown to stimulate chaperone and lipid biosynthesis, which are essential for ER biogenesis [18]. In turn, PERK phosphorylates the α subunit of eukaryotic translation initiation factor 2 (eIF2α) at serine 51 [19], resulting in an overall attenuation of Cap-dependent protein synthesis. This allows for the preferential translation of selected transcripts, such as the basic leucine zipper transcription factor 4 (ATF4), which is linked to cell survival and recovery [20]. Crosstalk between the UPR and lipid metabolism involves the transcription factors (TFs), such as sterol regulatory element-binding proteins (SREBP) and ATF6. These TFs are cleaved from the Golgi by site-1 and site-2 proteases, activating their respective lipogenic and ER-expansion functions [21]. The SREBP family consists of three proteins, SREBP1a, SREBP1c, and SREBP2, encoded by two genes, SREBF1 and SREBF2. SREBF1 acts as a central regulator of lipogenesis, whereas SREBF2 mediates sterol regulation and complements the function of SREBF1 [22]. On the other hand, ATF6 contributes to the expression of chaperones and the regulation of lipid metabolism by inducing ER expansion in an XBP1-independent manner [23].
There are various medical cannabis products available that may contain CBD. However, despite many therapeutic claims, the gene expression programs of UPR and SREBP signaling in CBD-treated cells remain poorly understood. Therefore, this study aimed to decode the role of CBD in human cell lines and primary human cells using a multitranscriptomic approach. Initially, we examined the transcriptional profiles of A549, THP-1, normal human epidermal keratinocytes (NHEK), monocyte-derived dendritic cells (DC), and monocyte-derived macrophages (MDM) following CBD treatment. Subsequently, we validated transcriptomic analysis in CD14+ macrophages. Results obtained from transcriptome analysis and RT-qPCR elucidate the effects of CBD in a cell-dependent context, highlighting the dynamics of the ER signaling pathways (UPR and SREBP) that regulate the transcriptome profile.
2. Materials and Methods
2.1. Transcriptomic Analysis of Previously Published RNA-Seq Datasets and Gene Analysis
We applied a previously established bioinformatics workflow [24]. using R software (version 4.2.0) [25] to analyze gene expression patterns from bulk RNA-seq in CBD-treated human cells. Our study utilized five independent datasets available at the Gene Expression Omnibus (GEO). These datasets included A549 cells either untreated or treated with 10 µM CBD for 24 hours (n = 3; GSE168797); THP-1 cells either untreated or treated with 31 µM CBD for 8 hours (n = 3; GSE201508); human epidermal keratinocytes (NHEK) either untreated or treated with 10 µM CBD for 24 hours (n = 3; GSE131565); monocyte-derived macrophages (MDM) treated or not with 30 µM CBD for 6 hours (n = 3; GSE285294), and monocyte-derived dendritic cells (DC) differentiated or not with 10 µM CBD for 3 days (n = 3; GSE235310). We filtered out low counts in all samples using the filterByExpr function [26].
The differentially expressed genes (DEGs) between untreated and CBD groups were screened using DESeq2 library [27]. We set the screening condition as an adjusted p-value < 0.01 and an absolute log2 fold change > 0.25. Principal component analysis (PCA) was performed on variance-stabilizing transformed counts using the prcomp function in R, and the volcano and MA plots were generated using the ggplot2 library [28]. Additionally, common and unique DEGs across datasets were visualized using UpSet plots generated with the ggupset R package.
Over-representation analysis (ORA) of the genes shared across cell types was performed using the enrichGO function (clusterProfiler R package), with Gene Ontology Biological Process (GO BP) terms as the reference set (org.Hs.eg.db annotation), a Benjamini-Hochberg adjusted p-value cutoff of 0.05, and a q-value cutoff of 0.2. Gene set enrichment analysis (GSEA) was performed independently for each cell type using the gseGO function (clusterProfiler), ranking genes by their DESeq2 Wald statistic and testing against the full GO BP gene set collection (minimum and maximum gene set sizes of 10 and 500 genes, respectively); normalized enrichment scores (NES) are reported for the specific pathways identified as significant by the ORA [29].
2.2. Transcription Factor Activity and Target-Gene Analysis
To identify transcription factors (TFs) driving CBD-induced transcriptional changes, TF activity enrichment analysis was performed using the TFactS algorithm implemented in the TFactSR R package [30]. Analyses were run independently for each cell type using its corresponding DEGs (adjusted p < 0.01, |log2FC| > 0.25). The TF-target catalog used as the reference set was built from CollecTRI [31] a curated and actively maintained collection of TF-target interactions, retrieved via the OmniPath REST API. For each TF-cell type pair, TFactS returned an enrichment significance (e-value) and the number of DE target genes (k); five TFs central to the UPR and cholesterol biosynthesis–ATF4, ATF6, XBP1, SREBF1, and SREBF2–were selected a priori as TF candidates of interest. Their activity across the five cell types was visualized using a bubble plot, where dot size represents k and dot position corresponds to -log10 (e-value).
To examine target-gene-level responses, we assembled a curated panel of ER-stress and cholesterol-metabolism genes regulated by these TFs, including HSPA5, DNAJB9, PPP1R15A/GADD34, HMGCS1, HMGCR, FADS2, and SCD, alongside the five TFs themselves. Each gene was annotated with which of the five TFs of interest regulate it per the CollecTRI catalog (excluding self-regulation); genes regulated by more than one TF of interest were assigned a combined category (e.g., “SREBF1 + SREBF2”). Log2 fold change values for this panel were visualized as a heatmap using the ComplexHeatmap R package [32] with genes grouped by TF-regulator category and asterisks marking those meeting the DEG significance threshold in each cell type. The same TF-target relationships were represented as a directed network using the igraph and ggraph R packages. Edges were drawn from each target TF to its panel genes (color-coded by source TF), while the nodes were colored according to the same TF-regulator category used in the heatmap.
2.3. Cell Line Culture
THP-1 cells (ATCC) were seeded on 24-well plates at 5 × 10⁵ cells/well and cultured in RPMI-1640 medium (Sigma-Aldrich) with 10% heat-inactivated fetal bovine serum (FBS; Gibco, Thermo Fisher Scientific, Massachusetts, USA) and 1% antibiotic-antimycotic solution (Corning, New York, USA), and incubated in 5% CO2 at 37 °C. A549 cells (ATCC) were seeded on 24-well culture plates at 4 × 10⁵ cells/well and cultured in Dulbecco’s Modified Eagle Medium (DMEM; Sigma-Aldrich, St. Louis, USA) with 2% FBS (Gibco, Thermo Fisher Scientific, Massachusetts, USA) and 1% antibiotic-antimycotic solution (Corning, New York, USA), and incubated at 37 °C and 5% CO2.
2.4. Obtention and Culture of Monocyte-Derived Macrophages (MDMs)
Human peripheral blood mononuclear cells (PBMCs) were isolated from blood units of healthy donors using a Lymphoprep density gradient (STEMCELL Technologies Inc, Vancouver, Canada) and centrifugation at 850 x g for 21 min. Platelet depletion was achieved by washing the cells three times with 1X PBS (Sigma-Aldrich) at 250 x g for 10 min. The percentage of CD14+ cells was subsequently determined by flow cytometry. To obtain human monocytes, 5 × 10⁵ CD14+ cells per well were seeded into 24-well plastic plates previously scratched with a 1000 μL pipette tip. Cells were allowed to adhere for 2 h in RPMI-1640 medium (Sigma-Aldrich) supplemented with 0.5% autologous serum, 4 mM L-glutamine, and 0.3% Na2CO3. Monocytes were cultured at 37 °C and 5% CO2 and then washed twice with 1X PBS to remove non-adherent cells. Monocytes were then cultured in RPMI-1640 medium supplemented with 10% FBS, 4 mM L-glutamine, 0.3% Na2CO3, and 1% antibiotic-antimycotic solution 100X (complete medium) and incubated at 37 °C and 5% CO2 for 6 days to obtain MDMs, as described in [33].
2.5. Treatment of Monocyte-Derived Macrophages with Cannabidiol and Cell Viability Assay
To evaluate cell viability, MDMs were treated with increasing concentrations of CBD (0.1 µM, 1 µM, 10 µM, 100 µM, and 500 µM; Agilent Technologies, Santa Clara, CA) or mock-treated (control) for 24 h at 37 °C with 5% CO2. Cell viability was determined by flow cytometry using the LIVE/DEAD™ Fixable Yellow Dead Cell Stain Kit (Invitrogen, Molecular Probes, USA) according to the manufacturer’s protocol. Flow cytometry results were analyzed using FlowJo™ v10.8 Software (BD Life Sciences).
2.6. Treatment of Cell Lines with Cannabidiol
A549 cells and human MDMs were treated with 10 μM CBD (Agilent Technologies, Santa Clara, CA) and incubated for 24 h at 37 °C with 5% CO2. THP-1 cells were treated with 31 μM CBD and incubated for 8 h under the same conditions, matching the original THP-1 transcriptome dataset (Section 2.1). Cells were harvested and stored in TRIzol reagent (Invitrogen, Life Technologies, CA) at -80 °C.
2.7. RNA Extraction, cDNA Synthesis and Real-Time RT-qPCR
Total RNA was extracted from untreated (control) or CBD-treated samples using TRIzol reagent (Invitrogen, Life Technologies, CA) following the manufacturer’s instructions. RNA concentrations were quantified using a NanoDrop-1000 spectrophotometer (Thermo Scientific, Wilmington, DE, USA) and reverse-transcribed into complementary DNA (cDNA) using iScript™ cDNA Synthesis Kit (Bio-Rad, USA). Expression levels of Glyceraldehyde-3-Phosphate Dehydrogenase (GAPDH; internal control) and total X-Box protein 1 (XBP1; target gene) mRNA were quantified by RT-qPCR using the SsoAdvancedTM Universal SYBR® Green Supermix (Bio-Rad, USA) and gene-specific primers (Supplementary Table S1). The threshold cycle was determined for each sample using the regression analysis function in Bio-Rad CFX Manager software. Relative mRNA expression was calculated using the 2-ΔΔCt method, normalized to GAPDH and expressed relative to the untreated control.
2.8. Statistical Data Analysis
Statistical analyses were performed using GraphPad Prism 8.0.1 (GraphPad Software Inc., San Diego, CA, USA; www.graphpad.com) to determine the significance of the differences between the untreated and treated datasets. The Shapiro-Wilk test was used to assess data normality. Statistical tests are indicated in the figure legends. Data are expressed as mean ± SD. Significant results were defined as p<0.05 (*).
3. Results
3.1. Transcriptome Profile of Human Cells Treated with CBD
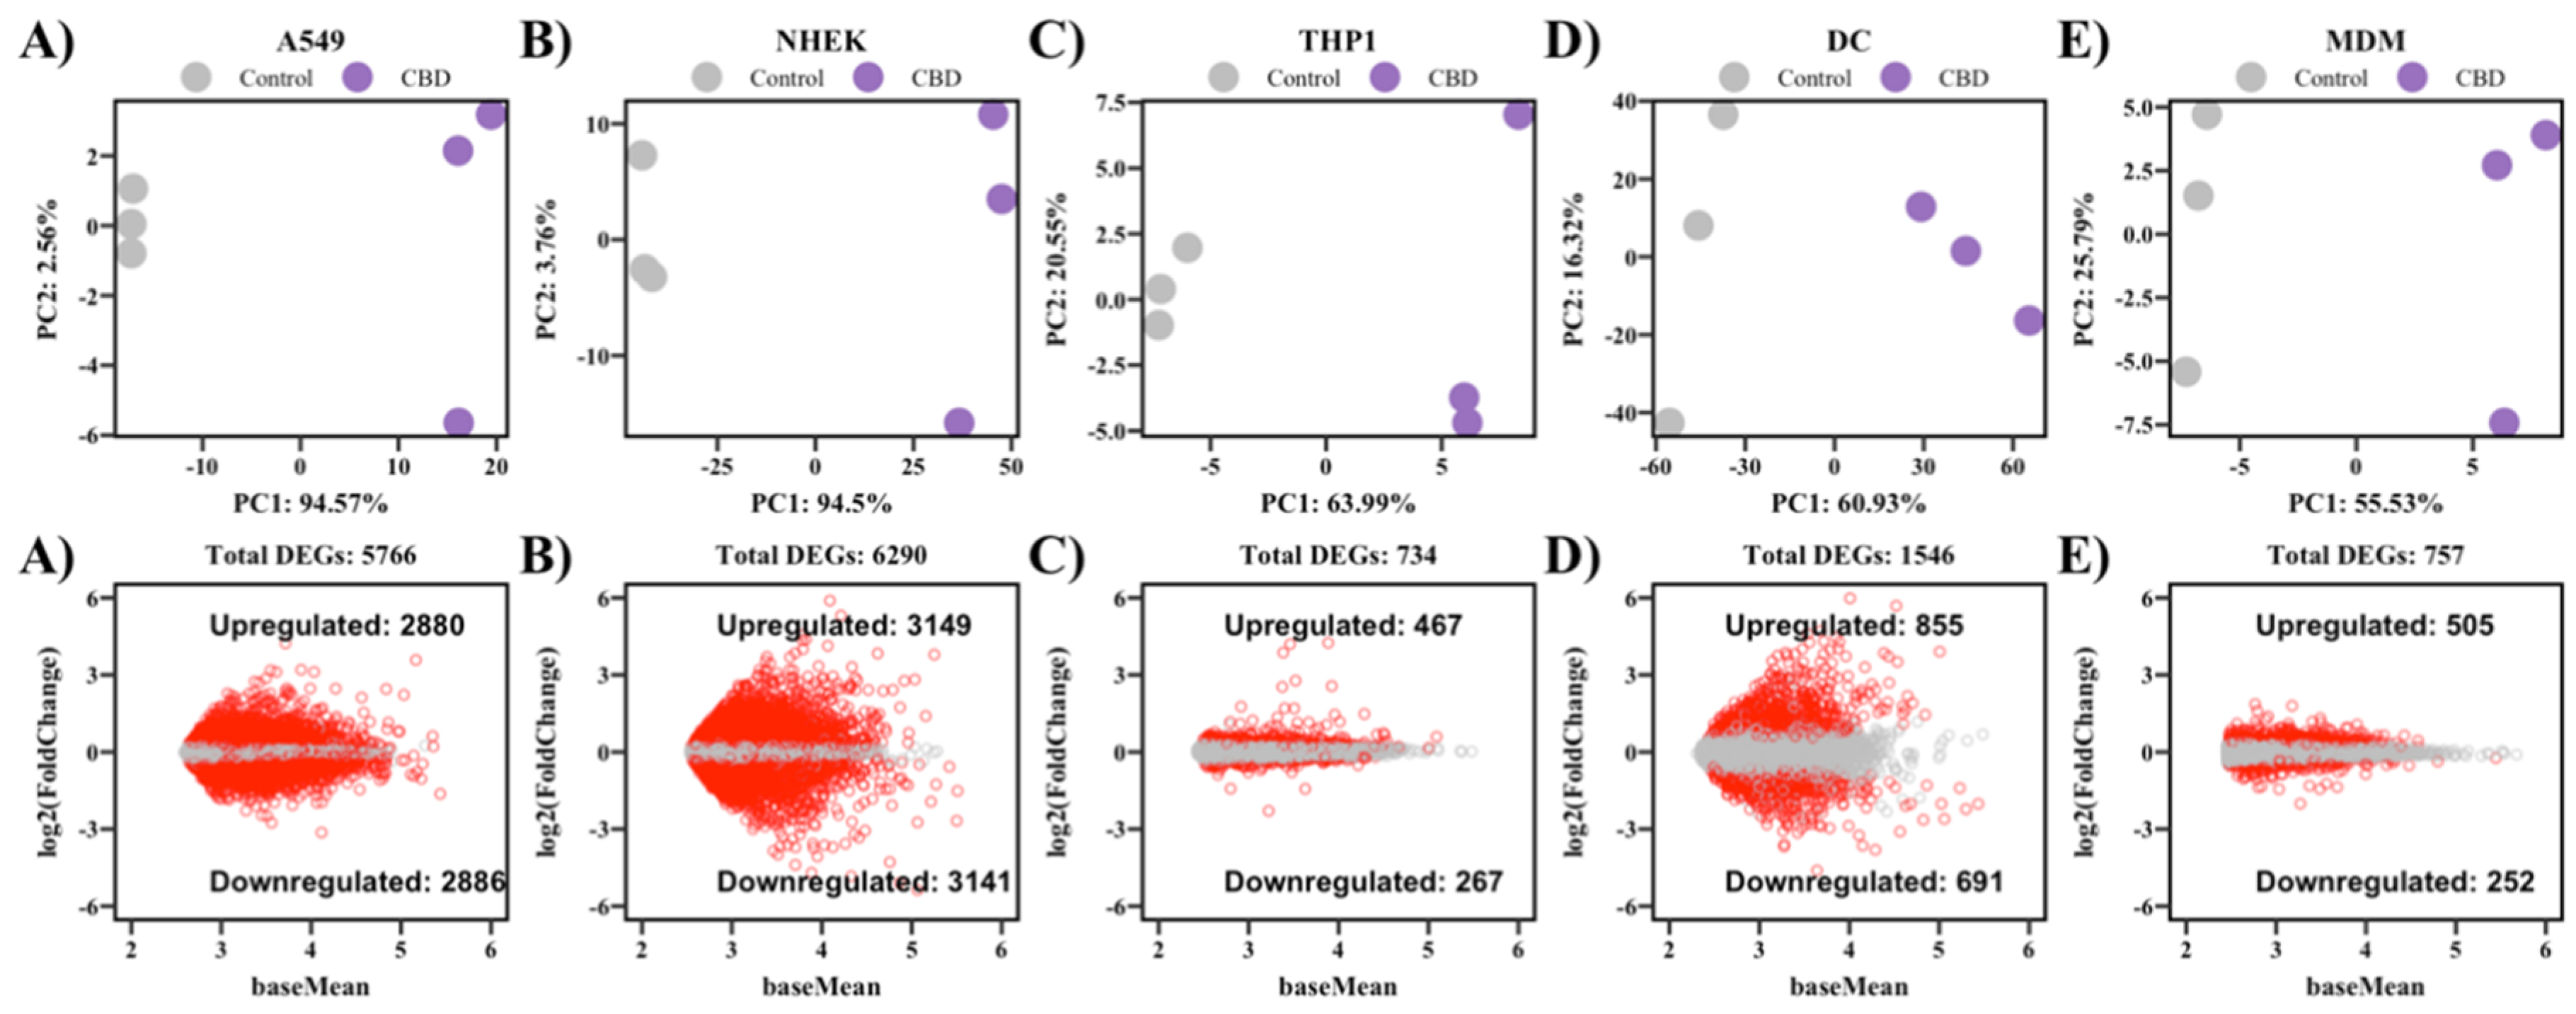
CBD is incorporated into organelle membranes and influences cholesterol bioavailability [34]. To decode the effect of CBD on gene expression involved in these pathways, we analyzed publicly available transcriptomic datasets. PCA analysis revealed clear separation between CBD-treated cells and their respective controls, primarily along PC1, which accounted for 94,57% of variance in A549 cells, 94,5% in NHEK, 63,99% in THP-1, 60,93% in DCs, and 55,53% in MDMs (Figure 1A-E). This yielded a total of 5,766 DEGs in A549, 6,290 in NHEK, 734 in THP-1, 1,546 in DCs, and 757 in MDMs (Figure 1A–E, respectively). These results demonstrate that CBD modulates the transcriptional landscape of human cells in a cell-type-specific manner.
Figure 1.
CBD modulates transcriptome profile in human cell lines. Principal component analysis of CBD-treated and control samples in A549 (A), NHEK (B), THP-1 (C), DC (D), and MDM (E), with the number of upregulated and downregulated DEGs (adjusted p-value < 0.01, |log2FC| > 0.25) for each cell type.
Figure 1.
CBD modulates transcriptome profile in human cell lines. Principal component analysis of CBD-treated and control samples in A549 (A), NHEK (B), THP-1 (C), DC (D), and MDM (E), with the number of upregulated and downregulated DEGs (adjusted p-value < 0.01, |log2FC| > 0.25) for each cell type.
To better understand the specific effects of CBD, we focused on genes differentially expressed in at least three cell types. Common and unique DEGs were identified using an UpSet plot, revealing 22 genes shared across all 5 cell types, 138 genes shared in 4 cell types, and 695 shared across 3 cell types (Figure 2A). To analyze the functional relevance of these overlapping DEGs, we performed an over-representation analysis (ORA). The shared DEGs were significantly enriched in pathways linked with the response to ER stress, autophagy, lipid metabolism, ferroptosis, and cholesterol metabolism (Figure 2B).
Figure 2.
Common and cell-type-specific transcriptional responses to CBD. UpSet plot of DEGs shared across the five cell types (A). Over-representation analysis of DEGs shared in ≥3 cell types, clustered by semantic similarity (B). Gene set enrichment analysis (GSEA) for the five processes identified by ORA, shown independently for each cell type (C).
Figure 2.
Common and cell-type-specific transcriptional responses to CBD. UpSet plot of DEGs shared across the five cell types (A). Over-representation analysis of DEGs shared in ≥3 cell types, clustered by semantic similarity (B). Gene set enrichment analysis (GSEA) for the five processes identified by ORA, shown independently for each cell type (C).
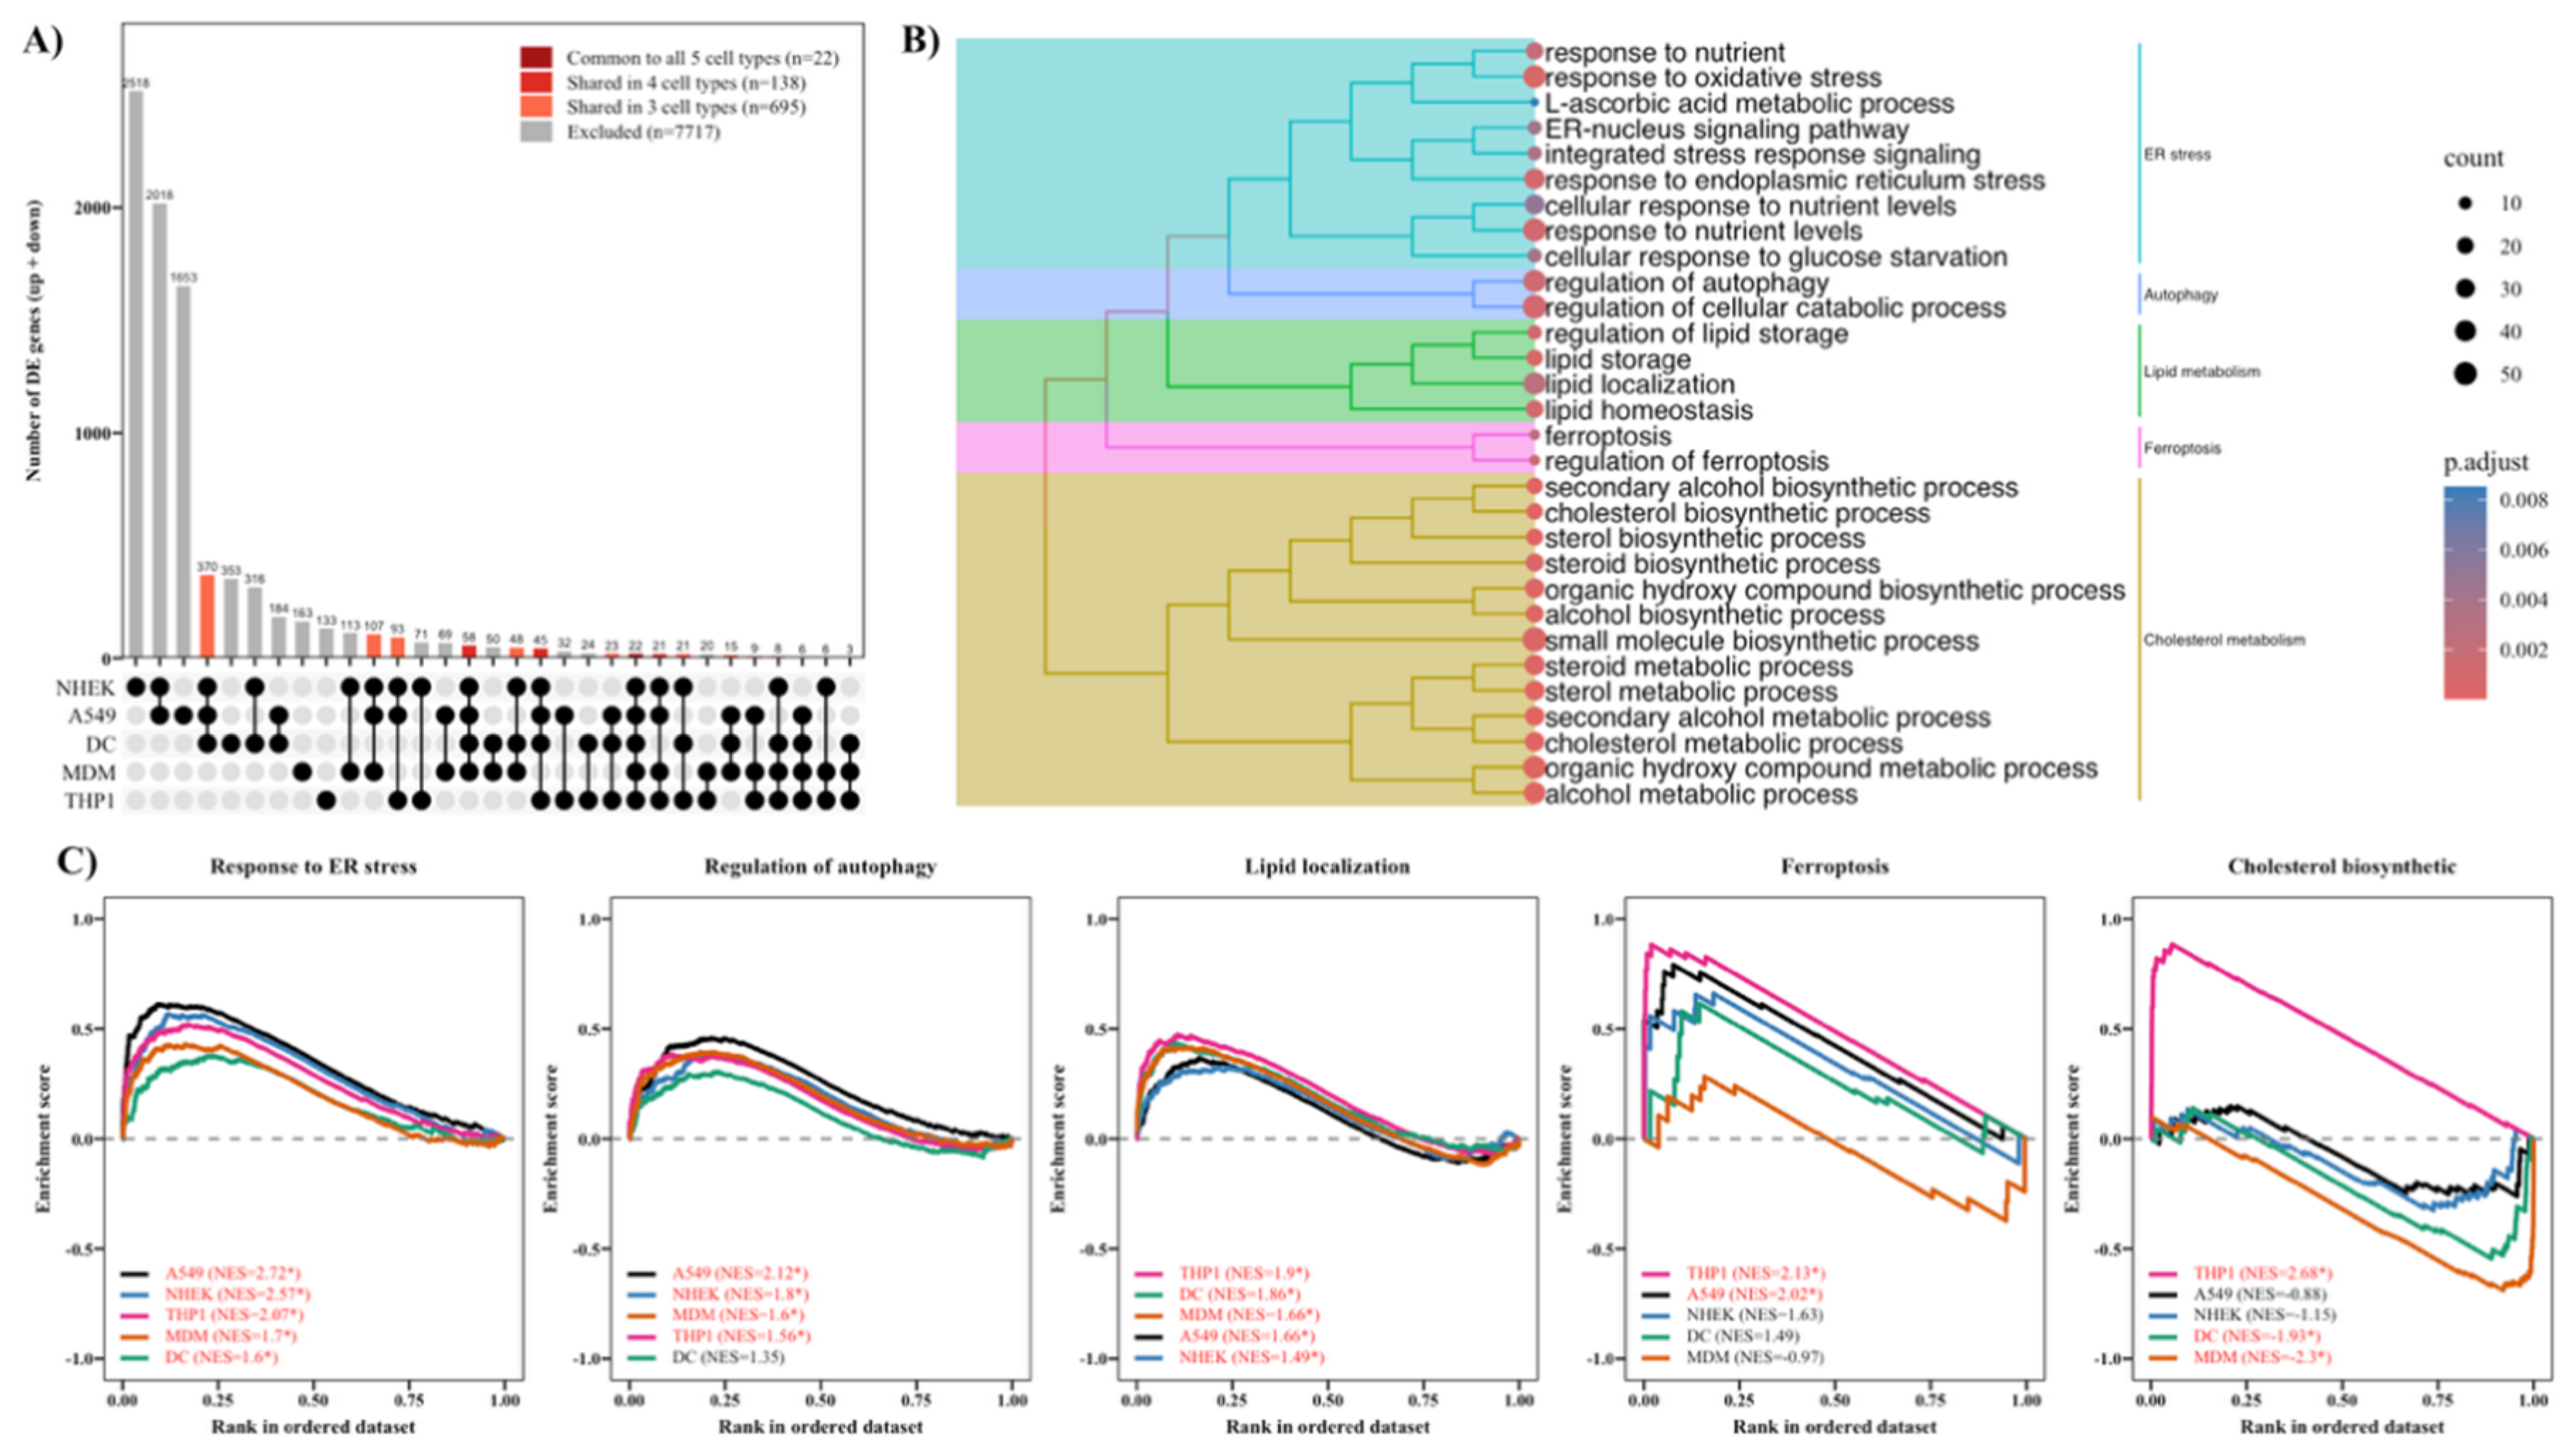
To further investigate cell-type-specific responses to CBD, we performed GSEA using the five processes identified by ORA (Fig. 2C). Genes involved in the response to ER stress were significantly upregulated across all five cell types (NES = 2.72 in A549, 2.57 in NHEK, 2.07 in THP-1, 1.7 in MDM, and 1.6 in DC: padj < 0.05). Autophagy regulation was upregulated in four of the five cell types (NES = 2.12 in A549, 1.8 in NHEK, 1.6 in MDM, and 1.56 in THP-1; padj < 0.05) but did not reach statistical significance in DCs. Lipid metabolism was significantly upregulated across all five cell types (NES = 1.9 in THP-1, 1.86 in DC, 1.66 in MDM, 1.66 in A549, and 1.49 in NHEK; padj < 0.05). In contrast, ferroptosis and cholesterol biosynthesis displayed cell-restricted patterns. Ferroptosis was significantly upregulated only in THP-1 and A549 (NES = 2.13 and 2.02, respectively; padj < 0.05), showing no significant enrichment in NHEK, DC, or MDM. Cholesterol biosynthetic genes were strongly upregulated in THP-1 (NES = 2.68), whereas this pathway was significantly downregulated in DC (NES = -1.93) and MDM (NES = -2.3), with no significant enrichment in A549 or NHEK. Together, these results indicate that ER stress, lipid metabolism, and autophagy represent common biological responses to CBD across all cell types. Conversely, ferroptosis is preferentially modulated in cell lines (THP1 and A549), whereas cholesterol metabolism is selectively regulated in myeloid cells (MDM, DCs, and THP1).
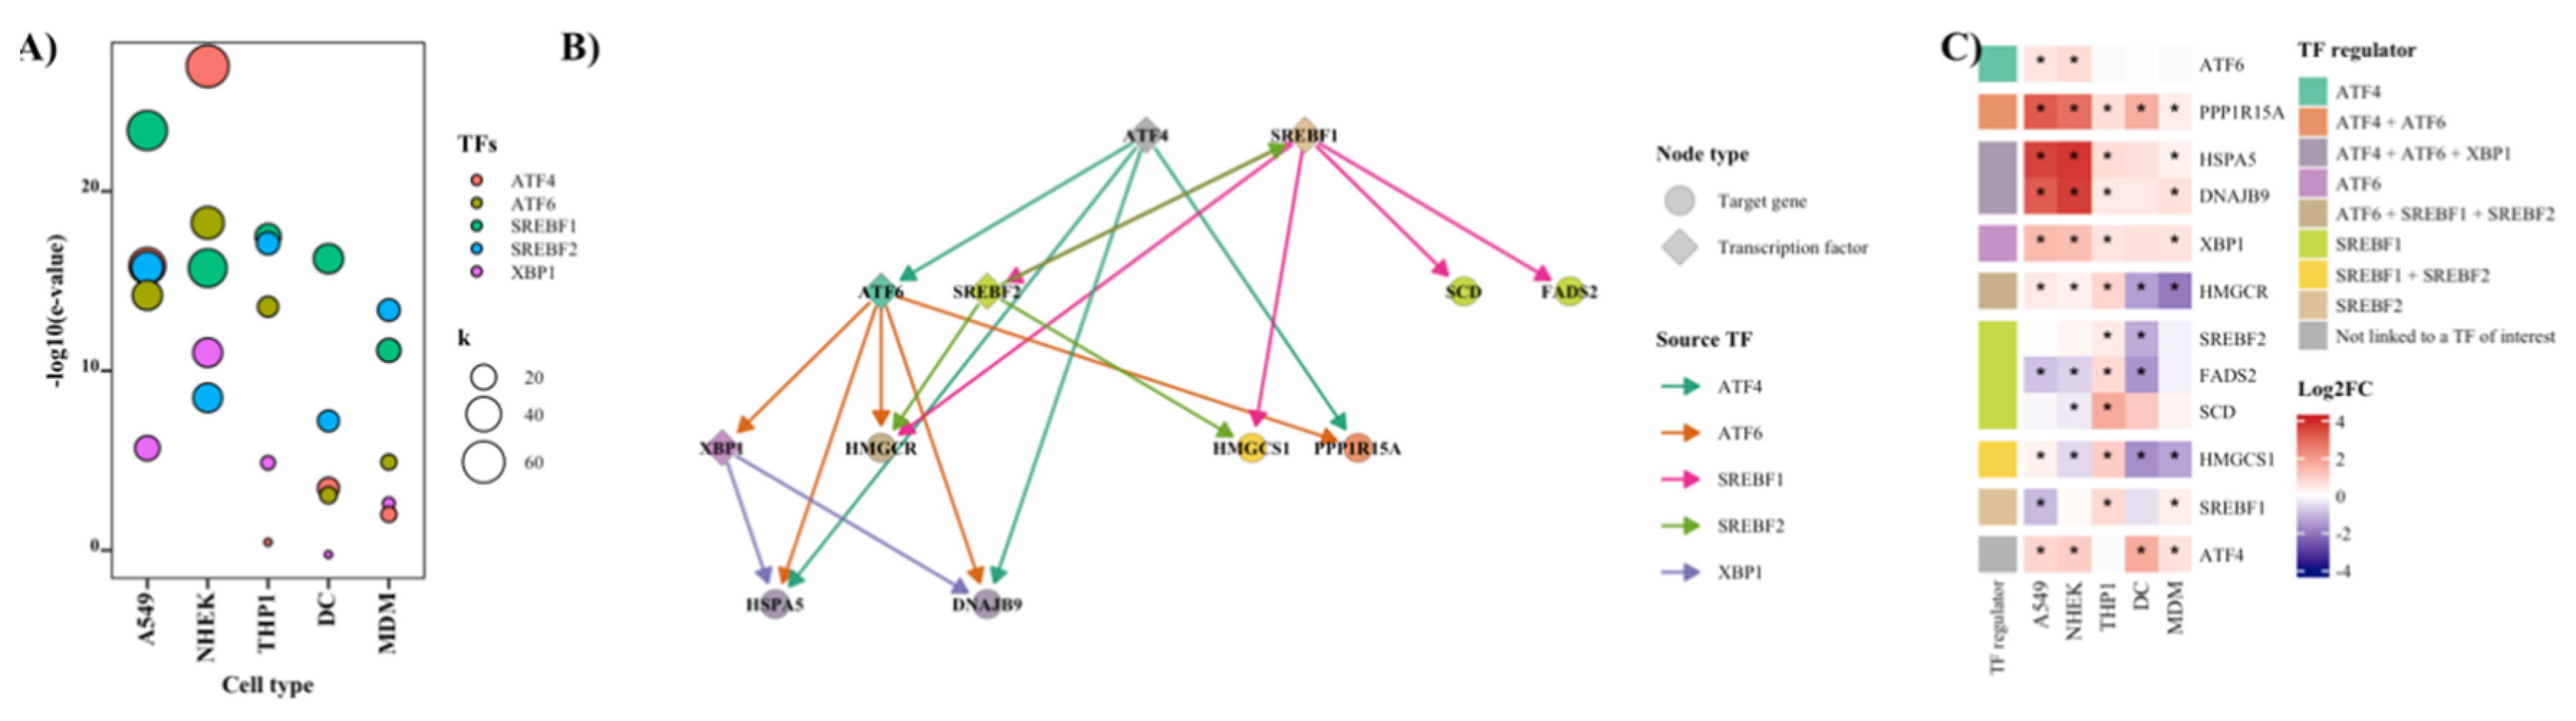
Having observed that CBD plays a key role in the expression of genes associated with ER stress, autophagy, lipid metabolism, ferroptosis, and cholesterol metabolism, we next investigated its effect on the TFs regulating these processes. TF activity enrichment analysis identified ATF4, ATF6, SREBF1, SREBF2 and XBP1, as significantly enriched regulators of the DEGs across all five CBD-treated cell types, although their relative activity varied markedly by cell type (Fig. 3A). Mapping these TFs onto their curated downstream targets recovered the expected shared regulatory architecture of the UPR and cholesterol-biosynthesis pathways: HSPA5 and DNAJB9 were linked to ATF4, ATF6 and XBP1, whereas HMGCS1 and HMGCR were linked to SREBF1 and SREBF2 (Fig. 3B). At the expression level, PPP1R15A (GADD34) was significantly upregulated across most cell types, while HSPA5, DNAJB9 and XBP1 were upregulated in A549, NHEK, THP1 and MDM cells, consistent with UPR activation; notably, the expression of UPR-target genes peaked in cell lines with marked ATF6 upregulation, such as A549 and NHEK (Fig. 3C). In contrast, the cholesterol-biosynthesis genes HMGCS1 and HMGCR exhibited more cell-type-restricted changes; these genes were upregulated only when SREBF1 and SREBF2 were induced, subsequently driving FADS2 and SCD expression (Fig. 3C). Notably DC only activates the UPR through the ATF4-PPP1R15A axis. Together, these results indicate that CBD engages a core UPR/cholesterol TF network, mediated by ATF4/ATF6/XBP1 and SREBF1/SREBF2, across all five cell types.
Figure 3.
CBD modulates a shared transcription factor network across cell types. TF activity enrichment for ATF4, ATF6, XBP1, SREBF1 and SREBF2 across the five CBD-treated cell types (A). Directed network of these TFs and their curated ER-stress/cholesterol-metabolism target genes, coloured by TF-regulator category (B). Heatmap of log2FC for the curated target-gene panel across cell types, grouped by TF-regulator category; asterisks indicate genes meeting the DEG significance threshold in each cell type (C).
Figure 3.
CBD modulates a shared transcription factor network across cell types. TF activity enrichment for ATF4, ATF6, XBP1, SREBF1 and SREBF2 across the five CBD-treated cell types (A). Directed network of these TFs and their curated ER-stress/cholesterol-metabolism target genes, coloured by TF-regulator category (B). Heatmap of log2FC for the curated target-gene panel across cell types, grouped by TF-regulator category; asterisks indicate genes meeting the DEG significance threshold in each cell type (C).
3.2. Validation of Target Gene Expression in CBD-treated A549 and THP-1 Cells by RT-qPCR
We next validated target gene expression in CBD-treated A549 and THP-1 cells. For this, both cell lines were treated with CBD under the same conditions matching its corresponding transcriptome dataset (Section 2.6). We determined the expression of genes encoding key TFs involved in ER protein processing and cholesterol metabolism (Fig. 4). Consistent with our multitranscript analysis, ATF4 and ATF6 were significantly upregulated in CBD-treated A549 cells, whereas the mRNA levels of these genes remained unchanged in THP-1 cells (Fig. 4A). We next quantified two XBP1 variants, spliced XBP1 (sXBP1) and unspliced XBP1 (uXBP1) and normalized their expression to total XBP1 (tXBP1). Notably, sXBP1 was upregulated in A549 cells, whereas uXBP1 and SREBF1 mRNA levels showed no significant changes (Fig. 4A). In contrast, we observed a significant increase in the mRNA level of sXBP1, uXBP1, and SREBF1 in THP-1 cells (Fig. 4A).
Figure 4.
Validation experiments of CBD-treated human cell lines. RT-qPCR for Transcription factors (A). protein processing (B) and cholesterol metabolism (C) genes. Unpaired t-tests were applied to compare the expression of one gene against its respective control (The normalized mRNA expression of the control is always 1, see dashed line). Significant code: ‘*’ 0.05.
Figure 4.
Validation experiments of CBD-treated human cell lines. RT-qPCR for Transcription factors (A). protein processing (B) and cholesterol metabolism (C) genes. Unpaired t-tests were applied to compare the expression of one gene against its respective control (The normalized mRNA expression of the control is always 1, see dashed line). Significant code: ‘*’ 0.05.
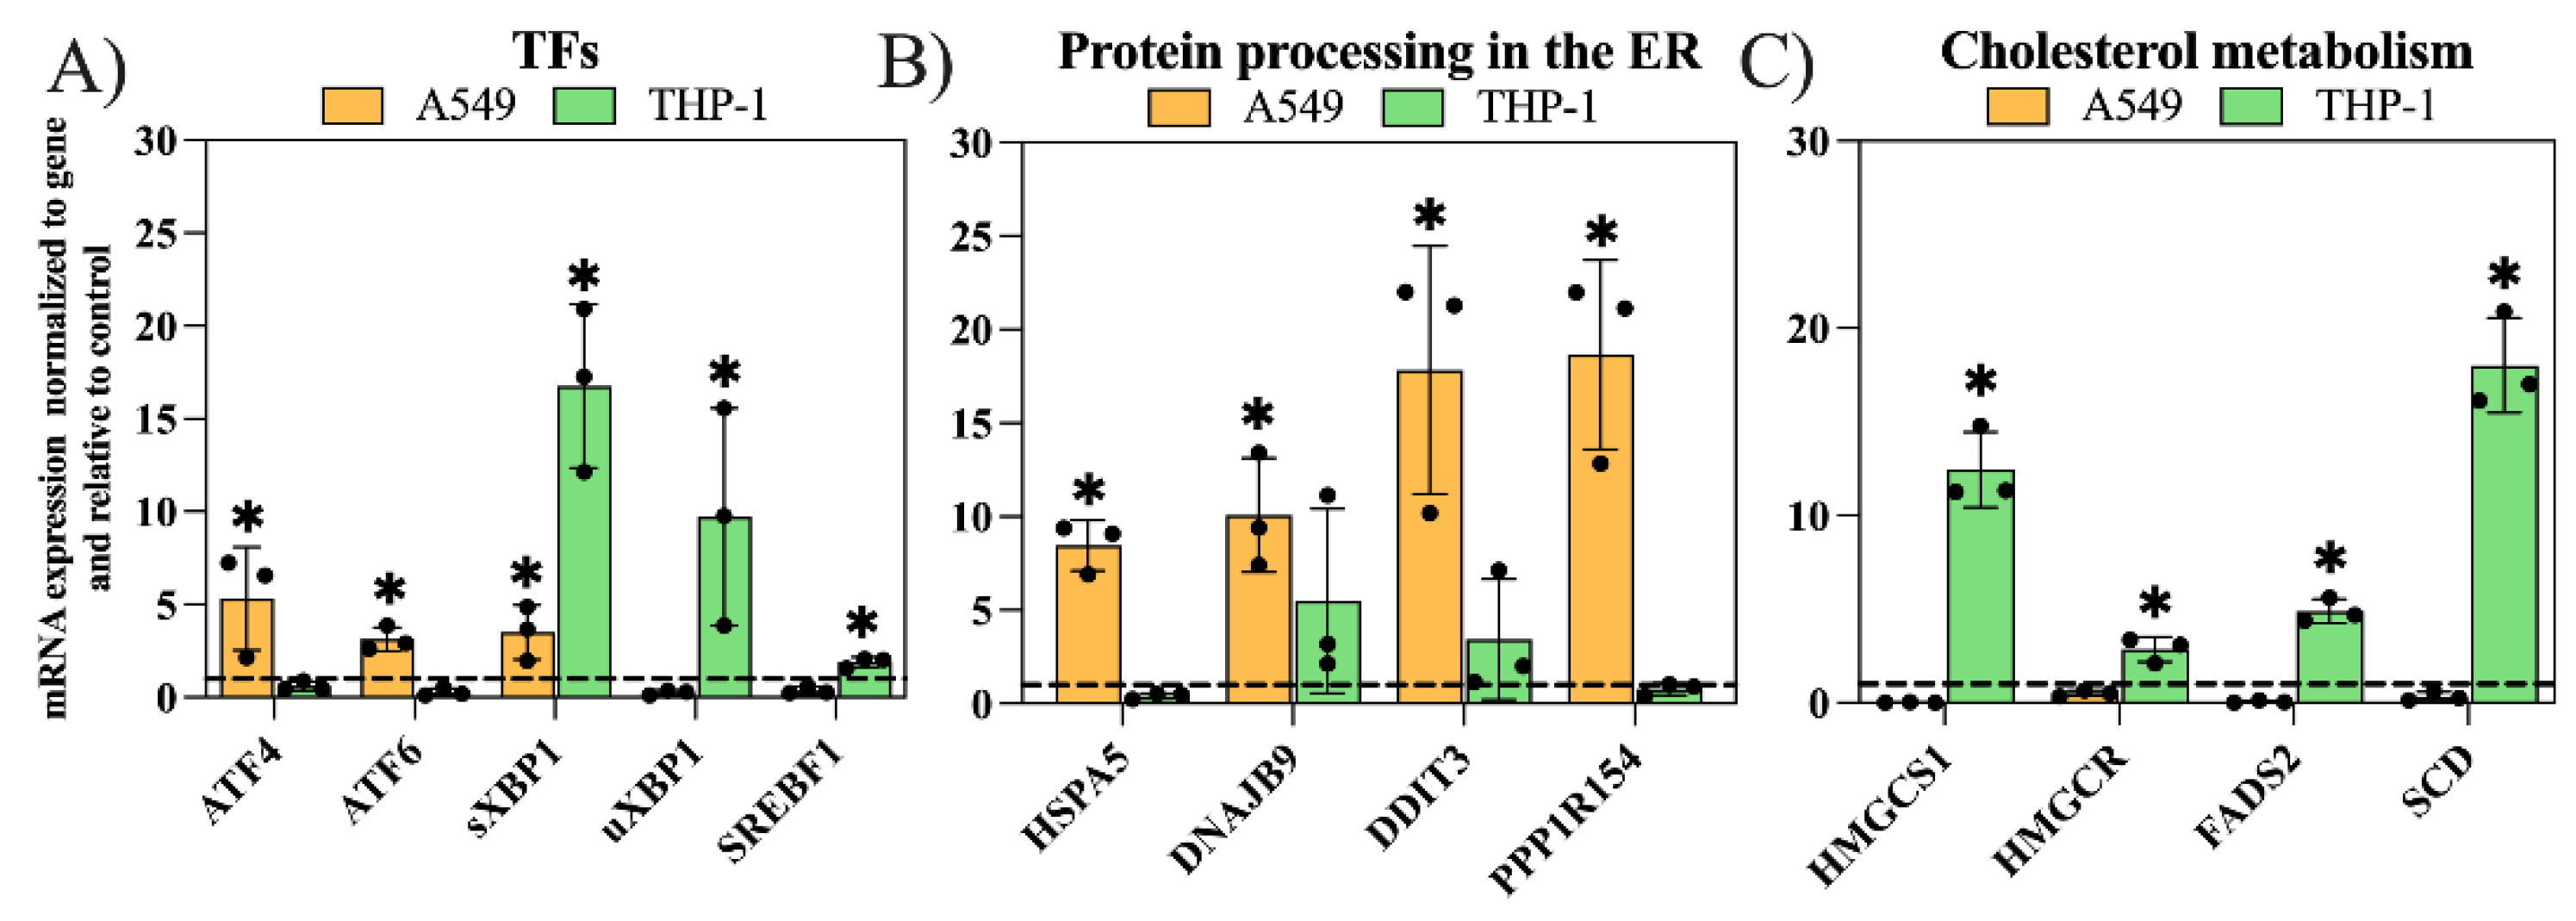
Next, we assessed the mRNA expression of target genes involved in ER protein processing and cholesterol metabolism. Consistent with our multi-transcriptomic findings, CBD treatment significantly increased the mRNA levels of HSPA5, DNAJB9, DDIT3, and PPP1R15A (GADD34) in A549 cells (Fig. 4B). In contrast, none of these genes reached statistical significance in THP-1 cells, although DNAJB9 and DDIT3 exhibited a trend toward upregulation (Fig. 4B-C). Conversely, CBD treatment significantly increased the mRNA levels of the cholesterol biosynthesis and fatty acid metabolism-related genes HMGCS1, HMGCR, FADS2, and SCD in THP-1 cells, whereas the gene expression of these genes remained unchanged in A549 cells (Fig. 4C).
3.3. Cell Viability Assessment and RT-qPCR Validation of mRNA-Seq Data in MDMs
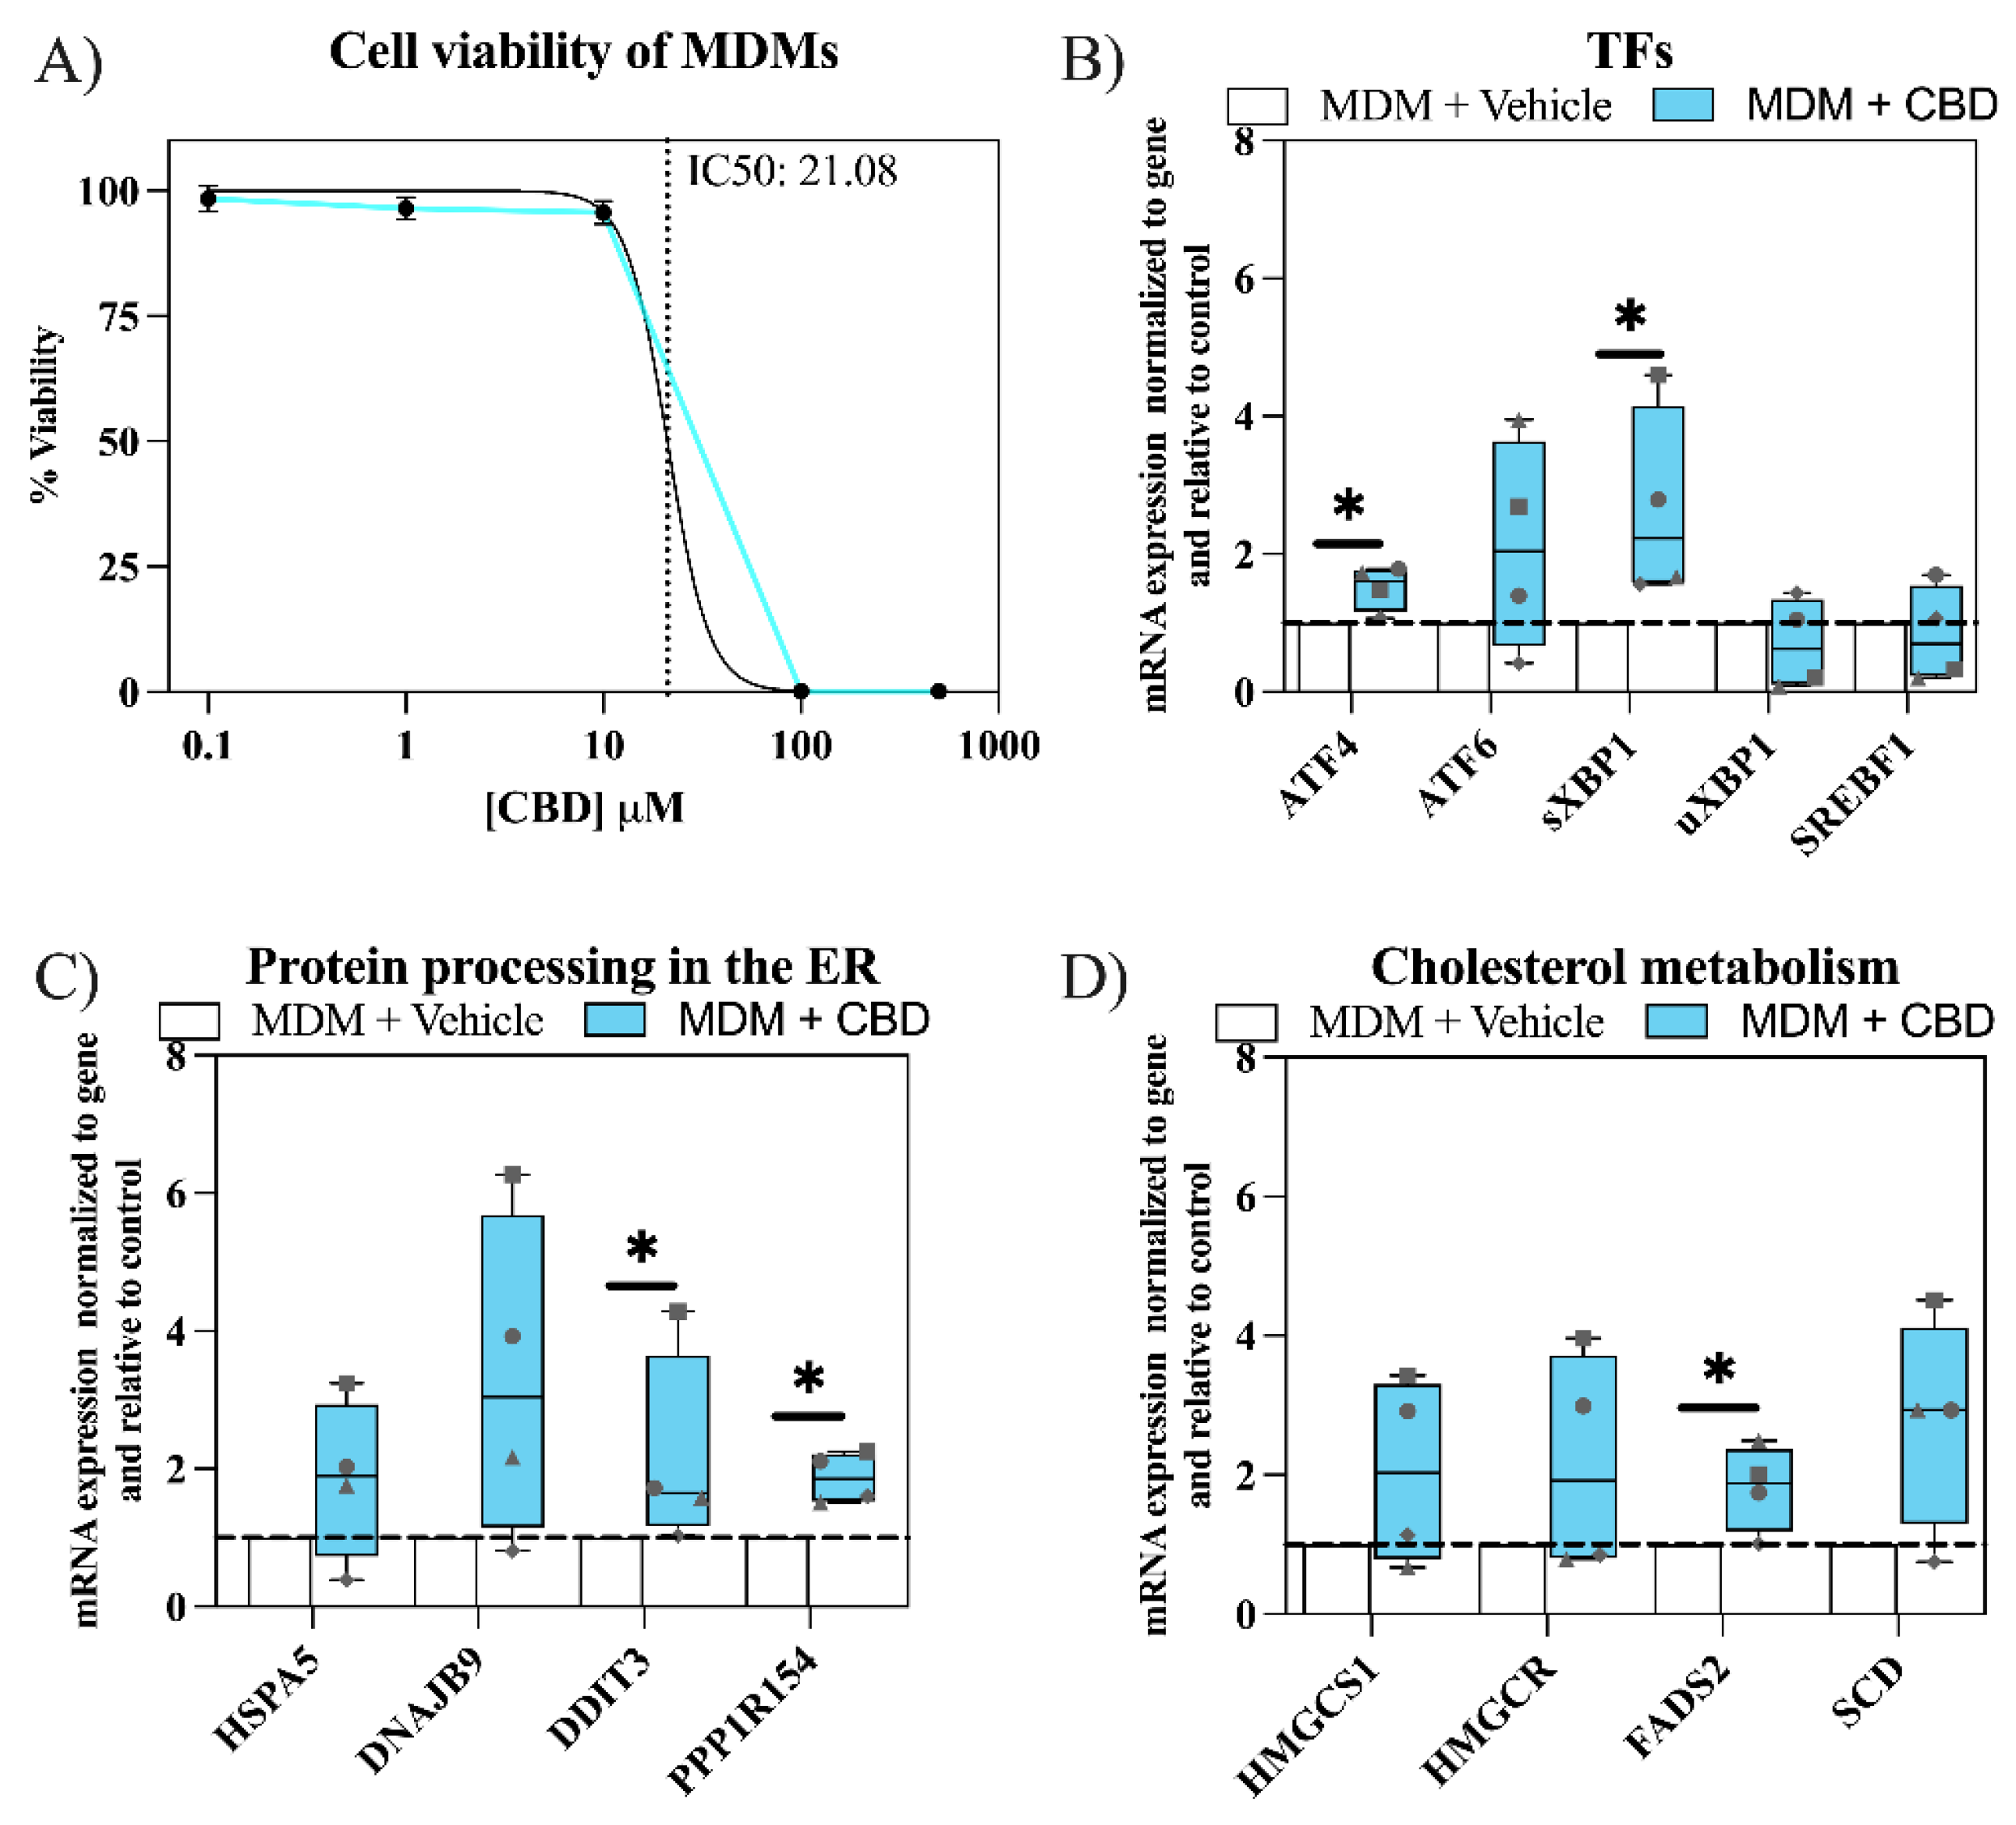
Before validating the RNA-Seq findings, we evaluated the effect of CBD on MDM cell viability. As shown in Figure 5A, MDMs maintained high viability (> 95%) even at increasing CBD concentrations, with a half-maximal inhibitory concentration (IC50) of 21.08 µM. Based on these findings, MDMs were treated with 10 µM CBD for RT-qPCR validation. We selected key genes encoding UPR TFs, SREBF1, and downstream targets involved in ER protein processing and cholesterol metabolism. Consistent with our transcriptomic predictions, CBD treatment significantly increased the expression of UPR-related TFs, including ATF4 and sXBP1, compared to untreated MDM, whereas the mRNA levels of uXBP1 and SREBF1 remained unchanged (Fig. 5B). Although ATF6 expression showed a notable trend toward upregulation, the change did not reach statistical significance. Consistent with the upregulation of UPR TFs (ATF4 and sXBP1), the mRNA levels of DDIT3 and PPP1R15A (GADD34), both of which are involved in ER protein processing, were significantly increased following CBD treatment (Fig. 5C). Similarly, HSPA5 and DNAJB9 showed trends toward increased mRNA expression; however, these changes did not reach statistical significance. Among the genes involved in cholesterol metabolism, only FADS2 showed a significant increase in mRNA expression, whereas the expression level of HMGCS1, HMGCR, and SCD remained unchanged (Fig. 5D). Overall, these findings indicate that CBD treatment in MDM predominantly upregulates genes involved in ER protein processing.
Figure 5.
Validation experiments of CBD-treated primary human cells. MDM viability analysis by flow cytometry (A). RT-qPCR for Transcription factors (B). protein processing (C) and cholesterol metabolism (D) genes. Unpaired t-tests were applied to compare the expression of one gene against its respective control. Significant code: ‘*’ 0.05.
Figure 5.
Validation experiments of CBD-treated primary human cells. MDM viability analysis by flow cytometry (A). RT-qPCR for Transcription factors (B). protein processing (C) and cholesterol metabolism (D) genes. Unpaired t-tests were applied to compare the expression of one gene against its respective control. Significant code: ‘*’ 0.05.
4. Discussion
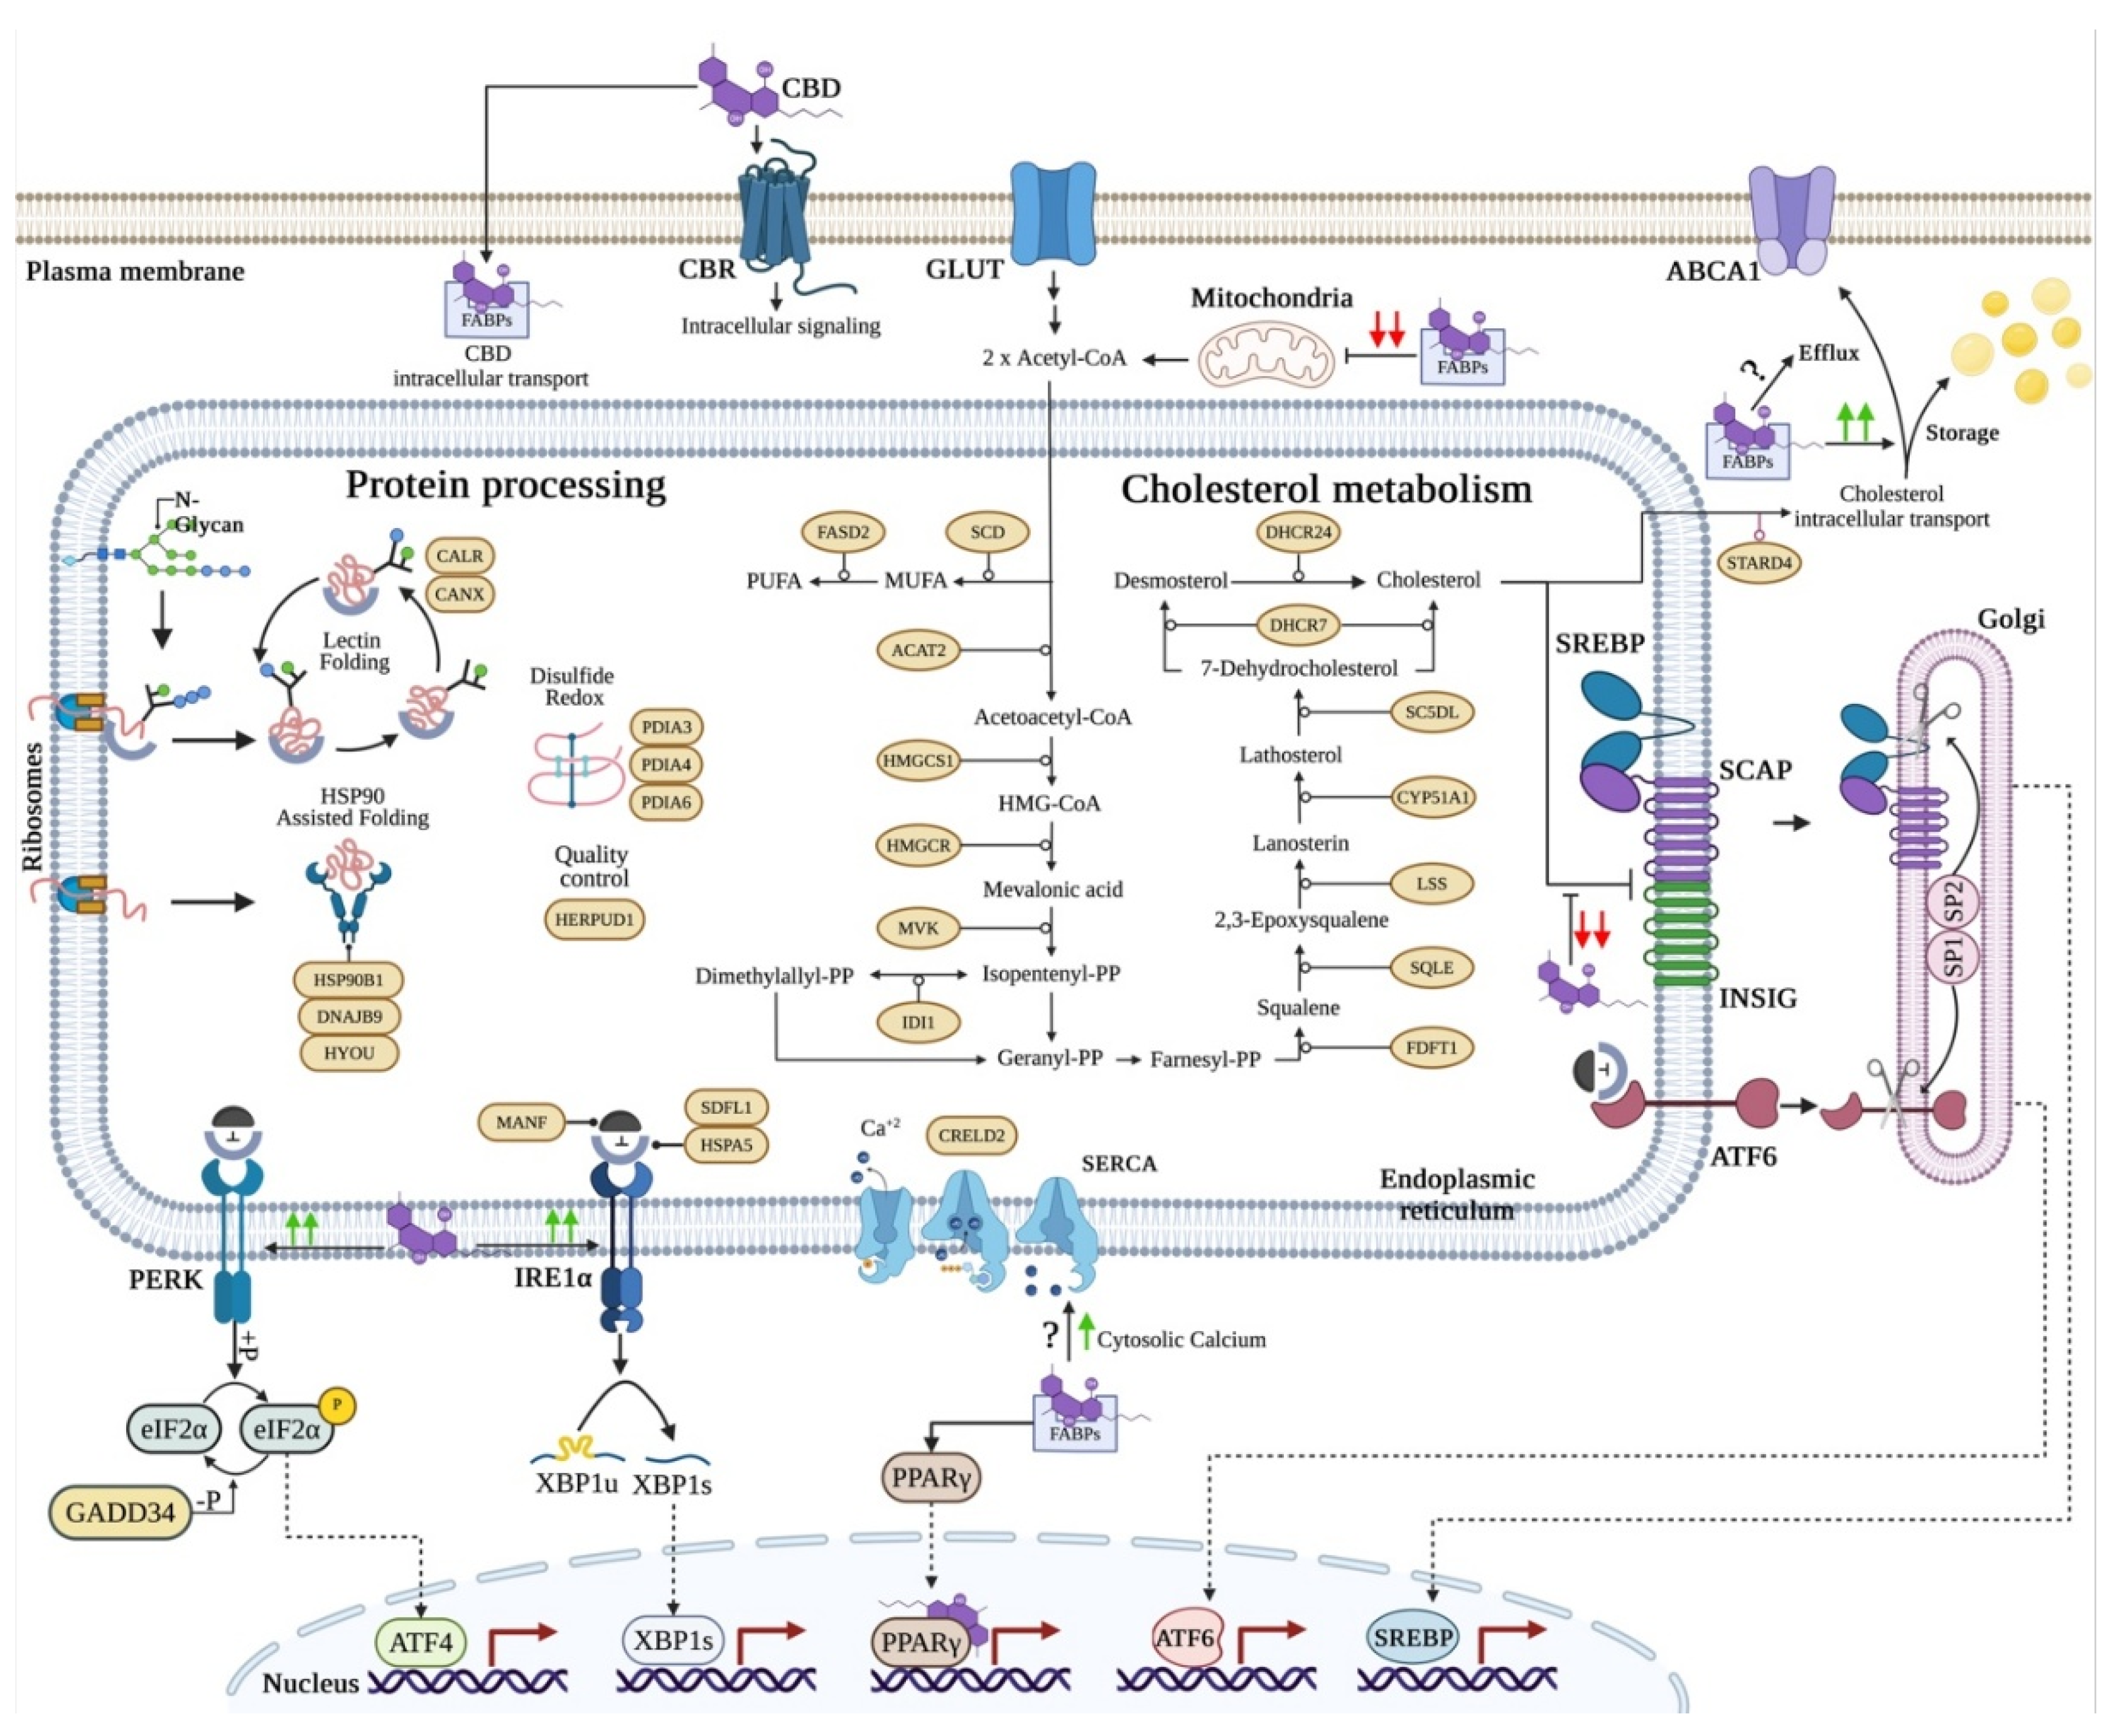
CBD is one of the major bioactive compounds found in cannabis and is currently the subject of significant medicinal study. Many preclinical and clinical trials are being conducted to investigate various diseases, including epilepsy [35]. CBD may impact multiple signaling pathways through direct binding to ionotropic, metabotropic, and nuclear receptors, as well as exerting less direct effects on enzymes and transporters [36,37,38,39,40]. Although a single receptor has not yet been identified, CBD is reported to have pleiotropic effects on cells [41] (Fig. 6). For instance, CBD has been reported to have antiviral effects against severe acute respiratory syndrome coronavirus 2 (SARS-CoV-2) through the activation of IRE1α-dependent decay (RIDD) [42], and long-term exposure of human immunodeficiency virus (HIV)-infected primary macrophages to CBD reduces viral spread [43]. This raises the question of whether the effects of CBD are cell-type-dependent. We analyzed multi-transcriptome data from human cell lines and primary human cells to address this issue. We found that the gene expression pattern in response to CBD treatment was highly dependent on cell type. For instance, A549 cell lines, NHEK, DC, and MDM cells upregulated genes involved in ER protein processing following CBD treatment, whereas THP-1 cells upregulated genes involved in cholesterol metabolism. Furthermore, the dynamics of the response depended on the expression of TFs, including ATF4, ATF6, sXBP1, and SREBF1. Upregulation of ATF4, ATF6, and sXBP1 leads to a gene expression program focused on protein processing in the ER, while the upregulation of sXBP1 and SREBF1 promotes gene expression programs targeting cholesterol and lipid metabolism. These interactions involve crosstalk that is strongly dependent on the expression of UPR and SREBP TFs (Fig. 6).
Figure 6.
Pleiotropic effects of CBD on ER protein processing and cholesterol metabolism. CBD can alter mitochondrial function, reduce ER cholesterol levels, stimulate the SREBP signaling pathway, induce cholesterol storage, and activate the nuclear receptor PPARγ. By altering membrane cholesterol availability, CBD may activate IRE1α and PERK receptors. Created with BioRender.com.
Figure 6.
Pleiotropic effects of CBD on ER protein processing and cholesterol metabolism. CBD can alter mitochondrial function, reduce ER cholesterol levels, stimulate the SREBP signaling pathway, induce cholesterol storage, and activate the nuclear receptor PPARγ. By altering membrane cholesterol availability, CBD may activate IRE1α and PERK receptors. Created with BioRender.com.
Increases in ATF4 protein levels in the MCF7 cell line after treatment with CBD were also reported [44]. Although our results indicated a link between CBD and ER stress, the differences between various cell lines and human primary cells have not been fully elucidated. As proposed by de la Harpe et al., who reported that CBD treatment significantly increased Ca2+ and ROS accumulation in MCF7 but not in MDA-MB-231 cells after exposure to 20 μM CBD [47], our results may be explained by differences in the localization or expression levels of CBD receptors. Recent evidence suggests that CBD is incorporated into membranes and increases the production and storage of cholesterol, limiting its availability [34]. Also, CBD can promote unconventional splicing of XBP1 [42]. Therefore, we speculate that CBD may induce lipotoxicity by affecting the function of ER-related receptors, including IRE1α and PERK, which can sense lipid membrane perturbations through their shared transmembrane (TM) domain [16].
We found that A549, NHEK, DC, and MDM treated with CBD upregulated ATF4, sXBP1, and their target genes involved in ER protein processing. These results suggest that CBD may indirectly activate PERK and IRE1α receptors by altering the lipid composition of the ER membrane. In agreement with this, it has been described that CBD can initiate the IRE1, PERK, and ATF6 pathways, resulting in the degradation of misfolded proteins and termination of protein translation [45]. Furthermore, Hajee Basha et al. reported that CBD binds the ER arm proteins involved in UPR, including ATF6, PERK, and XBP1, by molecular docking [45]. However, pretreated adipose stem cells with CBD protect cells against ER stress by downregulating the transcription of ERN1, EIF2AK3, DDIT3, and ATF6 [46]. Collectively, our results and the aforementioned studies suggest that CBD plays an important role in ER stress.
Cholesterol homeostasis in the ER is regulated by resident inactive TFs that sense cholesterol levels in the ER and generate a transcriptional response upon activation and translocation to the nucleus [22]. When sufficient sterols are present in the cell, cholesterol can bind directly to the sterol-sensing domain of the SREBP cleavage-activating protein (SCAP), leading to a conformational change. This conformation promotes the association of SCAP with another ER membrane protein named insulin-induced gene (INSIG), which blocks translocation of the SREBP–SCAP complex to the Golgi [47]. CBD has been proven to alter membrane cholesterol levels, leading to accumulation in lipid droplets [34]. Therefore, once cholesterol levels are reduced in the ER, SREBP translocates to the Golgi, where it is cleaved by site-1 and site-2 proteases and then translocates to the nucleus [22]. Since we observed that CBD treatment in THP-1 cells promoted the expression of cholesterol-related genes, we suggest that the effects observed in these cells were due to activation of the SREBP signaling pathway. Furthermore, we also observed splicing of XBP1, suggesting an important role for this TF in response to CBD treatment.
A major crosstalk factor between protein processing in the ER and cholesterol metabolism is ATF6. When protein overload occurs, ATF6 is translocated to the Golgi and is cleaved by the same proteases as SREBP and then translocated to the nucleus [18]. Importantly, we found that ATF6 is required to induce the UPR under CBD treatment, as we observed that A549 and NHEK cells enhance ATF6 expression and upregulate their target genes. However, we observed that DC did not upregulate ATF6 and therefore did not enhance the transcription of some UPR-responsive genes.
CBD is found to be cytotoxic at high doses in cancer cells [48]. However, CBD did not affect the viability of human PBMCs up to 10 μM [49]. Another study showed that CBD (4-8 μM) can induce apoptosis in mouse thymocytes [50], as well as the viability of primary monocyte cells exposed to 1-16 μM of CBD was affected [51,52], while treatment with 10 μM CBD did not affect NHEK and DC viability [53,54]. In agreement with this last study, we confirmed that CBD from 0.1 to 10 μM did not affect MDM viability. We then performed RT-PCR to study the effects of CBD on human MDM. We report for the first time that MDMs upregulate ATF4 and sXBP1 upon CBD treatment, while ATF6 trends to increase. Additionally, we observed upregulation of ATF4 target genes, including DDIT3 and PPP1R154, and a trend toward increased HSPA5 and DNAJB9. Therefore, like A549 and NHEK, the transcriptional profile of MDM mainly focuses on protein processing in the ER. In agreement with our results, Kim et al. (2024) reported that CBD increased the expression of ATF4 and DDIT3, elevated ER stress, and enhanced reactive oxygen species levels [55]. Similar results were observed in BV-2 microglial pancreatic cells upon CBD treatment [56,57].
The endocannabinoid system (ECS) regulates various physiological, behavioral, immunological, and metabolic aspects. Many components of the ECS are key regulators of the immune system and the immune response [58]. The ECS is present in MDM, and these cells can produce endogenous ligands, including 2-arachidonoylglycerol and N-arachidonoylethanolamine (2-AG and AEA, respectively) [59,60]. CBD may, therefore, also affect the ECS in MDM, which might exhibit varying levels of activity in different donors and may result in a relatively high donor dependence on the observed effects [53]. Our results highlight donor variability, as macrophages from a single donor (diamond symbol) appeared less responsive to CBD treatment (Fig. 5).
Although our results are primarily at the transcriptional level, the proteome profile of neuroblastoma cells supports the hypothesis proposed here. For instance, proteome-wide profiling of SH-SY5Y cells showed increased ER-related proteins in the CBD treatment group [41]. They found that mitochondria and the ER could be the main targets of phytocannabinoids and highlighted upregulation of the UPR by IRE1α and ATF6B [41], as we found at the transcriptional level. On the other hand, a multi-omics analysis of the neuroblastoma cell line SK-N-BE supporting our hypothesis related to the upregulation of proteins involved in cholesterol metabolism [61]. The authors highlight the upregulation of HMGCR, a rate-limiting enzyme of cholesterol biosynthesis, and suggest that in the presence of CBD, the ER cannot accurately sense cholesterol content at the plasma membrane and consequently generates excess esterified cholesterol [34]. Altogether, the obtained results may contribute to a better understanding of the role of CBD in regulating gene expression involved in protein processing in the ER and cholesterol metabolism.
5. Limitations of the Study
The study had a significant limitation: it compared transcriptome data from different treatments that varied in concentrations and times. Despite this limitation, our findings strongly suggest that CBD-induced changes in the transcriptome of human primary cells are closely associated with endoplasmic reticulum (ER) stress. Specifically, genes related to protein processing in the ER showed consistent patterns. This comparison provides robust evidence of CBD-induced ER stress. To gain deeper insights, further research and validation are needed to explore the molecular mechanisms underlying how CBD regulates gene expression. Additionally, it’s worth noting that this study did not directly investigate protein changes. However, other studies align with our multitranscript analysis by examining protein expression under CBD treatment.
6. Conclusions
The results of this study present biological pathways affected by CBD in human cell lines and primary human cells. Our findings suggest that CBD treatment induces different biological responses depending on the target cells. Depending on the cellular context, CBD treatment induces endoplasmic reticulum stress by upregulating TFs such as ATF4, ATF6, and XBP1. On the other hand, CBD can promote cholesterol biosynthesis by enhancing the expression of XBP1 and SREBP family genes. This analysis will provide accurate information for further research using CBD as a therapeutic agent.
Supplementary Materials
The following supporting information can be downloaded at the website of this paper posted on Preprints.org.
CRediT Authorship Contribution Statement
Y.S. Tamayo-Molina: Conceptualization, Investigation, Software, Formal analysis, Data curation, Visualization, Writing—original draft, Writing—review & editing. Lady Johana Hernández-Sarmiento: Methodology, Validation. Silvio Urcuqui-Inchima: Conceptualization, Funding acquisition, Resources, Supervision, Visualization, Writing—review & editing.
Funding
This research was supported by Universidad de Antioquia-CODI, Acta 2022-53011. The funders played no role in the study design and data collection.
Data Availability
Data will be made available on request.
Acknowledgments
The authors extend their appreciation to the blood bank of the “Escuela de Microbiología, UdeA, Medellín, Colombia” for supplying leukocyte-enriched blood units from healthy individuals, as well as to the personnel at the institutions where the study was conducted.
Declaration of Competing Interests
The authors declare that they have no known competing financial interests or personal relationships that could have appeared to influence the work reported in this paper.
References
- Radwan, M.M.; Chandra, S.; Gul, S.; ElSohly, M.A. Cannabinoids, Phenolics, Terpenes and Alkaloids of Cannabis. Molecules 2021, 26, 2774. [Google Scholar] [CrossRef] [PubMed]
- National Center for Biotechnology Information. PubChem Compound Summary for CID 644019, Cannabidiol. In: PubChem [Internet]. 2022 [cited 10 Apr 2022]. Available online: https://pubchem.ncbi.nlm.nih.gov/compound/Cannabidiol.
- Billakota, S.; Devinsky, O.; Marsh, E. Cannabinoid therapy in epilepsy. Curr. Opin. Neurol. 2019, 32, 220–226. [Google Scholar] [CrossRef] [PubMed]
- Brown, J.D.; Rivera Rivera, K.J.; Hernandez, L.Y.C.; Doenges, M.R.; Auchey, I.; Pham, T.; et al. Natural and Synthetic Cannabinoids: Pharmacology, Uses, Adverse Drug Events, and Drug Interactions. J. Clin. Pharmacol. 2021, 61, S37–S52. [Google Scholar] [CrossRef] [PubMed]
- Gülck, T.; Møller, B.L. Phytocannabinoids: Origins and Biosynthesis. Trends Plant Sci. 2020, 25, 985–1004. [Google Scholar] [CrossRef] [PubMed]
- Elmes, M.W.; Kaczocha, M.; Berger, W.T.; Leung, K.N.; Ralph, B.P.; Wang, L.; et al. Fatty acid-binding proteins (FABPs) are intracellular carriers for Δ9-tetrahydrocannabinol (THC) and cannabidiol (CBD). J. Biol. Chem. 2015, 290, 8711–8721. [Google Scholar] [CrossRef] [PubMed]
- Litvinov, D.Y.; Savushkin, E. V.; Dergunov, A.D. Intracellular and Plasma Membrane Events in Cholesterol Transport and Homeostasis. J. Lipids 2018, 2018, 1–22. [Google Scholar] [CrossRef] [PubMed]
- Ingólfsson, H.I.; Thakur, P.; Herold, K.F.; Hobart, E.A.; Ramsey, N.B.; Periole, X.; et al. Phytochemicals Perturb Membranes and Promiscuously Alter Protein Function. ACS Chem. Biol. 2014, 9, 1788–1798. [Google Scholar] [CrossRef] [PubMed]
- Ghovanloo, M.-R.; Choudhury, K.; Bandaru, T.S.; Fouda, M.A.; Rayani, K.; Rusinova, R.; et al. Cannabidiol inhibits the skeletal muscle Nav1.4 by blocking its pore and by altering membrane elasticity. J. General. Physiol. 2021, 153, 778–782. [Google Scholar] [CrossRef] [PubMed]
- Martin, L.J.; Banister, S.D.; Bowen, M.T. Understanding the complex pharmacology of cannabidiol: Mounting evidence suggests a common binding site with cholesterol. Pharmacol. Res. 2021, 166, 105508. [Google Scholar] [CrossRef] [PubMed]
- Han, J.; Kaufman, R.J. The role of ER stress in lipid metabolism and lipotoxicity. J. Lipid Res. 2016, 57, 1329–1338. [Google Scholar] [CrossRef] [PubMed]
- Lemmer, I.L.; Willemsen, N.; Hilal, N.; Bartelt, A. A guide to understanding endoplasmic reticulum stress in metabolic disorders. Mol. Metab. 2021, 47, 101169. [Google Scholar] [CrossRef] [PubMed]
- Pakos-Zebrucka, K.; Koryga, I.; Mnich, K.; Ljujic, M.; Samali, A.; Gorman, A.M. The integrated stress response. EMBO Rep. 2016, 17, 1374–1395. [Google Scholar] [CrossRef] [PubMed]
- Araki, K.; Nagata, K. Protein Folding and Quality Control in the ER. Cold Spring Harb. Perspect. Biol. 2012, 4, a015438–a015438. [Google Scholar] [CrossRef] [PubMed]
- Malhotra, J.D.; Kaufman, R.J. The endoplasmic reticulum and the unfolded protein response. Semin Cell Dev. Biol. 2007, 18, 716–731. [Google Scholar] [CrossRef] [PubMed]
- Volmer, R.; Ron, D. Lipid-dependent regulation of the unfolded protein response. Curr. Opin. Cell Biol. 2015, 33, 67–73. [Google Scholar] [CrossRef] [PubMed]
- Fisher, E.A.; Brodsky, J.L. The unfolded protein response: A multifaceted regulator of lipid and lipoprotein metabolism. Cell Metab. 2012, 16, 407–408. [Google Scholar] [CrossRef] [PubMed]
- Moncan, M.; Mnich, K.; Blomme, A.; Almanza, A.; Samali, A.; Gorman, A.M. Regulation of lipid metabolism by the unfolded protein response. J. Cell Mol. Med. 2021, 25, 1359–1370. [Google Scholar] [CrossRef] [PubMed]
- Ron, D. Translational control in the endoplasmic reticulum stress response. J. Clin. Investig. 2002, 110, 1383–1388. [Google Scholar] [CrossRef]
- Lu, P.D.; Harding, H.P.; Ron, D. Translation reinitiation at alternative open reading frames regulates gene expression in an integrated stress response. J. Cell Biol. 2004, 167, 27–33. [Google Scholar] [CrossRef] [PubMed]
- Ye, J.; Rawson, R.B.; Komuro, R.; Chen, X.; Davé, U.P.; Prywes, R.; et al. ER stress induces cleavage of membrane-bound ATF6 by the same proteases that process SREBPs. Mol. Cell 2000, 6, 1355–1364. [Google Scholar] [CrossRef] [PubMed]
- Daemen, S.; Kutmon, M.; Evelo, C.T. A pathway approach to investigate the function and regulation of SREBPs. Genes Nutr. 2013, 8, 289–300. [Google Scholar] [CrossRef] [PubMed]
- Bommiasamy, H.; Back, S.H.; Fagone, P.; Lee, K.; Meshinchi, S.; Vink, E.; et al. ATF6α induces XBP1-independent expansion of the endoplasmic reticulum. J. Cell Sci. 2009, 122, 1626–1636. [Google Scholar] [CrossRef] [PubMed]
- Tamayo-Molina, Y.S.; Velilla, P.A.; Hernández-Sarmiento, L.J.; Urcuqui-Inchima, S. Multitranscript analysis reveals an effect of 2-deoxy-d-glucose on gene expression linked to unfolded protein response and integrated stress response in primary human monocytes and monocyte-derived macrophages. Biochimica et Biophysica Acta (BBA)—General Subjects 2023, 1867, 130397. [Google Scholar] [CrossRef] [PubMed]
- R Core Team. R: A Language and Environment for Statistical Computing; R Foundation for Statistical Computing: Vienna, Austria, 2020. [Google Scholar]
- Robinson, M.D.; McCarthy, D.J.; Smyth, G.K. edgeR: a Bioconductor package for differential expression analysis of digital gene expression data. Bioinformatics 2010, 26, 139–140. [Google Scholar] [CrossRef] [PubMed]
- Love, M.I.; Huber, W.; Anders, S. Moderated estimation of fold change and dispersion for RNA-seq data with DESeq2. Genome Biol. 2014, 15, 550. [Google Scholar] [CrossRef] [PubMed]
- Wickham, H. ggplot2; Springer International Publishing: Cham, 2016. [Google Scholar] [CrossRef]
- Yu, G.; Wang, L.-G.; Han, Y.; He, Q.-Y. clusterProfiler: an R Package for Comparing Biological Themes Among Gene Clusters. OMICS 2012, 16, 284–287. [Google Scholar] [CrossRef] [PubMed]
- Fukushima, Atsushi. TFactSR: Enrichment Approach to Predict Which Transcription Factors Are Regulated. 2023.
- Badia-I-Mompel, P.; Vélez Santiago, J.; Braunger, J.; Geiss, C.; Dimitrov, D.; Müller-Dott, S.; et al. decoupleR: ensemble of computational methods to infer biological activities from omics data. Bioinform. Adv. 2022, 2. [Google Scholar] [CrossRef] [PubMed]
- Gu, Z. Complex heatmap visualization. iMeta 2022, 1. [Google Scholar] [CrossRef] [PubMed]
- Valdés-López, J.F.; Hernández-Sarmiento, L.J.; Tamayo-Molina, Y.S.; Velilla-Hernández, P.A.; Rodenhuis-Zybert, I.A.; Urcuqui-Inchima, S. Interleukin 27, like interferons, activates JAK-STAT signaling and promotes pro-inflammatory and antiviral states that interfere with dengue and chikungunya viruses replication in human macrophages. Front Immunol. 2024, 15. [Google Scholar] [CrossRef] [PubMed]
- Guard, S.E.; Chapnick, D.A.; Poss, Z.C.; Ebmeier, C.C.; Jacobsen, J.; Nemkov, T.; et al. Multiomic Analysis Reveals Disruption of Cholesterol Homeostasis by Cannabidiol in Human Cell Lines. Mol. Cell. Proteom. 2022, 21, 100262. [Google Scholar] [CrossRef] [PubMed]
- Devinsky, O.; Cilio, M.R.; Cross, H.; Fernandez-Ruiz, J.; French, J.; Hill, C.; et al. Cannabidiol: Pharmacology and potential therapeutic role in epilepsy and other neuropsychiatric disorders. Epilepsia 2014, 55, 791–802. [Google Scholar] [CrossRef] [PubMed]
- Laprairie, R.B.; Bagher, A.M.; Kelly, M.E.M.; Denovan-Wright, E.M. Cannabidiol is a negative allosteric modulator of the cannabinoid CB 1 receptor. Br. J. Pharmacol. 2015, 172, 4790–4805. [Google Scholar] [CrossRef] [PubMed]
- Ryberg, E.; Larsson, N.; Sjögren, S.; Hjorth, S.; Hermansson, N.; Leonova, J.; et al. The orphan receptor GPR55 is a novel cannabinoid receptor. Br. J. Pharmacol. 2007, 152, 1092–1101. [Google Scholar] [CrossRef] [PubMed]
- Russo, E.B.; Burnett, A.; Hall, B.; Parker, K.K. Agonistic properties of cannabidiol at 5-HT1a receptors. Neurochem Res. 2005, 30, 1037–1043. [Google Scholar] [CrossRef] [PubMed]
- O’Sullivan, S.E.; Sun, Y.; Bennett, A.J.; Randall, M.D.; Kendall, D.A. Time-dependent vascular actions of cannabidiol in the rat aorta. Eur. J. Pharmacol. 2009, 612, 61–68. [Google Scholar] [CrossRef] [PubMed]
- Khaliullina, H.; Bilgin, M.; Sampaio, J.L.; Shevchenko, A.; Eaton, S. Endocannabinoids are conserved inhibitors of the Hedgehog pathway. Proc. Natl. Acad. Sci. 2015, 112, 3415–3420. [Google Scholar] [CrossRef] [PubMed]
- Abyadeh, M.; Gupta, V.; Liu, X.; Rossio, V.; Mirzaei, M.; Cornish, J.; et al. Proteome-Wide Profiling Using Sample Multiplexing of a Human Cell Line Treated with Cannabidiol (CBD) and Tetrahydrocannabinol (THC). Proteomes 2023, 11, 36. [Google Scholar] [CrossRef] [PubMed]
- Nguyen, L.C.; Yang, D.; Nicolaescu, V.; Best, T.J.; Gula, H.; Saxena, D.; et al. Cannabidiol inhibits SARS-CoV-2 replication through induction of the host ER stress and innate immune responses. Sci. Adv. 2022, 8. [Google Scholar] [CrossRef] [PubMed]
- Tomer, S.; Mu, W.; Suryawanshi, G.; Ng, H.; Wang, L.; Wennerberg, W.; et al. Cannabidiol modulates expression of type I IFN response genes and HIV infection in macrophages. Front Immunol. 2022, 13, 1–13. [Google Scholar] [CrossRef] [PubMed]
- de la Harpe, A.; Beukes, N.; Frost, C.L. CBD activation of TRPV1 induces oxidative signaling and subsequent ER stress in breast cancer cell lines. Biotechnol. Appl. Biochem. 2022, 69, 420–430. [Google Scholar] [CrossRef] [PubMed]
- Dash, R.; Ali, MdC; Jahan, I.; Munni, Y.A.; Mitra, S.; Hannan, MdA; et al. Emerging potential of cannabidiol in reversing proteinopathies. Ageing Res. Rev. 2021, 65, 101209. [Google Scholar] [CrossRef] [PubMed]
- Kowalczuk, A.; Marycz, K.; Kornicka-Garbowska, K.; Kornicka, J.; Bujalska-Zadrożny, M.; Groborz, S. Cannabidiol (CBD) Protects Adipose-Derived Mesenchymal Stem Cells (ASCs) against Endoplasmic Reticulum Stress Development and Its Complications. Int. J. Environ. Res. Public Health 2022, 19, 10864. [Google Scholar] [CrossRef] [PubMed]
- Daemen, S.; Kutmon, M.; Evelo, C.T. A pathway approach to investigate the function and regulation of SREBPs. Genes Nutr. 2013, 8, 289–300. [Google Scholar] [CrossRef] [PubMed]
- Shrivastava, A.; Kuzontkoski, P.M.; Groopman, J.E.; Prasad, A. Cannabidiol Induces Programmed Cell Death in Breast Cancer Cells by Coordinating the Cross-talk between Apoptosis and Autophagy. Mol. Cancer Ther. 2011, 10, 1161–1172. [Google Scholar] [CrossRef] [PubMed]
- Blevins, L.K.; Bach, A.P.; Crawford, R.B.; Zhou, J.; Henriquez, J.E.; Rizzo, M.D.; et al. Evaluation of the anti-inflammatory effects of selected cannabinoids and terpenes from Cannabis Sativa employing human primary leukocytes. Food Chem. Toxicol. 2022, 170, 113458. [Google Scholar] [CrossRef] [PubMed]
- Lee, C.-Y.; Wey, S.-P.; Liao, M.-H.; Hsu, W.-L.; Wu, H.-Y.; Jan, T.-R. A comparative study on cannabidiol-induced apoptosis in murine thymocytes and EL-4 thymoma cells. Int. Immunopharmacol. 2008, 8, 732–740. [Google Scholar] [CrossRef] [PubMed]
- Wu, H.-Y.; Chang, A.-C.; Wang, C.-C.; Kuo, F.-H.; Lee, C.-Y.; Liu, D.-Z.; et al. Cannabidiol induced a contrasting pro-apoptotic effect between freshly isolated and precultured human monocytes. Toxicol. Appl. Pharmacol. 2010, 246, 141–147. [Google Scholar] [CrossRef] [PubMed]
- Wu, H.-Y.; Huang, C.-H.; Lin, Y.-H.; Wang, C.-C.; Jan, T.-R. Cannabidiol induced apoptosis in human monocytes through mitochondrial permeability transition pore-mediated ROS production. Free Radic. Biol. Med. 2018, 124, 311–318. [Google Scholar] [CrossRef] [PubMed]
- Pénzes, Z.; Alimohammadi, S.; Horváth, D.; Oláh, A.; Tóth, B.I.; Bácsi, A.; et al. The dual role of cannabidiol on monocyte-derived dendritic cell differentiation and maturation. Front Immunol. 2023, 14, 1–15. [Google Scholar] [CrossRef] [PubMed]
- Casares, L.; García, V.; Garrido-Rodríguez, M.; Millán, E.; Collado, J.A.; García-Martín, A.; et al. Cannabidiol induces antioxidant pathways in keratinocytes by targeting BACH1. Redox Biol. 2020, 28, 101321. [Google Scholar] [CrossRef] [PubMed]
- Kim, N.Y.; Mohan, C.D.; Sethi, G.; Ahn, K.S. Cannabidiol activates MAPK pathway to induce apoptosis, paraptosis, and autophagy in colorectal cancer cells. J. Cell Biochem. 2024, 125. [Google Scholar] [CrossRef] [PubMed]
- Juknat, A.; Pietr, M.; Kozela, E.; Rimmerman, N.; Levy, R.; Gao, F.; et al. Microarray and Pathway Analysis Reveal Distinct Mechanisms Underlying Cannabinoid-Mediated Modulation of LPS-Induced Activation of BV-2 Microglial Cells. PLoS ONE 2013, 8, e61462. [Google Scholar] [CrossRef] [PubMed]
- Mangal, N.; Reebye, V.; Habib, N.; Sodergren, M.H. Cannabidiol’s cytotoxicity in pancreatic cancer is induced via an upregulation of ceramide synthase 1 and ER stress. J. Cannabis Res. 2024, 6, 22. [Google Scholar] [CrossRef] [PubMed]
- Almogi-Hazan, O.; Or, R. Cannabis, the Endocannabinoid System and Immunity—the Journey from the Bedside to the Bench and Back. Int. J. Mol. Sci. 2020, 21, 4448. [Google Scholar] [CrossRef] [PubMed]
- Chiurchiù, V.; Lanuti, M.; Catanzaro, G.; Fezza, F.; Rapino, C.; Maccarrone, M. Detailed characterization of the endocannabinoid system in human macrophages and foam cells, and anti-inflammatory role of type-2 cannabinoid receptor. Atherosclerosis 2014, 233, 55–63. [Google Scholar] [CrossRef] [PubMed]
- Ruhl, T.; Corsten, C.; Beier, J.P.; Kim, B.S. The immunosuppressive effect of the endocannabinoid system on the inflammatory phenotypes of macrophages and mesenchymal stromal cells: a comparative study. Pharmacol. Rep. 2021, 73, 143–153. [Google Scholar] [CrossRef] [PubMed]
- Guard, S.E.; Chapnick, D.A.; Poss, Z.C.; Ebmeier, C.C.; Jacobsen, J.; Nemkov, T.; et al. Multiomic Analysis Reveals Disruption of Cholesterol Homeostasis by Cannabidiol in Human Cell Lines. Mol. Cell. Proteom. 2022, 21, 100262. [Google Scholar] [CrossRef] [PubMed]
Disclaimer/Publisher’s Note: The statements, opinions and data contained in all publications are solely those of the individual author(s) and contributor(s) and not of MDPI and/or the editor(s). MDPI and/or the editor(s) disclaim responsibility for any injury to people or property resulting from any ideas, methods, instructions or products referred to in the content. |
© 2026 by the authors. Licensee MDPI, Basel, Switzerland. This article is an open access article distributed under the terms and conditions of the Creative Commons Attribution (CC BY) license (http://creativecommons.org/licenses/by/4.0/).
Copyright: This open access article is published under a Creative Commons CC BY 4.0 license, which permit the free download, distribution, and reuse, provided that the author and preprint are cited in any reuse.