

Submitted:
02 September 2026
Posted:
02 September 2026
You are already at the latest version
Abstract
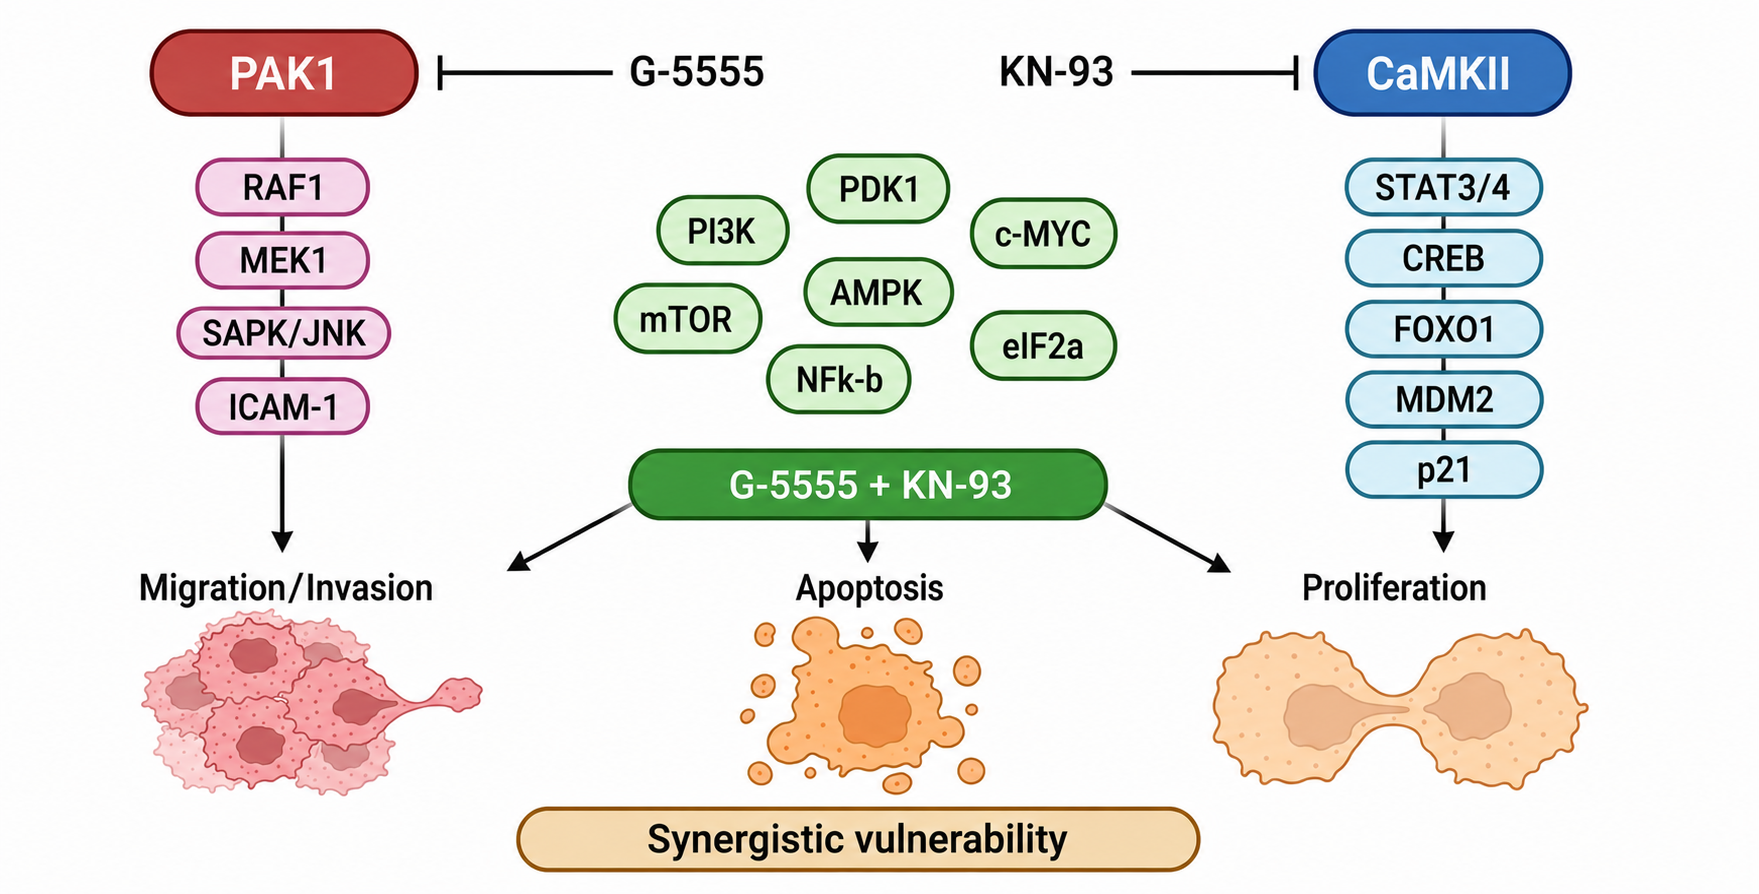
Background. Glioblastoma is a highly aggressive brain tumor characterized by rapid proliferation, diffuse invasion, and resistance to therapy. Although p21-activated kinase 1 (PAK1) and calcium/calmodulin-dependent protein kinase II (CaMKII) have each been independently implicated in malignant signaling, the biological consequences of their simultaneous pharmacological inhibition in glioblastoma remain poorly understood. Methods. U251, U87, and T98G glioblastoma cells lines were used to characterize basal PAK1 and CaMKII expression and activation by Western blotting and immunofluorescence. Public transcriptomic datasets were analyzed to assess the prognostic associations of PAK1 and CAMK2A expression and their transcriptional correlation in glioblastoma. Cells were treated with the group I PAK inhibitor G-5555 and the CaMKII inhibitor KN-93, either alone or in combination. Drug interactions were evaluated using the ZIP, Loewe, Bliss, and HSA reference models. Functional effects were assessed by cell viability and growth kinetics, cell-cycle analysis, caspase-3 cleavage, clonogenic assays, Transwell migration, wound healing assays, and MMP2/MMP9 expression. Exploratory phos-pho-signaling profiling was performed in U251 cells. Results. Higher PAK1 and CAMK2A expression was associated with poorer survival, and their transcript levels were positively correlated in glioblastoma samples (r = 0.54, p = 0.0001). Total and phosphorylated PAK1 and CaMKII were detected across all three cell lines, with heterogeneous basal abundance and activation patterns. Combined G-5555 and KN-93 treatment consistently enhanced growth inhibition relative to either single agent. Drug-interaction estimates varied across reference models, with the strongest positive interactions observed using HSA (mean synergy scores: 12.07, U251; 13.91, U87; and 14.25, T98G). Dual inhibition also suppressed cell expansion and clonogenicity, altered cell-cycle progression, increased caspase-3 cleavage, and impaired migration and invasion-associated phenotypes, accompanied by reduced MMP2 and MMP9 expression. Exploratory phospho-signaling profiling further revealed broad alterations in signaling networks associated with proliferation, survival, migration, cellular stress, and apoptosis. Conclusions. Combined pharmacological inhibition of PAK1 and CaMKII produces cooperative anti-tumor effects across multiple glioblastoma cell models despite inter-cell-line heterogeneity. These findings identify PAK1 and CaMKII signaling as potentially co-targetable vulnerabilities and provide a rationale for further mechanistic and in vivo evaluation of this combination.
Keywords:
glioblastoma
; PAK1
; CaMKII
; combination therapy
; migration
; apoptosis
; targeted therapy
1. Introduction
Glioblastoma is the most aggressive adult-type diffuse glioma and remains one of the most lethal primary brain tumors despite significant advances in neuro-oncology. Under the current World Health Organization (WHO) classification of central nervous system tumors, glioblastoma is defined as an IDH-wildtype adult diffuse glioma characterized by specific histopathological and/or molecular features [1]. Maximal safe surgical resection followed by radiotherapy and temozolomide remains the standard first-line treatment; however, the prognosis remains poor, with median overall survival generally limited to approximately 12–15 months [2,3,4]. Therapeutic failure is driven by multiple biological features, including extensive intratumoral heterogeneity, diffuse infiltration into the surrounding brain parenchyma, cellular plasticity, and the rapid emergence of treatment resistance [3,4].
Among these features, diffuse invasion represents a major therapeutic challenge because glioblastoma cells infiltrate the surrounding brain parenchyma beyond the macroscopically identifiable tumor margin, thus limiting complete surgical resection and contributing to recurrence [5]. This invasive behavior requires dynamic cytoskeletal remodeling, interactions with the extracellular matrix, and coordinated signaling programs that regulate cell adhesion, motility, and extracellular matrix degradation [5,6]. In parallel, the marked molecular heterogeneity of glioblastoma enables the coexistence and compensatory activation of multiple signaling pathways, which frequently limit the efficacy of therapies directed against individual signaling nodes [7,8]. Indeed, distinct receptor tyrosine kinase dependencies can coexist within individual glioblastomas, and simultaneous pathway inhibition may be required to effectively suppress downstream oncogenic signaling [7]. These observations provide a rationale for identifying co-targetable kinase dependencies capable of simultaneously disrupting proliferative and invasive programs in glioblastoma.
p21-activated kinase 1 (PAK1) is a serine/threonine kinase and a well-characterized downstream effector of the Rho-family GTPases Rac1 and Cdc42, with established roles in actin cytoskeletal remodeling, cell-cycle regulation, survival, migration, and invasion [9,10]. Dysregulated PAK1 signaling has been implicated in tumor progression across multiple malignancies, including glioma, where PAK1 inhibition suppresses proliferation, migration, and invasion while promoting cell-cycle arrest and apoptosis [10,11]. Calcium/calmodulin-dependent protein kinase II (CaMKII) has also emerged as a critical regulator of malignant phenotypes in glioblastoma. CaMKII activity has been implicated in glioma cell migration and invasion, whereas specific CaMKII isoforms contribute to glioblastoma cell proliferation and the maintenance of stem-like phenotypes [12,13,14].
Importantly, previous work from our group identified a functional connection between PAK1 and CaMKII in breast cancer, demonstrating that PAK1 interacts with and phosphorylates CaMKII and that pharmacological inhibition or depletion of PAK1 reduces CaMKII activity [15]. In that setting, combined pharmacological inhibition of PAK1 and CaMKII produced synergistic antitumor effects, enhancing apoptosis while suppressing proliferation, migration, invasion, and tumor growth [15]. These findings raise the possibility that functional convergence between PAK1- and CaMKII-dependent signaling may represent a broader cancer vulnerability. However, whether simultaneous targeting of these kinases produces cooperative antitumor effects in glioblastoma remains unknown.
Based on the previously identified functional interaction between PAK1 and CaMKII in breast cancer and the involvement of both kinases in signaling processes relevant to glioblastoma progression, we hypothesized that simultaneous pharmacological inhibition of PAK1 and CaMKII would produce greater antitumor effects than targeting either kinase alone. In the present study, we first examined the expression and activation of PAK1 and CaMKII in glioblastoma models and explored their clinical and transcriptional associations using publicly available datasets. We then evaluated the effects of combined PAK1 and CaMKII inhibition with G-5555 and KN-93, respectively, on cell proliferation, cell-cycle progression, apoptosis, clonogenicity, migration, and invasion-associated phenotypes in U251, U87, and T98G glioblastoma cells. Finally, we performed exploratory phospho-signaling profiling to characterize the broader signaling alterations associated with dual kinase inhibition.
2. Materials and Methods
2.1. Public Glioblastoma Dataset and Bioinformatic Analysis
We interrogated publicly available transcriptomic and survival data using The Human Protein Atlas and cBioPortal for Cancer Genomics. The Human Protein Atlas cancer survival module was used for exploratory survival analyses of PAK family members (PAK1–PAK6) and CaMKII-encoding genes (CAMK2A, CAMK2B, CAMK2D, and CAMK2G). Patients were stratified according to the expression cutoff defined by the platform, and survival differences were evaluated using the log-rank test. PAK1 and CAMK2A were subsequently prioritized for further analysis based on their exploratory survival associations and their relevance to the study hypothesis, which was informed by the previously described functional relationship between PAK1 and CaMKII signaling. The association between PAK1 and CAMK2A mRNA expression was evaluated using the TCGA Glioblastoma Multiforme PanCancer Atlas cohort available through cBioPortal. Correlation between transcript levels was assessed using Pearson’s correlation coefficient.
2.2. Cell Culture
Human glioblastoma cell lines U251, U87 and T98G were obtained from ATCC (Manassas, VA, USA). Cells were cultured in Dulbecco’s Modified Eagle Medium High Glucose (DMEM; Gibco, Thermo Fisher Scientific, Waltham, MA, USA) supplemented with 10% fetal bovine serum (FBS; Gibco, Thermo Fisher Scientific, Waltham, MA, USA) and 1% antibiotic–antimycotic solution (Gibco, Thermo Fisher Scientific, Waltham, MA, USA). Cells were maintained at 37 °C in a humidified incubator containing 5% CO2 atmosphere. All cell lines were routinely monitored by morphological inspection, tested for mycoplasma contamination, and maintained under sterile culture conditions throughout the experiments.
2.3. Western Blotting
U251, U87, and T98G glioblastoma cells were cultured until reaching approximately 80% confluence. Cells were washed with ice-cold phosphate-buffered saline (PBS) and lysed in RIPA buffer containing 20 mM Tris-HCl (pH 7.4), 150 mM NaCl, 1 mM EDTA, 1% Triton X-100, 0.5% SDS, and 1% sodium deoxycholate, supplemented with a protease inhibitor cocktail (Sigma-Aldrich, St. Louis, MO, USA) and phosphatase inhibitors (PhosSTOP; Roche, Basel, Switzerland). Cell lysates were incubated on ice and clarified by centrifugation at 12,000 × g for 15 min at 4 °C. Protein concentrations were determined using the Lowry protein assay. Equal amounts of protein (30 μg) were separated by SDS-PAGE and transferred onto Immobilon-P polyvinylidene difluoride (PVDF) membranes (Millipore, Burlington, MA, USA). Membranes were blocked for 1 h at room temperature with either 5% nonfat dried milk or 1% bovine serum albumin (BSA) in Tris-buffered saline containing 0.1% Tween-20 (TBS-T), as appropriate for the antibody used. Membranes were incubated overnight at 4 °C with the following primary antibodies: anti-PAK1 (1:1000; Cat. No. 2602, Cell Signaling Technology, Danvers, MA, USA), anti-phospho-PAK1 (Ser199/204; 1:1000; Cat. No. 2601, Cell Signaling Technology), anti-CaMKII (1:3000; Cat. No. ab134041, Abcam, Cambridge, UK), anti-phospho-CaMKII (Thr287; 1:3000; Cat. No. 3361, Cell Signaling Technology), anti-cleaved caspase-3 (1:1000; Cat. No. AB3623, Millipore, Burlington, MA, USA), anti-caspase-3 (1:1000; Cat. No. 9662, Cell Signaling Technology), and anti-GAPDH (clone 6C5; 1:3000; Cat. No. sc-32233, Santa Cruz Biotechnology, Dallas, TX, USA). After washing with TBS-T, membranes were incubated with the appropriate horseradish peroxidase (HRP)-conjugated secondary antibodies for 1 h at room temperature. Protein bands were visualized using SuperSignal West Femto Maximum Sensitivity Substrate (Thermo Fisher Scientific, Waltham, MA, USA) according to the manufacturer’s instructions. Band intensities were quantified by densitometric analysis when indicated. GAPDH was used as a loading control, and phosphorylated protein levels were normalized to their corresponding total protein levels.
2.4. Immunofluorescence and Confocal Microscopy
U251, U87, and T98G glioblastoma cells were seeded at a density of 5 × 10³ cells per well onto sterile glass coverslips coated with poly-L-lysine (Sigma-Aldrich, St. Louis, MO, USA) and cultured overnight. Cells were fixed with 4% paraformaldehyde for 15 min at room temperature, permeabilized with 0.2% Triton X-100 for 10 min, and blocked with 5% BSA in PBS for 1 h at room temperature. Cells were subsequently incubated with primary antibodies against PAK1, phospho-PAK1 (Ser199/204), CaMKII, and phospho-CaMKII (Thr287), as described above. After washing with PBS, cells were incubated for 1 h in the dark with the appropriate Alexa Fluor 488- or Alexa Fluor 594-conjugated secondary antibodies (Thermo Fisher Scientific, Waltham, MA, USA). The actin cytoskeleton was visualized using Alexa Fluor 647-conjugated phalloidin, and nuclei were counterstained with 4′,6-diamidino-2-phenylindole (DAPI). Fluorescence images were acquired using a Leica TCS SP8x confocal laser-scanning microscope equipped with White Light Laser (WLL) and HyD detectors (Leica Microsystems, Wetzlar, Germany).
2.5. Cell Viability and Drug Synergy Assays
Cell viability was assessed using the MTT colorimetric assay (Chemicon®, Cat. No. CT01-5; Merck, Burlington, MA, USA) according to the manufacturer’s instructions. Briefly, U251, U87, and T98G glioblastoma cells were seeded at a density of approximately 2.5 × 10³ cells per well in flat-bottom 96-well plates and allowed to adhere overnight under standard culture conditions. Cells were subsequently treated with increasing concentrations of the group I PAK inhibitor G-5555 (MedChemExpress, Monmouth Junction, NJ, USA), the CaMKII inhibitor KN-93 (Sigma-Aldrich, St. Louis, MO, USA), either individually or in combination, or with vehicle (DMSO). Cells were exposed to the indicated treatments for 72–120 h according to the growth characteristics of each cell line, while ensuring that vehicle-treated cultures did not exceed approximately 80% confluence. Following treatment, MTT reagent was added to each well and cells were incubated at 37 °C to allow the formation of formazan crystals by metabolically active cells. Formazan was subsequently solubilized according to the manufacturer’s protocol, and absorbance was measured using a BioTek Epoch 2 microplate reader (BioTek Instruments, Winooski, VT, USA). Cell viability was expressed relative to vehicle-treated controls.
Half-maximal inhibitory concentration (IC₅₀) values were determined by nonlinear regression analysis using GraphPad Prism version 9 (GraphPad Software, San Diego, CA, USA). Drug interactions between G-5555 and KN-93 were evaluated using the SynergyFinder+ web application [16]. Synergy scores were calculated using four reference models: Zero Interaction Potency (ZIP), Loewe additivity, Bliss independence, and Highest Single Agent (HSA) [16,17,18]. Synergy scores >10 were considered indicative of synergistic interactions, scores between −10 and 10 were considered additive or indicative of no meaningful interaction, and scores <-10 were considered antagonistic. Because these reference models rely on different assumptions regarding drug interaction, concordance across models was considered when interpreting the overall interaction between G-5555 and KN-93 [18].
2.6. Cell Proliferation Assay by Trypan Blue Exclusion
U251, U87, and T98G glioblastoma cells were serum-starved for 24 h in serum-free DMEM prior to treatment. Subsequently, 5 × 10³ cells were seeded per well and treated with G-5555 or KN-93 at their respective cell line-specific IC₅₀ concentrations, either alone or in combination, or with vehicle (DMSO). Cells were cultured in DMEM supplemented with 10% FBS for 72 h, and treatment-containing medium was replaced every 24 h. Viable cell numbers were determined at 24, 48, and 72 h using the trypan blue exclusion assay. At each time point, cells were harvested by trypsinization, stained with 0.4% trypan blue solution (Thermo Fisher Scientific, Waltham, MA, USA), and counted using a hemocytometer under light microscopy. Only trypan blue-negative cells were considered viable and included in the analysis. Cell growth curves were generated from viable cell counts obtained at each time point.
2.7. Cell Cycle Analysis
U251, U87, and T98G glioblastoma cells were seeded at a density of 2 × 10⁵ cells per well in six-well culture plates and synchronized in G0 by serum deprivation for 48 h. Following synchronization, cells were treated with vehicle (DMSO), G-5555, KN-93, or the combination of both inhibitors at their respective cell line-specific IC₅₀ concentrations. Cell-cycle arrest was released by the addition of DMEM supplemented with 10% FBS, and cells were collected at the indicated time points after serum stimulation. Cells were washed with 1× PBS and fixed in 70% ethanol overnight at 4 °C. Fixed cells were subsequently washed twice with PBS and stained with Propidium Iodide/RNase Staining Buffer (BD Pharmingen, Franklin Lakes, NJ, USA) for 30 min at room temperature in the dark. DNA content was analyzed using an Attune NxT flow cytometer (Thermo Fisher Scientific, Waltham, MA, USA), and data were processed using FlowJo software version 10.6 (BD Biosciences, Ashland, OR, USA). For cell-cycle analysis, singlets were first selected using an FSC-A versus FSC-H plot. The cellular population was then selected using an FSC-A versus propidium iodide (PI) plot to exclude debris and non-cellular events. DNA-content histograms were subsequently generated based on PI fluorescence intensity, and the proportions of cells in the G0/G1, S, and G2/M phases were determined from the resulting distributions. At least 10,000 singlet events were included in the final cell-cycle analysis per sample.
2.8. Colony Formation Assay
The long-term clonogenic capacity of glioblastoma cells following pharmacological inhibition of PAK1 and CaMKII was evaluated using a colony formation assay. Briefly, U251, U87, and T98G cells were seeded at a density of 500 cells per well in six-well culture plates and allowed to adhere overnight. Cells were subsequently treated with vehicle (DMSO), G-5555, KN-93, or the combination of both inhibitors at their respective cell line-specific IC₅₀ concentrations. Treatment-containing culture medium was replaced every 2–3 days throughout the experiment. After 14 days, cells were washed with PBS, fixed with 70% methanol, and stained with 0.2% crystal violet. Plates were imaged using a flatbed scanner, and colonies containing more than 50 cells were manually identified and counted from the acquired images using ImageJ software (National Institutes of Health, Bethesda, MD, USA). Colony formation was expressed relative to vehicle-treated controls.
2.9. Transwell Migration Assay
Cell migration was evaluated using 8-μm pore-size Transwell chambers (BD Biosciences, Franklin Lakes, NJ, USA). Briefly, U251, U87, and T98G glioblastoma cells were treated with G-5555 or KN-93 at their respective cell line-specific IC₅₀ concentrations, either alone or in combination, or with vehicle (DMSO). A total of 2.5 × 10⁴ cells per insert were seeded into the upper chamber in serum-free medium. The lower chamber contained complete culture medium supplemented with 10% FBS and the corresponding inhibitor treatments. Cells were incubated for 24 h at 37 °C in a humidified atmosphere containing 5% CO₂. Non-migrated cells remaining on the upper surface of the membrane were removed using cotton swabs. Cells that migrated to the lower surface were fixed with 70% methanol for 15 min and stained with 0.2% crystal violet for 15 min. Migrated cells were imaged using a Leica DM IL LED inverted microscope (Leica Microsystems, Wetzlar, Germany) and quantified by counting three randomly selected microscopic fields per insert.
2.10. Wound Healing Assay
Cell migration was additionally evaluated using a wound-healing assay. U251, U87, and T98G glioblastoma cells were seeded in six-well culture plates and grown to form a confluent monolayer. Cells were treated with mitomycin C (10 μg/mL) to minimize the contribution of cell proliferation to wound closure and with G-5555 or KN-93 at their respective cell line-specific IC₅₀ concentrations, either alone or in combination, or with vehicle (DMSO). Linear wounds were generated using a sterile 200-μL pipette tip, and detached cells were removed by washing with PBS. Cells were subsequently maintained in medium containing the corresponding treatments, and wound closure was monitored at 0 and 24 h using a Leica DM IL LED inverted microscope (Leica Microsystems, Wetzlar, Germany). Wound closure was quantified from the acquired images using ImageJ software (National Institutes of Health, Bethesda, MD, USA).
2.11. Reverse Transcription Quantitative PCR (RT–qPCR)
Total RNA was extracted from U251, U87, and T98G glioblastoma cells treated with vehicle (DMSO), G-5555, KN-93, or the combination treatment using TRIzol™ Reagent (Thermo Fisher Scientific, Waltham, MA, USA), according to the manufacturer’s instructions. RNA concentration and purity were determined using a BioTek Epoch microplate spectrophotometer (BioTek Instruments, Winooski, VT, USA). Complementary DNA (cDNA) was synthesized using the High-Capacity cDNA Reverse Transcription Kit (Applied Biosystems, Foster City, CA, USA). Quantitative PCR reactions were performed in a final volume of 20 μL using FastStart Universal SYBR Green Master Mix with ROX (Roche Diagnostics, Basel, Switzerland) on an ABI 7500 Real-Time PCR System (Applied Biosystems). The primer sequences used were as follows: MMP2, forward 5′-TCTTCAAGGACCGGTTCATTTG-3′ and reverse 5′-GAGCTCCAGATAAACGGGGCT-3′; MMP9, forward 5′-GTGGACGATGCCTGCAACGT-3′ and reverse 5′-GCCGCTCCTCAAAGACCGAG-3′; and GAPDH, forward 5′-CCCCGGTTTCTATAAATTGAGC-3′ and reverse 5′-CACCTTCCCCATGGTGTCT-3′. Thermal cycling conditions consisted of an initial denaturation step at 95 °C for 10 min, followed by 40 cycles of 95 °C for 15 s and 60 °C for 60 s. Melt-curve analysis was performed to verify amplification specificity. Relative gene expression levels were calculated using the −ΔΔCt method, with GAPDH used as the endogenous reference gene and vehicle-treated cells as the calibrator. All reactions were performed in technical triplicate.
2.12. Phospho-Specific Protein Microarray Analysis
Phospho-specific protein profiling was performed using the Cancer Signaling Phospho Antibody Array (Cat. No. PCS248; Full Moon BioSystems, Sunnyvale, CA, USA) according to the manufacturer’s instructions. This array contains 269 site-specific and phospho-specific antibodies targeting proteins involved in multiple cancer-related signaling pathways. Briefly, 100 μg of total protein from vehicle-, G-5555-, KN-93-, or combination-treated cells was subjected to biotin labeling using the reagents provided by the manufacturer. Biotin-labeled proteins were subsequently diluted in coupling solution and applied to the antibody microarray. Prior to sample hybridization, microarray slides were blocked for 30 min at room temperature, washed with Milli-Q water, and dried under compressed nitrogen. Arrays were incubated overnight at 4 °C with the biotin-labeled protein samples. Following hybridization, arrays were washed according to the manufacturer’s protocol, and bound proteins were detected using Cy3-conjugated streptavidin. Microarray processing was performed at the Microarray Unit of the Institute of Cellular Physiology, Universidad Nacional Autónoma de México (UNAM), Mexico City, Mexico. Fluorescence signals were acquired using a ScanArray 4000 Microarray Scanner and extracted using ScanArray 4000 software (Packard BioChip Technologies, Billerica, MA, USA). Signal intensities were subsequently processed using R statistical software (R Foundation for Statistical Computing, Vienna, Austria). Data normalization and fold-change calculations were performed relative to vehicle-treated controls. Heatmaps and phosphorylation-pattern analyses were generated using the ggplot2, pheatmap, and ComplexHeatmap R packages. Phosphorylation profiles were comparatively analyzed among vehicle-, G-5555-, KN-93-, and combination-treated cells.
2.13. Statistical Analysis
All experiments were independently performed at least three times, unless otherwise indicated, and data are presented as mean ± standard deviation (SD). Statistical analyses were performed using GraphPad Prism version 9.0 (GraphPad Software, San Diego, CA, USA) and R statistical software (R Foundation for Statistical Computing, Vienna, Austria). Comparisons among multiple groups were performed using one-way or two-way ANOVA, as appropriate, followed by Tukey’s multiple-comparisons test. Comparisons between two groups were performed using an unpaired two-tailed Student’s t-test. Survival differences were evaluated using the log-rank test, and correlations between PAK1 and CAMK2A expression were assessed using Pearson’s correlation coefficient. Drug interaction analyses were performed using SynergyFinder+ as described above. A two-sided p value < 0.05 was considered statistically significant.
3. Results
3.1. PAK1 and CAMK2A Expression Is Associated with Poor Prognosis and Positively Correlated in Glioblastoma
To assess the clinical relevance of PAK1 and CAMK2A expression in glioblastoma, publicly available transcriptomic and survival datasets were analyzed. Kaplan–Meier analysis using The Human Protein Atlas showed that high PAK1 expression was associated with significantly poorer survival compared with low PAK1 expression (log-rank p = 0.00043; Figure 1A). Similarly, high CAMK2A expression was associated with reduced survival probability (log-rank p = 0.027; Figure 1B). We next examined the relationship between PAK1 and CAMK2A mRNA expression using the TCGA Glioblastoma Multiforme PanCancer Atlas cohort available through cBioPortal. PAK1 and CAMK2A expression levels showed a significant positive correlation (Pearson r = 0.54, p = 0.0001; Figure 1C). Together, these analyses indicate that elevated expression of both kinases is associated with unfavorable prognosis and that their transcript levels are positively correlated in glioblastoma.
3.2. PAK1 and CaMKII Are Expressed and Basally Activated in Glioblastoma Cell Lines
To determine whether PAK1 and CaMKII signaling is present and basally active in glioblastoma models, total and phosphorylated protein levels were evaluated in U251, U87, and T98G cells by Western blotting and immunofluorescence. Western blot analysis demonstrated expression of total PAK1 and CaMKII in all three cell lines (Figure 1D). Phosphorylated PAK1 and phosphorylated CaMKII were also detected in U251, U87, and T98G cells, indicating basal activation of both kinases under standard culture conditions. Immunofluorescence analysis further confirmed the expression of PAK1 and CaMKII in all three glioblastoma cell lines (Figure 1E). Both proteins showed predominantly cytoplasmic localization, with overlapping intracellular distribution in merged images. Phalloidin staining delineated the actin cytoskeleton, whereas DAPI identified cell nuclei. The phosphorylated forms of PAK1 and CaMKII were likewise detectable by immunofluorescence in U251, U87, and T98G cells (Figure 1F), with heterogeneous staining patterns among the three models. Together, these findings confirm that PAK1 and CaMKII are expressed and basally phosphorylated in the glioblastoma cell lines used for subsequent pharmacological studies.
3.3. Combined PAK1 and CaMKII Inhibition Produces Cooperative Anti-Proliferative Effects in Glioblastoma Cells
To evaluate the pharmacological interaction between PAK1 and CaMKII inhibition, U251, U87, and T98G glioblastoma cells were exposed to increasing concentrations of G-5555 and KN-93, either alone or in combination. Dose–response matrices showed substantial inhibition of cell viability across all three cell lines, with mean inhibition values of 48.18% in U251, 48.85% in U87, and 49.27% in T98G cells (Figure 2A–C). Drug-interaction analysis revealed model-dependent differences among the four reference frameworks. In U251 cells, mean synergy scores were 0.74, 8.93, −0.14, and 12.07 for ZIP, Loewe, Bliss, and HSA, respectively. Corresponding scores were 0.38, 6.08, −0.11, and 13.91 in U87 cells and 1.65, 4.39, 1.31, and 14.25 in T98G cells. Thus, ZIP, Loewe, and Bliss scores remained within the additive or non-interactive range, whereas HSA scores exceeded the predefined synergy threshold of 10 in all three cell lines. These findings indicate that the interaction between G-5555 and KN-93 depends on the reference model applied, while consistently demonstrating enhanced inhibitory activity of the combination relative to the most effective single agent under the HSA model.
3.4. Combined PAK1 and CaMKII Inhibition Suppresses Cell Growth, Alters Cell-Cycle Progression, and Promotes Apoptotic Signaling
To further characterize the biological effects of combined PAK1 and CaMKII inhibition, cell growth was monitored over 72 h by trypan blue exclusion. Vehicle-treated U251, U87, and T98G cells showed progressive increases in viable cell number, whereas treatment with G-5555 or KN-93 attenuated cell expansion to varying degrees (Figure 3A). Combined treatment produced the strongest growth-suppressive effect across all three cell lines, which became particularly evident after 48 h and persisted through 72 h. Cell-cycle analysis further revealed treatment- and cell line-dependent alterations in cell-cycle progression (Figure 3B). At baseline, no major differences were observed among treatment groups. Following treatment, combined PAK1/CaMKII inhibition produced marked redistribution of cells across the G0/G1, S, and G2/M phases, with the most pronounced changes observed in U87 and T98G cells at 24 and 48 h. These findings indicate that the growth-suppressive effect of dual inhibition is accompanied by disruption of cell-cycle progression, although the specific pattern differed among glioblastoma models. To determine whether growth suppression was accompanied by apoptotic signaling, caspase-3 activation was evaluated by Western blotting (Figure 3C). Cleaved caspase-3 increased following combined G-5555/KN-93 treatment in all three cell lines, with the strongest response observed in U251 and T98G cells. Densitometric analysis confirmed increased cleaved caspase-3 levels following combination treatment compared with vehicle and, in U251 and T98G cells, with either single-agent treatment. KN-93 alone also increased caspase-3 activation in U251 and T98G cells, whereas the response to the individual inhibitors was more modest in U87 cells. Finally, long-term clonogenic capacity was markedly reduced by PAK1 and CaMKII inhibition (Figure 3D). Both G-5555 and KN-93 decreased colony formation relative to vehicle-treated cells, whereas combined treatment produced the greatest reduction across U251, U87, and T98G cells. Together, these findings show that combined PAK1/CaMKII inhibition suppresses both short-term cell expansion and long-term clonogenic capacity and is accompanied by alterations in cell-cycle progression and enhanced apoptotic signaling.
3.5. Combined PAK1 and CaMKII Inhibition Suppresses Glioblastoma Cell Migration and MMP2/MMP9 Expression
To determine whether PAK1 and CaMKII inhibition affects the migratory phenotype of glioblastoma cells, Transwell and wound-healing assays were performed in U251, U87, and T98G cells. In the Transwell assay, treatment with either G-5555 or KN-93 reduced cell migration relative to vehicle-treated controls, whereas combined treatment produced the greatest reduction in migrated cells across all three cell lines (Figure 4A). The inhibitory effect of the combination was particularly pronounced in U251 and T98G cells. Consistent with these findings, wound-healing assays showed reduced wound closure following pharmacological inhibition of PAK1 and CaMKII (Figure 4B). After 24 h, both single-agent treatments decreased wound closure to varying degrees, whereas combined G-5555/KN-93 treatment produced the lowest wound closure in all three cell lines. The reduction induced by the combination was most pronounced in T98G cells, with U87 and U251 cells also showing significant inhibition relative to vehicle-treated controls. Together, the Transwell and wound-healing assays show that simultaneous PAK1 and CaMKII inhibition markedly impairs glioblastoma cell migration. To examine whether these phenotypic changes were accompanied by alterations in genes associated with extracellular matrix remodeling and tumor invasion, MMP2 and MMP9 mRNA expression was evaluated by RT–qPCR (Figure 4C). Treatment-dependent reductions in MMP2 and MMP9 expression were observed across the three cell lines, although the magnitude of the response varied among cellular models. Combined inhibition produced a marked reduction in both transcripts in U251 and U87 cells. In T98G cells, the strongest transcriptional response was observed for MMP9, whereas changes in MMP2 were comparatively modest. These findings indicate that the reduced migratory phenotype following PAK1/CaMKII inhibition is accompanied by decreased expression of invasion-associated matrix metalloproteinases in a cell line-dependent manner.
3.6. Dual PAK1/CaMKII Inhibition Induces Broad Phospho-Signaling Changes in U251 Cells
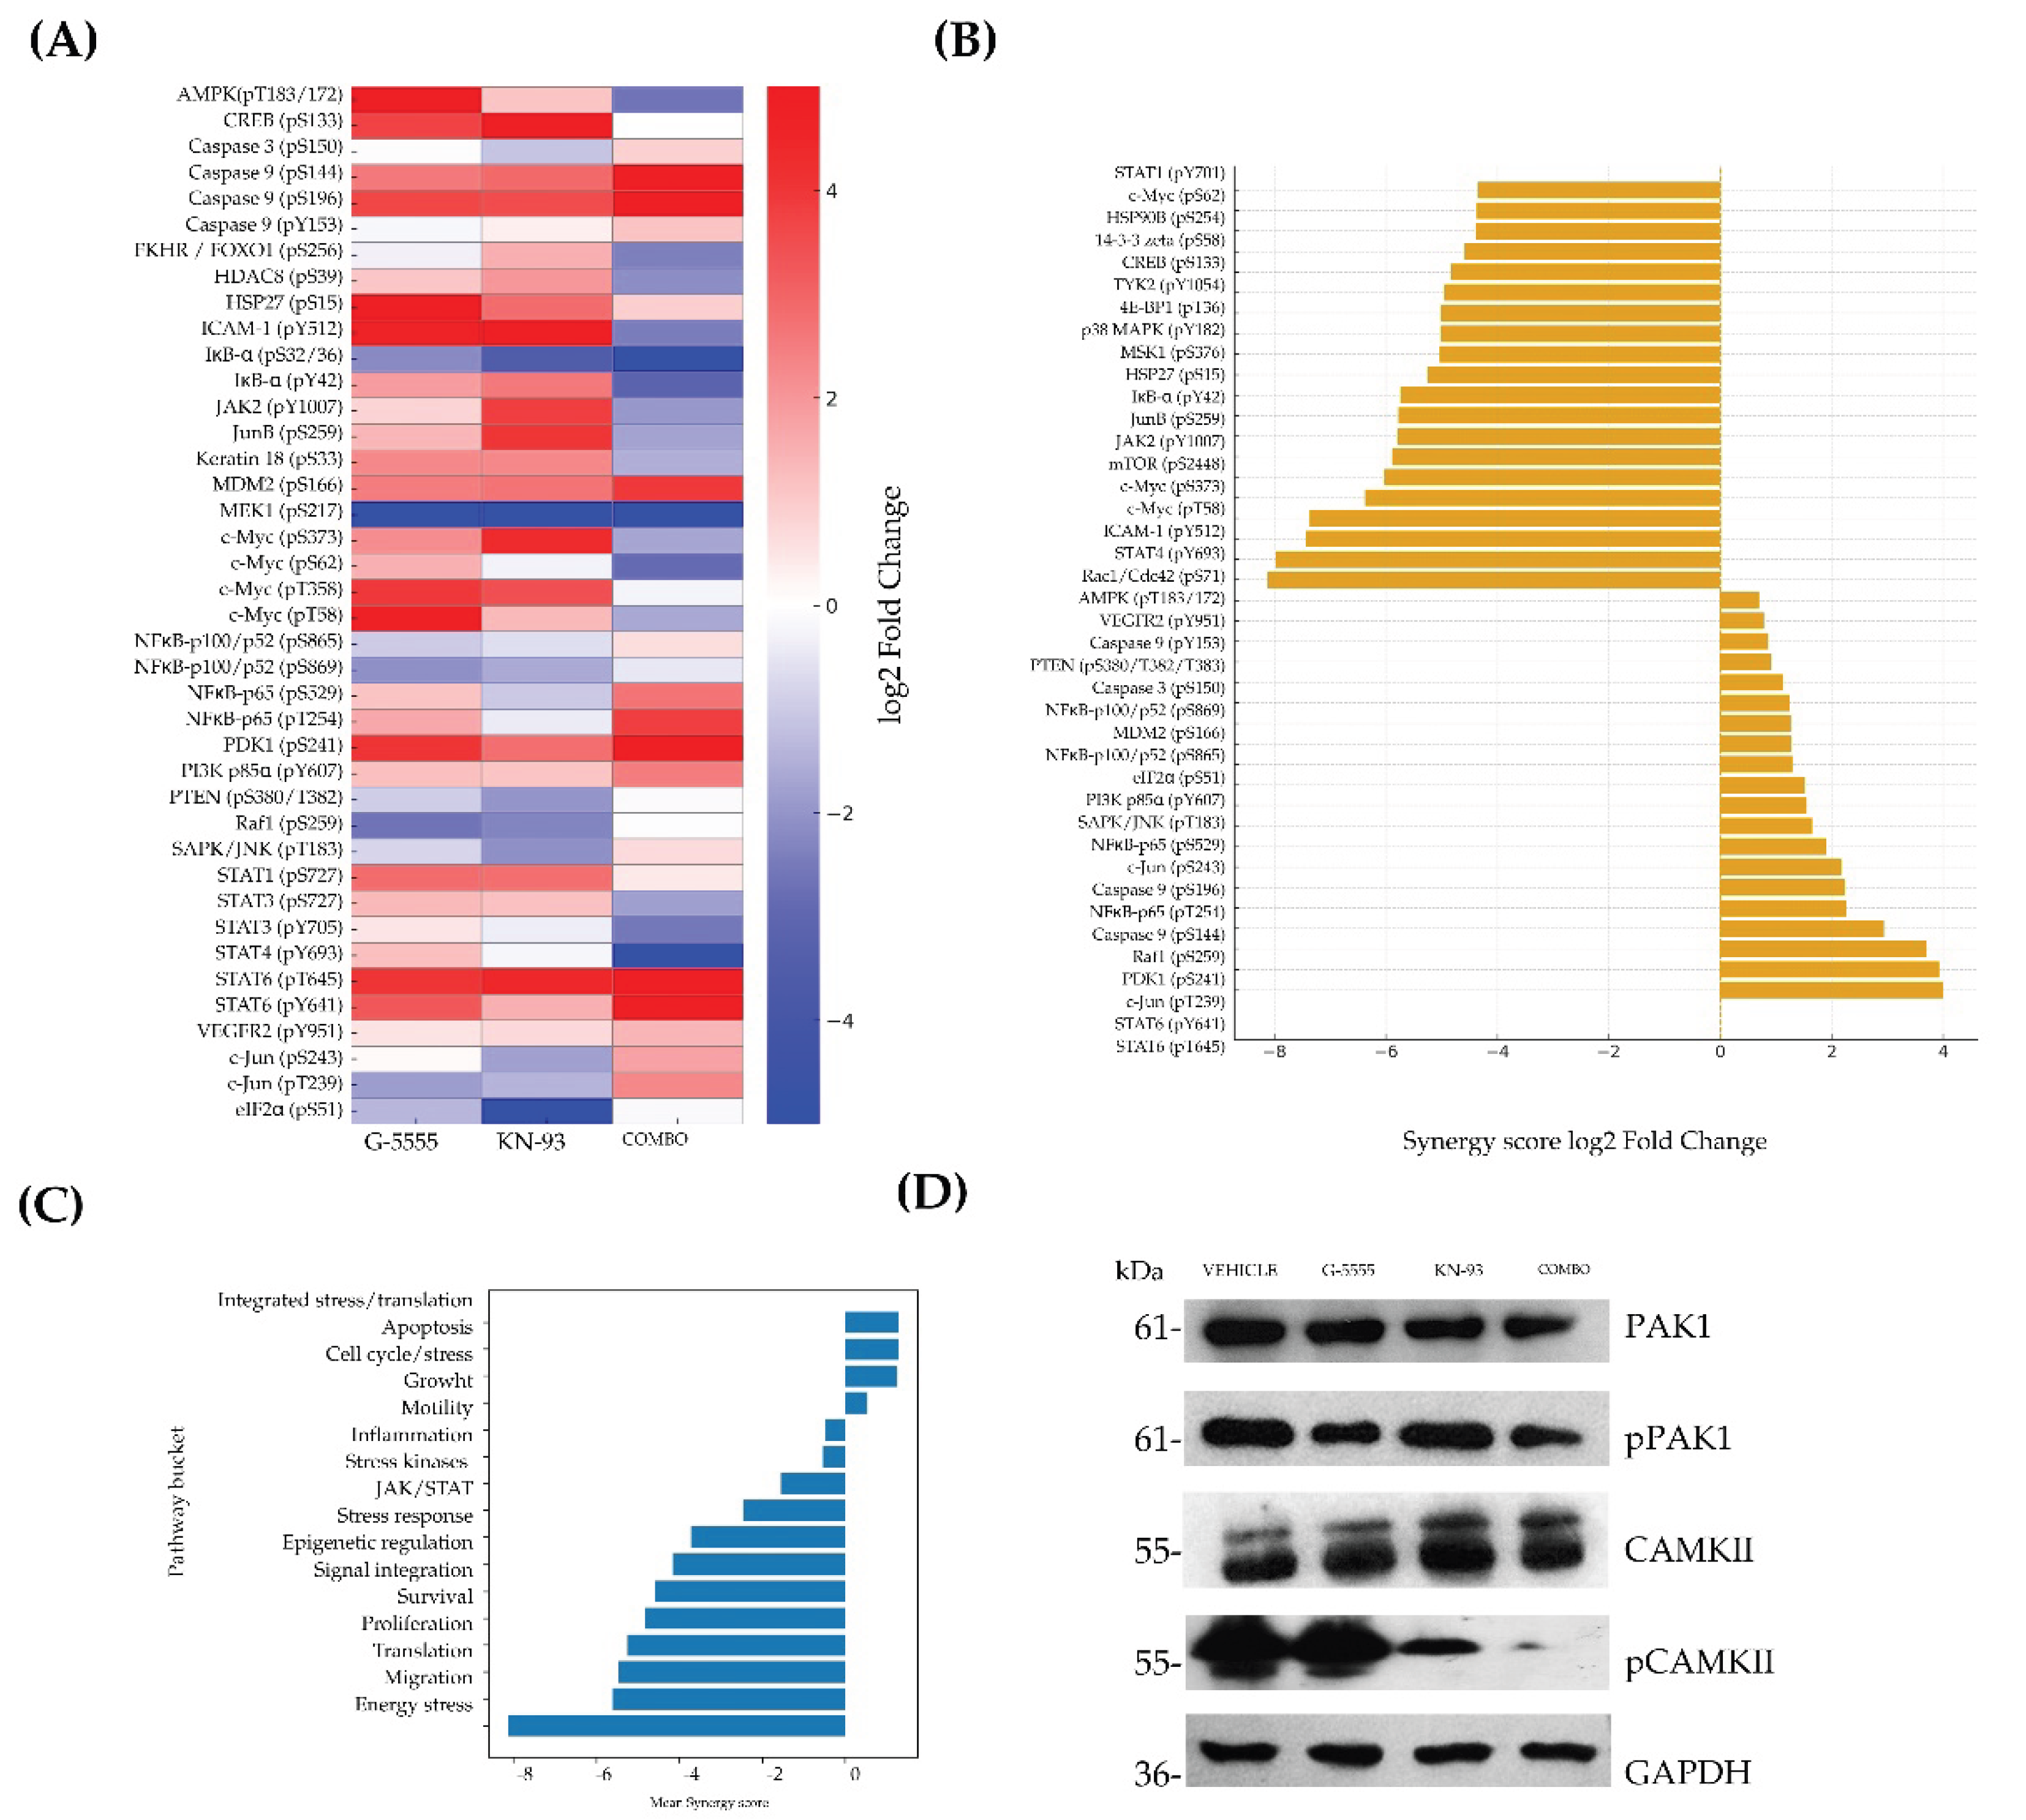
To explore the signaling changes associated with combined PAK1 and CaMKII inhibition, phospho-specific antibody array profiling was performed in U251 glioblastoma cells following treatment with G-5555, KN-93, or their combination (Figure 5A–C). The resulting phosphorylation profiles revealed broad treatment-dependent changes across multiple signaling proteins, with the combination producing a pattern distinct from those observed with either inhibitor alone (Figure 5A). Comparison of the combination treatment with vehicle-treated cells identified prominent decreases in phosphorylation across several signaling proteins, including STAT1, c-Myc, HSP90β, 14-3-3ζ, CREB, TYK2, p38 MAPK, MSK1, HSP27, IκB-α, JunB, JAK2, mTOR, STAT4, and Rac1, among others (Figure 5B). Conversely, increased phosphorylation was observed for a smaller subset of proteins, including STAT6, c-Jun, PDK1, Raf1, caspase-9, and SAPK/JNK. These findings indicate that combined PAK1/CaMKII inhibition is associated with extensive changes in signaling nodes involved in proliferation, survival, stress responses, inflammatory signaling, and apoptosis. Pathway-level grouping further showed that the predominant changes associated with combination treatment occurred in signaling categories related to energy stress, migration, translation, proliferation, survival, and signal integration (Figure 5C). Finally, Western blot analysis confirmed reduced phosphorylation of PAK1 and CaMKII following pharmacological inhibition, with the combination producing a marked reduction in the phosphorylated forms of both kinases while total protein levels remained comparatively preserved (Figure 5D). Together, these findings show that combined PAK1/CaMKII inhibition is associated with broad alterations in phospho-signaling and effective suppression of the targeted kinases in U251 glioblastoma cells.
4. Discussion
Glioblastoma remains exceptionally difficult to treat because its malignant phenotype is sustained by extensive cellular heterogeneity, diffuse infiltration, and signaling plasticity. These characteristics can limit the efficacy of therapies directed against individual signaling nodes. Indeed, distinct receptor tyrosine kinase-dependent populations can coexist within the same glioblastoma, and simultaneous inhibition of more than one signaling pathway may be required to effectively suppress downstream signaling in heterogeneous tumor populations [7]. In this context, the present study identifies PAK1 and CaMKII as co-targetable signaling components in glioblastoma cells. Combined pharmacological inhibition with G-5555 and KN-93 consistently produced greater biological effects than either inhibitor alone across complementary assays of cell growth, clonogenicity, migration, cell-cycle progression, and apoptotic signaling. Importantly, however, pharmacological interaction was dependent on the mathematical reference model, with synergy consistently identified by HSA but not by ZIP, Loewe, or Bliss. Thus, our findings support a cooperative rather than universally synergistic interaction between PAK1 and CaMKII inhibition.
The clinical and molecular observations provide a rationale for examining this combination. Higher PAK1 and CAMK2A expression was associated with poorer survival, and expression of the two genes was positively correlated in glioblastoma datasets. Previous clinical analyses have reported increased PAK1 expression and activation in gliomas and have associated PAK1 signaling with aggressive tumor phenotypes and proliferation [19]. These observations are consistent with our detection of total and phosphorylated PAK1 in all three glioblastoma cell lines. However, the correlation between PAK1 and CAMK2A expression should not by itself be interpreted as evidence of a functional interaction. Rather, it provided a clinically relevant observation that, together with our previous mechanistic findings in another tumor context, motivated functional evaluation of simultaneous pathway inhibition.
PAK1 has previously been implicated directly in glioma proliferation, migration, invasion, cell-cycle regulation, and apoptosis. Yi et al. reported that PAK1 inhibition reduced glioma cell proliferation, migration, and invasion, induced G1 arrest and apoptosis, decreased MMP2 and MMP9, and increased cleaved caspase-3; PAK1 silencing also reduced tumor formation in an orthotopic U87 model [11]. Similarly, pharmacological disruption of Rac1, an upstream regulator of PAK1, was previously shown to reduce PAK1 signaling and impair proliferation, migration, invasion, and actin cytoskeletal dynamics in malignant glioma cells [20]. Our findings closely parallel these observations: G-5555 reduced cell expansion, clonogenicity, and migration, while affecting MMP2/MMP9 expression and apoptotic signaling. The present results therefore independently reinforce the importance of PAK signaling in glioma biology, while extending previous work by evaluating PAK inhibition in combination with a second kinase pathway rather than as an isolated target.
There is also substantial biological precedent for targeting CaMKII in glioblastoma. CaMKII has been mechanistically linked to glioma invasion through regulation of the chloride channel ClC-3. Cuddapah et al. demonstrated that CaMKII phosphorylates and regulates ClC-3 in malignant glioma cells and that CaMKII inhibition reduces glioma invasion, providing a direct connection between calcium-dependent signaling, cell-volume regulation, and glioma motility [12]. More recently, CaMKII has emerged as a potential vulnerability in glioblastoma stem-like cells. Pharmacological suppression of CaMKII phosphorylation and genetic depletion of CaMKIIγ reduced proliferation, neurosphere formation, migration, invasion, and stemness-associated signaling in U87MG-derived glioblastoma stem-like cells [13]. These observations are consistent with the reduced migration and growth observed after KN-93 treatment in our models and suggest that CaMKII contributes to several malignant phenotypes beyond its canonical neuronal functions.
Particularly relevant to the present study is evidence that CaMKII can function as a therapeutically exploitable partner in combination treatments. Han et al. identified a synthetic-lethal interaction between CaMKII and NK1R inhibition in glioblastoma stem-like cells. Combined treatment markedly reduced viability and neurosphere formation, enhanced caspase-mediated apoptosis, suppressed PI3K/AKT/NF-κB signaling, and reduced tumor growth in a chorioallantoic membrane model. Importantly, the interaction was also reproduced using genetic depletion of CaMKIIγ, providing evidence beyond pharmacological inhibition alone [21]. Our findings are conceptually consistent with that study but identify a different potential partner for CaMKII: PAK1-associated signaling. Together, these observations support the broader concept that CaMKII may represent a particularly relevant node for combination-based therapeutic strategies in glioblastoma.
The rationale for examining PAK1 and CaMKII together is further strengthened by our previous demonstration of a direct functional relationship between these kinases in breast cancer. In that study, PAK1 interacted with and phosphorylated CaMKII, PAK1 inhibition or depletion reduced CaMKII activity, and combined pharmacological inhibition of PAK and CaMKII impaired proliferation, migration, invasion, and tumor growth [15]. The present study does not establish that the same direct biochemical interaction occurs in glioblastoma and should therefore not be interpreted as demonstrating a linear PAK1/CaMKII pathway in this tumor type. Nevertheless, the detection of basal phosphorylation of both kinases, their correlated transcript expression, and the enhanced phenotypic effects observed upon simultaneous inhibition raise the possibility that the functional relationship previously identified in breast cancer may extend to glioblastoma. Demonstrating this directly will require biochemical interaction studies and genetic perturbation of each kinase in glioblastoma models.
The effects on cell-cycle progression and caspase-3 activation provide additional context for the growth-suppressive phenotype. Previous PAK1 inhibition studies in glioma reported G1 arrest together with induction of apoptosis and increased cleaved caspase-3 [11]. CaMKII-targeted combination treatment in glioblastoma stem-like cells has likewise been associated with caspase-mediated apoptosis [21]. In our study, however, cell-cycle responses were heterogeneous across U251, U87, and T98G cells rather than conforming to a uniform arrest phenotype. This distinction is important because it suggests that the consequences of simultaneous PAK1/CaMKII inhibition depend on cellular context. Despite this heterogeneity, increased cleaved caspase-3 and marked suppression of clonogenic growth were consistently observed, indicating that disruption of these pathways compromises long-term cellular fitness across molecularly distinct glioblastoma models.
The migration experiments provide another point of convergence with previous studies. PAK1 inhibition has been shown to reduce glioma migration and invasion and to decrease MMP2 and MMP9 expression, whereas CaMKII inhibition can interfere with mechanisms required for glioma cell movement [11]. In the present study, G-5555 and KN-93 reduced migration in both Transwell and wound-healing assays, with combined treatment generally producing the strongest effect. These phenotypic changes were accompanied by reductions in MMP2 and MMP9 expression, although the magnitude differed among cell lines. Because our Transwell experiments did not incorporate an extracellular matrix barrier, these data specifically demonstrate impaired migration rather than direct inhibition of invasion. Nevertheless, the accompanying modulation of MMP2 and MMP9 supports an effect on molecular programs associated with extracellular matrix remodeling and invasive behavior. This distinction is particularly relevant in glioblastoma, where diffuse infiltration into surrounding brain tissue remains a major barrier to complete surgical eradication.
The phospho-specific antibody array further suggests that the biological effects of combined inhibition extend beyond isolated changes in PAK1 and CaMKII phosphorylation. Combination treatment was associated with broad alterations in signaling proteins related to JAK/STAT, MAPK, NF-κB, mTOR, stress-response, and apoptotic pathways. This observation is compatible with the increasingly recognized kinomic heterogeneity of glioblastoma. Analyses of human tumors have demonstrated substantial spatial variation in kinase activity, with distinct tumor regions exhibiting different signaling dependencies and therapeutic responses [22]. Likewise, coexisting receptor tyrosine kinase-dependent populations can require simultaneous pathway inhibition to suppress downstream signaling effectively [7]. Our array findings should therefore be interpreted as evidence of broad treatment-associated phospho-signaling changes rather than proof of collapse of any specific pathway. The accompanying reduction in phosphorylated PAK1 and CaMKII provides evidence of target engagement, whereas the broader array profile generates testable hypotheses regarding downstream signaling consequences of dual inhibition.
An important aspect of the present results is the apparent discrepancy among pharmacological interaction models. HSA scores exceeded the predefined synergy threshold in U251, U87, and T98G cells, whereas ZIP, Loewe, and Bliss scores remained within the additive or non-interactive range. This discrepancy is not necessarily contradictory because each model defines the expected effect of non-interacting drugs differently. Accordingly, the data do not support describing G-5555 and KN-93 as universally synergistic. Rather, the consistent enhancement observed across viability, cell counting, clonogenic, migration, and apoptotic readouts supports a robust cooperative biological effect, while formal synergy remains dependent on the reference framework used. This distinction is important for avoiding overinterpretation of drug-combination data and strengthens the rationale for validating the interaction through orthogonal genetic approaches.
Several limitations should be considered. First, the experiments were performed in established glioblastoma cell lines under two-dimensional culture conditions and therefore do not reproduce the cellular diversity, extracellular matrix, hypoxia, immune interactions, or blood–brain barrier constraints of human glioblastoma. Second, pharmacological inhibition cannot establish that all observed effects are specifically attributable to PAK1 and CaMKII. KN-93 in particular is widely used as a CaMKII inhibitor but pharmacological approaches should be complemented by genetic depletion or editing, while PAK-family selectivity should likewise be addressed experimentally. Third, although the study was motivated in part by our previous demonstration that PAK1 can directly regulate CaMKII, the present experiments do not establish a direct biochemical PAK1–CaMKII interaction in glioblastoma. Fourth, the phospho-antibody array provides targeted and exploratory signaling information rather than unbiased phosphoproteomic characterization. Finally, validation in patient-derived glioblastoma stem-like cells, organoids, and orthotopic models will be necessary before the translational relevance of combined PAK1/CaMKII targeting can be established.
Future studies should therefore determine whether genetic inhibition of PAK1 and specific CaMKII isoforms reproduces the pharmacological phenotype and whether PAK1 directly regulates CaMKII phosphorylation in glioblastoma. Given the established importance of CaMKII in glioblastoma stem-like cells, evaluation of the PAK1/CaMKII relationship in patient-derived GSC models is particularly warranted [21]. Testing the combination with temozolomide and radiotherapy, followed by evaluation in orthotopic models, would further establish whether this signaling vulnerability can be exploited within clinically relevant treatment contexts. Taken together, our findings identify simultaneous PAK1 and CaMKII inhibition as a promising experimental strategy that affects multiple malignant phenotypes in glioblastoma while providing a mechanistic framework for subsequent genetic and in vivo validation.
5. Conclusions
In conclusion, combined pharmacological inhibition of PAK1 and CaMKII suppresses multiple malignant phenotypes in glioblastoma cells, including cell growth, clonogenic capacity, and migration, while promoting apoptotic signaling and broad phospho-signaling changes. Although pharmacological synergy was dependent on the reference model applied, the consistent effects observed across three glioblastoma cell lines support PAK1 and CaMKII as potentially co-targetable signaling vulnerabilities. Further genetic validation and studies in patient-derived and in vivo models are warranted to establish the mechanistic and therapeutic relevance of this combined targeting strategy.
Author Contributions
Author Contributions: Conceptualization, H.I.S.-C., L.E.A.-R. and J.G.-M.; methodology, H.I.S.-C., A.M.G.-G., C.A.R.-C., R.X.S.-G., E.G.-Z., G.P.-L., J.E.O.-H., L.A.-L. and E.P.-Y.; software, H.I.S.-C.; validation, H.I.S.-C., A.M.G.-G., C.A.R.-C., R.X.S.-G. and E.G.-Z.; formal analysis, H.I.S.-C., A.M.G.-G., C.A.R.-C., R.X.S.-G. and E.G.-Z.; investigation, H.I.S.-C., A.M.G.-G., C.A.R.-C., R.X.S.-G., E.G.-Z., G.P.-L., J.E.O.-H., L.A.-L. and E.P.-Y.; resources, H.I.S.-C., L.E.A.-R. and J.G.-M.; data curation, H.I.S.-C., A.M.G.-G., C.A.R.-C., R.X.S.-G., E.G.-Z. and E.P.-Y.; writing—original draft preparation, H.I.S.-C.; writing—review and editing, H.I.S.-C., G.P.-L., J.E.O.-H., L.E.A.-R., L.A.-L., E.P.-Y., B.O.J.-J. and J.G.-M.; visualization, H.I.S.-C., G.P.-L., J.E.O.-H. and E.P.-Y.; supervision, H.I.S.-C. and J.G.-M.; project administration, H.I.S.-C.; funding acquisition, H.I.S.-C. All authors have read and agreed to the published version of the manuscript.
Funding
This research was funded by the Universidad Nacional Autónoma de México (UNAM), through grants PAPIIT IA201725 (H.I.S.-C.).
Institutional Review Board Statement
Not applicable.
Informed Consent Statement
Not applicable.
Data Availability Statement
We encourage all authors of articles published in MDPI journals to share their research data. In this section, please provide details regarding where data supporting reported results can be found, including links to publicly archived datasets analyzed or generated during the study. Where no new data were created, or where data is unavailable due to privacy or ethical restrictions, a statement is still required. Suggested Data Availability Statements are available in section “MDPI Research Data Policies” at https://www.mdpi.com/ethics.
Acknowledgments
During the preparation of this manuscript, the authors used ChatGPT (GPT-5.6 Sol; OpenAI) for language editing, improvement of clarity, and refinement of scientific writing. The authors reviewed and edited all AI-assisted output and take full responsibility for the content of this publication.
Conflicts of Interest
The authors declare no conflicts of interest.
Abbreviations
The following abbreviations are used in this manuscript:
| PAK1 | p21-activated kinase 1 |
| CaMKII | Calcium/calmodulin-dependent protein kinase II |
| CAMK2A | Calcium/calmodulin-dependent protein kinase II alpha |
| HSA | Highest Single Agent |
| ZIP | Zero Interaction Potency |
| MMP2 | Matrix metalloproteinase 2 |
| MMP9 | Matrix metalloproteinase 9 |
| GSC | Glioblastoma stem-like cell |
| NK1R | Neurokinin-1 receptor |
| BTK | Bruton’s tyrosine kinase |
References
- Louis, D.N.; Perry, A.; Wesseling, P.; Brat, D.J.; Cree, I.A.; Figarella-Branger, D.; Hawkins, C.; Ng, H.K.; Pfister, S.M.; Reifenberger, G.; et al. The 2021 WHO Classification of Tumors of the Central Nervous System: a summary. Neuro-Oncology 2021, 23, 1231–1251. [Google Scholar] [CrossRef] [PubMed]
- Weller, M.; van den Bent, M.; Preusser, M.; Le Rhun, E.; Tonn, J.C.; Minniti, G.; Bendszus, M.; Balana, C.; Chinot, O.; Dirven, L.; et al. EANO guidelines on the diagnosis and treatment of diffuse gliomas of adulthood. Nat. Rev. Clin. Oncol. 2021, 18, 170–186. [Google Scholar] [CrossRef] [PubMed]
- Stupp, R.; Mason, W.P.; van den Bent, M.J.; Weller, M.; Fisher, B.; Taphoorn, M.J.; Belanger, K.; Brandes, A.A.; Marosi, C.; Bogdahn, U.; et al. Radiotherapy plus concomitant and adjuvant temozolomide for glioblastoma. N Engl. J. Med. 2005, 352, 987–996. [Google Scholar] [CrossRef] [PubMed]
- Neftel, C.; Laffy, J.; Filbin, M.G.; Hara, T.; Shore, M.E.; Rahme, G.J.; Richman, A.R.; Silverbush, D.; Shaw, M.L.; Hebert, C.M.; et al. An Integrative Model of Cellular States, Plasticity, and Genetics for Glioblastoma. Cell 2019, 178, 835–849.e821. [Google Scholar] [CrossRef] [PubMed]
- Vollmann-Zwerenz, A.; Leidgens, V.; Feliciello, G.; Klein, C.A.; Hau, P. Tumor Cell Invasion in Glioblastoma. Int. J. Mol. Sci. 2020, 21. [Google Scholar] [CrossRef] [PubMed]
- So, J.S.; Kim, H.; Han, K.S. Mechanisms of Invasion in Glioblastoma: Extracellular Matrix, Ca(2+) Signaling, and Glutamate. Front Cell Neurosci. 2021, 15, 663092. [Google Scholar] [CrossRef] [PubMed]
- Szerlip, N.J.; Pedraza, A.; Chakravarty, D.; Azim, M.; McGuire, J.; Fang, Y.; Ozawa, T.; Holland, E.C.; Huse, J.T.; Jhanwar, S.; et al. Intratumoral heterogeneity of receptor tyrosine kinases EGFR and PDGFRA amplification in glioblastoma defines subpopulations with distinct growth factor response. Proc. Natl. Acad. Sci. U S A 2012, 109, 3041–3046. [Google Scholar] [CrossRef] [PubMed]
- Akgül, S.; Patch, A.M.; D’Souza, R.C.J.; Mukhopadhyay, P.; Nones, K.; Kempe, S.; Kazakoff, S.H.; Jeffree, R.L.; Stringer, B.W.; Pearson, J.V.; et al. Intratumoural Heterogeneity Underlies Distinct Therapy Responses and Treatment Resistance in Glioblastoma. Cancers 2019, 11. [Google Scholar] [CrossRef] [PubMed]
- Sells, M.A.; Knaus, U.G.; Bagrodia, S.; Ambrose, D.M.; Bokoch, G.M.; Chernoff, J. Human p21-activated kinase (Pak1) regulates actin organization in mammalian cells. Curr. Biol. 1997, 7, 202–210. [Google Scholar] [CrossRef] [PubMed]
- Radu, M.; Semenova, G.; Kosoff, R.; Chernoff, J. PAK signalling during the development and progression of cancer. Nat. Rev. Cancer 2014, 14, 13–25. [Google Scholar] [CrossRef] [PubMed]
- Yi, Q.; Chen, T.; Zhou, K.; Ma, Q.; Sun, Z.; Shi, H. PAK1 Inhibition Suppresses the Proliferation, Migration and Invasion of Glioma Cells. Curr. Protein Pept. Sci. 2023, 24, 178–189. [Google Scholar] [CrossRef] [PubMed]
- Cuddapah, V.A.; Sontheimer, H. Molecular interaction and functional regulation of ClC-3 by Ca2+/calmodulin-dependent protein kinase II (CaMKII) in human malignant glioma. J. Biol. Chem. 2010, 285, 11188–11196. [Google Scholar] [CrossRef] [PubMed]
- Shin, H.J.; Lee, S.; Jung, H.J. A curcumin derivative hydrazinobenzoylcurcumin suppresses stem-like features of glioblastoma cells by targeting Ca(2+) /calmodulin-dependent protein kinase II. J. Cell Biochem 2019, 120, 6741–6752. [Google Scholar] [CrossRef] [PubMed]
- Sim, K.M.; Lee, Y.S.; Kim, H.J.; Cho, C.H.; Yi, G.S.; Park, M.J.; Hwang, E.M.; Park, J.Y. Suppression of CaMKIIβ Inhibits ANO1-Mediated Glioblastoma Progression. Cells 2020, 9. [Google Scholar] [CrossRef] [PubMed]
- Saldivar-Cerón, H.I.; Villamar-Cruz, O.; Wells, C.M.; Oguz, I.; Spaggiari, F.; Chernoff, J.; Patiño-López, G.; Huerta-Yepez, S.; Montecillo-Aguado, M.; Rivera-Pazos, C.M.; et al. p21-Activated Kinase 1 Promotes Breast Tumorigenesis via Phosphorylation and Activation of the Calcium/Calmodulin-Dependent Protein Kinase II. Front Cell Dev. Biol. 2021, 9, 759259. [Google Scholar] [CrossRef] [PubMed]
- Zheng, S.; Wang, W.; Aldahdooh, J.; Malyutina, A.; Shadbahr, T.; Tanoli, Z.; Pessia, A.; Tang, J. SynergyFinder Plus: Toward Better Interpretation and Annotation of Drug Combination Screening Datasets. Genom. Proteom. Bioinform. 2022, 20, 587–596. [Google Scholar] [CrossRef] [PubMed]
- Yadav, B.; Wennerberg, K.; Aittokallio, T.; Tang, J. Searching for Drug Synergy in Complex Dose-Response Landscapes Using an Interaction Potency Model. Comput Struct. Biotechnol. J. 2015, 13, 504–513. [Google Scholar] [CrossRef] [PubMed]
- Tang, J.; Wennerberg, K.; Aittokallio, T. What is synergy? The Saariselkä agreement revisited. Front Pharmacol. 2015, 6, 181. [Google Scholar] [CrossRef] [PubMed]
- Venu, A.; Archana, B.; Kanumuri, R.; Vuttaradhi, V.K.; D’Cruze, L.; Murugan, S.; Ganesh, K.; Prathiba, D.; Dymova, M.A.; Rayala, S.K.; et al. Clinical Evaluation of P21 Activated Kinase 1 (PAK1) Activation in Gliomas and Its Effect on Cell Proliferation. Cancer Invest 2021, 39, 98–113. [Google Scholar] [CrossRef] [PubMed]
- Cardama, G.A.; Gonzalez, N.; Ciarlantini, M.; Gandolfi Donadío, L.; Comin, M.J.; Alonso, D.F.; Menna, P.L.; Gomez, D.E. Proapoptotic and antiinvasive activity of Rac1 small molecule inhibitors on malignant glioma cells. Onco Targets Ther. 2014, 7, 2021–2033. [Google Scholar] [CrossRef] [PubMed]
- Han, J.M.; Kim, Y.J.; Jung, H.J. Discovery of a New CaMKII-Targeted Synthetic Lethal Therapy against Glioblastoma Stem-like Cells. Cancers 2022, 14. [Google Scholar] [CrossRef] [PubMed]
- Ibrahim, A.N.; Yamashita, D.; Anderson, J.C.; Abdelrashid, M.; Alwakeal, A.; Estevez-Ordonez, D.; Komarova, S.; Markert, J.M.; Goidts, V.; Willey, C.D.; et al. Intratumoral spatial heterogeneity of BTK kinomic activity dictates distinct therapeutic response within a single glioblastoma tumor. J. Neurosurg. 2020, 133, 1683–1694. [Google Scholar] [CrossRef] [PubMed]
Figure 1.
Clinical relevance and basal phosphorylation of PAK1 and CaMKII in glioblastoma. (A,B) Kaplan–Meier survival analyses stratified by PAK1 (A) or CAMK2A (B) mRNA expression using data obtained from The Human Protein Atlas. High expression of PAK1 and CAMK2A was associated with poorer survival (log-rank p = 0.00043 and p = 0.027, respectively). (C) Pearson correlation analysis of PAK1 and CAMK2A mRNA expression in the TCGA Glioblastoma Multiforme PanCancer Atlas cohort, showing a positive correlation between both transcripts (Pearson r = 0.54, p = 0.0001). (D) Representative Western blot analysis of total PAK1, phospho-PAK1, total CaMKII, and phospho-CaMKII in U251, U87, and T98G cells. GAPDH was used as a loading control. (E) Representative immunofluorescence images showing total PAK1 and CaMKII expression. (F) Representative immunofluorescence images showing phosphorylated PAK1 and CaMKII. Phalloidin was used to visualize the actin cytoskeleton and DAPI to counterstain nuclei. Scale bars, 20 μm.
Figure 1.
Clinical relevance and basal phosphorylation of PAK1 and CaMKII in glioblastoma. (A,B) Kaplan–Meier survival analyses stratified by PAK1 (A) or CAMK2A (B) mRNA expression using data obtained from The Human Protein Atlas. High expression of PAK1 and CAMK2A was associated with poorer survival (log-rank p = 0.00043 and p = 0.027, respectively). (C) Pearson correlation analysis of PAK1 and CAMK2A mRNA expression in the TCGA Glioblastoma Multiforme PanCancer Atlas cohort, showing a positive correlation between both transcripts (Pearson r = 0.54, p = 0.0001). (D) Representative Western blot analysis of total PAK1, phospho-PAK1, total CaMKII, and phospho-CaMKII in U251, U87, and T98G cells. GAPDH was used as a loading control. (E) Representative immunofluorescence images showing total PAK1 and CaMKII expression. (F) Representative immunofluorescence images showing phosphorylated PAK1 and CaMKII. Phalloidin was used to visualize the actin cytoskeleton and DAPI to counterstain nuclei. Scale bars, 20 μm.
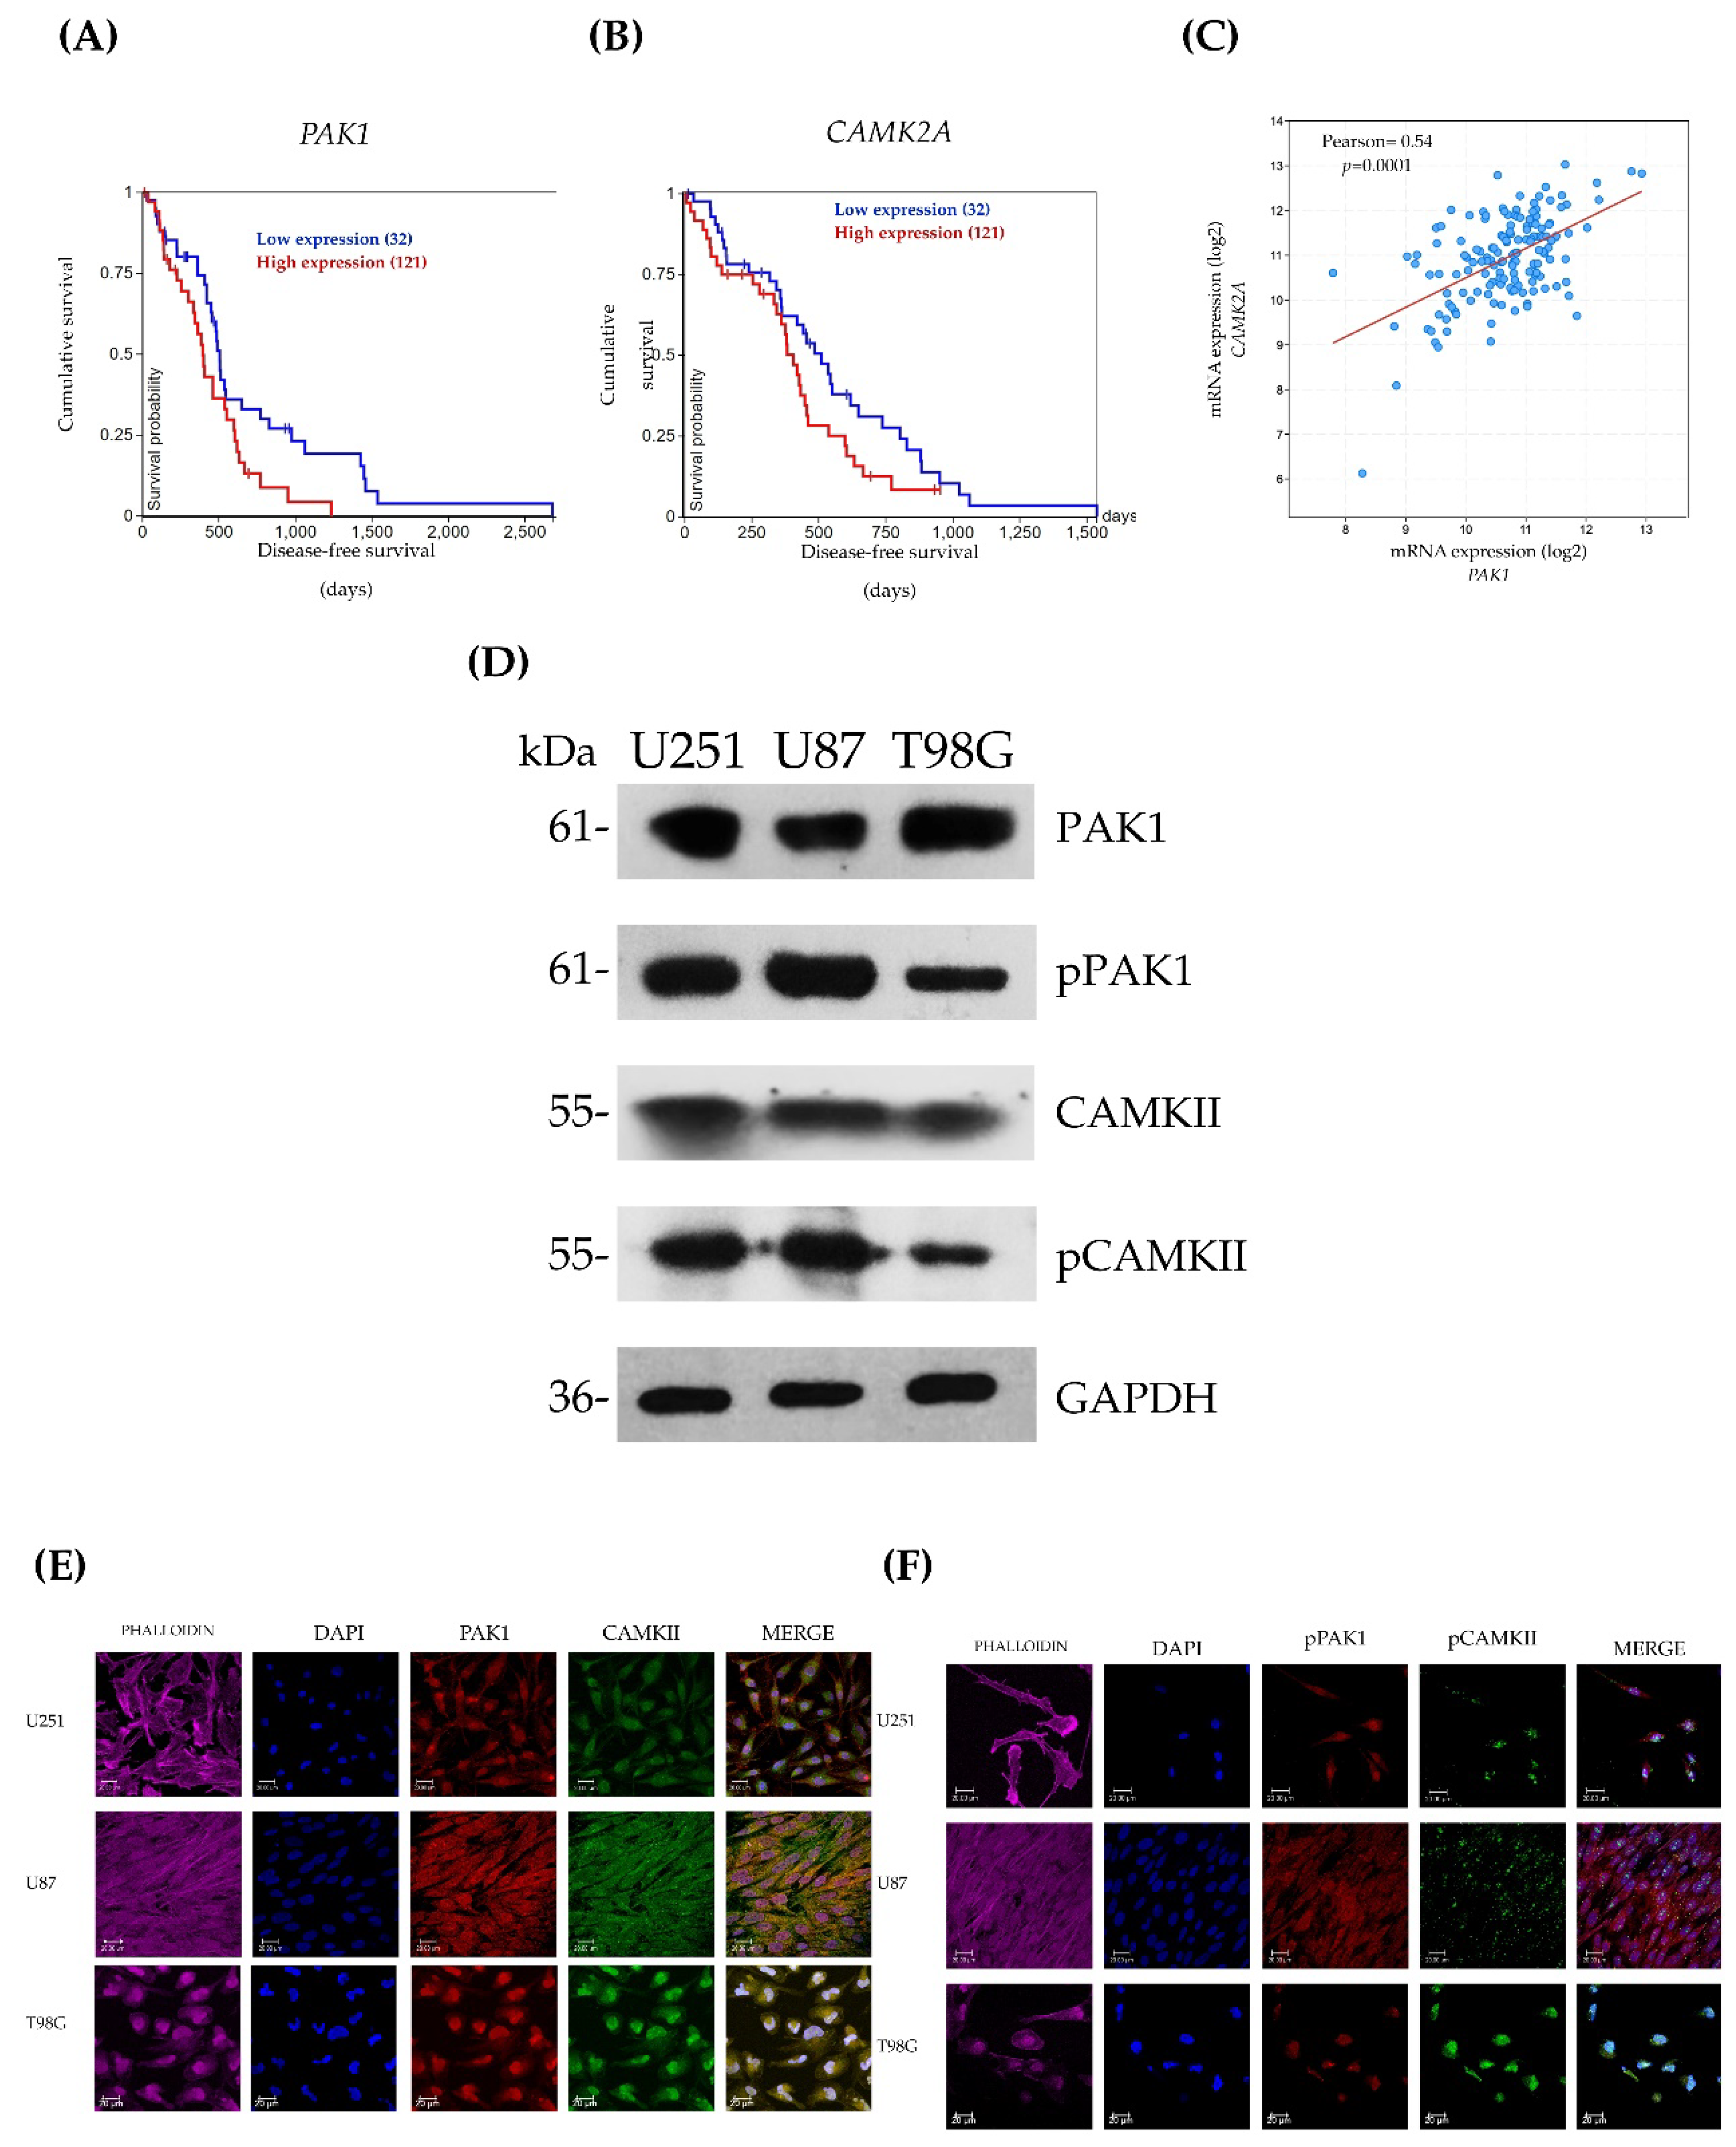
Figure 2.
Drug-interaction analysis of combined PAK1 and CaMKII inhibition in glioblastoma cells. Dose–response inhibition matrices and corresponding three-dimensional drug-interaction landscapes for G-5555 and KN-93 in U251 (A), U87 (B), and T98G (C) cells. Drug interactions were evaluated using the ZIP, Loewe, Bliss, and HSA reference models. Mean inhibition values and mean synergy scores are indicated for each cell line and reference model. Synergy scores >10 indicate synergy, scores between −10 and 10 indicate additive or no meaningful interaction, and scores <−10 indicate antagonism.
Figure 2.
Drug-interaction analysis of combined PAK1 and CaMKII inhibition in glioblastoma cells. Dose–response inhibition matrices and corresponding three-dimensional drug-interaction landscapes for G-5555 and KN-93 in U251 (A), U87 (B), and T98G (C) cells. Drug interactions were evaluated using the ZIP, Loewe, Bliss, and HSA reference models. Mean inhibition values and mean synergy scores are indicated for each cell line and reference model. Synergy scores >10 indicate synergy, scores between −10 and 10 indicate additive or no meaningful interaction, and scores <−10 indicate antagonism.
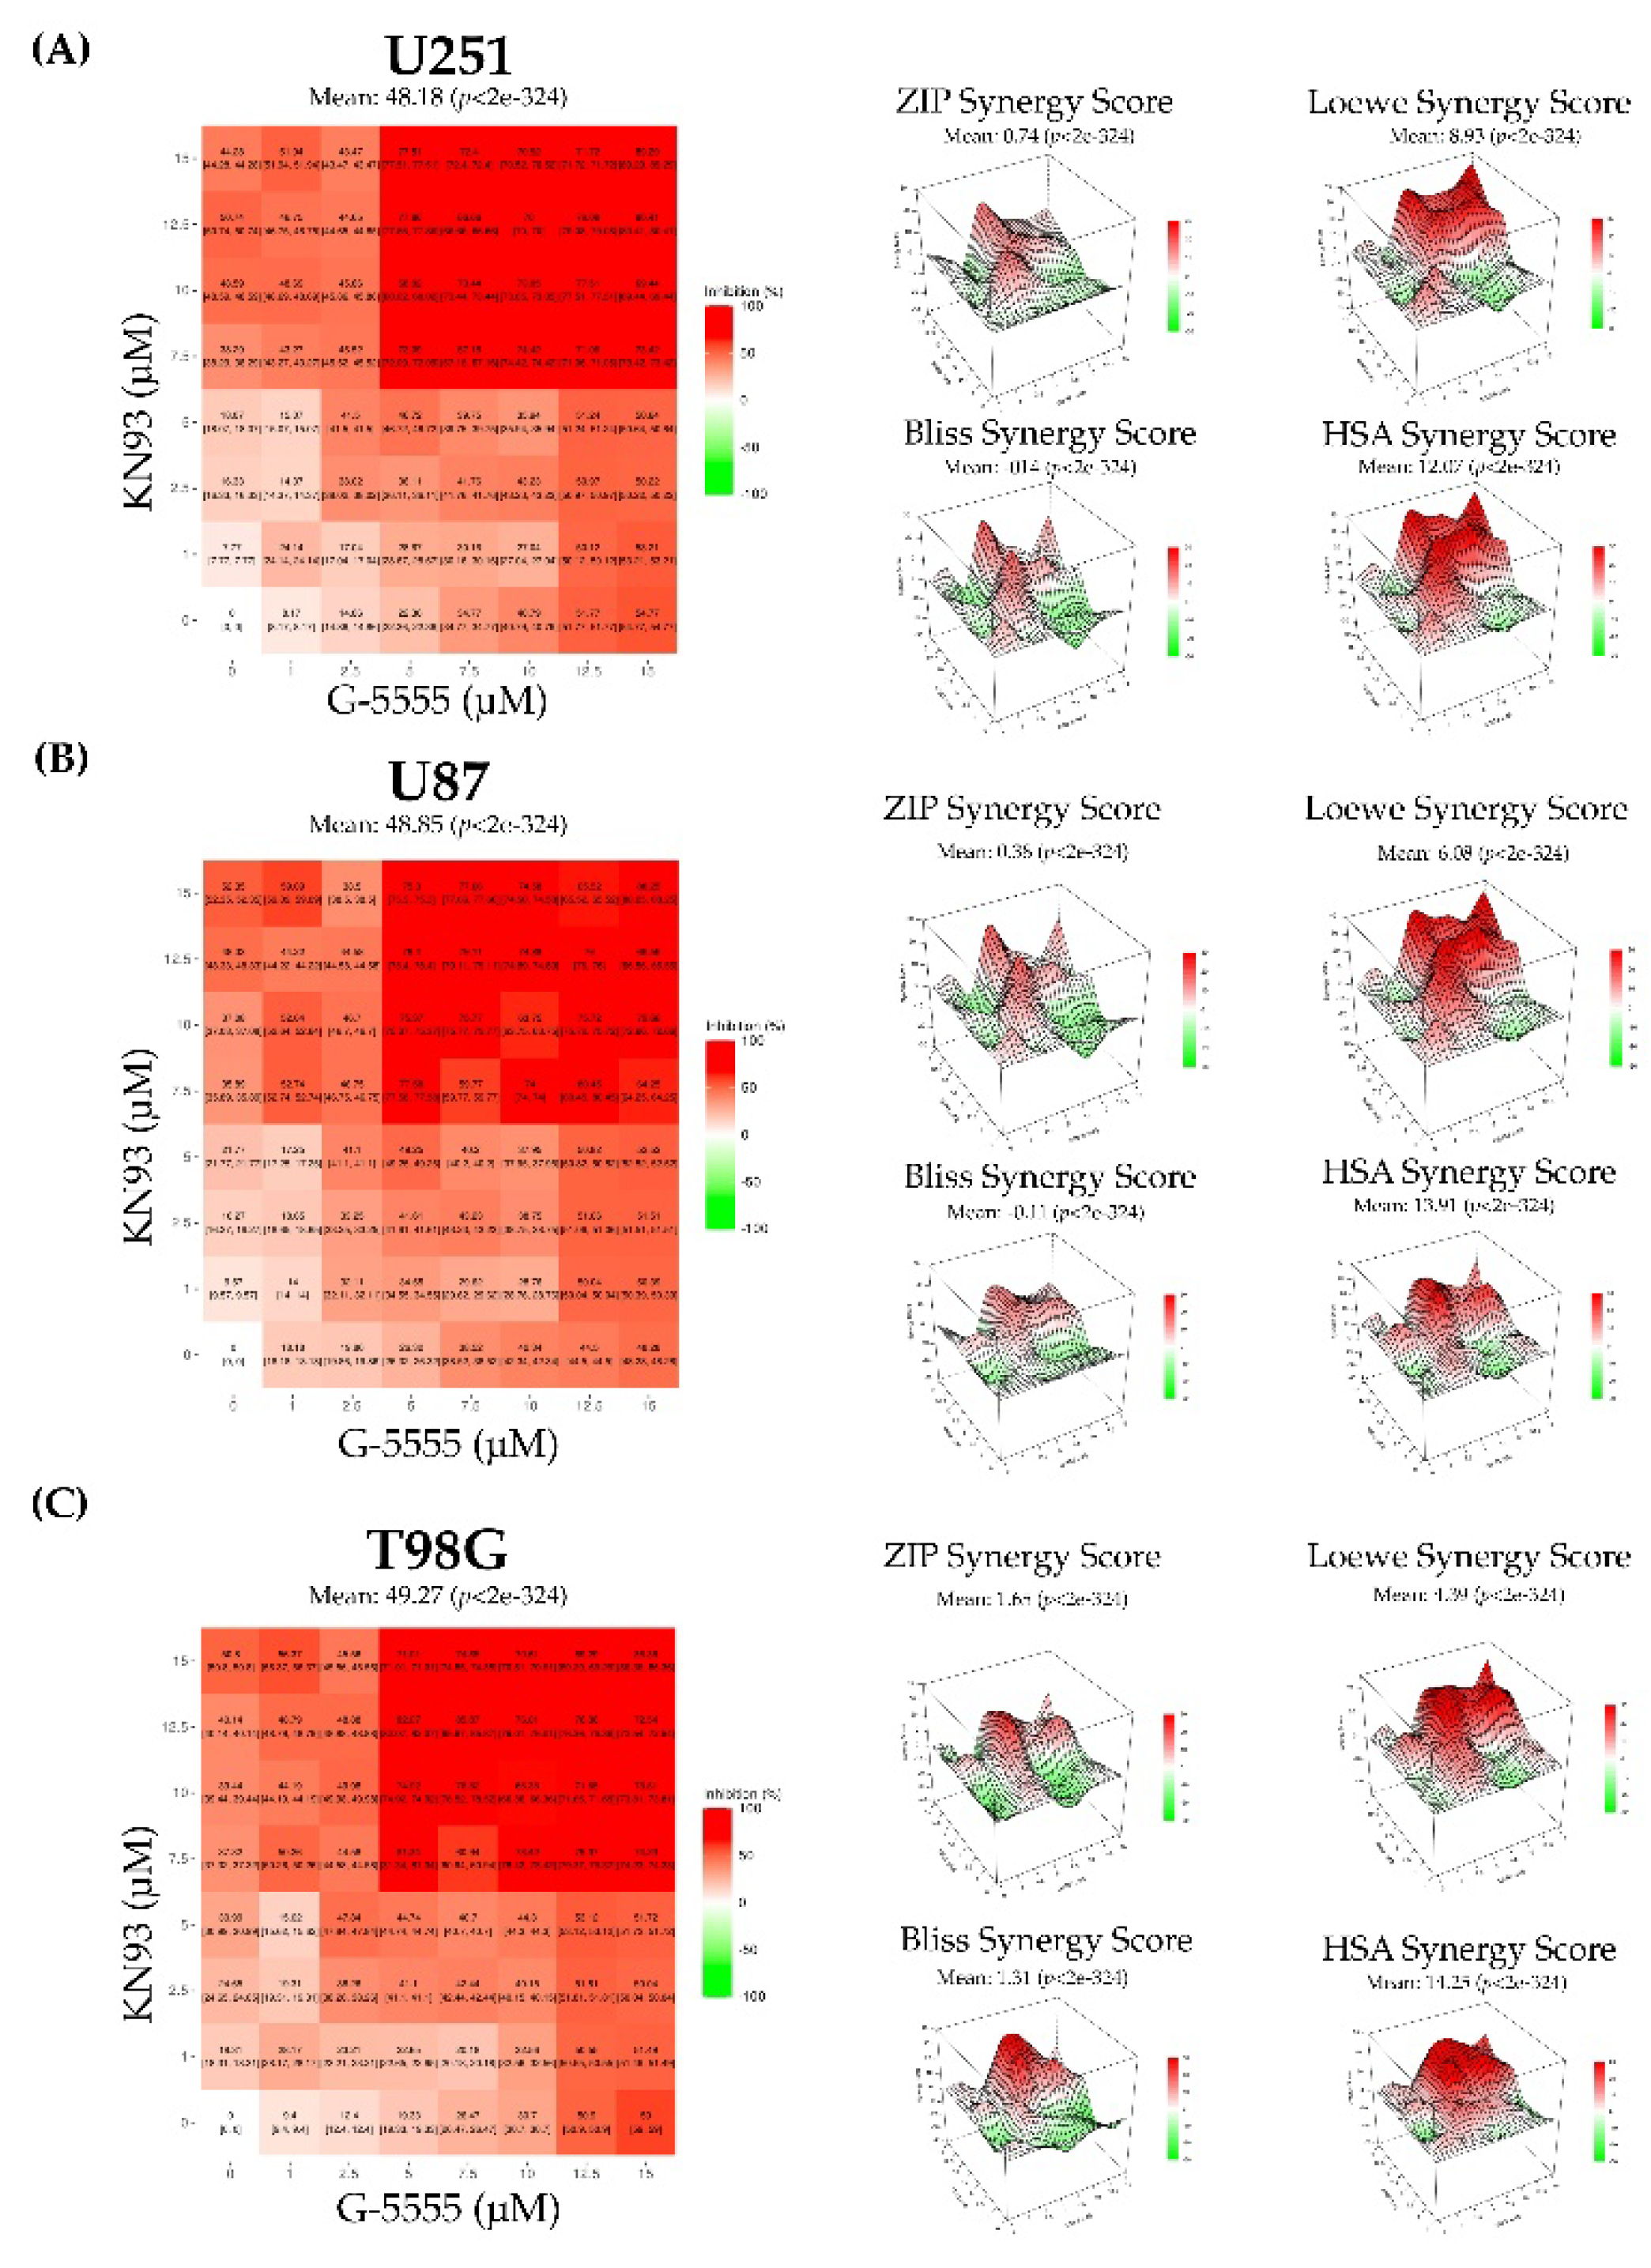
Figure 3.
Combined PAK1 and CaMKII inhibition suppresses glioblastoma cell growth, alters cell-cycle progression, enhances apoptotic signaling, and reduces clonogenic capacity. (A) Growth curves of U251, U87, and T98G cells treated with vehicle (DMSO), G-5555, KN-93, or their combination for 72 h. Viable cells were quantified by trypan blue exclusion at the indicated time points. (B) Cell-cycle distribution of U251, U87, and T98G cells at 0, 24, and 48 h following treatment. Percentages of cells in G0/G1, S, and G2/M phases are shown. (C) Representative Western blots of cleaved and pro-caspase-3 and densitometric quantification of cleaved caspase-3 normalized to GAPDH. (D) Representative colony formation assays and corresponding quantification of colony number after treatment with vehicle, G-5555, KN-93, or their combination. Data are presented as mean ± SD. ns, not significant; p < 0.05, p < 0.01, p < 0.001, and p < 0.0001.
Figure 3.
Combined PAK1 and CaMKII inhibition suppresses glioblastoma cell growth, alters cell-cycle progression, enhances apoptotic signaling, and reduces clonogenic capacity. (A) Growth curves of U251, U87, and T98G cells treated with vehicle (DMSO), G-5555, KN-93, or their combination for 72 h. Viable cells were quantified by trypan blue exclusion at the indicated time points. (B) Cell-cycle distribution of U251, U87, and T98G cells at 0, 24, and 48 h following treatment. Percentages of cells in G0/G1, S, and G2/M phases are shown. (C) Representative Western blots of cleaved and pro-caspase-3 and densitometric quantification of cleaved caspase-3 normalized to GAPDH. (D) Representative colony formation assays and corresponding quantification of colony number after treatment with vehicle, G-5555, KN-93, or their combination. Data are presented as mean ± SD. ns, not significant; p < 0.05, p < 0.01, p < 0.001, and p < 0.0001.
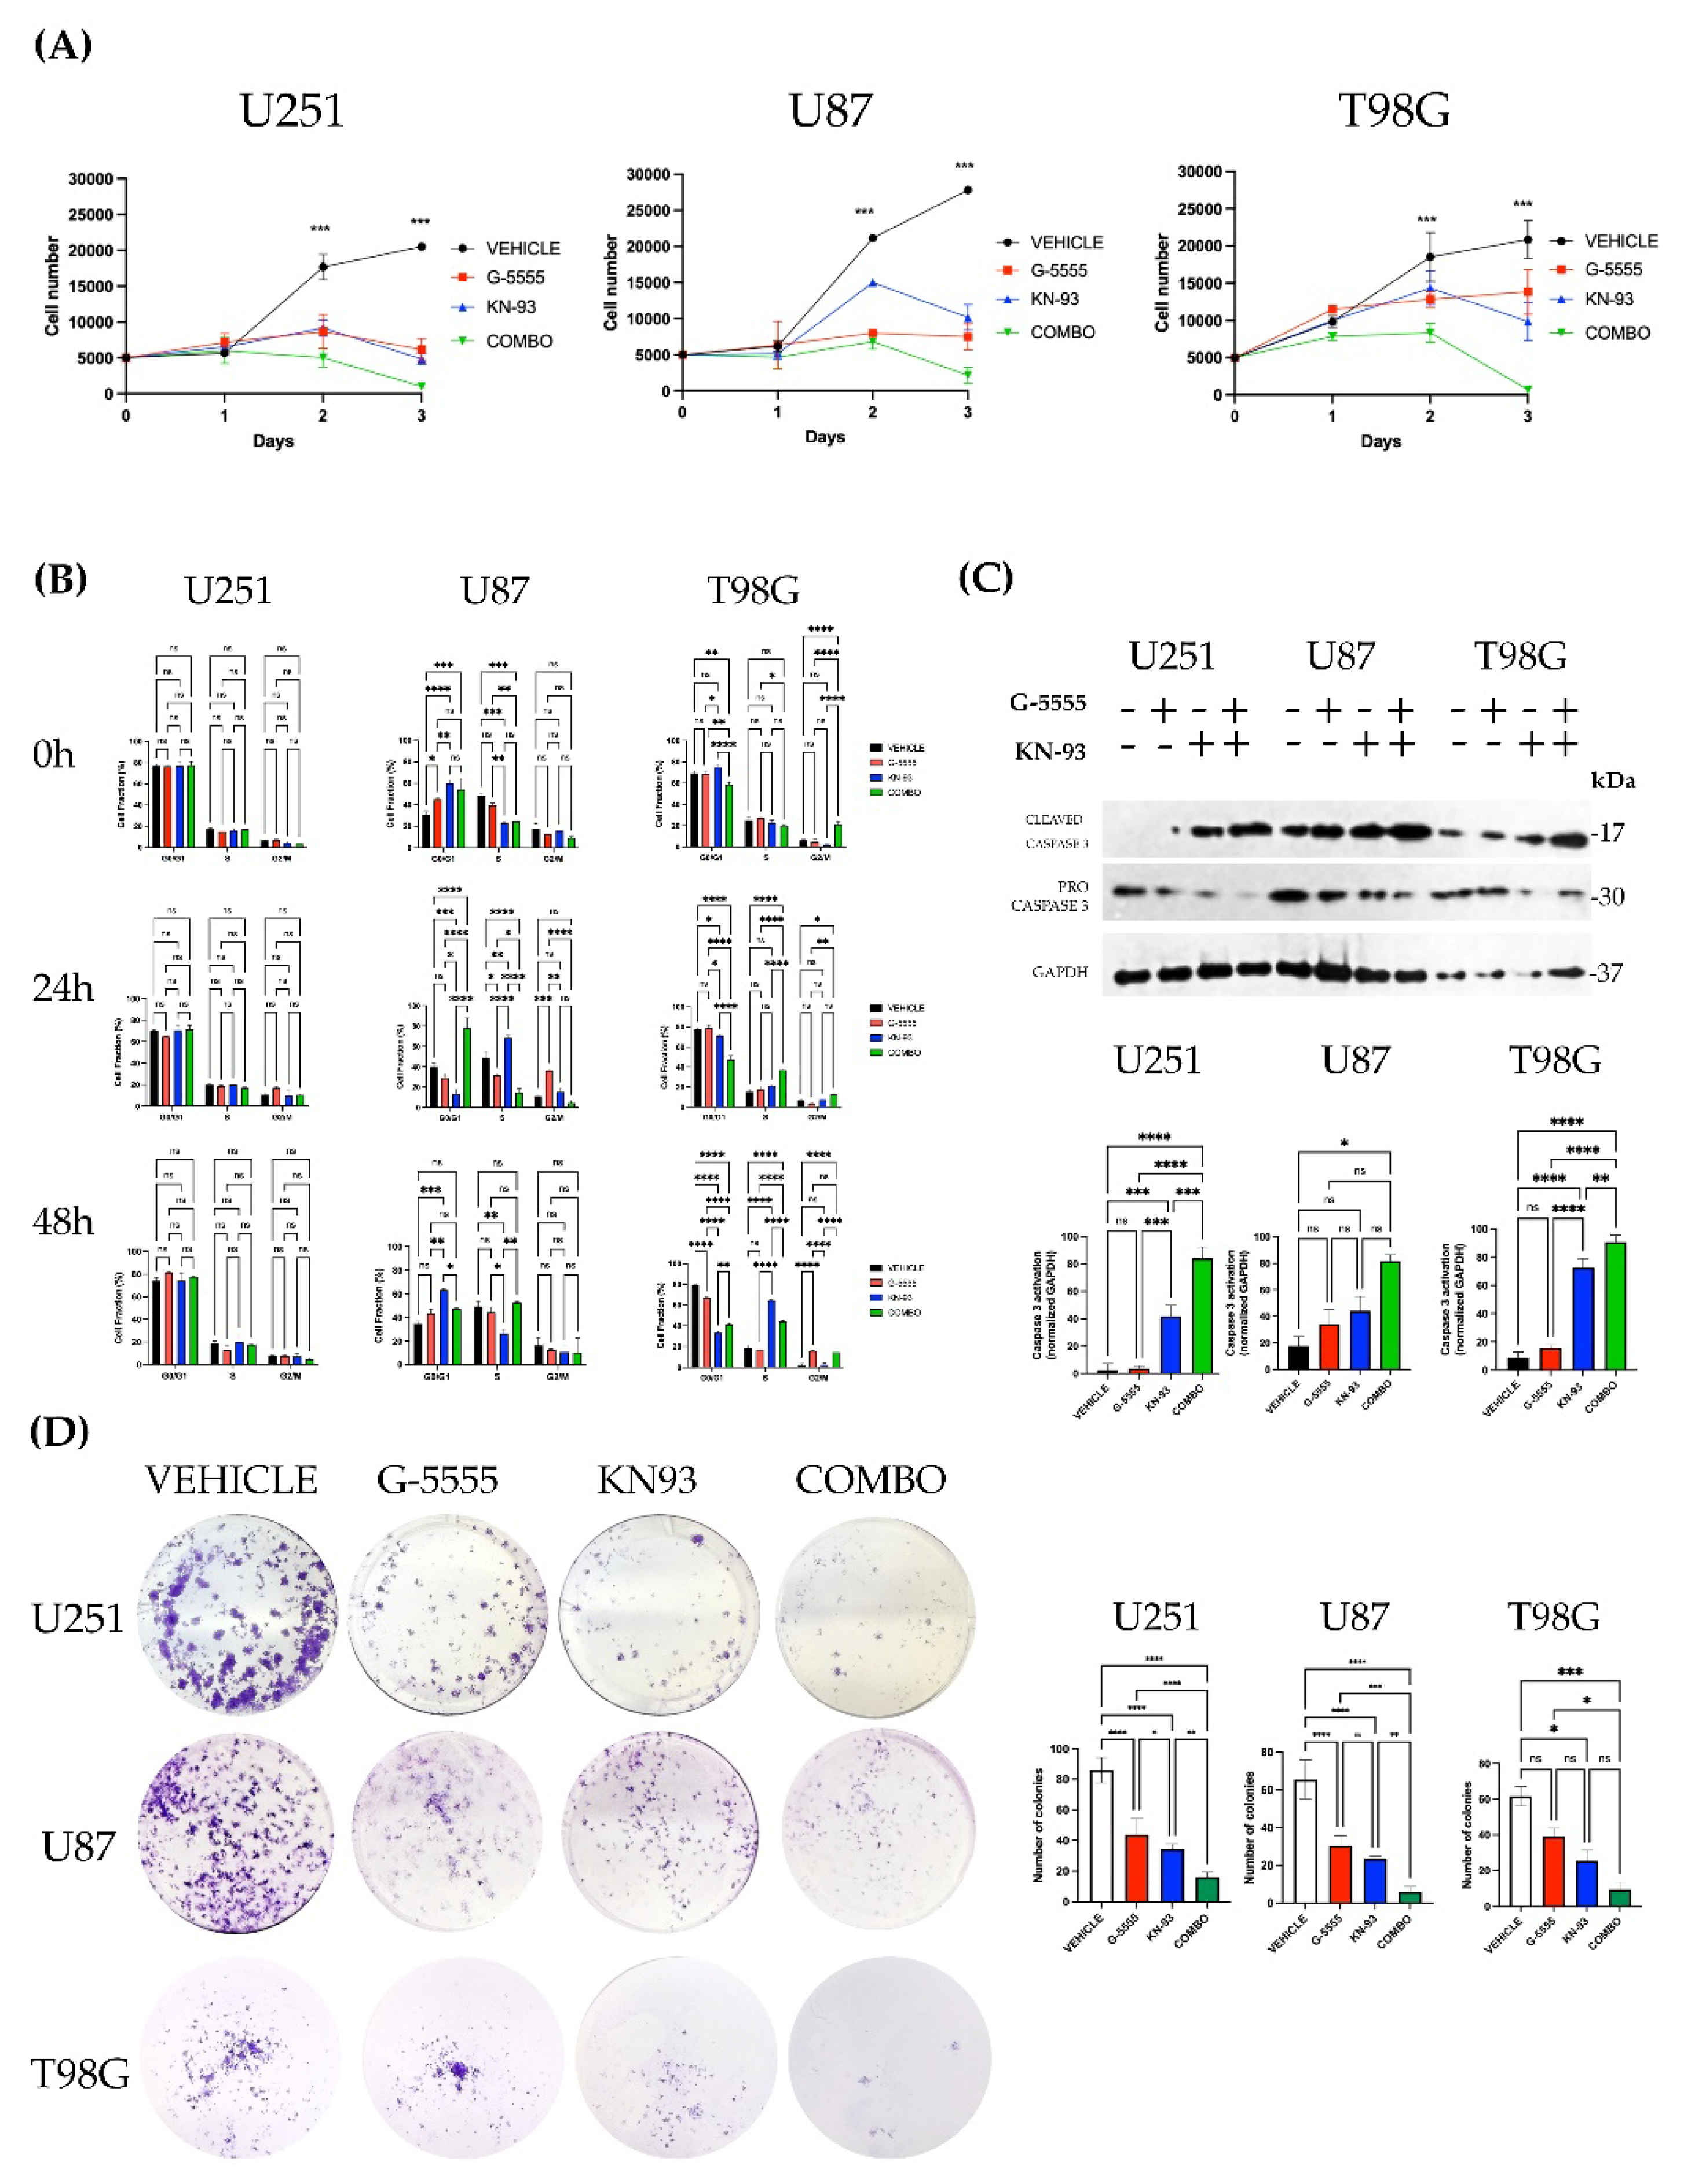
Figure 4.
Combined PAK1 and CaMKII inhibition suppresses glioblastoma cell migration and alters invasion-associated gene expression. (A) Representative Transwell migration images and quantification of migrated U251, U87, and T98G cells following treatment with vehicle (DMSO), G-5555, KN-93, or their combination. (B) Representative wound-healing images acquired at 0 and 24 h and corresponding quantification of wound closure. (C) Relative MMP2 and MMP9 mRNA expression following the indicated treatments. Data are presented as mean ± SD. ns, not significant; p < 0.05, p < 0.01, p < 0.001, and p < 0.0001.
Figure 4.
Combined PAK1 and CaMKII inhibition suppresses glioblastoma cell migration and alters invasion-associated gene expression. (A) Representative Transwell migration images and quantification of migrated U251, U87, and T98G cells following treatment with vehicle (DMSO), G-5555, KN-93, or their combination. (B) Representative wound-healing images acquired at 0 and 24 h and corresponding quantification of wound closure. (C) Relative MMP2 and MMP9 mRNA expression following the indicated treatments. Data are presented as mean ± SD. ns, not significant; p < 0.05, p < 0.01, p < 0.001, and p < 0.0001.
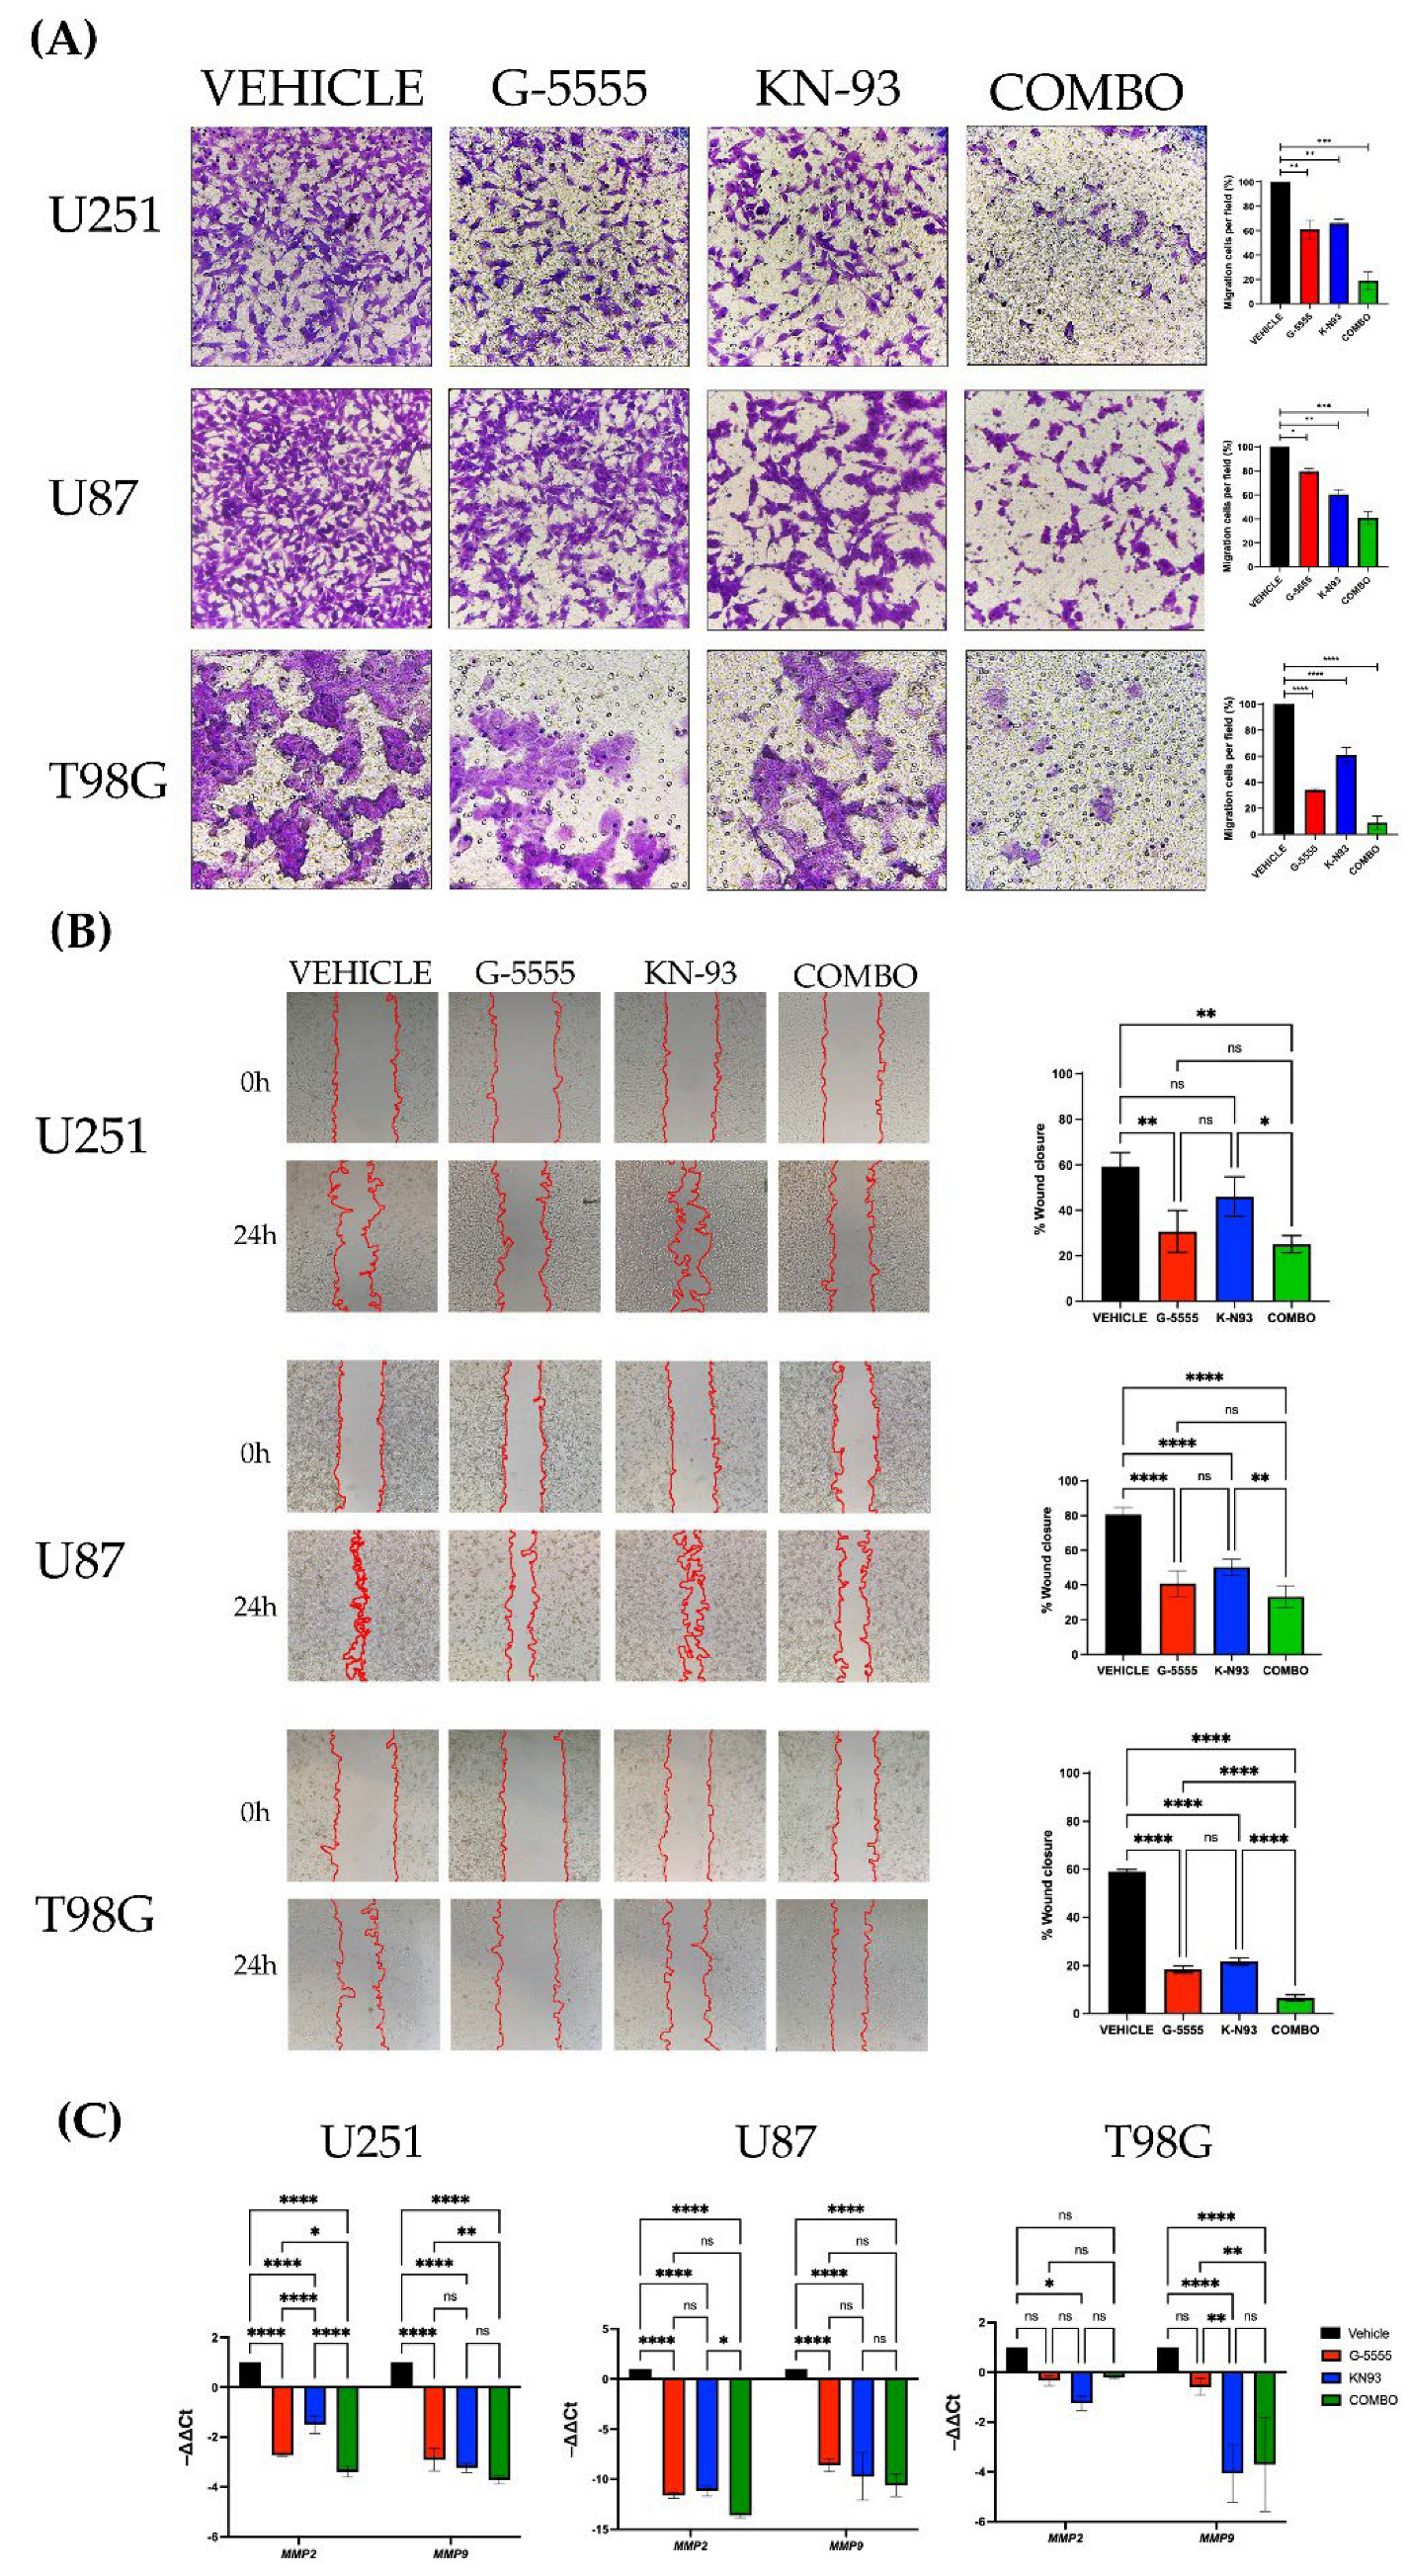
Figure 5.
Combined PAK1 and CaMKII inhibition induces broad phospho-signaling changes in U251 glioblastoma cells. (A) Heatmap showing relative phosphorylation changes across selected signaling proteins following treatment with G-5555, KN-93, or their combination, expressed as log2 fold change relative to vehicle-treated cells. (B) Ranked phosphorylation changes associated with combined G-5555/KN-93 treatment. (C) Pathway-level grouping of phosphorylation changes associated with combination treatment. (D) Representative Western blot analysis of total PAK1, phospho-PAK1, total CaMKII, and phospho-CaMKII following treatment with vehicle (DMSO), G-5555, KN-93, or their combination. GAPDH was used as a loading control.
Figure 5.
Combined PAK1 and CaMKII inhibition induces broad phospho-signaling changes in U251 glioblastoma cells. (A) Heatmap showing relative phosphorylation changes across selected signaling proteins following treatment with G-5555, KN-93, or their combination, expressed as log2 fold change relative to vehicle-treated cells. (B) Ranked phosphorylation changes associated with combined G-5555/KN-93 treatment. (C) Pathway-level grouping of phosphorylation changes associated with combination treatment. (D) Representative Western blot analysis of total PAK1, phospho-PAK1, total CaMKII, and phospho-CaMKII following treatment with vehicle (DMSO), G-5555, KN-93, or their combination. GAPDH was used as a loading control.
Disclaimer/Publisher’s Note: The statements, opinions and data contained in all publications are solely those of the individual author(s) and contributor(s) and not of MDPI and/or the editor(s). MDPI and/or the editor(s) disclaim responsibility for any injury to people or property resulting from any ideas, methods, instructions or products referred to in the content. |
© 2026 by the authors. Licensee MDPI, Basel, Switzerland. This article is an open access article distributed under the terms and conditions of the Creative Commons Attribution (CC BY) license (http://creativecommons.org/licenses/by/4.0/).
Copyright: This open access article is published under a Creative Commons CC BY 4.0 license, which permit the free download, distribution, and reuse, provided that the author and preprint are cited in any reuse.