

Submitted:
02 September 2026
Posted:
02 September 2026
You are already at the latest version
Abstract
Underwater visible light communication (UVLC) offers a high-speed alternative to acoustic and radio-frequency underwater links, but its performance is highly sensitive to channel impairments such as bubble-induced scattering. This paper presents an RGB wavelength-division-multiplexed UVLC system simulated in OptiSystem across a five-point turbidity gradient from clear to bubble-induced conditions, evaluated using Q-factor, bit error rate, bandwidth, and eye diagram metrics. An eleven-feature machine learning framework extracted from eye diagrams is classified using an Extreme Gradient Boosting model under a stratified, group-aware protocol, achieving 98.75% test accuracy and 96.18% (±2.17%) repeated cross-validation accuracy, statistically validated against support vector machine and Random Forest classifiers via a paired t-test. Physical-layer results reveal a monotonic wavelength-dependent degradation that becomes markedly non-uniform across the turbidity gradient, and an independently computed Mie scattering analysis shows bubble-induced scattering converging toward a wavelength-insensitive regime at physically realistic bubble radii, consistent with the classifier’s confusion pattern. A classification-triggered adaptive power strategy, validated through direct re-simulation, improves bit error rate by four to nine orders of magnitude under bubble-induced conditions, while Shannon capacity analysis indicates multi-gigabit-per-second headroom even under degraded conditions. These results demonstrate a physically grounded, validated framework integrating simulation, classification, and adaptive control for intelligent underwater optical communication.
Keywords:
underwater visible light communication
; wavelength division multiplexing
; machine learning classification
; XGBoost
; eye diagram analysis
; adaptive power control
1. Introduction
Underwater communication is essential for applications such as environmental monitoring, autonomous underwater vehicles (AUVs), and oceanographic data collection. However, conventional underwater communication technologies face significant physical limitations.
Acoustic communication is widely used for long-range transmission, typically supporting data rates of tens of kilobits per second with high latency and significant multipath interference. Radio frequency (RF) communication in seawater is highly attenuated due to the conductive nature of water, limiting practical data rates to only tens or hundreds of bits per second over short distances [1].
To overcome these limitations, underwater visible light communication (UVLC) has emerged as a promising alternative. UVLC systems exploit the wide optical spectrum and can achieve significantly higher data rates compared to acoustic and RF systems. Recent studies have demonstrated that UVLC systems can achieve data rates up to several gigabits per second under controlled conditions [2], while also providing low latency and high bandwidth [1].
Despite these advantages, UVLC performance is highly sensitive to channel impairments such as absorption, scattering, turbulence, and bubble-induced distortions. These effects degrade signal quality and limit communication range, particularly in dynamic underwater environments [3].
Eye diagram analysis is a well-established tool in optical communication systems for evaluating signal integrity. It provides both visual and quantitative metrics, including eye opening, jitter, and signal-to-noise ratio (SNR), which can be used to assess channel conditions and system performance. Coupling these eye diagram-derived metrics with machine learning-based classification offers a route to automated channel assessment, motivating the framework proposed in this work.
Underwater optical wireless communication (UOWC) has been extensively surveyed as a promising alternative to acoustic and radio-frequency underwater links, offering substantially higher data rates and lower latency at the cost of a strongly attenuating and scattering channel [4,5]. These foundational surveys established the core taxonomy of channel impairments (absorption, scattering, and turbulence) that subsequent system-level studies, including the present work, build upon. Theocharidis and Kavallieratou [1] provided a broader review of underwater communication technologies spanning acoustic, RF, and optical approaches, situating UVLC’s data-rate and latency advantages within the wider landscape of underwater communication options.
Recent advancements in RGB laser-based VLC have focused on Wavelength Division Multiplexing (WDM) to boost throughput. Zhang et al. [2] demonstrated a dense blue-green WDM system achieving over 10 Gbit/s aggregate throughput under turbidity-tolerant conditions, while Janarthanan and Gauni [6] proposed a 32-channel dense WDM system for underwater visible light communication using NRZ modulation, evaluated across pure sea, clear ocean, and coastal ocean water conditions; their system supported 320 Gbps transmission over a 200–350 m range with a very low reported bit error rate under optimized conditions. Rehman et al. [3] examined system-level design considerations for adaptive UVLC operation, motivating the channel-aware framework pursued in the present study.
Abd El-Mottaleb et al. proposed two related OCDMA-based approaches for secure and high-data-rate UOWC. In the first [7], a secure RGB image transmission framework based on Identity Row Shift Matrix Optical Code Division Multiple Access (IRSM-OCDMA) with particle-swarm-optimization-based image enhancement supported simultaneous multiuser transmission at an aggregate rate of up to 30 Gbps, evaluated across five distinct water types using standard image-quality metrics. In a related study [8], the same group extended this OCDMA approach specifically to the green spectrum (532–538 nm), reporting Q-factor and BER performance across the same five water types over underwater distances up to 50 m using OptiSystem simulation, and providing a directly comparable Q-factor/BER benchmark to the values reported in Table 3 of the present work.
NRZ-OOK has been favored for its simplicity and effectiveness in high-speed underwater links, owing to its direct mapping between bit value and optical intensity, avoiding the added receiver complexity of coherent or multilevel formats. Dong et al. [9] demonstrated a single-wavelength (450 nm) blue-laser UWOC system combining a linear equalizer with a low-complexity artificial neural network equalizer, achieving 1 Gbps data transmission over a 250-meter distance with a BER of , below the hard-decision forward error correction limit, the first reported Gbps-level demonstration beyond 250 m for UWOC. Other works confirm that with adequate equalization, NRZ-OOK can reliably support high-speed transmission over long underwater distances. The modulation scheme adopted in the present work follows this same NRZ-OOK principle and is formalized in Section 2.2.
Underwater optical channels experience impairments due to absorption (wavelength-dependent, e.g., blue light attenuates less than red), scattering (from particles, bubbles), and environmental factors such as salinity and turbulence. Chaudhary [10] demonstrated a polarization-division-multiplexed (PDM) MIMO UWOC architecture that mitigates salinity-induced degradation, reducing BER from approximately to as salinity increased from 32 to 34 ppt at a 3.6-meter link distance, and extending reliable operating range from 14 m (2×2 MIMO) to 20 m (4×4 MIMO). Ramley et al. [11] provided a comprehensive overview of Monte Carlo simulation approaches for solving the radiative transfer equation in underwater optical wireless channels, establishing Monte Carlo methods as a consistent and widely adopted approach for modeling photon propagation and received optical power distribution across diverse underwater environments. Vali et al. [12] more recently surveyed turbulence characterization and channel modeling techniques specific to UOWC, noting that turbulence effects are frequently treated independently of the absorption- and scattering-dominated attenuation modeled in the present work.
The physical mechanism underlying bubble-induced scattering specifically has been characterized since Davis’s foundational analysis of light scattering by an air bubble in water [13], which established that bubbles substantially larger than the incident wavelength – as is typical for underwater microbubbles relative to visible light – scatter in the Mie/geometric-optics regime rather than the wavelength-selective Rayleigh regime. This physical distinction is applied directly, with full governing equations, in Section 2.10.
Machine learning has enabled dynamic adaptation to varying channel conditions. The broader application of machine learning and deep learning to VLC systems, spanning channel estimation, noise mitigation, modulation classification, and symbol detection, has recently been comprehensively surveyed [14], underscoring the rapid growth of this research direction. Zhao et al. [15] proposed a deep recurrent neural network (SwitchOpt RNN) for link adaptation in underwater wireless optical communications, using only the receiver’s time-domain signal waveform without channel state information – representing the first investigation of deep-learning-based link adaptation for UWOC. In another study, Salama and Aly [16] combined DenseNet121 with Random Forest, Gated Recurrent Unit, LSTM, and RNN models to improve channel estimation accuracy in OFDM-based underwater optical communication systems, evaluated using 16-QAM modulation across varying pilot sample sizes.
Beyond underwater-specific studies, machine learning has also been applied to eye diagram-based channel classification in general optical and free-space optical (FSO) systems. Skoog et al. [17] demonstrated one of the earliest applications of this idea, using a support vector machine classifier to automatically identify impairments directly from eye diagram patterns in fiber-optic links. More recently, Islam et al. [18] applied an XGBoost classifier to received optical data to predict discrete turbulence levels in an FSO channel, reporting classification accuracies above 98% together with bit error rate (BER) and Q-factor measurements for each turbulence condition. While these studies confirm the viability of eye diagram- and received-signal-based machine learning classification for optical channels, neither addresses RGB wavelength-division multiplexed underwater channels or bubble-induced distortions, and neither couples the classification output back into an adaptive transmission strategy. The feature-extraction and classification methodology used in the present work, described fully in Section 2.4, builds directly on this eye-diagram-based classification precedent while extending it to the RGB WDM underwater setting.
Despite these advancements, most existing UVLC studies focus either on physical-layer system design or machine learning-based channel estimation independently, and the general optical/FSO studies that do combine eye diagram or received-signal features with machine learning classification [17,18] do not address RGB wavelength-division multiplexed underwater channels, bubble-induced distortions, or a resulting adaptive transmission strategy. Similarly, while several UOWC surveys [4,5,12] and machine-learning-for-VLC surveys [14] establish the individual maturity of physical-layer UVLC design and of ML-based optical channel classification as separate research threads, none couples RGB WDM system modeling, eye-diagram-based classification, and a validated adaptive power strategy within a single framework.
This work proposes an integrated RGB-based UVLC framework coupling physical-layer simulation with eye-diagram-based machine learning for channel classification and validated adaptive control.
The main contributions are:
- An integrated pipeline linking RGB WDM UVLC simulation directly to eye-diagram-based classification, rather than treating physical-layer design and machine learning independently.
- A multi-domain, 11-feature set (statistical, structural, frequency-domain, communication-specific) for eye-diagram classification under clear and bubble-induced conditions.
- An XGBoost classifier validated against SVM and Random Forest via a paired significance test across identical cross-validation folds.
- A five-point turbidity gradient revealing a non-uniform, threshold-like degradation profile across all three wavelengths.
- A physically grounded Mie-scattering analysis explaining the wavelength-selectivity behavior observed in the classification results.
- An adaptive laser bias/modulation-current strategy, validated through direct re-simulation showing measurable Q-factor and BER improvement.
2. Materials and Methods
2.1. System Model
The proposed underwater visible light communication (UVLC) system is designed and simulated using OptiSystem; its architecture is summarized as a block diagram in Figure 1. The system employs wavelength division multiplexing (WDM) to transmit multiple optical signals simultaneously over a shared underwater channel using red, green, and blue (RGB) laser sources.
At the transmitter side, three optical sources are modulated using Non-Return-to-Zero On-Off Keying (NRZ-OOK). The modulated optical signals are combined using a WDM multiplexer, forming a composite signal for transmission through the underwater channel. Table 1 summarizes the key transmitter, channel, and receiver parameters used throughout the simulation.

Table 1.
Key simulation parameters.
| Parameter | Value |
|---|---|
| Wavelengths (R/G/B) | 650 / 550 / 450 nm |
| Data rate per channel | 20 Mbps |
| Modulation | NRZ-OOK |
| Laser threshold current (R/G/B) | 33.46 mA (all channels) |
| Laser threshold power (R/G/B) | 0.037 / 0.044 / 0.054 mW |
| Link distance | 25 m |
| Absorption coeff. (clear/bubble) | 0.0405 / 0.180 m−1 |
| Scattering coeff. (clear/bubble) | 0.0025 / 0.219 m−1 |
| Photodetector sensitivity | 10 A/W |
2.2. Modulation Scheme
The transmitted optical signal under NRZ-OOK modulation can be expressed as
where is the binary value of the k-th transmitted bit, is the rectangular pulse shape occupying one bit period, and is the bit period corresponding to the 20 Mbps data rate given in Table 1. The instantaneous optical power switches between a low ("space," ) and high ("mark," ) level according to , with the achievable separation between these two levels – the extinction ratio – directly governing the eye diagram opening and, consequently, the Q-factor and BER reported in Section 3.
The underwater optical channel is modeled by considering both absorption and scattering effects, with clear-water and bubble-induced conditions represented by the coefficient pairs listed in Table 1. The bubble-induced scenario increases both coefficients relative to clear water, representing coastal turbid water with higher attenuation and signal distortion due to increased scattering caused by suspended particles and air bubbles. This modeling approach provides a simplified representation of bubble-induced effects, consistent with commonly used underwater channel models in the literature [11]. The attenuation of the optical signal in water can be described using the Beer–Lambert law [19]:
where denotes the transmitted optical power, is the received optical power, c is the attenuation coefficient (sum of absorption and scattering coefficients), and d represents the propagation distance.
At the receiver side, the combined optical signal is separated into its individual wavelength components using a WDM demultiplexer. Each channel is then detected using a photodetector, which converts the optical signal into an electrical signal for further analysis; both thermal and shot noise are included in the receiver model to account for the limitations of the practical system. Q-factor and BER values in Table 3 directly characterize link reliability at the evaluated distance.
2.3. Eye Diagram Acquisition and Dataset Preparation
Eye diagrams are used as a compact representation of signal integrity under different underwater channel conditions. For each received signal, eye diagrams are generated within OptiSystem’s Eye Diagram Analyzer and exported for further analysis. To ensure a consistent basis for feature extraction, the amplitude axis range of the Eye Diagram Analyzer is fixed (auto-scaling disabled) to a constant value for all repeated captures within a given channel-condition class, while the underlying signal noise and bit sequence are allowed to vary stochastically between captures, providing genuine independent realizations of the same channel condition rather than rescaled displays of a single result.
To ensure consistency, each image is resized to 128 × 128 pixels and converted to grayscale. The dataset consists of six classes corresponding to wavelength and channel condition combinations: blue (clear), blue (bubble-induced), green (clear), green (bubble-induced), red (clear), and red (bubble-induced). Each class contains 50 original samples, resulting in 300 images.
To enhance generalization and mitigate overfitting, data augmentation is applied using horizontal flipping, small-angle rotation (±5°), and additive Gaussian noise, each producing one augmented variant per original image. A small rotation angle is used rather than a large-angle rotation, since an eye diagram’s time and amplitude axes are not physically interchangeable, unlike a natural image. This increases the dataset to 1,200 samples (300 originals plus three augmented variants each).
In addition to the image-based captures used for machine learning, Q-factor, minimum bit error rate (BER), and eye height are obtained directly from OptiSystem’s Eye Diagram Analyzer for each of the six channel-condition combinations, providing complementary physical-layer performance metrics reported alongside the classification results in Section 3.
2.4. Feature Extraction
The processed eye diagrams are transformed into structured numerical representations through a multi-domain feature extraction process. For a grayscale eye-diagram image with pixel intensities , the extracted statistical features are computed as follows:
where and denote the 25th and 75th percentiles of the pixel intensity distribution, respectively, and the median is the 50th percentile. Beyond these six statistical descriptors, the extracted features capture three further complementary aspects of signal behavior:
- First, structural feature: edge density computed using the Canny edge detector;
- Second, frequency-domain feature: average spectral magnitude obtained via Fast Fourier Transform (FFT);
- Third, communication-specific features: eye opening, jitter, and signal-to-noise ratio (SNR).
In total, 11 features are extracted per eye diagram, providing a compact yet informative representation of signal characteristics for machine learning-based classification. This image-derived SNR feature is computed as [20]:
and is distinct from the electrical SNR reported in Table 3, which is derived analytically from Q-factor (Section 2.11).
2.5. Data Preprocessing and Model Training
Prior to training, the dataset is divided into training and testing partitions using a stratified, group-aware 80/20 split, in which all augmented variants of a given source image are constrained to the same partition and each of the six classes contributes an equal proportion of its source images to the held-out test set. This prevents augmented copies of a single source eye diagram from appearing in both the training and test partitions, and ensures balanced per-class representation in evaluation. The same partitioning scheme is applied to the cross-validation procedure described in Section 2.6.
Feature scaling is performed using z-score (standard score) normalization, fit on the training partition only and applied identically to the test partition to prevent information leakage:
where is a raw feature value, and and are the mean and standard deviation of that feature computed exclusively over the training partition, following the same statistical definitions given in Equations (3) and (4). This transformation centers each feature at zero mean and unit variance, preventing features with larger raw numerical ranges (e.g., frequency-domain energy) from dominating the gradient-boosted tree splits over smaller-range features (e.g., skewness).
An Extreme Gradient Boosting (XGBoost) classifier is employed due to its strong performance in structured data classification. The model is configured with 300 estimators, a maximum depth of 6, a learning rate of 0.1, and a subsampling ratio of 0.8. To confirm that classification performance is not specific to this configuration, results are additionally reported for a support vector machine (SVM) and a Random Forest classifier trained on identical splits, together with a grouped hyperparameter search, a feature-domain ablation, and a hierarchical condition-then-wavelength classifier.
2.6. Model Evaluation
The performance of the proposed classification framework is evaluated using accuracy, precision, recall, and F1-score. A confusion matrix is used to analyze class-wise prediction performance and identify misclassification patterns.
To assess model robustness, stratified, group-aware 5-fold cross-validation is performed, repeated across five independent fold assignments (25 folds in total) to obtain a stable estimate of mean accuracy. This repeated cross-validation accuracy, rather than a single-split test accuracy, is adopted as the primary reported performance metric. Statistical significance of pairwise differences between the three classifier architectures is assessed using a paired t-test across the 25 fold-level accuracy values, with each classifier evaluated on identical held-out folds to ensure valid pairing.
2.7. Adaptive Communication Strategy
Based on the predicted channel condition, the system provides adaptive feedback for communication optimization. In the presence of bubble-induced distortions, the framework recommends adjusting the transmitter’s bias current and modulation peak current to compensate for signal degradation, since these two laser drive parameters are what OptiSystem’s transmitter model exposes as independently controllable and what physically determine the achievable extinction ratio in Equation (1). Under clear conditions, nominal operating parameters are maintained to ensure stable and energy-efficient transmission. This integration of physical-layer modeling with machine learning provides a framework for adapting UVLC operation to varying underwater channel conditions based on classifier output.
2.8. Adaptive Power Validation Methodology
To validate the adaptive strategy described in Section 2.7, the bias and modulation peak currents for each bubble-induced channel were adjusted from their baseline values (40 mA bias, 40 mA modulation) to bring the bias current closer to the laser threshold current while widening the modulation swing.
This adjustment is physically justified by the relationship between bias current and extinction ratio in directly modulated laser diodes: the "space" (bit-0) level in Equation (1) is set by the bias current, while the "mark" (bit-1) level is set by bias plus modulation swing. When the bias current sits well above threshold, the space level itself lases at significant power, compressing the achievable contrast between mark and space regardless of how far above threshold the mark level is pushed. Positioning the bias current close to threshold instead ensures the space level remains near the laser’s turn-on point, while a wide modulation swing drives the mark level well into the linear lasing region, maximizing and, consequently, eye opening, Q-factor, and BER.
All three RGB laser diodes were confirmed to share an identical threshold current while exhibiting different threshold powers (Table 1), consistent with wavelength-dependent slope efficiency across the diodes; the same relative adjustment (bias current reduced to 35 mA, modulation peak current increased to 55 mA) was therefore applied uniformly across all three channels. Each channel was re-simulated under identical bubble-induced attenuation and scattering conditions, and Q-factor, BER, and eye height were recorded before and after adjustment for direct comparison.
2.9. Turbidity Gradient Simulation
To characterize the transition between clear-water and bubble-induced conditions at finer granularity than the two-endpoint model used elsewhere in this study, three intermediate turbidity levels were constructed by linearly interpolating both the absorption and scattering coefficients between the clear-water and bubble-induced endpoints listed in Table 1, at 25%, 50%, and 75% of the total coefficient difference. The resulting five-point gradient was simulated independently for each of the three RGB channels using the same OptiSystem configuration, receiver model, and Eye Diagram Analyzer settings described in Section 2.1.
2.10. Mie Scattering Efficiency Computation
To evaluate quantitatively whether bubble-induced scattering operates in a wavelength-selective (Rayleigh) or wavelength-insensitive (Mie/geometric-optics) regime, Mie scattering efficiencies were computed independently of the OptiSystem simulation using the miepython computational library. The relative refractive index of an air bubble in water is
and the Mie size parameter, relating bubble diameter to wavelength inside the surrounding medium, is
where is the bubble diameter for radius a. Given m and x, the scattering efficiency is obtained via the standard Mie series solution to Maxwell’s equations for a homogeneous sphere, following the classical formulation established for bubble scattering by Davis [13]. Scattering efficiency was computed for the three RGB wavelengths (450, 550, and 650 nm) across a bubble radius range of 1–1000 m, spanning the physically realistic range for underwater microbubbles.
2.11. Shannon Capacity Calculation
3. Results
3.1. Eye Diagram Analysis
The performance of the RGB NRZ-OOK UVLC system was evaluated under both clear water and bubble-induced conditions through detailed eye diagram analysis for each channel, shown in Figure 2, Figure 3 and Figure 4.
Under pure water conditions, all channels exhibit well-defined, open eye patterns. The blue channel (450 nm) shows the largest eye opening, followed by green (550 nm) and red (650 nm), consistent with lower absorption at shorter wavelengths.
Bubble-induced scattering visibly degrades signal quality across all channels, reducing eye opening and introducing noise and blurred decision boundaries. Degradation is most pronounced in the red channel, while blue remains relatively robust, consistent with the Q-factor and BER measurements reported below.
3.2. Bandwidth and Communication Performance Metrics
The measured bandwidth of each RGB channel, obtained from the frequency response using the dB cutoff criterion, is summarized in Table 2.
Table 2.
Measured bandwidth for RGB channels.
| Laser Color | Bandwidth (GHz) |
|---|---|
| Blue (450 nm) | 0.82 |
| Green (550 nm) | 0.60 |
| Red (650 nm) | 0.48 |
| Total Bandwidth | 1.90 |
The blue channel achieves the highest bandwidth (0.82 GHz), followed by green (0.60 GHz) and red (0.48 GHz), attributed to wavelength-dependent attenuation; this reflects the receiver’s available electrical bandwidth rather than the bandwidth occupied by the 20 Mbps signal itself, indicating headroom for higher-rate operation. WDM enables a total system bandwidth of approximately 1.90 GHz.
Received optical power at the 25 m link distance, computed from Equation (2) using the transmitter powers and attenuation coefficients in Table 1, is 12.6, 15.0, and 18.4 W for the red, green, and blue channels under clear-water conditions, respectively, dropping to 1.72, 2.05, and 2.51 nW under bubble-induced conditions – a reduction of approximately 39 dB at the same distance. Figure 5 illustrates this attenuation trend as a function of distance for all three channels under both conditions.
Table 3 summarizes Q-factor, minimum BER, eye height, received optical power, and SNR (Equation (13)) for each of the six channel-condition combinations.
Table 3.
Communication performance metrics.
| Condition | Q-Factor | BER | Rx Power | Eye Height | SNR (dB) |
|---|---|---|---|---|---|
| Blue-Clear | 10.27 | 18.4 W | 20.23 | ||
| Blue-Bubble | 5.08 | 2.51 nW | 14.12 | ||
| Green-Clear | 9.67 | 15.0 W | 19.71 | ||
| Green-Bubble | 4.48 | 2.05 nW | 13.03 | ||
| Red-Clear | 9.37 | 12.6 W | 19.43 | ||
| Red-Bubble | 4.31 | 1.72 nW | 12.69 |
The blue channel achieves the highest Q-factor and lowest BER of the three wavelengths under both conditions, consistent with its lower attenuation relative to green and red. This ordering is monotonic with wavelength (blue > green > red) across Q-factor, BER, and eye height, under both channel conditions. Under bubble-induced conditions specifically, the green and red channels exhibit the closest Q-factor (4.48 vs. 4.31) and BER ( vs. ) of any wavelength pair, while blue remains comparatively distinct (Q-factor 5.08, BER ).
3.3. Turbidity Gradient Results
Table 4 and Figure 6 present Q-factor, BER, eye height, and SNR across the full five-point turbidity gradient for all three wavelengths, obtained using the interpolation scheme described in Section 2.9.
Q-factor decreases monotonically with increasing turbidity for all three wavelengths, from a maximum of 10.27 (blue, clear water) to a minimum of 4.31 (red, bubble-induced). The degradation is markedly non-uniform: Q-factor declines gradually across the 0–75% range (blue: 10.27 to 9.471, a 7.8% reduction), while the final transition from 75% to the bubble endpoint produces a sharp collapse (blue: 9.471 to 5.08, a 46% reduction), with BER worsening by 13–14 orders of magnitude over that same final interval.
3.4. Mie Scattering Efficiency Results
Figure 7 shows the computed Mie scattering efficiency for the three RGB wavelengths across a bubble radius range of 1–1000 m, using the formulation given in Equations (10) and (11).
For bubble radii below approximately 2 m, scattering efficiency is meaningfully wavelength-dependent, with up to 27.6% relative difference between blue and green at 1 m radius. For radii beyond approximately 5–10 m the range most representative of coastal and turbulence-generated micro-bubbles, all three wavelengths converge to the geometric-optics limit , with pairwise differences typically below 1–2%. At physically realistic radii, no single wavelength pair consistently emerges as most similar; the specific pairwise ordering fluctuates with the Mie oscillation structure rather than following a stable trend.
3.5. Shannon Capacity Results
Table 5 reports theoretical channel capacity for all six channel-condition combinations, computed using Equation (12).
Even under bubble-induced degradation, theoretical capacity remains in the multi-gigabit-per-second range across every condition more than two orders of magnitude above the 20 Mbps data rate simulated in this work.
3.6. Adaptive Power Validation Results
Table 6 summarizes Q-factor, BER, eye height, and SNR before and after the bias/modulation current adjustment described in Section 2.8, applied to all three bubble-induced channels.
The adjustment yields substantial improvement across all three channels, with BER improving by 9, 7, and 4 orders of magnitude for blue, green, and red, respectively.
3.7. Machine Learning Classification Results
The performance of the XGBoost classifier is evaluated using the extracted eye diagram features under a stratified, group-aware train/test protocol, in which all augmented copies of a given source image are constrained to the same partition and each class contributes an equal proportion of its source images to the held-out test set. The classification accuracy on the test set is 98.75% (Table 7; 240 samples, corresponding to 60 unique source images).
The confusion matrix (Figure 8) shows pure-water classes separated perfectly, with all classification errors confined to the three bubble-induced classes. The dominant confusion is a mutual one between the bubble-induced green and red channels: 1 of 40 green samples is misclassified as red, and 2 of 40 red samples are misclassified as green, while the bubble-induced blue channel is classified perfectly (44 of 44 correct).
Stratified group-aware 5-fold cross-validation yields 97.50% (±1.69), and a repeated evaluation over 25 folds (five independent 5-fold assignments) yields 96.18% (±2.17), adopted as the primary reported accuracy given its lower variance.
Table 8 compares XGBoost against SVM (RBF kernel) and Random Forest, using identical features and the same stratified group split.
A paired t-test across the 25 identical stratified group folds indicates that the difference between XGBoost (mean 96.18%) and SVM (mean 96.90%) is statistically significant (, ), while the difference between XGBoost and Random Forest (mean 96.40%) is not (, ). XGBoost is retained as the primary model on the basis of its substantially lower computational cost and native feature-importance output.
A feature-domain ablation shows that statistical descriptors alone achieve 93.33% test accuracy, while adding structural features raises accuracy to 98.75%, matching the full 11-feature set; frequency-domain features alone contribute no further improvement (97.92%).
To confirm this reflects genuine eye-diagram structure rather than incidental image-scale differences, accuracy was recomputed restricted to the three bubble-induced classes only, where the large clear/bubble amplitude gap cannot aid discrimination. Edge density (0.408) and intensity kurtosis (0.270) account for the majority of feature importance, followed by mean intensity (0.112); eye opening itself contributes minimally (0.005). Restricted accuracy is 97.58%, well above the 33% chance level for a three-way classification problem.
4. Discussion
The physical-layer results confirm a monotonic wavelength-dependent relationship (blue > green > red) across every metric, consistent with the broader UOWC literature [4,5] and comparable OCDMA-based benchmarks [8]. The turbidity gradient reveals this degradation is non-uniform: Q-factor declines gradually through 75% turbidity, then collapses sharply toward the bubble endpoint, with BER worsening by 13–14 orders of magnitude over that final interval. This has practical implications for channel monitoring, since coarse clear/bubble discrimination alone could underestimate proximity to failure, motivating the extended-dataset future work identified below.
The Mie scattering computation shows that at bubble radii representative of real underwater microbubbles, all three wavelengths converge toward the wavelength-insensitive geometric-optics limit [13], consistent with the classifier’s dominant confusion occurring between the two channels independently identified as most physically similar (Table 3). This convergence is small enough (0.2–1.5%) that it explains the general loss of wavelength-selectivity rather than the specific pairwise ordering, which likely reflects additional wavelength-dependent factors within the simulated channel and receiver model not disentangled here.
Interpreted against the standard hard-decision FEC threshold (, SNR ≈ 15.56 dB), the adaptive power adjustment moves all three bubble-induced channels to or above this benchmark: blue and green gain comfortable margins (2.46 dB and 1.64 dB), while red crosses only marginally (0.14 dB), suggesting red would benefit from a larger, channel-specific adjustment under more severe conditions.
Shannon capacity analysis indicates multi-gigabit-per-second theoretical headroom even under bubble-induced degradation, though achievable rates in practice would be constrained by coding overhead and receiver complexity not modeled here.
Several limitations apply. The study is simulation-based; real underwater validation, incorporating turbulence-induced fading [12] and practical bubble-size variability, remains necessary before real-world reliability can be established. The classification dataset derives from 50 original captures per class, and a larger set spanning intermediate turbidity levels would strengthen generalization confidence. Finally, the specific physical mechanism behind the observed pairwise wavelength similarity is not fully resolved by the Mie analysis alone.
5. Conclusions
This paper presented an integrated framework combining RGB WDM UVLC simulation, eye-diagram-based machine learning classification, and a validated adaptive power-control strategy. An XGBoost classifier achieved 98.75% test accuracy and 96.18% (±2.17%) repeated cross-validation accuracy, statistically validated against SVM and Random Forest classifiers via a paired t-test.
Physical-layer characterization confirmed monotonic wavelength-dependent performance and revealed a non-uniform, threshold-like turbidity degradation profile. An independently computed Mie scattering analysis provided physical grounding for the classifier’s confusion pattern, showing convergence toward wavelength-insensitive scattering at realistic bubble radii.
The adaptive strategy was validated through direct re-simulation rather than proposed as an unverified capability, improving BER by four to nine orders of magnitude and moving all three channels to or above the standard FEC reliability threshold. Shannon capacity analysis indicated multi-gigabit-per-second headroom even under degraded conditions.
Future work should prioritize real underwater validation, incorporation of turbulence-induced fading, and extension of the classification dataset to intermediate turbidity levels.
Author Contributions
Conceptualization, E.A. and M.A.; methodology, E.A. and M.A.; software, E.A.; validation, E.A. and M.A.; formal analysis, E.A.; investigation, E.A.; resources, M.A.; data curation, E.A.; writing—original draft preparation, E.A.; writing—review and editing, M.A.; visualization, E.A.; supervision, M.A. All authors have read and agreed to the published version of the manuscript.
Funding
This research received no external funding.
Institutional Review Board Statement
Not applicable.
Informed Consent Statement
Not applicable.
Data Availability Statement
The eye diagram dataset and machine learning code generated and analyzed during this study are available from the corresponding author upon reasonable request.
Conflicts of Interest
The authors declare no conflicts of interest.
Abbreviations
| AUV | Autonomous Underwater Vehicle |
| BER | Bit Error Rate |
| CV | Cross-Validation |
| ER | Extinction Ratio |
| FEC | Forward Error Correction |
| FFT | Fast Fourier Transform |
| FSO | Free-Space Optical |
| GRU | Gated Recurrent Unit |
| IQR | Interquartile Range |
| IRSM-OCDMA | Identity Row Shift Matrix Optical Code Division Multiple Access |
| LSTM | Long Short-Term Memory |
| MIMO | Multiple-Input Multiple-Output |
| NRZ-OOK | Non-Return-to-Zero On-Off Keying |
| OCDMA | Optical Code Division Multiple Access |
| OFDM | Orthogonal Frequency Division Multiplexing |
| PDM | Polarization-Division Multiplexed |
| PIN | Positive-Intrinsic-Negative (photodiode) |
| QAM | Quadrature Amplitude Modulation |
| RF | Radio Frequency |
| RGB | Red, Green, Blue |
| RNN | Recurrent Neural Network |
| SNR | Signal-to-Noise Ratio |
| SVM | Support Vector Machine |
| UOWC | Underwater Optical Wireless Communication |
| UVLC | Underwater Visible Light Communication |
| UWOC | Underwater Wireless Optical Communication |
| WDM | Wavelength Division Multiplexing |
| XGBoost | Extreme Gradient Boosting |
References
- Theocharidis, T.; Kavallieratou, E. Underwater communication technologies: a review. Telecommun. Syst. 2025, 88, 54. [Google Scholar] [CrossRef]
- Zhang, K.; Sun, C.; Shi, W.; Lin, J.; Li, B.; Liu, W.; Chen, D.; Zhang, A. Turbidity-tolerant underwater wireless optical communications using dense blue–green wavelength division multiplexing. Opt. Express 2024, 32, 20762–20775. [Google Scholar] [CrossRef] [PubMed]
- Rehman, S.; Rong, Y.; Chen, P. Designing an adaptive underwater visible light communication system. Sensors 2025, 25, 1801. [Google Scholar] [CrossRef] [PubMed]
- Zeng, Z.; Fu, S.; Zhang, H.; Dong, Y.; Cheng, J. A survey of underwater optical wireless communications. IEEE Commun. Surv. Tutor. 2017, 19, 204–238. [Google Scholar] [CrossRef]
- Kaushal, H.; Kaddoum, G. Underwater optical wireless communication. IEEE Access 2016, 4, 1518–1547. [Google Scholar] [CrossRef]
- Janarthanan, M.; Gauni, S. Optimization of underwater visible light communication transmission using multilevel regression modelling. Ocean Eng. 2024, 309, 117988. [Google Scholar] [CrossRef]
- Abd El-Mottaleb, S.A.; Atieh, A.; Aly, M.H. Next-generation UOWC enabling high-speed and secure RGB image transmission using IRSM-OCDMA with PSO-based image enhancement. Sci. Rep. 2025, 15, 44130. [Google Scholar] [CrossRef] [PubMed]
- Abd El-Mottaleb, S.A.; Singh, M.; Atieh, A.; Aly, M.H. High data rate underwater optical wireless communication systems with ICSM codes within green spectrum. Opt. Quantum Electron. 2025, 57, 213. [Google Scholar] [CrossRef]
- Dong, X.; Zhang, K.; Sun, C.; Zhang, J.; Zhang, A.; Wang, L. Towards 250-m gigabits-per-second underwater wireless optical communication using a low-complexity ANN equalizer. Opt. Express 2025, 33, 2321–2337. [Google Scholar] [CrossRef] [PubMed]
- Chaudhary, S. Mitigating salinity effects in UWOC using integrated polarization-multiplexed MIMO architecture. J. Sens. Actuator Netw. 2026, 15, 17. [Google Scholar] [CrossRef]
- Ramley, I.; Alzayed, H.M.; Al-Hadeethi, Y.; Chen, M.; Barasheed, A.Z. An overview of underwater optical wireless communication channel simulations with a focus on the Monte Carlo method. Mathematics 2024, 12, 3904. [Google Scholar] [CrossRef]
- Vali, Z.; Michelson, D.; Ghassemlooy, Z.; Noori, H. A survey of turbulence in underwater optical wireless communications. Optik 2025, 320, 172126. [Google Scholar] [CrossRef]
- Davis, G.E. Scattering of light by an air bubble in water. J. Opt. Soc. Am. 1955, 45, 572–581. [Google Scholar] [CrossRef]
- Al-Imran; Chowdhury, M.Z.; Joha, M.I.; Rahman, M.M.; Kabir, M.S.; Jang, Y.M. Machine learning and deep learning in VLC systems: A comprehensive survey. IEEE Open J. Commun. Soc. 2025, 6, 7955–8006. [Google Scholar] [CrossRef]
- Zhao, X.; Qi, Z.; Pompili, D. Link adaptation in underwater wireless optical communications based on deep learning. Comput. Netw. 2024, 242, 110233. [Google Scholar] [CrossRef]
- Salama, W.M.; Aly, M.H. Improved channel estimation for underwater wireless optical communication OFDM systems by combining deep learning and machine learning models. Opt. Quantum Electron. 2025, 57, 181. [Google Scholar] [CrossRef]
- Skoog, R.A.; Banwell, T.C.; Gannett, J.W.; Habiby, S.F.; Pang, M.; Rauch, M.E.; Toliver, P. Automatic identification of impairments using support vector machine pattern classification on eye diagrams. IEEE Photon. Technol. Lett. 2006, 18, 2398–2400. [Google Scholar] [CrossRef]
- Islam, M.Z.; Abele, E.; Hossain, F.F.; Ahmad, A.; Ekin, S.; O’Hara, J.F. Free-space optical channel turbulence prediction: A machine learning approach. IEEE Commun. Lett. 2025, 29, 1126–1130. [Google Scholar] [CrossRef]
- Mobley, C.D. Light and Water: Radiative Transfer in Natural Waters; Academic Press: San Diego, CA, USA, 1994. [Google Scholar]
- Haykin, S. Communication Systems, 5th ed.; Wiley: New York, NY, USA, 2009. [Google Scholar]
- Agrawal, G.P. Fiber-Optic Communication Systems; Wiley: New York, NY, USA, 1997. [Google Scholar]
Figure 1.
Block-diagram representation of the RGB wavelength-division multiplexed UVLC system.
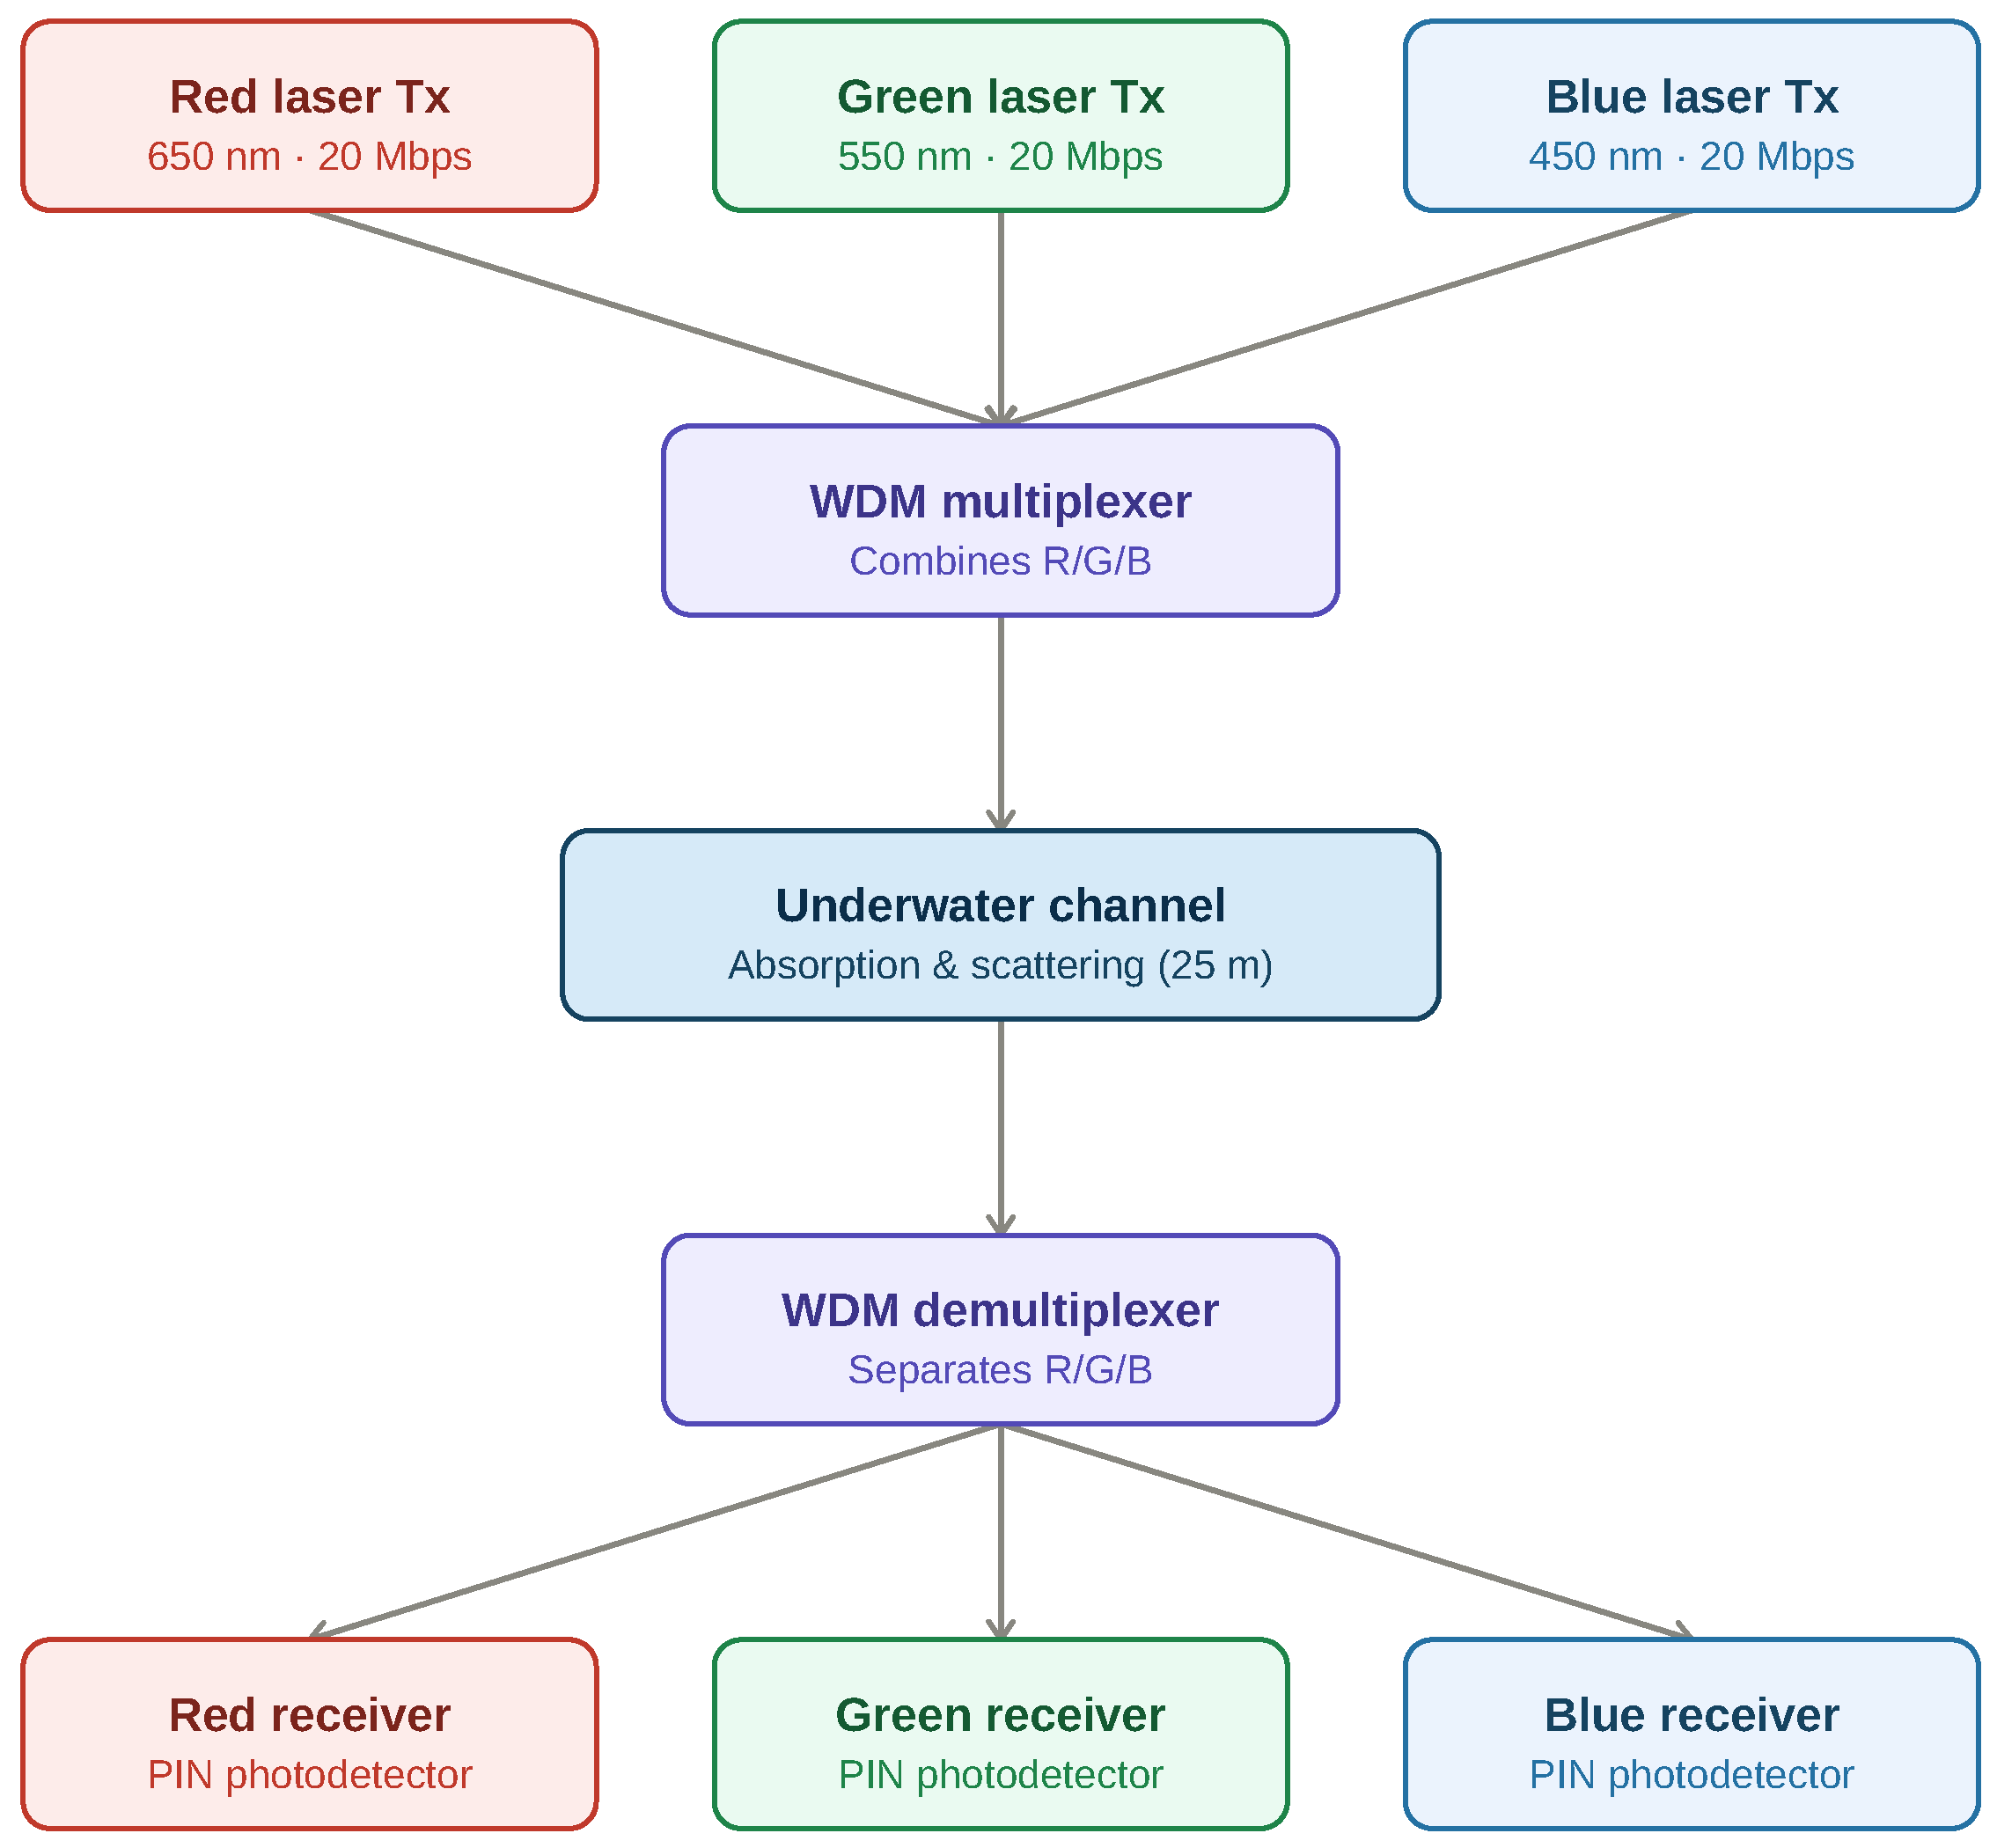
Figure 2.
Eye diagram of the blue channel (450 nm) under (a) pure water and (b) bubble-induced conditions.
Figure 2.
Eye diagram of the blue channel (450 nm) under (a) pure water and (b) bubble-induced conditions.
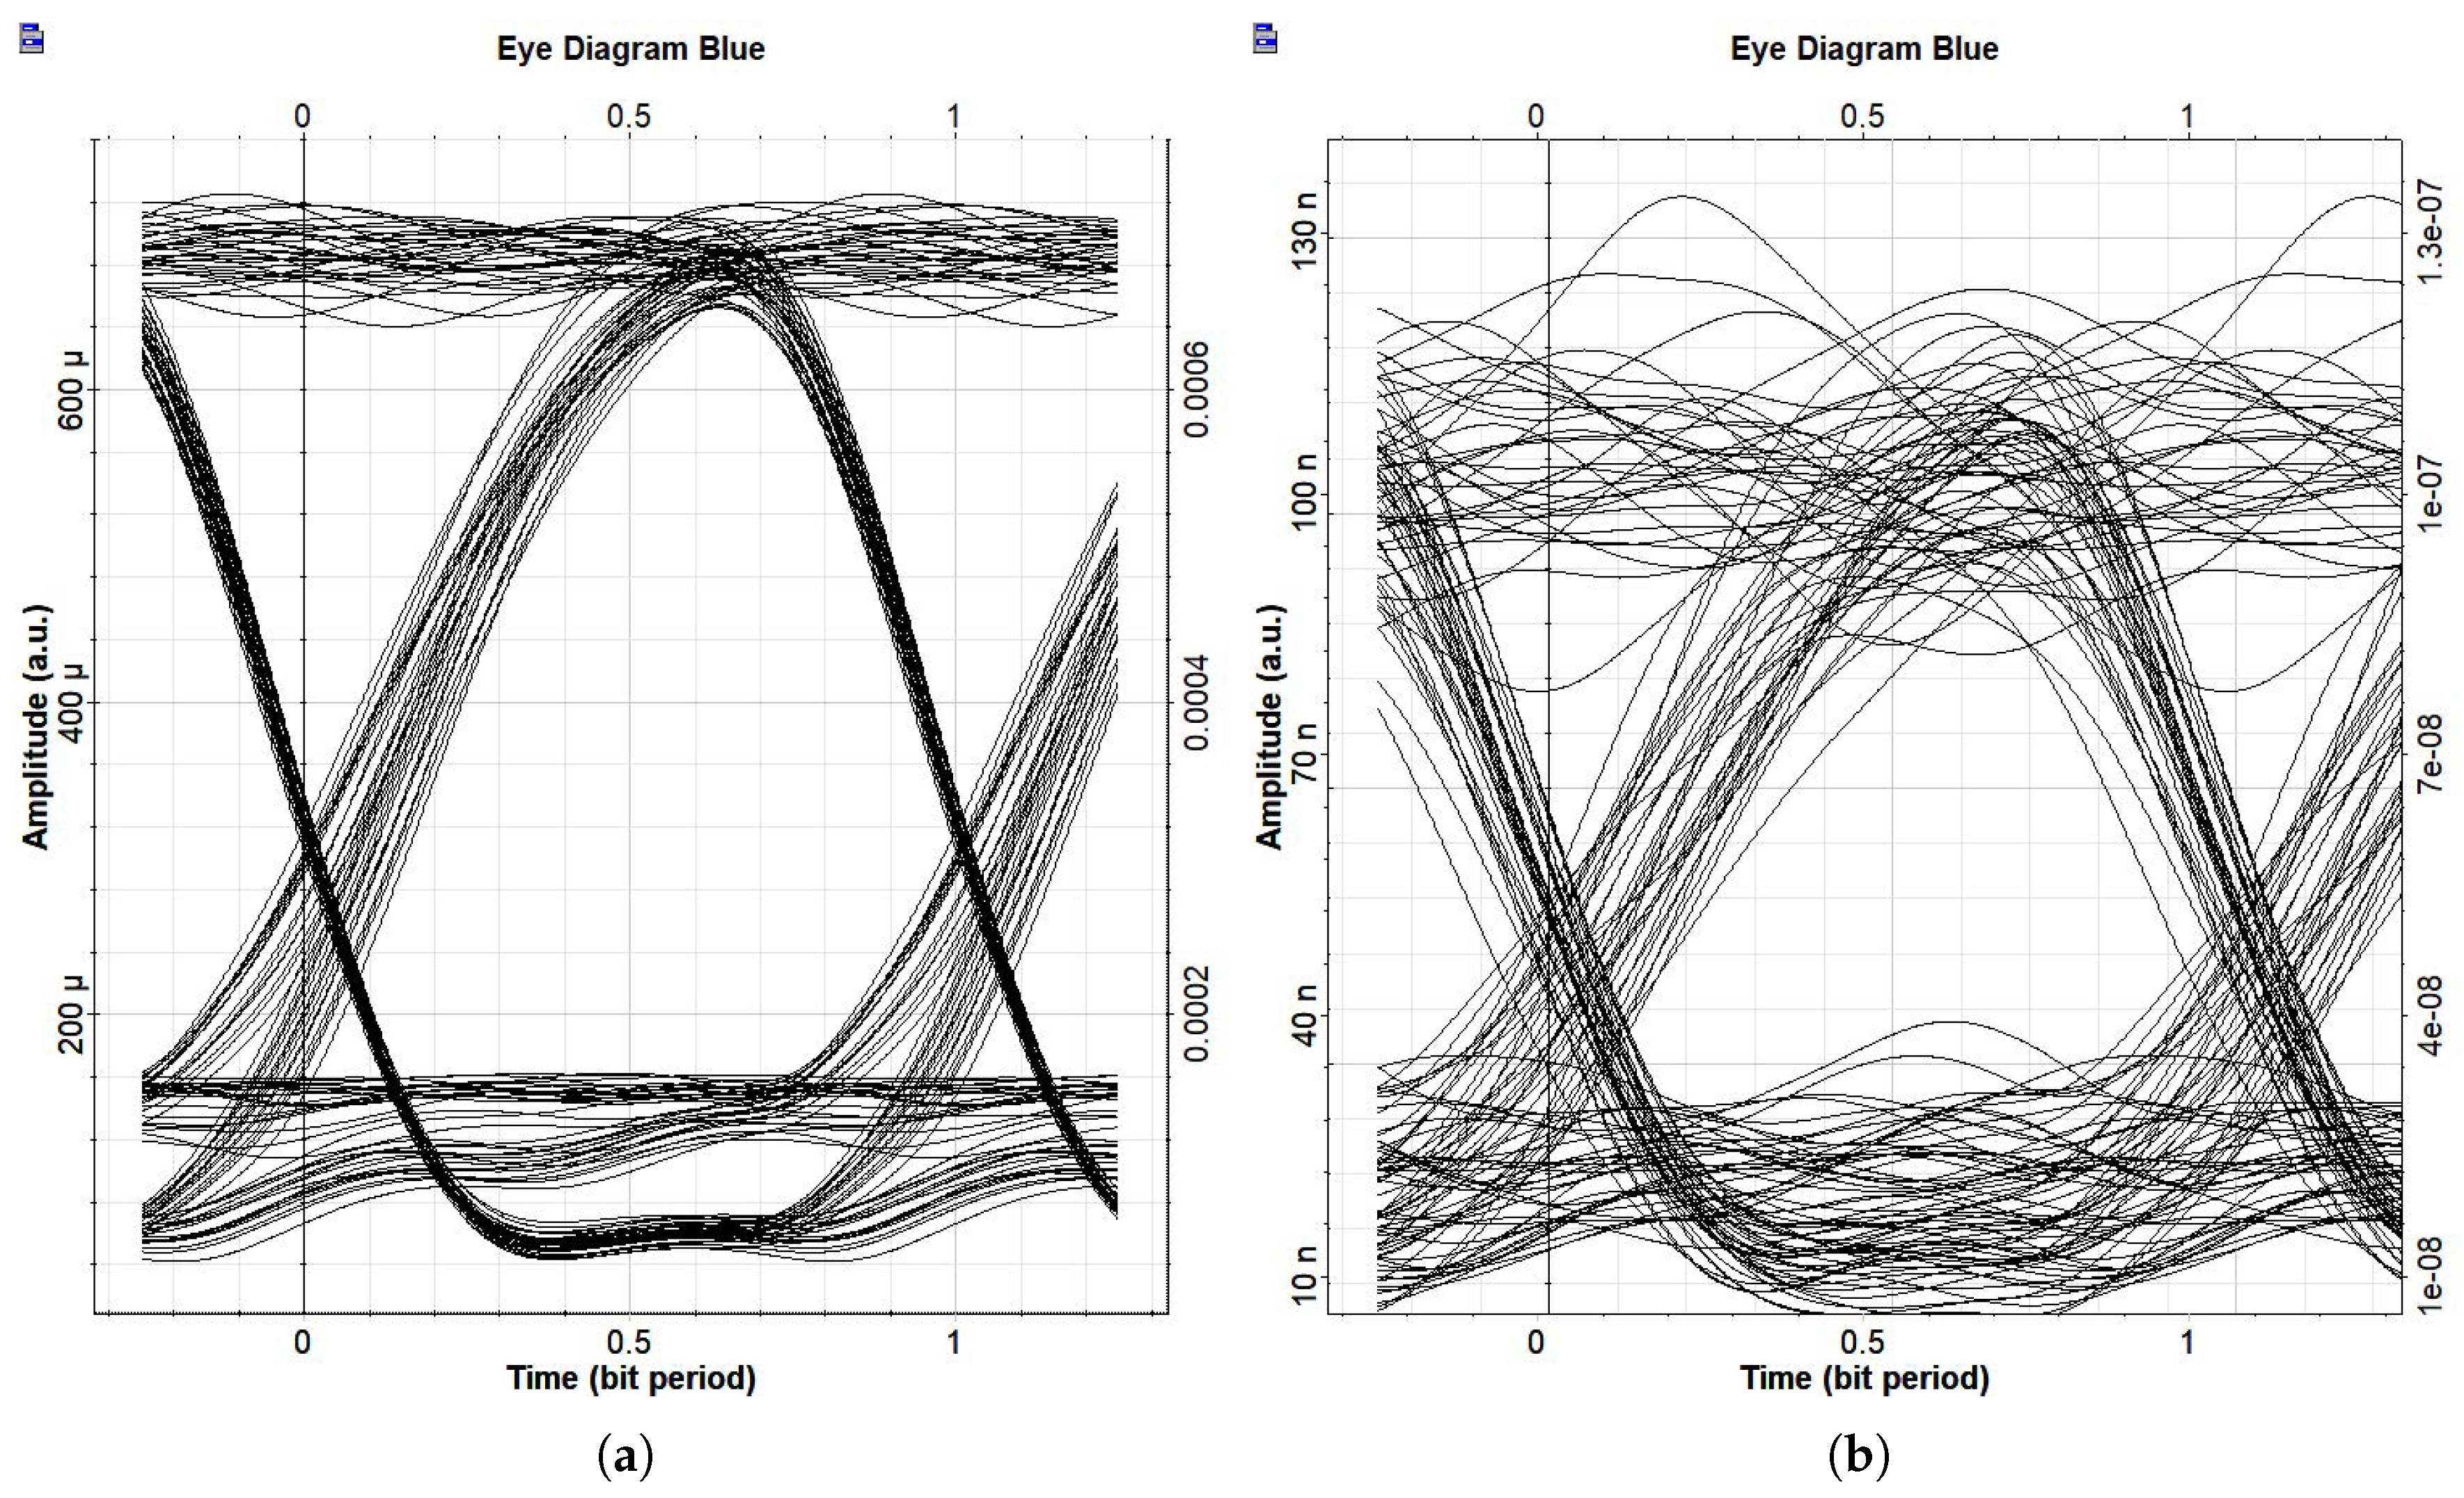
Figure 3.
Eye diagram of the green channel (550 nm) under (a) pure water and (b) bubble-induced conditions.
Figure 3.
Eye diagram of the green channel (550 nm) under (a) pure water and (b) bubble-induced conditions.
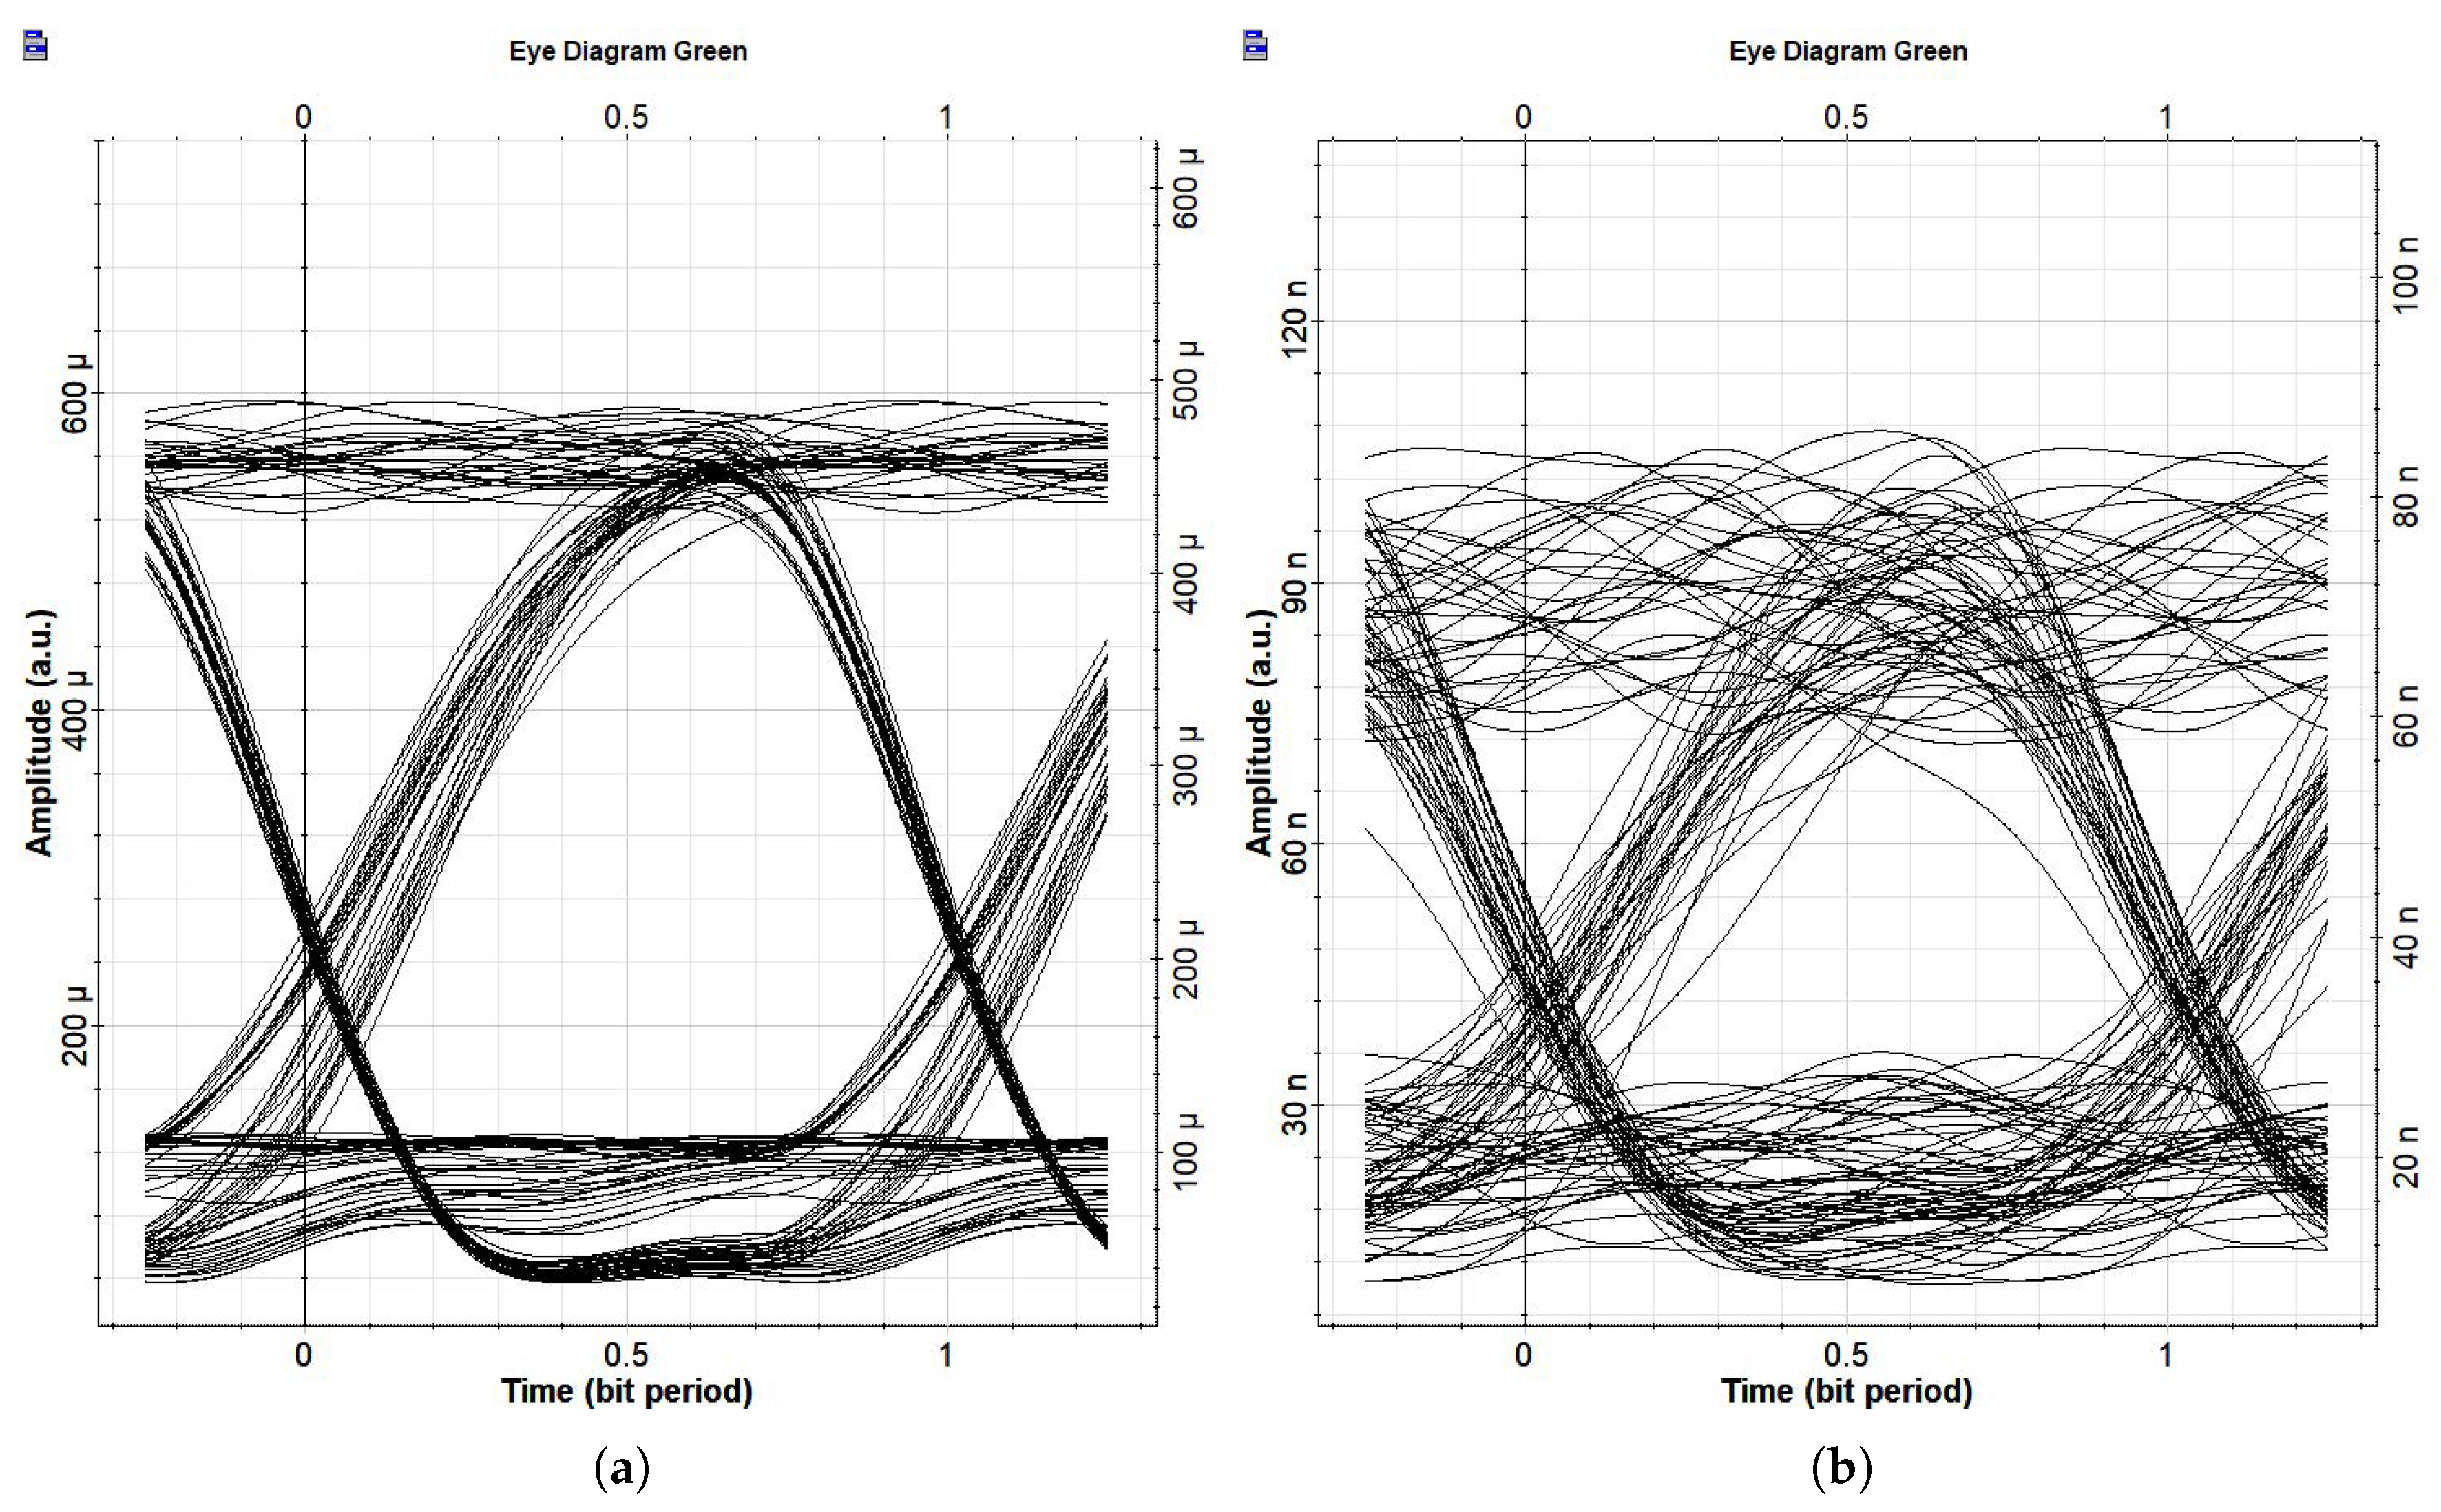
Figure 4.
Eye diagram of the red channel (650 nm) under (a) pure water and (b) bubble-induced conditions.
Figure 4.
Eye diagram of the red channel (650 nm) under (a) pure water and (b) bubble-induced conditions.
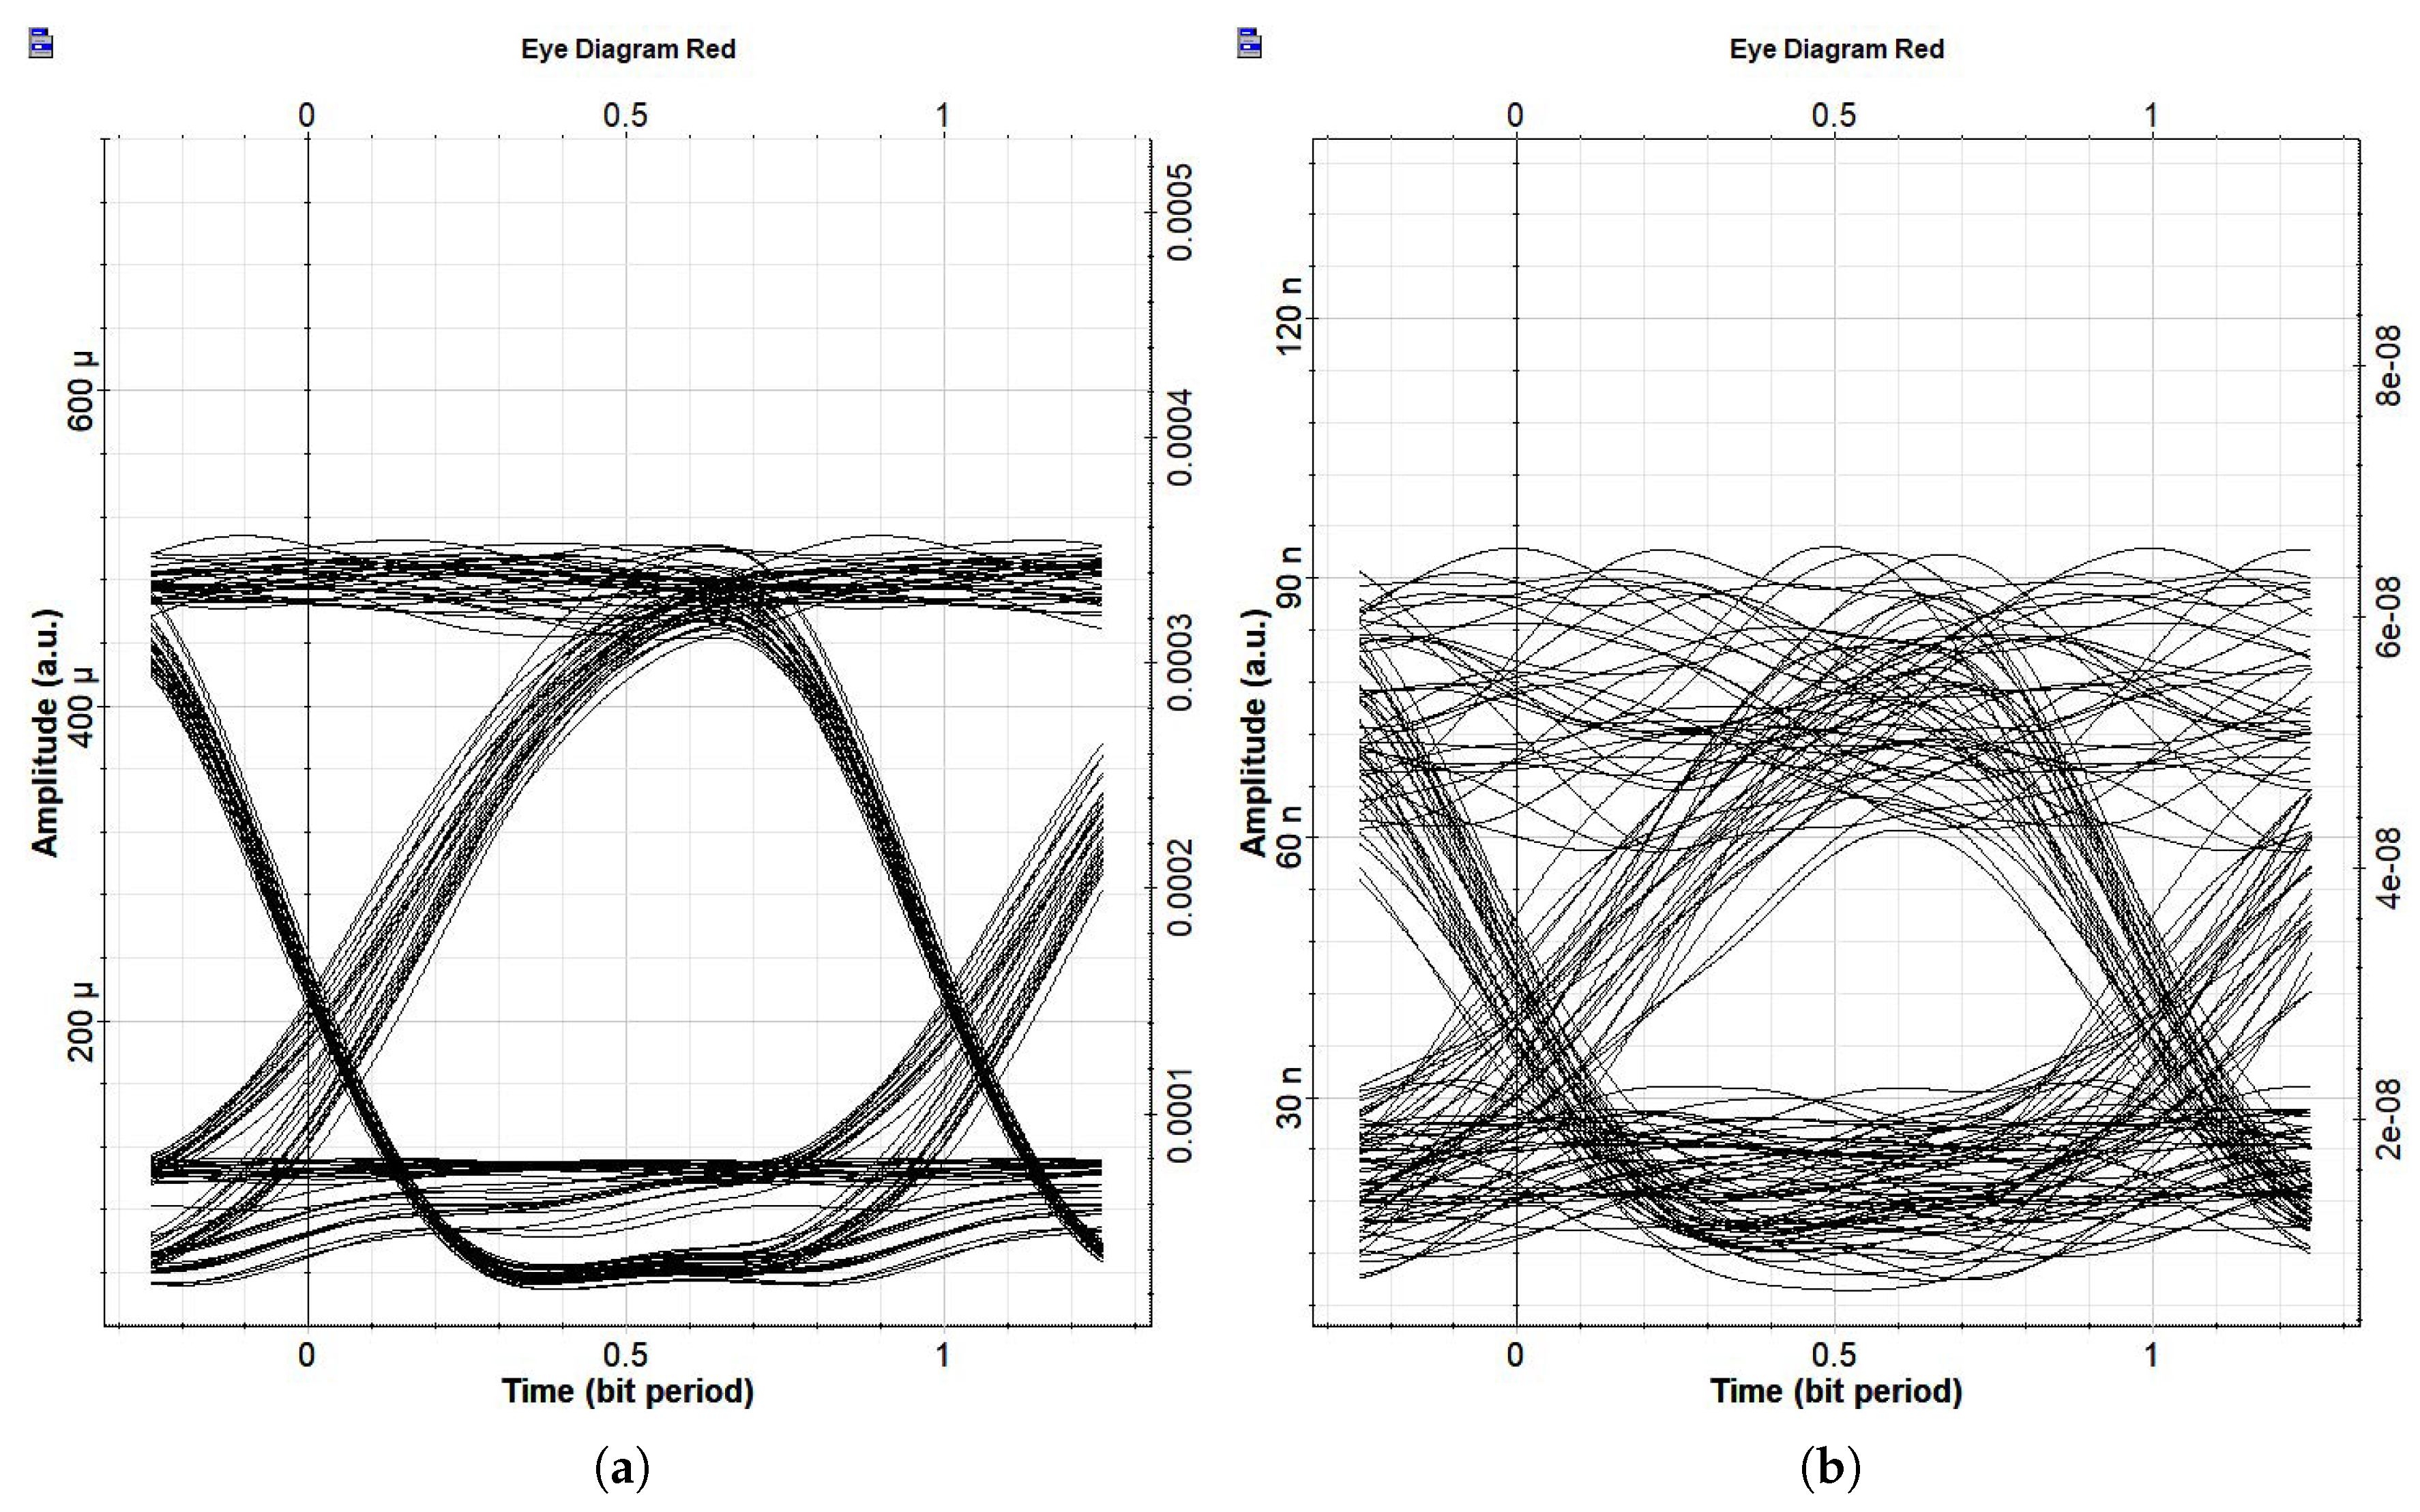
Figure 5.
Received optical power vs. distance under the Beer–Lambert attenuation model (Equation (2)) .
Figure 5.
Received optical power vs. distance under the Beer–Lambert attenuation model (Equation (2)) .
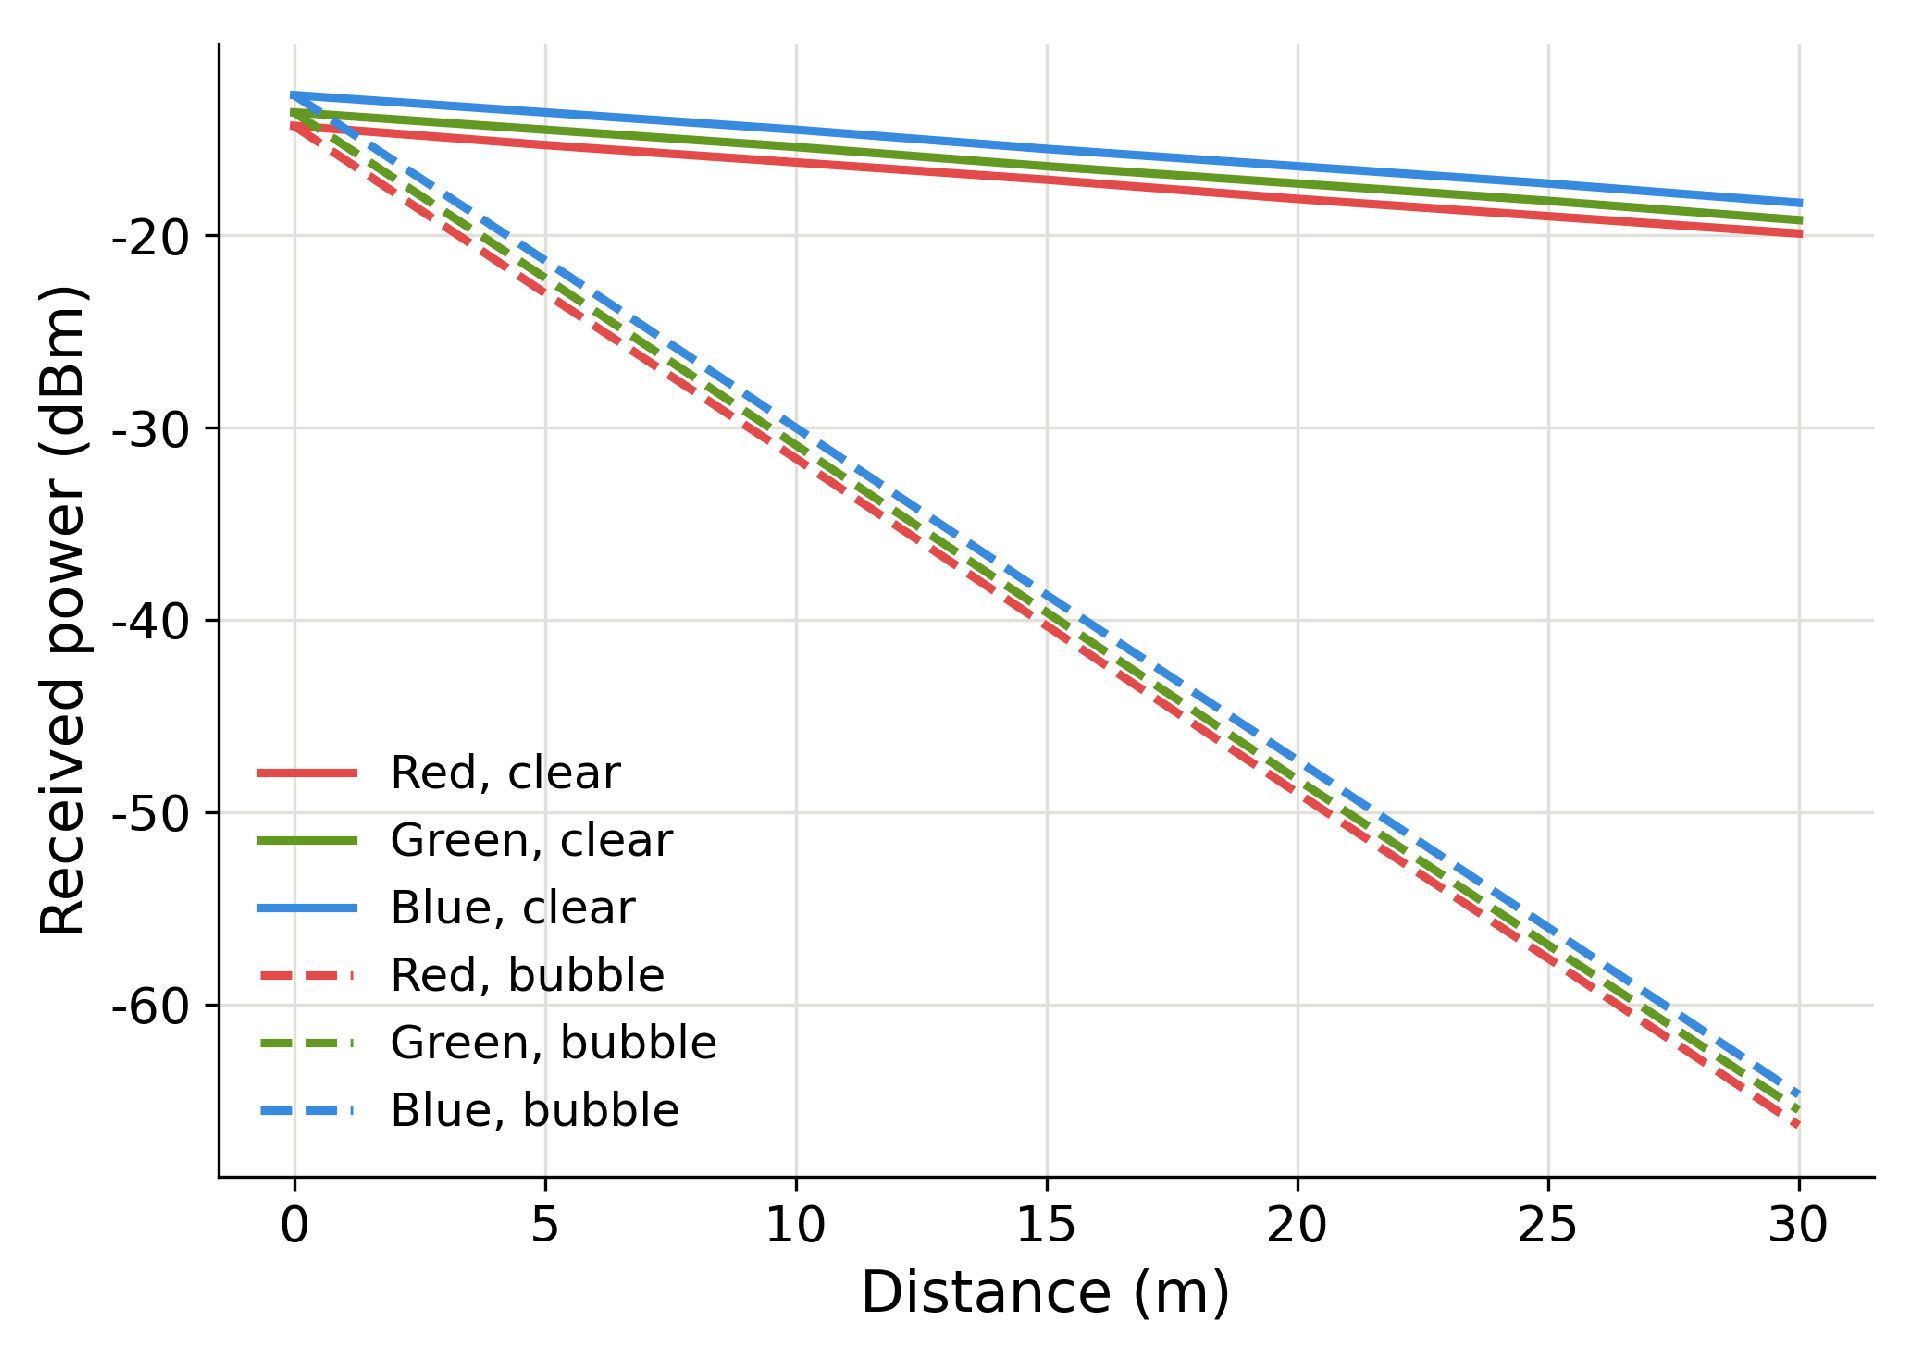
Figure 6.
Q-factor as a function of turbidity level for the red, green, and blue channels.
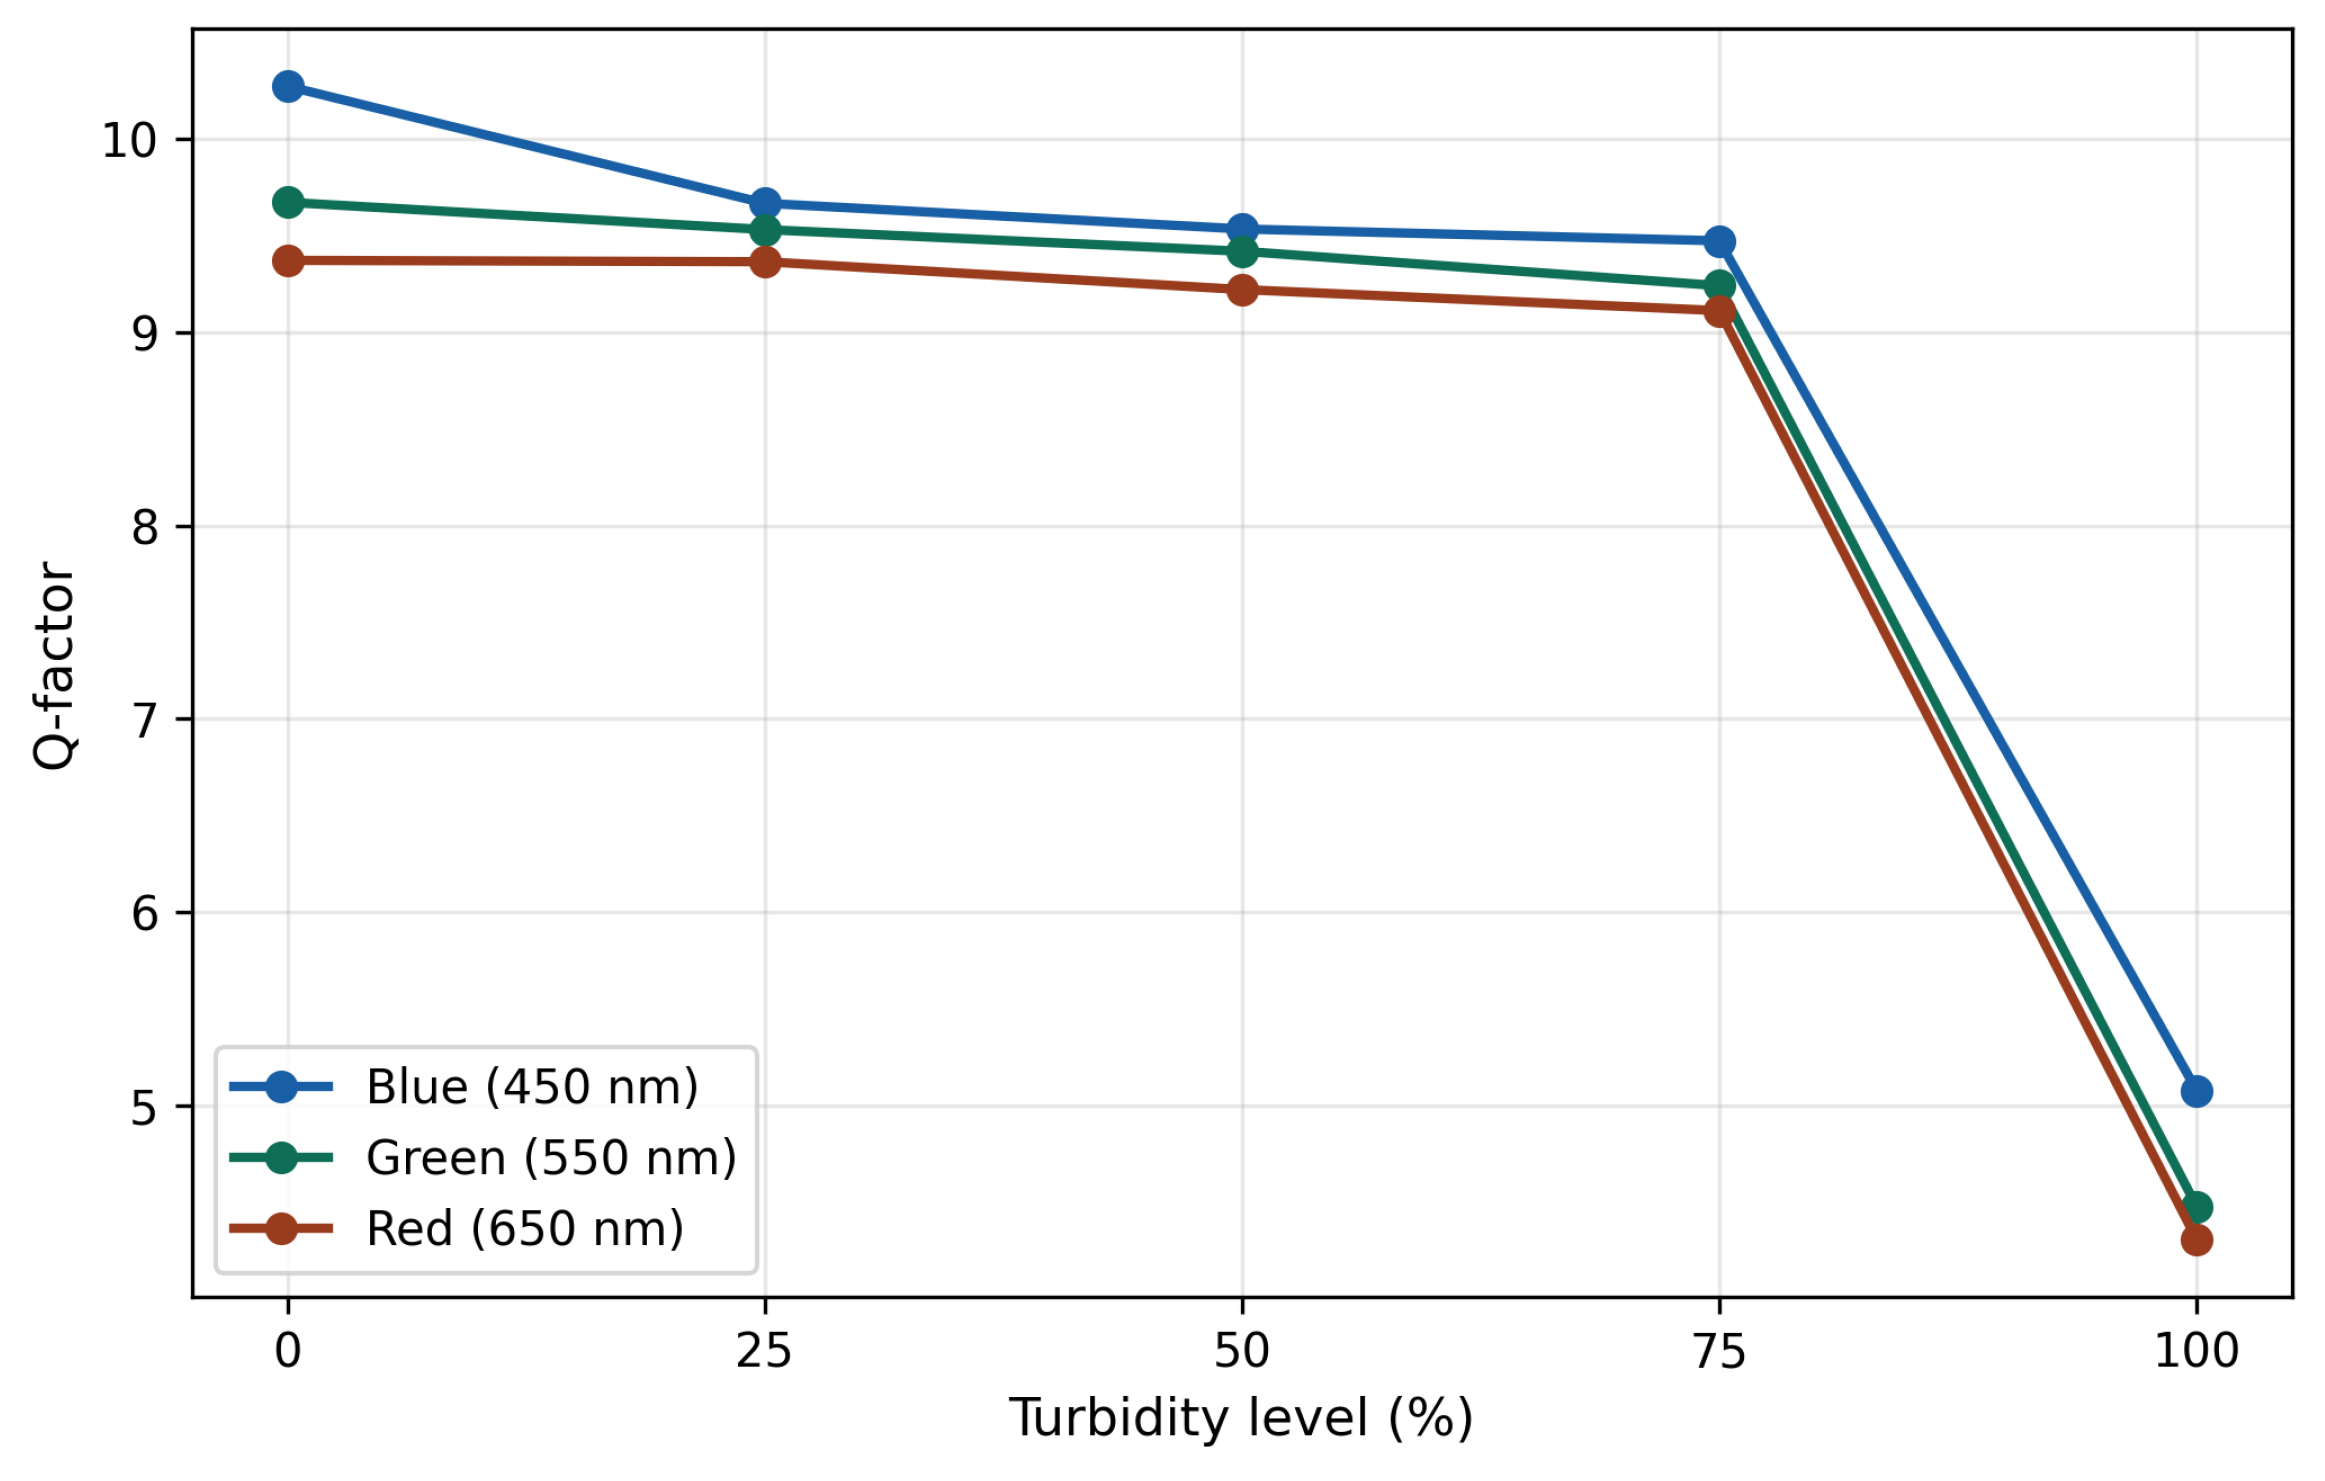
Figure 7.
Computed Mie scattering efficiency for red, green, and blue wavelengths as a function of bubble radius, converging to the geometric-optics limit for radii beyond approximately 10 m.
Figure 7.
Computed Mie scattering efficiency for red, green, and blue wavelengths as a function of bubble radius, converging to the geometric-optics limit for radii beyond approximately 10 m.
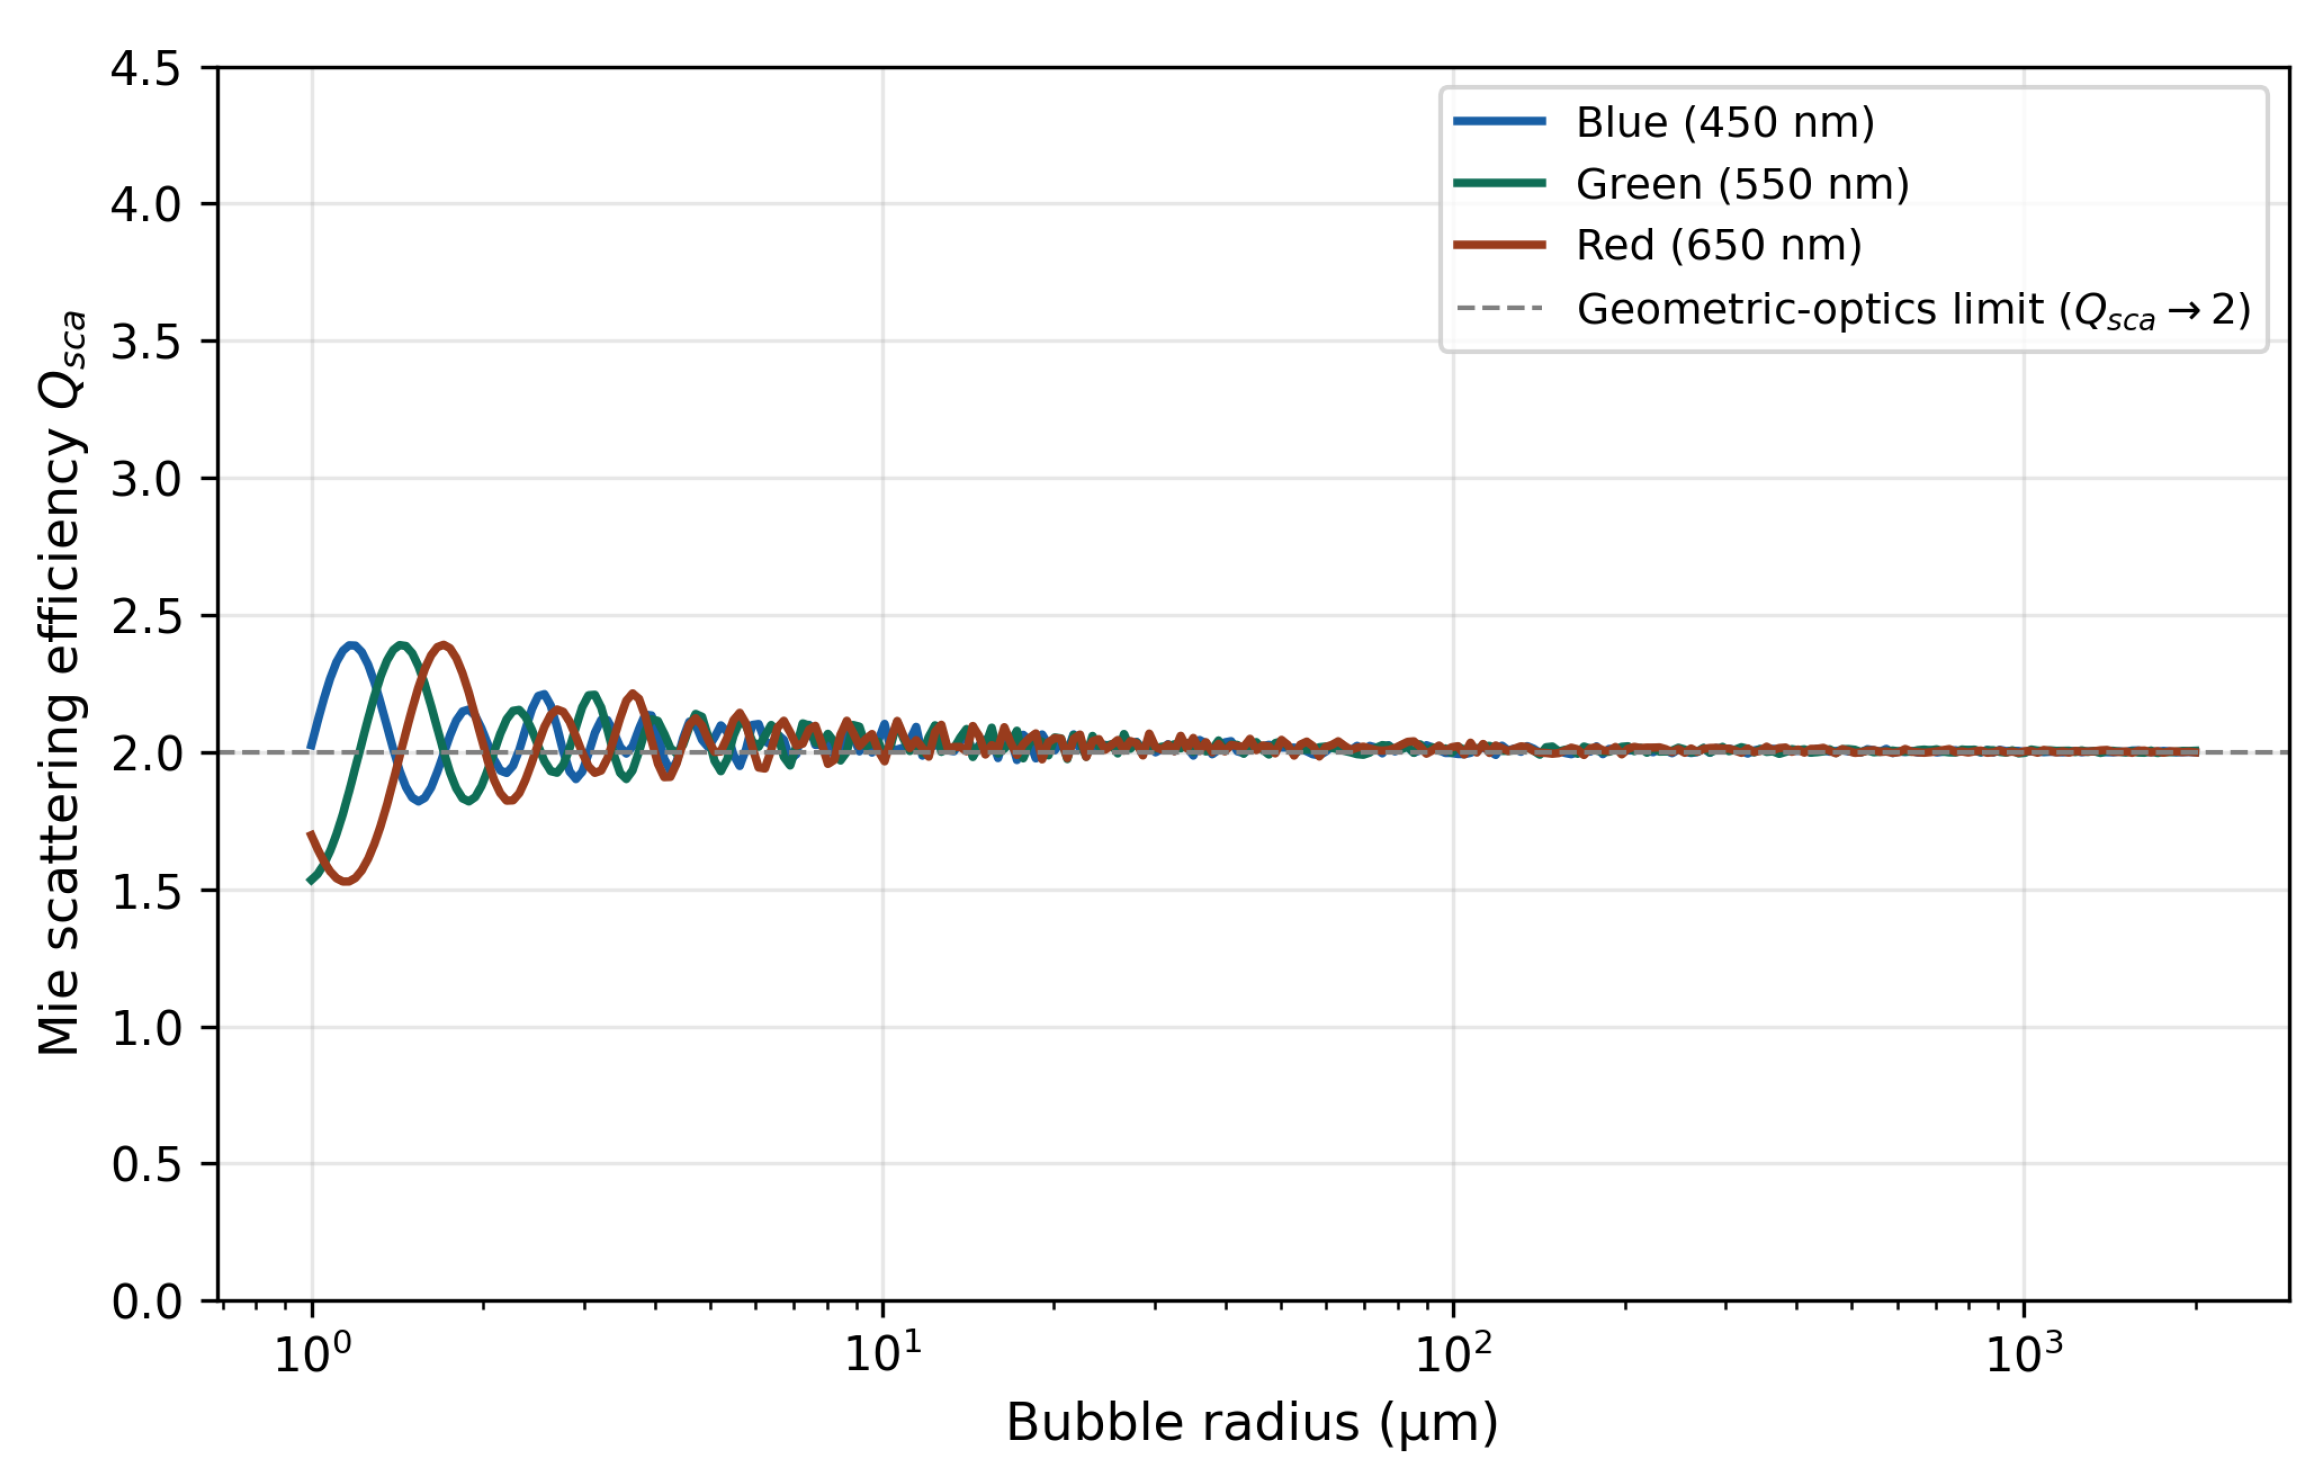
Figure 8.
Confusion matrix for the XGBoost classifier. Rows represent true classes and columns represent predicted classes.
Figure 8.
Confusion matrix for the XGBoost classifier. Rows represent true classes and columns represent predicted classes.
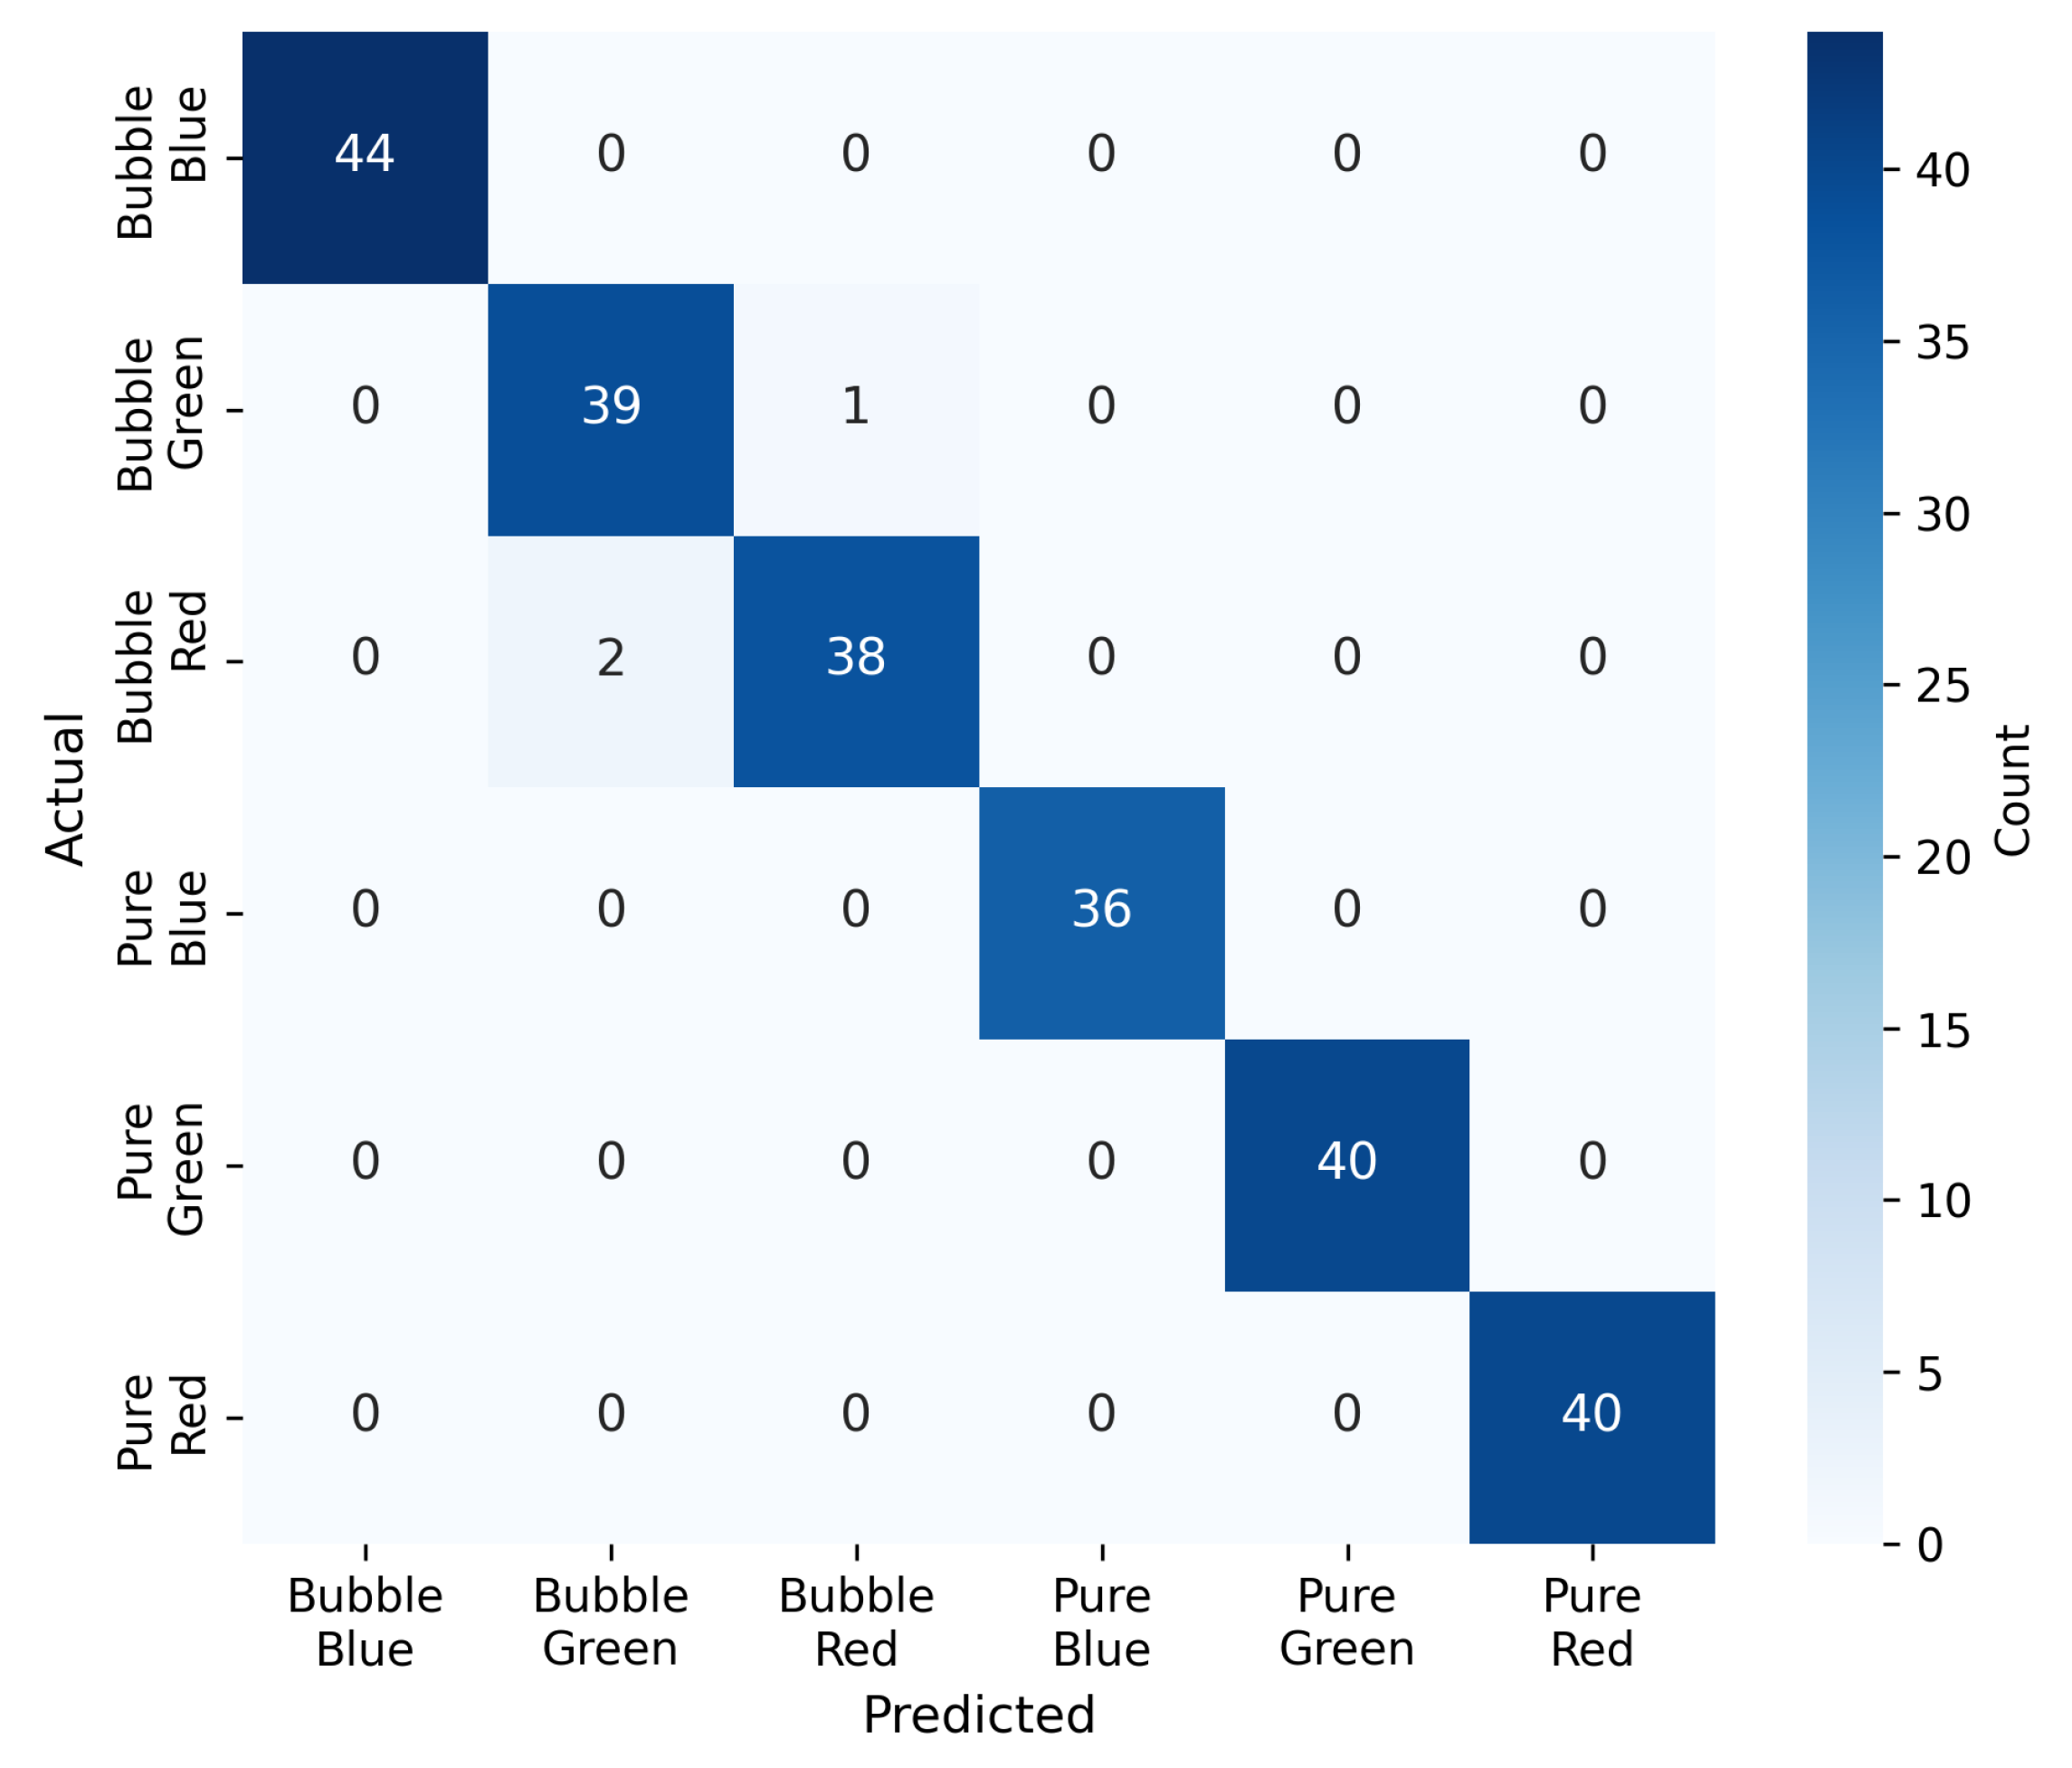
Table 4.
Physical-layer metrics across the turbidity gradient.
| Turbidity | Channel | Q-Factor | BER | Eye Height | SNR (dB) |
|---|---|---|---|---|---|
| 0% (Clear) | Blue | 10.27 | 20.23 | ||
| Green | 9.67 | 19.71 | |||
| Red | 9.37 | 19.43 | |||
| 25% | Blue | 9.665 | 19.70 | ||
| Green | 9.529 | 19.58 | |||
| Red | 9.363 | 19.43 | |||
| 50% | Blue | 9.532 | 19.58 | ||
| Green | 9.417 | 19.48 | |||
| Red | 9.219 | 19.30 | |||
| 75% | Blue | 9.471 | 19.53 | ||
| Green | 9.239 | 19.31 | |||
| Red | 9.110 | 19.19 | |||
| 100% (Bubble) | Blue | 5.08 | 14.12 | ||
| Green | 4.48 | 13.03 | |||
| Red | 4.31 | 12.69 |
Table 5.
Theoretical Shannon channel capacity.
| Condition | SNR (Linear) | Capacity (Gbps) |
|---|---|---|
| Blue-Clear | 105.4 | 5.52 |
| Blue-Bubble | 25.8 | 3.89 |
| Green-Clear | 93.6 | 3.94 |
| Green-Bubble | 20.1 | 2.64 |
| Red-Clear | 87.7 | 3.11 |
| Red-Bubble | 18.6 | 2.06 |
Table 6.
Adaptive power validation: bubble-induced conditions before and after laser current adjustment.
Table 6.
Adaptive power validation: bubble-induced conditions before and after laser current adjustment.
| Condition | Q-Factor | BER | Eye Height | SNR (dB) | ||||
|---|---|---|---|---|---|---|---|---|
| Before | After | Before | After | Before | After | Before | After | |
| Blue-Bubble | 5.08 | 7.959 | 14.12 | 18.02 | ||||
| Green-Bubble | 4.48 | 7.247 | 13.03 | 17.20 | ||||
| Red-Bubble | 4.31 | 6.093 | 12.69 | 15.70 | ||||
Table 7.
Classification performance of the XGBoost model.
| Class | Precision | Recall | F1-Score | Support |
|---|---|---|---|---|
| Bubble-Blue | 1.00 | 1.00 | 1.00 | 44 |
| Bubble-Green | 0.95 | 0.97 | 0.96 | 40 |
| Bubble-Red | 0.97 | 0.95 | 0.96 | 40 |
| Pure-Blue | 1.00 | 1.00 | 1.00 | 36 |
| Pure-Green | 1.00 | 1.00 | 1.00 | 40 |
| Pure-Red | 1.00 | 1.00 | 1.00 | 40 |
| Macro Avg | 0.99 | 0.99 | 0.99 | 240 |
| Weighted Avg | 0.99 | 0.99 | 0.99 | 240 |
Table 8.
Classifier comparison.
| Classifier | Test Accuracy | 5-Fold CV Accuracy |
|---|---|---|
| XGBoost | 98.75% | 97.50% |
| SVM (RBF kernel) | 97.92% | 96.50% |
| Random Forest | 98.33% | 97.00% |
Disclaimer/Publisher’s Note: The statements, opinions and data contained in all publications are solely those of the individual author(s) and contributor(s) and not of MDPI and/or the editor(s). MDPI and/or the editor(s) disclaim responsibility for any injury to people or property resulting from any ideas, methods, instructions or products referred to in the content. |
© 2026 by the authors. Licensee MDPI, Basel, Switzerland. This article is an open access article distributed under the terms and conditions of the Creative Commons Attribution (CC BY) license (http://creativecommons.org/licenses/by/4.0/).
Copyright: This open access article is published under a Creative Commons CC BY 4.0 license, which permit the free download, distribution, and reuse, provided that the author and preprint are cited in any reuse.