

Submitted:
01 September 2026
Posted:
02 September 2026
You are already at the latest version
Abstract
Independent-link and static-relation models cannot adequately represent device sharing, reception competition, and mode scheduling in dynamic multi-platform secondary surveillance radar systems. To study these system-level issues, we designed and implemented Jsimu, a research simulation platform, and evaluated both its model implementation and research capabilities. Jsimu places platform motion, antenna scanning, bidirectional propagation, device-state transitions, and signal-reception decisions on a unified time axis. Root interrogation transactions connect direct and derived paths with stage outcomes, target–scan records, and system metrics. A conservative spatial index improves execution efficiency. The evaluation combined a model-capability coverage assessment, analytically tractable micro-scenarios, controlled-density experiments, comparisons with public data, and paired index tests. Program results agreed with the analytical expectations at dynamic-dwell sampling times and device-state boundaries, and with the defined reception rules at all tested competition-grid points. Layered evidence traced system statistics to individual transactions, propagation paths, and reception decisions. Controlled factor-removal replay further tested the sensitivity of transaction outcomes to specified factors. Scan-level target update rates were comparable in magnitude to published system-level results from MIT Lincoln Laboratory. Published ATC-83 and ATC-84 results also supported, to different degrees, the simulated high-to-low-altitude interrogation-rate ratio and FRUIT-like arrival rates at three receiver thresholds. In the validation scenario, the spatial index reduced candidate checks by approximately 54% and provided a 1.75–2.07× speedup. These results show that Jsimu consistently represents the principal interactions of dynamic multi-platform secondary radar systems. The platform is sufficiently credible for mechanism analysis, system-level performance evaluation, parameter-sensitivity studies, and controlled design comparisons.
Keywords:
secondary surveillance radar
; system-level studies
; simulation platform
; dynamic multi-platform system
; transaction traceability
1. Introduction
Secondary surveillance radar (SSR) is used in a wide range of applications. It supports target surveillance, identification, and information exchange through coordinated interrogation–reply operation [1,2,3]. Civil Mode A/C, Mode S, and airborne collision-avoidance systems differ from military identification friend or foe (IFF) systems in mission, signal format, and equipment. Nevertheless, they share such mechanisms as interrogation scheduling, transponder occupancy, bidirectional propagation, and reception competition. They can therefore be studied as members of the broader class of secondary-radar interrogation–reply systems [1,4,5].
With one interrogator and a small number of targets, an interrogation–reply transaction can be approximated by a simple sequence: interrogation transmission, reception and decoding by the target, reply generation, and reception and decoding at the interrogator. This approximation is insufficient when multiple interrogators, many targets, and several operating modes coexist. A transponder may receive interrogations from different sources within a short interval. A reply receiver may receive several expected or asynchronous replies at the same time. Platform motion and antenna scanning continuously change the geometry, while reflected, scattered, and other derived paths may enter the same reception window with different delays and powers. The success of a complete transaction therefore depends on more than the link parameters of the designated devices. It also depends on surrounding activity, device states, and the order in which the signals arrive [6,7,8,9].
Flight trials and operational data directly reflect real-system behavior. However, sites, airspace, equipment, and safety constraints make it difficult to vary platform counts, deployment patterns, and operating parameters at will. They also limit access to device states and make low-probability concurrent events difficult to reproduce. Statistical performance models can estimate system load from mean interrogation, reply, or occupancy rates, but they provide less information about the process that produced a particular result. System-level studies under different configurations, extreme loads, or complex interference conditions therefore need a simulation platform that follows dynamic platform states and interactions over time. The platform must also support controlled repetition, parameter comparison, and result traceability.
Previous work provides an important basis for SSR system simulation. SISSIM uses an event-driven model to analyze interrogation and reply RF environments and device behavior under specified loads. Its steady-state load analysis uses a fixed spatial configuration of aircraft and ground facilities [8]. ESIT, developed with support from EUROCONTROL, combines statistical and detailed time-based simulation in one environment. It represents interrogations, replies, antenna azimuth, propagation delay, transponder occupancy, and message overlap. In its detailed time-based mode, however, aircraft positions remain fixed, and Mode S targets are assumed to have been acquired and locked out before the simulation begins [9]. Other studies have examined improvements to secondary surveillance through blended surveillance architectures [10]. These studies show that discrete-event and detailed time-based models are effective for analyzing load and competition in interrogation–reply systems. However, a research platform for dynamic multi-platform SSR must go further. It must represent platform motion, target acquisition, competition for shared device resources, and path arrivals within the same continuous simulation process. It must also connect system metrics to the interactions that produced them.
To meet these requirements, we designed and implemented Jsimu, a dynamic multi-platform simulation platform for system-level studies of secondary radar. Its principal implementation method is a traceable global-event process. Dynamic geometry, mode timing, device-resource competition, path arrivals, and reception decisions are handled within one run. Jsimu also provides an integrated workflow for scenario configuration, controlled execution, and result trace-back. Table 1 compares its principal features with those of publicly documented simulation systems.
The principal contributions of this work are as follows:
- Jsimu provides a dynamic multi-platform simulation platform for system-level SSR studies. It represents platform motion, antenna scanning, interrogation and reply propagation, device-resource states, mode scheduling, and system statistics within one environment. Its human–machine interface supports the construction, execution, and analysis of complex scenarios.
- A global causal-event model is combined with unified transaction processing for propagation paths and reception competition. Activities on different platforms act on shared device states, while direct signals, derived paths, and asynchronous replies participate in the same reception process.
- A layered evidence chain connects root interrogation transactions to system metrics. Aggregate results can be traced to individual transactions, propagation paths, and reception interactions, and controlled factor-diagnostic replay is supported.
- The platform is evaluated at four levels: rule implementation, system behavior, external comparison, and scaling semantics. A conservative, semantics-preserving spatial index improves execution efficiency for larger scenarios.
2. System-Level Issues in Secondary Radar
The system architecture and operating regime of secondary radar differ from those of conventional primary radar and, to an even greater extent, from those of directional communication systems.
2.1. Bidirectional Transaction Chain and Asymmetric Constraints
Secondary-radar operation comprises two interrelated stages: interrogation and reply. Whether an interrogation arrives and is processed depends on interrogator-antenna coverage, the propagation link, signal-mode compatibility, and the current state of the transponder. The interrogator can identify the resulting reply only if the reply is generated correctly, the return link is adequate, the reply receiver is available, and no other signals arriving at the same time prevent decoding. Interrogations and replies are subject to different constraints in frequency, radiation pattern, power, timing, and reception processing. They therefore cannot be represented by one symmetric link or a single binary connected/disconnected state [1,3,7].
System-performance statistics must reflect these operating characteristics. Interrogation transmissions, decoded interrogations, transmitted replies, decoded replies, and target reports formed within a scan period correspond to distinct statistical objects. Successful decoding of an interrogation by a target does not guarantee that the reply will be received at the originating site. Conversely, failure of one reply does not necessarily imply that the target will be missed over the entire scan. Unless these levels are distinguished, signal-event counts, transaction success rates, and target update rates can easily be conflated as one performance measure.
2.2. Over-Interrogation, Transponder Occupancy, and Multi-Site Coupling
In airspace covered by multiple interrogators, the same target may receive several interrogations from different platforms within a short interval. Over-interrogation not only increases loading in the interrogation band, but also repeatedly drives the transponder through reception, reply-delay, transmission, and recovery states. A transponder processes valid interrogations in arrival order: the first interrogation to initiate processing occupies the transponder, and subsequent interrogations arriving while the device remains occupied are not processed and receive no reply. Activity from one interrogation source can therefore change the effective outcome of another. This coupling depends on the arrival order of the interrogation signals and on the device state, rather than solely on the mean interrogation rate of an individual interrogator [1,6,8,9].
Mode S reduces unnecessary all-call replies through target acquisition, selective addressing, and lockout, but it does not eliminate system coupling. Acquisition requires time, and roll-call interrogations remain constrained by beam dwell, scheduling capacity, and device occupancy. Therefore different interrogators can continue to affect one another [3,6,7]. System capacity should consequently not be expressed simply as the total number of platforms that can be accommodated within a spatial region. It is more appropriately understood as a sustainable service capability under a specified sensor-network structure, target distribution, scanning and scheduling scheme, and performance requirement.
2.3. Reply Garble, Asynchronous Replies, and Derived Propagation Paths
When an interrogator receives replies triggered by its own interrogation, multiple expected replies may overlap in time. For Mode A/C signals, a broadcast interrogation can trigger near-simultaneous replies from several targets, and the overlapping signals may cause synchronous garble, pulse interleaving, or false triggering. The result produced by the reply receiver depends on the arrival-time difference, signal-to-interference ratio, and processing algorithm. A receiver with stronger processing capability may still identify or separate some partially overlapping replies [8,11,12].
Replies triggered by other interrogators may also arrive at the current interrogator’s reply receiver, where they constitute false replies unsynchronized in time (FRUIT) [13]. These asynchronous replies increase the received load in the reply band and may compete with the expected replies from the local interrogation.
Reflection, scattering, sea-surface two-ray propagation, and other propagation phenomena may alter signal power or introduce additional delay. A power correction changes the link margin relative to the reception threshold, whereas a path with resolvable additional delay may form a new arrival that participates in reply triggering, device occupancy, or reception competition. A system-level simulation does not require an explicit electromagnetic-field model, but it must distinguish effects that modify the attributes of an existing path from those that generate an independent arrival. Otherwise, the correct causal relationships among events cannot be preserved.
2.4. Dynamic Geometry and Nonuniform Local Load
Platform motion and antenna scanning continuously change range, azimuth, elevation, propagation delay, and main-lobe/sidelobe relationships. Even when the total number of targets in the full region is fixed, the number covered by a given beam can vary substantially over time. Under broadcast interrogation, local clustering increases the number of near-simultaneous replies. Under selective interrogation, the local target count directly affects whether scheduling can be completed within one dwell. Mean spatial density or total platform count is therefore insufficient to characterize system stress on its own; local beam density, site visibility, and temporal distribution are also important [8,9].
Dynamic geometric relationships among targets also preclude representation of system performance and metrics by fixed relationships. The platform position, antenna pointing, and device state applicable to a signal interaction must be determined jointly from the system state at the time of transmission or signal arrival.
2.5. Requirements for the Simulation Platform
A dynamic simulation platform for these system-level studies must answer at least the following questions:
- How should interrogation and reply relationships be determined at event time under platform motion and different antenna-scanning conditions?
- How should signals from different interrogation sources compete for shared transponder and receiver resources in their actual order of arrival?
- How should the interrogation and reply links, propagation-power corrections, and additional signals with independent delays be represented separately?
- How should overlap, capture, and separation caused by expected replies, FRUIT, and derived paths be jointly decided within one reception window?
- How should signal events be progressively aggregated into transaction outcomes, target–scan results, and system-load metrics?
- How can execution remain reproducible, results remain comparable, and causes remain traceable under stochastic modeling and large-scale computation?
3. Design of the Dynamic Multi-Platform SSR Simulation Platform
3.1. Modeling Levels and Overall Structure
Jsimu is designed for system-level studies of secondary radar. It explicitly models platform motion, antenna pointing, bidirectional propagation, signal timing, device-resource states, reception competition, and scheduling policies. RF front ends, IQ sampling, physical modems, cryptographic authentication, and equipment-specific algorithms are represented at a higher level through power, threshold, duration, probability, and state parameters. This scope allows Jsimu to study interactions among multiple sites, targets, and operating modes while retaining the parameter control required for repeatable experiments.
The platform combines a protocol-independent event-processing framework with mode-specific constraints. A/C-like, Mode S-like, IFF-like, and user-defined signals share the same models of platform motion, propagation, device states, reception windows, and evidence. Their signal formats, compatibility relationships, reply timing, and scheduling rules are configured separately.
Let the simulation state at time be
where denotes platform positions and motion states, denotes devices and their resource states, denotes active reception windows and path interactions, and is the set of pending events. At run time, the scenario input specifies , signal and policy parameters, and a random seed; the global-event kernel then advances . As shown in Figure 1, the upper level specifies the dynamic-geometry, mode-timing, propagation-and-reception, and device-resource constraints that the model must obey. The middle level shows how these constraints enter unified events, shared states, and transaction aggregation. The lower level provides traceable process evidence, relationship/scan results, and data statistics.
3.2. Dynamic Multi-Platform and Device Models
3.2.1. Platform–Device Relationships
A platform represents a physical carrier with a spatial position and motion state. A device represents an interrogator, transponder, or reply receiver mounted on a platform. One platform may carry multiple devices, whereas each device is mounted on only one platform and maintains a unique operating state throughout the scenario. Whenever event processing requires spatial or motion information for a device, its position, heading, and antenna state at the event time are obtained from its parent platform.
The interaction between an interrogator and a transponder is not represented as a predefined connection. When an interrogation-transmission or signal-arrival event occurs, the model separately determines the possible interrogation and reply relationships from the platform positions, antenna pointing, radio line of sight, device states, and mode compatibility at that time. As the platforms move and the antennas scan, an interaction may be established or lost between the same pair of devices at different times. This prevents a fixed network relationship at the initial instant from being substituted for the entire simulation process.
Platform trajectories are specified as time-stamped sequences of three-dimensional positions, with linear interpolation between adjacent trajectory points. From the platform latitude, longitude, and altitude at the event time, the model calculates slant range, azimuth, elevation, propagation delay, and radio line of sight; the last uses a configurable effective-Earth-radius approximation [14]. Platform motion is driven by external trajectories. The current model does not solve six-degree-of-freedom flight dynamics or continuous attitude changes.
3.2.2. Signals, Capabilities, and Interrogation Policies
A signal object specifies the protocol, frequency, duration, guard time, reply mapping, reply delay, recovery time, and basic decoding parameters. Device capabilities specify acceptable protocols, interrogation types, addresses, and user-defined capability tags. An interrogation policy determines transmission times, target selection, and the scheduling method. Separating these three types of object allows “signal-format incompatibility”, “ lack of device support”, and “insufficient link conditions” to produce distinct decision criteria.
For an interrogation signal transmitted by device to a candidate transponder , let be its expected arrival time. The deterministic admission condition is
Here, , , and denote the horizontal-beam, radio-line-of-sight, and vertical-beam/altitude constraints, respectively. represents mode, format, and address compatibility, while indicates whether the device can accept a new interrogation. is the uplink received power, and is the effective threshold. Signal reception and decoding must still be completed after admission. Thus, does not imply the success of the complete transaction.
The time of the th scheduled transmission is represented as
where is the scheduling interval and is jitter controlled by the run’s random seed. Periodic broadcast, beam gating, conditional burst, selective-address polling, and multimode scheduling use a common scheduling interface while sharing the interrogator’s transmission resource. A Mode S-like policy additionally retains target-acquisition, roll-call-interrogation, and lockout states, thereby preserving the relationship between all-call discovery and subsequent selective interrogation within the same run.
3.2.3. Device-Resource States
When processing a valid interrogation, a transponder proceeds through interrogation reception, decoding, reply delay, reply transmission, and post-transmission hold. Let the interrogation-arrival, end-of-interrogation-reception, start-of-reply, and end-of-reply times be , , , and , respectively. The principal intervals are
with
Signal duration determines the actual energy interval of or ; reply delay determines ; and guard and recovery times jointly determine the post-transmission hold interval .
The interrogator’s transmission resource is likewise modeled using signal duration plus the effective guard interval. A platform possessing both interrogation and reply functions is also subject to platform-level conflict constraints. Guard time, scheduling guard, and recovery time are applied as the maximum applicable constraint according to resource ownership; intervals with the same physical meaning are not added repeatedly.
3.3. Global Causal-Event Advancement
3.3.1. Time and Events
An event represents a minimal state transition or decision at a specified simulation time, such as interrogation transmission, signal arrival, completion of reception, reply transmission, or completion of recovery. Internal simulation time is represented in integer nanoseconds as ; this representation does not imply nanosecond-level physical fidelity to the real system.
Each event is written as , where is the timestamp, is a deterministic sequence number, is the processing action, and is the transaction and path context. The sequence number is used only for deterministic arbitration among identical timestamps and is not interpreted as evidence of a physical ordering below the nanosecond scale.
Let be the complete scenario state before event is processed and let be the set of pending events. Event advancement is expressed as
where performs state updates and decisions, and generates derived events whose times are no earlier than . Events such as completion of reception, transmission, and recovery carry active-object tokens. If a token has become invalid by the time its event is executed, that event cannot overwrite a newer state established subsequently.
3.3.2. Cross-Platform Event Generation and Competition
At the start of a run, the platforms, devices, random sources, and global event queue are initialized, and the first scheduled event of each policy is added to the queue. Events are then removed in timestamp–sequence-number order. Each interrogation policy generates only its scheduled transmission events. When a transmission event is executed, the model identifies candidate targets from the platform positions and antenna states at that time and creates an arrival event with an independent propagation delay for every valid candidate. The target transponder’s current state is determined when the interrogation arrives. Reply-delay, reply-transmission, reception-completion, recovery, and other events are generated only after interrogation reception and decoding have been completed. At each event time, the relevant geometry is updated and active tokens are checked. Admission or reception decisions are then made against shared device states, the transaction, path, and reception-window contexts are recorded, and derived events are added to the queue. After the run ends, the complete evidence is aggregated into transaction, relationship, and system statistics.
The current model calculates propagation distance at signal-transmission time and does not perform a second iterative calculation for target motion while the signal is in flight. Multiple interrogations arriving at a transponder within the same nanosecond are not jointly processed at the RF-waveform level; they are arbitrated by deterministic sequence number. These treatments define the time-scale boundary of the Jsimu discrete-event model.
3.4. Path Arrivals and Unified Reception Processing
3.4.1. Event-Based Representation of Paths
A propagation path is represented as
where is the root interrogation-transaction identifier, is the path identifier, and are the source and destination devices, and are the transmission and arrival times, is the received power, and denotes a direct, scattered, or other path type. Propagation delay, antenna gain, free-space loss, system loss, and applicable environmental corrections are calculated separately for the interrogation and reply directions [14,15].
The model divides environmental effects into two classes. Effects in the first class modify only the power and decoding conditions of the current path; examples include system-level sea-surface two-ray propagation loss and some low-elevation effects. Effects in the second class have independent additional delay and power and therefore generate new arrival events; examples include equivalent point scattering and delayed reply replicas. Both classes may alter the subsequent transaction outcome, but only the second introduces a new received signal.
3.4.2. Competition Decisions Within a Reception Window
A signal triggered by the current interrogation and returned to the reply receiver at the same site is marked as an expected reply. A signal triggered by another interrogation and arriving at that receiver is marked as an asynchronous reply or FRUIT-like arrival. Both types, together with derived paths, use the same reception windows and threshold processing; none bypasses competition because of its source.
Let the occupancy interval of reply at the receiver be
In arrival order, let and define and . The model first uses the reception intervals to determine whether two replies overlap. If they do, enhanced separation, capture, and noncaptured overlap are examined in sequence according to their arrival-time difference, power difference, signal formats, and receiver capabilities. The principal decision sequence is
where indicates whether the receiver has enhanced-separation capability, is the minimum separable arrival interval, and is the capture threshold. For noncaptured overlap between A/C-like replies, the model further distinguishes pulse-slot ambiguity, interleaved replies, and false-reply risk using 1.45-s pulse slots, the applicable tolerances, and the 20.3-s framing interval. Whether each branch is enabled and where its boundary lies are determined by receiver capabilities and signal parameters. Jsimu subjects all expected, asynchronous, and derived arrivals to this common decision process and preserves the source and transaction identity of every interaction.
The same root transaction may produce multiple successfully decoded replicas along different paths. After the first valid decoding has been completed, subsequent successful replicas are recorded as duplicate paths and do not increment the transaction-success count. Failed paths are nevertheless retained as participating factors.
3.5. Layered Transaction Evidence and Reproducible Comparisons
Event totals alone cannot explain why a target-data update succeeded or failed. Jsimu uses the root interrogation transaction as the main organizing identifier and represents the evidence using the following hierarchy:
events → paths and reception interactions → interrogation/reply stage outcomes → device relationships and target–scan results → device and system statistics
Let and be the interrogation- and reply-path sets for transaction . Let indicate successful decoding of path , and let indicate that it was not successfully decoded. The indicator function equals 1 when the condition in brackets holds and 0 otherwise. indicates whether at least one interrogation path was successfully decoded. indicates whether at least one path of the resulting reply was successfully decoded. indicates whether the transaction completed both stages. Thus,
This aggregation preserves the meaning of success through at least one valid path while retaining the arrivals, failures, and reception interactions of the other paths. Event-level evidence answers what occurred; path-level evidence identifies which signals participated; stage outcomes identify where a transaction terminated; and relationship- and scan-level evidence forms statistics suitable for system analysis.
The evidence distinguishes direct causes of failure from contributing factors. A direct cause is the condition on which the current stage’s failure decision is based, such as transponder occupancy, a signal below threshold, or noncaptured overlap. A contributing factor can alter power, timing, or a competition relationship without necessarily reversing the result by itself.
A reproducible run stores the normalized input, random seed, software and data-contract versions, model library, event evidence, and statistical definitions. It constructs a stable cross-run transaction identifier from root-source, signal, time, and stage facts. Runs with the same input and random seed should produce identical results. Factor-diagnostic replay removes a specified factor while preserving the run snapshot and random seed. A transaction that changes from failure to success, or from success to failure, indicates sensitivity of the result to that factor.
Figure 2 shows an actual root transaction from a factor-diagnostic scenario. The aggregate failure can be traced back to a reception interaction at RX_COAST_A and its sif_garble decision.
3.6. Interactive Experiment Organization and Human–Machine Interface
Dynamic multi-platform SSR simulation involves multiple classes of object, including platforms, devices, signals, policies, propagation environments, and statistical definitions. Configuration files and aggregate results alone make it difficult to determine whether a complex scenario conforms to the intended experiment. Jsimu therefore treats the human–machine interface as part of the simulation workflow and uses one work environment to organize scenario construction, pre-run checks, simulation control, state observation, result comparison, and evidence trace-back.
The scenario-construction interface jointly represents sites, trajectories, antennas, device capabilities, signals, and interrogation policies through a map, a platform–device hierarchy, and parameter panels; it also displays device relationships and configuration-check results before execution. During a run, the interface presents platform motion, antenna scanning, event progress, and major system metrics. After runs with different parameter sets, results at the device, relationship, transaction, and system levels can be compared under identical statistical definitions. For unusual or representative statistical results, the user can trace back progressively from a system metric to device relationships, root interrogation transactions, propagation paths, reception windows, and individual decisions, thereby relating macroscopic performance changes to the underlying event process.
Figure 3 presents a representative run of an OpenSky real-world traffic scenario. The same workspace displays the spatial traffic distribution, scenario-execution state, target-identification and reply-quality metrics, and diagnostic results for key issues.
The interface normalizes a scenario configuration to form a run snapshot. Simulation, statistical derivation, and factor diagnosis are all performed by the same back-end model. Interactive operations introduce no model parameters independent of the scenario snapshot, and the same snapshot and random seed can be rerun without the interface. The interface thus improves the efficiency of constructing and checking complex scenarios while also supporting controlled experiment organization and navigation through simulation evidence. In this way, Jsimu provides a complete research workflow from model configuration and run observation to result interpretation.
3.7. Spatial Indexing
Event-driven execution avoids traversing the entire simulation scenario at fixed small time steps, but it may still require substantial computation. If a run generates interrogations in a scenario containing potential targets, direct enumeration requires approximately candidate checks. In scenarios with many targets, Jsimu uses a spatial grid and time-bucket index to eliminate devices that clearly cannot participate in the current event before applying the complete geometry, beam, power, capability, and state decisions to the retained candidates.
Let be the set of devices that event may actually involve, the set returned by the index, and the set of all devices. The semantic requirement for candidate pruning is
The index may retain additional candidates but must not omit a device that could affect the result. Moving trajectories are registered in each time bucket using a conservative spatial envelope, and safety margins are added to range and directional queries. When a safe bound cannot be established, the model falls back to a broader candidate set or a complete check.
4. Simulation Platform Validation and System-Behavior Evaluation
4.1. Validation Framework and Statistical Definitions
4.1.1. Validation Levels
To evaluate Jsimu’s ability to represent and study system-level issues, the platform was tested at four levels. Table 2 summarizes the question addressed, the basis for comparison, and the principal results at each level.
Paired simulation experiments used identical scenario geometry, device parameters, and random-seed sets and changed only the independent variable under investigation. All unrelated stochastic-variation parameters were disabled in the rule-implementation boundary tests so that analytical and program results could be compared point by point.
4.1.2. Overall Validation Coverage
The platform’s internal evaluation defined 37 validation items. All 35 applicable items passed; two were classified as not applicable because independent external timing data and semantics for multi-source association were unavailable. The tests covered five areas: antennas, spatial and effective coverage; transmitter and receiver capabilities; signal formats and timing; IFF-like external-data control; and simplified environmental models. In Figure 4, L1 denotes configuration reachability: a configuration enters the intended execution path and produces an observable result. L2 denotes mechanism consistency: event order, state transitions, and decision boundaries conform to the model rules. L3 denotes system-behavior consistency: system outputs vary with key variables in a manner consistent with the expected mechanism or external evidence.
4.1.3. Expected Reply Targets and Target–Scan Statistics
Hereafter, each interrogator–expected-reply-target–scan-cycle combination is defined as one target–scan unit. Let be the set of scan cycles of interrogator , and let be the expected-reply-target set predetermined for scan cycle from the experimental surveillance region, operational range, target activity state, and available signal formats. If at least one interrogation is validly received and decoded by target during that cycle, ; otherwise, it is 0. The target–scan success rate for the interrogation stage is
The denominator is the total number of expected target–scan units, and the numerator is the number of those units in which at least one interrogation was decoded. Thus, is a dimensionless proportion. If, within the same target–scan unit, at least one reply triggered by a valid interrogation is successfully decoded at that site, ; otherwise, it is 0. The complete target–scan update rate is
Both metrics use binary counting by target–scan unit: whether a target succeeds once or several times during a scan cycle, it counts as one successful unit. Results are normally reported by interrogator, and system-wide summaries use an equal-weight mean across sites. Mixed-mode scenarios are additionally grouped by A/C-only targets and Mode S-compatible targets so that differences in target counts do not obscure performance differences between categories.
The target–scan metrics do not distinguish between one success among multiple interrogations and successful reply decoding for every interrogation. The density experiments therefore also measure the reply completion rate per valid interrogation. Let be the set of target-level valid-interrogation records formed by interrogator within the steady-state window. When a broadcast interrogation is decoded by multiple targets, each target forms a separate record. If the reply triggered by record is causally associated with that site and successfully decoded there, ; otherwise, it is 0. The reply completion rate per valid interrogation is
The denominator is the number of target-level valid-interrogation records, and the numerator is the number for which the corresponding reply was successfully decoded at the site. therefore represents reply-stage completion conditional on successful interrogation decoding. represents the proportion of expected targets obtaining at least one complete update in each scan cycle. The two metrics reflect reception-competition intensity and per-scan service capability, respectively. The numbers of reply transmissions, device occupancy events, reception overlaps, FRUIT-like arrivals, and stage-specific failure causes are retained as explanatory data.
4.2. Validation of Core Rule Implementation
4.2.1. Transponder State Shared by Multiple Interrogators
The global causal-event mechanism was checked using a manually verifiable microscopic scenario. The scenario contains two interrogators, and , and one transponder, , shared by them; the arrival times of the two interrogation signals at are controlled directly. Interrogation duration is fixed at 1 s, reply delay at 3 s, reply duration at 20.3 s, and recovery time at 50 s. The decoding probability is set to 1, and jitter, random deviations, scattering, ghost paths, multipath, and interference are disabled. After the first interrogation arrives, the analytical state timeline of is
The transponder therefore becomes available again at
, which denotes the difference between the arrival times of the two interrogations at , is used as the independent variable. The second interrogation is placed in each of the four intervals during which the first transaction occupies the device and at the equality boundary where the device becomes idle again. Interrogation-decoding, reply-transmission, end-of-transmission, and recovery-completion times are extracted from the complete retained event log and compared point by point with the analytical timeline. The results are shown in Table 3 and Figure 5.
4.2.2. Consistency Between Dynamic Geometry and Discrete-Event Sampling
Dynamic geometry was validated with an analytically tractable constant-speed beam-crossing scenario. The continuous beam-dwell interval was calculated independently; theoretical sampling times were then generated from the interrogation period and compared event by event with the program output. The results are shown in Table 4.
For all five dynamic-crossing scenarios, the actual event times and independently derived analytical sampling sets were identical in integer-nanosecond representation. Directional checks were also performed by interrogating moving platforms flying east, north, and west. All three scenarios produced five successful interrogations at the expected azimuths.
4.2.3. Reply-Reception Competition Boundaries
The third microscopic scenario contains one interrogator and two A/C-like reply sources. The power of the first reply is fixed at dBm, and both replies have a duration of 20.3 s. The arrival-time difference of the second reply relative to the first, , and the power difference are swept as independent variables. The capture threshold is fixed at 10 dB, and the minimum separation interval of the enhanced-separation receiver is fixed at 5 s. The pulse-slot interval, tolerance, and framing interval are fixed at 1.45, 0.40, and 20.3 s, respectively.
The experiment forms a two-dimensional parameter grid over
is sampled at 0.25-s intervals and at 1-dB intervals, with the non-overlap boundary at 20.3 s added explicitly. The capture-type and enhanced-separation receivers together produce 8,364 program-decision points. Program classification strictly follows the sequence non-overlap, enhanced separation, capture, and A/C-like structural overlap. The results are shown in Figure 6.
When s and the two replies still overlap in time, the enhanced-separation receiver produces 2,542 enhanced-separation points, substantially reducing the pulse-slot-ambiguity and interleaved-reply regions. When s, both receiver types classify the replies as non-overlapping. The narrow bands in the capture-type receiver plot arise from the 1.45-s slot periodicity and -s tolerance, rather than numerical noise. All 8,364 grid points, as well as nine refined points placed around the capture, separation, pulse-slot, and non-overlap boundaries, agree with the predefined classification.
4.2.4. Closure of the Transaction-Evidence Chain and a Diagnostic Example
A mixed-scheduling validation scenario enables five modes simultaneously; two of them share identical interrogation and reply signals, allowing the test to determine whether signal identifiers incorrectly replace mode identity. The results show that transaction identity remains consistent across eight processing stages, four classes of relationship event, and the aggregate counts for all five modes. The two modes sharing signal definitions are not merged, and every root transaction can be traced across scheduling, bidirectional propagation, decoding, and relationship statistics.
The factor-diagnostic example introduces an equivalent coastal scatterer and fixes the random seed. In the baseline run, an equivalent scattered path enters the reception window and the corresponding reply transaction fails because of SIF garble. When only that scatterer is removed while the scenario snapshot and random seed are held fixed, the failure disappears and the root transaction changes to success. Replaying the baseline reproduces the original result. This result shows that layered evidence can locate an aggregate failure at a particular root interrogation, propagation path, and reception competition, and can analyze sensitivity to a specified factor through controlled replay.
4.3. Controlled Local-Beam-Density and Mixed-Mode Experiments
4.3.1. Research Question and Scenario Design
The independent variable in these controlled scenario experiments is not the total platform count across the entire scenario, but the local number of targets, , simultaneously within the main lobe during one scan. Simply increasing the total aircraft count does not ensure an increase in the instantaneous target density within any interrogator beam, nor does it control the competition among A/C-like broadcast replies at the receiver. A small controlled scenario was therefore designed using the fixed parameters and simulation settings listed in Table 5. Geometric calculations show that, at every statistical sampling time, the azimuthal spread of the 32 designed trajectories relative to any site is no greater than 1.95°, which is less than the 2.45° main-lobe width. Thus,
Sidelobes, scattering, multipath, and external blocking are disabled so that the curves primarily reflect broadcast-reply competition, Mode S-like roll-call scheduling, and the nominal decoding probability.
The three operating-mode conditions are:
- A/C-like only: All targets have A/C-only reply capability, and each interrogator uses A/C-like broadcast interrogation.
- Mode S-like only: All targets have Mode S-compatible reply capability, and each interrogator uses roll-call interrogation after initial acquisition.
- 1:3 mixed mode: The ratio of A/C-only to Mode S-compatible targets is fixed at 1:3, and each interrogator schedules A/C broadcast and Mode S-like roll-call interrogations concurrently.
Mode S-compatible targets can respond to A/C interrogations. The two interrogation classes in the mixed group share transmission resources and scheduling, and all replies enter the same reception windows. The mixed result is therefore not a linear weighted combination of the two single-mode results.
Each scenario contains seven complete scans. Scan 0 is dedicated to staggered Mode S-like target acquisition by the four sites and is excluded from the results. Scans 1–6 constitute the steady-state statistical window.
The 10- or 20-ms values in the table are scheduling periods for different signal modes. One A/C-like period produces one broadcast interrogation. One Mode S-like scheduling slot can arrange mutually non-overlapping roll-call interrogations for multiple acquired targets; equal scheduling periods therefore do not imply equal total numbers of RF interrogations.
4.3.2. Principal Results and Auxiliary Metrics
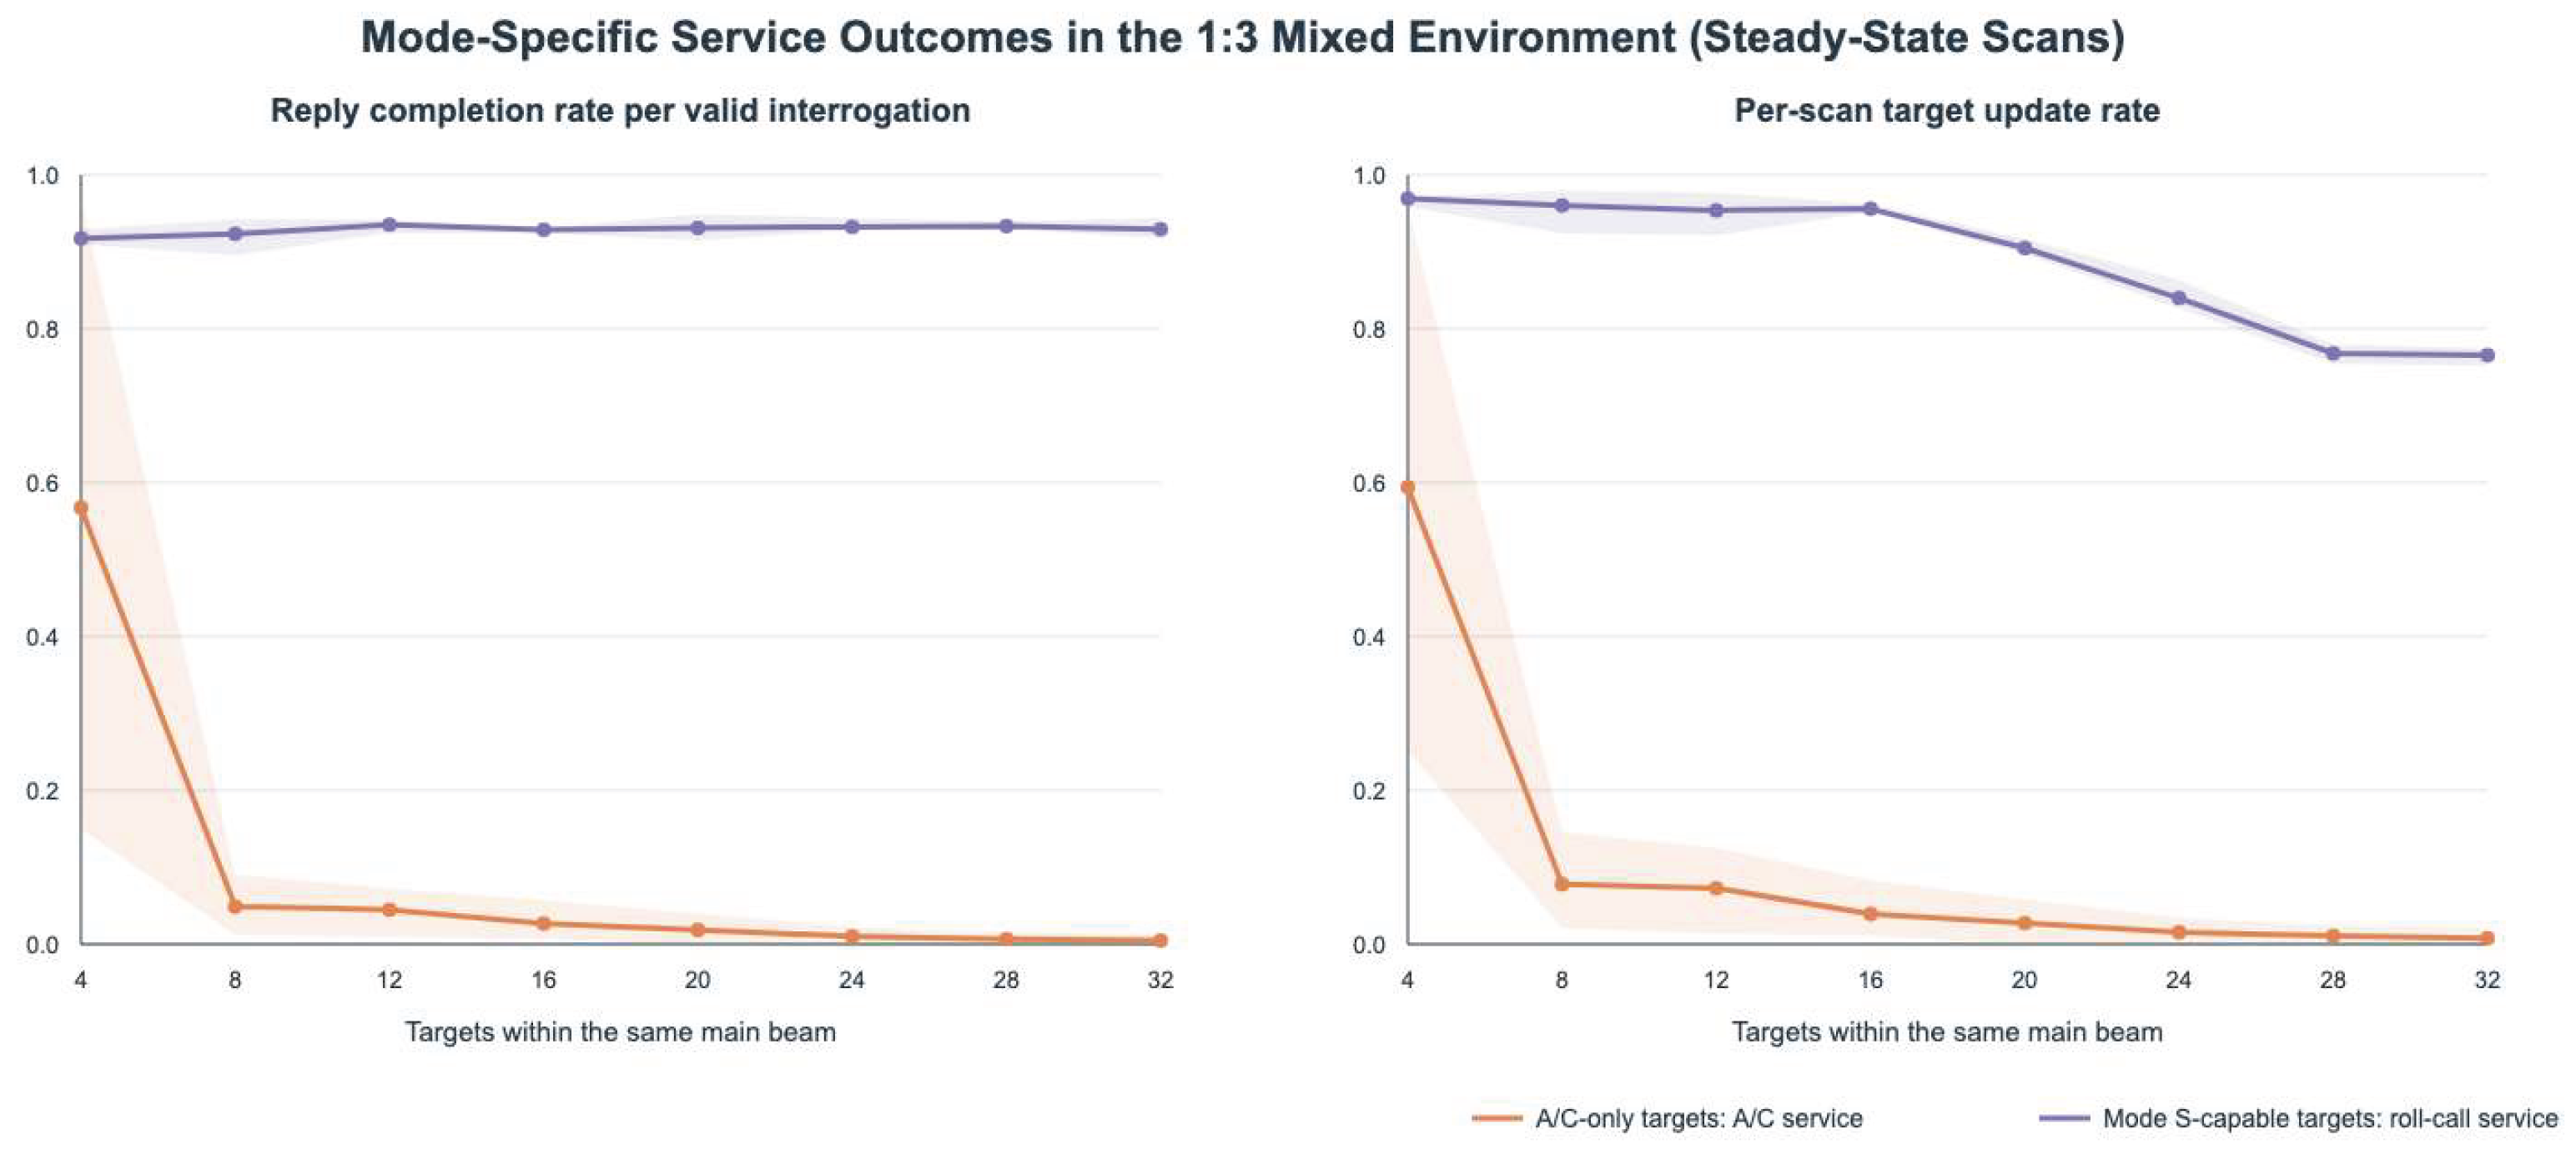
The experiment focuses on two metrics. is the proportion of replies triggered by valid interrogations that are successfully decoded by the receiver at the same site. is the proportion of expected targets that complete at least one interrogation–reply update within each complete scan. The former directly measures reply-reception competition, whereas the latter is also affected by scheduling service capability per scan. Each site is calculated separately before an equal-weight mean is taken across sites. Each curve point is the mean of four sample groups and the shaded region is the minimum-to-maximum range. The four samples in the mixed group use four rotations of the 1:3 capability labels.
Figure 7.
Reply completion rate per valid interrogation and per-scan target update rate under controlled local beam density.
Figure 7.
Reply completion rate per valid interrogation and per-scan target update rate under controlled local beam density.
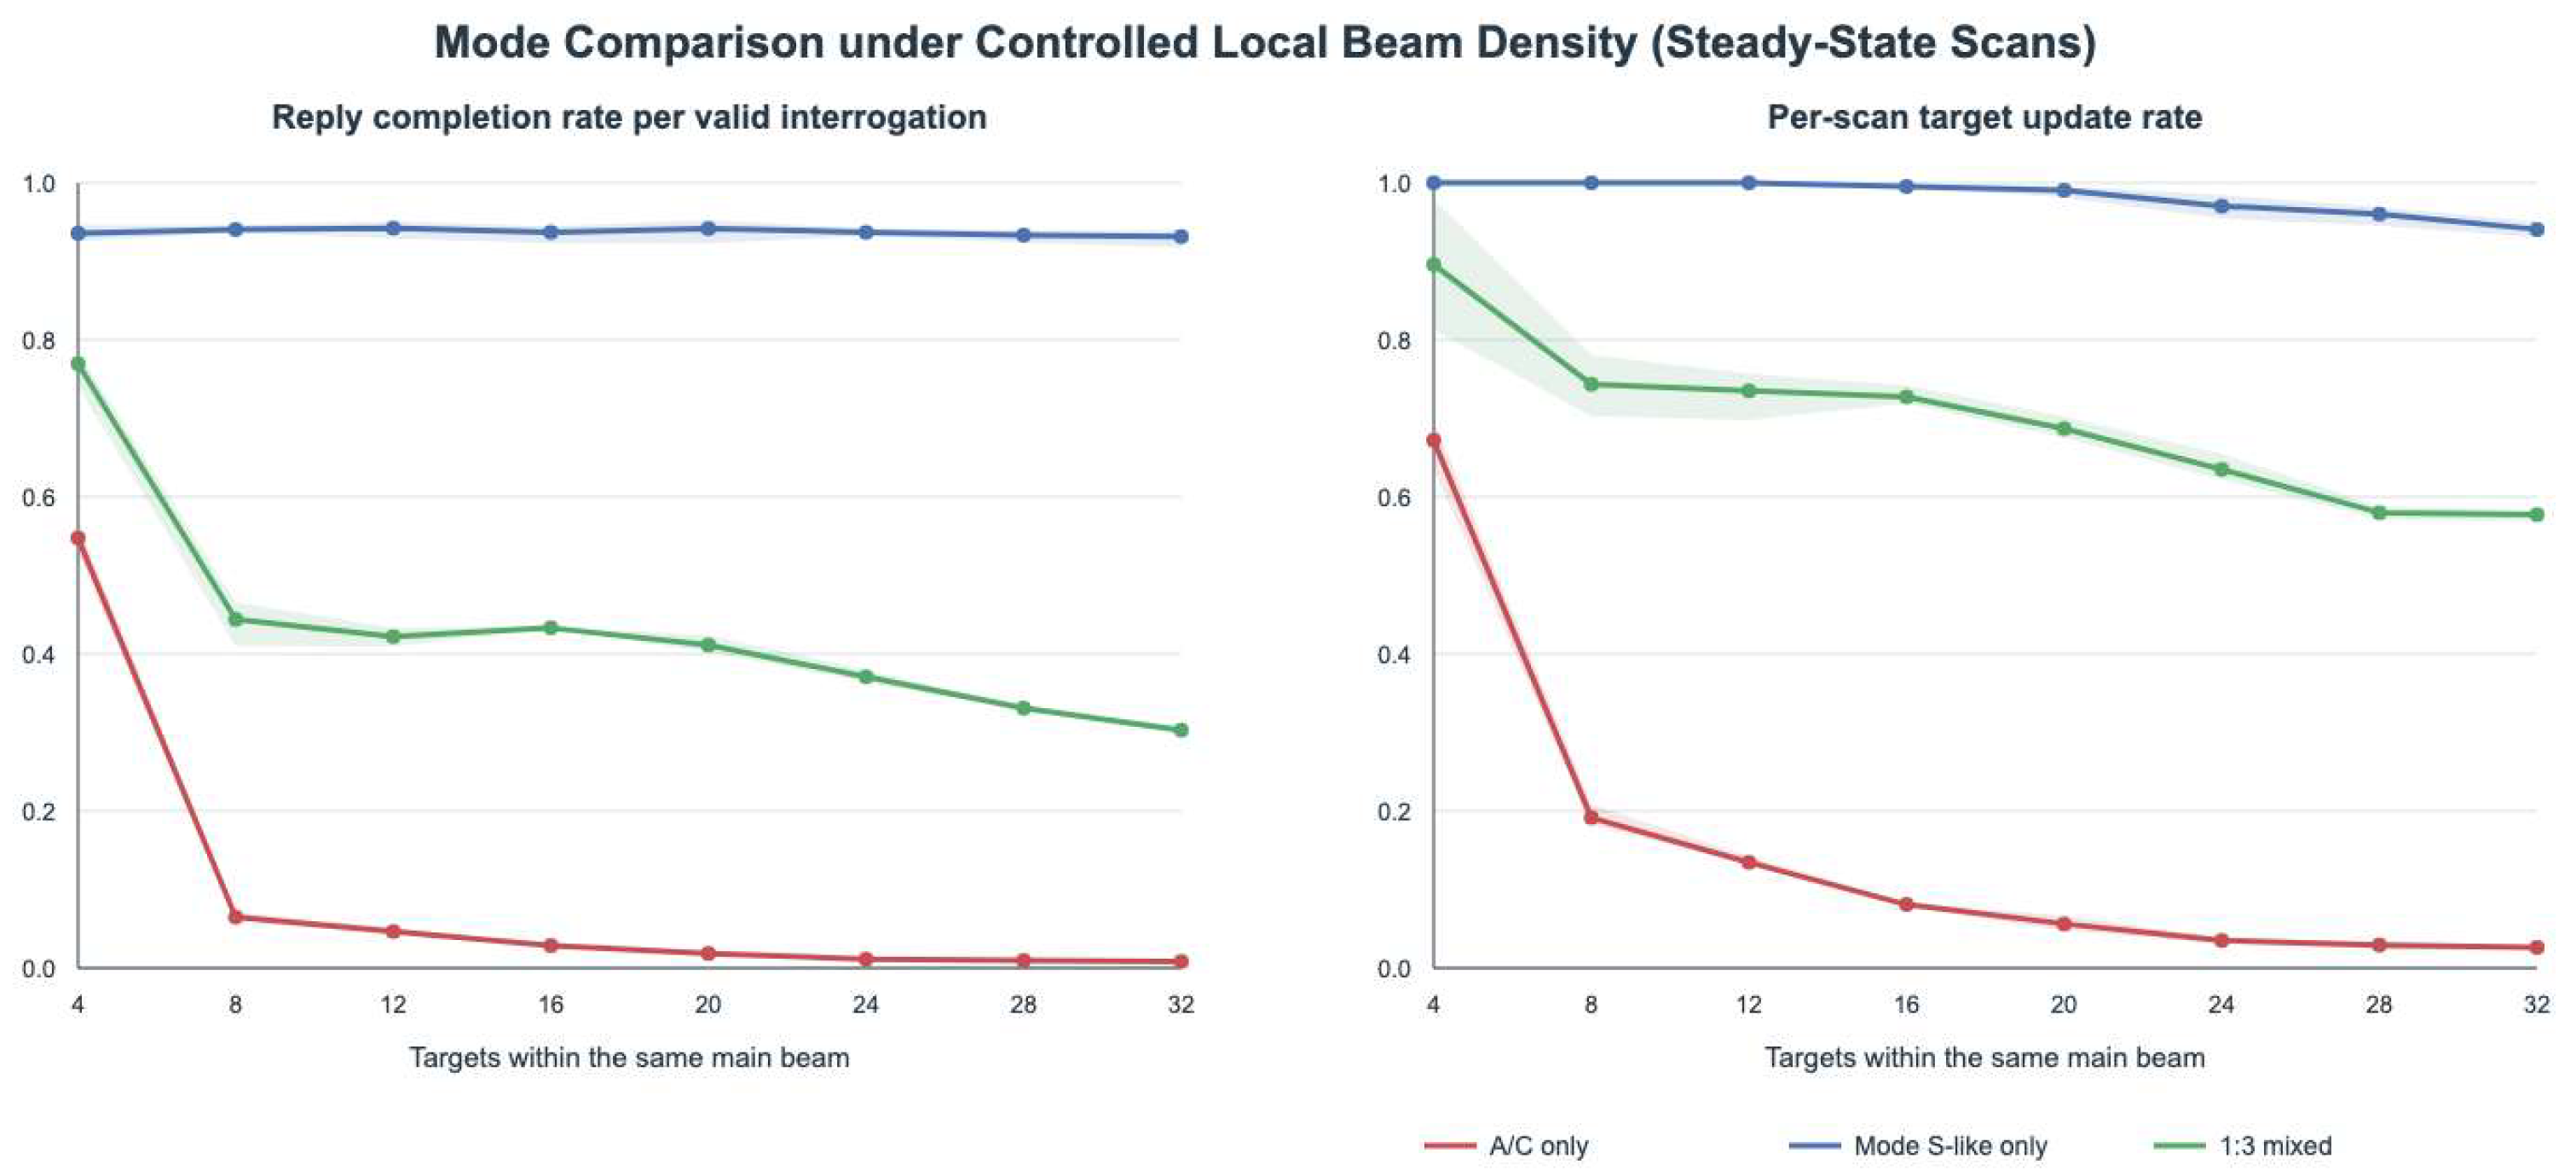
Figure 8.
A/C service for A/C-only targets and roll-call service for Mode S-compatible targets in a 1:3 mixed environment.
Figure 8.
A/C service for A/C-only targets and roll-call service for Mode S-compatible targets in a 1:3 mixed environment.
The A/C-like-only condition is highly sensitive to local density. As increases from 4 to 32, the reply completion rate per valid interrogation falls from 54.74% to 0.84%, and the per-scan update rate falls from 67.19% to 2.60%. Even after targets have responded to the same broadcast interrogation, multiple omnidirectional replies may still create pulse-slot ambiguity, interleaving, or false-trigger risk at the receiver.
Under the Mode S-like-only condition, the reply completion rate per valid interrogation remains between 93.15% and 94.23% at all eight operating points, close to the nominal decoding probability of 0.95, and does not undergo the A/C-like collapse as the target count increases. The per-scan update rate is 100% for and then declines gradually, remaining 94.08% at . This distinction shows that selective addressing separates two questions: whether replies overlap and whether all targets can be scheduled during one main-lobe dwell. Addressing and non-overlapping scheduling suppress the former, whereas the latter remains constrained by beam-dwell time, the roll-call period, and the maximum number of targets per scheduling slot.
The aggregate mixed-group metrics reflect both mechanisms. The reply completion rate per valid interrogation falls from 76.97% to 30.29%, and the per-scan update rate falls from 89.58% to 57.75%. Mode-specific analysis is more informative. For Mode S-compatible targets served by roll-call, the reply completion rate per valid interrogation changes from 91.73% to 92.90% and remains essentially stable; the per-scan update rate falls from 96.88% to 76.56%, primarily reflecting service capacity after the roll-call scheduling frequency is halved in the mixed schedule. For A/C-only targets served by A/C, the corresponding means fall from 56.70% and 59.38% to 0.49% and 0.78%, respectively. At , the mixed group contains only one A/C-only target. The four sample groups retain the same four trajectories and rotate the target assigned the A/C-only capability. Their range at this point therefore also includes effects of trajectory position and random seed and should not be interpreted as a density effect alone.
The experiment shows that Jsimu distinguishes reception competition among broadcast replies from the service capability of roll-call scheduling. It also identifies the mode-specific service outcomes of different target categories. The platform can therefore study how local target density and mode composition affect system performance.
4.4. Comparison With Published Results and External Data
Four types of external evidence of different strengths were used to evaluate Jsimu’s system-simulation capability and research results. Published MIT Lincoln Laboratory (MIT LL) results provide a system-level order-of-magnitude reference for scan performance. ATC-83 supports comparison of a dimensionless interrogation-rate ratio at different altitudes. ATC-84 tests whether the FRUIT threshold–arrival-rate relationship closes forward when the parameters are configured from the same source. OpenSky supplies real-world route geometry for a stress test.
4.4.1. System-Level Reference to MIT LL Mode S Results
In its description of the Mode S beacon radar system, Orlando reported three types of information used in this comparison: operating parameters for conventional ATCRBS, field scan-level results from the Automated Radar Terminal System (ARTS) and Transportable Measurements Facility (TMF), and capacity conditions for the Mode S engineering prototype. The ATCRBS parameters include a terminal scan period of approximately 4.8 s, a beamwidth of approximately 2°–3°, and a sliding-window interrogation rate of approximately 400/s. The all-target blip/scan values for ARTS and TMF were 94.6% and 98.0%, respectively, and the crossing-track-target values were 86.9% and 96.6%. The Mode S engineering prototype was designed for 400 aircraft over 360° and 50 aircraft within a local 11.5° sector [7].
Jsimu uses these operating parameters to construct high-load scenarios: a 4.8-s scan period and 2.45° beamwidth; all-call interrogation at approximately 400/s for the A/C-like group; and all-call target-address acquisition followed by selective polling during the run for the Mode S-like group. Each configuration is run with 30 random seeds for five scan cycles per seed. Table 6 places the Jsimu results alongside the published performance and capacity data to determine the system scale of the scan-level results.
In the 20° high-load scenarios, the A/C-like and Mode S-like scan-level results are close to the published ARTS all-target and TMF crossing-track results, respectively. When the 50 targets are further compressed into the peak 11.5° sector, the A/C-like target update rate falls to 85.320%, and reply-overlap failures increase markedly with sector compression. No large-scale reply overlap occurs in the Mode S-like case, but the scan-level result is strongly affected by the target-acquisition process. These changes reflect, respectively, the different mechanisms of broadcast-reply competition and roll-call service after acquisition and are consistent with the published analysis of ATCRBS garble and Mode S capacity design.
In the peak-sector Mode S-like case, excluding the first one, two, and three acquisition scans yields target update rates of 88.050%, 96.000%, and 99.600%, respectively. Event statistics show that this change results from progressive construction of the target set during all-call acquisition, rather than a scheduling deficit that could be eliminated simply by increasing roll-call PRF. Under the selected comparable statistical definitions, the absolute differences between the four Jsimu scan-level results and their corresponding published references range from 0.167 to 1.747 percentage points, or approximately 0.2–1.8 percentage points. These comparisons do not constitute a replication of the original field equipment or test conditions, but they show that the Jsimu results fall within similar absolute ranges. The scenario therefore provides not only an order-of-magnitude reference for scan-level performance but also an illustration of how initial acquisition affects statistics over a finite observation window.
4.4.2. Altitude-Ratio Comparison Using an 11-Site Subset of ATC-83
ATC-83 recorded the airborne ATCRBS uplink environment along the Boston–Washington corridor in 1977. Its summary reports a mean Mode A+C interrogation rate of approximately 75/s for the 8,500-ft segment and approximately 100/s for the 17,500-ft segment [16]. From the 68 interrogators listed in the report, this study selects 11 named terminal interrogators, uses the PRI/PRF, scan-period, and mode-interlace parameters in of ATC-83 Volume II, and uses the corresponding airport reference points as location proxies [17,18]. The two scenarios retain the same horizontal observation point and device parameters and differ only in target altitude.
Within a 60-s statistical window, the observation platform receives and successfully decodes 1,598 and 2,071 interrogations at 8,500 and 17,500 ft, respectively, corresponding to 26.633 and 34.517 interrogations per second. Six and nine sites in the subset, respectively, produce valid observations. These values are below the ATC-83 rates of 75/s and 100/s principally because the report describes the complete 68-site environment, whereas the scenario contains only 11 named terminal sites; the absolute interrogation rates therefore cannot be compared directly. The simulated high-to-low-altitude ratio is 1.296, compared with approximately 1.333 for the corresponding ATC-83 measured means. This comparison shows that the subset model reproduces the joint increase in visible interrogators and received interrogations with altitude.
4.4.3. Closure of the ATC-84 FRUIT Threshold–Arrival-Rate Relationship
ATC-84 reports airborne measurements of ATCRBS FRUIT in the Los Angeles Basin and states that a 10-dB change in receiver threshold changes the FRUIT rate by approximately one order of magnitude [13]. Using the report’s approximate relationship , the simulation sets replies/s/aircraft and includes 91 density targets, four spatially distributed load sources, a monitoring altitude of 4,500 ft, and a 10-s statistical window. Only the receiver threshold differs among the three scenarios. The comparison quantity is the raw FRUIT-like arrival rate after threshold decisions. Results are shown in Table 7.
All three threshold points lie within the corresponding approximate envelopes of the historical ATC-84 measurement curves. From to dBm, the simulated arrival rate decreases by a factor of approximately 7.0, consistent with the report’s description of approximately one order of magnitude and with its measured range. Thus, when the basic parameters are configured from the same report and the specified statistical method is used, Jsimu’s spatial propagation, threshold screening, and FRUIT-like arrival statistics jointly reproduce all three historical scales, rather than merely the direction of change.
4.4.4. OpenSky Case Driven by Real-World Traffic Geometry
The base scenario uses trajectories for 36 aircraft derived from OpenSky Network public data for the Pearl River Delta/Hong Kong–Shenzhen region from 06:00:00 to 06:01:00 UTC on March 1, 2026 [19]. The data contain 1,862 state points, with 26–36 active targets over time. Under the same terminal traffic geometry, site, antenna, power, threshold, and random seed, the scenario examines differences in reply load and near-simultaneous-reply pressure between A/C all-call and Mode S-like acquisition followed by selective addressing. The mean numbers of replies are 1,332.6 and 476.6 for A/C-like and Mode S-like operation, respectively, and the corresponding mean near-overlap-type failures are 41.2 and 0.4. Mode S-like operation reduces these two metrics by 64.2% and approximately 99.0%, respectively. The results show that Jsimu can perform a controlled mode comparison under real-world dynamic route conditions.
4.5. Semantic Consistency and Performance of the Spatial Index
The spatial index reduces the number of candidate devices requiring a complete link decision for each interrogation. To determine whether candidate pruning changes the specified results, the experiment uses a reference scenario containing six ground sites and 120 aircraft. The aircraft are distributed across core, eastern, and southwestern traffic regions, and the ground sites concurrently use A/C-like broadcast, Mode S-like roll-call, fixed-beam-triggered, and other interrogation policies. Within each of the three traffic regions, aircraft are selected in a nested farthest-point order such that
while the aircraft-count ratio among the three regions remains 2:2:1. The four scales correspond to 36, 66, 96, and 126 platforms. The model uses a grid spatial index with a cell width of 50 km, a time bucket of 5 s, and a range margin of 25 km. Each simulation lasts 300 s. At every scale, three runs are performed with the spatial index disabled and three with it enabled, producing 12 paired comparisons and 24 independent-process runs. Within each pair, only the index mode is switched; the scenario snapshot, random seed, active platforms, signal parameters, and event-recording definitions remain identical. Run results are sorted by stable cross-run transaction identifier. After run identifiers and absolute paths are removed, all key statistics are compared.
Six output classes—device metrics, failure statistics, relationship statistics, transaction outcomes, random-sample summaries, and reply-timing analysis—are identical item by item across all 12 paired runs, as are the scheduled-event counts. Candidate pruning therefore does not change the compared simulation semantics within the tested range of scales and index parameters.
Formal runs were conducted on a Mac Studio with a 16-core Apple M4 Max processor and 128 GB of memory, running macOS 26.5.2 and Python 3.12.13. Table 8 reports the median execution time of three runs.
The candidate-check count increases approximately linearly with aircraft count. The grid spatial index reduces candidate checks by approximately 54% at all four scales, and the reduction fraction does not increase markedly with scale. Speedup rises from 1.750 with 30 aircraft to 2.074 with 120, indicating that the fixed cost of index construction and queries is amortized more effectively at the larger scales.
5. Discussion
5.1. Real-Data Support for the Validation of Complex Scenarios
Tests of rule implementation, system behavior, external agreement, and scaling semantics establish Jsimu’s credibility for mechanism analysis, system-performance studies, parameter-sensitivity analysis, and controlled design comparisons. More precise quantitative validation of complex scenarios will require real data. The most useful data would record interrogations, replies, device states, reception decisions, and target reports on a common time basis. Most public sources provide only aggregate results for a particular sensor network or statistical definition. These results support comparisons of key metrics, but they do not capture the complete event process under overlapping multi-site coverage, dense traffic, complex propagation, or simultaneous operation of several modes. Calibration and comparison with measured data under such conditions will therefore be a priority in further validation.
5.2. Scope of IFF-Like Functions
Jsimu’s general event-processing framework supports IFF-like interrogation–reply processes. Users may define signal formats, device capabilities, compatibility relationships, reply rules, and scheduling policies. Civil SSR and IFF-like systems can therefore share models of dynamic platforms, bidirectional propagation, device states, reception competition, and transaction traceability while retaining separate signal and rule configurations.
The signal modes, equipment parameters, operating rules, and application scenarios of IFF systems may involve sensitive or classified information. This paper uses public SSR, Mode A/C, and Mode S sources to discuss the design of a platform for system-level studies. IFF-like and user-defined signal capabilities are mentioned only to explain the platform’s extensibility. The paper does not analyze the parameters, rules, or performance of any specific IFF mode. Dedicated IFF-like studies should be conducted separately under the applicable information-security and data-management requirements.
6. Conclusions
This paper designed and implemented Jsimu to study system-level issues in secondary radar under multi-site, multi-target, multimode, and dynamic-platform conditions. Jsimu organizes platform motion, interrogation and reply propagation, competition for device resources, reception-window decisions, and result evidence as one continuous global causal process. It provides a complete experimental environment for scenario configuration, system execution, metric calculation, and transaction trace-back.
The platform includes models of dynamic platform–device relationships, a unified integer time axis, bidirectional path arrivals, shared device states, reception competition, and layered transaction evidence. A conservative spatial index supports larger simulations. Rule tests, controlled system-behavior experiments, comparisons with published results and external data, and paired scaling tests evaluated causal boundaries, mechanism responses, external magnitude, and computational semantics. The platform distinguished broadcast-reply competition, roll-call scheduling capacity, and service behavior in mixed modes. Its transaction evidence connected events and paths with reception decisions and system statistics. External comparisons provided support at the levels of scan results, dimensionless ratios, and measurement envelopes. The spatial index provided consistent acceleration while preserving six classes of output.
Taken together, the results show that Jsimu consistently represents dynamic geometry, shared resources, signal interactions, reception competition, and mode scheduling in secondary radar systems. Jsimu is a credible research simulation platform for these systems. It can be used to study the combined effects of sensor-network topology, target density, interrogation mode, device capability, propagation environment, and operating parameters on system performance. It also connects system metrics to the individual transactions and interaction paths that produced them.
Future work will focus on comparison with measured data and parameter calibration for complex sensor networks. Validation datasets will be developed for representative application scenarios. These datasets will support further studies of operational optimization and effectiveness in secondary-radar systems.
Data Availability Statement
The public data used for external comparisons are available from the sources cited in this paper. The simulation configurations and derived results supporting the findings are available from the author upon reasonable request.
Use of Artificial Intelligence
During the development of the simulation software, the author used AI-assisted tools to assist with code debugging and related development tasks. AI-assisted tools were also used to support the translation of the Chinese manuscript into English and subsequent language editing. The author reviewed and verified all AI-assisted outputs, revised them where necessary, and takes full responsibility for the software, technical content, and final manuscript.
Conflicts of Interest
The author declares no conflicts of interest.
References
- International Civil Aviation Organization. Annex 10 to the Convention on International Civil Aviation, Volume IV: Surveillance Radar and Collision Avoidance Systems, 6th ed.; ICAO: Montréal, Canada, 2026; Available online: https://store.icao.int/en/annex-10-aeronautical-telecommunications-volume-iv-surveillance-radar-and-collision-avoidance-systems (accessed on 22 August 2026).
- Federal Aviation Administration. Aeronautical Information Manual: Chapter 4, Section 5, Surveillance Systems. Available online: https://www.faa.gov/air_traffic/publications/atpubs/aim_html/chap4_section_5.html (accessed on 22 August 2026).
- EUROCONTROL. Principles of Mode S Operation and Interrogator Codes, ed. 2.3; EUROCONTROL: Brussels, Belgium, 2003; Available online: https://www.eurocontrol.int/publication/principles-mode-s-operation-and-interrogator-codes (accessed on 22 August 2026).
- Federal Aviation Administration. Introduction to TCAS II Version 7.1 . FAA: Washington, DC, USA, 2011. Available online: https://www.faa.gov/documentLibrary/media/Advisory_Circular/TCAS%20II%20V7.1%20Intro%20booklet.pdf (accessed on 22 August 2026).
- NATO Airborne Early Warning and Control Programme Management Agency. Current and Future: Identification Friend or Foe—Mode 5 and Enhanced Mode S . Available online: https://www.napma.nato.int/awacs/a3.html (accessed on 22 August 2026).
- EUROCONTROL. EUROCONTROL-GUID-200: Guidelines on Mode S Interrogation Configuration to Reduce 1030/1090 MHz RF Usage, ed. 1.0; EUROCONTROL: Brussels, Belgium, 2025; Available online: https://www.eurocontrol.int/publication/eurocontrol-guid-200-eurocontrol-guidelines-mode-s-interrogation-configuration-reduce (accessed on 22 August 2026).
- Orlando, V.A. The Mode S beacon radar system. Linc. Lab. J. 1989, 2, 345–362. Available online: https://www.ll.mit.edu/r-d/publications/mode-s-beacon-radar-system (accessed on 22 August 2026).
- Herber, A.; Walberer, A. SSR system performance and interference analysis using an event-driven simulation model. Informationen Aus Dem Bereich Forsch. Entwickl. 2012, 1, 20–30. Available online: https://www.dfs.de/homepage/de/medien/publikationen/fokus1201.pdf (accessed on 22 August 2026).
- Schreiber, H.; Bösch, W.; Paulitsch, H.; et al. ESIT—A digital twin of air surveillance infrastructure. E I Elektrotechnik Und Informationstechnik 2024, 141, 175–187. [Google Scholar] [CrossRef]
- Kim, E.; Sivits, K. Blended secondary surveillance radar solutions to improve air traffic surveillance. Aerosp. Sci. Technol. 2015, 45, 203–208. [Google Scholar] [CrossRef]
- Cameron, A.G. Further Studies of ATCRBS Based on ARTS-III Derived Data . Project Report ATC-38; MIT Lincoln Laboratory: Lexington, MA, USA, 1974. Available online: https://www.ll.mit.edu/r-d/publications/further-studies-atcrbs-based-arts-iii-derived-data (accessed on 22 August 2026).
- Elkin, G.R.; Gertz, J.L. The Beacon Target Detector (BTD) Algorithms Deployed in the ASR-9 Processor Augmentation Card (9-PAC); MIT Lincoln Laboratory: Lexington, MA, USA, 2000; Available online: https://www.ll.mit.edu/r-d/publications/beacon-target-detector-btd-algorithms-deployed-asr-9-processor-augmentation-card-9 (accessed on 22 August 2026).
- Harman, W.H., III. Airborne Measurements of ATCRBS Fruit . Project Report ATC-84; MIT Lincoln Laboratory: Lexington, MA, USA, 1978. Available online: https://www.ll.mit.edu/r-d/publications/airborne-measurements-atcrbs-fruit (accessed on 22 August 2026).
- International Telecommunication Union Radiocommunication Sector. Recommendation ITU-R P.834-9: Effects of Tropospheric Refraction on Radiowave Propagation; ITU: Geneva, Switzerland, 2017; Available online: https://www.itu.int/rec/R-REC-P.834-9-201712-I/en (accessed on 22 August 2026).
- International Telecommunication Union Radiocommunication Sector. Recommendation ITU-R P.525-5: Calculation of Free-Space Attenuation; ITU: Geneva, Switzerland, 2024; Available online: https://www.itu.int/rec/R-REC-P.525-5-202411-I/en (accessed on 22 August 2026).
- Nagy, F., Jr. Uplink ATCRBS Environment Measurements Along the Boston-Washington Corridor . In The RF Environment; MIT Lincoln Laboratory: Lexington, MA, USA, 1978; Volume 1, Available online: https://www.ll.mit.edu/r-d/publications/uplink-atcrbs-environment-measurements-along-boston-washington-corridor-volume-1 (accessed on 22 August 2026).
- Nagy, F., Jr. Uplink ATCRBS Environment Measurements Along the Boston-Washington Corridor . In Interrogator Characteristics; MIT Lincoln Laboratory: Lexington, MA, USA, 1979; Volume 2, Available online: https://www.ll.mit.edu/r-d/publications/uplink-atcrbs-environment-measurements-along-boston-washington-corridor-volume-2 (accessed on 22 August 2026).
- OurAirports. airports.csv. Available online: https://davidmegginson.github.io/ourairports-data/airports.csv (accessed on 12 August 2026).
- Schäfer, M.; Strohmeier, M.; Lenders, V.; et al. Bringing Up OpenSky: A large-scale ADS-B sensor network for research. In Proceedings of the 13th IEEE/ACM International Symposium on Information Processing in Sensor Networks, Berlin, Germany, 15–17 April 2014; pp. 83–94. [Google Scholar] [CrossRef]
Figure 1.
Structure of the Jsimu traceable global-event simulation method.
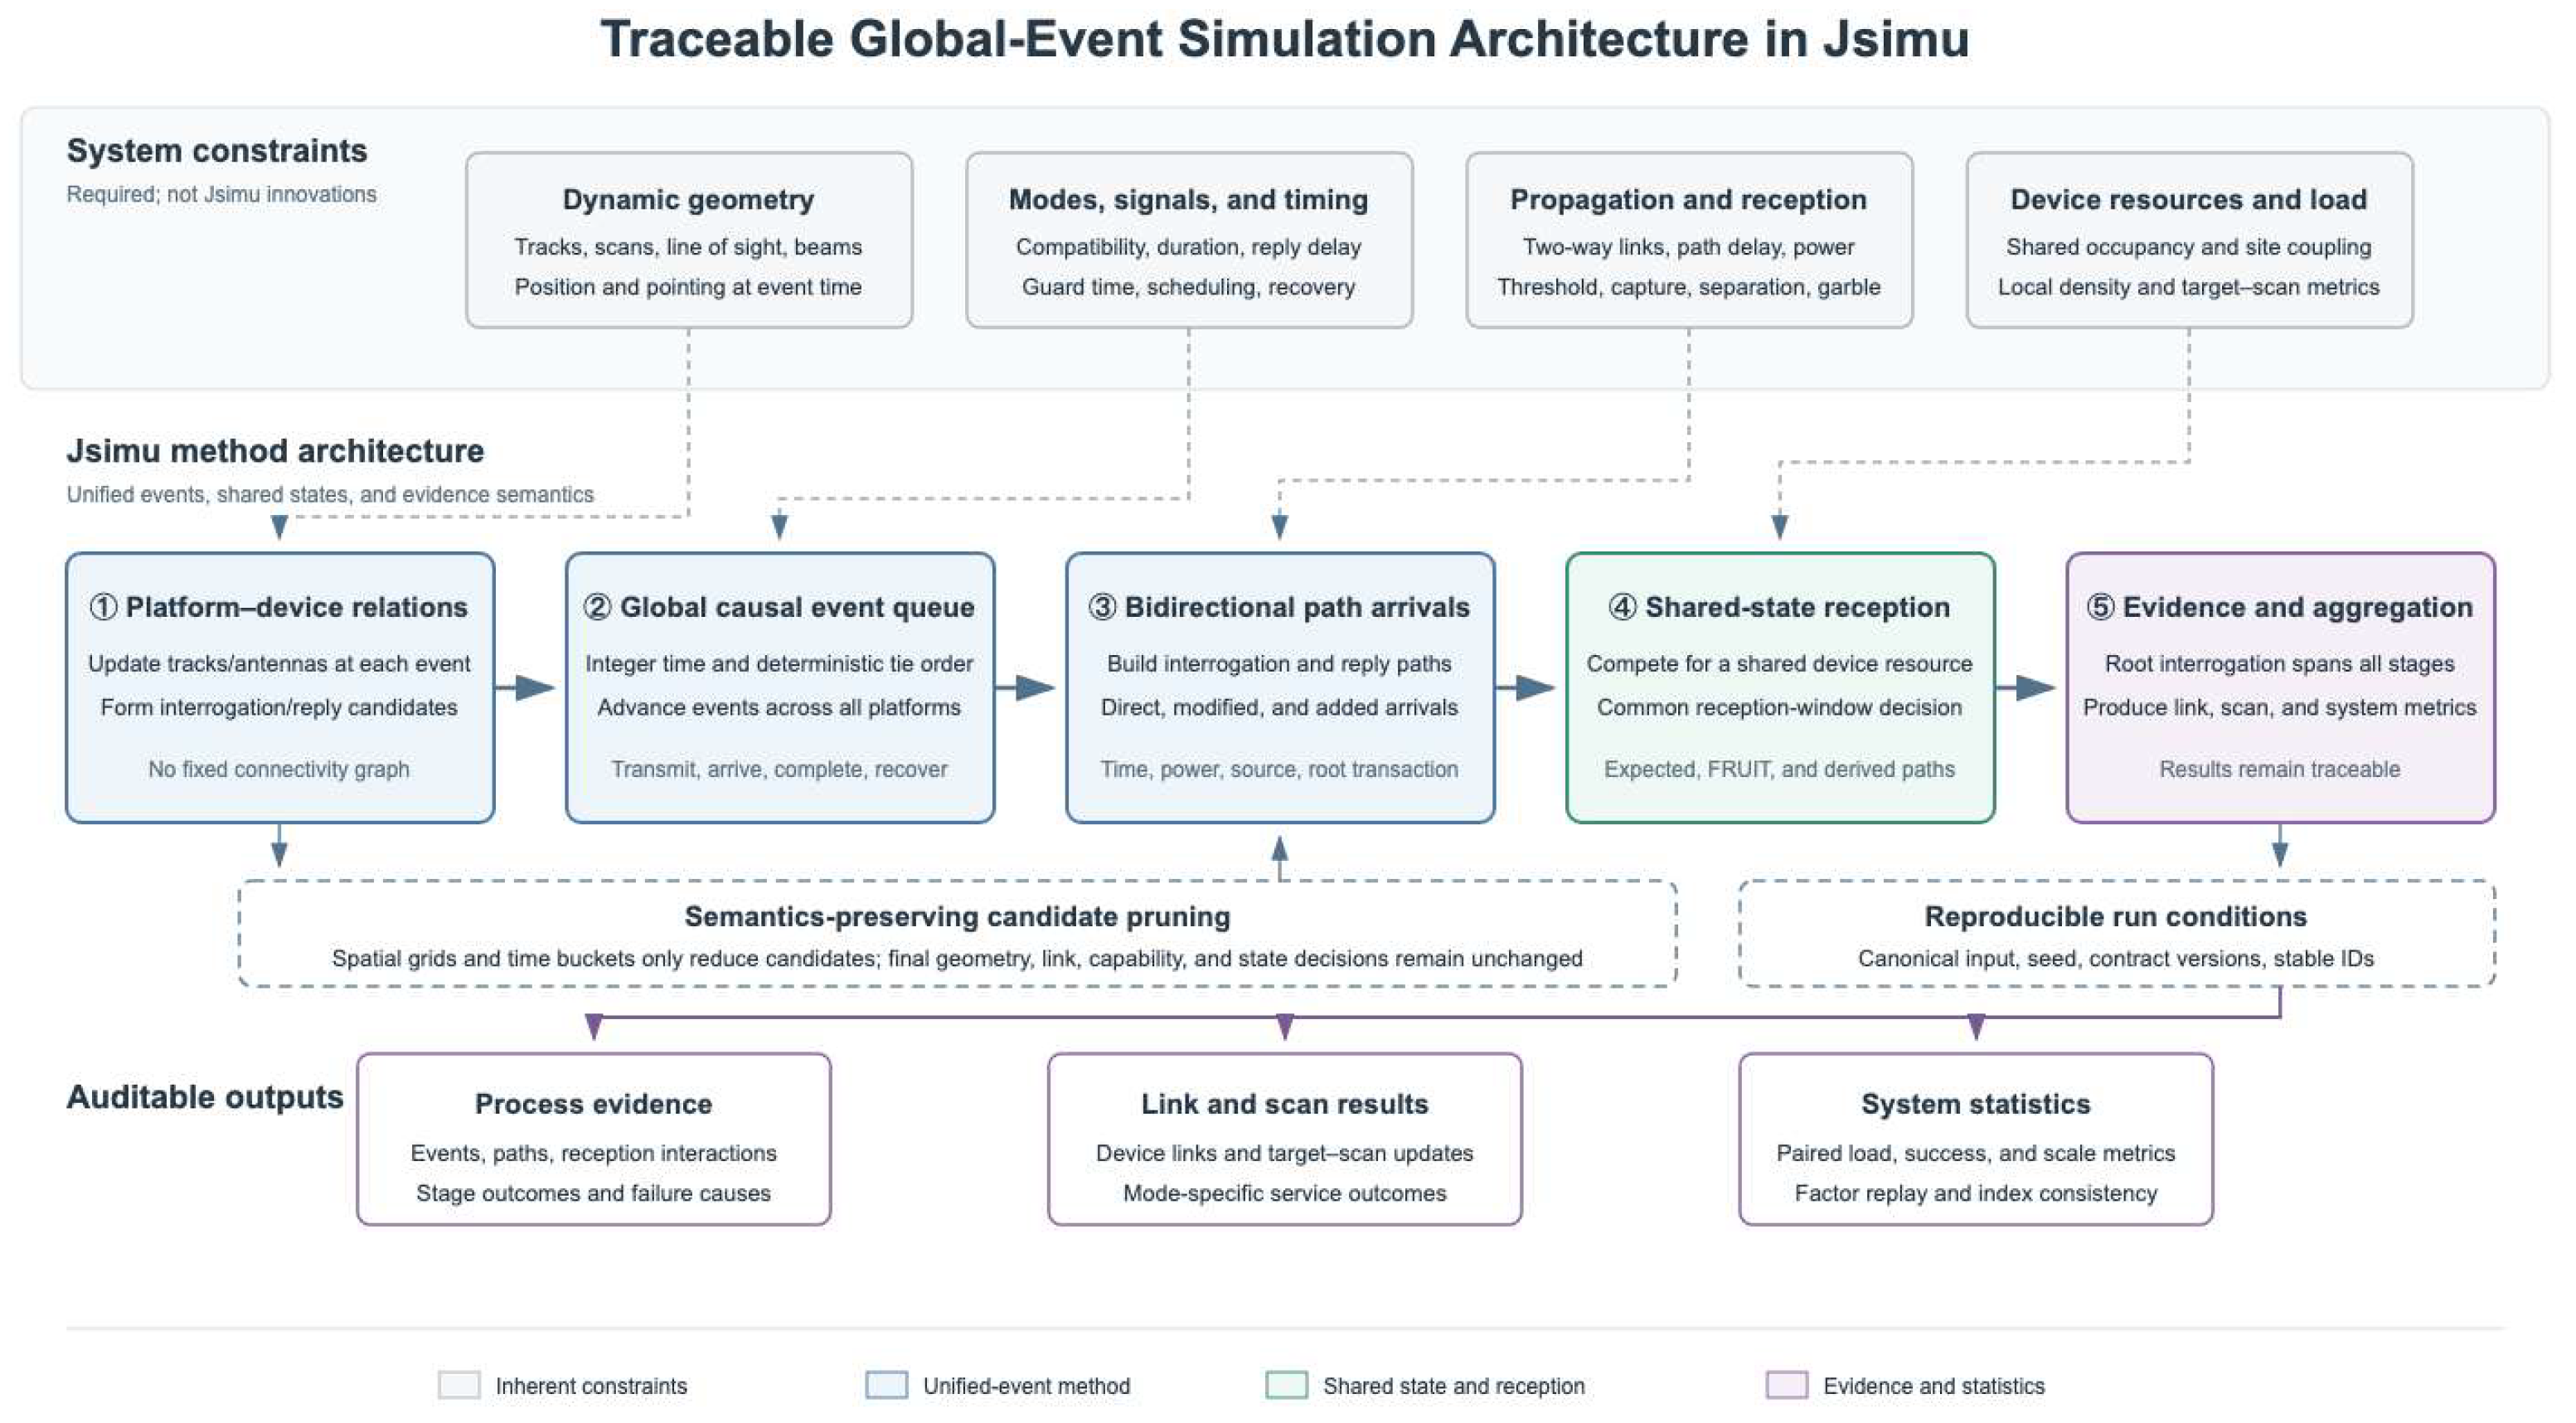
Figure 2.
Layered transaction evidence and result trace-back.
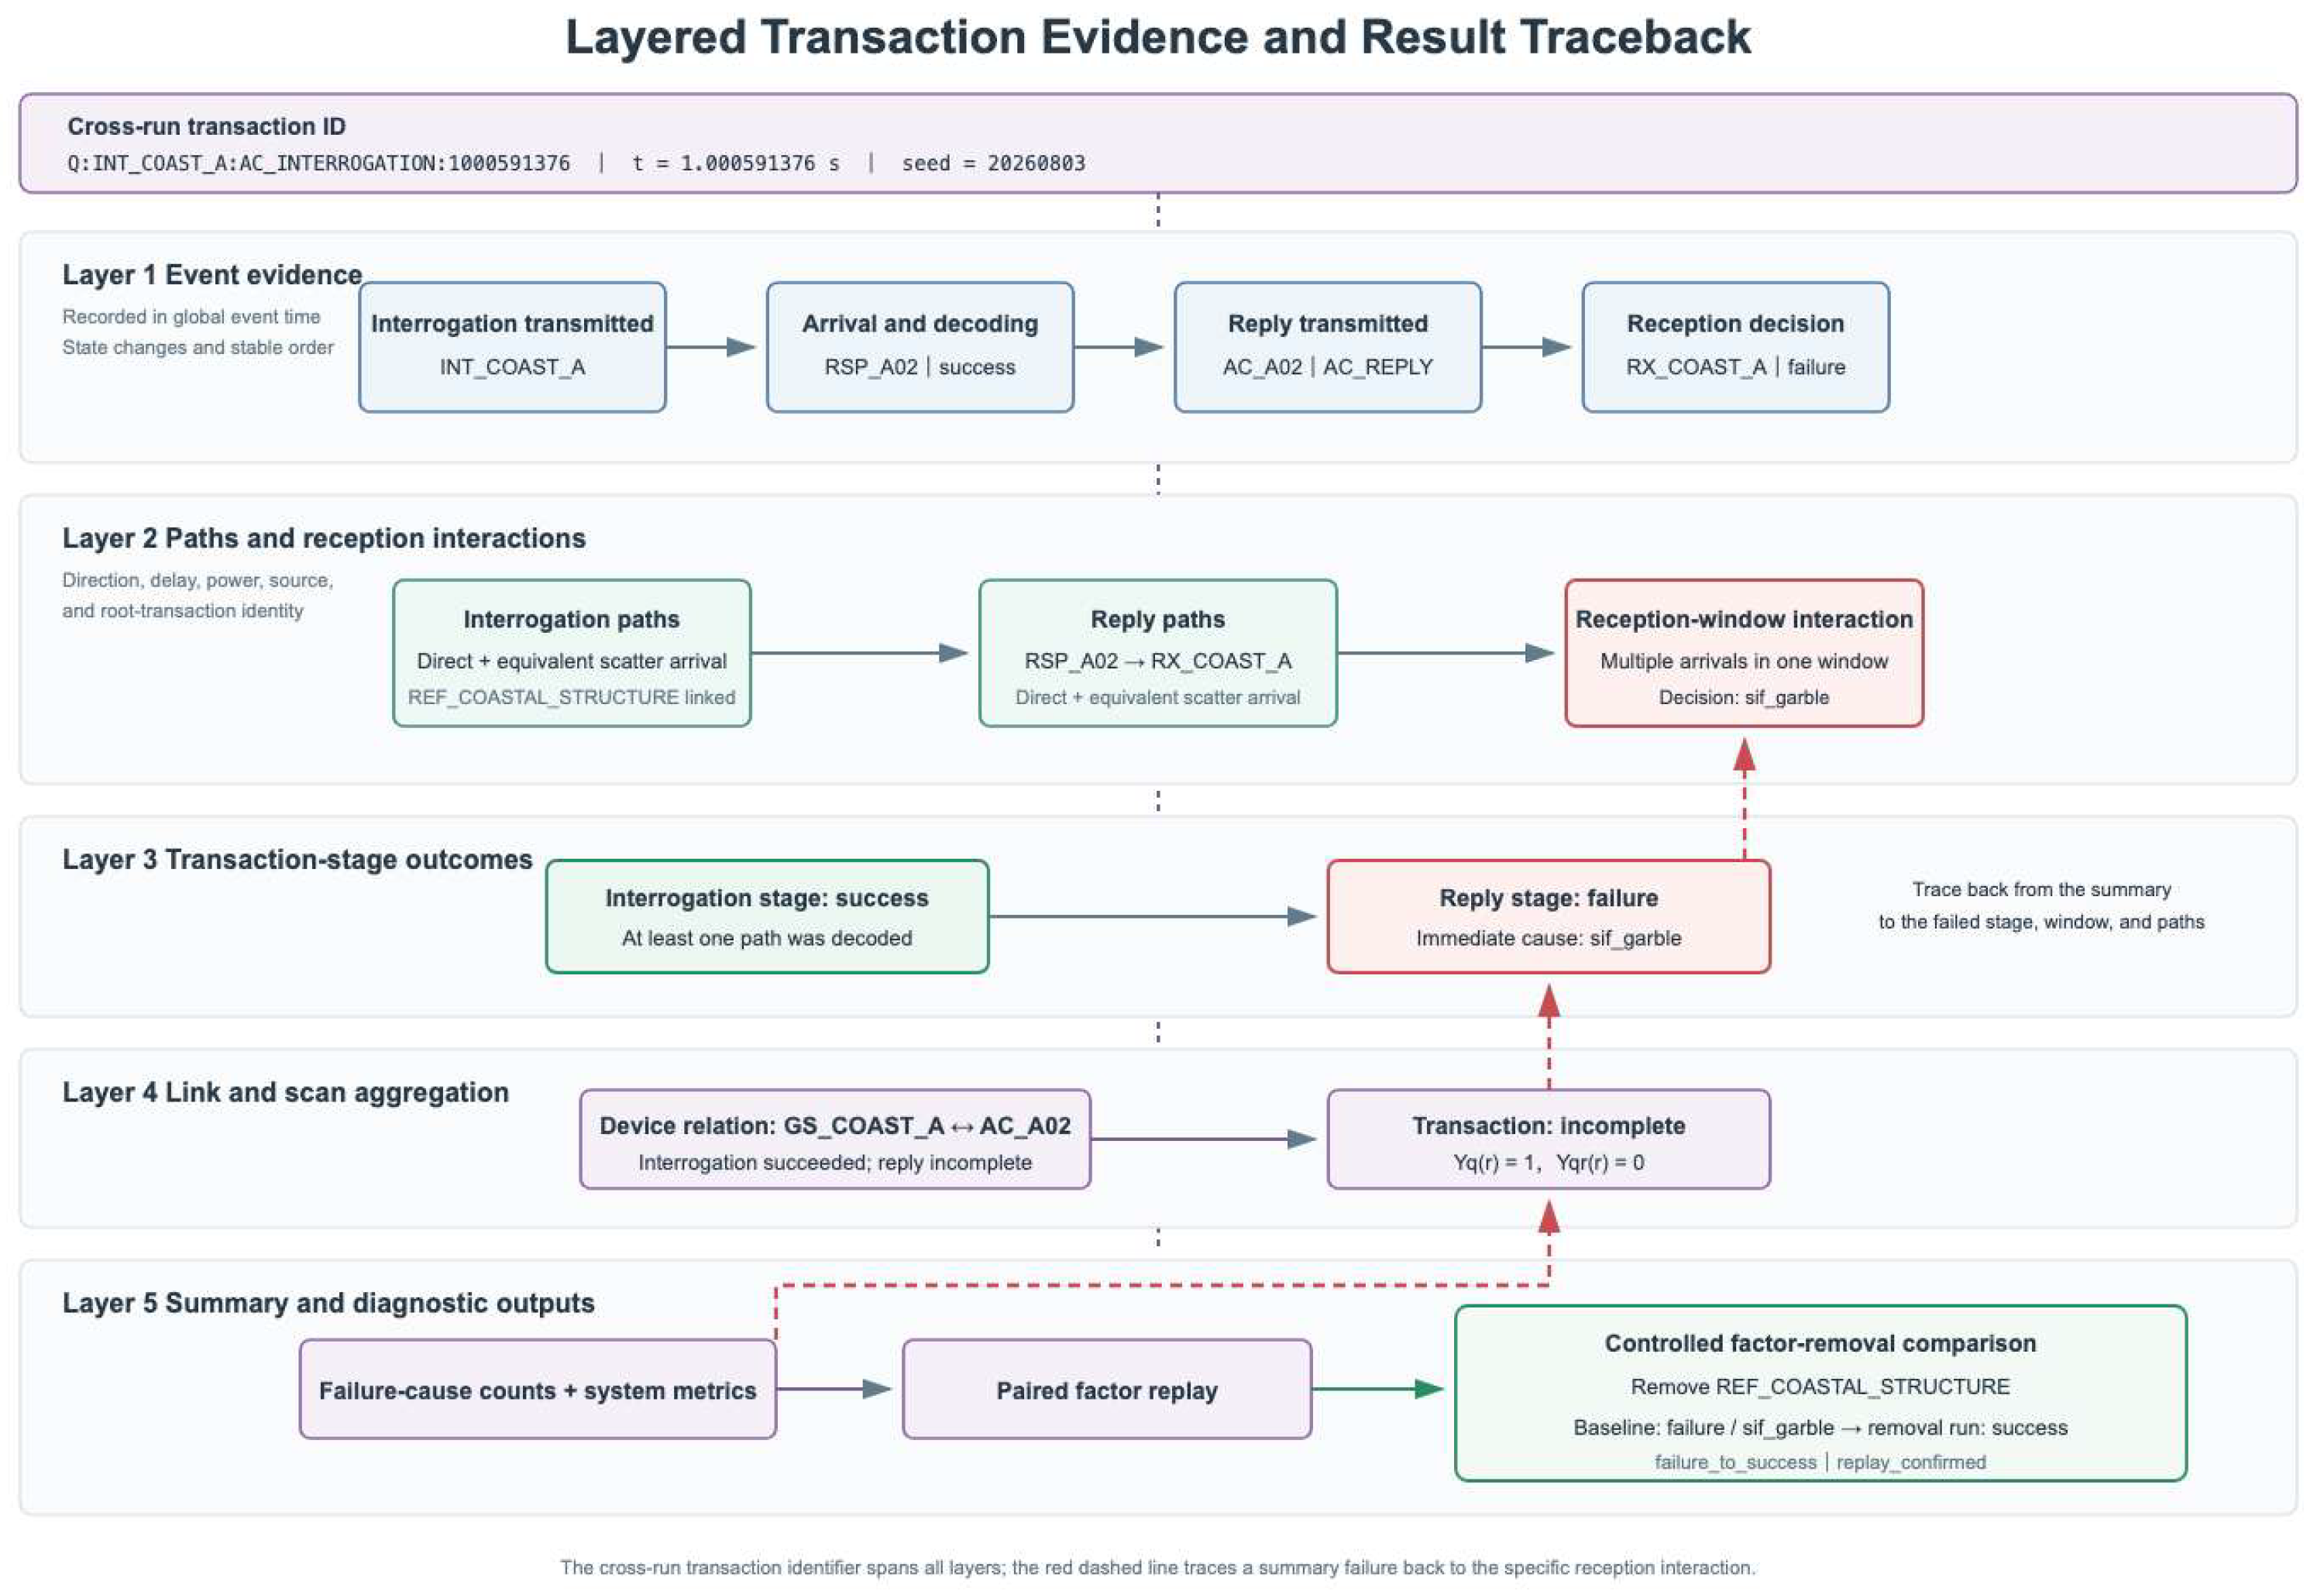
Figure 3.
Jsimu interface for executing and examining an OpenSky real-world traffic scenario.
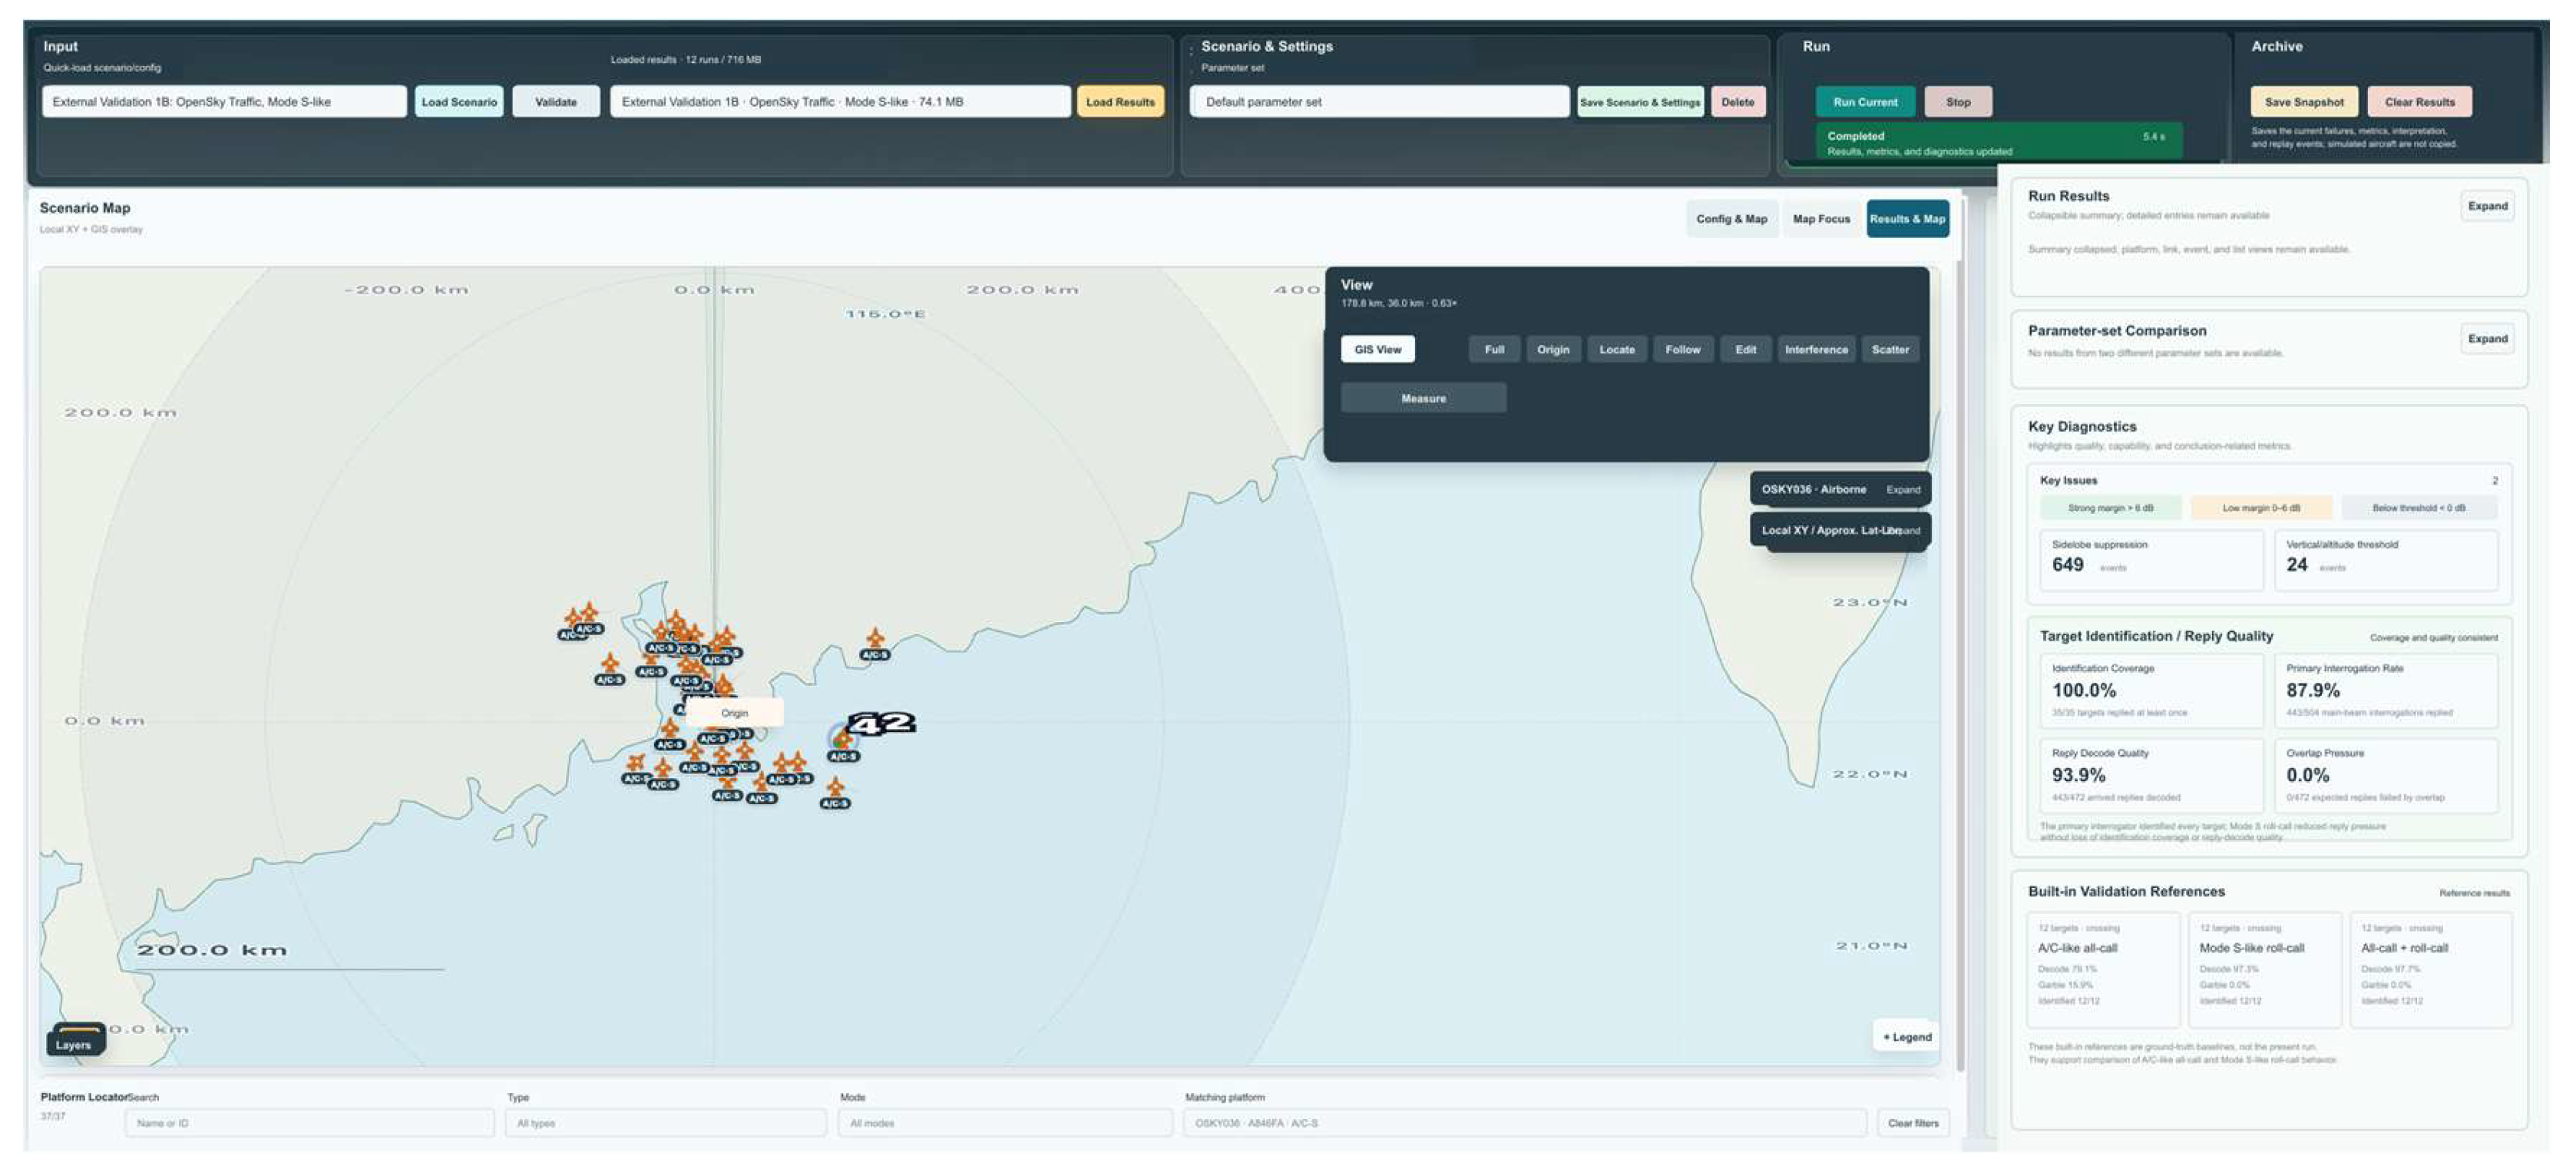
Figure 4.
Overall validation coverage and boundary of external evidence.
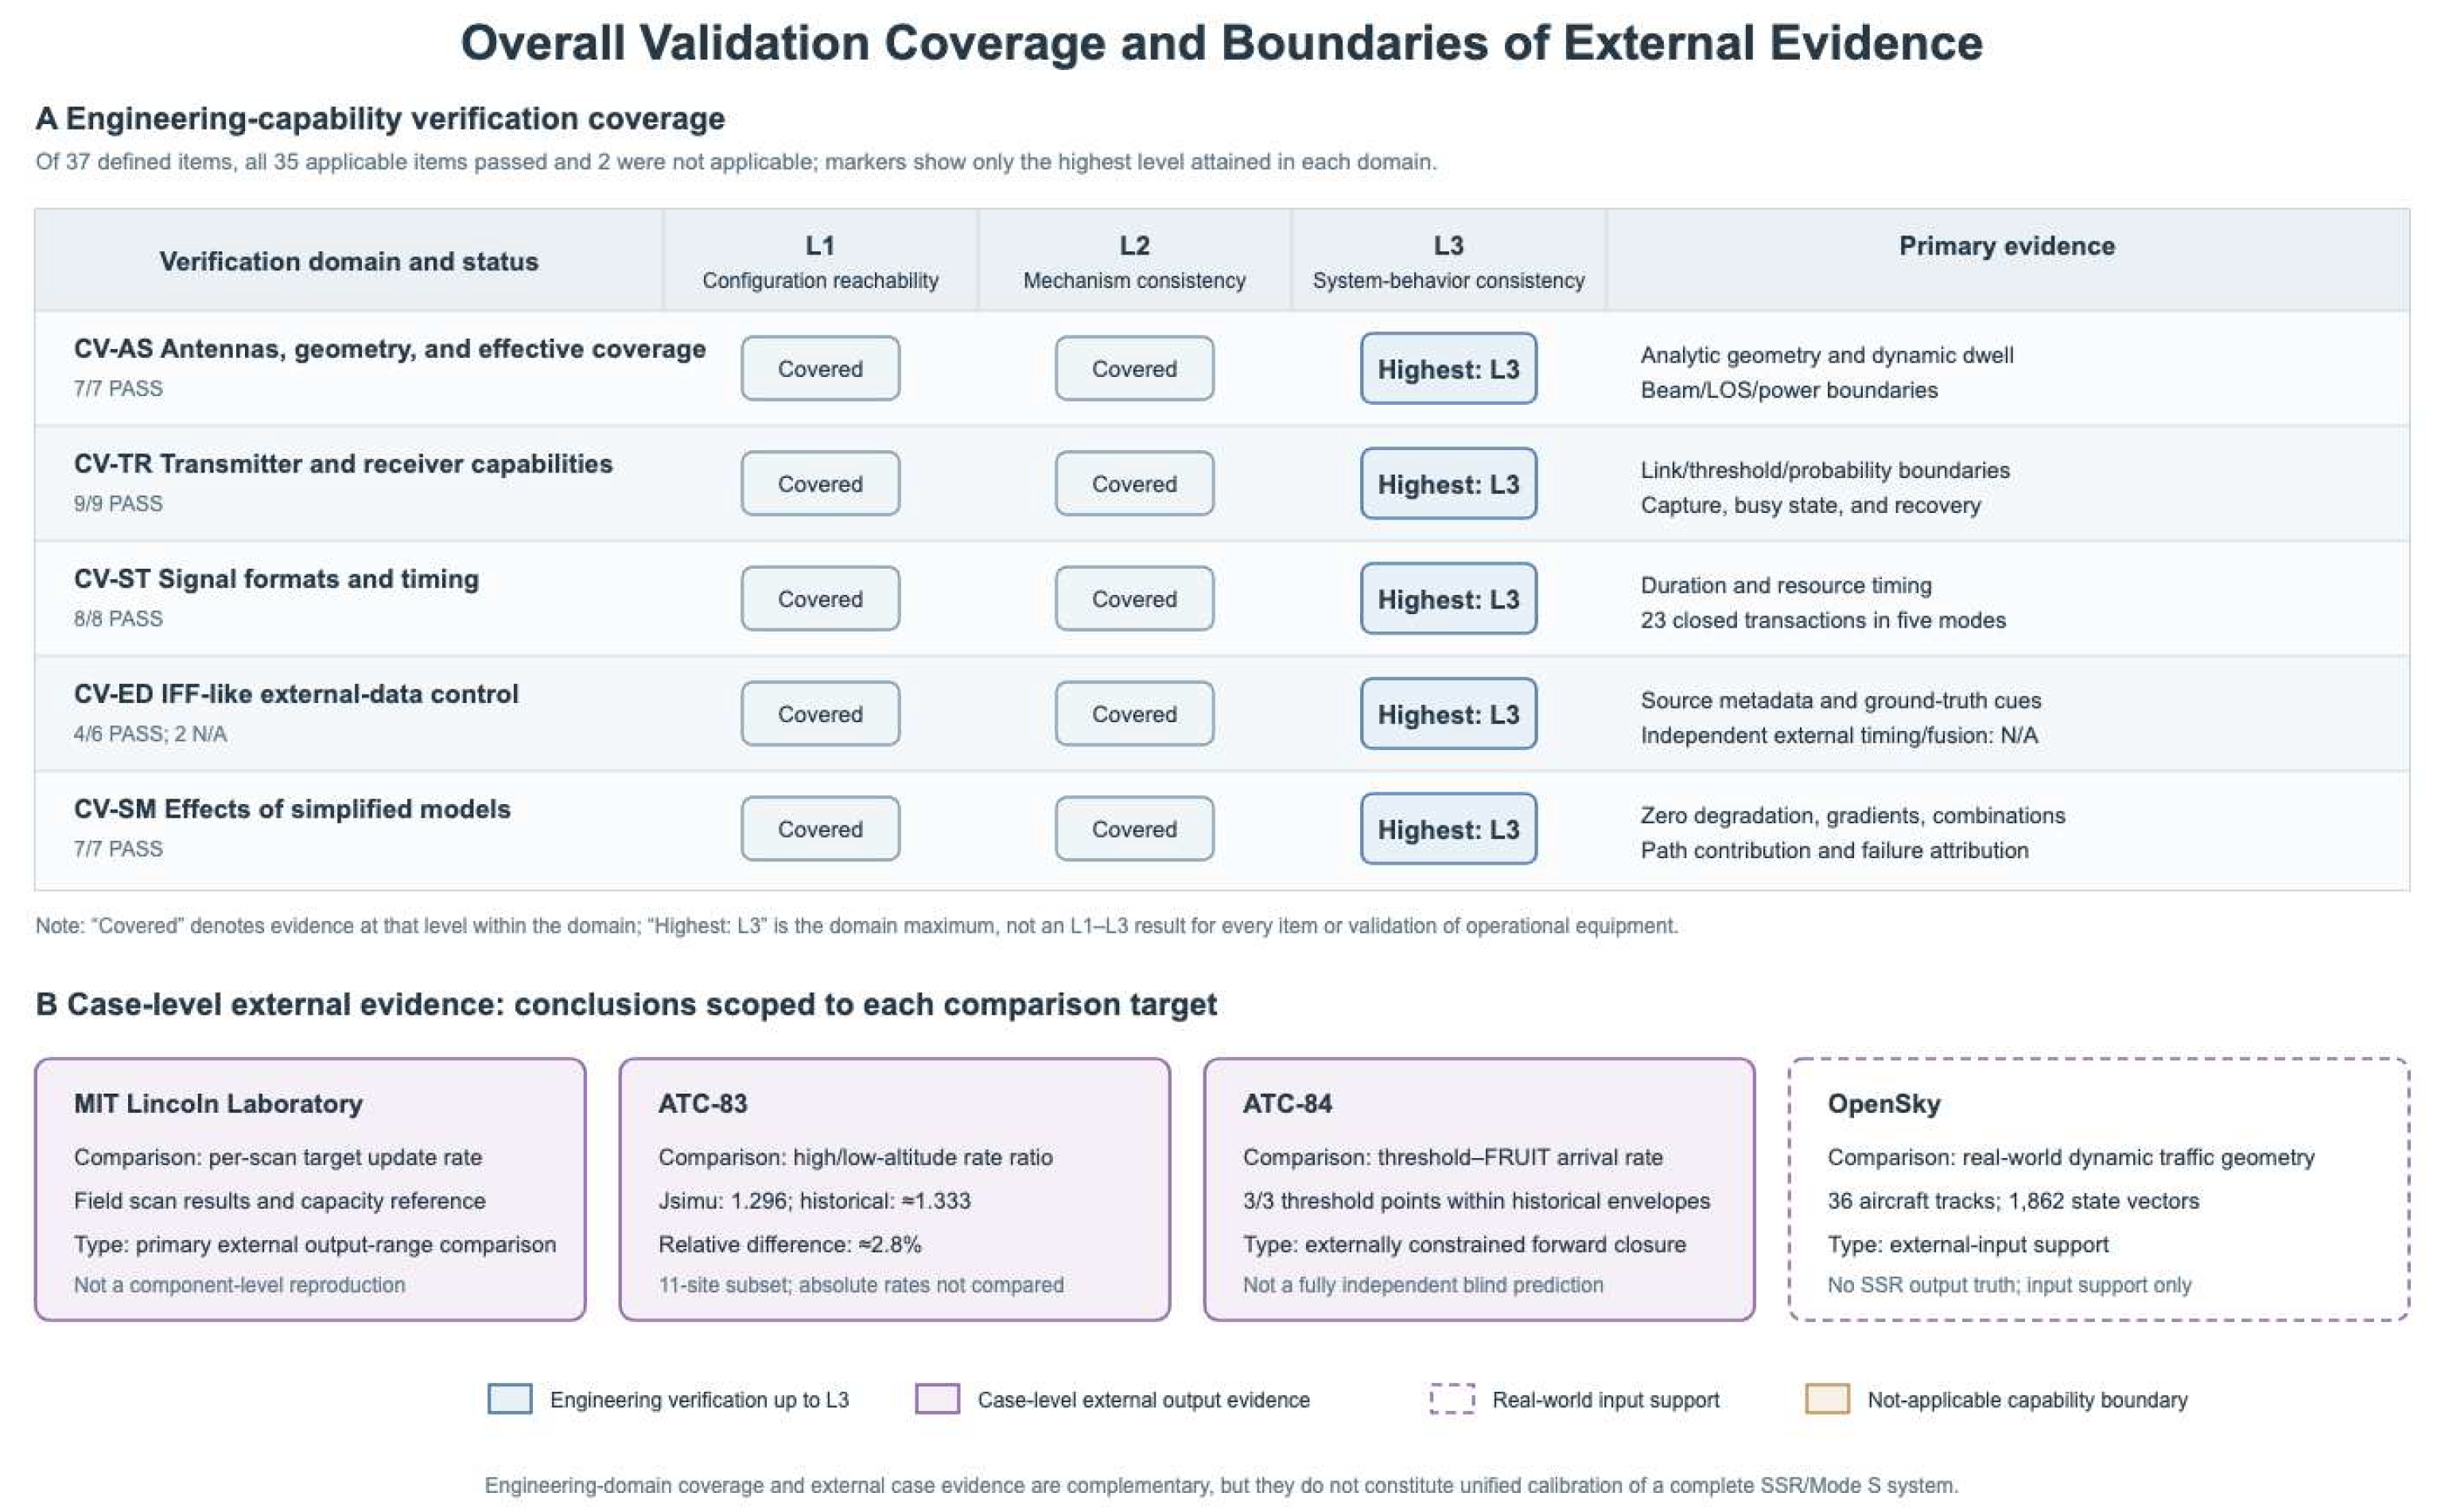
Figure 5.
Transaction-state timeline of a shared transponder and outcome of the second interrogation.
Figure 5.
Transaction-state timeline of a shared transponder and outcome of the second interrogation.
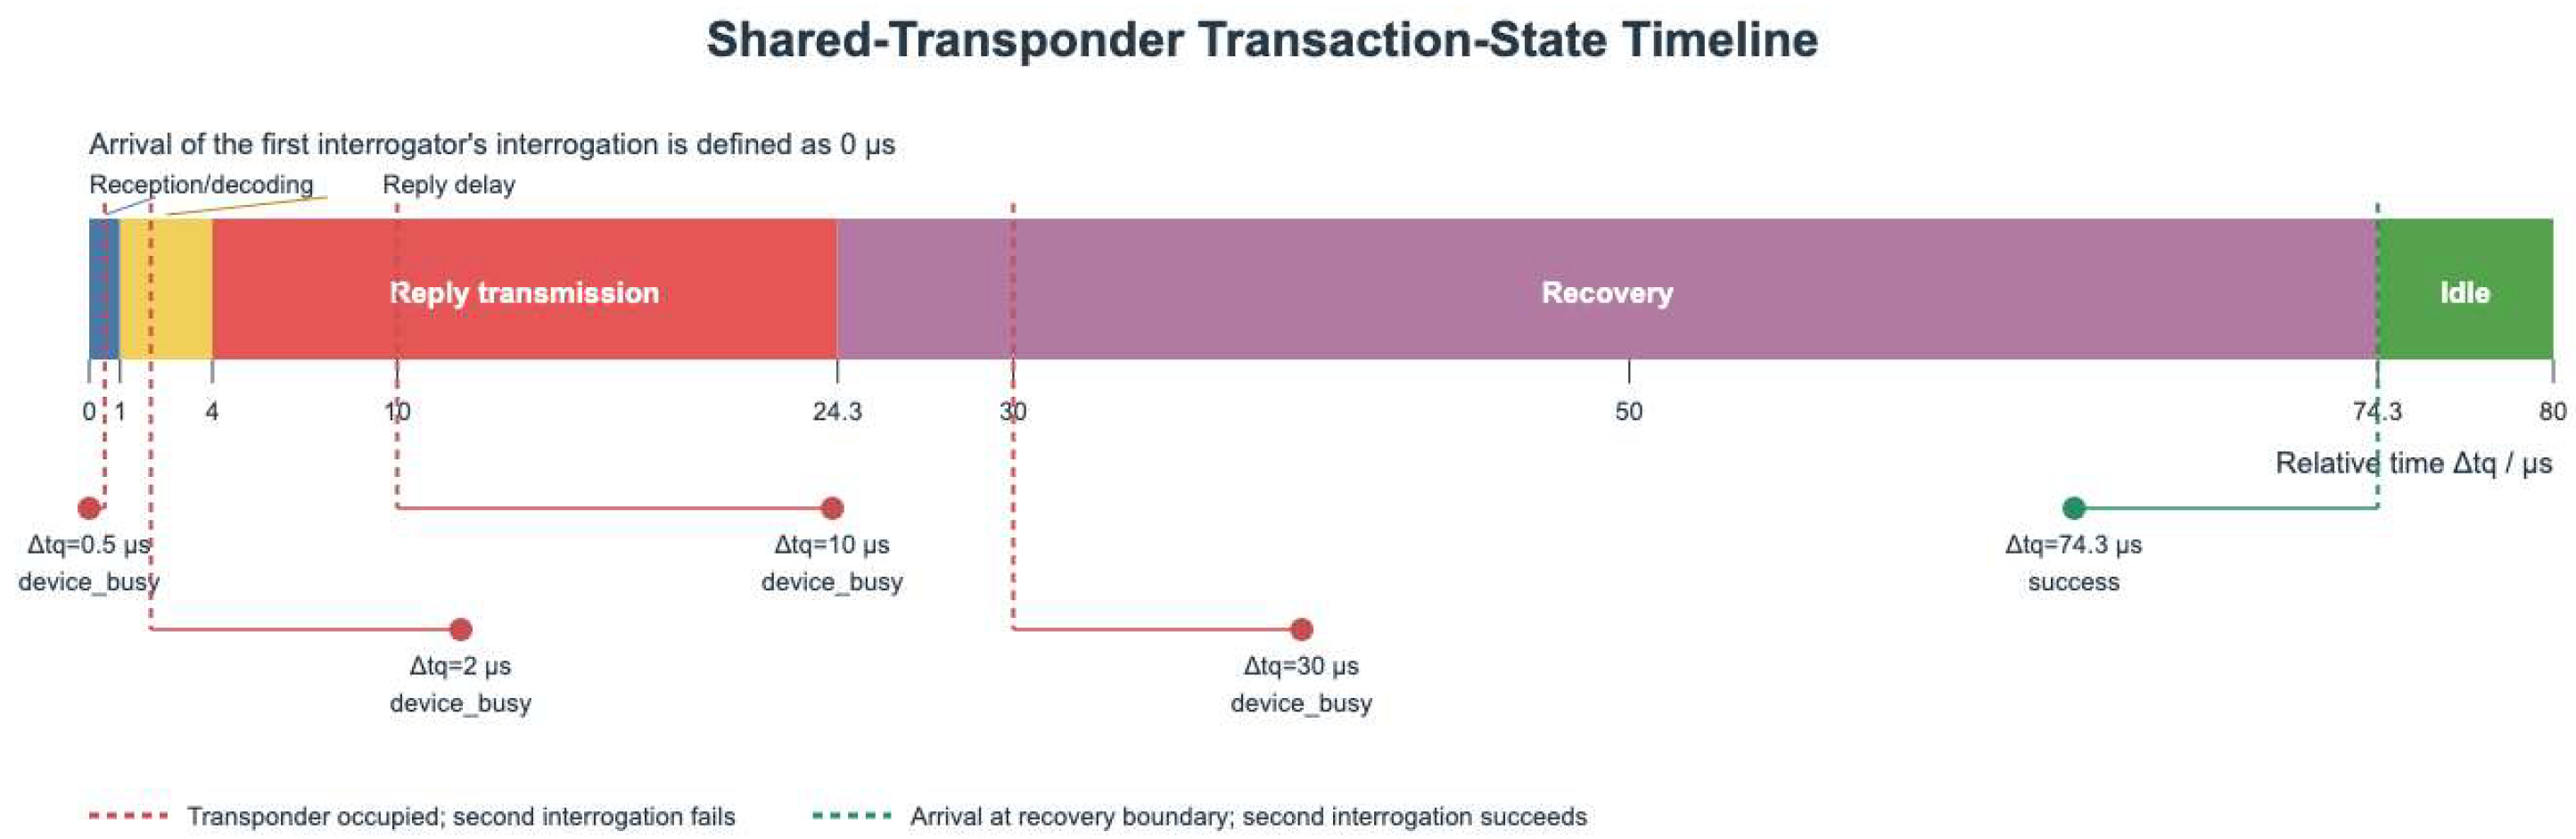
Figure 6.
–decision regions of capture-type and enhanced-separation receivers.
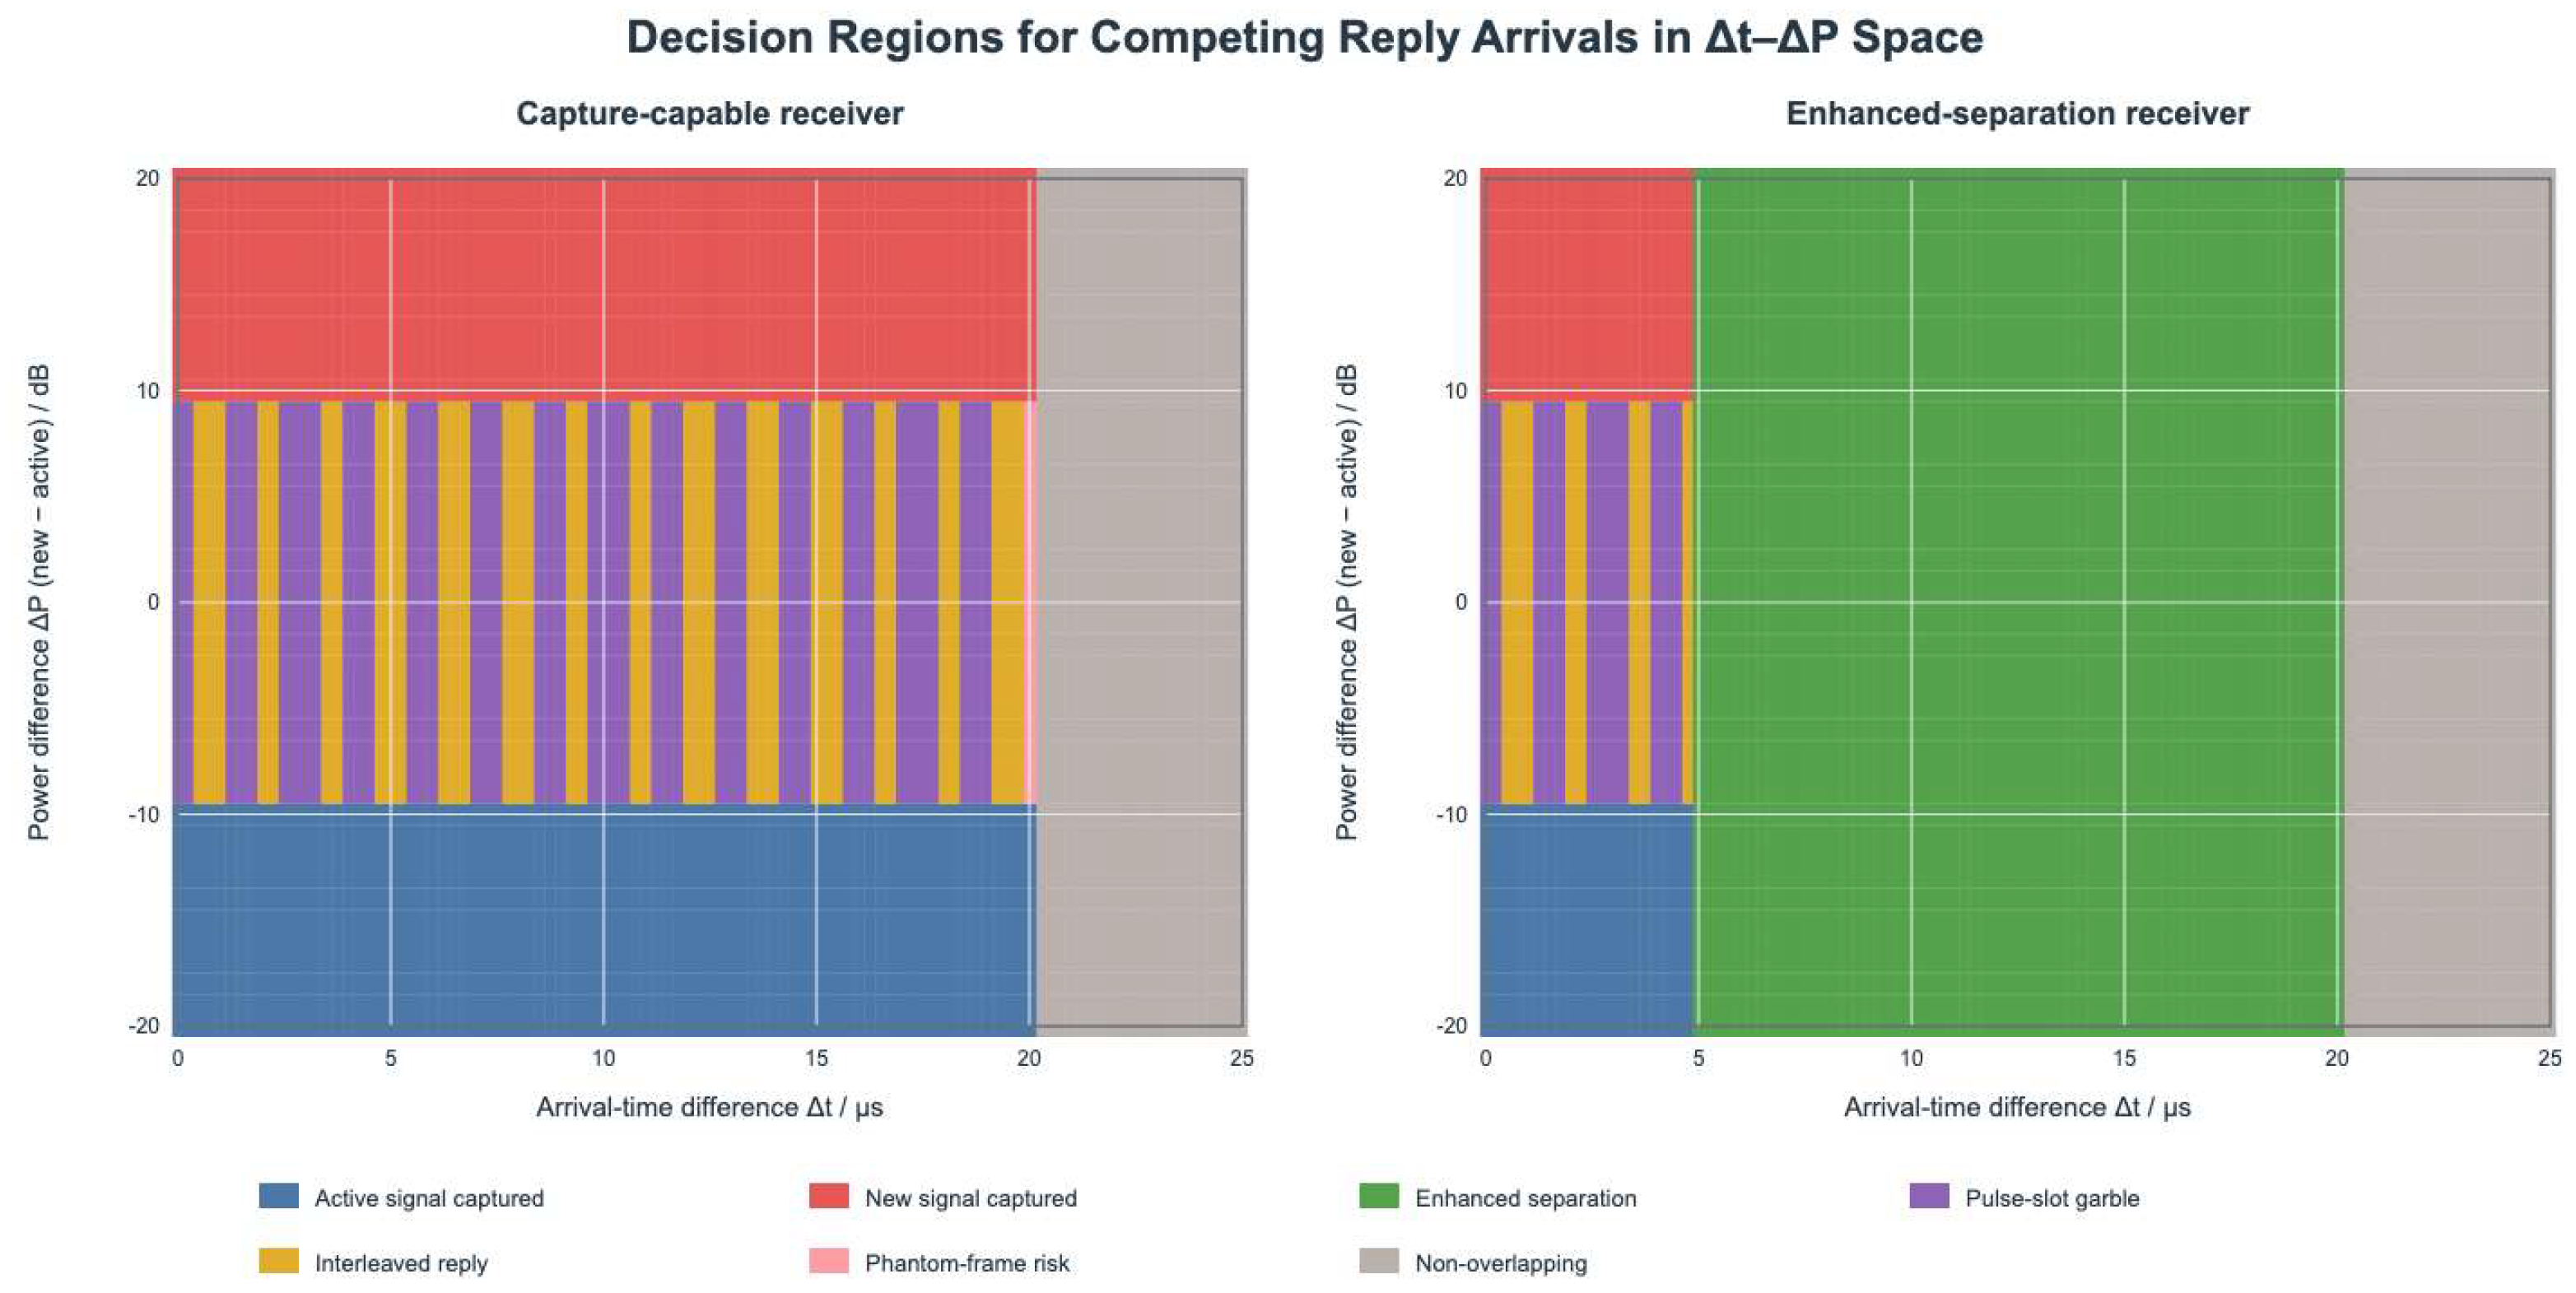

Table 1.
Principal features of Jsimu and publicly documented secondary-radar simulation systems.
| Feature | SISSIM [8] | ESIT [9] | Jsimu |
| Traffic and platform relationships | Primarily spatial snapshots | Positions remain fixed in detailed time-based simulation | Updated during execution from platform motion and event time |
| Mode S target state | Not stated in the public source | Pre-acquired and locked out | Acquisition, roll-call interrogation, and lockout occur during simulation |
| Device and reception competition | Based on measured device behavior | Includes device occupancy and message overlap | Cross-platform events compete for shared device states; all arrivals participate in a common reception process |
| Result evidence | Primarily load and performance results | Primarily system-performance results | Root transactions connect events, paths, reception interactions, stage outcomes, and system metrics |
| Configurable protocol behavior | Not described in the public source | Not described in the public source | Configurable signal formats, capabilities, compatibility relationships, reply rules, and scheduling policies |
Table 2.
Validation levels, comparison bases, and principal results.
| Level | Question addressed | Basis for comparison | Principal results |
| Rule implementation | Does the implementation reproduce the defined causal order and decision boundaries? | Analytically tractable microscopic scenarios and boundaries | Event timelines, state transitions, and reception-decision regions |
| System behavior | How does system performance vary with target density and mode composition? | Controlled sweeps of local beam density | Reply completion rate per valid interrogation and target–scan update-rate curves |
| External comparison | Which system outputs receive order-of-magnitude support from published results, and which sources constrain only the inputs? | MIT LL, ATC-83, ATC-84, and OpenSky | Absolute ranges, ratios, measurement envelopes, and real-world traffic geometry |
| Scaling semantics | Does acceleration alter the results, and how does computation grow with scale? | Paired runs with the spatial index disabled and enabled | Consistency checks, candidate-check counts, and execution time |
Table 3.
Boundary-validation results for a shared transponder state.
| Stage of first transaction | Analytical expectation | Program result | Assessment | |
| 0.5 s | Reception/decoding | device_busy | device_busy | Consistent |
| 2.0 s | Reply delay | device_busy | device_busy | Consistent |
| 10.0 s | Reply transmission | device_busy | device_busy | Consistent |
| 30.0 s | Recovery | device_busy | device_busy | Consistent |
| 74.3 s | Boundary of renewed availability | Success | Success | Consistent |
Table 4.
Validation results for dynamic geometry and discrete-event sampling.
| Scenario | Continuous dwell interval | Dwell time | Decoded interrogations/replies |
| Forward/reverse, 200 ms | 9.710191–20.289809 s | 10.579619 s | 53/53 |
| Forward, 500 ms | 9.710191–20.289809 s | 10.579619 s | 21/21 |
| Double speed, 200 ms | 4.855095–10.144905 s | 5.289809 s | 26/26 |
| Outside beam throughout, 200 ms | None | 0 | 0/0 |
Table 5.
Parameters of the controlled local-beam-density experiment.
| Parameter | Value |
| Local coordinates of four sites | and km; site altitude 50 m |
| Target corridor | 32 nested parallel trajectories; initial –km; lateral coordinate km; altitude 8 km; speed 200 m/s |
| Antenna | Circular scan; beamwidth 2.45°; scan period 4.8 s; maximum target azimuthal spread 1.95° |
| Steady-state A/C-like scheduling | A/C-like only: 10 ms; mixed-group A/C-like: 20 ms |
| Steady-state Mode S-like scheduling | Mode S-like-only roll-call: 10 ms; mixed-group Mode S-like roll-call: 20 ms; at most 12 non-overlapping roll-call interrogations scheduled per slot |
| Nominal signal parameters | Ground transmission 61 dBm; ground reception threshold dBm; airborne transmission 51 dBm; airborne interrogation-reception threshold dBm; single-event decoding probability 0.95 |
| Isolation conditions | Sidelobes, scattering, multipath, and external blocking disabled; initialization scan excluded from steady-state results |
Table 6.
Reference comparison between Jsimu scan-level results and published MIT LL results.
| Jsimu scenario and statistical definition | Jsimu result | Published MIT LL reference |
| 50 targets/20°, A/C-like all-call | 92.853% | ARTS all targets: 94.6% |
| 50 targets/20°, Mode S-like steady state | 96.767% | TMF crossing-track targets: 96.6%; all targets: 98.0% |
| 50 targets/11.5°, A/C-like all-call | 85.320% | Capacity condition: 50 targets/11.5°; ARTS crossing-track targets: 86.9% |
| 50 targets/11.5°, Mode S-like acquisition followed by selective addressing | 88.050%–99.600% | Capacity condition: 50 targets/11.5°; TMF crossing-track targets: 96.6% |
Table 7.
FRUIT-like arrival rates compared with the historical ATC-84 envelopes.
| Receiver threshold | Jsimu FRUIT-like arrival rate | Approximate ATC-84 measurement envelope |
| dBm | 6,542.4 replies/s | 6,300–7,600 replies/s |
| dBm | 2,755.6 replies/s | 2,700–3,500 replies/s |
| dBm | 932.8 replies/s | 650–1,250 replies/s |
Table 8.
Spatial-index scale and execution performance.
| Aircraft | Scheduled events | Candidate checks: disabled | Candidate checks: indexed | Candidate reduction | Execution time: disabled | Execution time: indexed | Speedup |
| 30 | 18,806 | 203,286 | 93,685 | 53.915% | 9.527 s | 5.443 s | 1.750 |
| 60 | 33,132 | 409,620 | 185,391 | 54.741% | 19.541 s | 10.145 s | 1.926 |
| 90 | 47,912 | 617,010 | 280,769 | 54.495% | 30.347 s | 15.300 s | 1.984 |
| 120 | 59,390 | 819,708 | 370,935 | 54.748% | 41.703 s | 20.108 s | 2.074 |
Disclaimer/Publisher’s Note: The statements, opinions and data contained in all publications are solely those of the individual author(s) and contributor(s) and not of MDPI and/or the editor(s). MDPI and/or the editor(s) disclaim responsibility for any injury to people or property resulting from any ideas, methods, instructions or products referred to in the content. |
© 2026 by the authors. Licensee MDPI, Basel, Switzerland. This article is an open access article distributed under the terms and conditions of the Creative Commons Attribution (CC BY) license (http://creativecommons.org/licenses/by/4.0/).
Copyright: This open access article is published under a Creative Commons CC BY 4.0 license, which permit the free download, distribution, and reuse, provided that the author and preprint are cited in any reuse.