

Submitted:
31 August 2026
Posted:
01 September 2026
You are already at the latest version
Abstract
This paper presents an adaptive digital twin framework for intelligent fault diagnosis and predictive health monitoring of a coupled multi-machine electric drive system. The experimental platform consists of two synchronous motors and a synchronous generator arranged in an interconnected electromechanical configuration and instrumented through the Lucas-Nülle laboratory platform. A physics-based digital representation is integrated with experimental measurements to reproduce the electrical and mechanical behavior of the drive system under different operating conditions. Physical-to-digital residuals are subsequently used for health assessment, fault detection, fault isolation, and intelligent classification. Experimental validation under five load conditions resulted in mean root-mean-square errors of 0.0391 N·m for torque, 0.1079 A for motor current, and 0.4555 V for motor voltage, with an overall mean normalized RMSE of 4.16%. The experimentally validated healthy-state digital twin was subsequently evaluated using model-based current-sensor, voltage-sensor, and torque-degradation scenarios. Channel-specific residual analysis successfully detected and isolated the abnormalities under investigation. Using digital-twin residual features, an Ensemble classifier achieved a test accuracy of 98.61%, outperforming ANN and SVM classifiers. In addition, a prognostic indicator was developed to characterize progressive degradation, with threshold crossings observed at simulated severities of 1.26%, 12.44%, and 17.37% for voltage-sensor deviation, torque degradation, and current-sensor deviation, respectively. The results demonstrate that integrating experimentally validated digital-twin modeling, residual-based diagnostics, intelligent classification, and degradation monitoring provides a unified framework for condition assessment of coupled multi-machine electric-drive systems.
Keywords:
digital twin
; electric drives
; multi-machine systems
; fault diagnosis
; predictive monitoring
; residual analysis
; machine learning
; condition monitoring
1. Introduction
The advent of the Fourth Industrial Revolution has enabled machine-to-machine interaction through sophisticated sensing technologies that support real-time adaptation, analysis, and optimal decision-making. In modern industrial systems, induction motors, often regarded as the workhorses of industry, are widely utilized in industrial processes and domestic applications [1]. Multi-phase electric drives are increasingly adopted in high-performance applications, including electric vehicles, aerospace, marine systems, and renewable energy, owing to their high torque density, efficiency, and fault tolerance [2]. Three-phase induction machines offer several well-recognized advantages, including low maintenance requirements, high reliability, simple construction, ruggedness, and widespread commercial availability. Industrial electric-drive systems are essential for powering machinery and controlling a wide range of industrial processes. Precise control of motor variables, particularly torque and position, is critical for maintaining the required performance and quality of industrial operations [3].
Breakdowns during operation can result in severe economic and safety consequences, including significant repair costs, unscheduled production shutdowns, increased labor requirements, and missed production deadlines. Moreover, operation under faulty conditions can significantly reduce system efficiency and create serious safety hazards [4].
Therefore, the development of methods for the early detection of faults, particularly at their incipient stages, remains an important scientific and technical challenge [5]. Electrical-machine faults may involve stator-winding faults, rotor faults, bearing faults, and static or dynamic eccentricity, all of which can adversely affect machine reliability and operating performance [5]. Bearing failures represent a substantial proportion of rotating-machine failures and can result in unplanned downtime and significant economic losses [6]. If bearing faults are not diagnosed accurately and promptly, they may lead to equipment damage, production interruption, economic losses, and safety incidents [7].
The increasing complexity of electrical machines and their growing integration into critical infrastructure have intensified the demand for robust fault-diagnosis techniques to ensure operational reliability, safety, and efficiency [8]. Recently, deep learning (DL) technologies have been widely used for rotating machinery fault diagnosis due to their ability to adaptively process high-dimensional, complex data [9]. In 2019, Li X. proposed a fault-diagnosis approach based on deep generative adversarial networks (GANs) and cross-domain transfer learning, demonstrating effective cross-domain diagnostic performance when the test data differed from the training dataset [10]. Existing fault-diagnosis methods increasingly rely on machine-learning and deep-learning approaches, among which Convolutional Neural Networks (CNNs), Long Short-Term Memory (LSTM) networks, and autoencoders have demonstrated strong feature-extraction capabilities, although their applicability may remain restricted in certain operating environments [11].
A broad range of failure conditions requires continuous monitoring, including single-phase burnout, overload, voltage imbalance, and voltage spikes, which are commonly encountered in motors controlled by variable-frequency drives [12]. Fault monitoring (FM) involves continuously observing a system to detect and diagnose abnormalities caused by equipment faults, process faults, or other disruptive events as early as possible. This process is essential for maintaining the quality, efficiency, reliability, and safety of manufacturing processes, transportation systems, power plants, and other complex engineering systems [13].
Recently, Industry 4.0 has accelerated the digital transformation of industrial systems. Digital twin (DT) technology, as an important component of Industry 4.0, offers significant potential for improving industrial competitiveness, productivity, and operational efficiency [14]. Advances in communication and information technologies have further supported digital manufacturing through the development of digital-twin models and process simulations [15]. A digital twin (DT) has been defined as “an integrated simulation of a complex product, which can mirror the life of its corresponding physical twin” [15].
Digital-twin technology (DTT) is distinguished by the reciprocal interaction between physical and virtual representations, differentiating it from conventional Internet of Things (IoT) or computer-aided design approaches [15]. The ability of digital twins to accommodate diverse system configurations is particularly important for the accurate interpretation, monitoring, and efficient operation of complex mechanical systems [15].
Despite the research gap regarding the increasing use of digital twins and intelligent algorithms for electrical machine condition monitoring, most reported approaches remain focused on individual motors, isolated mechanical components, or specific fault mechanisms. Such approaches do not fully represent the interactions that arise in coupled multi-machine drive systems, where electrical or mechanical deviations originating in one component may influence the behavior of other interconnected machines. Furthermore, digital-twin tracking, residual-based fault isolation, intelligent classification, and progressive degradation monitoring are often investigated separately rather than within a unified experimental framework. These limitations motivate the development of an integrated approach that can represent multi-machine interactions while simultaneously supporting condition tracking, fault diagnosis, and predictive health assessment. Figure 1 summarizes this research gap and the resulting contributions of the proposed study.
The principal contributions of this work are summarized as follows:
- Development of an adaptive digital-twin framework for a coupled SM1–SG–SM2 electric-drive configuration rather than an isolated single-machine system.
- Experimental characterization and digital-twin validation across multiple load, frequency, excitation, and phase-shift operating conditions using a Lucas-Nülle laboratory platform.
- Development of channel-specific physical-to-digital residual indices for torque, current, and voltage, enabling fault detection and isolation using experimentally established healthy baselines.
- Integration of digital-twin residual features with SVM, Ensemble, and ANN classifiers for intelligent identification of healthy and abnormal operating conditions.
- Introduction of health, fault-severity, and prognostic indicators for monitoring the evolution of physical-to-digital deviations under progressive degradation.
- Experimental evaluation of digital-twin tracking accuracy together with model-based fault-injection studies for assessing diagnostic and predictive-monitoring performance.
2. Related Work
Digital-twin-based condition monitoring has received increasing attention in electrical machines, rotating machinery, manufacturing systems, and industrial drive applications. Recent studies have combined physics-based models with machine-learning techniques, parameter estimation, domain adaptation, and prognostic methods to improve fault-diagnosis performance under changing operating conditions. In electrical-drive applications, digital twins have been investigated for individual permanent-magnet synchronous machines, induction motors, DC motors, and drivetrain components. Other studies have extended the concept toward bearing and gearbox degradation, manufacturing systems, and multi-motor applications.
Although these studies demonstrate the potential of digital twins for condition monitoring, several limitations remain. A substantial portion of the existing literature considers a single machine or a specific mechanical component. Multi-machine studies, on the other hand, generally emphasize fault diagnosis without simultaneously addressing adaptive digital-twin synchronization, residual-based isolation, intelligent classification, and progressive health monitoring. In addition, experimental validation across multiple electrical and mechanical operating conditions remains limited. The present study addresses this gap using the coupled SM1–SG–SM2 laboratory configuration.

Table 1.
Adaptive Digital Twin-Driven Intelligent Fault Diagnosis and Predictive Monitoring of Multi-Machine Electric Drive Systems.
Table 1.
Adaptive Digital Twin-Driven Intelligent Fault Diagnosis and Predictive Monitoring of Multi-Machine Electric Drive Systems.
| Ref. | Year | System / Application | Digital Twin Approach | AI / Diagnostic Method | Monitoring Target | Predictive Monitoring | Main Limitation Compared with Proposed Work |
|---|---|---|---|---|---|---|---|
| [12] | 2023 | Electric Drive / Induction Motor | EKF-based DT | EKF state and parameter estimation | Electrical-drive condition | Partial | Single electric drive; no coupled multi-machine diagnosis |
| [11] | 2023 | Industrial AC Machine | Hybrid DT | Predictive ML | Electrical and mechanical condition | Yes | Single AC machine; no multi-machine coordination |
| [10] | 2023 | General Engineering Systems | DT-based fault monitoring | Fault-monitoring framework | System abnormalities | Partial | General framework; not specifically developed for coupled electric drives |
| [14] | 2024 | DC Motor | Self-Aware DT | PSO-based identification | Parameter drift | Yes | Demonstrated on a single machine |
| [15] | 2024 | PMSM Generating Unit | Physics-based DT | EKF parameter identification | Parameter variation | Partial | Application-specific PMSM generating unit; no integrated AI diagnosis |
| [6] | 2025 | Rolling Bearing | Full-Life Integrated DT | DT-data-assisted fault diagnosis | Bearing faults and degradation | Yes | Restricted to bearings rather than complete electric-drive systems |
| [8] | 2025 | Bearing Cage | DT-assisted degradation model | Data-driven degradation assessment | Bearing-cage degradation | Yes | Mechanical component only |
| [2] | 2025 | Multi-Three-Phase PMSM | Physics-Based DT | Physics/model-based analysis | Open-phase fault | Partial | One multi-phase machine rather than a coupled multi-machine system |
| [13] | 2025 | Rotating Machine | Data-Driven DT | Data-driven machine monitoring | Operating-condition deviations | Partial | Rotating-machine case study; no coupled SM–SG–SM architecture |
| [4] | 2026 | Frequency-Regulated Electrical Machine | Mathematical DT | Frequency-characteristic analysis | Electrical-machine operating behavior | No | Focuses on frequency characteristics rather than integrated fault diagnosis and health prediction |
| [16] | 2024 | PMSM | Physics-Based DT | RBDO + Distance Clustering + Genetic Algorithm | PMSM Fault Detection / Condition Monitoring | Partial | Focuses on a single PMSM and sensor placement; no coupled multi-machine framework |
| [17] | 2025 | PMSM | DT Modeling Framework | Physics-Based, Data-Driven, and Hybrid Modeling | Fault Detection / Predictive Maintenance | Yes | PMSM-focused framework; no experimental coupled multi-machine diagnosis |
| [18] | 2025 | Rotating Machinery | DT-Inspired Frameworks | Physical Models + Deep Learning | Intelligent Fault Diagnosis + RUL | Yes | Review study; no unified experimental multi-machine implementation |
| [19] | 2025 | Rotating Machinery | DT-Driven Frameworks | Multiple DT Diagnostic Methods | Condition Monitoring, Fault Diagnosis, Life Prediction | Yes | Review of rotating machinery rather than a coupled electrical-drive implementation |
| [20] | 2025 | Electric Machines | DT-Based Fault Diagnosis | AI/ML + DT Modeling | Electrical and Mechanical Machine Faults | Yes | Review/application survey; no adaptive SM–SG–SM experimental framework |
| [21] | 2025 | Electric Motor / PMSM | FE-Based Healthy-Motor DT | Time-Series Modeling + GPR + Ensemble Learning |
Partial Discharge Detection and Localization | Partial | Targets a specific insulation-related fault in a single motor |
| Proposed Work | 2026 | Coupled SM1–SG–SM2 Electric Drive | Adaptive physics/data-integrated DT | Residual analysis + SVM + Ensemble + ANN | Current-sensor, voltage-sensor, torque degradation, system health | Yes—prognostic degradation monitoring | Unified multi-machine framework with experimentally validated healthy-state DT; physical fault experiments remain future work |
3. Proposed Mathematical Framework
The proposed adaptive digital twin framework is developed for the experimental multi-machine electric-drive configuration consisting of Synchronous Motor 1 (SM1), Synchronous Generator (SG), and Synchronous Motor 2 (SM2). The three machines form a coupled electromechanical system in which the operating condition of one machine can influence the dynamic response of the remaining machines through mechanical and electrical interactions. The mathematical framework, therefore, combines individual machine dynamics, multi-machine coupling, adaptive state and parameter estimation, residual generation, health assessment, and physics-informed intelligent fault diagnosis. This formulation provides the mathematical foundation for the adaptive digital twin architecture and the Lucas-Nülle multi-machine experimental platform. The overall mathematical organization of the framework is shown in Figure 2.
3.1. Multi-Machine State Representation
Consider a multi-machine electric-drive system composed of electrical machines. The overall system state vector is constructed by augmenting the individual state vectors of all machines as
where the state vector of the -th machine is defined as
For the experimental three-machine configuration,
Accordingly, the complete state vector contains the electrical - and -axis currents, mechanical angular velocities, and rotor angular positions of SM1, SG, and SM2. This augmented representation allows the digital twin to simultaneously track the dynamic states of the three machines rather than treating them as isolated components.
3.2. dq-Axis Electrical Model
The electrical dynamics of each synchronous machine are formulated in the synchronously rotating reference frame. For the -th machine, the stator voltage equations are expressed as
and
Rearranging (4) and (5) gives the current-state dynamics
and
The electrical angular velocity is related to the mechanical angular velocity through
where denotes the number of pole pairs of the -th machine.
The -axis representation is particularly suitable for the proposed digital twin because it provides physically interpretable electrical states that can be continuously estimated and compared with the corresponding physical measurements. Variations in stator resistance, excitation, loading, supply conditions, or other electrical abnormalities alter current dynamics and, consequently, generate measurable physical-to-digital deviations.
3.3. Flux-Linkage Model
The - and -axis flux linkages of the synchronous machine are represented by
and
For the laboratory synchronous machines, represents the effective excitation-field flux linkage. This formulation allows changes in the excitation condition to be incorporated into the digital representation and is particularly relevant because excitation current is among the experimentally monitored quantities in the proposed platform.
3.4. Electromagnetic Torque Model
The electromagnetic torque developed by the -th synchronous machine is given by
Substituting (9) and (10) into (11) yield
Equation (12) establishes the principal coupling between the electrical and mechanical dynamics of each machine. Consequently, electrical deviations in current, excitation, or machine parameters can propagate to the mechanical subsystem through the electromagnetic torque.
3.5. Mechanical Dynamic Model
The rotational dynamics of the -th machine are described by
where is the equivalent moment of inertia, is the viscous friction coefficient, is the externally applied load torque, and represents the torque exchanged with the mechanically coupled machine.
Therefore,
The rotor-position dynamics are
These equations enable the digital twin to reproduce the measured speed and torque behavior under no-load, variable-load, and model-based abnormal operating conditions.
3.6. Multi-Machine Electromechanical Coupling
For the experimental SM1-SG-SM2 configuration, the machines cannot be considered completely independent because their operating conditions are coupled. The corresponding coupling torque between machines and can be represented in a generalized form as
where and denote the equivalent coupling stiffness and damping coefficients, respectively.
For an ideally rigid mechanical coupling,
and
For the complete three-machine system, the coupling vector is defined as
This coupling representation is important for multi-machine fault diagnosis because a disturbance originating in one machine may produce secondary deviations in the remaining machines. The proposed digital twin can therefore evaluate both local machine residuals and system-level propagated effects.
3.7. Individual Machine State-Space Representation
The nonlinear dynamic model of the -th machine can be expressed compactly as
where
and
Around a given operating point, the nonlinear model can be represented in a local state-space form as
The corresponding measurement equation is
The explicit separation of normal inputs, coupling effects, faults, process disturbances, and measurement noise is important for residual-based diagnosis because the residual generator should be sensitive to physical faults while remaining robust against normal operating variations.
3.8. Unified Multi-Machine Dynamic Model
The individual machine models are combined into the augmented system
with the output equation
The global fault vector may be written as
The augmented formulation enables simultaneous representation of local machine faults and their propagation through the coupled multi-machine system.
3.9. Adaptive Digital Twin Model
The digital twin operates in parallel with the physical multi-machine platform. Its estimated state dynamics are formulated as
with
The correction term
synchronizes the virtual representation with the physical system measurements through a physical-to-digital correction. Unlike a conventional offline simulation, the digital twin receives information from the physical platform and updates its estimated states based on the physical-to-digital mismatch.
The state-estimation error is defined as
Under healthy operating conditions and proper observer design,
A persistent increase in the state-estimation error may consequently indicate model mismatch, abnormal operation, parameter degradation, or a physical fault. The adaptive digital-twin architecture is shown in Figure 3.
3.10. Online Parameter Adaptation
A fixed-parameter digital model may lose tracking accuracy when the physical machines experience variations in loading, thermal changes, parameter drift, or component degradation. The proposed adaptive digital twin, therefore, updates selected machine parameters online.
The estimated global parameter vector is defined as
For each machine,
The adaptive update law is formulated as
where
The matrix controls the adaptation rate, whereas represents the sensitivity or regression matrix relating parameter variations to the observed physical-to-digital error.
This adaptive mechanism allows the digital twin to follow legitimate changes in operating conditions without interpreting every parameter variation as a fault. At the same time, abnormal deviations that cannot be explained by normal parameter adaptation remain visible in the residual signals and can subsequently be processed by the diagnostic layer.
3.11. Physical-to-Digital Residual Generation
The residual vector constitutes the principal link between the physics-based digital twin and the intelligent diagnostic system. It is defined as
For the three-machine system,
The residual of each machine may contain current, voltage, speed, torque, and excitation-related deviations according to the available physical measurements,
For the linearized observer representation, the residual dynamics can be expressed as
Equation (40) shows that an appropriately designed observer suppresses the nominal state-estimation error while fault components entering through remain observable in the residual response.
3.12. Electrical and Mechanical Residual Indices
To separate electrical and mechanical abnormalities, two residual indices are introduced. The electrical residual index for the machine is
The mechanical residual index is
The local residual magnitude of machine is consequently defined as
A system-level residual can then be obtained from
subject to
The weighting factors allow the diagnostic framework to account for the relative importance or operating criticality of individual machines.
3.13. Normalized Residual and Fault Detection
Because the monitored variables have different physical units and operating ranges, a normalized residual can be defined as
where represents the healthy-condition standard deviation of the -th measurement and prevents division by zero.
A fault-detection decision variable is then formulated as
where is the experimentally determined healthy-to-fault residual threshold. This formulation permits the diagnostic threshold to be derived from healthy baseline measurements rather than being arbitrarily selected.
3.14. Health Index
A normalized machine health index is derived from the residual magnitude as
where is a normalization constant determined from the healthy operating region.
The health index satisfies
Thus, indicates close agreement between the physical machine and its digital twin, whereas indicates an increasingly severe physical-to-digital deviation.
The overall multi-machine health index is defined as
This provides both machine-level and system-level health information, enabling the proposed framework to determine whether degradation is localized to a particular machine or affects the complete drive system.
3.15. Fault Severity Index
The normalized fault-severity index is defined as
Accordingly,
where values approaching zero represent healthy operation and increasing values indicate progressively larger physical-to-digital deviations.
The system-level fault severity is
3.16. Prognostic Indicator
To incorporate both the instantaneous machine condition and its degradation tendency, a prognostic indicator is introduced as
The health-index degradation rate is
The parameter controls the sensitivity of the prognostic indicator to the health degradation rate. Consequently, two machines with similar instantaneous health indices can yield different prognostic indicators if one exhibits a substantially faster rate of degradation.
The quantity is treated as a prognostic indicator rather than a direct remaining useful life estimate unless run-to-failure or sufficiently representative degradation data are available for explicit RUL training and validation.
3.17. Physics-Informed Feature Vector for Intelligent Diagnosis
Rather than relying exclusively on raw sensor measurements, the intelligent diagnostic layer uses features generated jointly from the physical measurements and digital-twin residuals. For the -th machine, the feature vector is formulated as
The complete multi-machine feature vector is
The fault classifier is consequently represented by
where denotes the estimated operating or fault class and represents the selected intelligent classifier.
This formulation provides a physics-informed diagnostic strategy because the classifier receives quantities that represent physical-to-digital inconsistency, electrical and mechanical deviation, and machine-health evolution rather than relying solely on unprocessed sensor data.
3.18. Digital Twin Tracking Performance
The accuracy of the adaptive digital twin can be quantitatively evaluated using the root-mean-square error (RMSE),
the mean absolute error (MAE),
and the normalized root-mean-square error,
These indices can be evaluated independently for speed, torque, current, voltage, and other measured quantities under different loading conditions. They also provide a quantitative basis for comparing the proposed adaptive digital twin with a conventional fixed-parameter digital model.
3.19. Composite Optimization Objective
The adaptive digital twin can be formulated through a composite objective function that simultaneously considers tracking accuracy, parameter consistency, and fault sensitivity:
subject to
The first term penalizes physical-to-digital tracking error, the second represents parameter-estimation mismatch, and the third incorporates the health-related diagnostic state. The weighting coefficients , , and determine the relative contribution of each objective.
The complete mathematical framework, therefore, establishes a closed relationship among the physical multi-machine system, the adaptive digital twin, online parameter updating, residual generation, machine-level health assessment, system-level health monitoring, and intelligent fault classification. The framework is designed to exploit the coupled SM1-SG-SM2 experimental configuration rather than independently monitoring each electrical machine.
3.20. Definition of Mathematical Symbols
The mathematical symbols used in the proposed framework are summarized in Table 2.
4. Experimental Setup and Digital-Twin Implementation
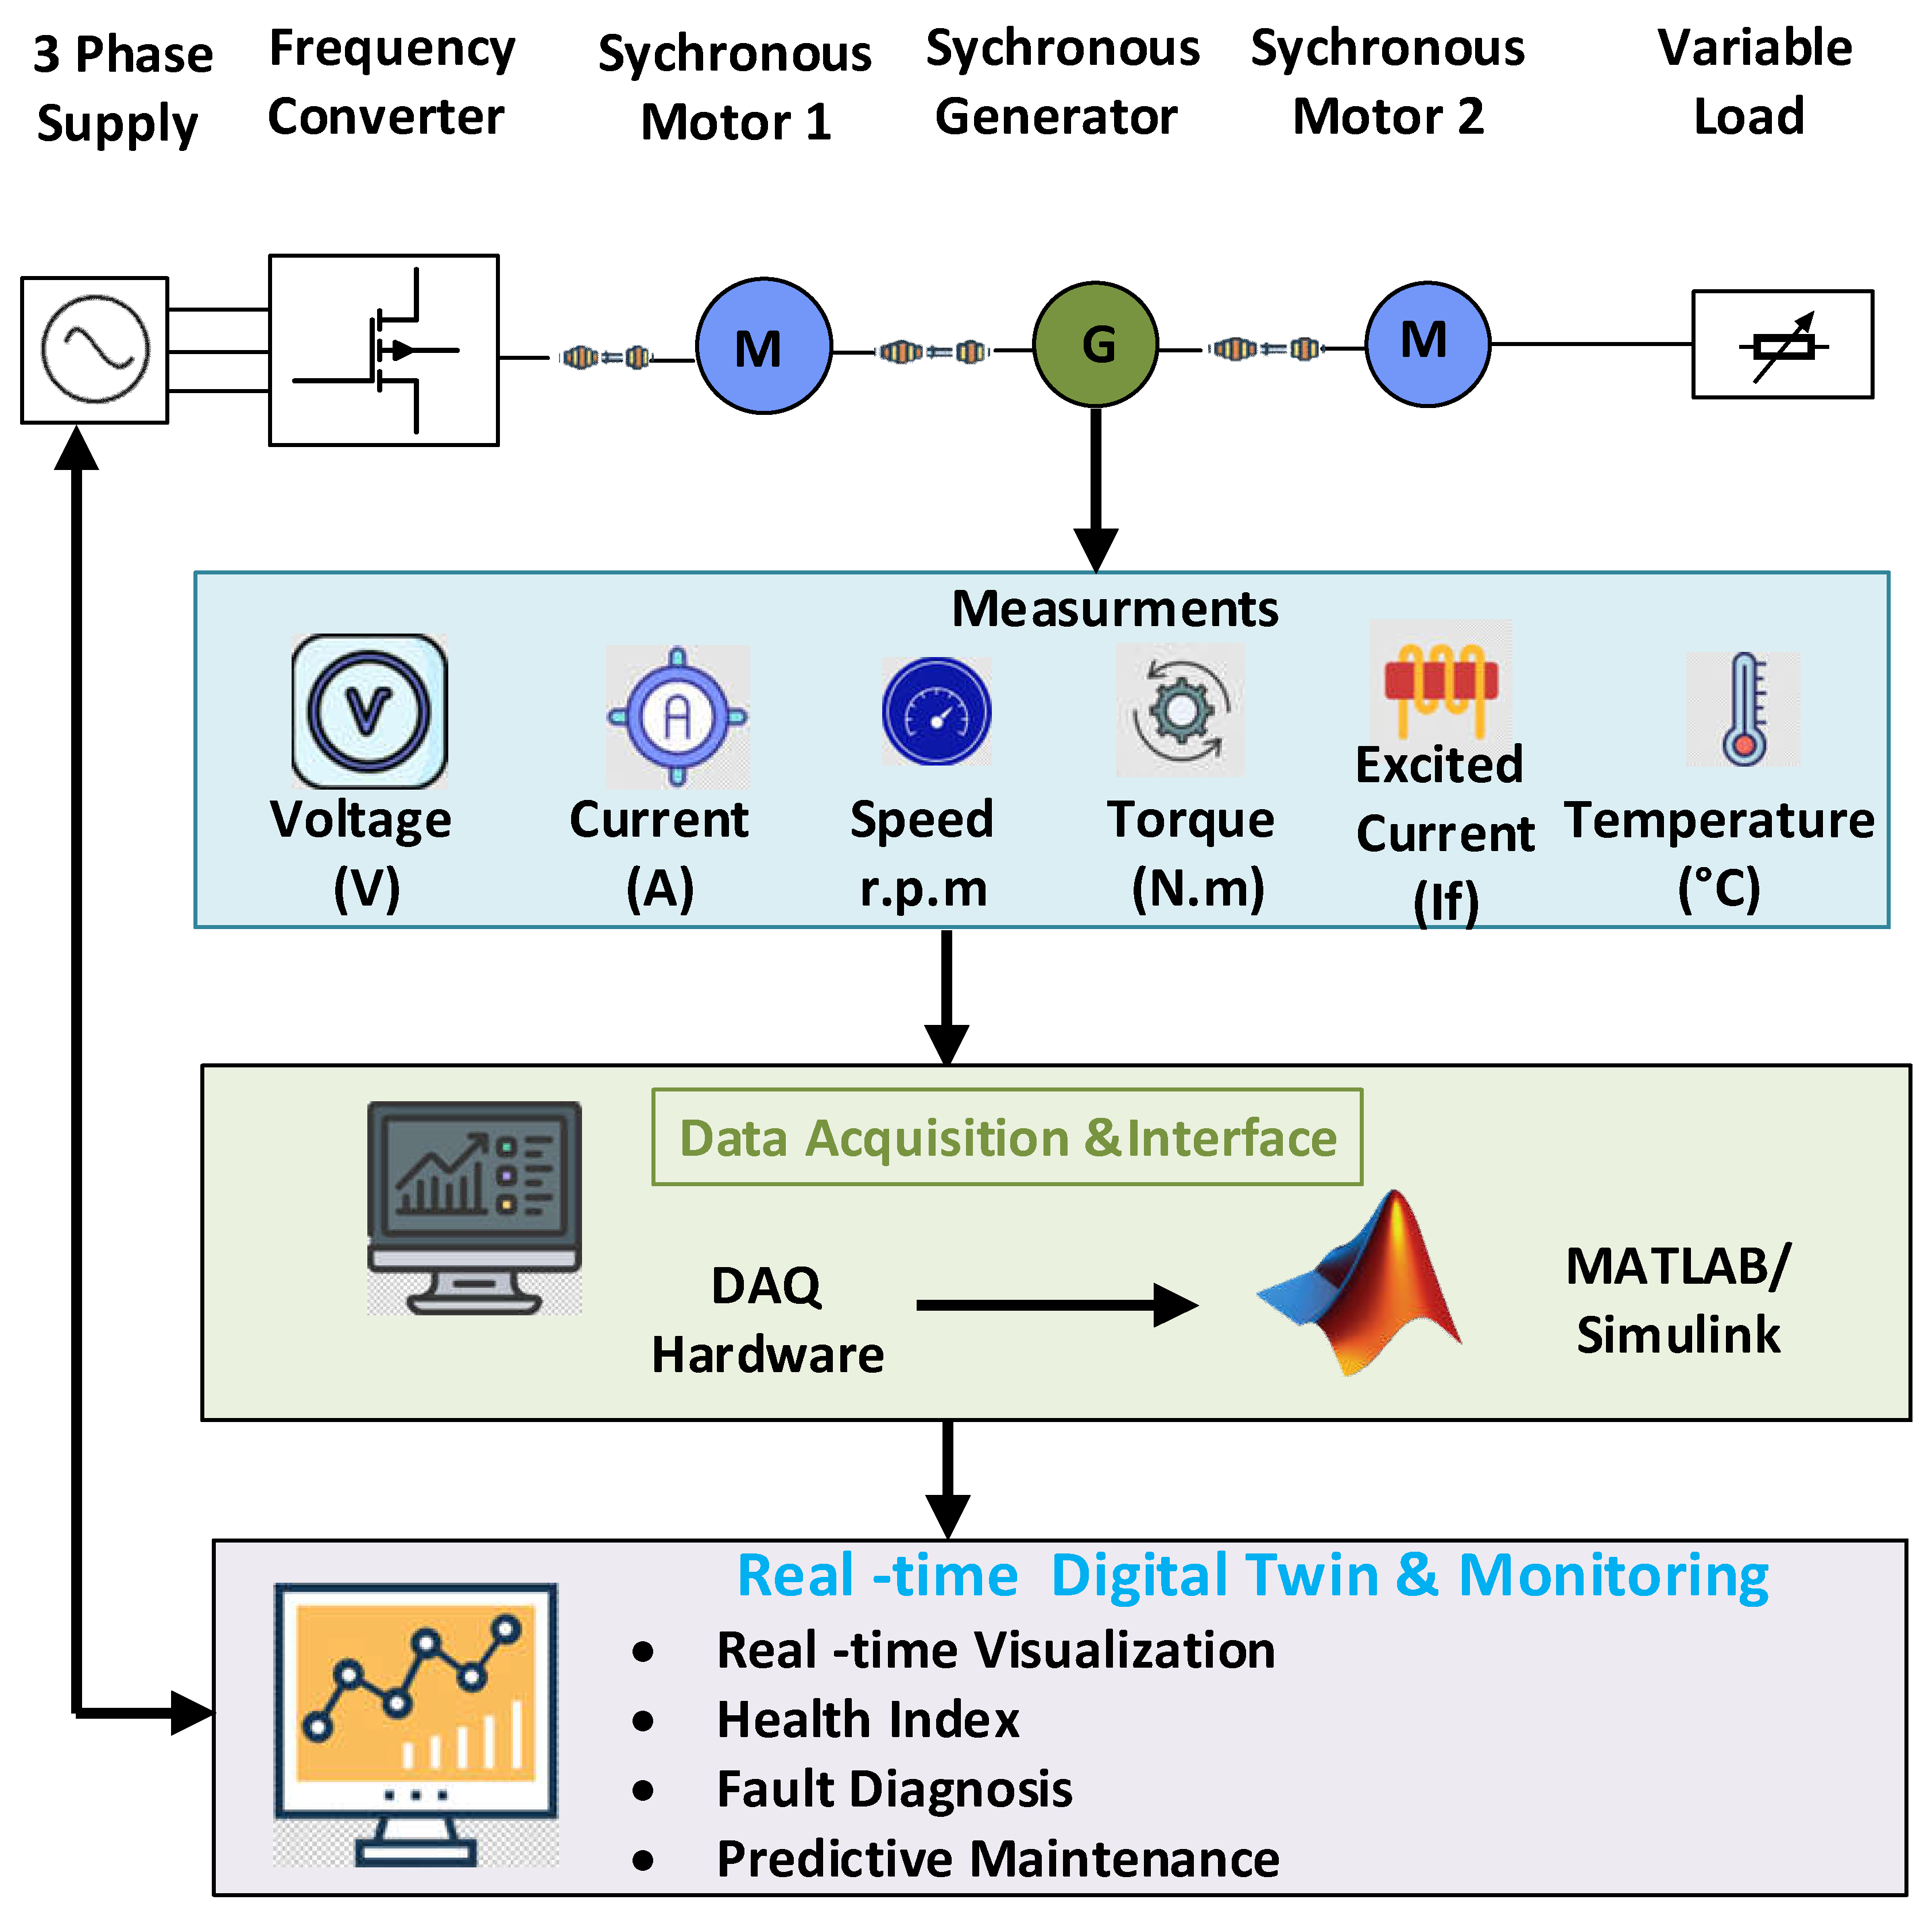
The experimental investigation was conducted on the Lucas-Nülle electrical machine laboratory platform, configured as a coupled multi-machine drive system. The physical system consisted of Synchronous Motor 1 (SM1), a Synchronous Generator (SG), and Synchronous Motor 2 (SM2). The machines were interconnected to permit the investigation of electrical and mechanical behavior under different excitation, frequency, phase-shift, and load conditions. Voltage, current, torque, excitation current, and other available electrical variables were acquired from the experimental platform and used for both operating-characteristic analysis and digital-twin validation. The laboratory platform is shown in Figure 5.
The experimental campaign included no-load phase-shift tests at 0°, 30°, and 60°, loaded resistance tests using R1–R5 conditions, and additional tests at different torque levels. The resistance values considered in the loaded experiments were 50, 100, 300, 500, and 1000 Ω. These operating conditions yielded a range of physical responses to evaluate the digital representation's ability to reproduce variations in torque, current, and voltage.
The digital-twin implementation was developed in MATLAB using the mathematical framework presented in Section 3. Experimental operating variables were supplied to the digital model, and its estimated outputs were continuously compared with the corresponding physical measurements. Torque, motor current, and motor voltage were selected as the principal validation channels because they provide complementary mechanical and electrical information regarding the operating state of the drive system. The integrated AI and digital-twin workflow is summarized in Figure 4.
Figure 4.
Workflow integrating the adaptive digital twin with residual-based health assessment and AI classification.
Figure 4.
Workflow integrating the adaptive digital twin with residual-based health assessment and AI classification.
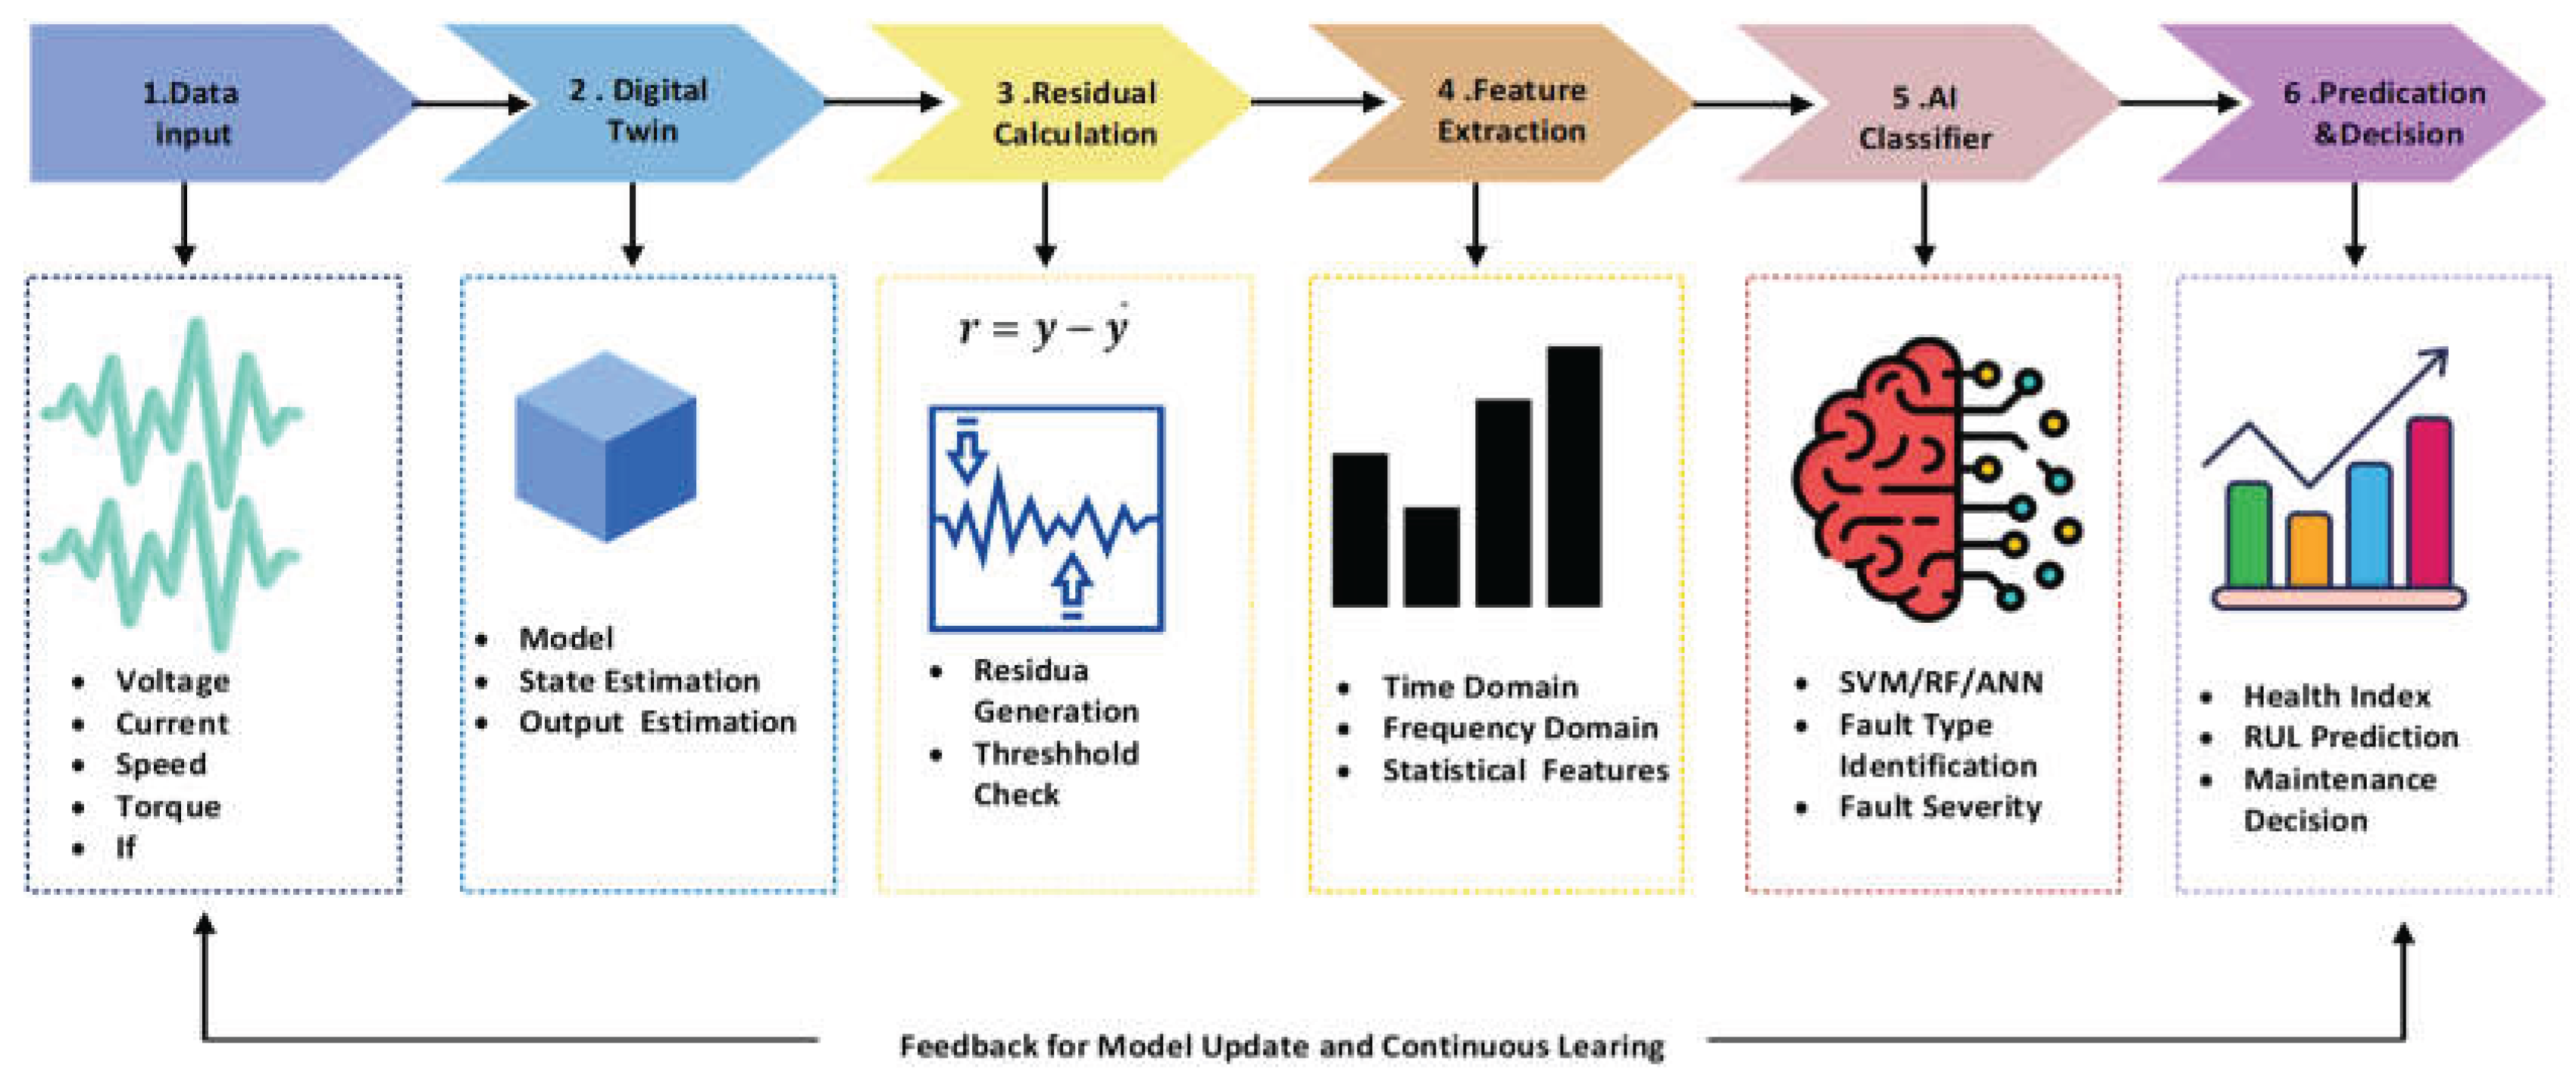
Figure 5.
The Lucas-Nülle laboratory platform is used to experimentally validate the multi-machine digital twin.
Figure 5.
The Lucas-Nülle laboratory platform is used to experimentally validate the multi-machine digital twin.
For each validation condition, the physical-to-digital tracking error was evaluated using RMSE and NRMSE. Healthy-state residual distributions were subsequently used to establish channel-specific detection thresholds. The experimentally validated digital twin, therefore, provided the baseline model against which abnormal deviations could be identified. Fault-diagnosis studies were then performed using model-based fault injection on the validated healthy data. The investigated scenarios included a +20% current-sensor deviation, a +15% voltage-sensor deviation, and a −20% torque-degradation condition. These scenarios were used to evaluate diagnostic sensitivity and fault isolation and were not treated as experimentally induced physical faults.
5. Results and Discussion
The experimental results are summarized in Table 3, Table 4, Table 5, Table 6 and Table 7. Table 3 presents the no-load phase-shift response; Table 4 reports performance under the R1–R5 resistance conditions; Table 5 summarizes motor-current behavior at different torque levels; Table 6 consolidates the main experimental trends; and Table 7 identifies the datasets used for digital-twin calibration and validation.
5.1. Experimental Results and Digital-Twin Validation
5.1.1. Torque Tracking
Figure 6 compares the experimentally measured torque with the corresponding digital-twin estimate under the R3 = 300 Ω load condition. The digital twin closely follows the experimental torque profile over the investigated frequency range, including the nonlinear increase observed at higher frequencies. The small deviations between the measured and estimated responses indicate good tracking capability of the developed digital twin. Across all evaluated load conditions, the mean torque RMSE was 0.0391 N·m, demonstrating accurate reproduction of the measured mechanical behavior.
5.1.2. Motor Current Tracking
Figure 7 presents the comparison between the measured motor current and the digital-twin prediction for R3 = 300 Ω. The predicted current closely follows the experimental response throughout the tested frequency range, with only minor deviations at selected operating points. The mean current RMSE across the five evaluated load conditions was 0.1079 A. These results demonstrate that the digital twin can effectively reproduce the electrical current characteristics of the experimental drive system under varying operating frequencies.
5.1.3. Motor Voltage Tracking
Figure 8 illustrates the experimental and digital-twin motor-voltage responses under the R3 = 300 Ω load condition. The digital-twin estimate follows the measured voltage trend over the complete frequency range and captures the more pronounced voltage increase at higher frequencies. The mean voltage RMSE across R1–R5 was 0.4555 V. Considering torque, current, and voltage jointly, the digital twin achieved an overall mean NRMSE of 4.16%, confirming consistent tracking performance across the experimentally evaluated operating conditions.
5.1.4. Health Index and Fault Diagnosis
Table 8 summarizes the digital-twin tracking errors, residuals, health indices, and diagnostic decisions across the evaluated load conditions.
Across the experimentally evaluated healthy load conditions, the mean torque, current, and voltage RMSE values were 0.0391 N·m, 0.1079 A, and 0.4555 V, respectively. The mean NRMSE was 4.16%, and the mean health index was 0.9179.
Figure 9 shows the digital-twin-based health index obtained for the five experimentally evaluated load conditions, ranging from R1 = 50 Ω to R5 = 1000 Ω. The health index remained above 0.90 for all cases, with a mean value of 0.9179. The lowest value, approximately 0.9025, occurred at R4 = 500 Ω, whereas the highest value, approximately 0.9273, was obtained at R5 = 1000 Ω. All operating conditions were therefore classified as healthy according to the adopted health-index criterion. These healthy-state results establish the baseline against which residual growth and health-index degradation under subsequent fault conditions can be evaluated.
Figure 10 presents the normalized channel-specific residual scores obtained from the digital twin under healthy and simulated fault conditions. Separate detection thresholds were established for the torque, current, and voltage channels using the healthy experimental validation data. The healthy condition remained below the normalized detection threshold of 1 for all three channels. In contrast, the simulated 20% current-sensor fault increased the current residual score to 1.128, the 15% voltage-sensor fault increased the voltage residual score to 8.735, and the 20% torque degradation increased the torque residual score to 1.612. The dominant residual therefore provides a clear signature for both fault detection and fault isolation.
The use of channel-specific thresholds is particularly important because torque, current, and voltage have different physical units, operating ranges, and healthy-state variability. A single absolute residual threshold would therefore provide an inconsistent basis for comparison among the monitored variables. In the proposed approach, each residual is normalized using its corresponding healthy baseline before the diagnostic decision is made. Consequently, a normalized score greater than unity represents a deviation beyond the established healthy operating region. This formulation also explains the distinct residual signatures observed for the three investigated fault scenarios and enables the affected measurement channel to be identified directly.
The channel-specific detection and isolation results are summarized in Table 9.
The normalized detection boundary was set to 1. Before normalization, the channel-specific thresholds were 0.10678 N·m for torque, 0.33973 A for current, and 0.98283 V for voltage. The three abnormal cases were generated through model-based fault injection applied to experimentally validated healthy data; therefore, they are reported as simulated fault conditions rather than experimentally induced hardware faults.
Figure 11 illustrates the residual signature map generated from the channel-specific digital-twin residuals. Under the healthy operating condition, all residual scores remained below their corresponding detection thresholds. Each injected fault produced a dominant response in its associated physical channel: the current-sensor fault was characterized by an increased current residual, the voltage-sensor fault produced a dominant voltage residual, and the torque-degradation condition resulted in a dominant torque residual. These distinct signatures enable straightforward isolation of the investigated fault types using the digital-twin residual framework.
The Ensemble classifier achieved the best overall test performance, with an accuracy of 98.61%. As shown in Figure 12, the classifier correctly identified 100% of the current-sensor and voltage-sensor fault samples and 98.5% of the torque-fault samples. The healthy class achieved a recall of 84.6%, with 15.4% of the healthy test samples misclassified as torque faults. These results demonstrate that the digital-twin residual features provide strong discrimination among the investigated operating conditions, while also indicating that further refinement of the healthy–torque-fault decision boundary could reduce false alarms.
Figure 13 compares the classification performance of the SVM, Ensemble, and ANN models. The Ensemble classifier provided the highest test accuracy of 98.61%, followed by the ANN at 98.15% and the SVM at 97.69%. The Ensemble model also achieved a macro-precision of 0.9890, macro-recall of 0.9578, and macro-F1 score of 0.9718, and was therefore selected as the best-performing classifier for the proposed diagnostic framework.
Table 10 provides the corresponding accuracy, precision, recall, and F1-score values for the evaluated classifiers.
Figure 14 illustrates the evolution of the digital-twin prognostic indicator under progressively increasing simulated current-sensor, voltage-sensor, and torque-degradation conditions. The prognostic indicator increases with fault severity and crosses the normalized detection boundary at different degradation levels depending on the monitored channel. The voltage-related indicator exhibited the highest sensitivity, reaching the detection threshold at approximately 1.26% simulated severity, whereas the torque-degradation and current-sensor indicators crossed the threshold at approximately 12.44% and 17.37%, respectively. These results demonstrate the ability of the digital-twin framework to track progressive degradation trends and provide an early warning indicator prior to severe operating deterioration. The reported prognostic indicator is used for predictive health monitoring and is not interpreted as a direct remaining useful life estimate.
The prognostic-indicator threshold-crossing severities are summarized in Table 11.
5.2. Discussion
The experimental results demonstrate that the proposed digital twin can reproduce the principal electrical and mechanical characteristics of the multi-machine drive system across the evaluated operating conditions. The mean tracking errors of 0.0391 N·m for torque, 0.1079 A for current, and 0.4555 V for voltage, together with an overall mean NRMSE of 4.16%, indicate close agreement between the experimental measurements and the corresponding digital-twin estimates. The health index remained above 0.90 for all five experimentally evaluated load conditions, further demonstrating the stability of the healthy-state digital representation. These results are particularly important because accurate healthy-state tracking establishes the baseline required for reliable residual-based diagnosis.
The fault-injection analysis further demonstrated that the physical-to-digital residuals provide interpretable signatures of abnormal conditions. Rather than producing only a global anomaly score, the proposed approach retains the contribution of individual physical channels. Consequently, the current-sensor deviation primarily increased the current residual, the voltage-sensor deviation generated a dominant voltage residual, and torque degradation primarily affected the torque residual. This behavior provides both detection and isolation capability and reduces the dependence on black-box classification alone.
The AI classification results support this observation. All three evaluated classifiers achieved test accuracies above 97%, while the Ensemble classifier achieved the highest accuracy of 98.61% and an F1-score of 0.9718. The confusion matrix nevertheless revealed that 15.4% of healthy samples were classified as torque faults, indicating partial overlap between healthy and low-level torque-degradation residual features. This represents an important area for further refinement through additional experimental data, adaptive decision boundaries, or temporal residual features.
The progressive degradation analysis extends the framework beyond instantaneous fault classification. The prognostic indicator increased systematically with simulated degradation severity, although the sensitivity varied considerably among channels. Voltage deviations produced the earliest threshold crossing, followed by torque degradation and current-sensor deviation. This behavior demonstrates the potential of the digital twin for early-warning applications while also showing that diagnostic thresholds should account for the sensitivity and natural variability of individual measurements. The prognostic indicator is intentionally interpreted as a degradation indicator rather than as an estimate of remaining useful life because the current experimental dataset does not include complete run-to-failure trajectories.
Overall, the results indicate that the main advantage of the proposed framework lies in the integration of physical modeling and data-driven diagnosis. The digital twin provides physically interpretable estimates and residuals, while the intelligent classifier converts these residual patterns into operating-condition decisions. The prognostic layer subsequently evaluates how these deviations evolve as degradation increases. This combination provides a unified path from physical measurement to state estimation, fault detection, fault classification, and predictive health monitoring for interconnected electric-drive systems.
6. Conclusions
This study presented an adaptive digital twin framework for intelligent fault diagnosis and predictive health monitoring of a coupled multi-machine electric drive system. The framework integrates a physics-based representation of the SM1–SG–SM2 configuration with experimental measurements, physical-to-digital residual generation, health assessment, intelligent classification, and progressive degradation monitoring.
Experimental validation demonstrated close agreement between the digital twin and the physical system under multiple load conditions. Mean RMSE values of 0.0391 N·m, 0.1079 A, and 0.4555 V were obtained for torque, current, and voltage, respectively, while the overall mean NRMSE was 4.16%. Channel-specific residual analysis successfully detected and isolated the investigated model-based current-sensor, voltage-sensor, and torque-degradation scenarios. Among the evaluated intelligent classifiers, the Ensemble model achieved the highest test accuracy of 98.61% and an F1-score of 0.9718. Progressive degradation analysis further demonstrated that the proposed prognostic indicator can identify the evolution of abnormal physical-to-digital deviations and provide an early-warning measure before severe deterioration.
The results demonstrate the feasibility of combining experimentally validated digital-twin modeling with residual-based diagnostics and intelligent classification for multi-machine electric-drive condition monitoring. Future work will extend the framework to experimentally induced physical faults, transient operating conditions, longer degradation trajectories, and online implementation. Such extensions will also enable the prognostic layer to progress from degradation indication to experimentally validated remaining useful life estimation.
Data Availability Statement
The original contributions presented in this study are included in the article. Further inquiries can be directed to the corresponding author.
Conflict of Interests
The authors declare no conflict of interest.
References
- Samiullah, M.; Ali, H.; Zahoor, S.; Ali, A. Fault Diagnosis on Induction Motor Using Machine Learning and Signal Processing. arXiv 2024, arXiv:2401.15417. [Google Scholar] [CrossRef]
- Macrì, N.; Rubino, S.; Ferrari, S.; Pellegrino, G.; Bojoi, R. Digital Twin Models of Multi-Three-Phase Permanent Magnet Synchronous Motors. In Proceedings of the 2025 IEEE Energy Conversion Congress and Exposition (ECCE), Philadelphia, PA, USA, 19–23 October 2025; pp. 1–8. [Google Scholar] [CrossRef]
- Oberoi, V.; Karthik, V.G.; Dheeba, J.; Singh, R.R. Intrusion Detection of Service Disruption Attack for Industrial Electrical Drive System. In Proceedings of the 2024 15th International Conference on Computing Communication and Networking Technologies (ICCCNT), Kamand, India, 24–28 June 2024; pp. 1–6. [Google Scholar] [CrossRef]
- Safronov, D.I.; Diuldin, N.D.; Khismatullin, A.S. Use of Digital Twin to Study the Frequency Characteristics of Electrical Machines with Frequency-Regulated Electric Drives. In Proceedings of the 2026 International Conference on Industrial Engineering, Applications and Manufacturing (ICIEAM), Sochi, Russia, 18–22 May 2026; pp. 342–347. [Google Scholar] [CrossRef]
- Bahgat, B.H.; Elhay, E.A.; Elkholy, M.M. Advanced Fault Detection Technique of Three Phase Induction Motor: Comprehensive Review. Discov. Electron. 2024, 1, 9. [Google Scholar] [CrossRef]
- Fan, J.; Zhao, L.; Li, M. Research on Digital Twin Modeling and Fault Diagnosis Methods for Rolling Bearings. Sensors 2025, 25. [Google Scholar] [CrossRef] [PubMed]
- Jiang, Y.; He, Y.; Shi, Z.; Jiang, H.; Dong, Z.; Sun, J.; Tang, C.; Jiao, W. Cross-Conditions Fault Diagnosis of Rolling Bearing Based on Transitional Domain Adversarial Network. IEEE Sens. J. 2025, 25, 1978–1993. [Google Scholar] [CrossRef]
- Fan, C.; Wang, P.; Zhang, Y.; Ma, H.; Li, X.; Wang, Q. Digital Twin Assisted Degradation Assessment of Bearing Cage Performance. IEEE Trans. Ind. Inform. 2025, 21, 5171–5181. [Google Scholar] [CrossRef]
- Liu, W.; Han, B.; Zheng, A.; Zheng, Z. Fault Diagnosis for Reducers Based on a Digital Twin. Sensors 2024, 24, 2575. [Google Scholar] [CrossRef] [PubMed]
- Bofill, J.; Abisado, M.; Villaverde, J.; Sampedro, G.A. Exploring Digital Twin-Based Fault Monitoring: Challenges and Opportunities. Sensors 2023, 23, 7087. [Google Scholar] [CrossRef] [PubMed]
- Singh, R.R.; Bhatti, G.; Kalel, D.; Vairavasundaram, I.; Alsaif, F. Building a Digital Twin Powered Intelligent Predictive Maintenance System for Industrial AC Machines. Machines 2023, 11, 796. [Google Scholar] [CrossRef]
- Ebadpour, M.; Jamshidi, M.; Talla, J.; Hashemi-Dezaki, H.; Peroutka, Z. Digital Twin Model of Electric Drives Empowered by EKF. Sensors 2023, 23. [Google Scholar] [CrossRef] [PubMed]
- Cheruku, S.; Balaji, S.; Delgado, A.; Krishnamurthy, V.R. Data-Driven Digital Twins for Real-Time Machine Monitoring: A Case Study on a Rotating Machine. J. Comput. Inf. Sci. Eng. 2025, 25, 031005. [Google Scholar] [CrossRef]
- Vilar-Dias, J.L.; Junior, A.S.S.; Lima-Neto, F.B. An Interpretable Digital Twin for Self-Aware Industrial Machines. Sensors 2024, 24, 4. [Google Scholar] [CrossRef] [PubMed]
- Di Nezio, G.; Marini, G.; Di Benedetto, M.; Lidozzi, A.; Solero, L. Digital Twin Based Identification of Passive Parameters for PMSM-Based Generating Unit by an Extended Kalman Filter for Wind Off-Shore Applications. In Proceedings of the 2024 International Symposium on Power Electronics, Electrical Drives, Automation and Motion (SPEEDAM), Napoli, Italy, 19–21 June 2024; pp. 1191–1196. [Google Scholar] [CrossRef]
- Kohtz, S.; Zhao, J.; Renteria, A.; Lalwani, A.; Xu, Y.; Zhang, X.; Haran, K.S.; Senesky, D.; Wang, P. Optimal Sensor Placement for Permanent Magnet Synchronous Motor Condition Monitoring Using a Digital Twin-Assisted Fault Diagnosis Approach. Reliab. Eng. Syst. Saf. 2024, 242, 109714. [Google Scholar] [CrossRef]
- Lukman, G.F.; Lee, C. Towards Digital Twin Modeling and Applications for Permanent Magnet Synchronous Motors. Energies 2025, 18, 956. [Google Scholar] [CrossRef]
- Ma, H.; Fan, C.; Zhang, Y.; Wang, Q.; Yu, K.; Ma, Z. Digital Twin-Inspired Methods for Rotating Machinery Intelligent Fault Diagnosis and Remaining Useful Life Prediction: A State-of-the-Art Review and Future Challenges. Mech. Syst. Signal Process. 2025, 232, 112770. [Google Scholar] [CrossRef]
- Zhao, L.; Xie, T.; Wei, Y.; Liu, Y.; Qin, Y. Overview of Digital Twin-Driven Rotating Machinery Fault Diagnosis: Status and Trends. Meas. Sci. Technol. 2025, 36, 052001. [Google Scholar] [CrossRef]
- Hu, J.; Xiao, H.; Ye, Z.; Luo, N.; Zhou, M. Research and Prospects of Digital Twin-Based Fault Diagnosis of Electric Machines. Sensors 2025, 25, 2625. [Google Scholar] [CrossRef] [PubMed]
- Kohtz, S.; Renteria, A.; Rodriguez, A.; Lalwani, A.; Samarakoon, A.; Haran, K.S.; Senesky, D.; Wang, P. Partial Discharge Diagnosis in Electric Motor with Digital Twin Model-Enhanced Ensemble Learning. Reliab. Eng. Syst. Saf. 2025, 264, 111370. [Google Scholar] [CrossRef]
Figure 1.
Research gap and principal contributions of the proposed framework.
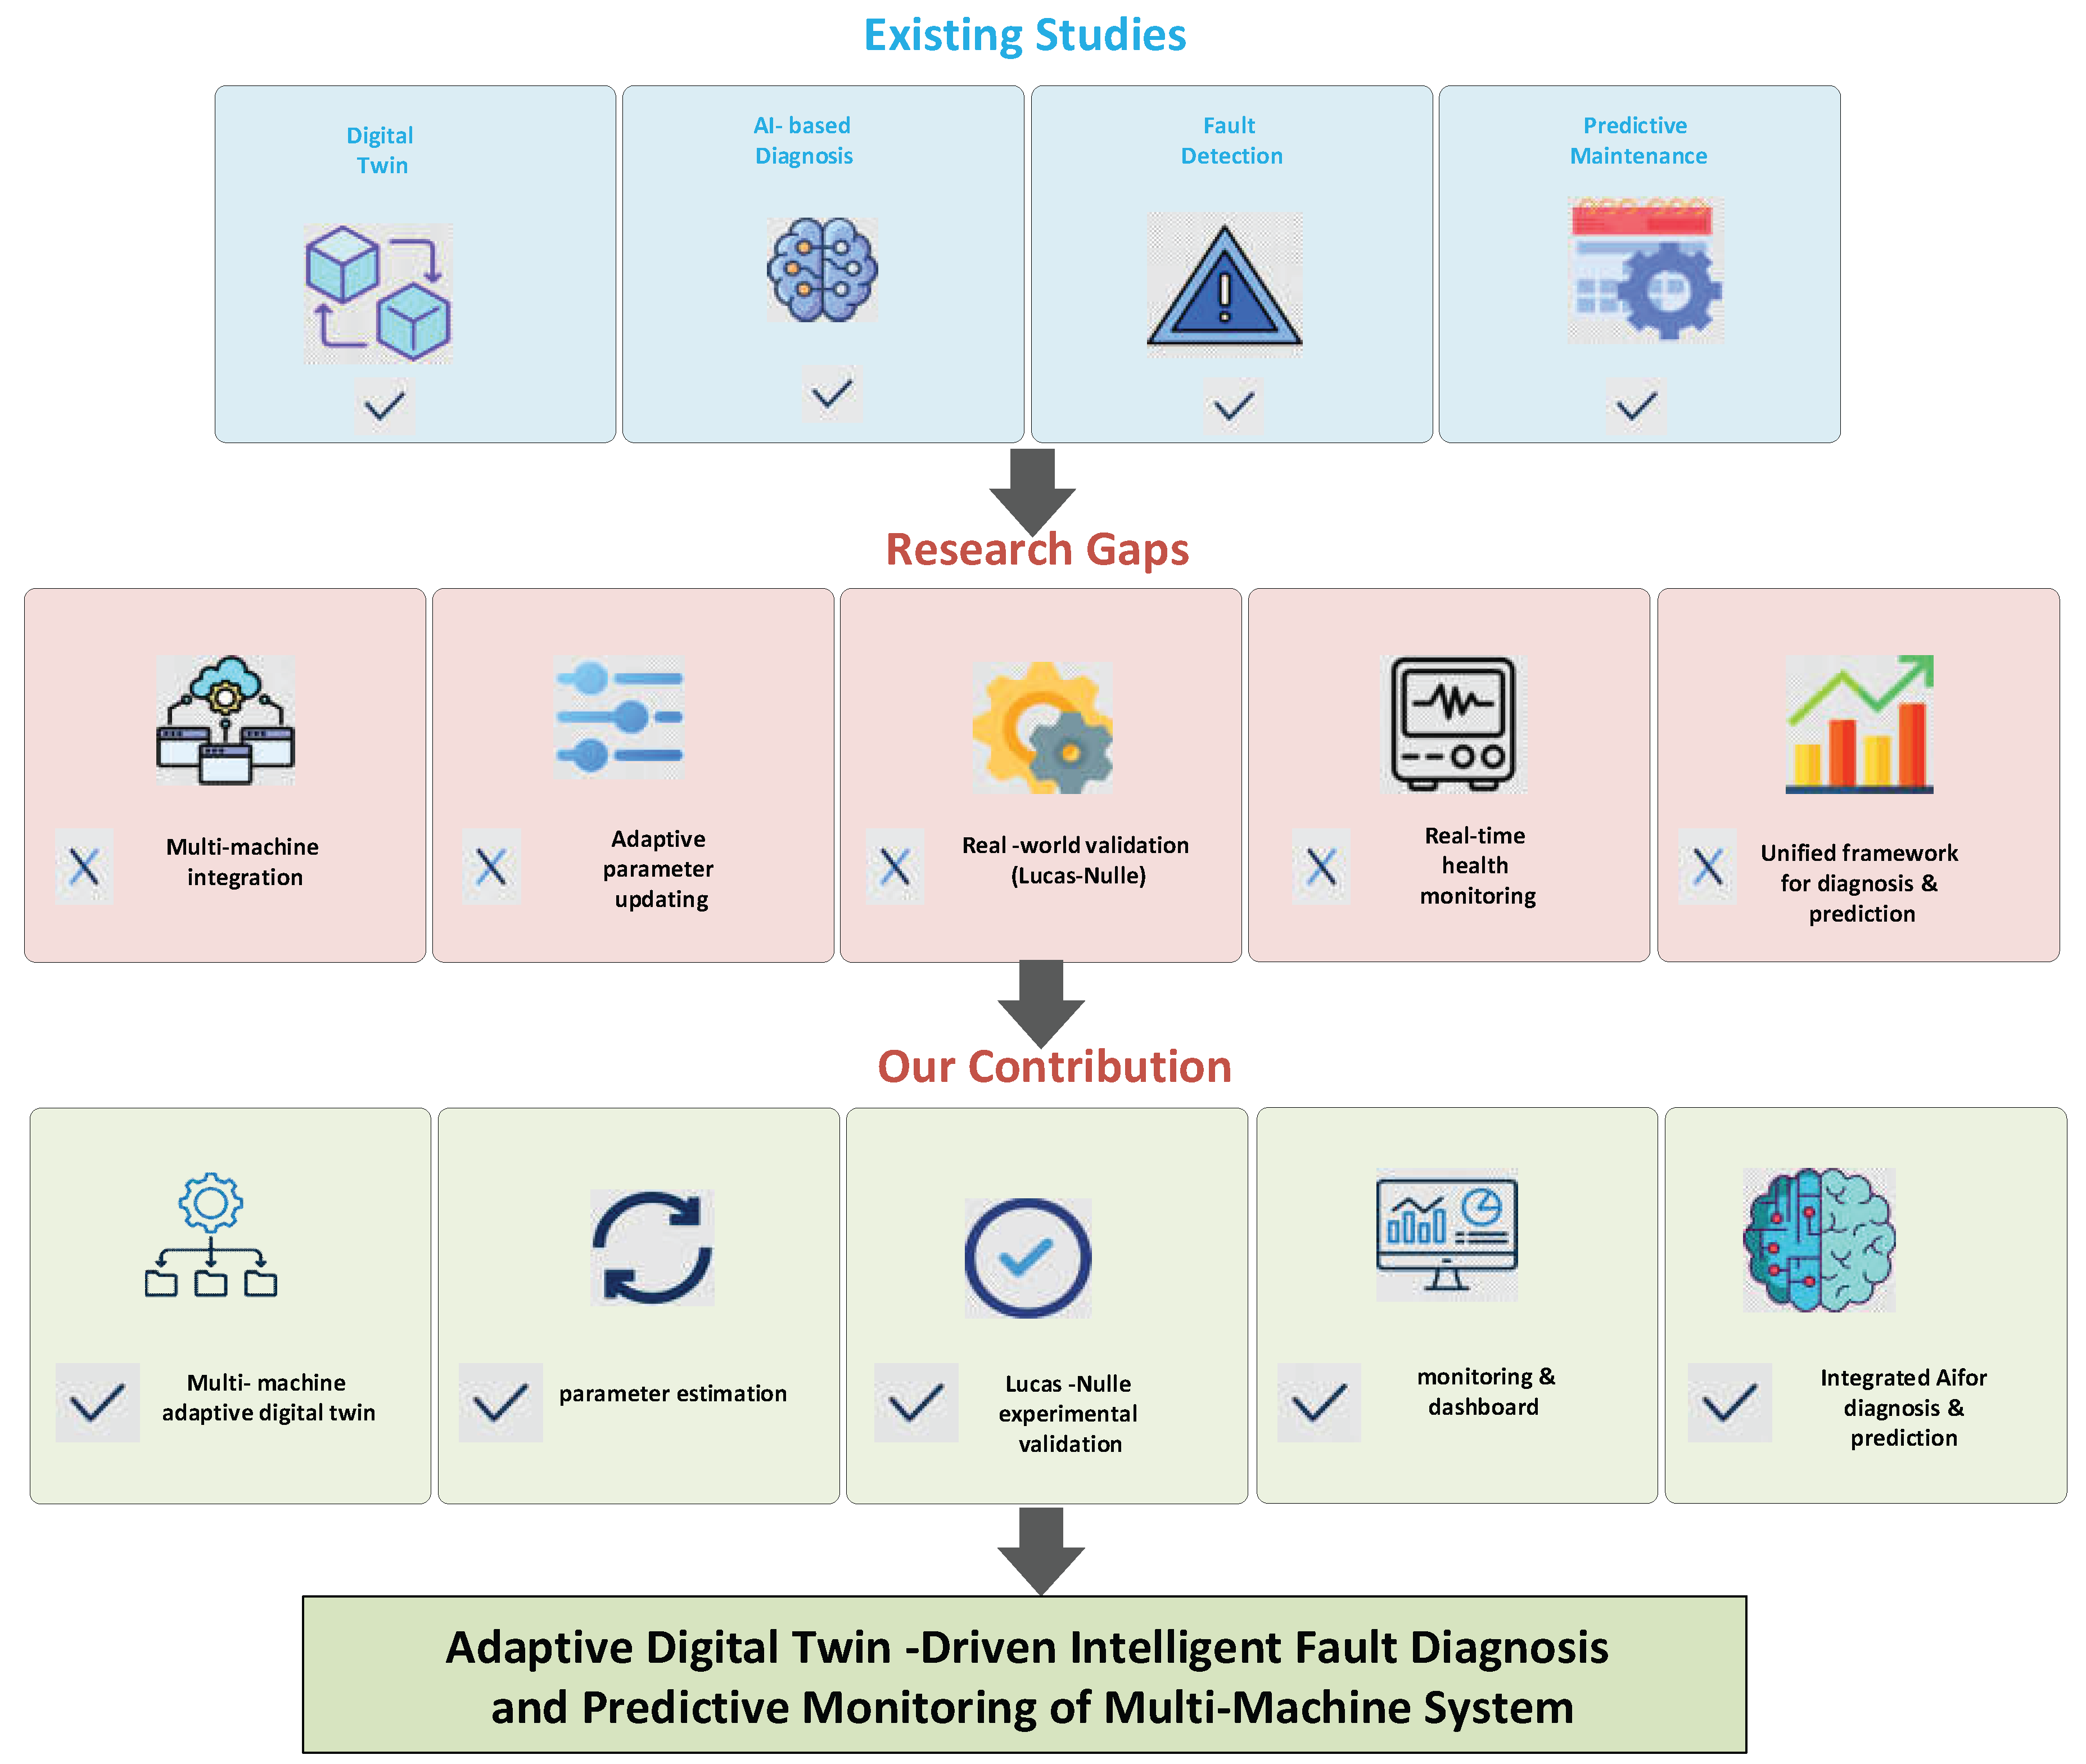
Figure 2.
Proposed mathematical framework for the adaptive multi-machine digital twin.
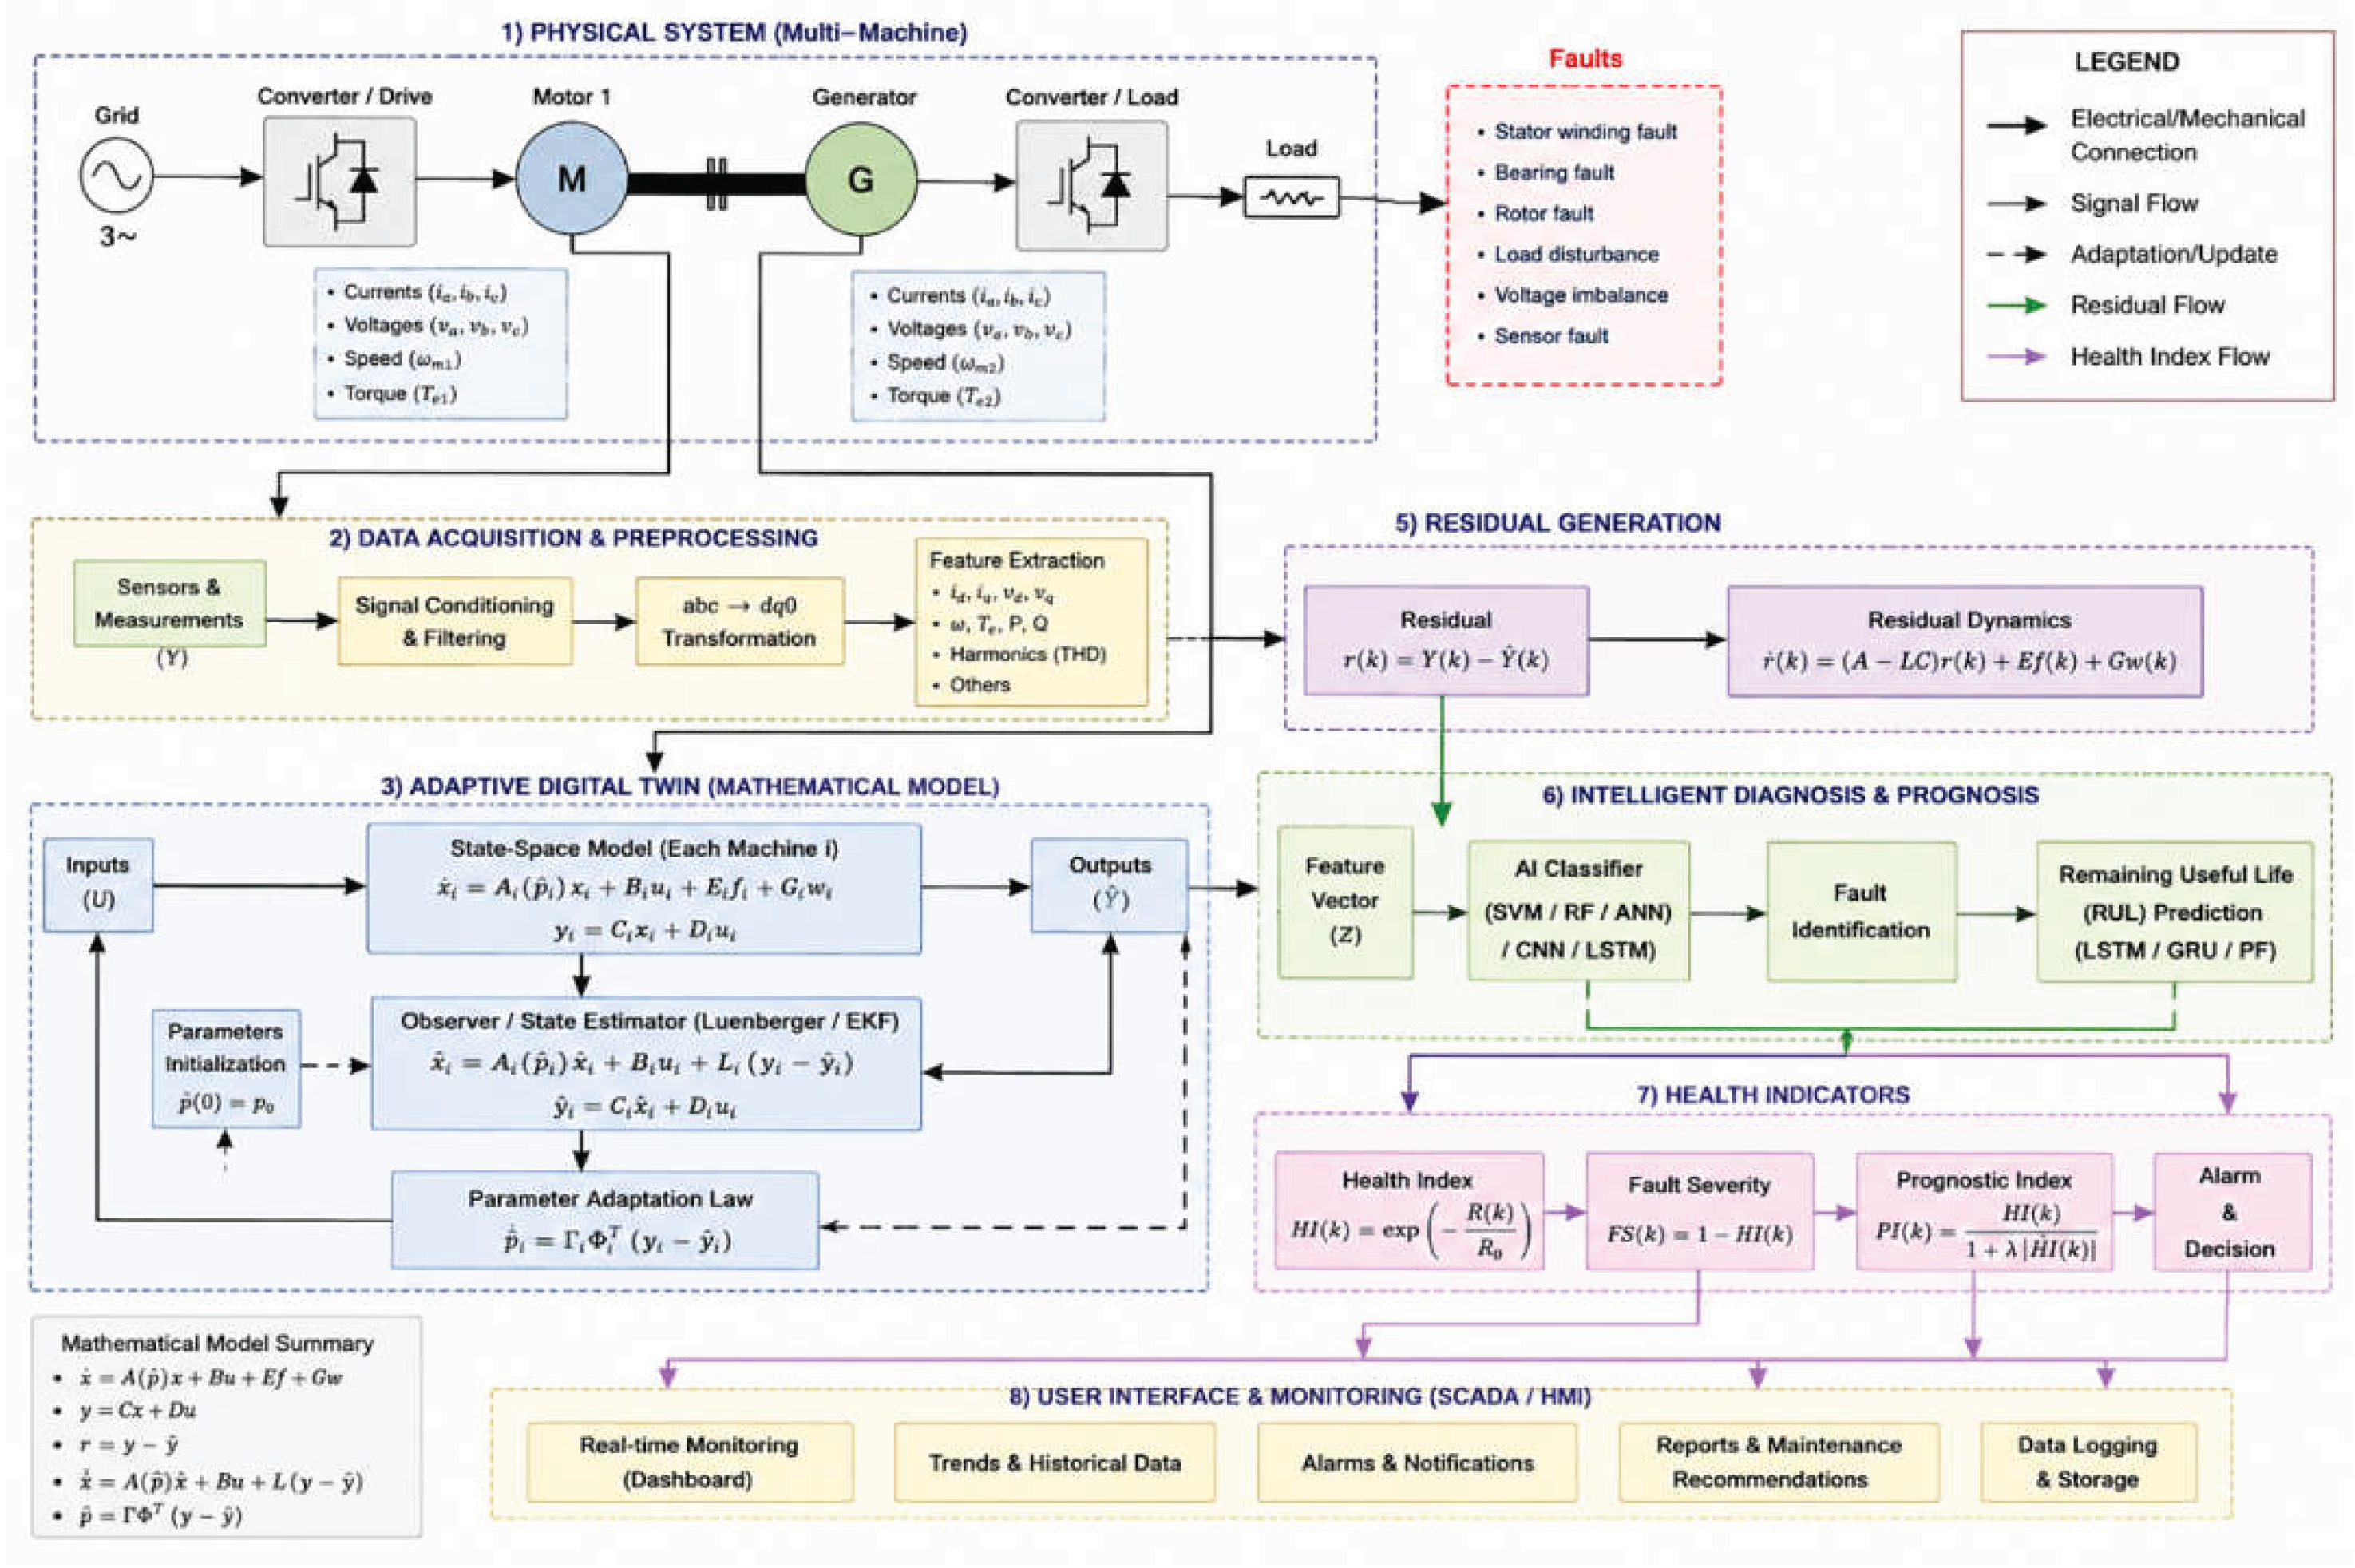
Figure 3.
Adaptive digital-twin architecture for the coupled multi-machine system.
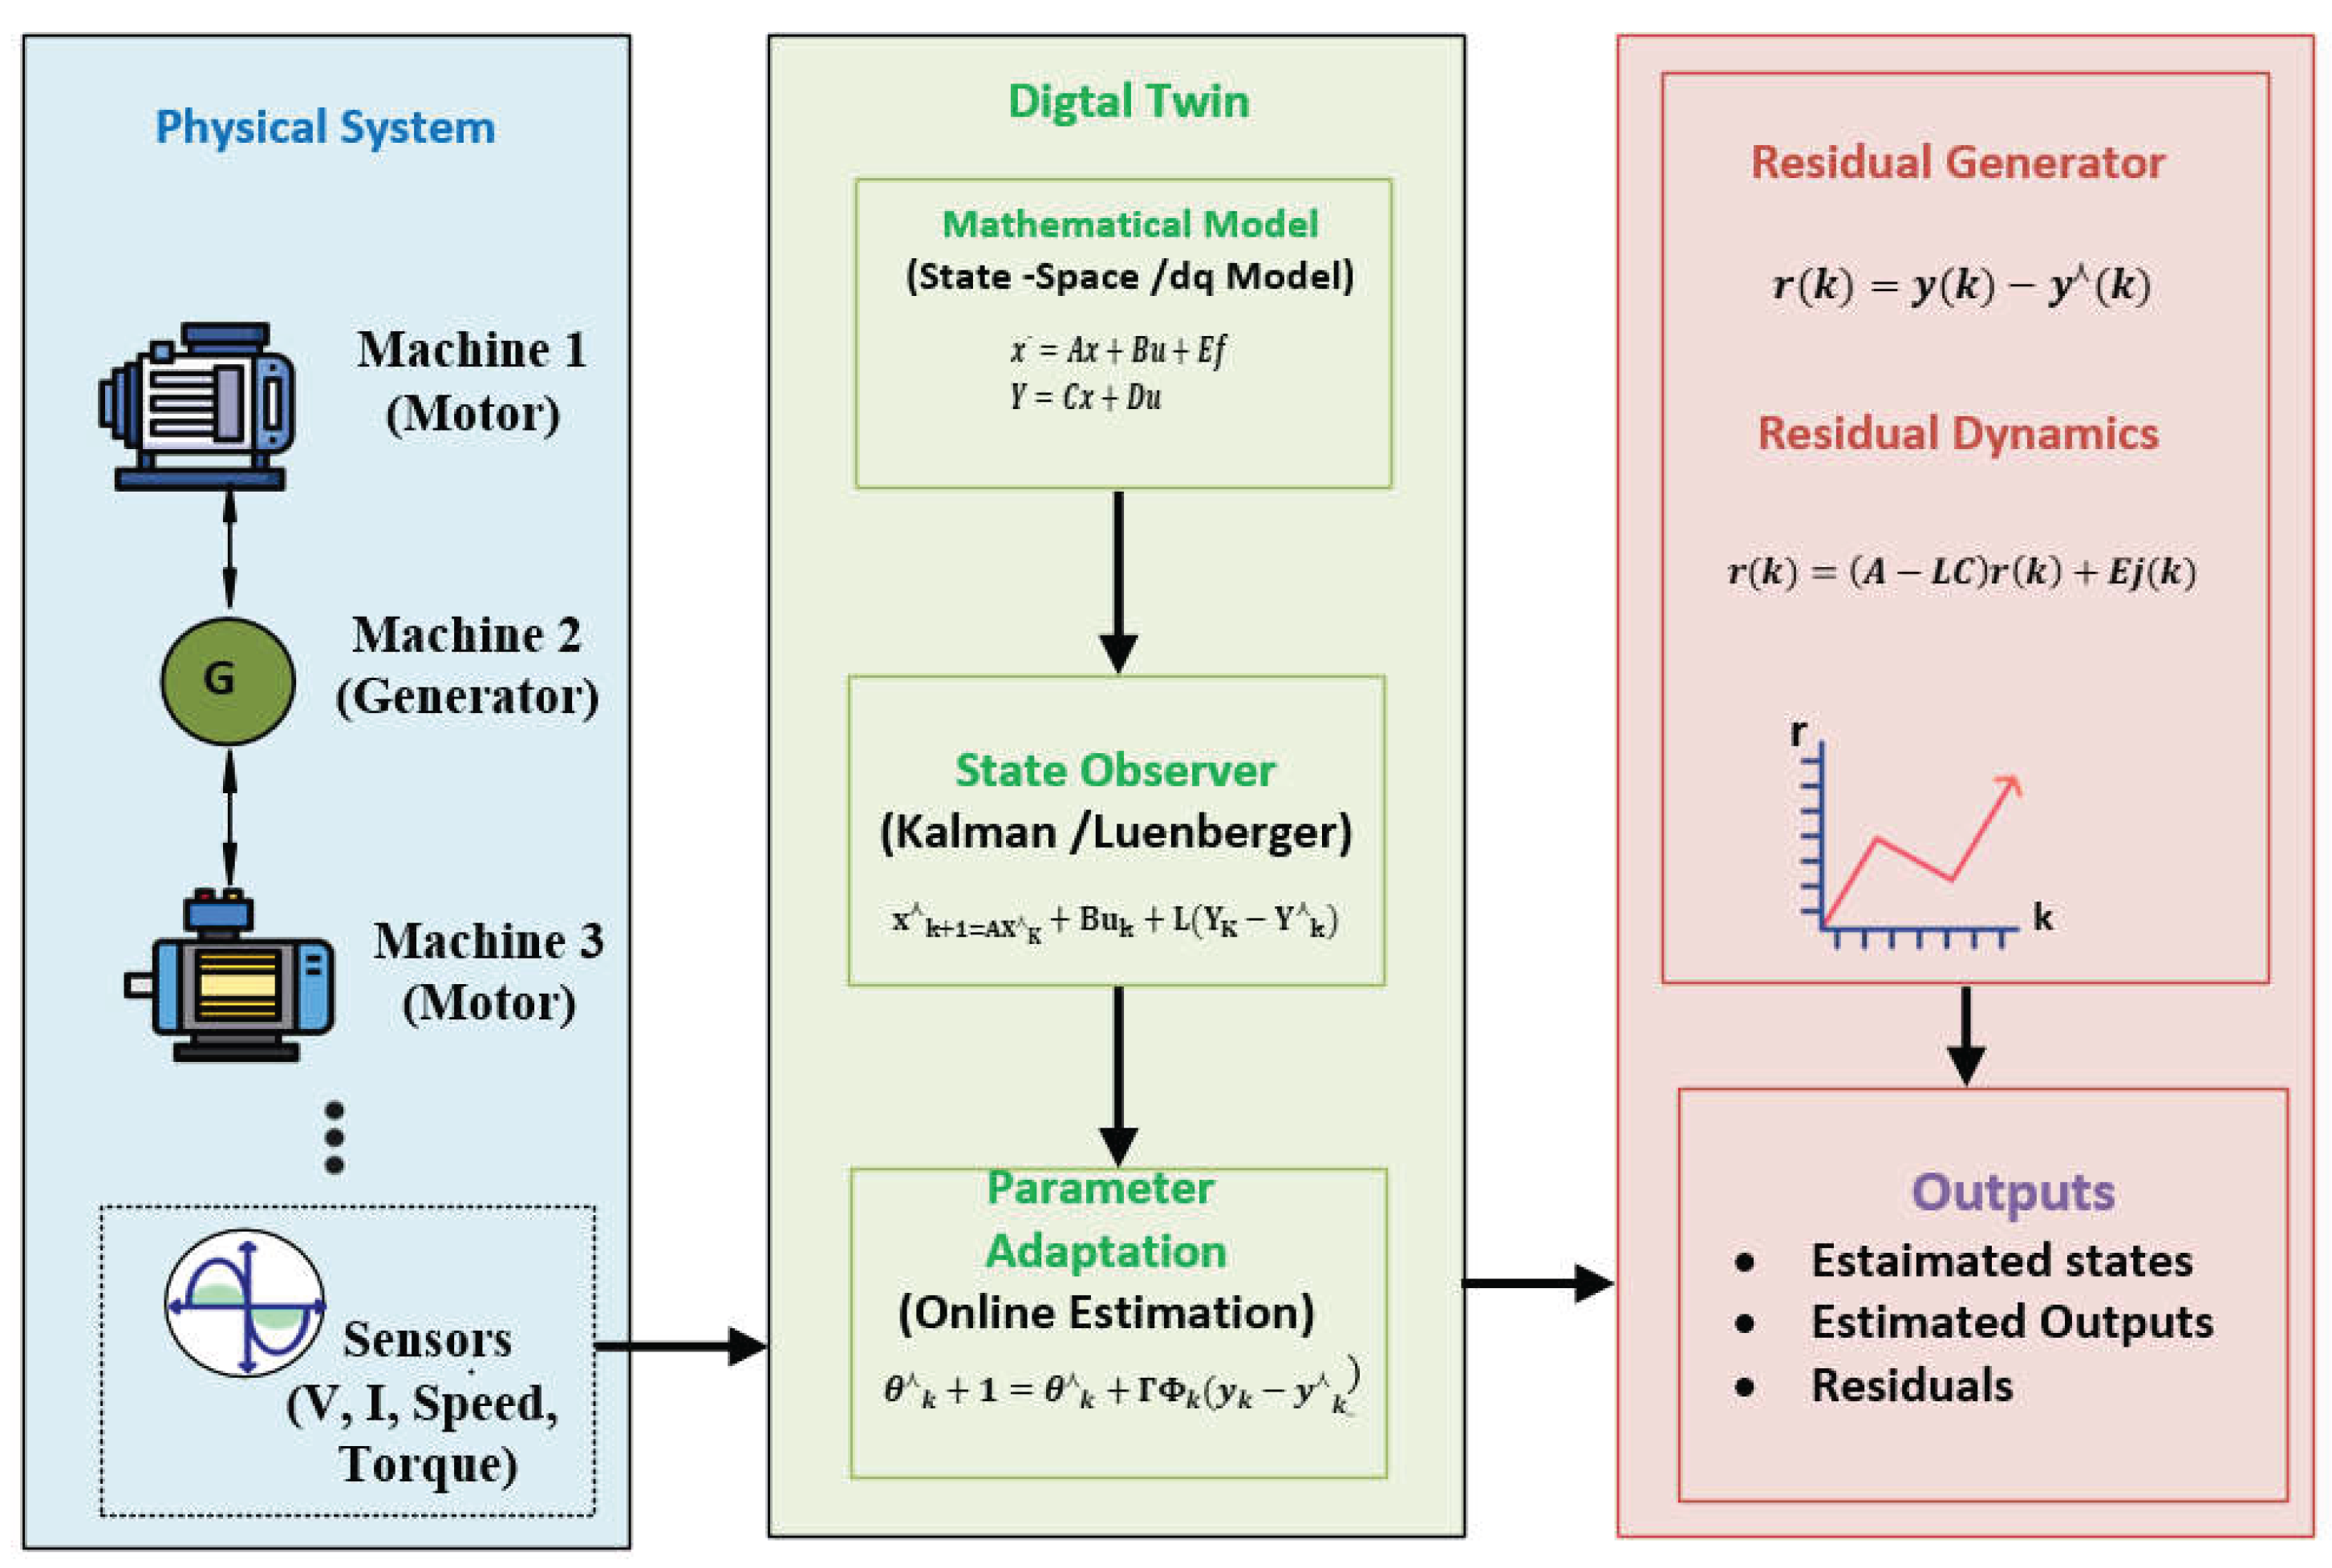
Figure 6.
Experimental and digital-twin torque tracking under the R3 = 300 Ω load condition.
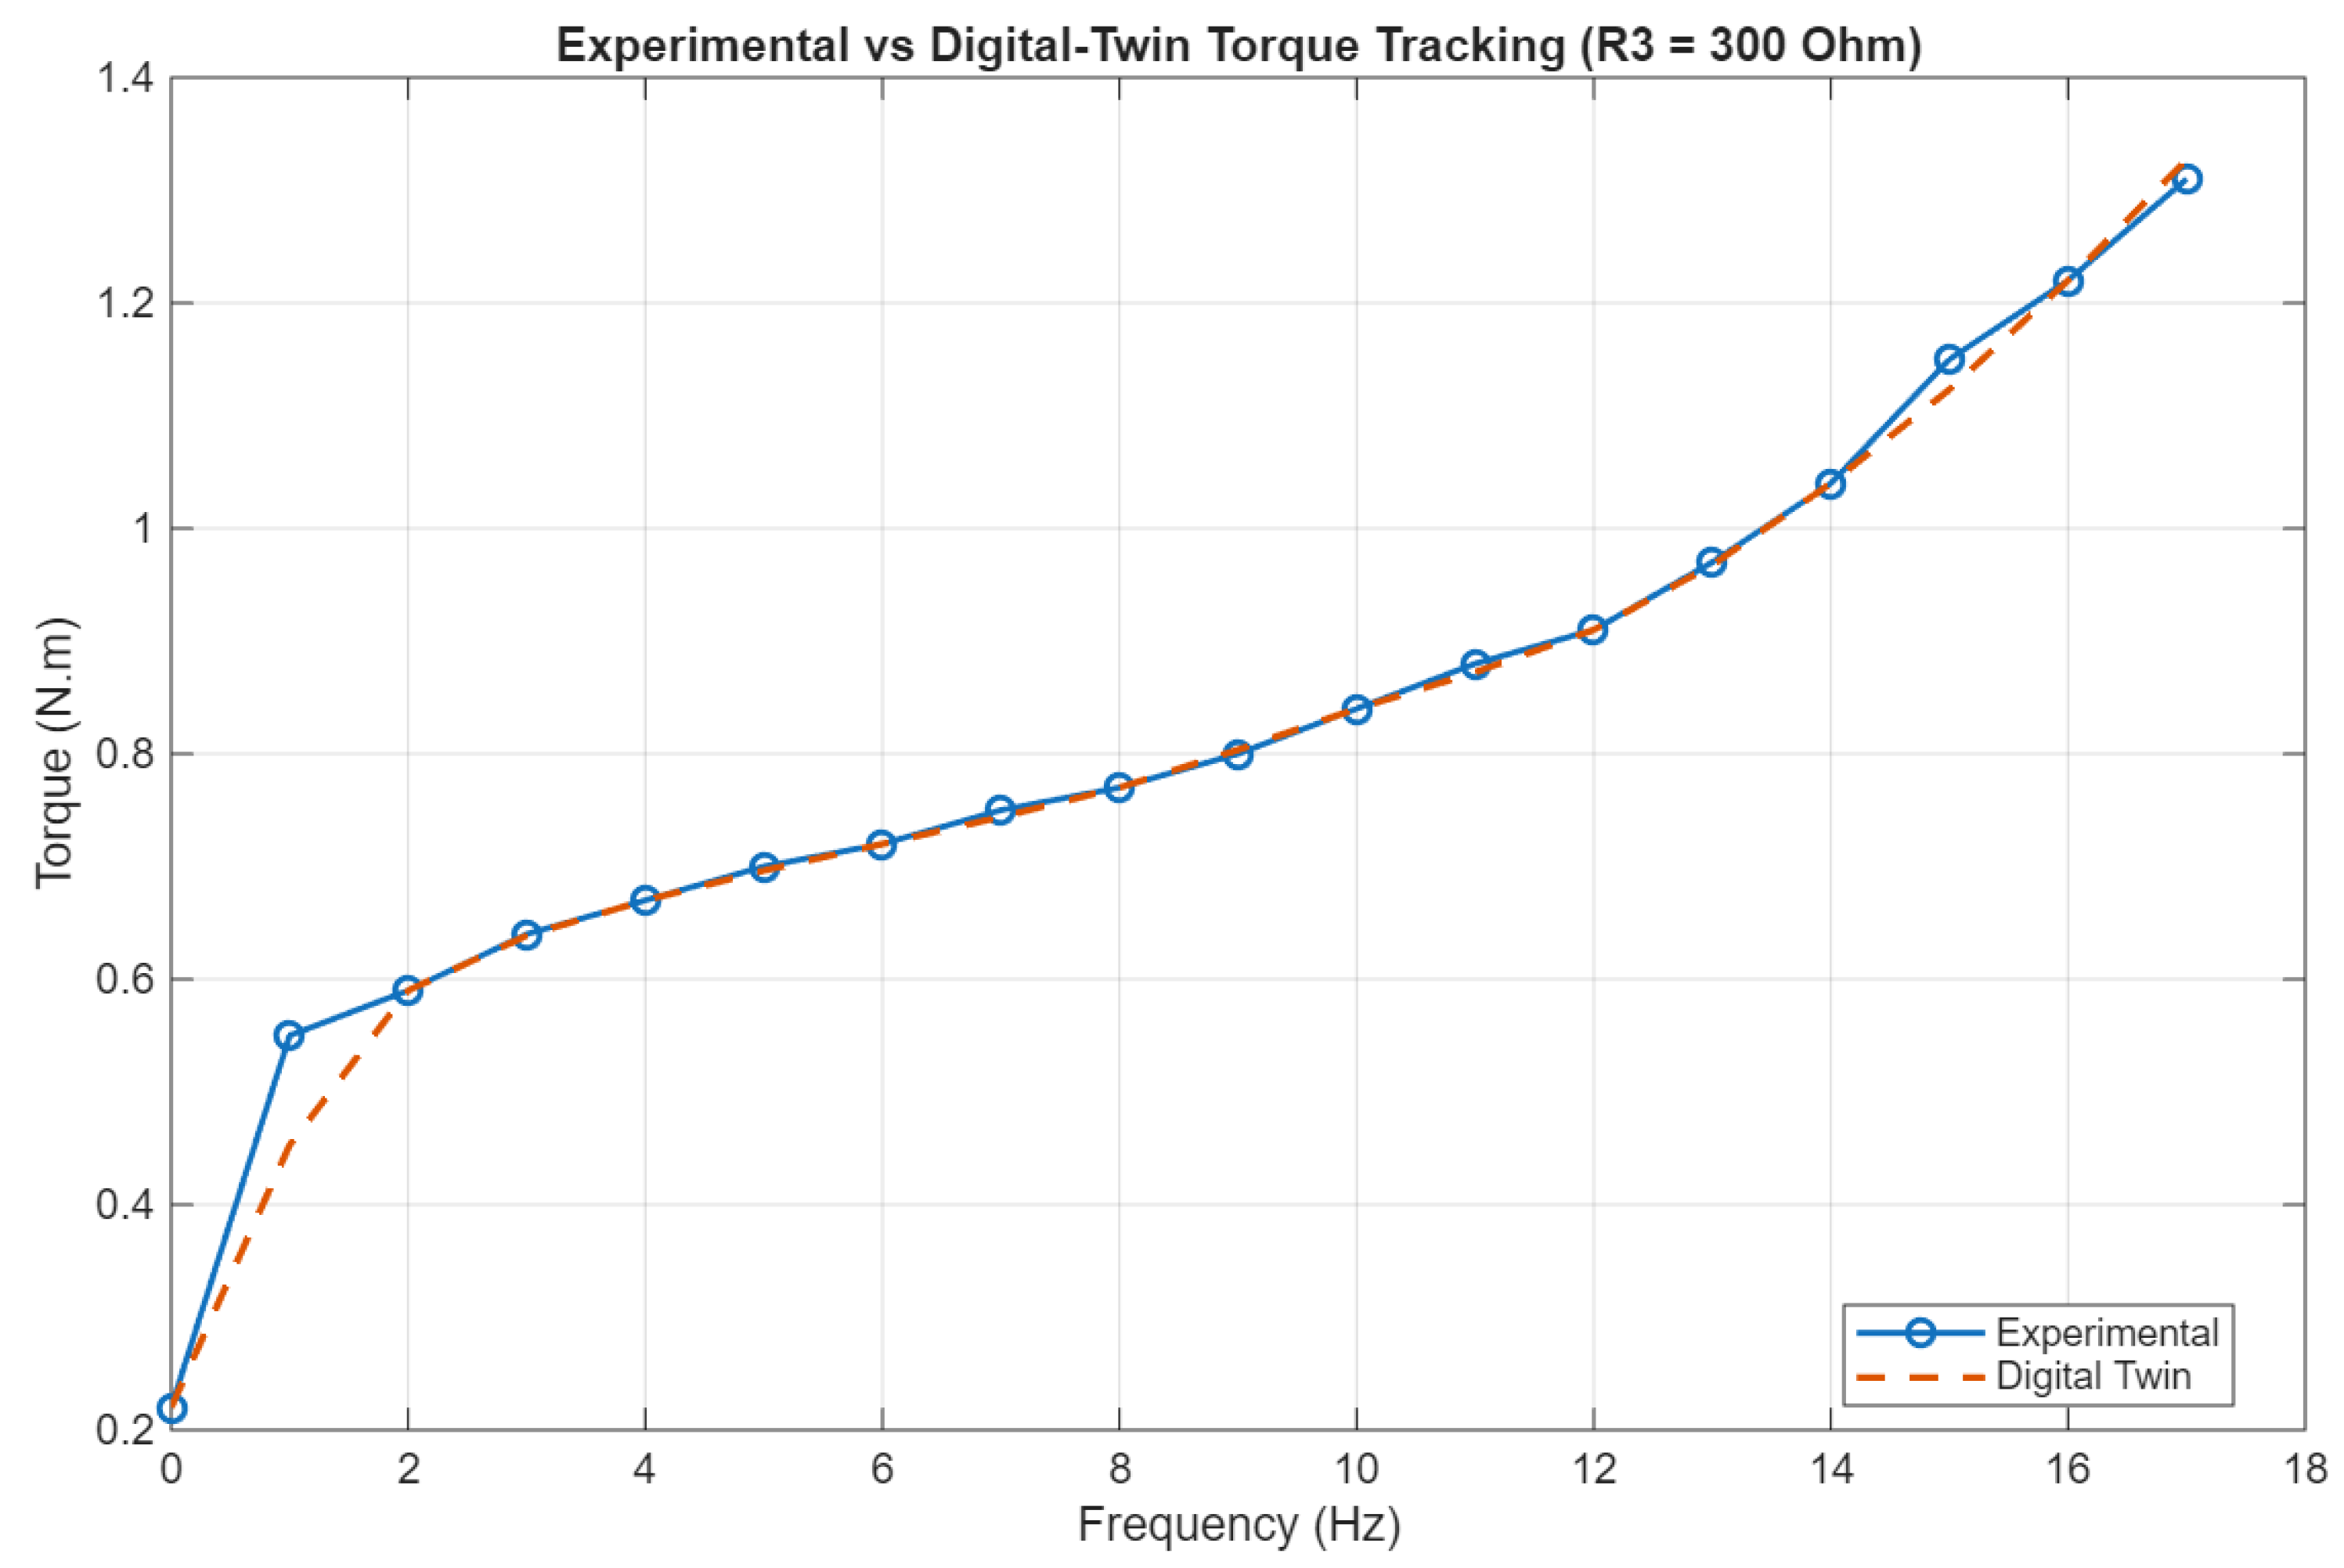
Figure 7.
Experimental and digital-twin motor-current tracking under the R3 = 300 Ω load condition.
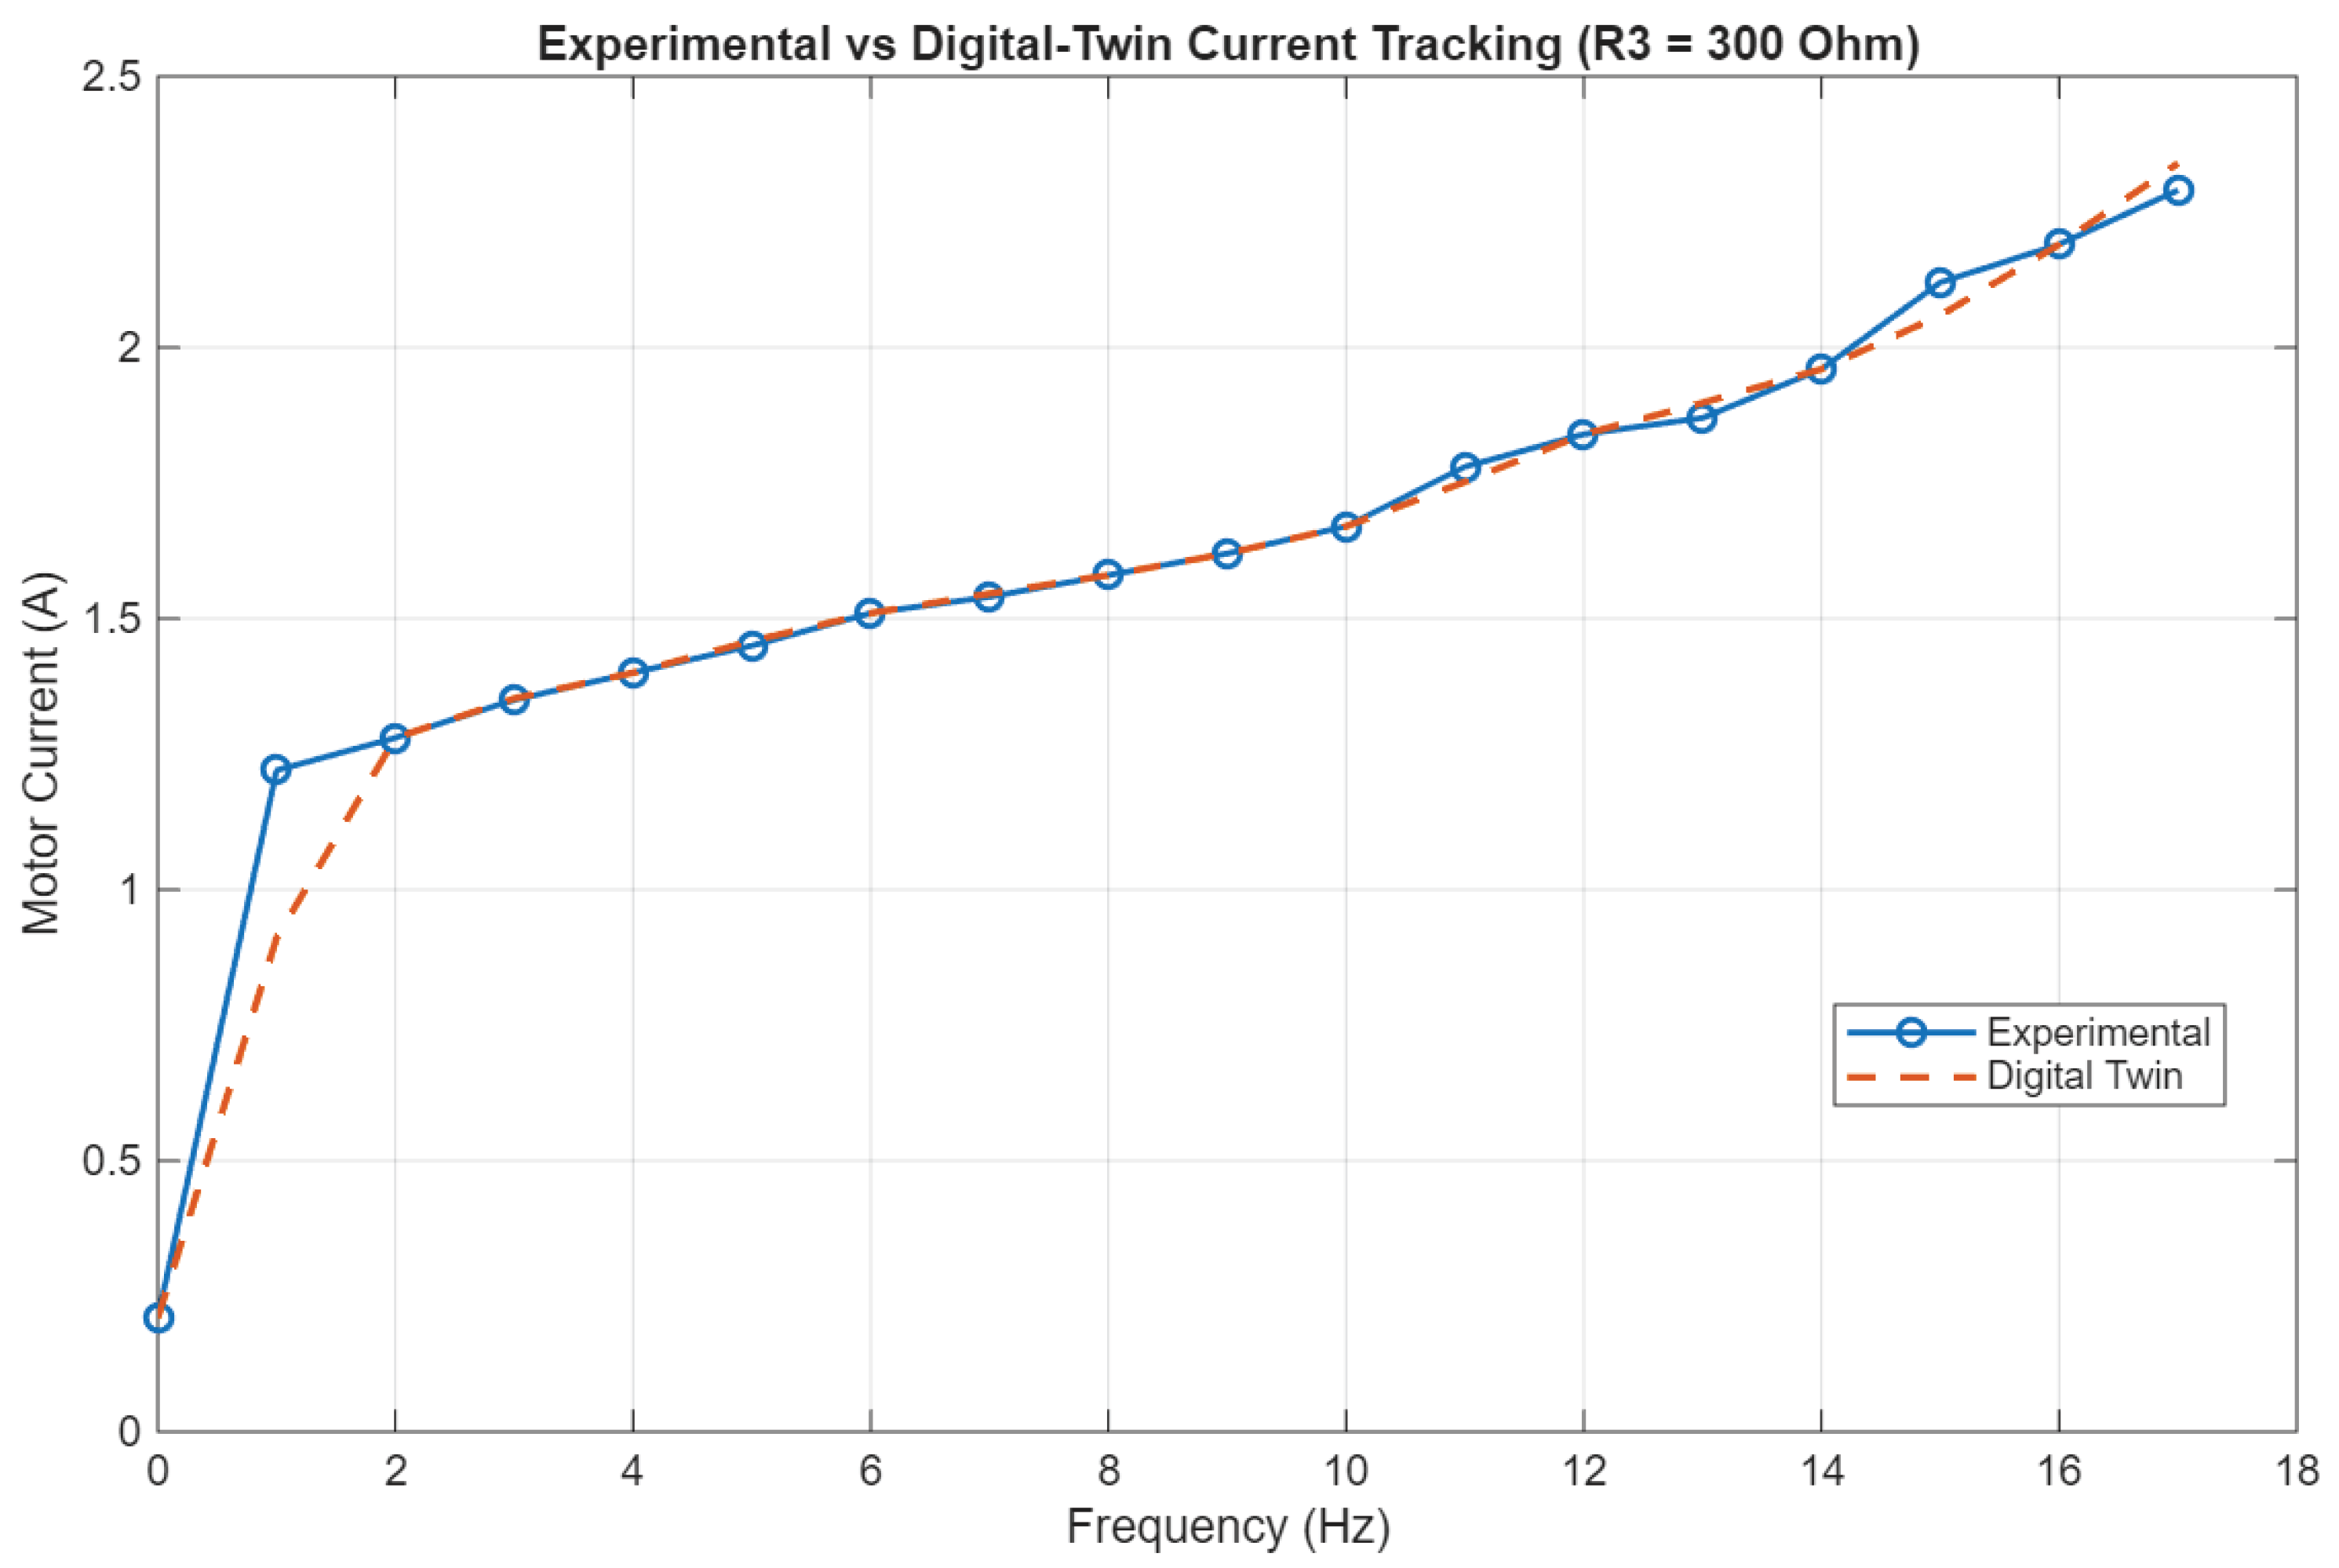
Figure 8.
Experimental and digital-twin motor-voltage tracking under the R3 = 300 Ω load condition.
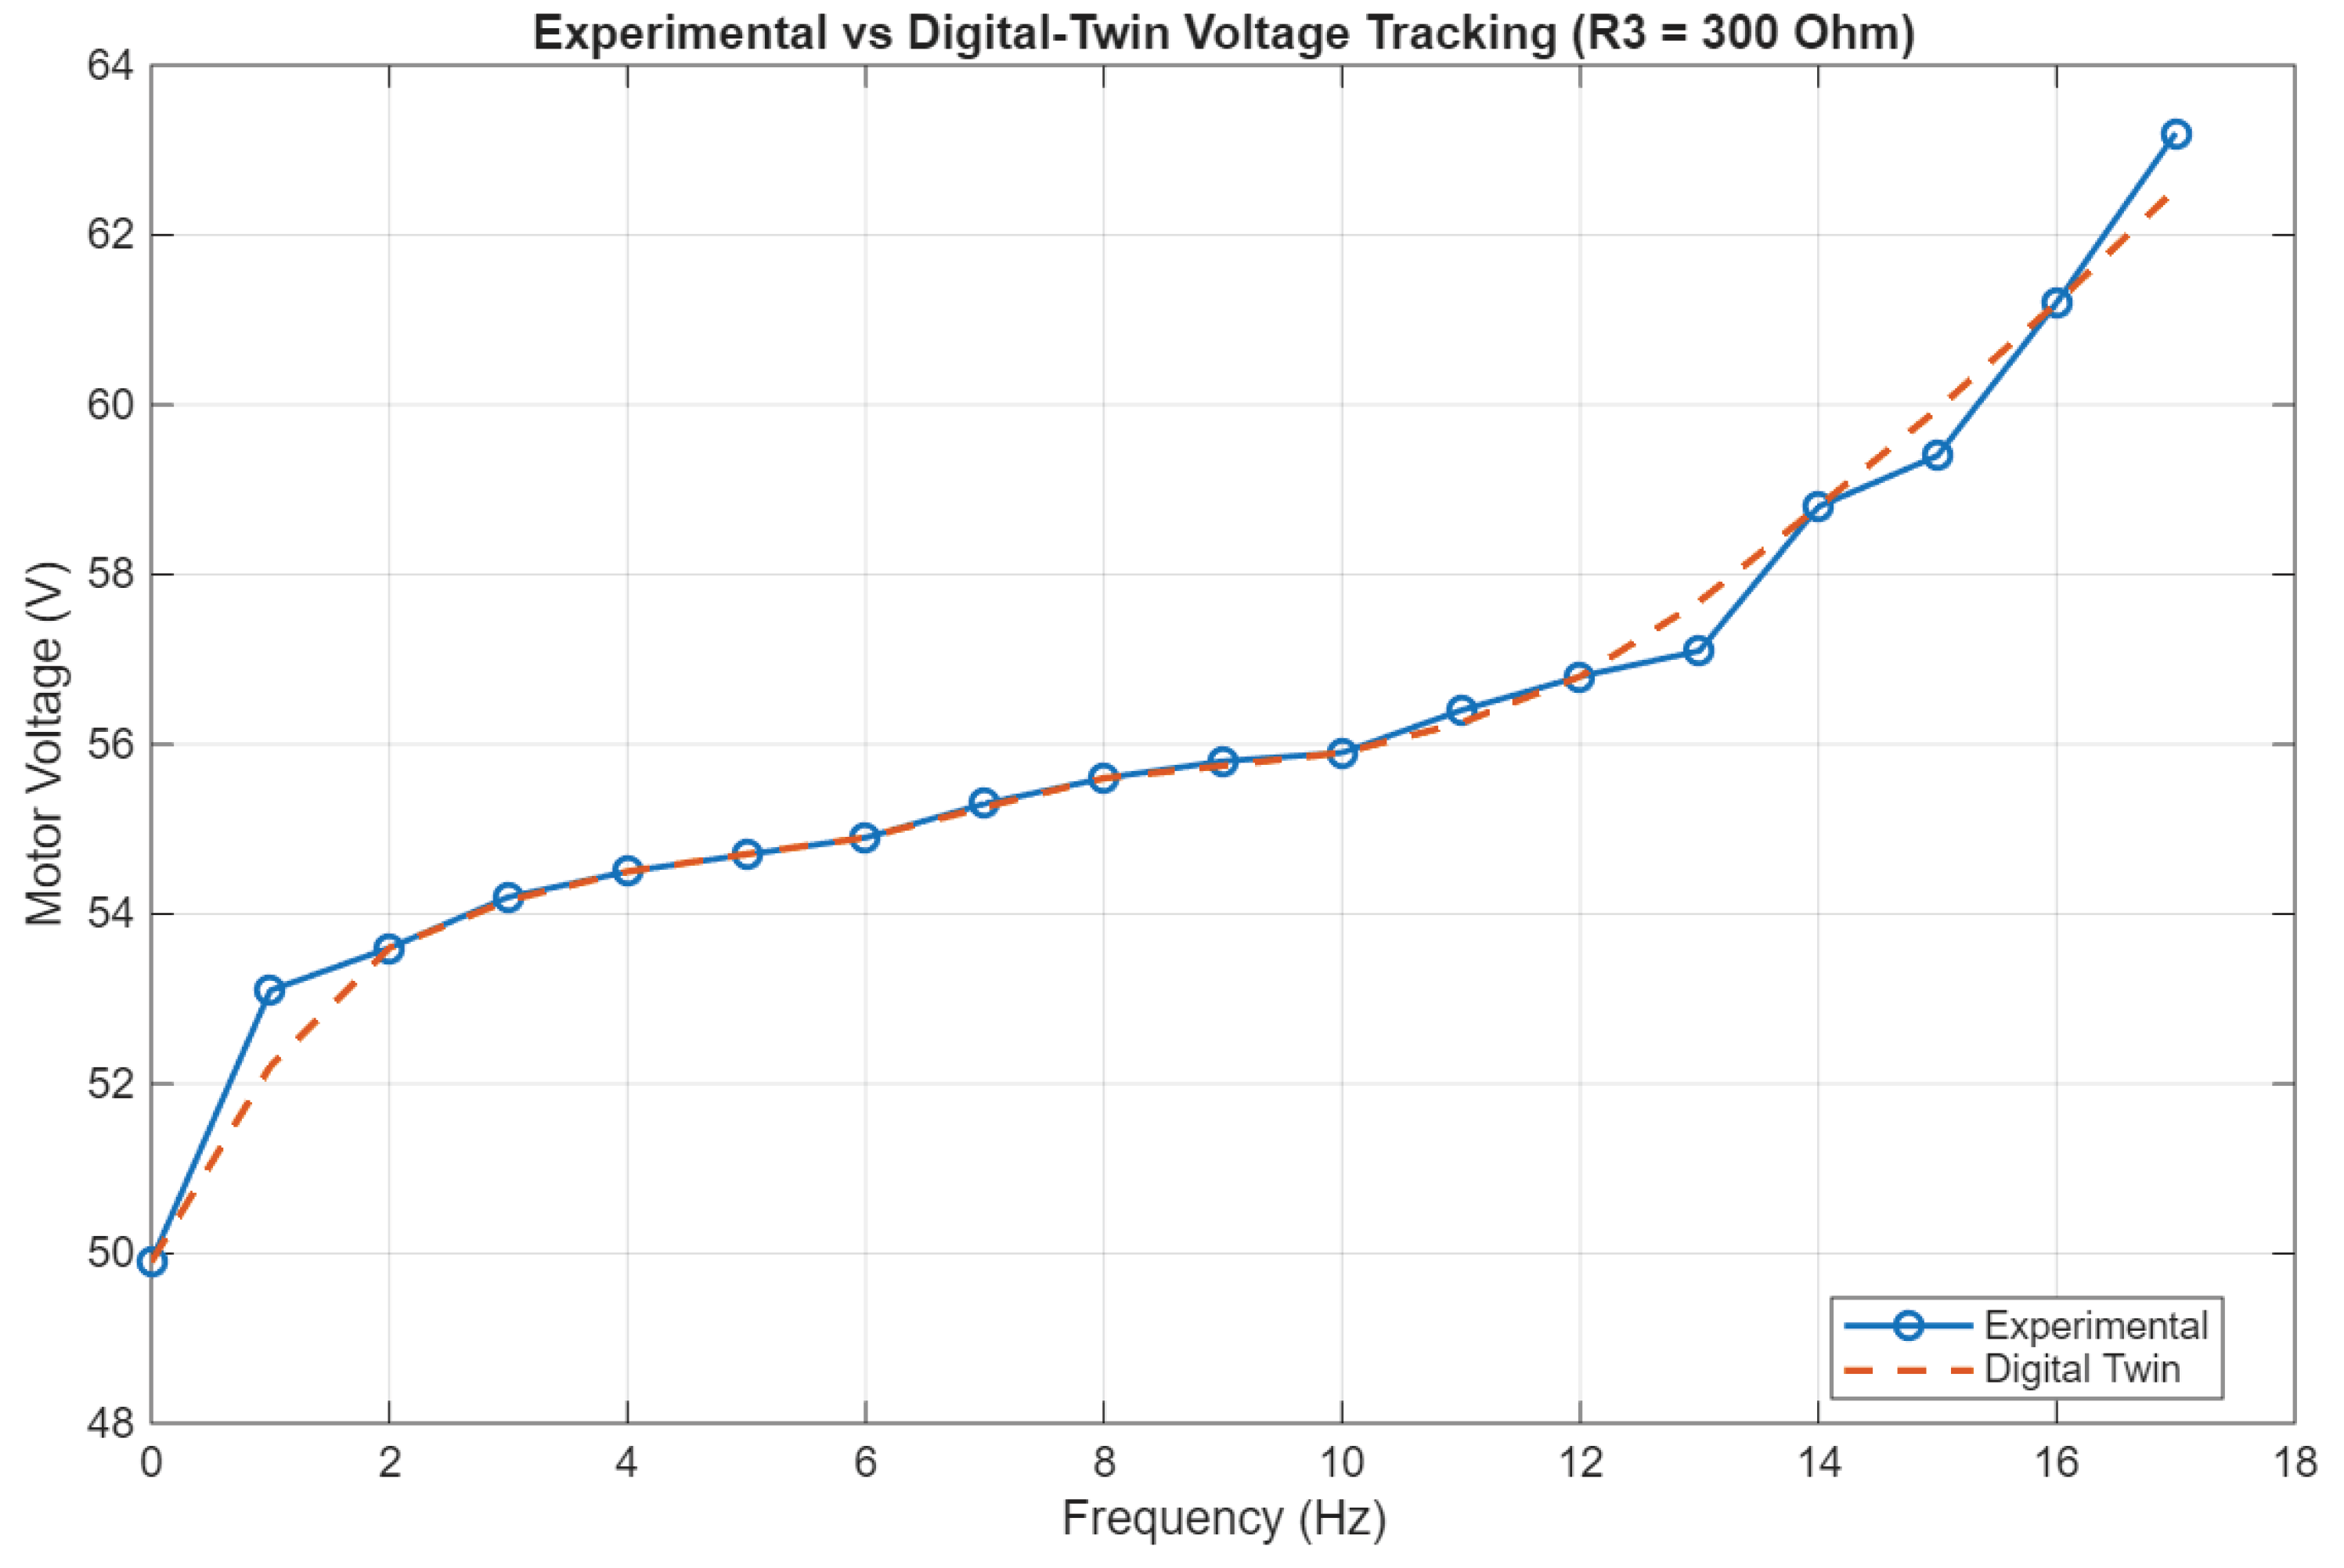
Figure 9.
Digital-twin-based health index across the experimentally evaluated load conditions.
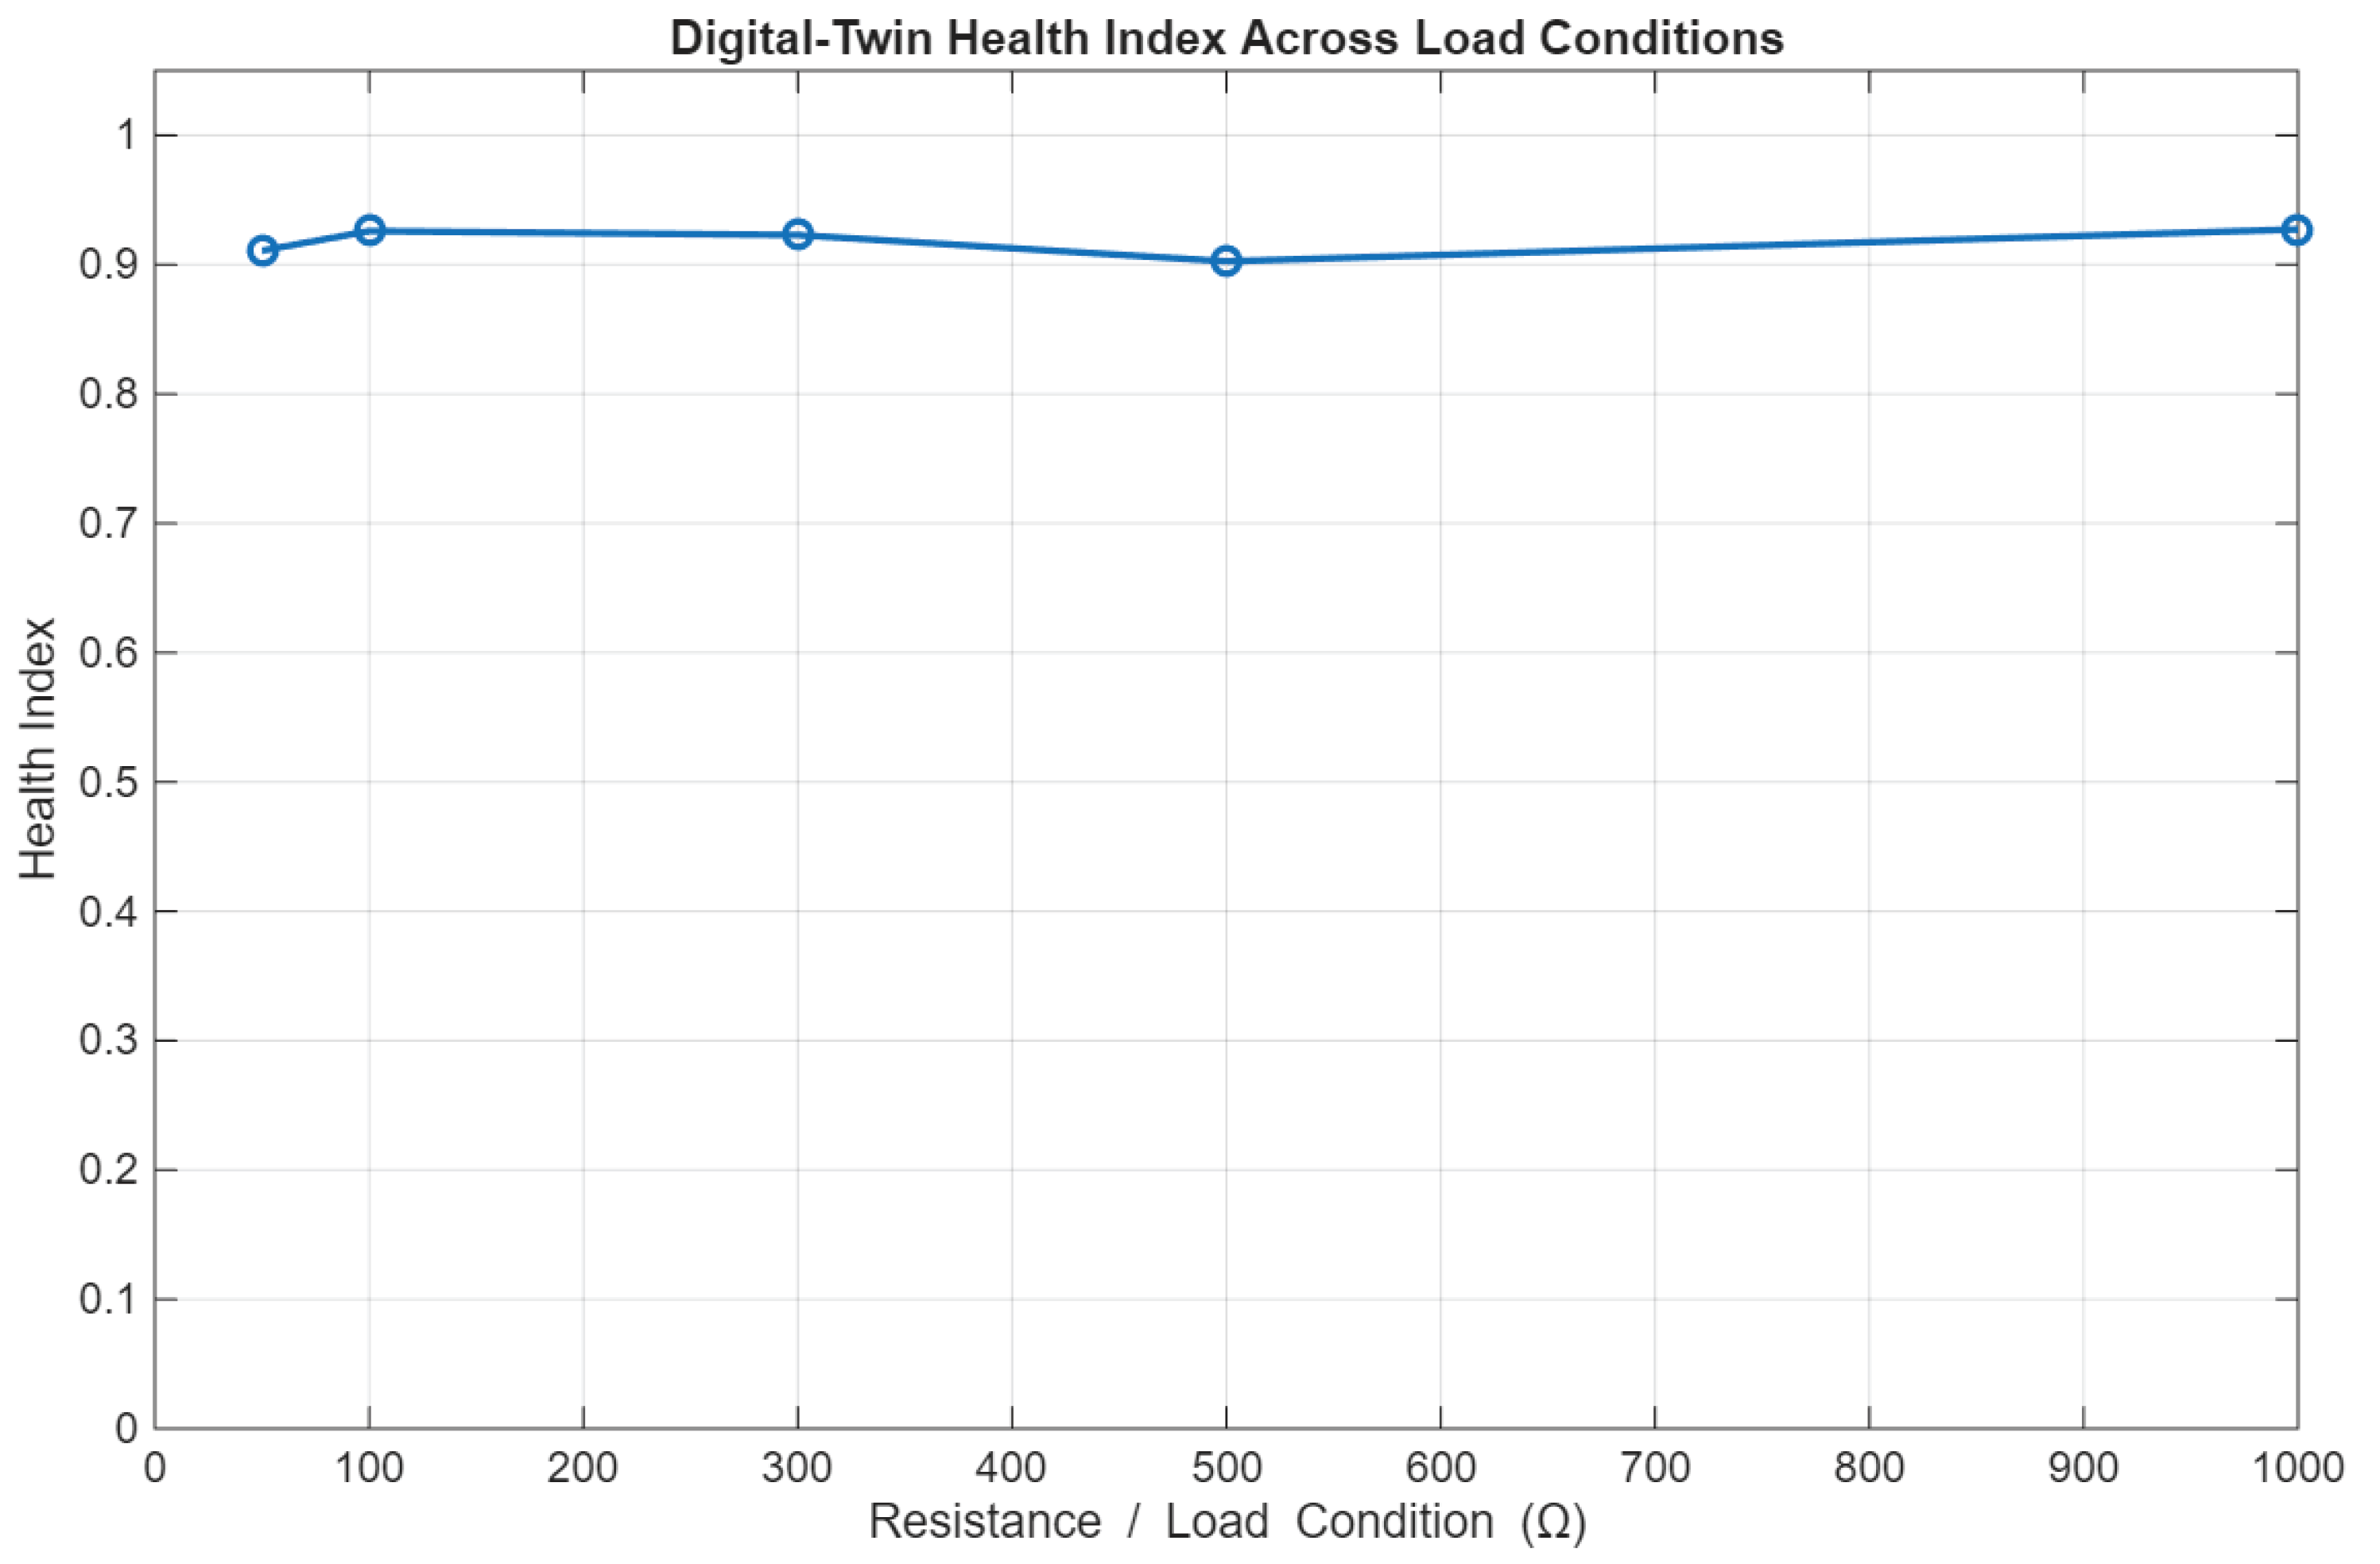
Figure 10.
Channel-specific digital-twin residual scores under healthy and simulated fault conditions.
Figure 10.
Channel-specific digital-twin residual scores under healthy and simulated fault conditions.
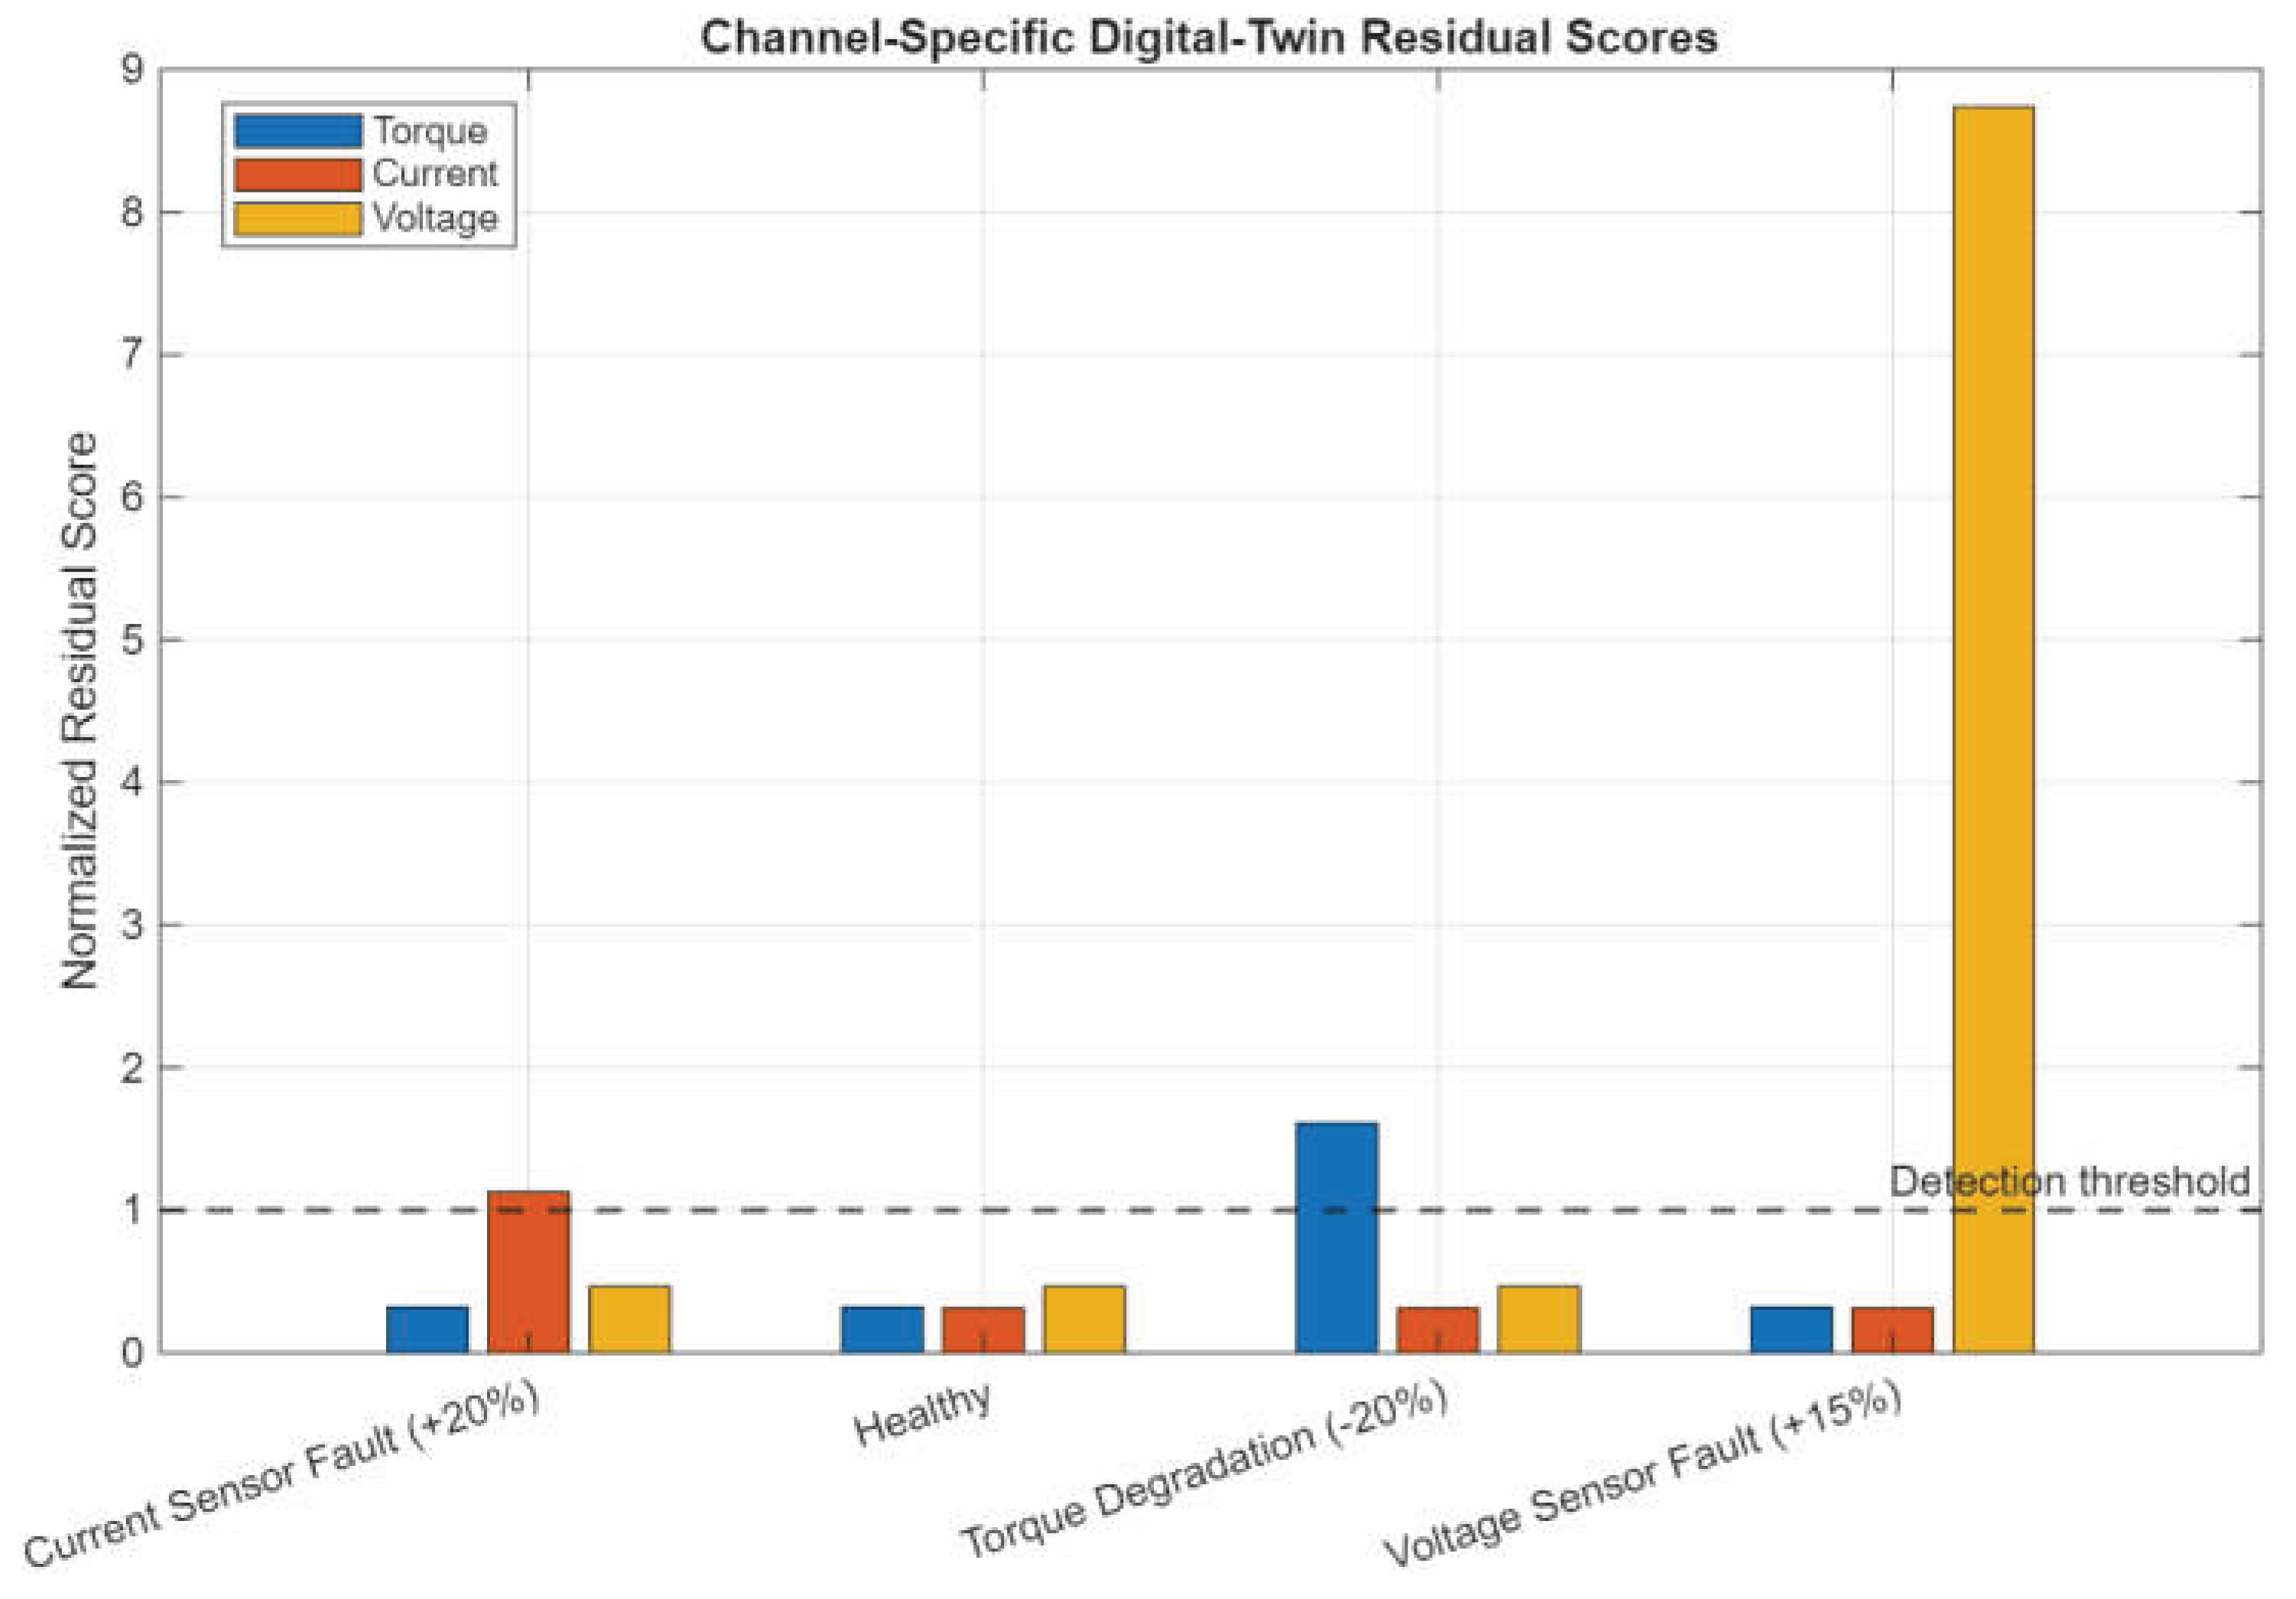
Figure 11.
Digital-twin residual signature map for isolation of simulated fault conditions.
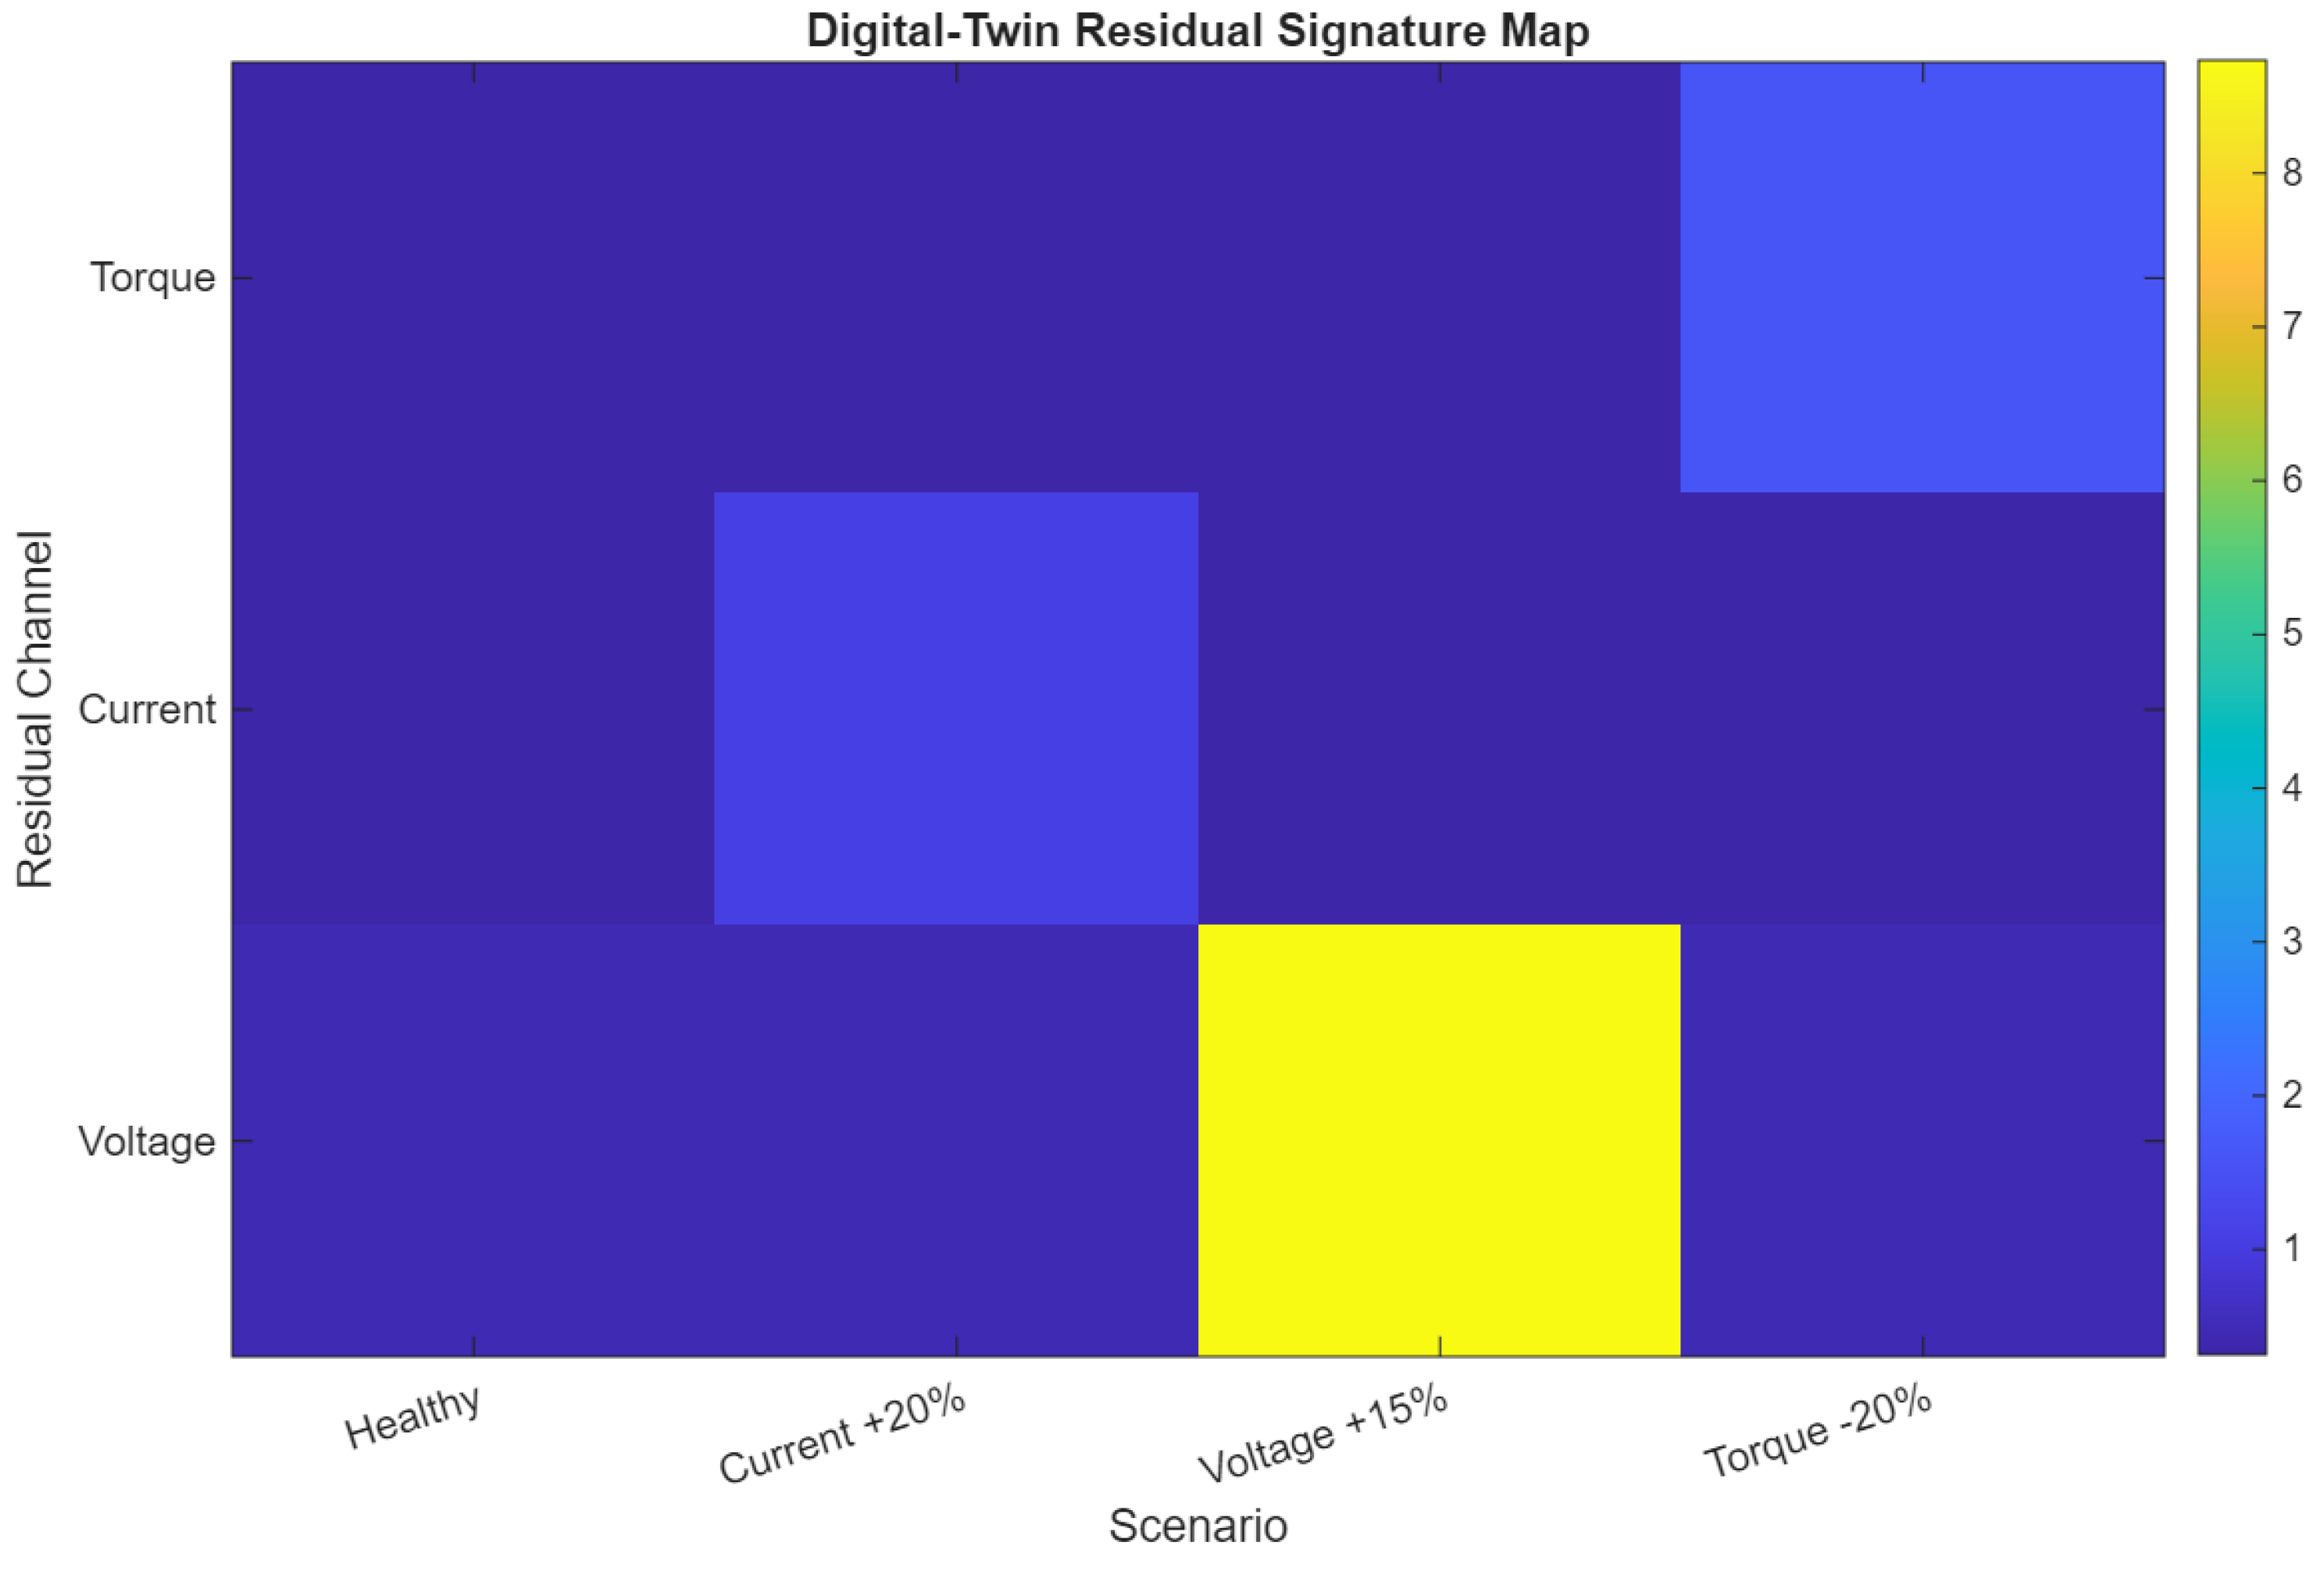
Figure 12.
Row-normalized confusion matrix of the Ensemble classifier for digital-twin residual-based fault classification.
Figure 12.
Row-normalized confusion matrix of the Ensemble classifier for digital-twin residual-based fault classification.
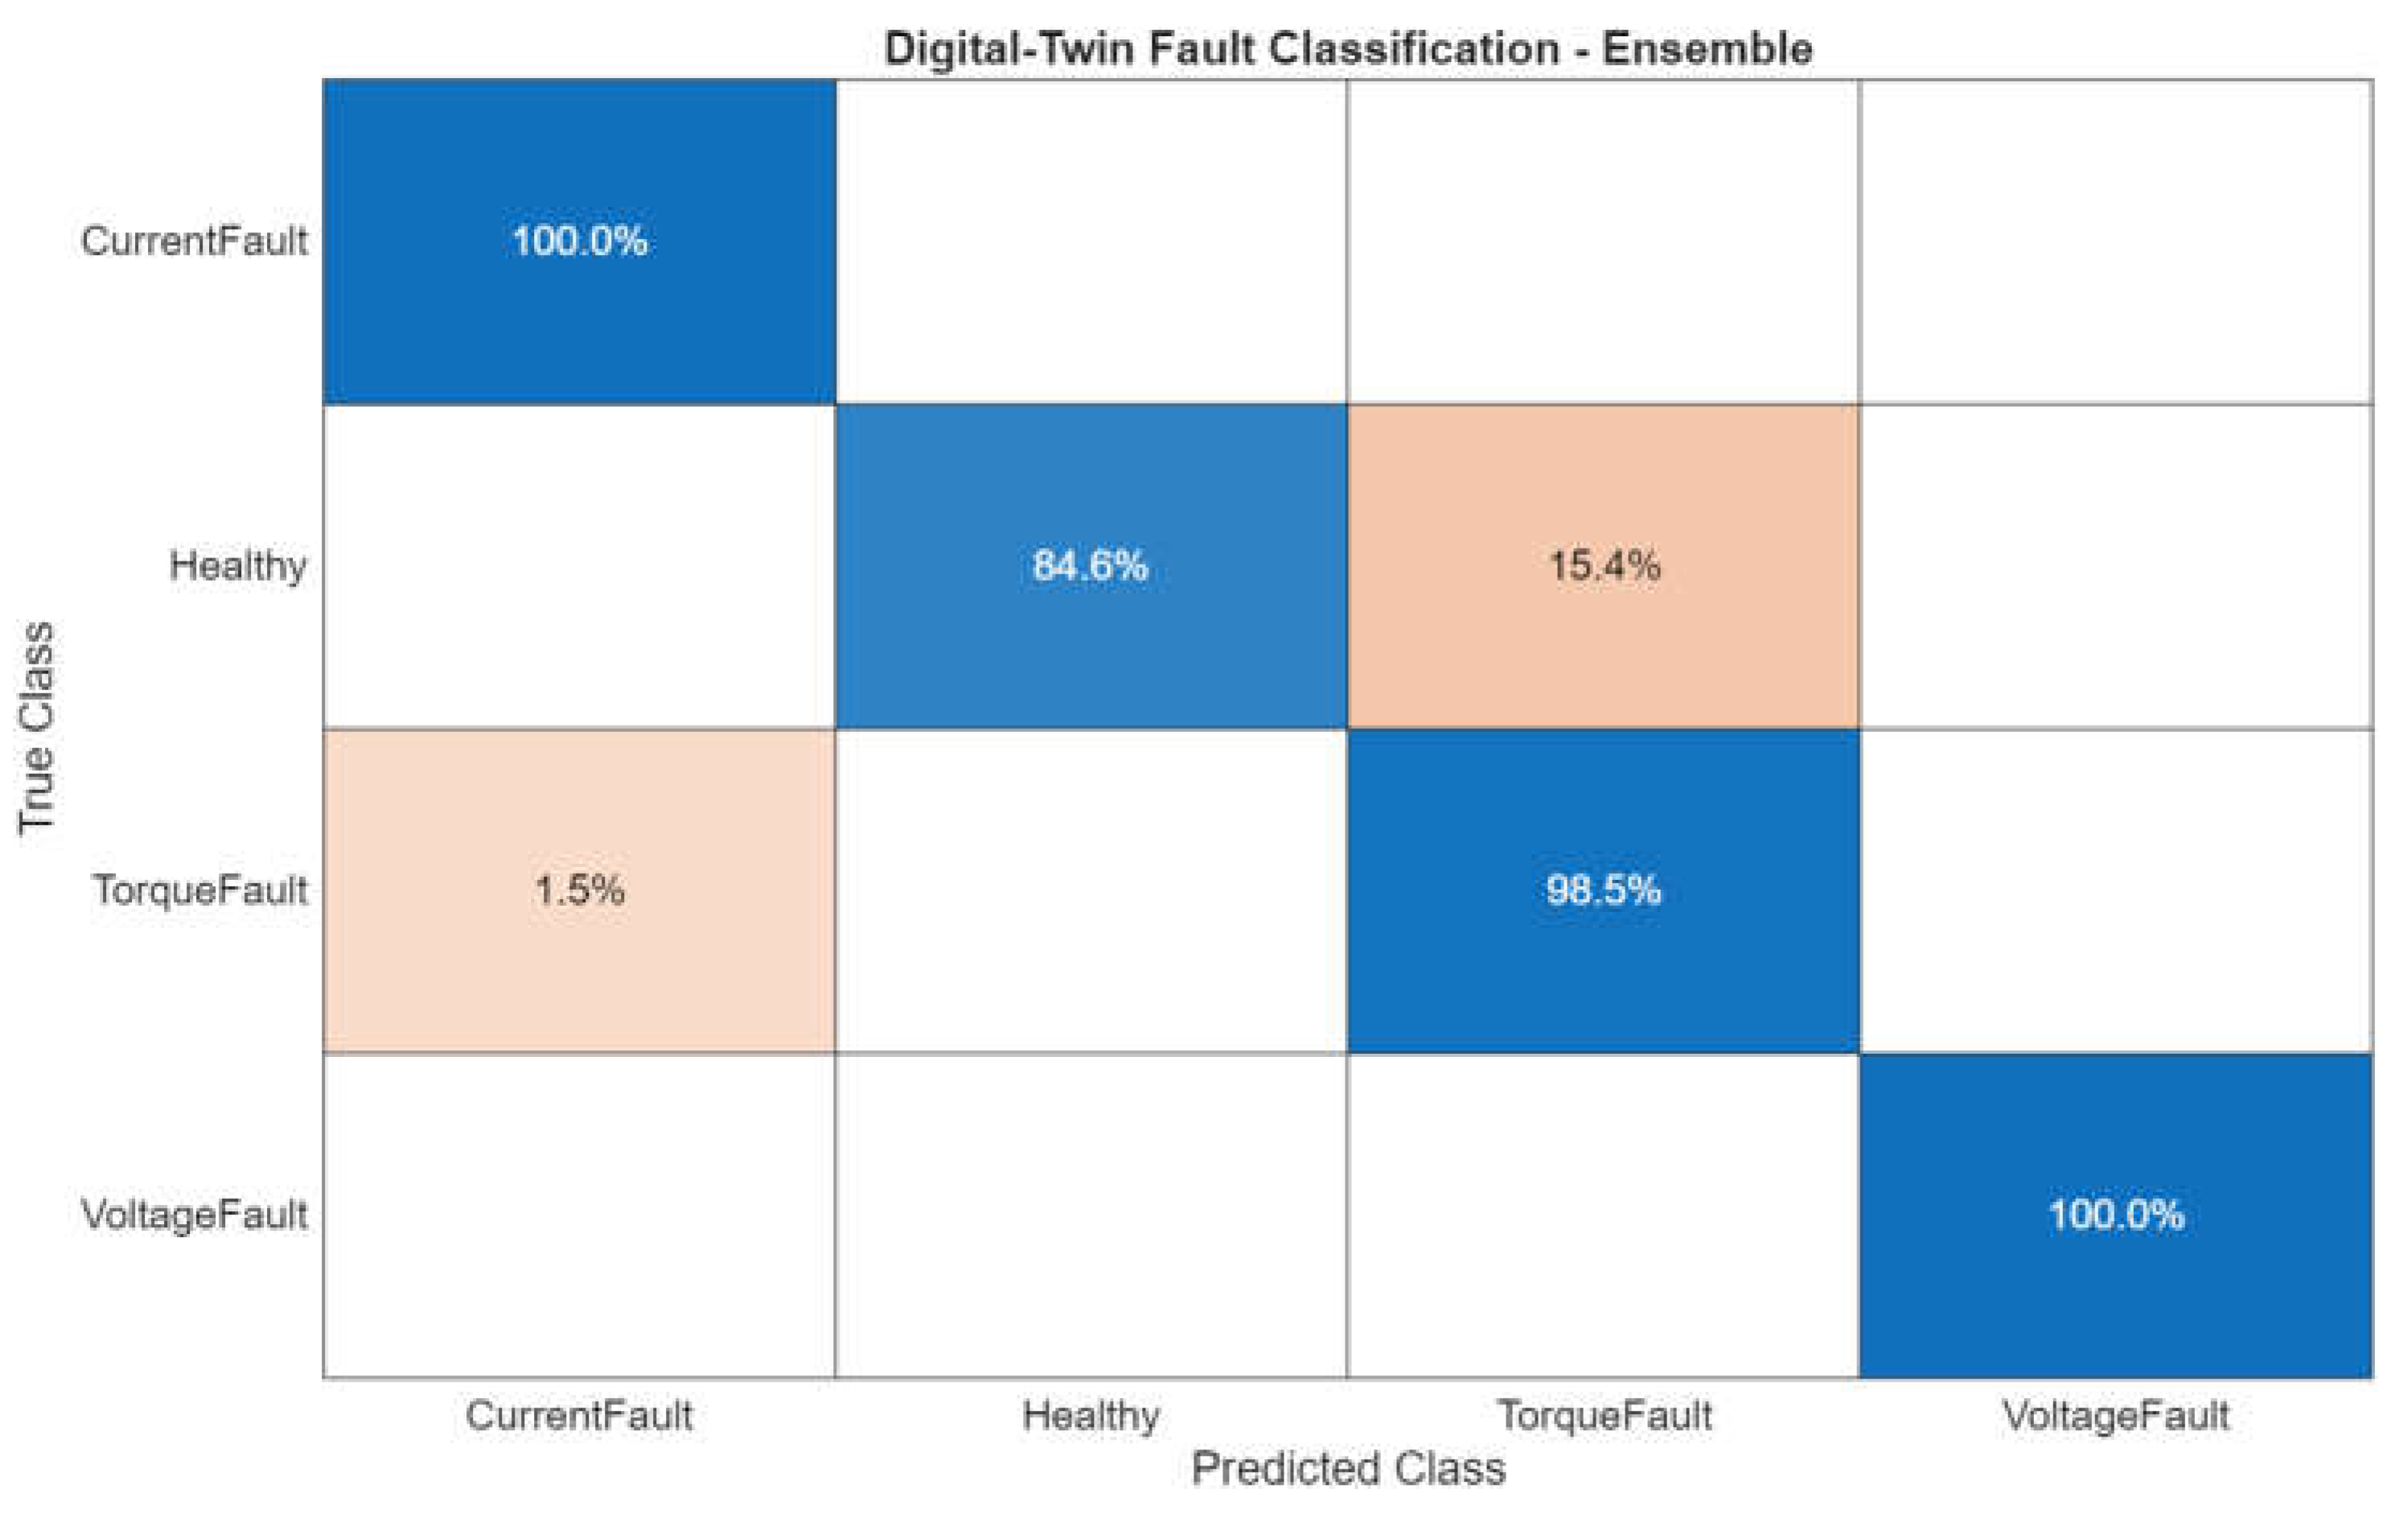
Figure 13.
Test-accuracy comparison of AI classifiers using digital-twin residual features.
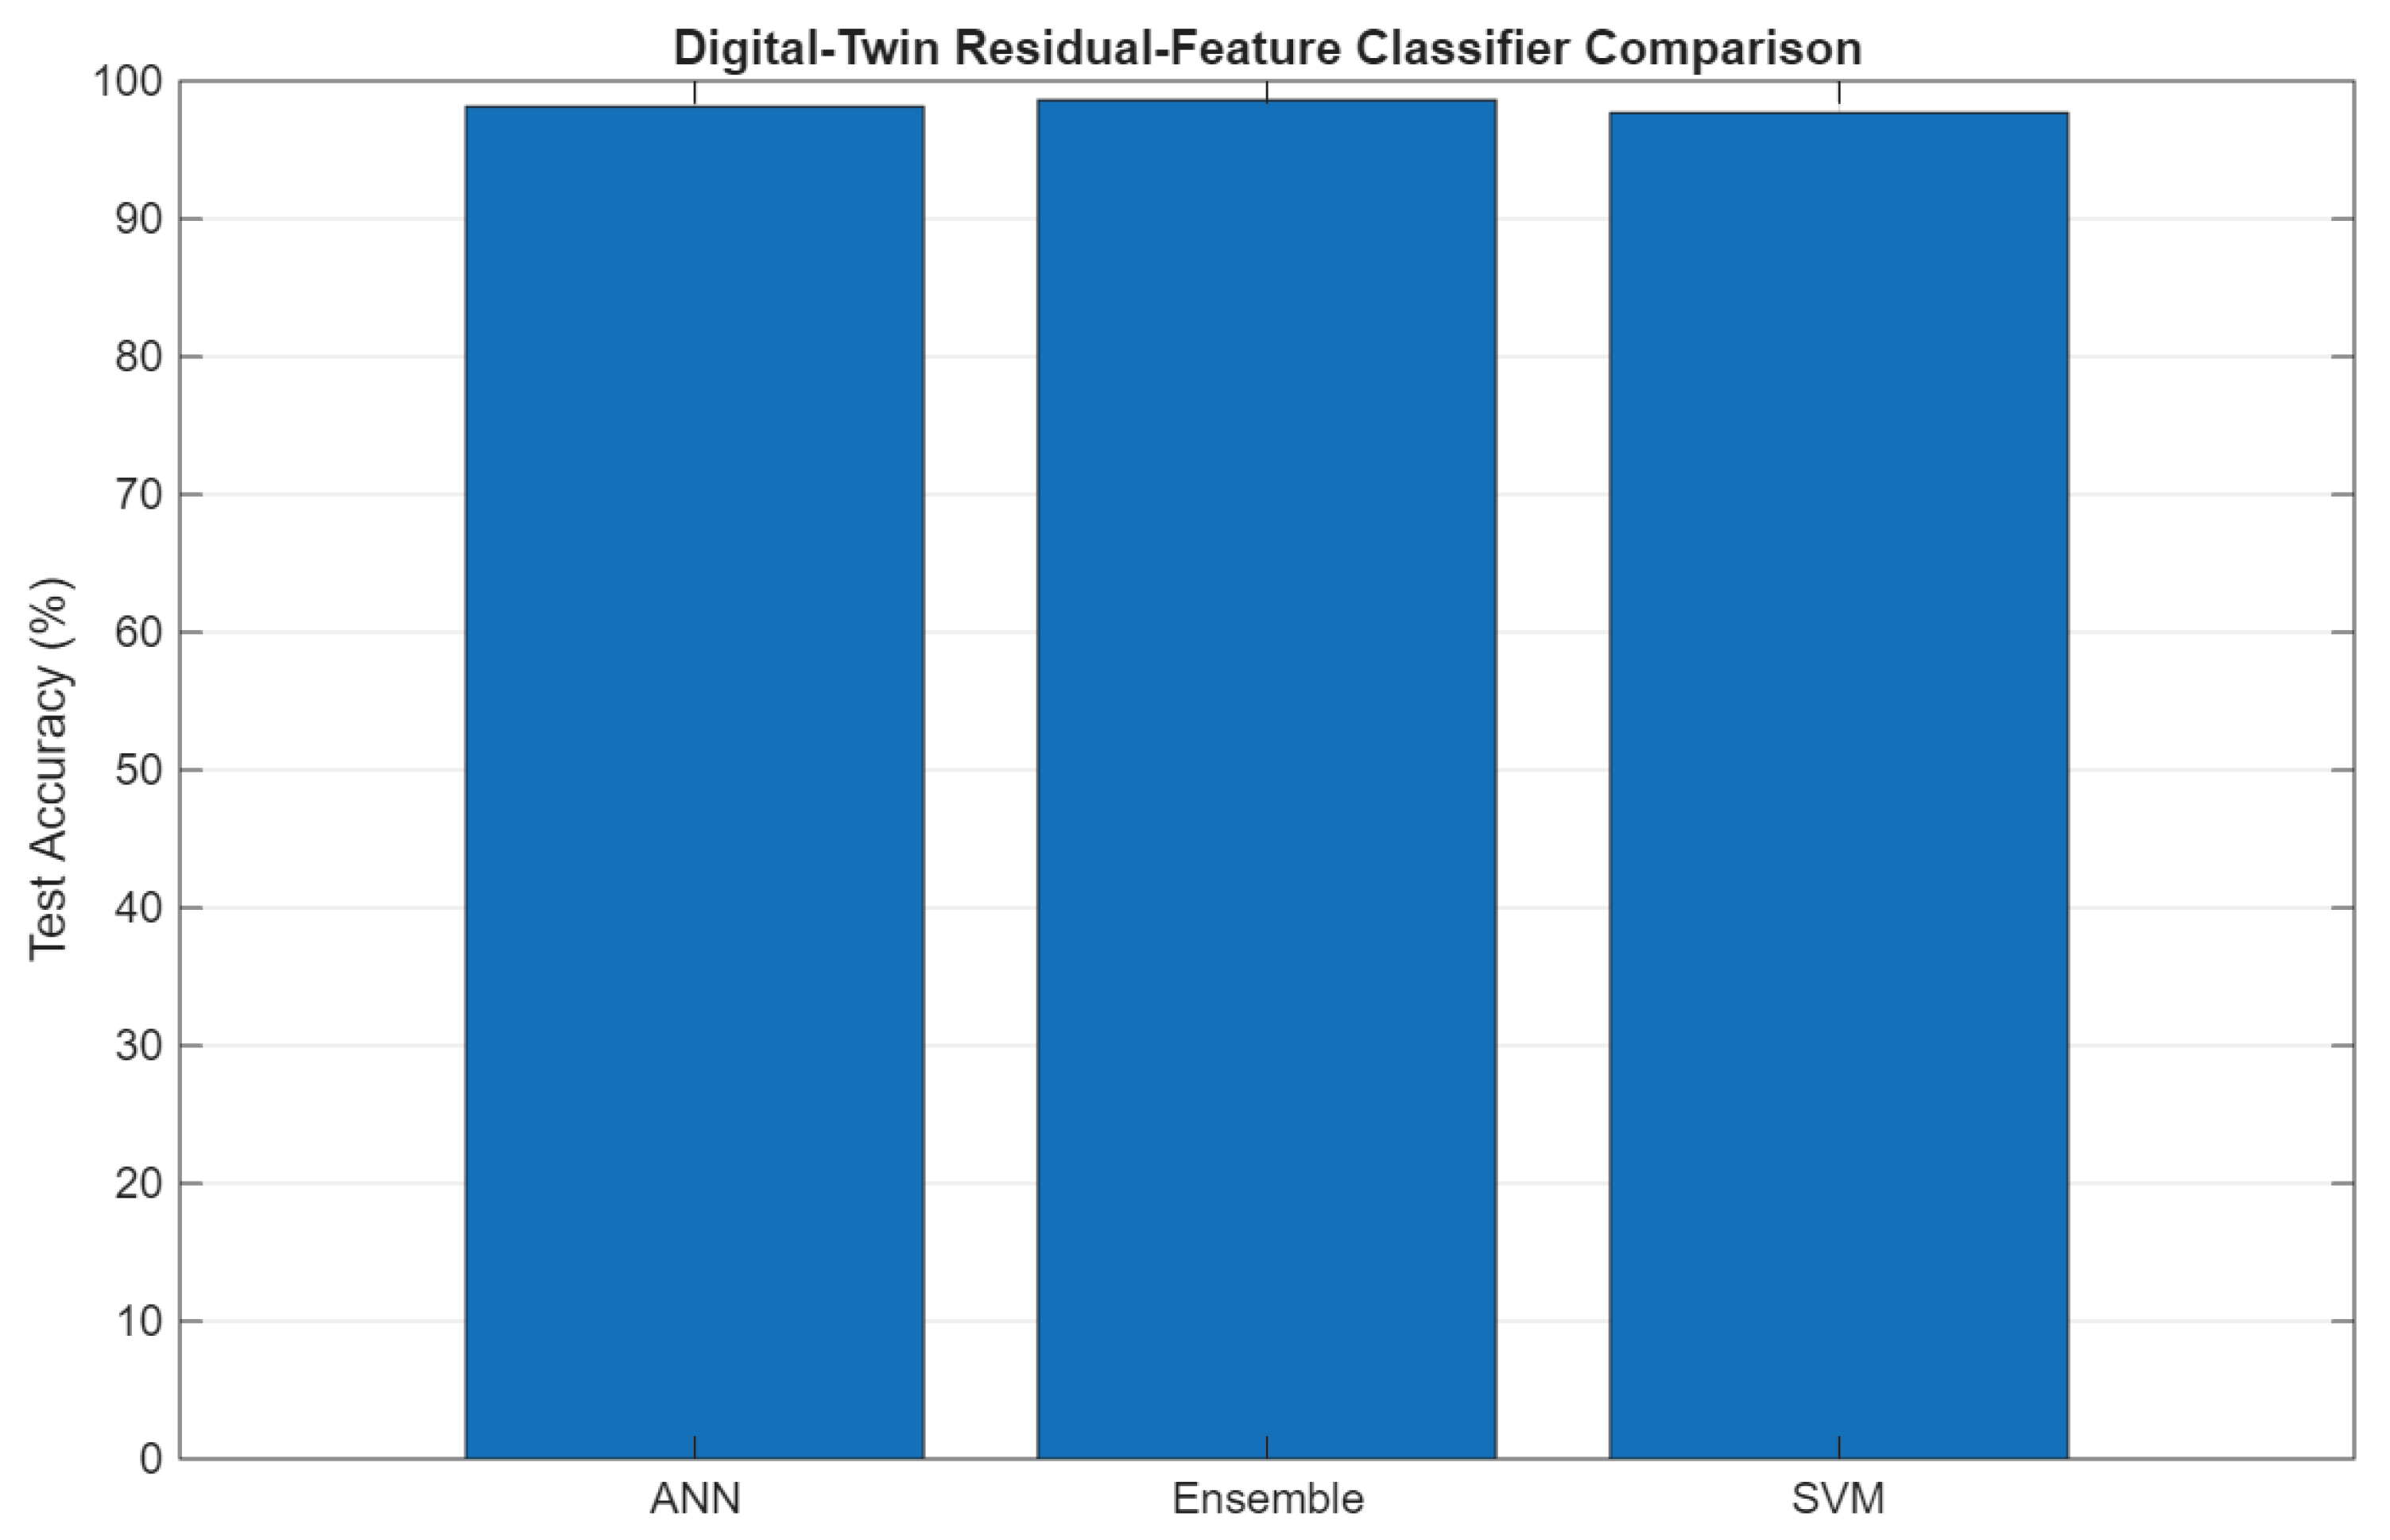
Figure 14.
Digital-twin prognostic-indicator trajectories under progressive simulated degradation.
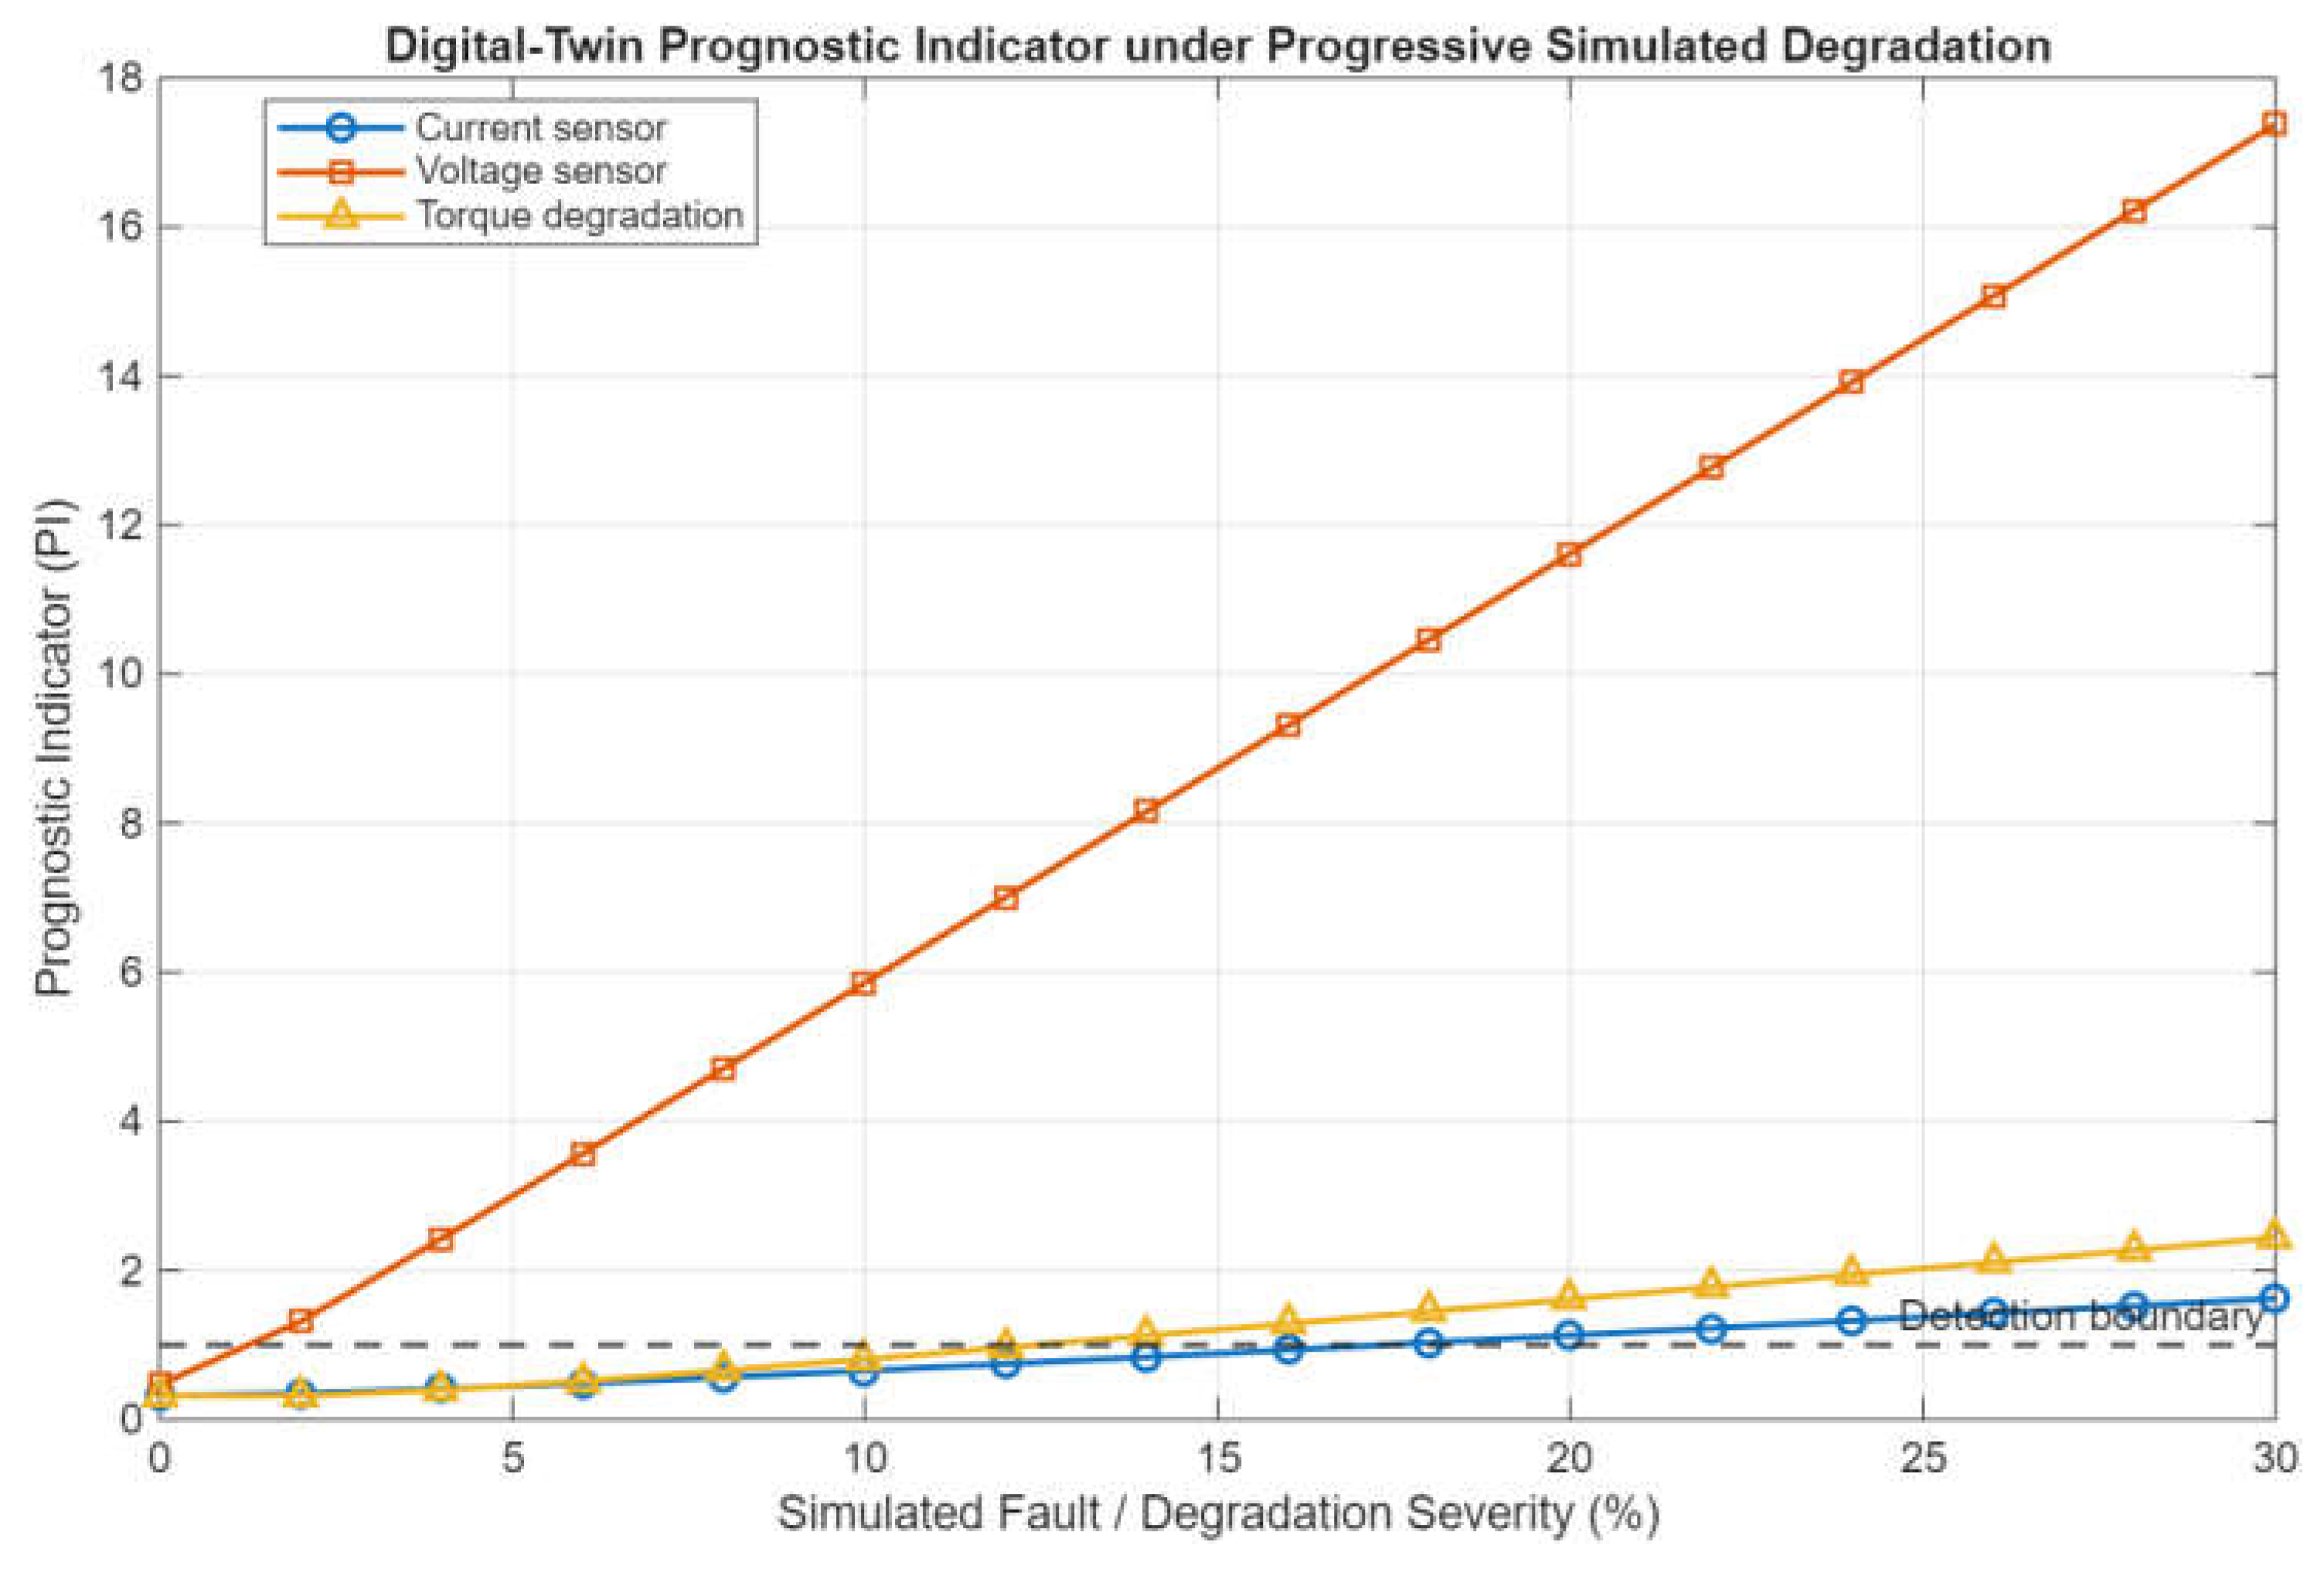
Table 2.
Definitions and units of the mathematical symbols used in the proposed framework.
| Symbol | Definition | Unit |
|---|---|---|
| Number of electrical machines | - | |
| Machine index | - | |
| Number of data samples | - | |
| State vector of the -th machine | - | |
| Augmented state vector of the complete multi-machine system | - | |
| Direct-axis stator current | A | |
| Quadrature-axis stator current | A | |
| Direct-axis stator voltage | V | |
| Quadrature-axis stator voltage | V | |
| Stator resistance | ||
| Direct-axis inductance | H | |
| Quadrature-axis inductance | H | |
| Direct-axis flux linkage | Wb | |
| Quadrature-axis flux linkage | Wb | |
| Effective excitation-field flux linkage | Wb | |
| Electrical angular velocity | rad/s | |
| Mechanical angular velocity | rad/s | |
| Rotor angular position | rad | |
| Number of pole pairs | - | |
| Electromagnetic torque | N m | |
| Applied load torque | N m | |
| Machine coupling torque | N m | |
| Equivalent shaft/coupling stiffness | N m/rad | |
| Equivalent coupling damping coefficient | N m s/rad | |
| Equivalent rotational inertia | kg m² | |
| Viscous friction coefficient | N m s/rad | |
| Input vector of machine | - | |
| Global multi-machine input vector | - | |
| Parameter vector of machine | - | |
| Global physical parameter vector | - | |
| Estimated digital-twin parameter vector | - | |
| Individual machine state matrix | - | |
| Individual machine input matrix | - | |
| Individual machine output matrix | - | |
| Augmented multi-machine state matrix | - | |
| Augmented input matrix | - | |
| Augmented measurement/output matrix | - | |
| Multi-machine coupling matrix | - | |
| Fault distribution matrix | - | |
| Disturbance distribution matrix | - | |
| Multi-machine coupling vector | - | |
| Global fault vector | - | |
| Process disturbance vector | - | |
| Measurement-noise vector | - | |
| Physical-system output vector | - | |
| Digital-twin estimated state vector | - | |
| Digital-twin estimated output vector | - | |
| Observer gain matrix | - | |
| State-estimation error vector | - | |
| Parameter-adaptation gain matrix | - | |
| Parameter regression/sensitivity matrix | - | |
| Physical-to-digital residual vector | - | |
| Electrical residual index | - | |
| Mechanical residual index | - | |
| Overall residual magnitude of machine | - | |
| System-level residual magnitude | - | |
| Fault-detection residual threshold | - | |
| Health-index normalization constant | - | |
| Machine health/residual weighting coefficient | - | |
| Machine health index | - | |
| Overall multi-machine health index | - | |
| Machine fault-severity index | - | |
| System-level fault-severity index | - | |
| Prognostic indicator | - | |
| Prognostic degradation-rate weighting coefficient | - | |
| Physics-informed diagnostic feature vector | - | |
| Estimated operating/fault class | - | |
| Intelligent fault-classification mapping | - | |
| Root-mean-square tracking error | Physical variable unit | |
| Mean absolute tracking error | Physical variable unit | |
| Normalized root-mean-square error | % | |
| Composite-objective weighting coefficients | - | |
| Composite digital-twin objective function | - | |
| Euclidean norm | - |
Table 3.
No-load performance under different phase-shift angles.
| Phase shift | Torque at 0 Hz (N·m) | Torque at 8 Hz (N·m) | Mean torque (N·m) | Excitation current at 8 Hz (A) | Motor current at 8 Hz (A) |
|---|---|---|---|---|---|
| 0° | 0.21 | 1.49 | 1.044 | 4.80 | 2.30 |
| 30° | 0.17 | 1.42 | 0.998 | 4.63 | 2.33 |
| 60° | 0.16 | 1.10 | 0.737 | 4.00 | 1.88 |
Table 4.
Loaded performance under different resistance conditions.
| Load | Mean torque (N·m) | Final torque (N·m) | Mean motor current (A) | Final motor current (A) |
|---|---|---|---|---|
| R1 = 50 Ω | 0.904 | 1.41 | 1.632 | 2.34 |
| R2 = 100 Ω | 0.857 | 1.38 | 1.613 | 2.30 |
| R3 = 300 Ω | 0.818 | 1.31 | 1.604 | 2.29 |
| R4 = 500 Ω | 0.800 | 1.33 | 1.594 | 2.26 |
| R5 = 1000 Ω | 0.797 | 1.27 | 1.614 | 2.31 |
Table 5.
Motor-current characteristics under different torque levels.
| Torque level | Current at If = 1 A (A) | Minimum current (A) | If at minimum (A) | Current at If = 5 A (A) | Mean current (A) |
|---|---|---|---|---|---|
| 0.26 N·m | 0.68 | 0.37 | 2.5 | 0.68 | 0.523 |
| 0.50 N·m | 0.84 | 0.49 | 2.5 | 0.86 | 0.650 |
| 1.00 N·m | 1.20 | 0.80 | 2.5 | 1.07 | 0.949 |
Table 6.
Summary of experimentally observed operating trends.
| Experimental factor | Observed trend | Interpretation for the digital twin |
|---|---|---|
| Increasing frequency | Torque, current, voltage, and power generally increase. | The twin must reproduce nonlinear operating-point dependence. |
| Increasing phase shift from 0° to 60° | Torque and excitation/current responses decrease at comparable frequencies. | Phase angle should be treated as an operating-condition input. |
| Changing R1–R5 load resistance | Torque and current responses vary with resistance/load condition. | Load condition must be represented in calibration and validation. |
| Increasing torque demand | Motor-current requirement increases. | Current is a useful electrical indicator for load and health monitoring. |
Table 7.
Experimental datasets used for digital-twin calibration and validation.
| Dataset group | Main variables | Operating conditions | Use in framework |
|---|---|---|---|
| No-load phase-shift tests | Frequency, torque, excitation current, motor current, power variables | 0°, 30°, 60° | Operating-characteristic analysis |
| Loaded resistance tests | Frequency, torque, motor current, motor voltage, power variables | R1–R5; 0° | Digital-twin calibration and validation |
| Additional phase-shift loaded tests | Frequency, torque, excitation current and available electrical variables | R1–R5; 60° | Cross-condition extension/validation |
| Torque-level tests | Excitation current, motor current, phase shift | ≈0.26, 0.50, 1.00 N·m | Supplementary operating-characteristic analysis |
Table 8.
Experimental digital-twin tracking and health-monitoring performance.
| Load | Torque RMSE (N·m) | Current RMSE (A) | Voltage RMSE (V) | Mean NRMSE (%) | Overall residual | HI | FS | Decision |
|---|---|---|---|---|---|---|---|---|
| R1 = 50 Ω | 0.0313 | 0.1106 | 0.6816 | 4.52 | 0.0467 | 0.9108 | 0.0892 | Healthy |
| R2 = 100 Ω | 0.0299 | 0.0970 | 0.4230 | 3.75 | 0.0385 | 0.9259 | 0.0741 | Healthy |
| R3 = 300 Ω | 0.0343 | 0.1071 | 0.4591 | 3.91 | 0.0401 | 0.9229 | 0.0771 | Healthy |
| R4 = 500 Ω | 0.0639 | 0.1269 | 0.3642 | 4.88 | 0.0513 | 0.9025 | 0.0975 | Healthy |
| R5 = 1000 Ω | 0.0360 | 0.0978 | 0.3497 | 3.71 | 0.0378 | 0.9273 | 0.0727 | Healthy |
Table 9.
Channel-specific digital-twin detection and isolation of simulated fault conditions.
| Condition | Torque score | Current score | Voltage score | Overall score | Detection | Diagnosis |
|---|---|---|---|---|---|---|
| Healthy | 0.321 | 0.315 | 0.467 | 0.467 | Healthy | Healthy |
| Current sensor fault (+20%) | 0.321 | 1.128 | 0.467 | 1.128 | Fault Detected | Current Sensor Fault |
| Voltage sensor fault (+15%) | 0.321 | 0.315 | 8.735 | 8.735 | Fault Detected | Voltage Sensor Fault |
| Torque degradation (-20%) | 1.612 | 0.315 | 0.467 | 1.612 | Fault Detected | Torque Fault |
Table 10.
Performance comparison of AI classifiers using digital-twin residual features.
| Classifier | Accuracy (%) | Precision | Recall | F1-score |
|---|---|---|---|---|
| SVM | 97.69 | 0.9821 | 0.9194 | 0.9436 |
| Ensemble | 98.61 | 0.9890 | 0.9578 | 0.9718 |
| ANN | 98.15 | 0.9855 | 0.9386 | 0.9582 |
Table 11.
Prognostic-indicator threshold crossing under progressive simulated degradation.
| Degradation mode | Threshold crossing severity (%) |
|---|---|
| Voltage sensor deviation | 1.26 |
| Torque degradation | 12.44 |
| Current sensor deviation | 17.37 |
Disclaimer/Publisher’s Note: The statements, opinions and data contained in all publications are solely those of the individual author(s) and contributor(s) and not of MDPI and/or the editor(s). MDPI and/or the editor(s) disclaim responsibility for any injury to people or property resulting from any ideas, methods, instructions or products referred to in the content. |
© 2026 by the authors. Licensee MDPI, Basel, Switzerland. This article is an open access article distributed under the terms and conditions of the Creative Commons Attribution (CC BY) license (http://creativecommons.org/licenses/by/4.0/).
Copyright: This open access article is published under a Creative Commons CC BY 4.0 license, which permit the free download, distribution, and reuse, provided that the author and preprint are cited in any reuse.