
Preprint
Article

This version is not peer-reviewed.

Environmental Risk Assessment of Toxic Emissions into the Air Resulting from Waste Fires

Submitted:

31 August 2026

Posted:

01 September 2026

You are already at the latest version

Abstract
The risk arising from the uncontrolled burning of waste is significant given the spatial conditions and the exposure to human health. The environmental risk associated with the emission of harmful gases and particulates into the air as a result of uncontrolled waste burning is the subject of an analysis of the legal consequences of the incident. In order to determine the risks involved, it is necessary to analyse the volume of emissions, the qualitative composition of these emissions, the range of pollutant dispersion during the event, and the level of human exposure in relation to the distribution of the pollutants present. As part of this study, the authors have undertaken work to address a research gap involving the development of a methodology for assessing environmental risk based on an analysis of the degree of exposure of people and the environment to air emissions from a waste storage facility fire. The resulting risk is assessed using analytical methods based on mathematical modelling of pollutant dispersion using the Gaussian “plume” model (Model Pasquilla) using a computer programme called Operat FB and analysing the reference levels set by the NDS (Maximum permissible concentration), EPA (The Environmental Protection Agency), OSHA (Occupational Safety and Health Administration) and under local Polish legislation. This paper presents a case study, namely the uncontrolled incineration of waste resulting from the treatment of municipal waste.
Keywords: 
;  ;  

1. Introduction

In recent years, incidents of uncontrolled waste burning at waste collection sites have become a significant problem in Poland. Between 2017 and 2022, there were 754 such incidents (NIK report) [1]. Among the reasons cited for this phenomenon are the ban on waste imports into China – which in previous years had accepted significant quantities from more economically developed countries – and the ban on the landfilling of combustible waste introduced in Poland, coupled with a simultaneous increase in the requirements that customers place on alternative fuels [2,3]. Risks of this kind also arise as a result of the growing volume of waste batteries, which are increasingly ending up at waste management facilities that do not process batteries [4,5].
In Poland, such incidents are generally the subject of investigations by the public prosecutor’s office, which are usually conducted with a view to identifying an offence under the Criminal Code, that is, bringing about an incident which threatens the safety of many people or property on a large scale, and towards criminalising the unauthorised handling of substances and waste, which may endanger human life or health or cause a deterioration in the quality of water, air or land, or damage to the plant or animal world.
Uncontrolled waste incineration produces toxic by-products, most of which are released into the atmosphere, they may therefore reduce air quality and pose a threat to the life and health of people breathing such air. When assessing whether these risks have materialised, difficulties may arise in determining the volume of harmful gases and pollutants to which people have been exposed, the duration and extent of that exposure, and identifying the specific levels of damage caused. The variation in emissions of harmful substances into the atmosphere results from the incineration of many different types of waste [6,7,8,9,10,11,12]. Information on the toxicity of pure combustion products is now considered standard knowledge [13]. Mixtures of products resulting from the combustion of certain types of waste were subjected to biotests, which revealed mutagenicity and cytotoxicity [9,14]. For genotoxic mutagens, a non-threshold model of action is traditionally assumed, according to which even a very small dose may carry a risk of inducing mutations. However, recent research suggests that threshold values may exist for certain mutagenic mechanisms [15]. This means that it is not possible to determine safe concentrations for them, below which they do not cause mutation.
Illegal waste incineration is typically dispersed, long-term and difficult to accurately identify. Emissions occur without any control over the combustion parameters, which makes it impossible to determine precisely the type of waste being incinerated and the volume of emissions of individual pollutants [16]. This process encourages the formation of particulate matter, carbon monoxide, polycyclic aromatic hydrocarbons, dioxins, furans, volatile organic compounds and heavy metals. Furthermore, emissions may originate from multiple sources simultaneously, which makes it significantly more difficult to assess their impact on the environment and human health. A landfill fire, on the other hand, is a sudden and short-lived event that can cause very high instantaneous concentrations of pollutants. Its scale depends primarily on the area affected by the fire, the type and quantity of waste, and meteorological conditions.
The first step in assessing environmental risk may be to determine the quantity of waste incinerated, the next is to determine the quantity and composition of the gases and particulates released into the air, followed by the dispersion range of these pollutants and the extent of their impact. The quantity of waste incinerated can usually be identified on the basis of records kept by a professional waste management facility or by calculating the volume of the storage area for that waste. Determining the qualitative and quantitative composition of emissions is currently a challenge that hinges on establishing the actual qualitative composition of the waste itself, which undoubtedly has a significant impact on the quantity and quality of the resulting emissions. Scientific research in this area shows a certain degree of diversity, likely due to uncertainties regarding the variation in the composition of the waste being incinerated. Some people measure the amount of carbon oxides (II and IV) generated as a result of the incineration of a unit mass of municipal waste [6], whereas others focus on the quantities of other pollutants produced when this waste is incinerated [7]. In some studies, the authors focus on the quantities of various combustion products from non-metallic waste originating from car shredders, it can be assumed, with some degree of approximation, that these results also apply to the combustion of plastic materials from other sources [8]. Lemieux and Ryan investigated the combustion products per unit mass of car tyres [9]. These studies enable an approximate calculation of the levels of gas and particulate emissions that might have been produced as a result of the uncontrolled incineration of the same or similar types of waste in other locations. The EPA presents a wide range of results regarding the emission rates from uncontrolled waste incineration in its document AP42, Fifth Edition, Volume I Chapter 2: Solid Waste Disposal [17].
In order to determine the extent of air pollutant spread, mathematical pollutant dispersion models are used to calculate the dispersion of air pollutants. A pollutant dispersion model is a tool (mathematical, physical or computer-based) which, in this context, describes how air pollutants spread through the environment [18]. It is used to assess air quality, the impact of industrial installations, and spatial planning.
In order to determine the environmental risk associated with the exposure of the environment to toxic gaseous and dust emissions, appropriate reference levels are adopted. Reference levels are established in accordance with legislation or on the basis of data from the literature, if such levels are not specified in legislation. Risk assessment based on the toxicity of emissions to air involves determining the level of pollutants present during the incident in areas where people are present, and assessing whether the concentration of pollutants at that location is at a level that could pose a risk. When assessing harm to humans, the levels most commonly referred to are the NDS, NDSCh and NDSP levels.

2. Materials and Methods

2.1. Determination of Gas and Dust Emissions

Determining the quantities of gases and dust released into the atmosphere involves establishing the amount of waste incinerated and having data on the quantities of products generated by the incineration of a single unit of waste. To date, the quantities of combustion products from unit quantities of car tyres in shreds and pieces [9], non-metallic residues from car shredders [8], municipal waste [6,7], agricultural waste [10] and military waste [11,12] have been determined. Uncontrolled waste combustion often takes place at temperatures significantly lower than those in waste incineration plants, these can range from 80–230 °C in the case of surface combustion, and 309–406 °C in the case of deep combustion. At the point where combustion begins and at its centre, the temperature is significantly higher, e.g. 704 °C [19,20]. High temperatures are also found at plastic waste incineration sites, particularly when there is a large amount of such waste or when it is relatively flammable [21]. The combustion temperature has a significant impact on the composition of the combustion products, it is therefore important that predictions of the risks posed by uncontrolled waste combustion are based on emission data from incidents of a similar nature, rather than on data relating to combustion under optimal laboratory conditions.
This study analysed a case study as an example of a typical waste fire incident that took place in a selected town in south-western Poland. The quantity of waste that was burnt was calculated on the basis of the waste records kept by the facility, including waste received and transferred for disposal as post-disaster waste. Information on the meteorological conditions at the time of the fire, obtained from a source at the scene, was used for the calculations. Emission factor levels were adopted on the basis of data from the study „EPA AP-42, Vol. I, CH 2.5: Open Burning”[22]. Furthermore, the data on emission duration – that is, the duration of the fire – were taken from the findings reported by the State Fire Service. The emission calculations are presented below (Table 1).

2.2. Modelling the Dispersion Range of Pollutants

Once the estimated quantities of gases and particulates emitted into the atmosphere during waste incineration had been determined, their likely concentrations were calculated at the nearest locations where people regularly spend time and who might be exposed to the harmful effects of these substances. For this purpose, the Gaussian plume model and Pasquin’s atmospheric stability classes were used, this model is the reference model and is recommended by current legislation on the basis of national regulations. Guidelines for carrying out calculations of pollutant emission dispersion using the Gaussian plume model and Pasquin’s atmospheric stability classes are set out in Annex 3 to the Regulation of the Polish Minister for the Environment of 26 January 2010 on reference values for certain substances in the air (Dz. U. z 2010 r. Nr 16, poz. 87) [10]. However, this model is not mandatory across the European Union under a single piece of legislation. The European Union sets out requirements regarding air quality and the assessment of the impact of emissions, leaving the choice of specific dispersion models to the Member States. In many countries, the use of models based on Pasquin’s theory stems directly from national legislation or official regulatory guidelines. In Germany, the relevant legislation is the Technische Anleitung zur Reinhaltung der Luft – TA Luft, issued under the Bundes-Immissionsschutzgesetz (BImSchG), which requires the use of the AUSTAL2000 model as the reference method for dispersion calculations [23,24]. The document itself no longer explicitly mentions the Pasquin model, but AUSTAL2000 is derived from classical dispersion models based on Pasquin’s theory. This method, which is cited directly, is set out in the United States Environmental Protection Agency’s 40 CFR Part 51 [25]. In other countries, however, and in their documents – such as those of the UK’s Environment Agency – only the Pasquin stability class is used [26].
The model used assumes average meteorological conditions from the measurement period, uniform terrain, constant emission parameters and a simplified description of atmospheric turbulence [27]. Despite its simplicity, it is still used in preliminary analyses and in some reference methodologies.

2.3. Assessment of Environmental Risk

Polish legislation regulates the concentrations of hazardous substances released into the environment by setting reference levels, exceeding these levels leads to a deterioration in air quality. In order to determine the risk associated with the potential for harm to humans and the environment due to air pollution by toxic substances, it is necessary to consider the concentrations of these substances in the air in the context of environmental damage and adverse effects on human health. Pollutant levels constituting a deterioration in air quality may only give rise to a potential risk to the environment when their quality standards are exceeded, however, this does not necessarily imply a risk to human health. With regard to ambient air quality, limit values for certain substances in the air have been specified, expressed as daily average and annual average values (for annual average values, a permissible frequency of exceedances is also specified) – Regulation of the Minister for the Environment of 24 August 2012 on the levels of certain substances in the air (Dz.U. 2012.1031 z późn. zm.) [28].
In order to assess the risk to humans, account must be taken of the concentration levels of compounds that are toxic to human health, as short-term exposure to which may cause harm to one’s health [29]. These concentrations are partly specified in the Polish national regulation issued by the Minister for Family, Labour and Social Policy on 12 June 2018 concerning the maximum permissible concentrations and intensities of factors harmful to health in the workplace (Dz.U. 2018. 1286 z późn. zm) [30], based on the defined maximum permissible concentrations (NDS) – the weighted average concentration such that exposure to it by a worker over an 8-hour working day and an average working week, throughout their working life, should not result in adverse effects on their health or on the health of future generations.
Under the legislation, a deterioration in air quality may be considered justified if the frequency with which the maximum reference values for substances in the air or the permissible levels for such substances are exceeded is greater than 0.274 per cent of the time in a year in the case of sulphur dioxide, and 0.2 per cent of the time in a year for other substances in the air. This condition applies to concentrations of regulated substances, 0.2 per cent of the year equates to 17.5 hours, whereas the waste fire in question lasted for up to 3.5 hours. Consequently, any exceedances of the limit values used to determine the deterioration in air quality during that period fell within the permissible range of 0.2% of the year.
Given that current legislation does not specify limit values for all substances emitted during a fire, a review was also carried out of the limit values in accordance with the standards and norms set by the EPA (U.S. Environmental Protection Agency), i.e. the air quality standard in force in the United States, and OSHA (Occupational Safety and Health Administration), i.e. the occupational health and safety standard in force in the United States. In the context of assessing the risk associated with the potential impact on human health of toxic emissions into the air, it is appropriate to establish additional, reliable reference values. Based on the data analysis carried out, a dataset has been prepared in relation to the emissions under consideration (Table 2).
Exceeding the values defined as acceptable according to the above sources of information should therefore be regarded as a justified environmental risk associated with a threat to human health. It should be noted, however, that the most reliable confirmation of the existence of a risk is to refer to the NDS values as relevant in the context of the potential to cause a risk to the health of people within the range of exposure to the concentrations of air pollutants in question.

3. Results

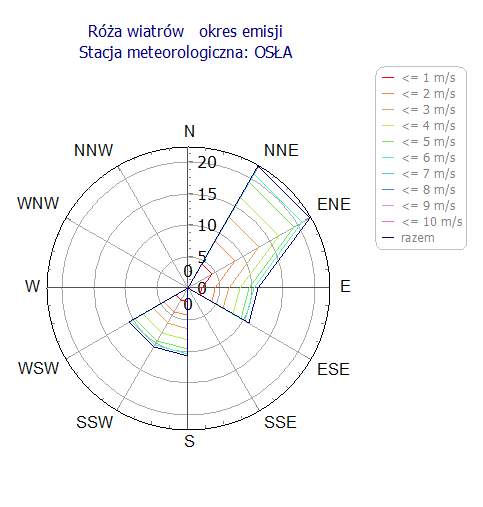
Given that this analysis focuses on the emission episode (the duration of the fire), wind rose data (wind directions and speeds) have also been taken into account. According to meteorological data, the prevailing winds blow from the north-north-east. The wind rose used for the calculations is shown below (Figure 2).
Figure 1. The wind rose adopted for the calculations.
Preprints 231052 g001
The aerodynamic roughness factor was calculated in accordance with the regulation [10], as the area-weighted average of the terrain roughness values around the object in question for each type of area, calculated at a level of z0 = 0,035.
The emitter parameters were determined on the basis of data on the area of the waste fire site, which was therefore assumed to be 50 m2.
As part of the modelling calculations, additional concentration monitoring points were established in the immediate vicinity (i.e. an additional grid), including areas inhabited by people, such as the nearest selected settlement. The purpose of establishing these monitoring points is to identify the concentration levels occurring in areas where people are present, and thus to determine people’s exposure to pollutants. The nearest sensitive areas, i.e. the nearest settlement, are located approximately 700 m from the site of the fire.
Given the temporary nature of the emissions – i.e. a fire lasting 3.5 hours – average concentrations and the frequency of exceedances of one-hour concentration limits are not taken into account.
The concentration isolines shown in the diagrams below are presented here, along with tabular results indicating the maximum value and the frequency of exceedances of “D1” – this is the reference value for the substance in the air or the permissible level of the substance in the air, averaged over one hour, in accordance with the Regulation Dz.U.2010.16.87 [10]. Table 4, Table 5, Table 6, Table 7, Table 8, Table 9, Table 10, Table 11, Table 12, Table 13, Table 14, Table 15, Table 16, Table 17, Table 18, Table 19, Table 20 and Table 21, the frequency of occurrence of the calculated pollutant concentrations “Z” and the “critical equilibrium state of the atmosphere” are given, the latter is based on established atmospheric equilibrium states on a scale corresponding to the wind speed range “critical wind speed” as set out in Table 3.
Figure 2. Isolines of maximum concentrations (A) PM-10 particulate matter, (B) Benzo(a)pyrene, (C) Benzene, (D) Toluene, (E) Ethylbenzene, (F) PM 2.5 particulate matter, (G) Hexane, (H) Anthracene, (I) Benzo(b)fluoranthene, (J) Benzo(e)pyrene, (K) Benzo(g,h,i)perylene, (L) Benzo(k)fluoranthene, (M) Chrysene, (N) Fluoranthene, (O) Benzo(a)anthracene, (P) Phenanthrene, (R) Pyrene, (S) Retene.
Preprints 231052 g002aPreprints 231052 g002bPreprints 231052 g002c
Table 3. An overview of metrological conditions, including the state of atmospheric equilibrium in relation to the range of wind speeds.
The state of equilibrium of the atmosphere Wind speed range ua x [m/s]
1 - extremely unstable 1 - 3
2 - unstable 1 - 5
3 - slightly unstable 1 - 8
4 - neutral 1 - 11
5 - slightly stable 1 - 5
6 - stable 1 - 4
Table 4. Summary of maximum PM-10 concentration (µg/m3) values in the supplementary grid.
Parameter Value X Y Z crit. crit. crit.
m m m state.eq wind.s. wind.d.
Maximum concentration µg/m3 1,2 1012 1804 1 6 1 S
Frequency of exceedances D1= 280, % 0,00 - - - - - -
Table 5. Summary of maximum benzo(a)pyrene concentrations (µg/m3) in the supplementary grid.
Parameter Value X Y Z crit. crit. crit.
m m m state.eq wind.s. wind.d.
Maximum concentration µg/m3 0,00 1012 1804 1 6 1 S
Frequency of exceedances D1= 0,012, % 0,00 - - - - - -
Table 6. Summary of maximum benzene concentration (µg/m3) values in the supplementary grid.
Parameter Value X Y Z crit. crit. crit.
m m m state.eq wind.s. wind.d.
Maximum concentration µg/m3 0,00 1012 1804 1 6 1 S
Frequency of exceedances D1= 30, % 0,00 - - - - - -
Table 7. Summary of maximum toluene concentration (µg/m3) values in the supplementary grid.
Parameter Value X Y Z crit. crit. crit.
m m m state.eq wind.s. wind.d.
Maximum concentration µg/m3 0,00 1012 1804 1 6 1 S
Frequency of exceedances D1= 100, % 0,00 - - - - - -
Table 8. Summary of maximum ethylbenzene concentrations (µg/m3) in the supplementary grid.
Parameter Value X Y Z crit. crit. crit.
m m m state.eq wind.s. wind.d.
Maximum concentration µg/m3 0,00 1012 1804 1 6 1 S
Frequency of exceedances D1= 500, % 0,00 - - - - - -
Table 9. Summary of maximum PM 2.5 concentration (µg/m3) values in the supplementary grid.
Parameter Value X Y Z crit. crit. crit.
m m m state.eq wind.s. wind.d.
Maximum concentration µg/m3 1,1 1012 1804 1 6 1 S
Frequency of exceedances – not applicable, D1 none - - - - - - -
Table 10. Summary of maximum hexane concentration (µg/m3) values in the supplementary grid.
Parameter Value X Y Z crit. crit. crit.
m m m state.eq wind.s. wind.d.
Maximum concentration µg/m3 0,001 1012 1804 1 6 1 S
Frequency of exceedances D1= 700, % 0,00 - - - - - -
Table 11. Summary of maximum anthracene concentration (µg/m3) values in the supplementary grid.
Parameter Value X Y Z crit. crit. crit.
m m m state.eq wind.s. wind.d.
Maximum concentration µg/m3 0,001 1012 1804 1 6 1 S
Frequency of exceedances D1= 200, % 0,00 - - - - - -
Table 12. Summary of maximum benzo(b)fluoranthene concentrations (µg/m3) in the supplementary grid.
Parameter Value X Y Z crit. crit. crit.
m m m state.eq wind.s. wind.d.
Maximum concentration µg/m3 0,003 1012 1804 1 6 1 S
Frequency of exceedances D1= 20, % 0,00 - - - - - -
Table 13. Summary of maximum benzo(e)pyrene concentration (µg/m3) values in the supplementary grid.
Parameter Value X Y Z crit. crit. crit.
m m m state.eq wind.s. wind.d.
Maximum concentration µg/m3 0,003 1012 1804 1 6 1 S
Frequency of exceedances D1= 0,008, % 0,00 - - - - - -
Table 14. Summary of maximum benzo(g,h,i)perylene concentrations (µg/m3) in the supplementary grid.
Parameter Value X Y Z crit. crit. crit.
m m m state.eq wind.s. wind.d.
Maximum concentration µg/m3 0,004 1012 1804 1 6 1 S
Frequency of exceedances D1= 200, % 0,00 - - - - - -
Table 15. Summary of maximum benzo(k)fluoranthene concentrations (µg/m3) in the supplementary grid.
Parameter Value X Y Z crit. crit. crit.
m m m state.eq wind.s. wind.d.
Maximum concentration µg/m3 0,001 1012 1804 1 6 1 S
Frequency of exceedances D1= 200, % 0,00 - - - - - -
Table 16. Summary of maximum chrysen concentrations (µg/m3) in the supplementary grid.
Parameter Value X Y Z crit. crit. crit.
m m m state.eq wind.s. wind.d.
Maximum concentration µg/m3 0,005 1012 1804 1 6 1 S
Frequency of exceedances D1= 20, % 0,00 - - - - - -
Table 17. Summary of maximum fluoranthene concentrations (µg/m3) in the supplementary grid.
Parameter Value X Y Z crit. crit. crit.
m m m state.eq wind.s. wind.d.
Maximum concentration µg/m3 0,032 1012 1804 1 6 1 S
Frequency of exceedances D1= 200, % 0,00 - - - - - -
Table 18. Summary of maximum phenanthrene concentrations (µg/m3) in the supplementary grid.
Parameter Value X Y Z crit. crit. crit.
m m m state.eq wind.s. wind.d.
Maximum concentration µg/m3 0,002 1012 1804 1 6 1 S
Frequency of exceedances D1= 0,2, % 0,00 - - - - - -
Table 19. Summary of maximum phenanthrene concentrations (µg/m3) in the supplementary grid.
Parameter Value X Y Z crit. crit. crit.
m m m state.eq wind.s. wind.d.
Maximum concentration µg/m3 0,007 1012 1804 1 6 1 S
Frequency of exceedances D1= 200, % 0,00 - - - - - -
Table 20. Summary of maximum pyrene concentrations (µg/m3) in the supplementary grid.
Parameter Value X Y Z crit. crit. crit.
m m m state.eq wind.s. wind.d.
Maximum concentration µg/m3 0,017 1012 1804 1 6 1 S
Frequency of exceedances D1= 200, % 0,00 - - - - - -
Table 21. Summary of maximum retene concentrations (µg/m3) in the supplementary grid.
Parameter Value X Y Z crit. crit. crit.
m m m state.eq wind.s. wind.d.
Maximum concentration µg/m3 0,006 1012 1804 1 6 1 S
Frequency of exceedances – not applicable, D1 none - 2043 2117 1 6 1 SSW
Chart key: 0,0X - Values corresponding to the isolines [µg/m³], ---- - Isolines of maximum concentrations [µg/m³], 0,00X - Maximum concentration values at calculation points (receptor grid) for which no closed isoline has been determined [µg/m³].
Calculations have shown that the concentrations of substances emitted as a result of the fire in question, as observed in the nearest residential areas, including the nearest selected settlement:
  • • do not exceed the applicable national air quality standards, which are regulated by the Regulation of the Minister for the Environment of 26 January 2010 on reference values for certain substances in the air (Dz. U. z 2010 r. Nr 16, poz. 87)[10],
  • • do not exceed the EPA’s air quality standards,
  • • do not exceed the Occupational Safety and Health Administration (OSHA) air quality standards,
  • • do not exceed the NDS values specified in the Regulation of the Minister for Family, Labour and Social Policy of 12 June 2018 on the maximum permissible concentrations and intensities of factors harmful to health in the workplace (Dz.U. 2018.1286 z późn. zm)[30]
The calculations showed that the most unfavourable atmospheric conditions for the spread of pollutants within the vicinity of sensitive areas were: atmospheric equilibrium state “6 – stable”, a critical wind speed of 1 m/s, and a critical wind direction of “S – south”. This means that, under such meteorological conditions, the highest concentrations of pollutants in the atmosphere were reached during the fire. Nevertheless, the calculations show that even under these established unfavourable meteorological conditions, pollutant levels did not reach a level that could have affected the health and lives of people living in the nearest settlement..

4. Discussion

On the basis of the analyses and calculations carried out, it was established that there was no evidence that the waste accumulated on the site during its uncontrolled burning had been stored in such quantities or under such conditions that it could have posed a threat to human life and health, as it was not demonstrated that:
  • In the areas surrounding the nearest settlements where people were present, concentrations of substances produced during the uncontrolled burning of waste could reach levels toxic to humans during exposure,
  • in areas outside the nearest settlements, particularly in the immediate vicinity of burning waste, there were people who could have been exposed to harmful substances produced by the fire,
Based on the findings of the analyses, it can also be concluded that a fire on this scale could not have caused a deterioration in air quality, as:
  • It has not been demonstrated that the concentrations of hazardous substances emitted into the atmosphere during a fire exceed the reference levels set out in the Regulation of the Polish Minister for the Environment of 26 January 2010 on reference levels for certain substances in the air (Dz. U. z 2010 r. Nr 16, poz. 87) [10],
  • the fire was a short-lived event – it lasted up to 3.5 hours, which is less than 17.5 hours, corresponding to 0.2 per cent of a year, i.e. the period during which levels for substances other than sulphur dioxide may be exceeded.
It is difficult to determine the actual impact on health of incidents involving the uncontrolled burning of waste for a number of reasons. Such incidents occur unexpectedly, which makes it impossible to carry out comprehensive measurements of the concentrations of combustion products emitted into the environment. Nor are measurements taken of the combustion temperature or the dynamics of the process, as this is an uncontrolled event. Based on information about the incident, it is possible to determine the time of the fire, its location and when the fire-fighting operation was completed. Based on records and actual attendance figures, an approximate volume of waste can be recorded. This makes it possible to estimate the approximate quantity of waste incinerated. Based on the information gathered in this way, it is necessary to determine whether the incident could have posed a risk to human life and health. The answer to these questions should depend on the quantity of pollutants released into the environment as a result of the uncontrolled burning of waste, the extent of their dispersion in the environment, and the degree of exposure of the human body to concentrations of toxic substances..
It cannot be assumed that every instance of exceeding a threshold value poses a risk to human life and health, as everything depends on the amount of the substance absorbed. However, prolonged exposure to toxic substances can be harmful to human health. For this very reason, it cannot be taken for a fact that the release of even a minimal amount of a mutagenic substance into the environment poses a threat to human life or health.
In the case under analysis, there was no exceedance of airborne concentrations of substances toxic to human health as a result of short-term exposure at a distance of 700 metres from the residential buildings closest to the site of the fire. The high number of "waste fires" and the associated environmental risks linked to excessive emissions of toxic substances in recent years also point to an urgent need to undertake experimental work aimed at identifying the actual products of waste combustion at low temperatures, under conditions of limited oxygen supply. The research should primarily cover: mixed municipal waste, the combustible fraction of municipal waste, and batteries and accumulators. Analysing environmental risk in the context of the toxicity of emissions to air is also important from the perspective of the legal aspects of enforcing claims arising from environmental quality breaches, including risks to human health.

5. Conclusions

This paper presents a methodology for assessing the risk of exposure to local residents in the immediate vicinity, based on an assessment of the toxicity of concentrations measured in these areas as a result of pollutant emissions from an uncontrolled waste fire. Assessing the toxicity of burning this type of waste requires an analysis that takes into account the type of waste being burnt, the volume of emissions, the duration of the fire and the meteorological conditions during the incident. The toxicity assessment of the concentrations was carried out on the basis of data gathered from the literature and regulatory sources, using calculation methods for the dispersion of pollutants. Furthermore, the assessment methods employed made it possible to identify areas exposed to the effects of pollutant emissions, which in turn allows the potential impacts of such emissions to be determined. The pollutant concentration values obtained may also indicate that, within a radius of 700 m, there was no significant risk of human exposure to the toxic effects of the identified substances following the uncontrolled burning of a specified quantity (14,000 kg) and type of waste (residue from municipal waste treatment) over a specified fire duration (3.5 hours) and under specified meteorological conditions.
For the case under analysis, the calculations carried out showed that the predicted concentrations of the toxic substances under investigation did not exceed the applicable national and international standards. The results obtained indicate that the mere occurrence of a fire on such a scale is not in itself sufficient to conclusively establish a risk to human health or the environment.
The comprehensive approach and the proposed methodology for risk assessment based on the evaluation of pollutant toxicity, as presented in this article, confirm the validity of the analytical tools adopted, including dispersion modelling as a tool to support the assessment of the impacts of uncontrolled waste fires, particularly in situations where it is not possible to obtain direct measurement data from the actual event.

Supplementary Materials

The following supporting information can be downloaded at the website of this paper posted on Preprints.org.

Author Contributions

Conceptualization, Ł.Sz., P.J.; methodology, Ł.Sz., P.J., M.B.; software, Ł.Sz., M.B..; validation, Ł.Sz., P.J. and M.B.; formal analysis, Ł.Sz., P.J. and M.B.; investigation, Ł.Sz., P.J. and M.B.; resources, Ł.Sz., P.J. and M.B.; data curation, Ł.Sz., P.J. and M.B.; writing—original draft preparation, Ł.Sz., P.J. and M.B.; writing—review and editing, Ł.Sz., P.J. and M.B.; visualization, Ł.Sz., P.J. and M.B.; supervision, Ł.Sz., P.J..; project administration, Ł.Sz., P.J.; funding acquisition, Ł.Sz. All authors have read and agreed to the published version of the manuscript.

Funding

This research received no external funding.

Institutional Review Board Statement

Not applicable.

Data Availability Statement

Data Availability Statements.

Acknowledgments

The authors have reviewed and edited the output and take full responsibility for the content of this publication.

Conflicts of Interest

The authors declare no conflict of interest.

Abbreviations

The following abbreviations are used in this manuscript:
NIK Najwyższa Izba Kontroli (The Supreme Audit Office)
EPA Environmental Protection Agency
NDS Najwyższe dopuszczalne stężenie (Maximum permissible concentration)
NDSCh Najwyższe Dopuszczalne Stężenie Chwilowe (Maximum Permissible Momentary Concentration)
NDSP Najwyższe dopuszczalne stężenie pułapowe (Maximum permissible concentration threshold)
OSHA Occupational Safety and Health Administration

References

  1. Najwyższa Izba Kontroli. Informacja o wynikach kontroli; Nr ewid. 154/2022/P/22/061/LKI; Zapobieganie pożarom miejsc gromadzenia odpadów. Raport NIK; Najwyższa Izba Kontroli: Warszawa, 2022.
  2. Li, B.; Mu, Y. Impact of China’s National Sword Policy on Waste Import Margins: A Difference-in-Differences Approach. Sustainability 2024, 16, 776. [Google Scholar] [CrossRef]
  3. DzU z 2015 r. poz. 1277; Rozporządzeniem Ministra Gospodarki z 16 lipca 2015 r. w sprawie dopuszczenia odpadów do składowania na składowiskach.
  4. National Service Center for Environmental Publications (NSCEP). EPA 530-R-21-002; An Analysis of Lithium-Ion Battery Fires in Waste Management and Recycling. U.S. Environmental Protection Agency (EPA): Washington, DC, USA, 2021.
  5. Winslow, K.M.; Laux, S.J.; Townsend, T.G. A Review on the Growing Concern and Potential Management Strategies of Waste Lithium-Ion Batteries. Resour. Conserv. Recycl. 2018. [Google Scholar] [CrossRef]
  6. Kersten, M.; Moor, H. C.; Johnson, C. A. Speciation of trace metals in leachate from a MSWI bottom ash landfill. In Applied Geochemistry; 1997. [Google Scholar] [CrossRef]
  7. Głodek, E. Porównanie wielkości emisji zanieczyszczeń dla różnych opcji spalania odpadów. Pr. Inst. Ceram. I Mater. Bud. 2011, 7(nr 4), 89–96. [Google Scholar]
  8. Ryan, J.V.; Lutes, C.C. EPA-600/R-93-044; Characterization of emissions from the simulated open-burning of non-metallic automobile shredder residue. United States Environmental Protection Agency, 1993. [CrossRef]
  9. DeMarini, D.M.; Lemieux, P.M.; Ryan, J.V.; Brooks, L.R.; Williams, R.W. Mutagenicity and Chemical Analysis of Emissions from the Open Burning of Scrap Rubber Tires. Environ. Sci. Technol. 1994. [Google Scholar] [CrossRef] [PubMed]
  10. Dz.U. 2010 nr 16 poz. 87; Rozporządzenia Ministra Środowiska z dnia 26 stycznia 2010 r. w sprawie wartości odniesienia dla niektórych substancji w powietrzu.
  11. Trozzi, C.; Nielsen, O.-K.; Hjelgaard, K.; Wenborn, M.; Woodfield, M. EMEP/EEA Air Pollutant Emission Inventory Guidebook 2023; EEA Report 06/2023; European Environment Agency: Copenhagen, Denmark, 2023. [Google Scholar] [CrossRef]
  12. Aurell, J.; Gullett, B.K.; Yamamoto, D. Emissions from Open Burning of Simulated Military Waste from Forward Operating Bases. Environ. Sci. Technol. Sci. Technol. 2012, 46(20), 11004–11012. [Google Scholar] [CrossRef] [PubMed]
  13. Seńczuk, W., Ed. Toksykologia współczesna; Wydawnictwo Naukowe PWN: Warszawa, Polska, 2020.
  14. Vicente, E.D.; Figueiredo, D.; Goncalves, C.; Vicente, A.; Lopes, I.; Oliveira, H.; Alves, C.A. PM10 exposure in beauty salons: impact on A549 cell viability, cell cycle, oxidative stress, and mutagenicity. In University of Aveiro. Environmental Toxicology and Pharmacology; 2025. [Google Scholar] [CrossRef] [PubMed]
  15. Lovell, David P. Dose–response Threshold-Mediat. Mech. Mutagen. Stat. Model. Study Des. 2000, Volume 464(Issue 1), Pages: 87–95. [CrossRef] [PubMed]
  16. Adeniran, J.A.; Aremu, A.S.; Abdulraheem, K.A. Modelling of air emissions from open burning of municipal waste in Ilorin Metropolis, North Central Nigeria. Environ. Qual. Manag. 2024. [Google Scholar] [CrossRef]
  17. U.S. Environmental Protection Agency (EPA). AP-42: Compilation of Air Pollutant Emission Factors, 5th ed.; Environmental Protection Agency: Research Triangle Park, NC, USA, 1995; Available online: https://www.epa.gov/air-emissions-factors-and-quantification/ap-42-fifth-edition-volume-i-chapter-2-solid-waste-0 (accessed on 14.07.2026 r).
  18. Juda-Rezler, K. Oddziaływanie zanieczyszczeń powietrza na środowisko, 2nd ed.; Oficyna Wydawnicza Politechniki Warszawskiej: Warszawa, Polska, 2006. [Google Scholar]
  19. Lönnermark, A.; Blomqvist, P.; Marklund, S. Emissions from simulated deep-seated fires in domestic waste. Chemosphere 2008. [Google Scholar] [CrossRef] [PubMed]
  20. Ruokojärvi, P.; Ruuskanen, J.; Ettala, M.; Rahkonen, P.; Tarhanen, J. Formation of polyaromatic hydrocarbons and polychlorinated organic compounds in municipal waste landfill fires. Chemosphere 1995, 31(no. 8), 3899–3908. [Google Scholar] [CrossRef]
  21. Dominguez, T.; Aurell, J.; Gullett, B.; Eninger, R.; Yamamoto, D. Characterizing emissions from open burning of military food waste and ration packaging compositions. J. Mater. Cycles Waste Manag 2018, 20, 902–913. [Google Scholar] [CrossRef] [PubMed]
  22. U.S. Environmental Protection Agency (EPA). AP-42: Compilation of Air Pollutant Emission Factors, Volume I: Stationary Point and Area Sources; Chapter 2.5: Open Burning, 5th ed.; U.S. Environmental Protection Agency: Research Triangle Park, NC, USA, 1992; Available online: https://www.epa.gov/sites/default/files/2020-10/documents/c02s05 (accessed on 14.07.2026 r).
  23. Bundesministerium für Umwelt; Naturschutz und nukleare Sicherheit (BMU). Erste Allgemeine Verwaltungsvorschrift zum Bundes-Immissionsschutzgesetz (Technische Anleitung zur Reinhaltung der Luft – TA Luft); Bundesministerium für Umwelt, Naturschutz und nukleare Sicherheit: Berlin, Germany, 2021; Available online: https://www.verwaltungsvorschriften-im-internet.de/bsvwvbund_18082021_IGI25025005.htm (accessed on 14.07.2026 r).
  24. Bundesrepublik Deutschland. Bundes-Immissionsschutzgesetz (BImSchG) – Gesetz zum Schutz vor schädlichen Umwelteinwirkungen durch Luftverunreinigungen, Geräusche, Erschütterungen und ähnliche Vorgänge; Bundesgesetzblatt I; Bundesrepublik Deutschland: Berlin, Germany, 1974; zuletzt geändert 2024. Available online: https://www.gesetze-im-internet.de/bimschg/BJNR007210974.html (accessed on 14.07.2026 r).
  25. U.S. Environmental Protection Agency (EPA). 40 CFR Part 51, Appendix W to Part 51—Guideline on Air Quality Models; U.S. Environmental Protection Agency: Washington, DC, USA, 2024; Available online: https://www.epa.gov/scram/2024-appendix-w-final-rule (accessed on 14.07.2026 r).
  26. Environment Agency. Air Emissions Risk Assessment for Your Environmental Permit; Environmental Permitting Regulations Guidance; Environment Agency: Bristol, UK, 2021; Available online: https://assets.publishing.service.gov.uk/media/65fd71a4f1d3a0001132adc2/CD1.M_Air_emissions_risk_assessment_for_your_environmental_permit.pdf (accessed on 14.07.2026 r).
  27. Pasquill, Frank. Atmospheric Dispersion Modeling. J. Air Pollut. Control Assoc. 1979. [Google Scholar] [CrossRef]
  28. Dz.U. 2012 poz. 1031; Rozporządzenie Ministra Środowiska z dnia 24 sierpnia 2012 r. w sprawie poziomów niektórych substancji w powietrzu.
  29. The National Institute for Occupational Safety and Health (NIOSH). 2013. Current Intelligence Bulletin 66: Derivation of Immediately Dangerous to Life or Health (IDLH) Values. Publication Number 2014-100.
  30. Dz.U. 2018 poz. 1286; Rozporządzenie Ministra Rodziny, Pracy i Polityki Społecznej z dnia 12 czerwca 2018 r. w sprawie najwyższych dopuszczalnych stężeń i natężeń czynników szkodliwych dla zdrowia w środowisku pracy.
Table 1. Calculations of emissions resulting from a fire.
Substances Emission factor, [mg/kg] Quantity of waste incinerated, [kg] Total emissions, [kg] Duration of the fire, [h] Hourly emission, [kg/h]
Benzene 0,01230 14000 0,00017220 3,5 0,0000492
Toluene 0,00330 0,00004620 0,0000132
Ethylbenzene 0,00120 0,00001680 0,0000048
Hexane 0,00430 0,00006020 0,0000172
Anthracene 0,00132 0,00001848 0,0000053
Benzo(a)pyrene 0,00753 0,00010542 0,0000301
Benzo(b)fluoranthene 0,00925 0,00012950 0,0000370
Benzo(e)pyrene 0,00965 0,00013510 0,0000386
Benzo(g,h,i)perylene 0,01493 0,00020902 0,0000597
Benzo(k)fluoranthene 0,00251 0,00003514 0,0000100
Benzo(a)anthracene 0,01441 0,00020174 0,0000576
Chrysene 0,01718 0,00024052 0,0000687
Fluoranthene 0,10705 0,00149870 0,0004282
Indeno(1,2,3-c,d)pyrene 0,01070 0,00014980 0,0000428
Phenanthrene 0,02405 0,00033670 0,0000962
Pyrene 0,05881 0,00082334 0,0002352
Retene 0,01877 0,00026278 0,0000751
Dust 8,00000 0,11200000 0,0320000
Table 2. A summary of permissible concentrations, reference values and standards for the substances included in the analysis.
Substance Reference value as set out in the Regulation Dz.U.2010.16.87 [µg/m3] NDS in accordance with the regulation Dz.U. 2018.1286, [µg/m3] Standard according to EPA [µg/m3] Standard ac-cording to OSHA [µg/m3]
Benzene 30 1600 30 320
Toluene 100 100000 5000 brak
Ethylbenzene 500 200000 1000 435000
Hexane brak 72000 700 180000
Anthracene brak brak brak 200
Benzo(a)pyrene 0,012 2 0,002 200
Benzo(b)fluoranthene brak Brak 20 200
Benzo(e)pyrene brak Brak 0,008 200
Benzo(g,h,i)perylene brak Brak brak 200
Benzo(k)fluoranthene brak Brak brak 200
Benzo(a)anthracene brak Brak 0,2 200
Chrysene brak Brak 20 200
Fluoranthene brak Brak brak 200
Indeno(1,2,3-c,d)pyrene brak Brak 0,2 200
Phenanthrene brak Brak brak 200
Pyrene brak Brak brak 200
Retene brak brak brak brak
Dust 280 1460 b/d brak
Disclaimer/Publisher’s Note: The statements, opinions and data contained in all publications are solely those of the individual author(s) and contributor(s) and not of MDPI and/or the editor(s). MDPI and/or the editor(s) disclaim responsibility for any injury to people or property resulting from any ideas, methods, instructions or products referred to in the content.
Copyright: This open access article is published under a Creative Commons CC BY 4.0 license, which permit the free download, distribution, and reuse, provided that the author and preprint are cited in any reuse.