

Submitted:
31 August 2026
Posted:
01 September 2026
You are already at the latest version
Abstract
Multiparameter optical sensing of micrometer-sized particles requires morphological and material-related optical responses to be resolved for the same individual particles. Here, we develop a polarization-resolved digital holographic (PRDH) sensing system that integrates digital in-line holography with division-of-focal-plane polarimetry. The system numerically refocuses particles distributed at different axial positions and, for each resolved particle, retrieves three-dimensional coordinates, equivalent diameter, major and minor axes, perimeter, area, and shape factor, together with the linear Stokes parameters S0, S1, and S2 and the degree of linear polarization (DoLP). Particle-size measurements using three standard glass-microsphere groups yielded an average absolute relative deviation of approximately 5.5% between the group-mean measured diameters and the corresponding nominal values. For the particle groups investigated, the group-mean DoLP decreased with increasing nominal refractive index, whereas the comparison between 5 and 10 μm borosilicate microspheres indicated a comparatively weak size dependence. A descriptive linear fit to the five group means gives R2 = 0.926 over the investigated refractive-index range; this trend is further examined using T-matrix simulations, which show a qualitatively consistent refractive-index dependence in the forward-scattering region. The PRDH approach therefore provides particle-resolved, co-registered morphological and polarimetric information for multiparameter optical sensing of three-dimensional microparticle fields.
Keywords:
optical sensing
; digital holography
; polarization imaging
; microparticle characterization
; degree of linear polarization
; refractive index
1. Introduction
Micrometer-sized particles are ubiquitous in atmospheric environments, biopharmaceutical formulations, and industrial processes. Their size, morphology, spatial distribution, and optical properties are often required simultaneously because these quantities describe complementary aspects of particle state and composition. In atmospheric research, particle concentration, size distribution, and morphology are important for pollution monitoring, exposure assessment, and cloud microphysical studies [1,2,3]. In biopharmaceutical applications, the number, size, morphology, and optical characteristics of protein aggregates, silicone-oil droplets, and glass fragments are relevant to product quality and stability [4]. These demands are driving particle sensing from single-parameter measurements toward multiparameter characterization at the individual-particle level [5,6].
Existing particle-measurement techniques provide different subsets of this information. Optical particle counters and single-particle light-scattering instruments rapidly estimate particle size and number concentration [7,8], while optical array probes, microscopic imaging, and micro-flow imaging provide two-dimensional size and shape information [3,9,10]. Electron microscopy, Raman spectroscopy, and Fourier-transform infrared spectroscopy can provide finer morphological or material-composition information, but generally require different measurement configurations and do not inherently provide three-dimensional particle localization [4,6]. Polarimetric measurements offer a complementary optical dimension because the polarization response of scattered light depends on refractive index, shape, internal structure, orientation, and scattering geometry [11,12]. Ensemble polarimetry and lidar have demonstrated the value of polarization for characterizing suspended particles and aerosols [13,14,15], whereas single-particle polarimetry can retain particle-to-particle heterogeneity. For example, microfluidic or flow-based systems have been used to guide particles through a defined polarization-scattering region for individual-particle analysis [16,17]. However, these approaches typically rely on constrained flow channels, fixed scattering volumes, or limited focal depths.
A key sensing challenge therefore arises for micrometer-sized particles distributed over a three-dimensional measurement volume. Conventional imaging has a finite depth of field: particles away from the focal plane are blurred, and their signals can overlap with neighboring particles, making particle-resolved morphological and polarimetric measurements difficult. Digital holography addresses the axial-localization problem by recording a hologram from which particles at different depths can be numerically refocused and localized in three dimensions [18,19,20]. Polarization-sensitive digital holography has also been used for quantitative polarization imaging, birefringence measurement, and material characterization [21,22,23,24,25,26,27]. In particular, previous studies have demonstrated simultaneous holographic and polarization recording for microfibers and microplastics [25,26,27]. These studies establish the complementarity of holography and polarimetry, while leaving room for a sensing framework that associates three-dimensional particle localization and morphology with particle-resolved linear-polarization parameters within the same particle field.
In this work, we develop a polarization-resolved digital holographic sensing system for simultaneous morphological and polarimetric characterization of individual microparticles within a three-dimensional particle field. The system combines digital in-line holographic reconstruction with division-of-focal-plane polarization imaging to retrieve, for each resolved particle, three-dimensional coordinates, equivalent diameter, major and minor axes, perimeter, area, and shape factor together with S0, S1, S2, and DoLP. The particle-sizing capability is evaluated using three groups of standard glass microspheres. We then examine how the measured DoLP varies across particle groups with different nominal refractive indices and sizes and use T-matrix calculations to test whether the experimentally observed trend is physically consistent with forward-scattering polarimetry. The main contributions are therefore twofold: (1) particle-resolved, co-registered retrieval of morphological and linear-polarization parameters within a three-dimensional particle field; and (2) experimental identification and numerical interpretation of a refractive-index-dependent DoLP response under the investigated measurement conditions.
2. Measurement Principles
2.1. Polarization Measurement and Refractive-Index Sensitivity
For an interface between two dielectric media, the Fresnel coefficients for s- and p-polarized light depend on the refractive indices and incidence geometry [28]:
where n1 and n2 are the refractive indices of the media, θi is the angle of incidence, and θt is the angle of refraction, satisfying Snell’s law:
The Fresnel relations illustrate, at the interface level, why refractive-index contrast can modify the relative amplitudes of orthogonal polarization components. For an incident field resolved into p- and s-polarized components, the reflected components can be written as:
Here, Ep and Es denote the p- and s-polarized electric-field components, and rp and rs are the corresponding Fresnel reflection coefficients. These relations are introduced only to illustrate the refractive-index sensitivity of polarization at an optical interface; the PRDH measurements in this study are not interpreted as a direct Fresnel-reflection inversion.
The polarization state of a partially polarized optical field can be represented by the four Stokes parameters:
Here, Ep and Es are the orthogonal electric-field components; Rm and Im denote the real and imaginary parts, respectively; Es* is the complex conjugate of Es; Ap and As are the corresponding amplitudes; and ϕp and ϕs are their phases.
For intensity-based polarization detection, the Stokes parameters can be expressed in terms of analyzer-resolved intensities [29]:
The degree of polarization (DoP) is defined as the polarized fraction of the total optical intensity:
When only the linear polarization components are considered, the degree of linear polarization (DoLP) is calculated as [30]:
DoLP ranges from 0 to 1 and quantifies the fraction of the measured intensity associated with linear polarization. In the present PRDH system, S0, S1, and S2 are obtained from the four analyzer orientations of the DoFP camera, and DoLP is then calculated from Equation (9). Because the recorded hologram contains the unscattered transmitted field together with the particle-scattered field, the measured DoLP is influenced jointly by particle refractive index, size, shape, and the collection geometry. Accordingly, the refractive-index dependence reported in this study is evaluated empirically and interpreted with T-matrix scattering calculations rather than treated as a direct refractive-index inversion.
The interface-level relations above therefore provide qualitative physical motivation, whereas the quantitative particle response is governed by electromagnetic scattering. Section 5 uses the T-matrix method to examine the dependence of the forward-scattering polarization response on particle size and refractive index.
2.2. Digital In-Line Holographic Reconstruction
Digital in-line holography (DIH) provides a compact route to volumetric particle sensing because a single recorded hologram can be numerically propagated to multiple axial planes. When a plane wave illuminates a particle, the particle-scattered field interferes with the unscattered transmitted field, and the resulting interference pattern is recorded as a hologram. The object field can then be numerically reconstructed using scalar diffraction propagation. For a measurement volume containing multiple particles, the reconstructed field at an axial distance Zr can be written as:
where λ is the wavelength; R(x,y) denotes the reference field; IH(x,y) is the recorded hologram intensity; k is the wave number; x and y are coordinates on the hologram plane; u and v are coordinates on the reconstruction plane; and Zr is the reconstruction distance. By propagating the hologram through a sequence of reconstruction distances, particles located at different axial positions can be brought into focus and localized in three dimensions [31].
After the particle focal plane is determined, contour-based image analysis is used to extract particle morphology. A minimum-area bounding rectangle is fitted to the segmented particle contour using a rotating-calipers procedure [32,33], providing the major and minor axes. The particle area Si , major-axis L and contour perimeter Li are obtained from the binary particle region, and the equivalent diameter is calculated from the segmented area. The shape factor F is calculated using Equation (11); for an ideal circular projection, F approaches 4, and larger values indicate greater deviation from a compact circular shape [34,35].
3. Materials and Methods
3.1. PRDH Sensing System
The PRDH sensing system integrates digital in-line holography with division-of-focal-plane polarimetry so that holographic and linear-polarization information are recorded under the same illumination condition. This architecture is designed to support particle-resolved retrieval of morphology and polarization within a three-dimensional measurement volume. The optical layout is shown in Figure 1a.
A 520 nm pulsed laser is expanded by L1 and collimated by L2 to provide approximately uniform illumination. The beam then passes through the linear polarizer L3 (extinction ratio > 1000:1). Beam splitter L4 divides the polarized beam into a monitoring arm and a measurement arm. The monitoring arm is recorded by DoFP1 to monitor the incident polarization state, while the measurement arm illuminates the particle field. The particle-scattered field and the unscattered transmitted reference field are collected by a 5× telecentric lens (WWK50-102-111V3; 102 mm working distance; distortion 0.16%; telecentricity 0.18°) and recorded by DoFP2. DoFP2 uses a Sony IMX264 global-shutter sensor with a 5-megapixel resolution and simultaneously records analyzer-resolved intensities at 0°, 45°, 90°, and 135° at up to 36 frames/s at full resolution. The simultaneous four-orientation acquisition provides the intensity information required for linear Stokes and DoLP retrieval while the holographic interference pattern provides the information required for numerical refocusing and three-dimensional localization [36].
3.2. Particle Samples and Evaluation Design
The PRDH system was evaluated using droplets, borosilicate glass microspheres of different nominal sizes, soda-lime glass microspheres, and irregular sand grains. The experiments were organized to examine three complementary aspects of performance. First, standard glass microspheres were used to evaluate particle-size measurement. Second, 5 and 10 μm borosilicate microspheres were compared to examine the effect of size at the same nominal refractive index. Third, particle groups spanning nominal refractive indices from approximately 1.33 to 1.52 were used to examine the dependence of the measured DoLP on refractive index under the present optical configuration. Because the particle groups differ in more than one physical property, the refractive-index analysis is interpreted as an empirical dependence rather than as a direct refractive-index calibration.
4. Results
4.1. Morphological Parameter Retrieval and Particle-Size Validation
Figure 1d illustrates numerical reconstruction of a polarization-resolved hologram containing droplets. The recorded hologram was propagated through 35 axial reconstruction planes separated by 5 mm over a total range of 170 mm. This axial stack captures the evolution of particle focus with reconstruction distance and provides the basis for determining the particle focal plane.
The transfer function employed by the convolution method is:
where λ = 520 nm is the laser wavelength, δ = 3.45 μm is the sensor pixel size, x/Xδ is the normalized spatial coordinate in the horizontal direction, and y/Yδ is the normalized spatial coordinate in the vertical direction.
Particle focus was determined using the local intensity-gradient variance. For each candidate particle region, the gradient variance was calculated across the 35 reconstructed planes, and the plane with the maximum value was selected as the in-focus plane. The corresponding reconstruction distance provides the axial coordinate, while the particle centroid in the selected plane provides the transverse coordinates. An example of an in-focus reconstruction is shown in Figure 1e.
Morphological parameters were then extracted from the in-focus particle image. Figure 2 shows representative processing results for (a) a 10 μm borosilicate microsphere, (b) a 50 μm soda-lime glass microsphere, and (c) a sand grain. The reconstructed in-focus images are shown in Figure 2((a-3),(b-3),(c-3)).
Each in-focus particle was segmented by intensity thresholding followed by morphological opening and closing to suppress isolated pixels and smooth the particle boundary. When enclosed cavities remained in the segmented region, hole filling was applied to obtain a continuous particle mask. The resulting masks are shown in Figure 2((a-4),(b-4),(c-4)).
For each segmented particle, the projected area and contour perimeter are calculated from the particle mask. A minimum-area bounding rectangle is fitted to the extracted contour to obtain the major and minor axes, and the equivalent diameter is calculated from the particle area. Together with the centroid coordinates and reconstruction distance, the procedure yields nine scalar morphological descriptors for each particle: x, y, and z coordinates; equivalent diameter; major axis; minor axis; perimeter; area; and shape factor F. The shape factor is calculated using Equation (11). Table 1 lists these quantities for the three representative particles in Figure 2.
To evaluate particle-size measurement, three groups of standard glass microspheres with nominal diameters of 5.1 ± 0.5 μm, 10.0 ± 1.0 μm, and 49.0 ± 1.4 μm were measured. For convenience, these groups are referred to as the 5, 10, and 50 μm particles. As shown in Figure 3, the measured values are distributed around the corresponding nominal sizes. The average absolute relative deviation between the group-mean measured diameters and the nominal diameters is approximately 5.5%. This result provides a quantitative check of the sizing performance under the present reconstruction and segmentation settings. Residual deviations can arise from the discrete axial reconstruction interval and from threshold-dependent localization of the particle boundary; therefore, the reported value should be interpreted as a system-level sizing result for the present measurement conditions rather than as a universal accuracy specification.
Figure 4 compares the shape factor F for particle groups with different morphologies. Droplets and irregular sand grains exhibit clearly different distributions because their projected shapes differ substantially, whereas the distributions of droplets and similarly sized borosilicate microspheres overlap strongly because both groups are approximately spherical in projection. These results illustrate that morphology provides useful but incomplete particle information and motivate the addition of a co-registered optical parameter that is sensitive to material-dependent scattering.
Accordingly, morphological descriptors and polarimetric descriptors are treated as complementary measurements in the PRDH framework. The following section examines the linear-polarization response of the same particle groups, with particular attention to its dependence on nominal refractive index and particle size.
4.2. Polarimetric Characterization
For each particle, the analyzer-resolved holograms are reconstructed at the particle-specific focal plane determined above. The corresponding intensity values are then used to calculate S0, S1, and S2 according to Equation (7), and DoLP is calculated using Equation (9). The particle mask obtained from the morphological channel is used to associate the polarization measurement with the same spatially resolved particle. Figure 5 shows representative DoLP maps, where warmer colors denote higher DoLP and cooler colors denote lower DoLP.
Figure 6a–e summarize the particle-averaged DoLP values for the five investigated groups. The droplets (nominal n = 1.33) have a mean DoLP of 0.938, while the 5 and 10 μm borosilicate microspheres (nominal n = 1.47) have mean DoLP values of 0.849 and 0.843, respectively. The small difference between the two borosilicate size groups indicates a comparatively weak size dependence within this specific 5–10 μm comparison. The sand grains (nominal n = 1.50) and soda-lime glass microspheres (nominal n = 1.52) exhibit lower mean DoLP values of 0.797 and 0.763, respectively. Taken together, the group means decrease systematically as the nominal refractive index increases across the investigated particle groups. Because particle material, morphology, and size are not fully controlled independently across all groups, this result is interpreted as an empirical refractive-index-dependent trend rather than evidence that DoLP is determined by refractive index alone.
To quantify the group-level trend shown in Figure 6f, the five mean DoLP values were regressed against the corresponding nominal refractive indices using a first-order least-squares model. The descriptive fit is:
where n is the nominal real refractive index assigned to each particle group. Over the limited range n=1.33–1.52, the fit captures an approximately linear negative association between group-mean DoLP and nominal refractive index. Because the five group means represent only four distinct refractive-index levels—the 5 and 10 μm borosilicate groups share the same nominal refractive index—and because DoLP can also depend on particle size, shape, orientation, absorption, and optical collection geometry, Equation (13) should be regarded as a descriptive fit to the present dataset rather than as a universal DoLP-to-refractive-index calibration. These additional factors are examined further in the T-matrix analysis and discussion below.
5. T-Matrix Simulation and Discussion
To examine the physical plausibility of the experimentally observed DoLP dependence, we used the T-matrix method to calculate polarization-dependent particle scattering [37]. The method expands the incident and scattered electromagnetic fields in vector spherical wave functions and relates their expansion coefficients through a transition matrix. Although the T-matrix framework is applicable to rotationally symmetric non-spherical scatterers, spherical particles are used here to isolate the influence of particle size and refractive index in a simplified model.
The incident and scattered fields are expressed as:
Here, r0 is the radius of a sphere enclosing the particle. The coefficients pmn and qmn of the scattered field are linearly related to the incident-field coefficients amn and bmn through the T-matrix.
Equations (16) and (17) can be written compactly as Equation (18):
The T-matrix is then written as:
Here, Q and RgQ are 2 × 2 block matrices constructed using the corresponding regular and outgoing vector spherical wave functions.
The polarization transformation of the scattered field can be represented by a 4 × 4 Mueller scattering matrix. If S denotes the incident Stokes vector and S’ the scattered Stokes vector, their relationship is:
For a rotationally symmetric particle under the symmetry assumptions used here, the scattering matrix can be written in the following form:
The PRDH experiment primarily detects the transmitted reference field together with low-angle forward-scattered light. The T-matrix calculation was therefore used to examine the forward-scattering polarization response. The simulations used spherical, non-absorbing particles with a wavelength of 0.50 μm, refractive-index real parts of 1.33, 1.44, 1.50, and 1.52, and zero imaginary part. Particle-size distributions were represented using the Hansen-Travis model with equivalent-sphere radii of 1, 1.5, 2, 2.5, and 3 μm, an effective variance of 0.10, and seven Gaussian integration points. Because the simulation wavelength and refractive-index grid are not identical to every experimental condition, the comparison is used to examine qualitative trends rather than direct quantitative agreement.
Figure 7a shows the simulated DoLP as a function of scattering angle for particles of different sizes at a fixed refractive index. In the forward-scattering region, the curves for 2-6 μm particles remain relatively close, indicating a weaker size dependence than the refractive-index dependence observed in Figure 7b. At a fixed particle size, increasing the refractive index from 1.33 to 1.52 produces a systematic decrease in DoLP over the low-angle forward-scattering region. This trend is qualitatively consistent with the experimental group-level behavior and supports the physical plausibility of refractive-index-sensitive DoLP measurements. The simulation does not model the complete transfer function of the experimental system, including the exact angular weighting of the telecentric collection optics and the holographic interference process, and is therefore not used as a quantitative calibration of the measured DoLP.
The observed refractive-index sensitivity is consistent with previous Stokes and multi-angle polarization-scattering studies in which refractive index and composition influence the measured polarization response [11,12]. The distinctive feature of the present sensing approach is that this polarimetric information is associated with the same individual particles for which three-dimensional position and morphology are obtained by holographic reconstruction. Several limitations should nevertheless be stated. First, only four distinct nominal refractive-index levels are represented, and the particle groups are not fully matched in material, size, and morphology; consequently, Equation (13) is a descriptive relationship for the present dataset rather than a universal calibration curve. Second, the current transmission/forward-scattering geometry is best suited to transparent or weakly absorbing particles. For opaque or strongly absorbing particles, attenuation of the transmitted field can reduce hologram contrast and increase uncertainty in Stokes retrieval. Third, a quantitative refractive-index inversion would require a calibrated model that includes particle size, shape, absorption, and the angular response of the collection optics. These issues define the scope of the present study and motivate future validation using size-matched particles with a denser refractive-index series and alternative collection geometries.
6. Conclusions
This study presents a polarization-resolved digital holographic sensing approach for particle-resolved multiparameter characterization in three-dimensional particle fields. By combining numerical holographic refocusing with division-of-focal-plane polarimetry, the system associates nine scalar morphological descriptors (x, y, and z coordinates; equivalent diameter; major and minor axes; perimeter; area; and shape factor) with four linear-polarization descriptors (S0, S1, S2, and DoLP) for each resolved particle. Measurements of three standard glass-microsphere groups yielded an average absolute relative deviation of approximately 5.5% between group-mean measured and nominal diameters. Across the investigated particle groups, the group-mean DoLP decreased with increasing nominal refractive index, while the 5 and 10 μm borosilicate groups showed only a small difference in mean DoLP. A descriptive regression of the five group means gave an approximately linear negative trend over n = 1.33-1.52, and T-matrix calculations showed a qualitatively consistent refractive-index dependence in forward scattering. These results support PRDH as an optical sensing framework that co-registers particle morphology and polarization information. The present DoLP-refractive-index relationship should be interpreted as an empirical trend under the tested conditions, not as a universal refractive-index calibration, and further validation with independently controlled particle properties is required for quantitative inversion.
Author Contributions
Conceptualization, X.X.; methodology, Y.C. and X.X.; software, Y.C.; validation, R.X. and P.Y.; formal analysis, Y.C.; investigation, Y.C., R.X., Y.X., X.S., and J.L.; resources, P.Y. and J.W.; data curation, Y.C., R.X., and X.S.; writing - original draft preparation, Y.C.; writing - review and editing, X.X. and J.W.; visualization, Y.X. and J.L.; supervision, X.X. and J.W.; project administration, X.X.; funding acquisition, X.X. All authors have read and agreed to the published version of the manuscript.
Funding
This research was funded by the National Natural Science Foundation of China, grant number 42575150.
Institutional Review Board Statement
Not applicable.
Informed Consent Statement
Not applicable.
Data Availability Statement
The data presented in this study are available from the corresponding author upon reasonable request.
Acknowledgments
The authors gratefully acknowledge the Department of Nephrology, Xi’an XD Group Hospital, Xi’an, China, for providing the standard particle samples used in this study. We also thank all members of the research team for their valuable contributions to data analysis, experimental measurements, and manuscript preparation.
Conflicts of Interest
The authors declare no conflicts of interest.
Abbreviations
The following abbreviations are used in this manuscript:
| PRDH | Polarization-Resolved Digital Holography |
| DIH | Digital In-Line Holography |
| DoFP | Division of Focal Plane |
| DoP | Degree of Polarization |
| DoLP | Degree of Linear Polarization |
References
- Yan, X.; Han, J.; Ding, X.; Jin, J.; Zhang, L. Effect of ambient particulate matter pollution on disease burden globally: a systematic analysis of the global burden of disease study 2021. BMC Public Health 2025, 25, 4376. [Google Scholar] [CrossRef] [PubMed]
- Maciel, F.V.; Diao, M.; Yang, C.A. Partition between supercooled liquid droplets and ice crystals in mixed-phase clouds based on airborne in situ observations. Atmos. Meas. Tech. 2024, 17, 4843–4861. [Google Scholar] [CrossRef]
- Baumgardner, D.; Brenguier, J.L.; Bucholtz, A.; Coe, H.; DeMott, P.; Garrett, T.J.; Gayet, J.F.; Hermann, M.; Heymsfield, A.; Korolev, A.; et al. Airborne instruments to measure atmospheric aerosol particles, clouds and radiation: A cook’s tour of mature and emerging technology. Atmos. Res. 2011, 102, 10–29. [Google Scholar] [CrossRef]
- Gross-Rother, J.; Blech, M.; Preis, E.; Bakowsky, U.; Garidel, P. Particle detection and characterization for biopharmaceutical applications: current principles of established and alternative techniques. Pharmaceutics 2020, 12, 1112. [Google Scholar] [CrossRef] [PubMed]
- Mao, M.; Bienstein, M.; Contreras, F.; Wang, D.; Feng, L.; Schwaneberg, U. MagNanoTrap enrichment empowers ultra-sensitive quantification of mixed nanoplastic particles from environmental water samples. Angew. Chem. Int. Ed. 2026, 65, e22823. [Google Scholar] [CrossRef] [PubMed]
- Zhu, Y.; Li, Y.; Huang, J.; Lam, E.Y. Smart polarization and spectroscopic holography for real-time microplastics identification. Commun. Eng. 2024, 3, 32. [Google Scholar] [CrossRef]
- Chen, A.; Wang, S.; Jiang, X.; Yan, S.; Bian, A.; Xu, W.; Zeng, J.; Deng, T. Optical aerosol sizing method without prior refractive index. Measurement 2022, 204, 112072. [Google Scholar] [CrossRef]
- Han, Y.; Ding, L.; Wang, Y.; Zheng, H.; Fang, L. Shape discrimination of individual aerosol particles using light scattering. Sensors 2023, 23, 5464. [Google Scholar] [CrossRef] [PubMed]
- Maharjan, R.; Lee, J.C.; Bøtker, J.P.; Kim, K.H.; Kim, N.A.; Jeong, S.H.; Rantanen, J. Assessment of subvisible particles in biopharmaceuticals with image feature extraction and machine learning. Chemom. Intell. Lab. Syst. 2024, 245, 105061. [Google Scholar] [CrossRef]
- Fawaz, I.; Schaz, S.; Boehrer, A.; Garidel, P.; Blech, M. Micro-flow imaging multi-instrument evaluation for sub-visible particle detection. Eur. J. Pharm. Biopharm. 2023, 185, 55–70. [Google Scholar] [CrossRef] [PubMed]
- Liao, R.; Zeng, N.; Zeng, M.; He, Y.; Ma, H. Estimation and extraction of the aerosol complex refractive index based on Stokes vector measurements. Opt. Lett. 2019, 44, 4877–4880. [Google Scholar] [CrossRef] [PubMed]
- Guo, W.; Zeng, N.; Liao, R.; Xu, Q.; Guo, J.; He, Y.; Di, H.; Hua, D.; Ma, H. Simultaneous retrieval of aerosol size and composition by multi-angle polarization scattering measurements. Opt. Lasers Eng. 2022, 149, 106799. [Google Scholar] [CrossRef]
- Li, J.; Wang, H.; Liao, R.; Wang, Y.; Liu, Z.; Zhuo, Z.; Guo, Z.; Ma, H. Statistical Mueller matrix driven discrimination of suspended particles. Opt. Lett. 2021, 46, 3645–3648. [Google Scholar] [CrossRef] [PubMed]
- Qi, S.; Huang, Z.; Ma, X.; Huang, J.; Zhou, T.; Zhang, S.; Dong, Q.; Bi, J.; Shi, J. Classification of atmospheric aerosols and clouds by use of dual-polarization lidar measurements. Opt. Express 2021, 29, 23461–23476. [Google Scholar] [CrossRef]
- Xiao, D.; Wang, N.; Chen, S.; Wu, L.; Müller, D.; Veselovskii, I.; Li, C.; Landulfo, E.; Sivakumar, V.; Li, J.; et al. Simultaneous profiling of dust aerosol mass concentration and optical properties with polarized high-spectral-resolution lidar. Sci. Total Environ. 2023, 872, 162091. [Google Scholar] [CrossRef] [PubMed]
- Chen, Y.; Zeng, N.; Chen, S.; Zhan, D.; He, Y.; Ma, H. Study on morphological analysis of suspended particles using single angle polarization scattering measurements. J. Quant. Spectrosc. Radiat. Transf. 2019, 224, 556–565. [Google Scholar] [CrossRef]
- Han, B.; Hu, Z.; Huang, T.; Cui, W.; Liu, H.; Yang, J.; Liao, R.; Ma, H. Flow stokes microscopy for high throughput classification of marine particles. Opt. Laser Technol. 2024, 176, 111000. [Google Scholar] [CrossRef]
- Memmolo, P.; Miccio, L.; Paturzo, M.; Di Caprio, G.; Coppola, G.; Netti, P.A.; Ferraro, P. Recent advances in holographic 3D particle tracking. Adv. Opt. Photon. 2015, 7, 713–755. [Google Scholar] [CrossRef]
- Shyam Kumar, M.; Hong, J. A review of 3D particle tracking and flow diagnostics using digital holography. Meas. Sci. Technol. 2025, 36, 032005. [Google Scholar] [CrossRef]
- Zhang, H.; Wang, B.; Zhang, L.; Zhao, Y.; Wang, Y.; Feng, J.; Xiao, W.; Wang, G.; Wu, Y.; Wu, X. Adaptive in-focus particle detection and segmentation in holographic 3D image with mechanism-guided machine learning. Opt. Lasers Eng. 2024, 181, 108400. [Google Scholar] [CrossRef]
- Colomb, T.; Dahlgren, P.; Beghuin, D.; Cuche, E.; Marquet, P.; Depeursinge, C. Polarization imaging by use of digital holography. Appl. Opt. 2002, 41, 27–37. [Google Scholar] [CrossRef] [PubMed]
- Colomb, T.; Dürr, F.; Cuche, E.; Marquet, P.; Limberger, H.G.; Salathé, R.-P.; Depeursinge, C. Polarization microscopy by use of digital holography: application to optical-fiber birefringence measurements. Appl. Opt. 2005, 44, 4461–4469. [Google Scholar] [CrossRef] [PubMed]
- Chen, P.; Tang, Z.-L.; Wang, J.; Fu, X.-D.; Chen, F.-H. Analysis of digital in-line polarization holography by Stokes parameters. Acta Phys. Sin. 2012, 61, 104202. [Google Scholar] [CrossRef]
- Liu, T.; de Haan, K.; Bai, B.; Rivenson, Y.; Luo, Y.; Wang, H.; Karalli, D.; Fu, H.; Zhang, Y.; FitzGerald, J.; et al. Deep Learning-Based Holographic Polarization Microscopy. ACS Photonics 2020, 7, 3023–3034. [Google Scholar] [CrossRef] [PubMed]
- Běhal, J.; Valentino, M.; Miccio, L.; Bianco, V.; Itri, S.; Mossotti, R.; Dalla Fontana, G.; Stella, E.; Ferraro, P. Toward an all-optical fingerprint of synthetic and natural microplastic fibers by polarization-sensitive holographic microscopy. ACS Photonics 2022, 9, 694–705. [Google Scholar] [CrossRef]
- Huang, J.; Zhu, Y.; Li, Y.; Lam, E.Y. Snapshot polarization-sensitive holography for detecting microplastics in turbid water. ACS Photonics 2023, 10, 4483–4493. [Google Scholar] [CrossRef]
- Li, Y.; Zhu, Y.; Huang, J.; Ho, Y.-W.; Fang, J.K.-H.; Lam, E.Y. High-throughput microplastic assessment using polarization holographic imaging. Sci. Rep. 2024, 14, 2355. [Google Scholar] [CrossRef] [PubMed]
- Azzam, R.M.A. Relationship between the p and s Fresnel reflection coefficients of an interface independent of angle of incidence. J. Opt. Soc. Am. A 1986, 3, 928–929. [Google Scholar] [CrossRef]
- Duan, J.; Dong, K.; Wang, J.; Ni, X.; Fang, R.; Zhao, H. Underwater polarization image restoration based on transmittance-limiting correction. Opt. Precis. Eng. 2025, 33, 1722–1738. [Google Scholar] [CrossRef]
- Xu, X.; Ji, Y.; Chen, Z.; Liu, Z.; Sun, B.; Hua, D. Rapid nondestructive detection of the moisture content of holly leaves using focal plane polarization imaging. Trans. Chin. Soc. Agric. Eng. 2024, 40, 219–226. [Google Scholar] [CrossRef]
- Singh, D.K.; Panigrahi, P.K. Improved digital holographic reconstruction algorithm for depth error reduction and elimination of out-of-focus particles. Opt. Express 2010, 18, 2426–2448. [Google Scholar] [CrossRef]
- Dong, P.; Zhou, F.; Zhao, C.; Wang, Y.; Mi, Z.; Fu, X. Automatic measurement of underwater sea cucumber size based on binocular vision. Comput. Eng. Appl. 2021, 57, 271–278. [Google Scholar] [CrossRef]
- Wang, S.; Tian, J.; Cai, W.; Li, J.; Wang, S.; Li, P. Recognition of stacked texture-less workpieces based on hole features. Comput. Eng. Appl. 2022, 58, 282–288. [Google Scholar] [CrossRef]
- Huang, M.; Lei, H. An improved Holroyd cloud particle habit identification method and its application. Acta Meteorol. Sin. 2020, 78, 289–300. [Google Scholar] [CrossRef]
- Zhang, R.; Li, H.; Zhou, X.; Li, H.; Hu, X.; Xia, Q. Shape recognition of DMT airborne cloud particle images and its application. J. Appl. Meteorol. Sci. 2021, 32, 735–747. [Google Scholar] [CrossRef]
- Wang, W.; Zhang, H.; Ke, L.; Kang, Q.; Li, J.; Bi, H. Polarization Error Analysis and Polarization Calibration Method for Division of Focal-plane Polarimeter Camera. Acta Photonica Sin. 2024, 53, 0911002. [Google Scholar] [CrossRef]
- Mishchenko, M.I.; Travis, L.D. Capabilities and limitations of a current FORTRAN implementation of the T-matrix method for randomly oriented, rotationally symmetric scatterers. J. Quant. Spectrosc. Radiat. Transf. 1998, 60, 309–324. [Google Scholar] [CrossRef]
Figure 1.
(a) Polarization-resolved digital holographic sensing system: Laser, 520 nm pulsed laser; L1, beam-expander lens; L2, collimating lens; L3, linear polarizer; L4, beam splitter; DoFP1, incident-polarization monitoring camera; DoFP2, measurement polarization camera; 5× telecentric lens. (b) Polarization-resolved hologram of droplets; (c) background-subtracted polarization-resolved hologram; (d) numerical particle-refocusing sequence; (e) reconstructed in-focus particle image.
Figure 1.
(a) Polarization-resolved digital holographic sensing system: Laser, 520 nm pulsed laser; L1, beam-expander lens; L2, collimating lens; L3, linear polarizer; L4, beam splitter; DoFP1, incident-polarization monitoring camera; DoFP2, measurement polarization camera; 5× telecentric lens. (b) Polarization-resolved hologram of droplets; (c) background-subtracted polarization-resolved hologram; (d) numerical particle-refocusing sequence; (e) reconstructed in-focus particle image.
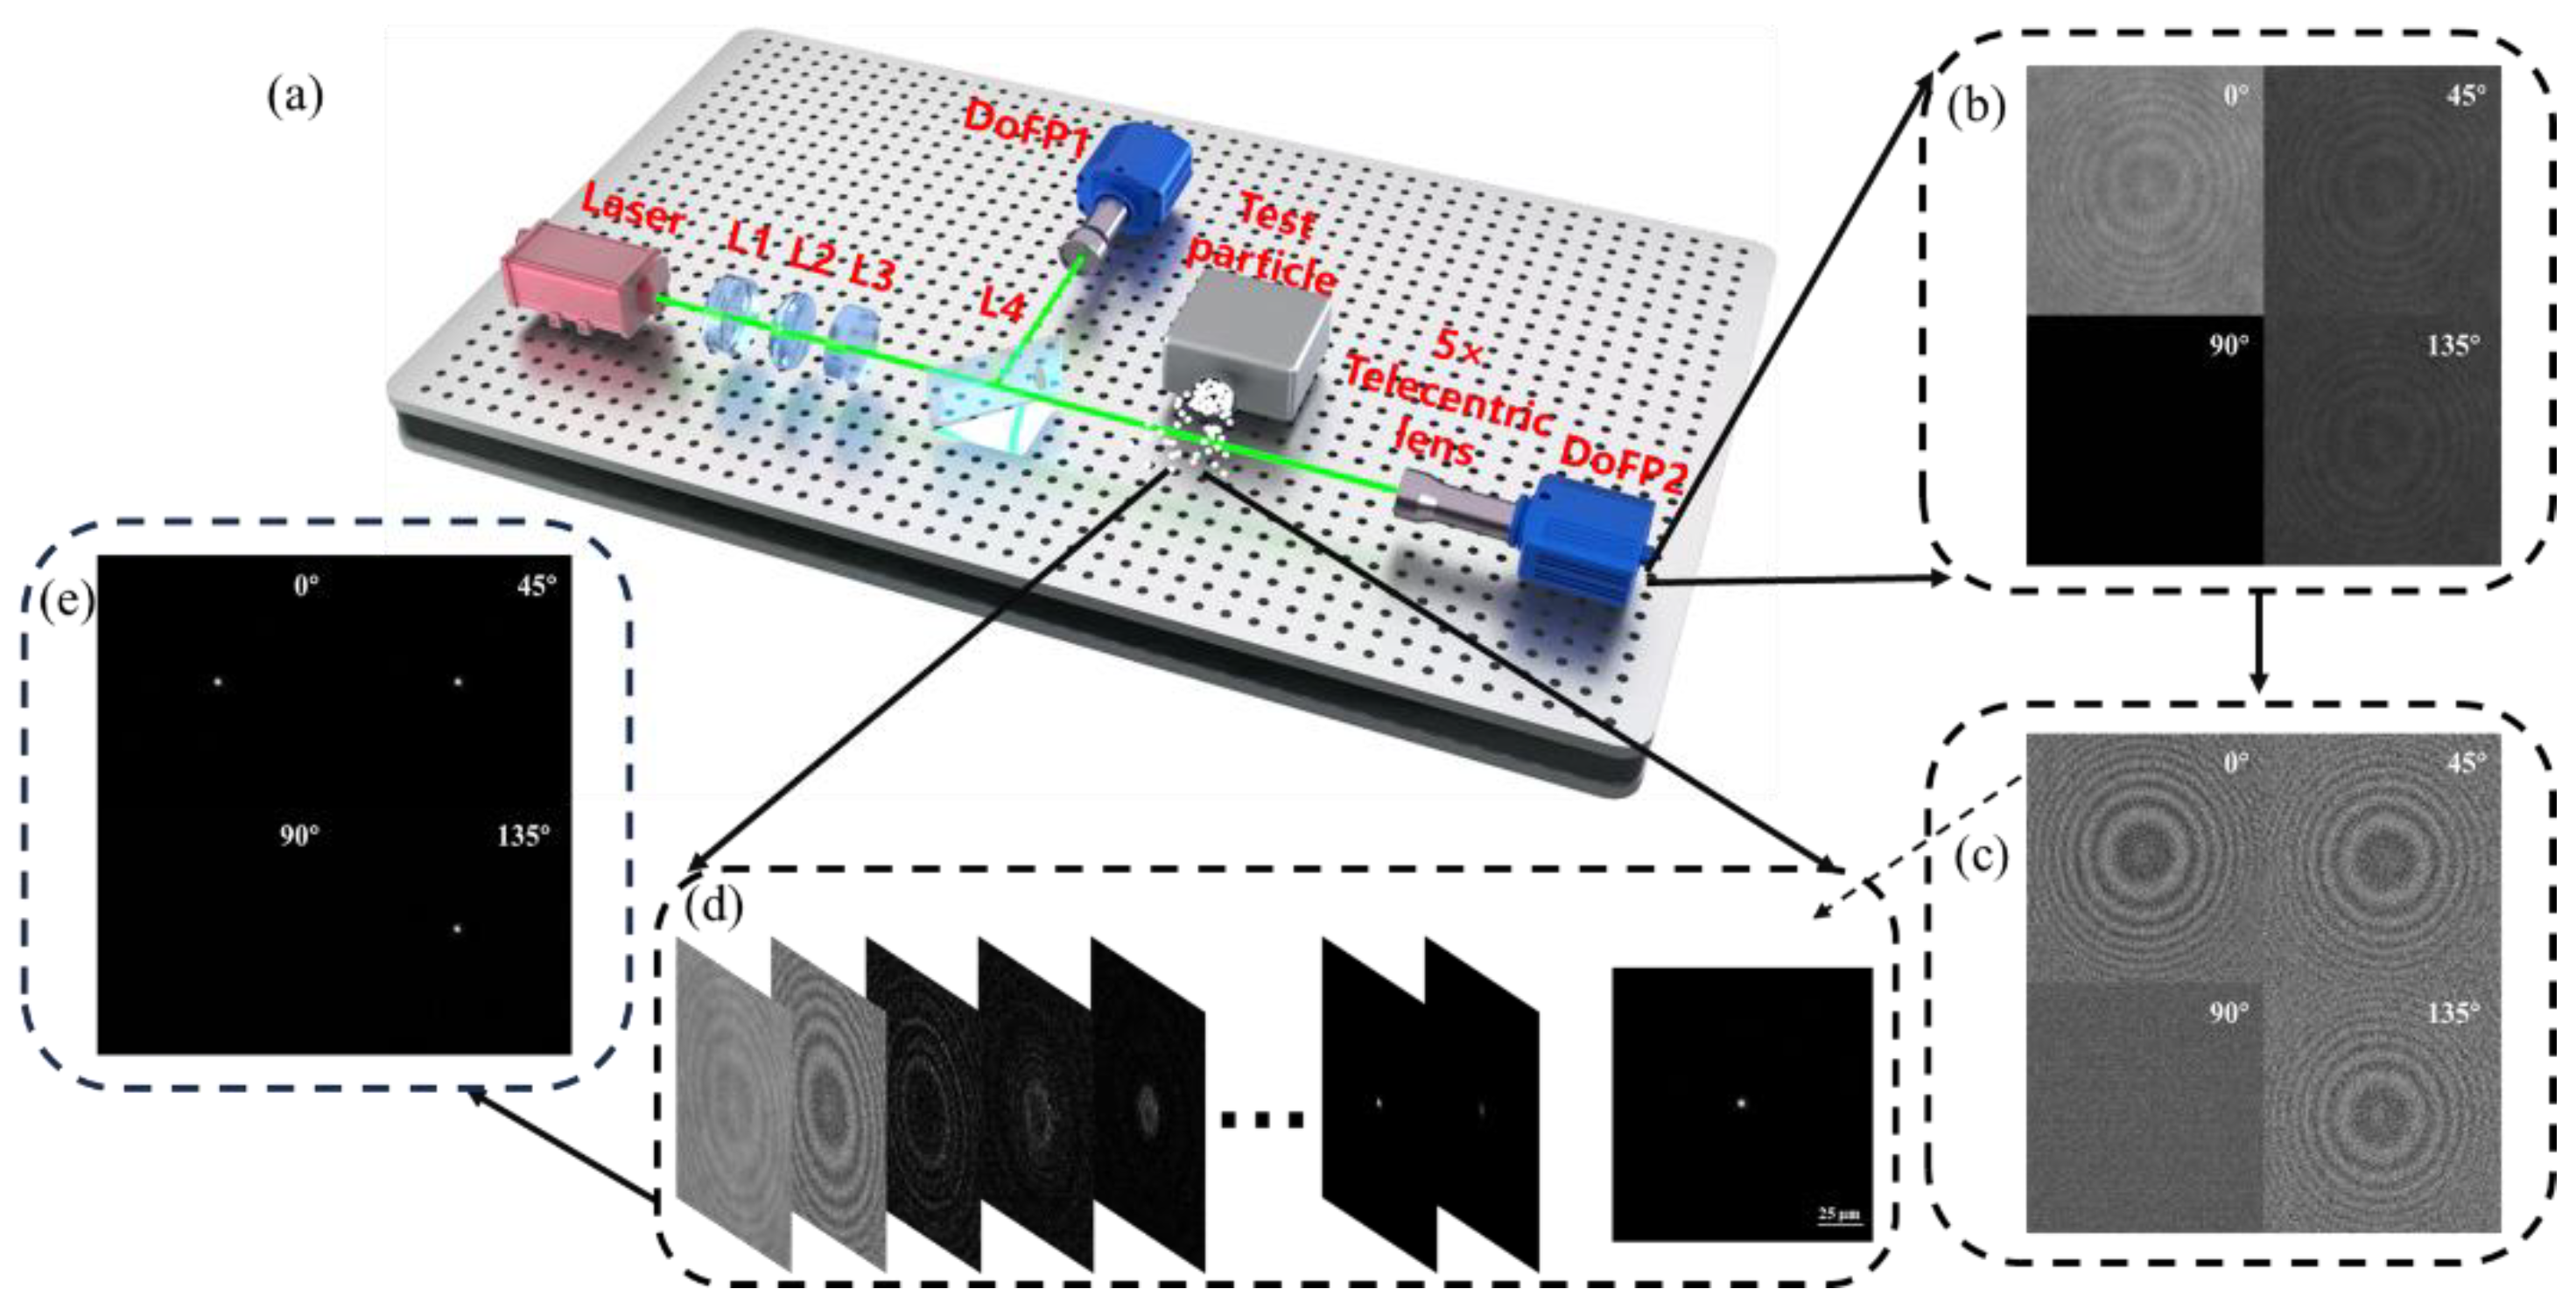
Figure 2.
Morphological-processing results for three representative particles. (a-1), (b-1), and (c-1): raw particle holograms; (a-2), (b-2), and (c-2): background-subtracted particle images; (a-3), (b-3), and (c-3): reconstructed in-focus particle images; (a-4), (b-4), and (c-4): segmented particle masks; (a-5), (b-5), and (c-5): minimum-area bounding rectangles.
Figure 2.
Morphological-processing results for three representative particles. (a-1), (b-1), and (c-1): raw particle holograms; (a-2), (b-2), and (c-2): background-subtracted particle images; (a-3), (b-3), and (c-3): reconstructed in-focus particle images; (a-4), (b-4), and (c-4): segmented particle masks; (a-5), (b-5), and (c-5): minimum-area bounding rectangles.
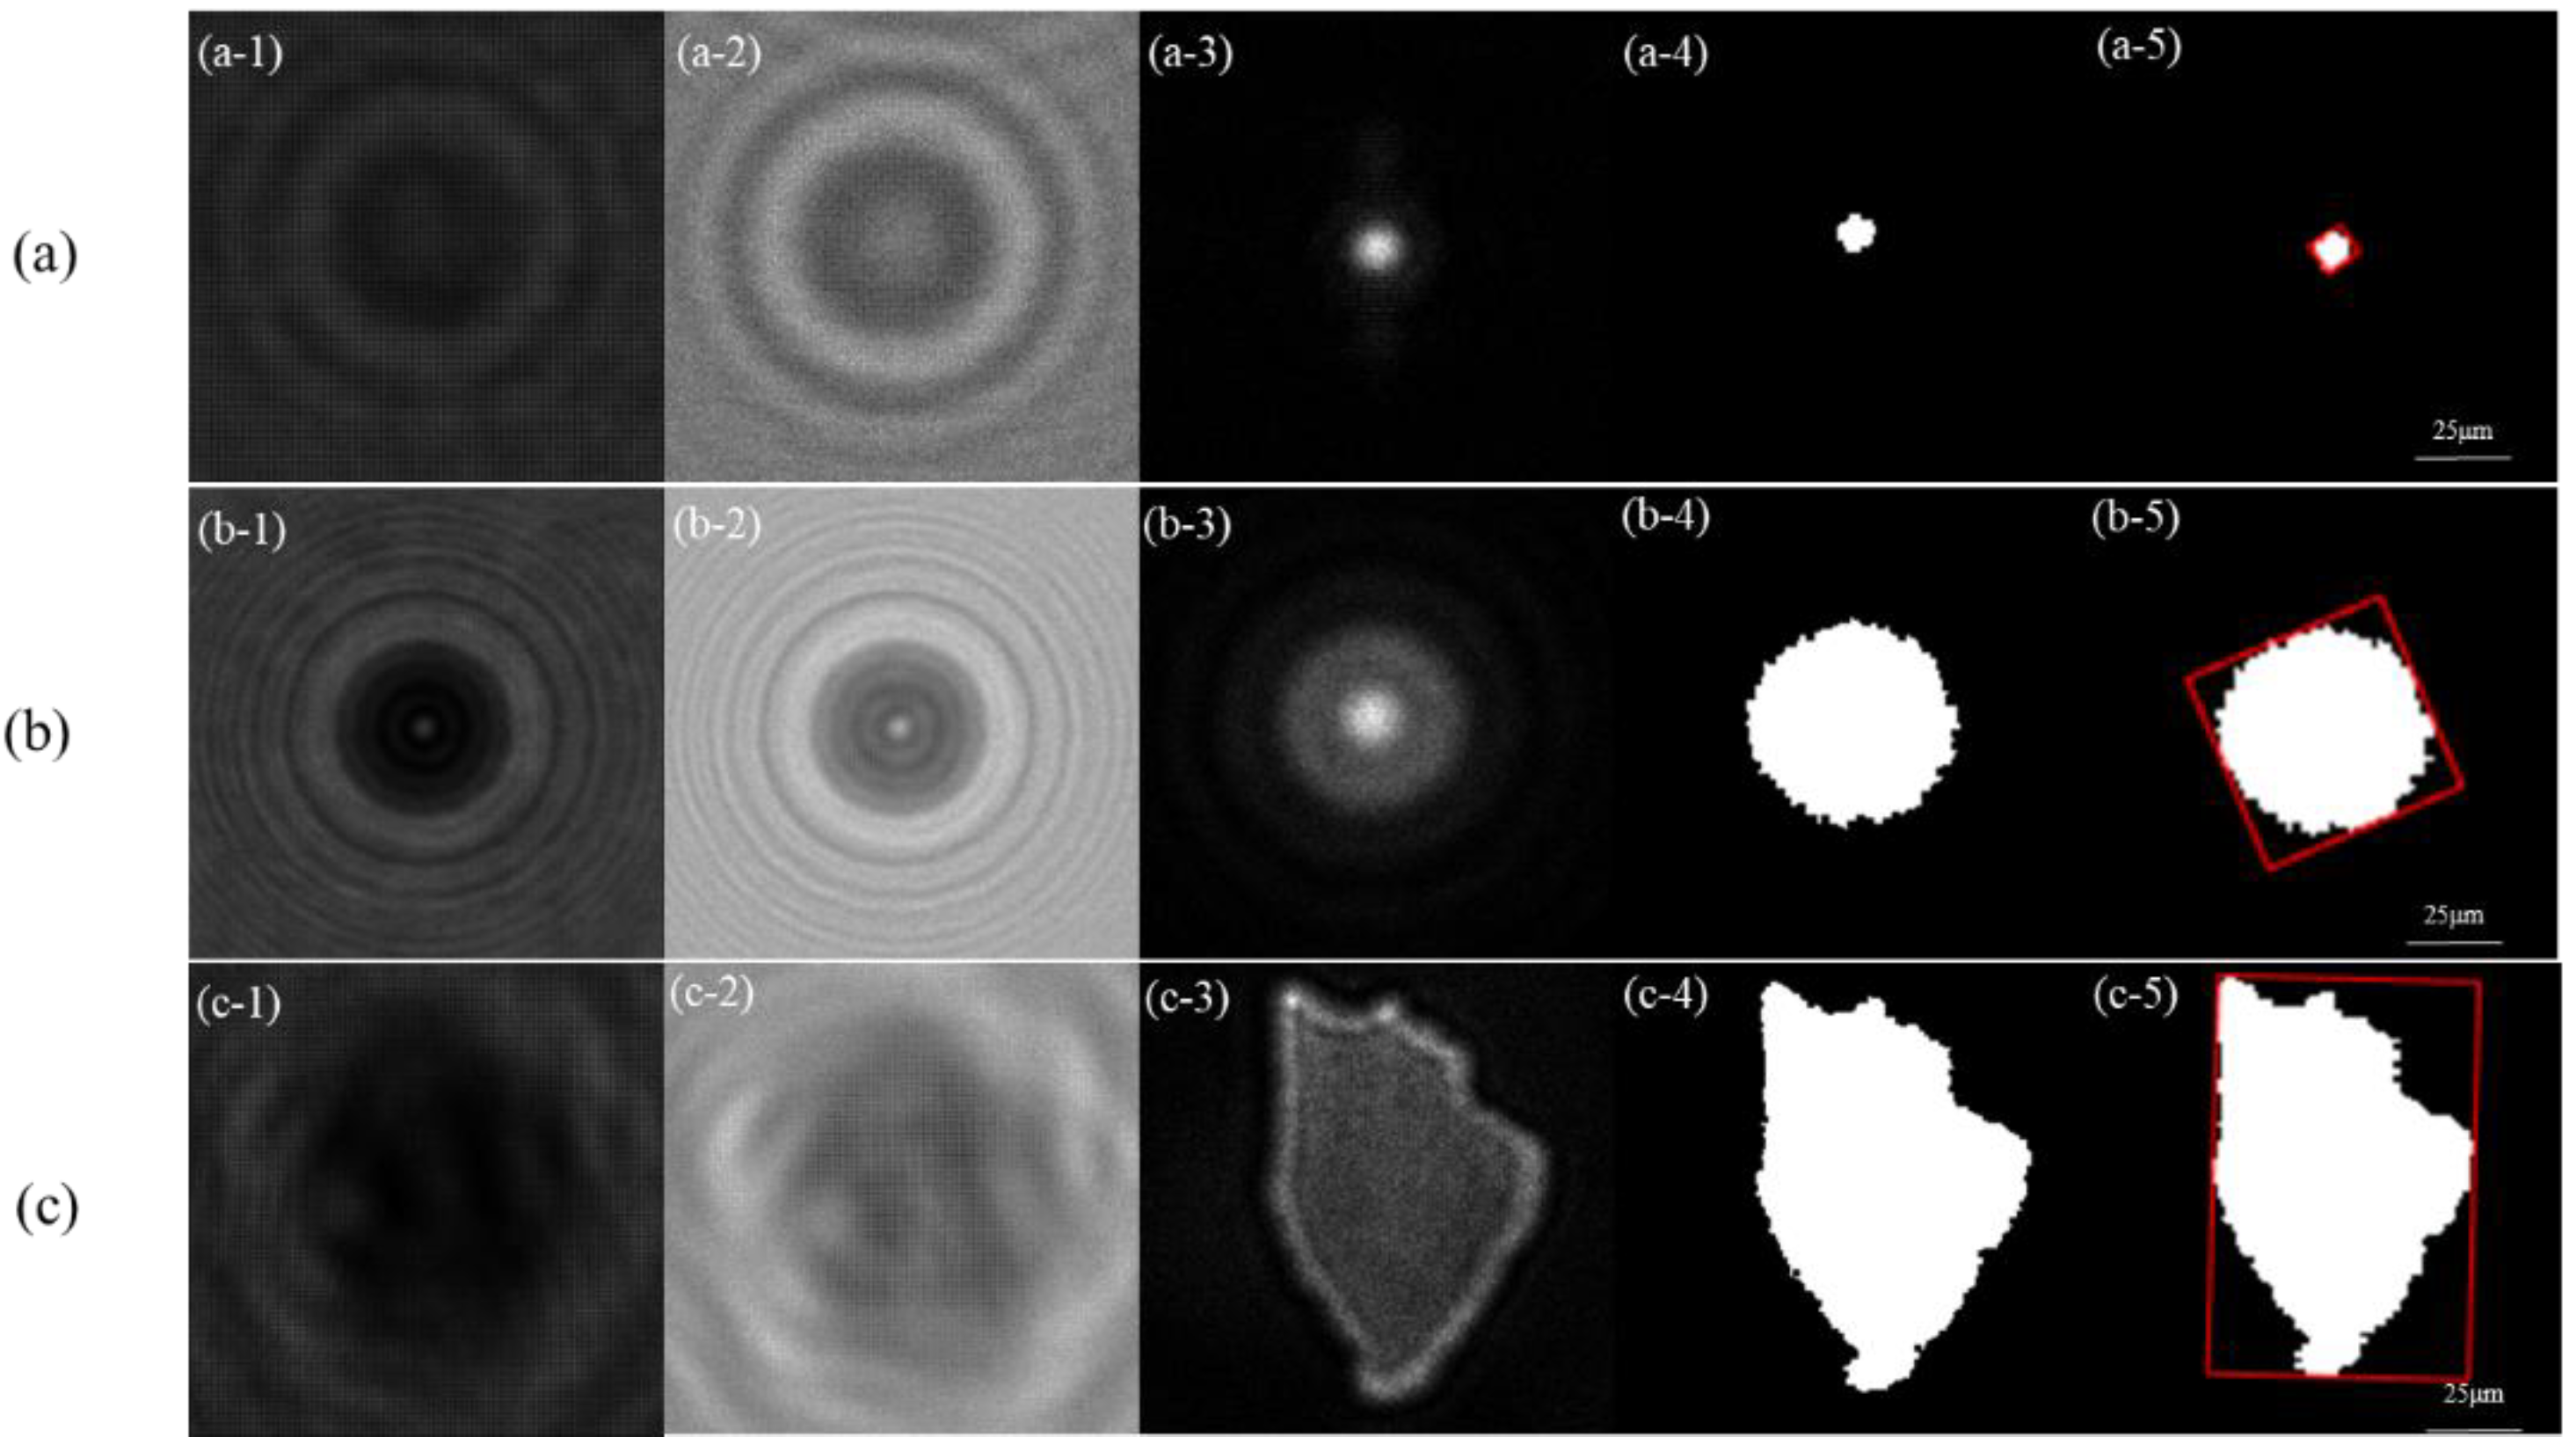
Figure 3.
Particle-size measurement of the three standard microsphere groups. (a) Measured equivalent diameters for nominal 5, 10, and 50 μm particles; (b) distribution of measured diameters for the three nominal size groups.
Figure 3.
Particle-size measurement of the three standard microsphere groups. (a) Measured equivalent diameters for nominal 5, 10, and 50 μm particles; (b) distribution of measured diameters for the three nominal size groups.
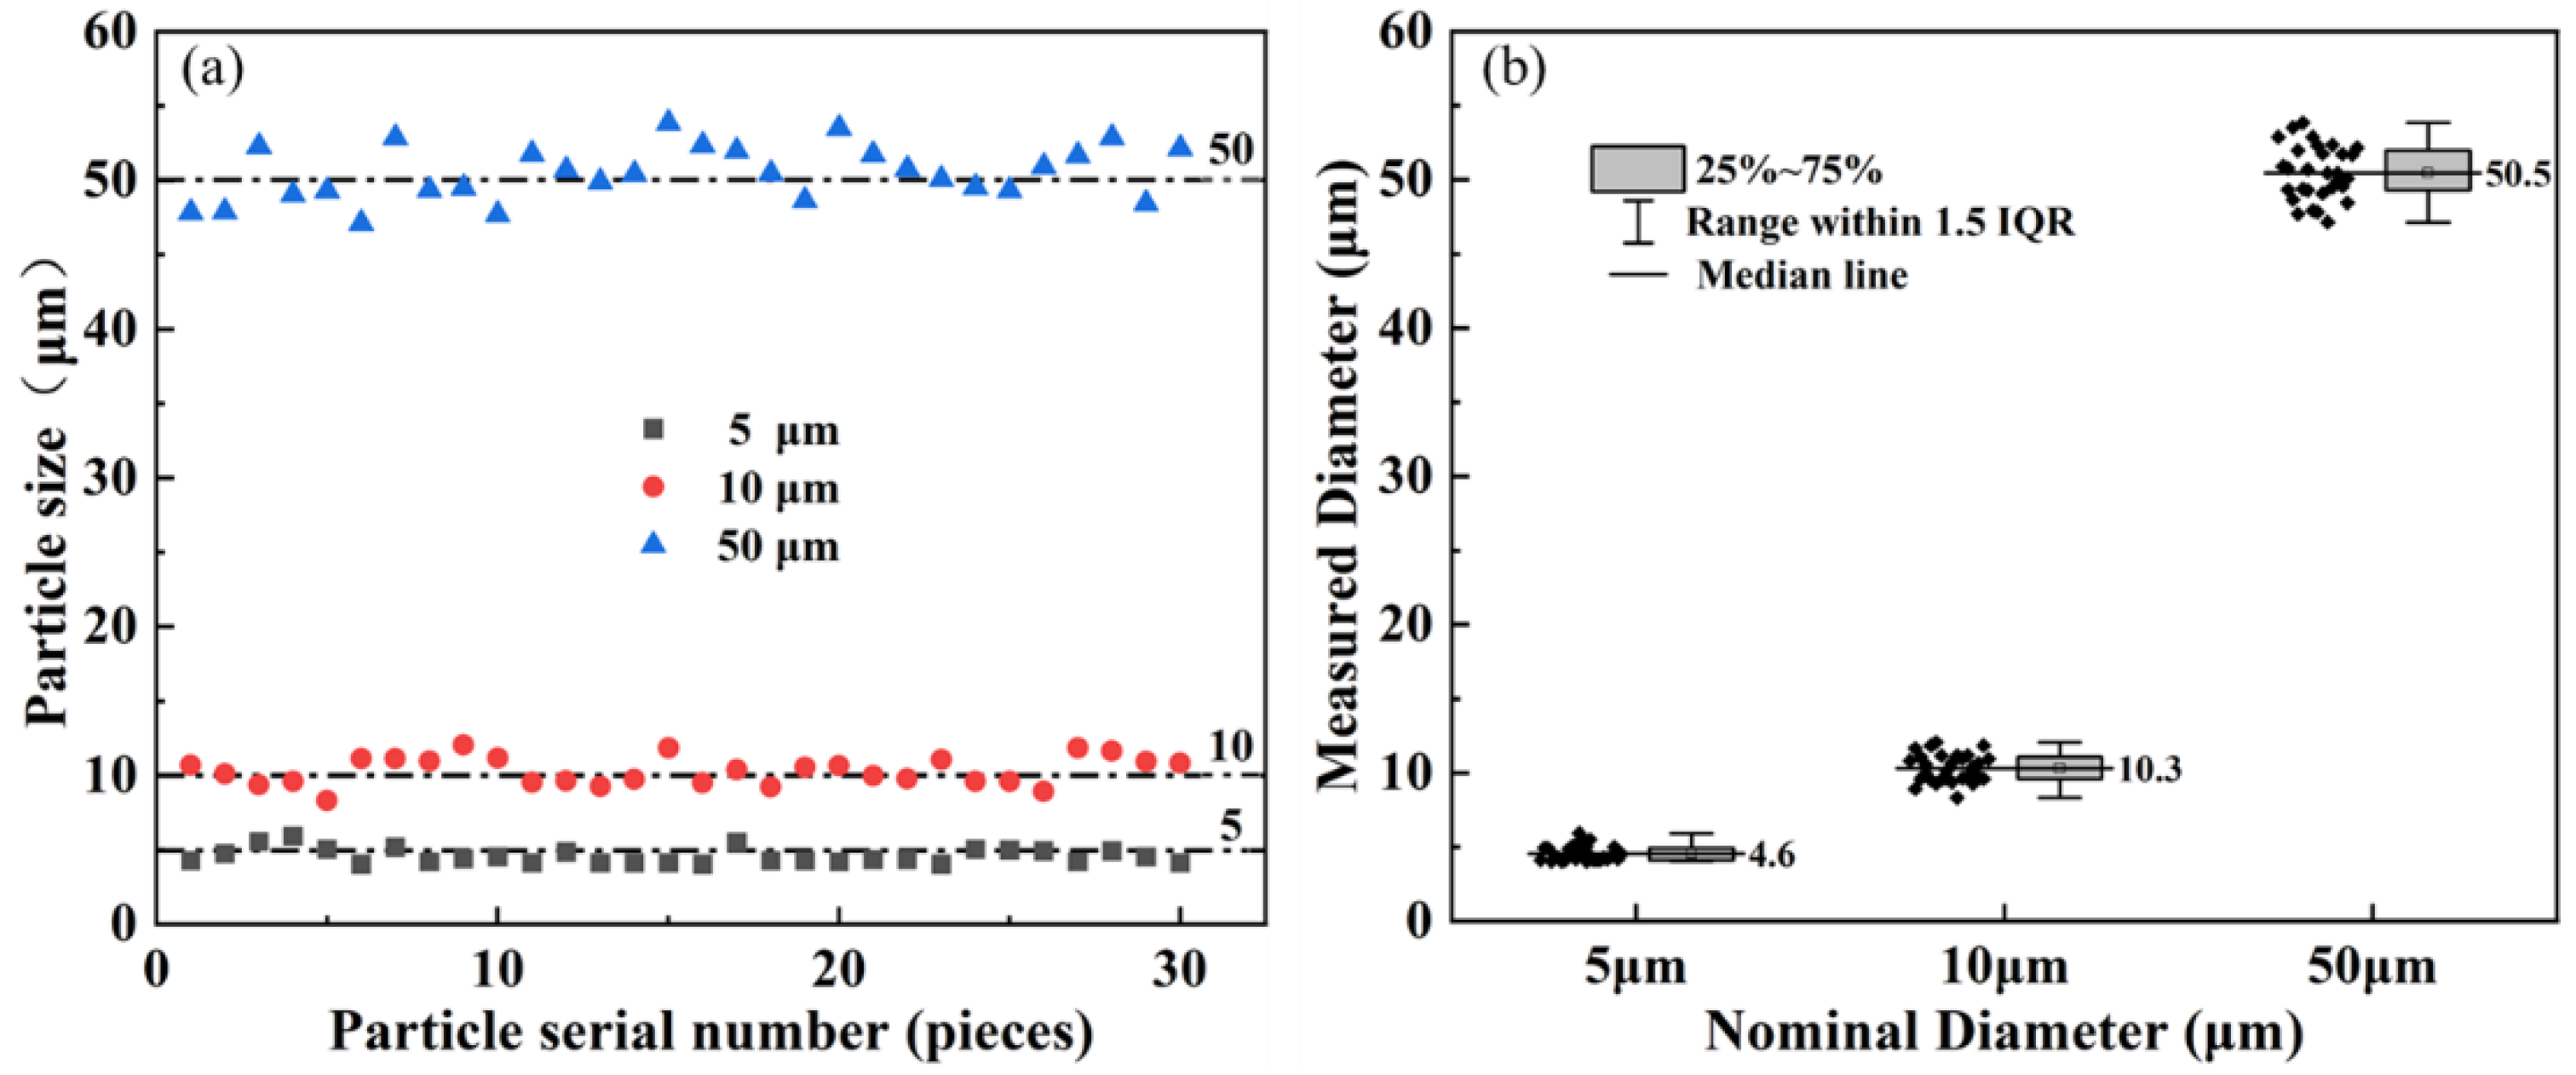
Figure 4.
Shape-factor distributions for (a) droplets and sand grains and (b) droplets and 5 μm borosilicate microspheres.
Figure 4.
Shape-factor distributions for (a) droplets and sand grains and (b) droplets and 5 μm borosilicate microspheres.
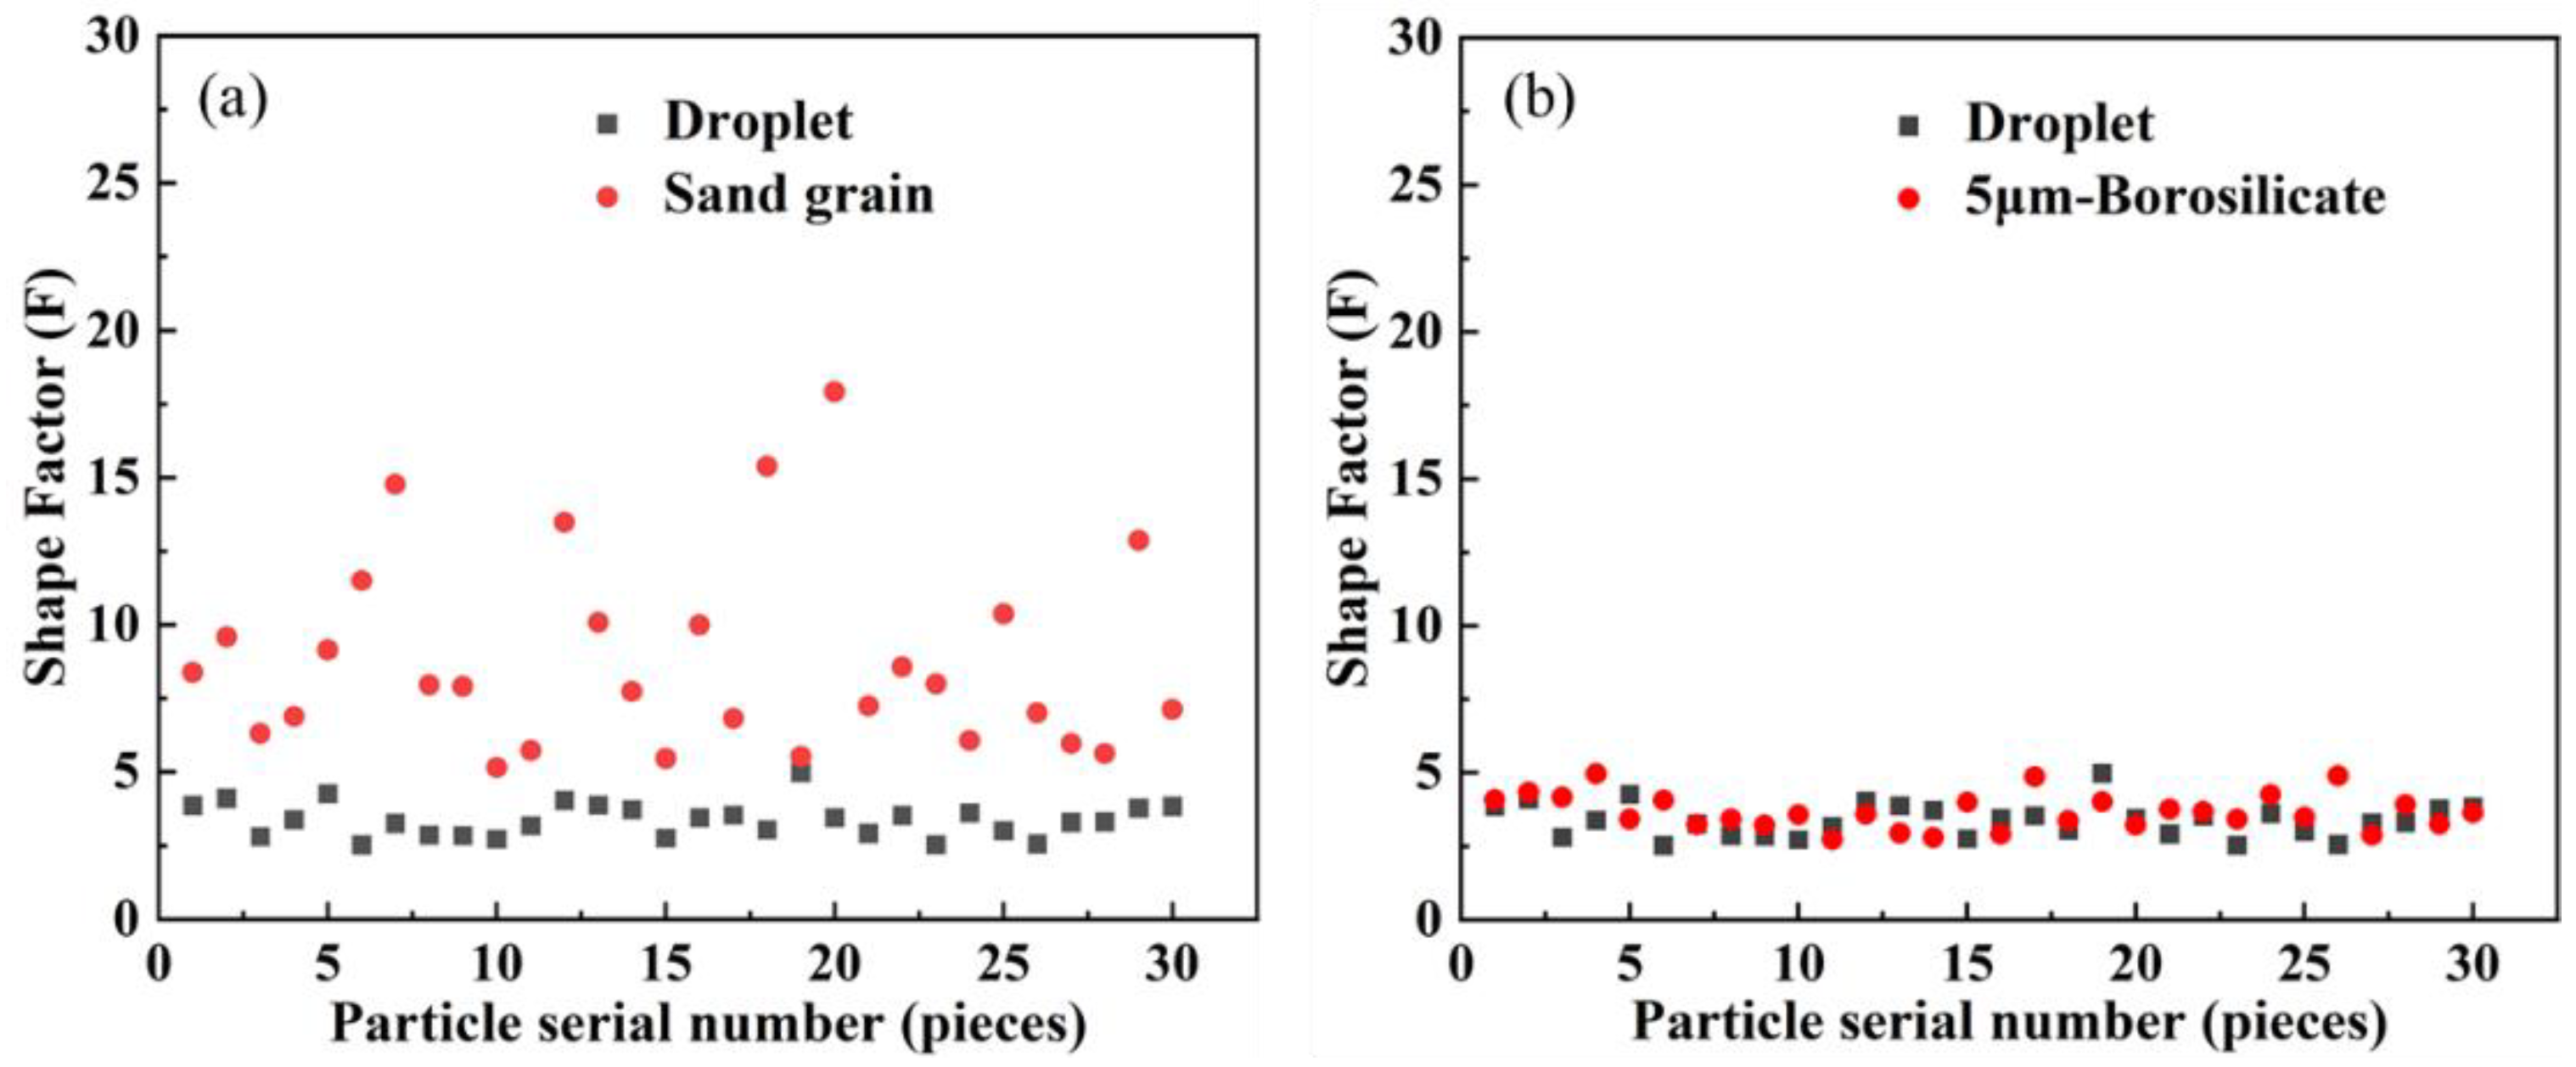
Figure 5.
Representative DoLP maps of the investigated particle groups: (a) droplets (n = 1.33, approximately 5 μm); (b,c) borosilicate microspheres (n = 1.47, 5 and 10 μm); (d) soda-lime glass microspheres (n = 1.52, 50 μm); and (e) sand grains (n = 1.50). The refractive-index values are the nominal values used for comparison in this study.
Figure 5.
Representative DoLP maps of the investigated particle groups: (a) droplets (n = 1.33, approximately 5 μm); (b,c) borosilicate microspheres (n = 1.47, 5 and 10 μm); (d) soda-lime glass microspheres (n = 1.52, 50 μm); and (e) sand grains (n = 1.50). The refractive-index values are the nominal values used for comparison in this study.
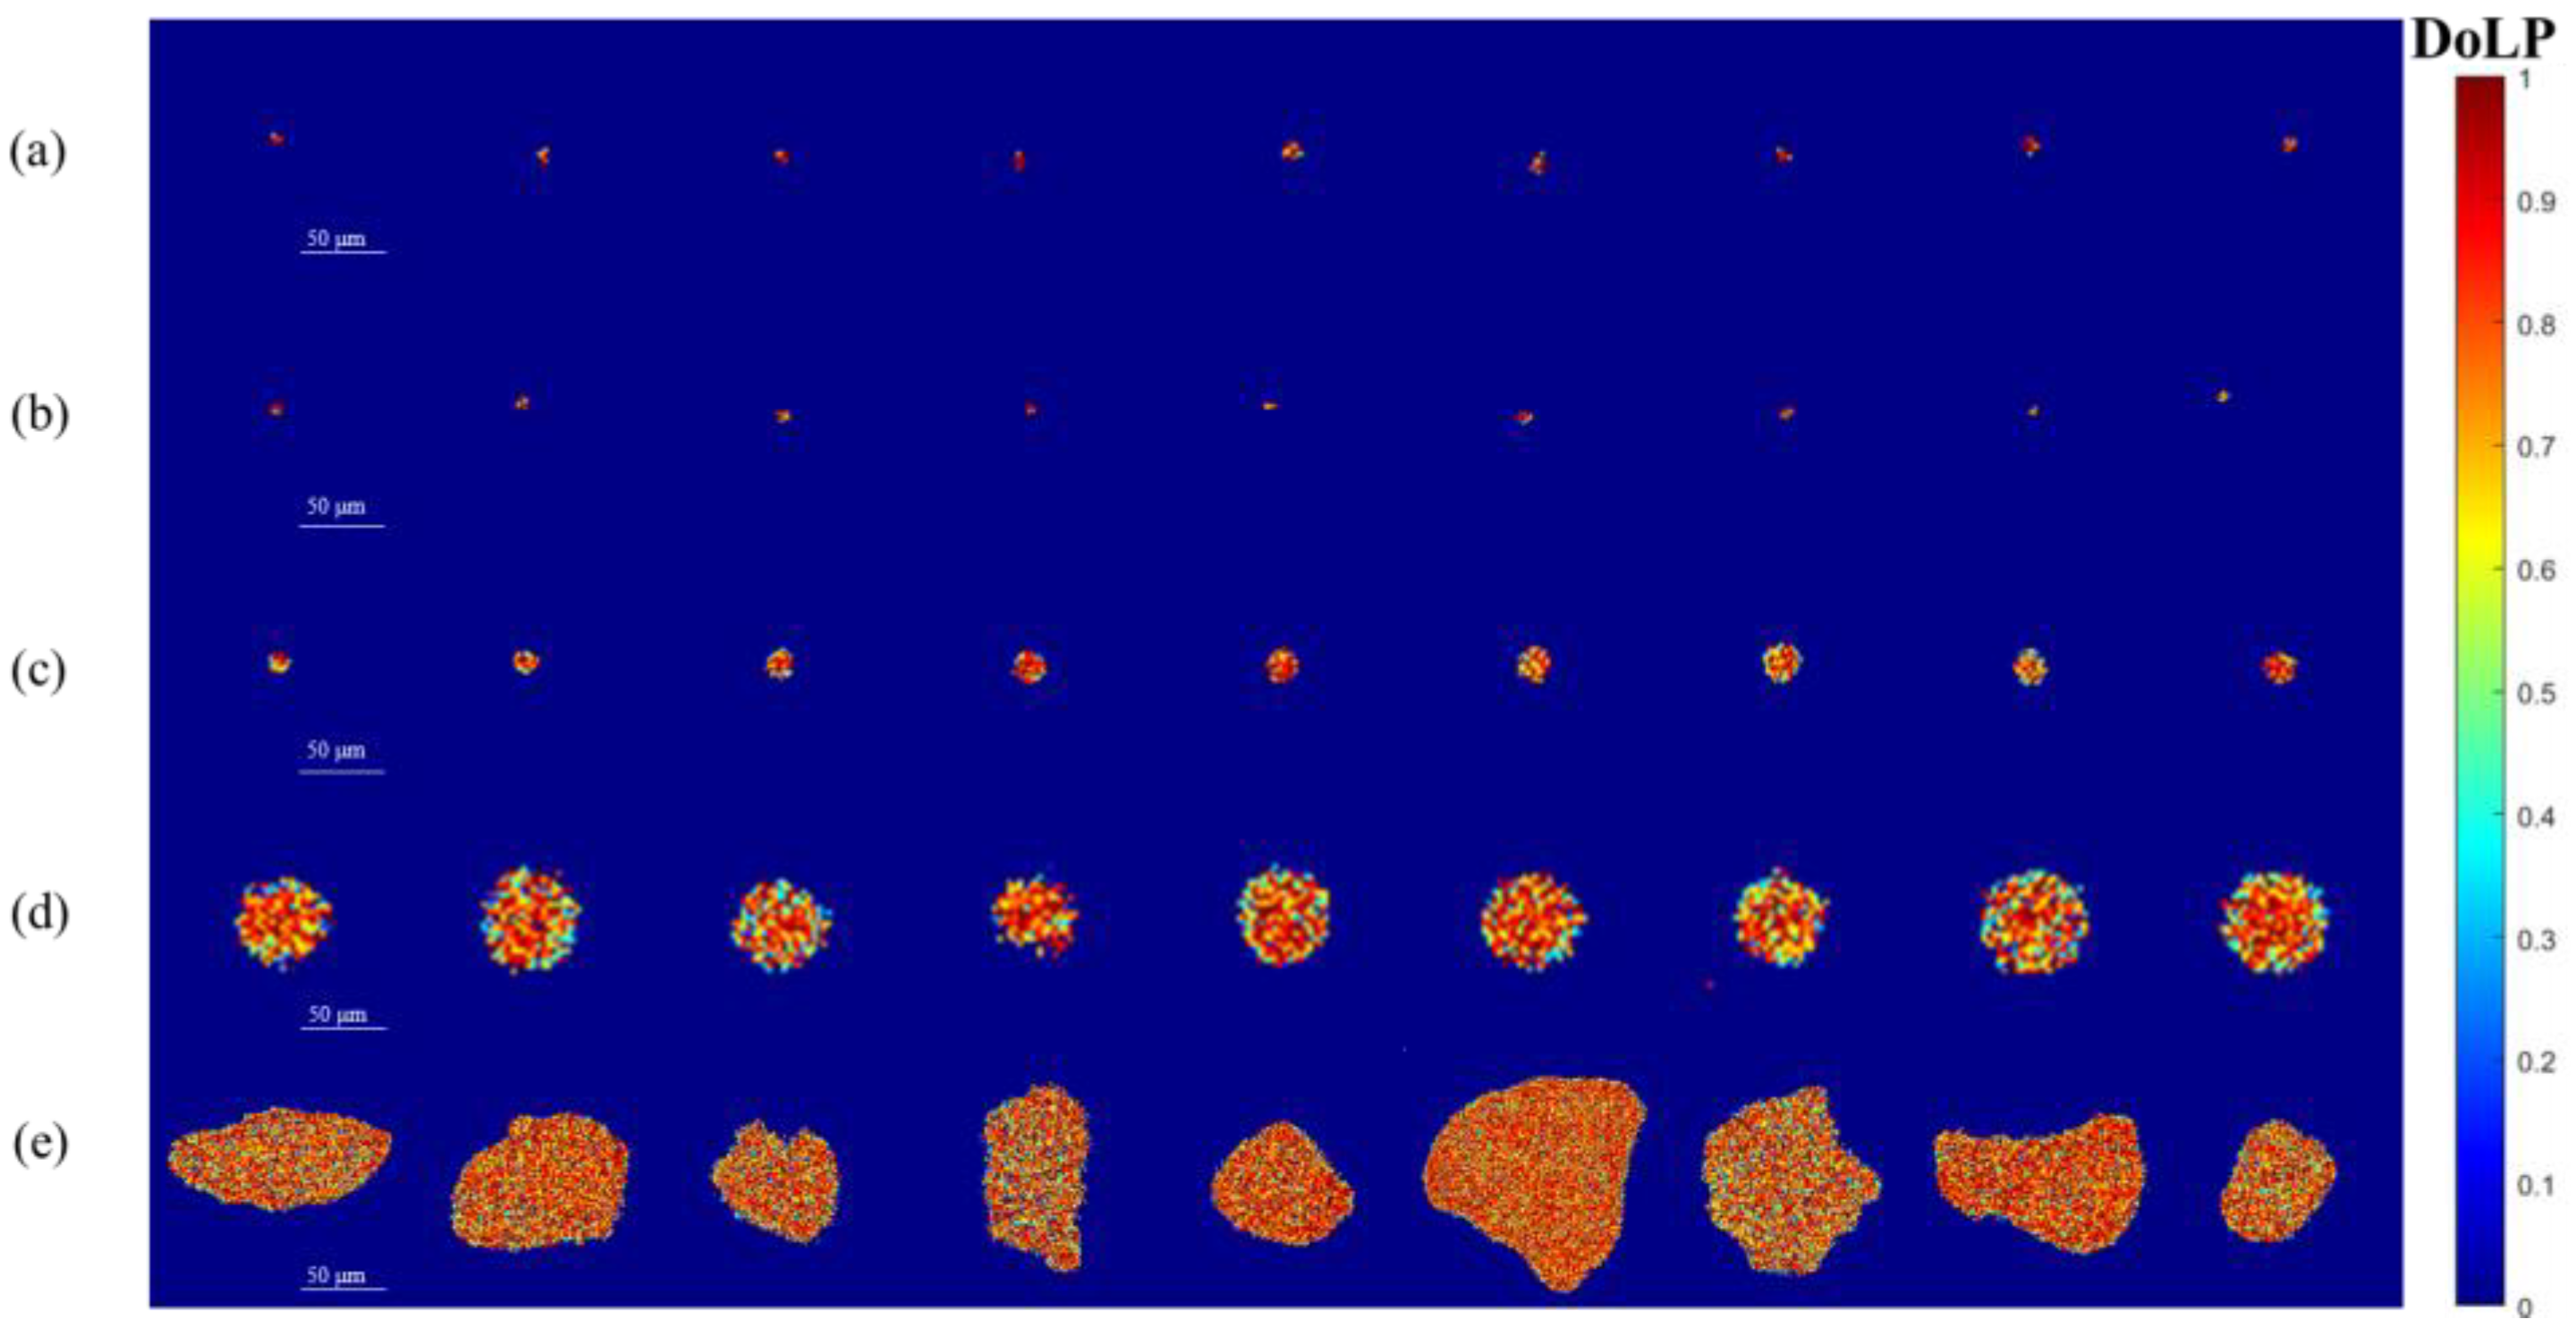
Figure 6.
Particle-level DoLP results and the group-level refractive-index trend. (a) Droplets (n = 1.33, approximately 5 μm); (b,c) borosilicate microspheres (n = 1.47, 5 and 10 μm); (d) soda-lime glass microspheres (n = 1.52, 50 μm); (e) sand grains (n = 1.50); (f) the five group-mean DoLP values plotted against nominal refractive index, together with the first-order least-squares fit.
Figure 6.
Particle-level DoLP results and the group-level refractive-index trend. (a) Droplets (n = 1.33, approximately 5 μm); (b,c) borosilicate microspheres (n = 1.47, 5 and 10 μm); (d) soda-lime glass microspheres (n = 1.52, 50 μm); (e) sand grains (n = 1.50); (f) the five group-mean DoLP values plotted against nominal refractive index, together with the first-order least-squares fit.
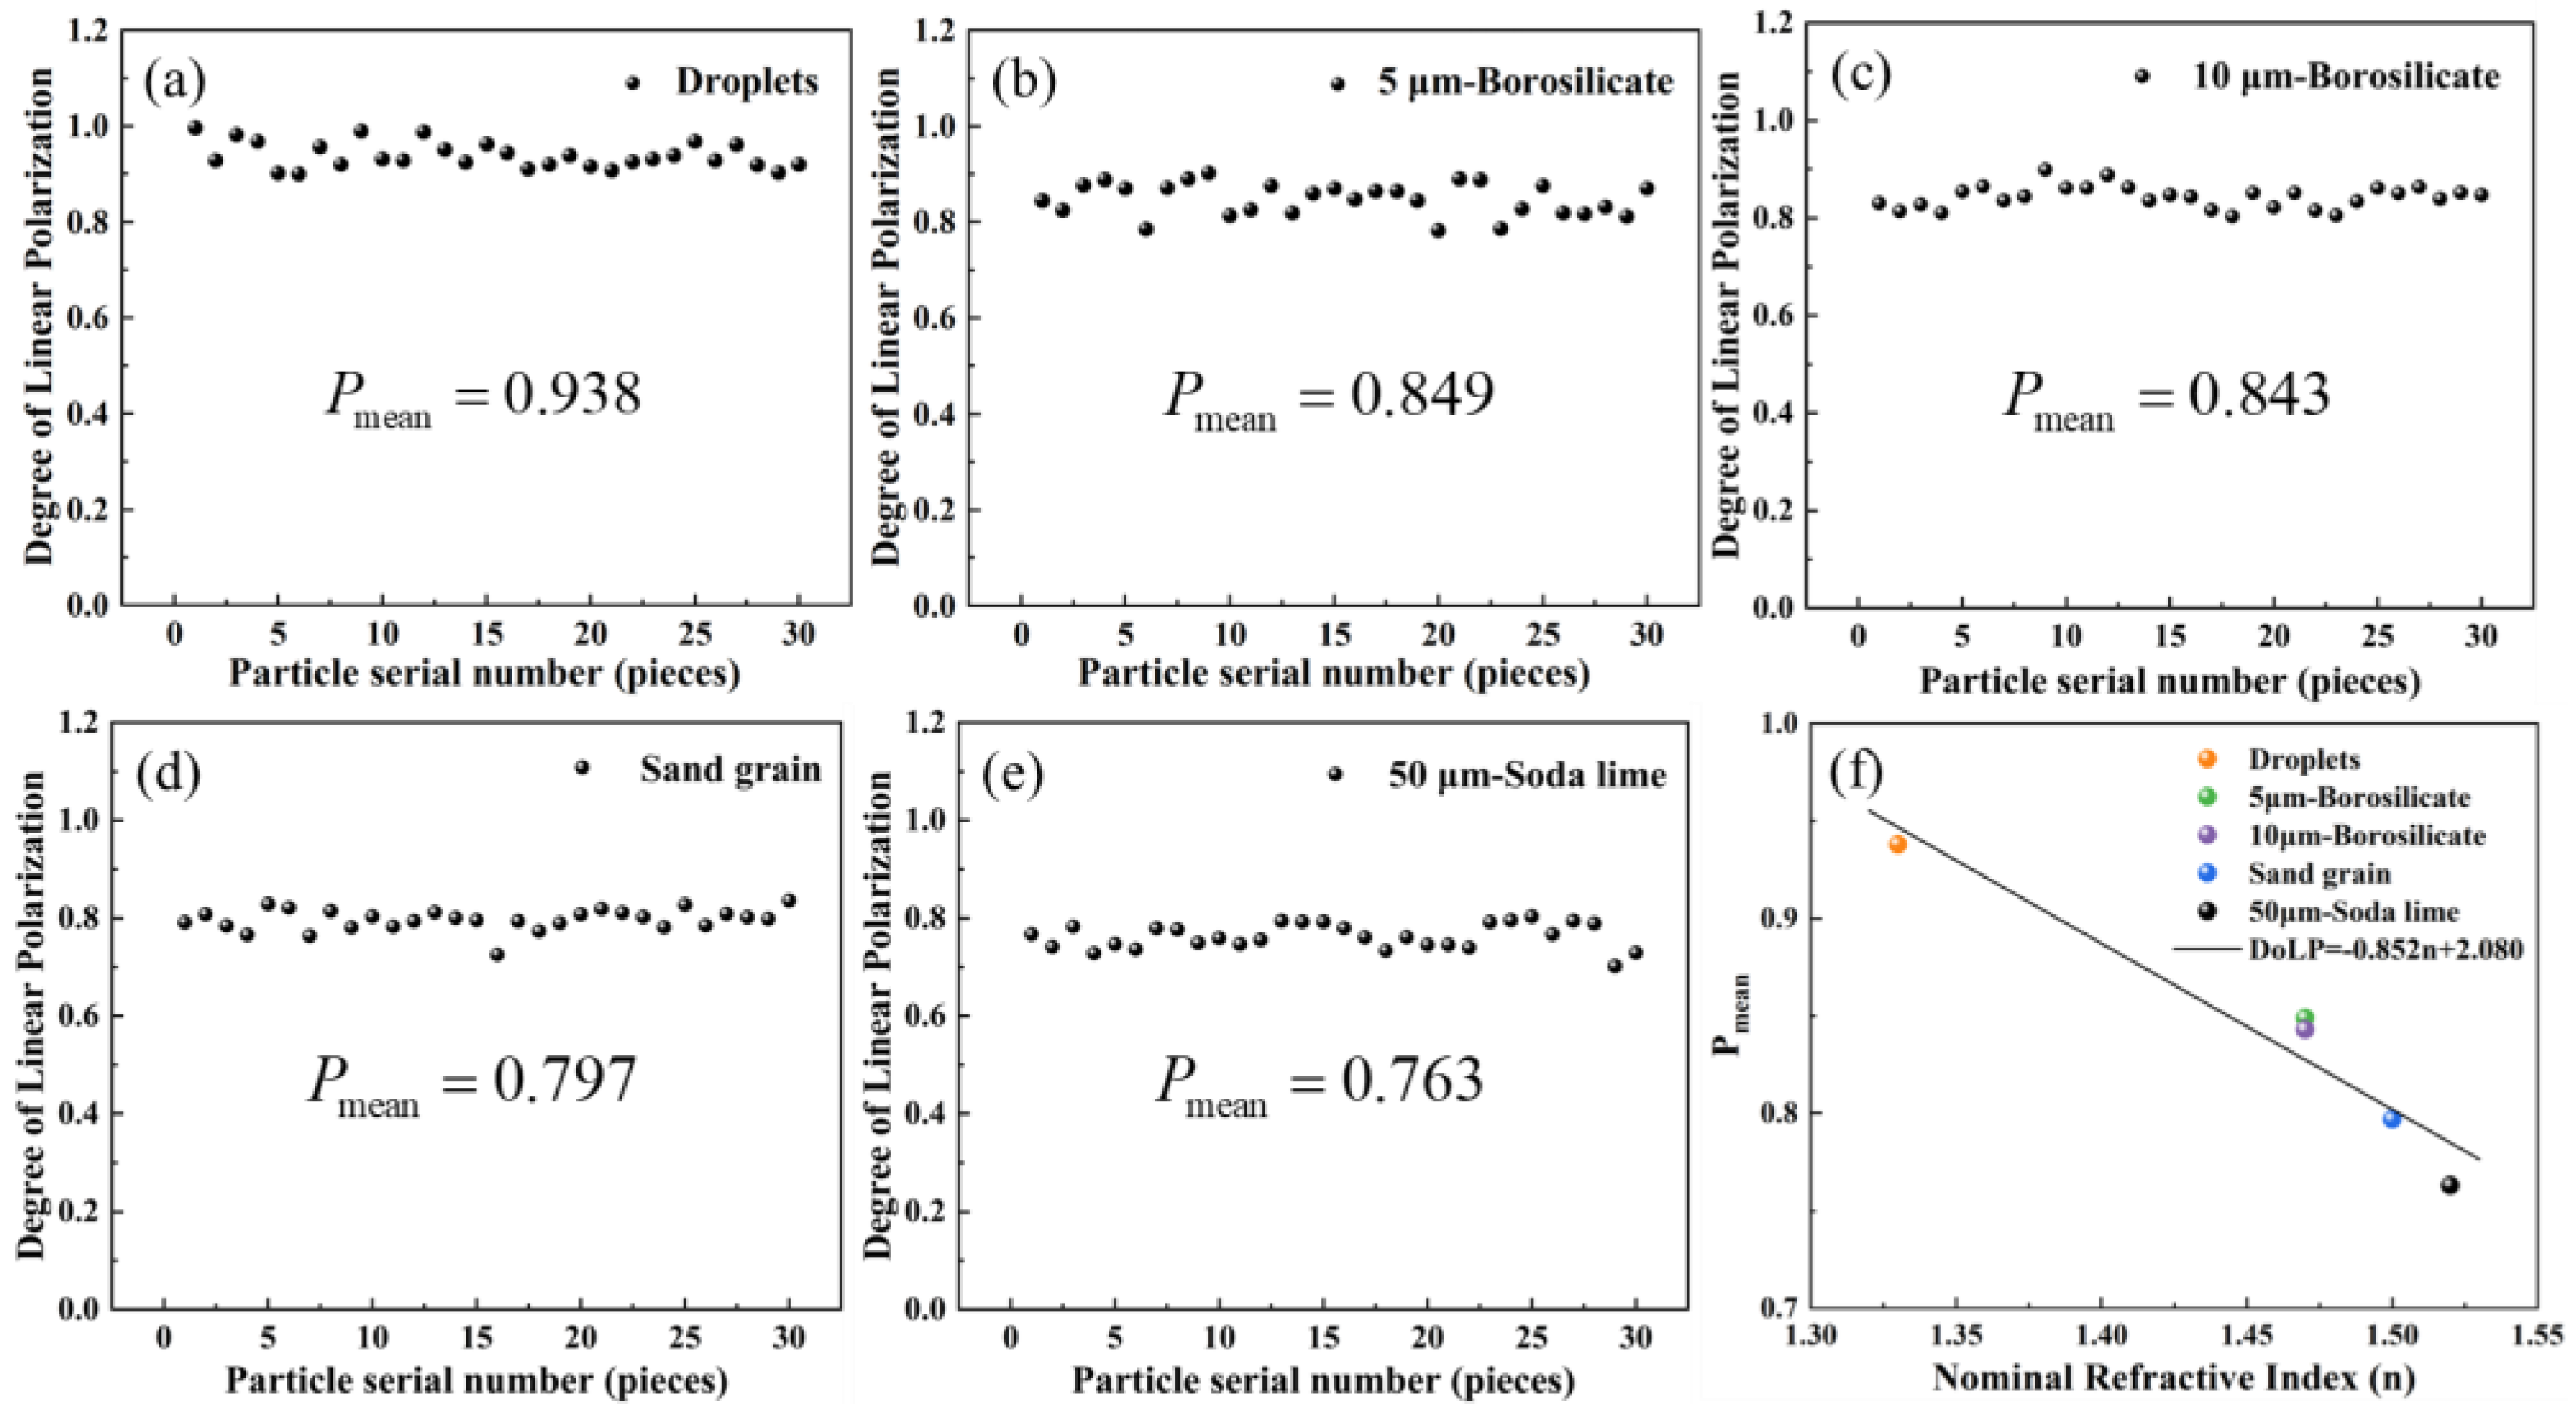
Figure 7.
T-matrix simulation of DoLP versus scattering angle: (a) different particle sizes at a fixed refractive index; (b) different refractive indices at a fixed particle size.
Figure 7.
T-matrix simulation of DoLP versus scattering angle: (a) different particle sizes at a fixed refractive index; (b) different refractive indices at a fixed particle size.
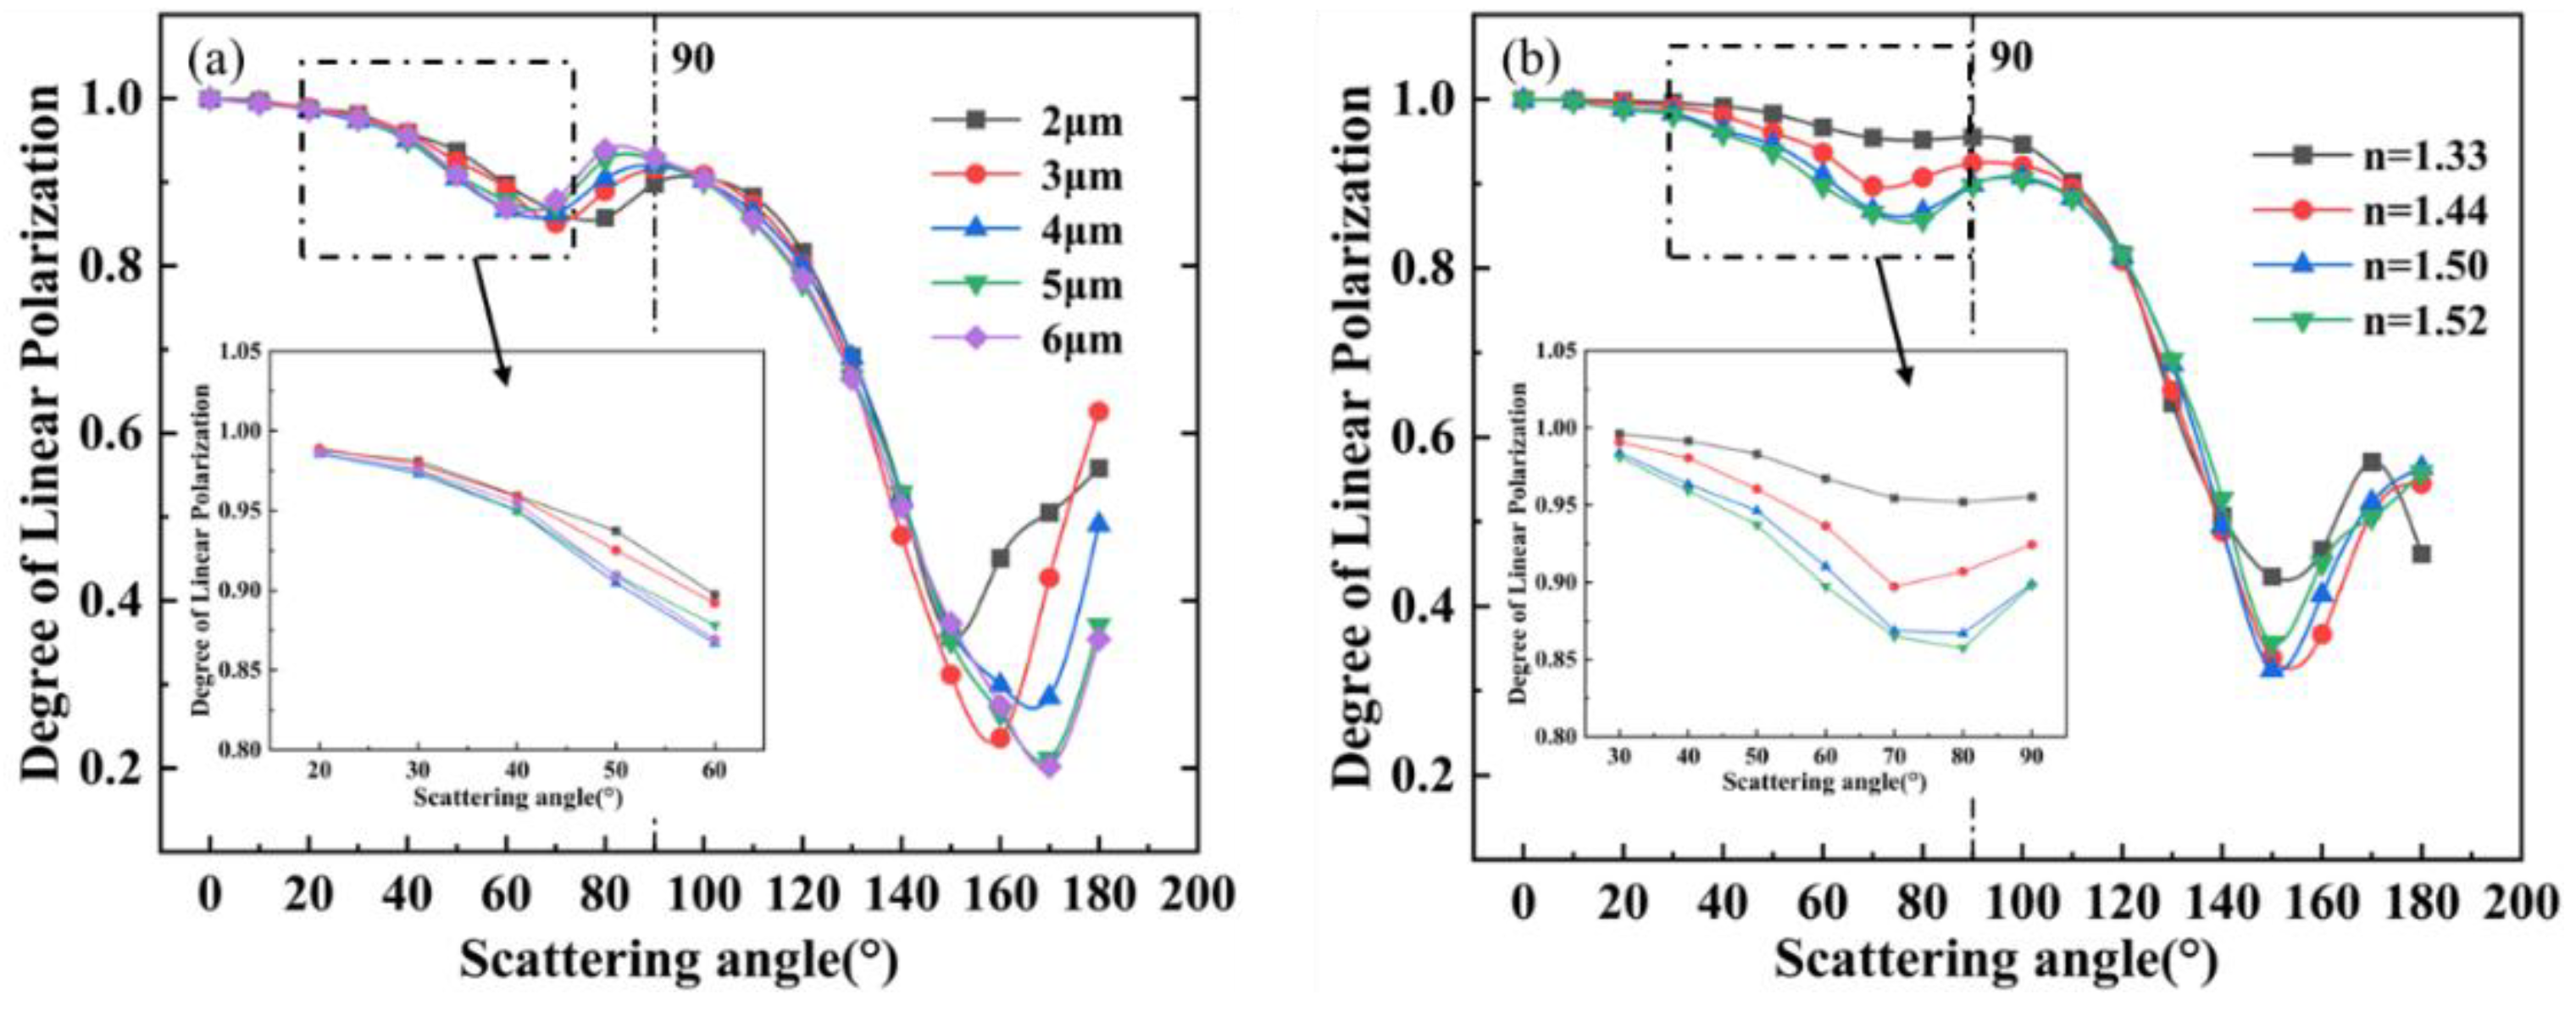

Table 1.
Morphological parameters of the three representative particles shown in Figure 2.
Table 1.
Morphological parameters of the three representative particles shown in Figure 2.
| X (mm) |
Y (mm) |
Z (mm) |
Diameter (μm) |
Minor axis (μm) |
Major axis (μm) |
Perimeter (μm) |
Area (μm2) |
F | |
|---|---|---|---|---|---|---|---|---|---|
| a | 0.297 | 1.143 | 3.8 | 8.53 | 8.01 | 8.546 | 27.13 | 62.84 | 3.69 |
| b | 0.179 | 1.079 | 2.6 | 47 | 47.3 | 47.84 | 183.29 | 1863.5 | 4.71 |
| c | 1.363 | 1.039 | 5.4 | 85.92 | 77.2 | 118.69 | 369.97 | 6437.3 | 6.82 |
Disclaimer/Publisher’s Note: The statements, opinions and data contained in all publications are solely those of the individual author(s) and contributor(s) and not of MDPI and/or the editor(s). MDPI and/or the editor(s) disclaim responsibility for any injury to people or property resulting from any ideas, methods, instructions or products referred to in the content. |
© 2026 by the authors. Licensee MDPI, Basel, Switzerland. This article is an open access article distributed under the terms and conditions of the Creative Commons Attribution (CC BY) license (http://creativecommons.org/licenses/by/4.0/).
Copyright: This open access article is published under a Creative Commons CC BY 4.0 license, which permit the free download, distribution, and reuse, provided that the author and preprint are cited in any reuse.