
Submitted:
29 August 2026
Posted:
31 August 2026
You are already at the latest version
Abstract
Objectives: This study evaluates whether cardiovascular (CV) parameters derived from noninvasive arterial pulse signals can reveal subject-specific characteristics in patients with atypical CV dynamics that may be obscured in group-level analyses. Methods: Seven special-case patients—including a heart transplant (HTx) recipient and individuals with bradycardia (low heart rate), low dicrotic notch (DN), and intermittent arterial pulse waveform (APW) variations—were analyzed across three visits over the cardiac rehabilitation period. Radial artery (RA) and carotid artery (CA) signals, acquired using microfabricated tactile sensors, were processed using a single-degree-of-freedom time–frequency (SDOF–TF) framework to extract multiple CV parameters. Results: The patients exhibited highly heterogeneous CV profiles. Subjects with low heart rate (HR) demonstrated blunted post-exercise responses. Subjects with low DN morphology exhibited elevated lower-order harmonic amplitudes. Patients with intermittent features showed cyclic variations in APW morphology at-rest and during post-exercise recovery. Across all cases, RA measurements generally provided more stable and interpretable individualized patterns across visits, whereas CA measurements were more susceptible to variability related to motion artifacts (MA) and sensor-artery interaction effects. Conclusions: The SDOF–TF framework successfully identifies individualized multi-parameter CV characteristics associated with diverse complex CV conditions of the seven cases. The findings support the potential value of individualized arterial pulse analysis for personalized CV monitoring and indicate that post-exercise assessment provides more distinctive characterization of CV dynamics than conventional at-rest analysis alone.
Keywords:
arterial pulse signal
; arterial pulse waveform
; harmonic amplitude
; time-frequency analysis
; single-degree-of-freedom (SDOF)
; heart rate variability
; respiration
1. Introduction
Following Part I, which examined cardiovascular (CV) characteristics in 18 patients with heterogeneous heart diseases, this study focuses on a subset of seven cases separated from the main cohort due to clearly atypical CV and arterial pulse waveform (APW) profiles. These subjects were identified based on consistent deviations from the cohort’s predominant patterns, including heart rate (HR), the location of dicrotic notch (DN), and APW morphology. They exhibit pronounced departures from trends observed in most patients, such as unusually low at-rest HR, atypical DN location, intermittent or irregular APW variability, and distinct physiological conditions such as heart transplantation (HTx). Collectively, these features suggest fundamentally different CV regulatory characteristics, warranting separate analysis.
Seven such cases are examined from the same cohort: one patient included due to the well-established impairment of autonomic regulation in HTx individuals [1,2,3,4,5,6], rendering this subject physiologically distinct despite not exhibiting markedly abnormal APW morphology; two patients with low at-rest HR (i.e., bradycardia) [7,8]; two patients with lower relative DN position within the waveform; and two patients exhibiting intermittent APW variations across consecutive pulse cycles. Given these distinctive characteristics, the cases are analyzed separately, with particular emphasis on comparisons between radial artery (RA) and carotid artery (CA) measurements to assess whether distal RA signals fail to capture features evident in CA waveforms.
The objective of this study is to apply the same single-degree-of-freedom time–frequency (SDOF-TF) framework [9] and analytical methodology used in Part I to these cases. This approach enables characterization of subject-specific physiological features, longitudinal variability, and site-dependent differences between RA and CA measurements, thereby providing further insight into atypical CV dynamics and the broader spectrum of CV phenotypes within the cohort.
2. Materials and Methods
2.1. Study Population
The Seven special cases were selected from the same cohort as in Part I based on atypical CV characteristics. These included:
- One HTx patient (CR008), included due to the well-established impairment of autonomic regulation in HTx individuals, rendering this subject physiologically distinct from the general cohort. This patient has been previously reported in a case study [10].
- Two patients (CR002 and CR011) with relatively low DN position in APW.
- Two patients (CR013 and CR035) with low at-rest HR (bradycardia).
- Two patients (CR019 and CR020) exhibiting intermittent APW variations across consecutive pulse cycles.
All patients underwent pulse signal measurements at both the RA and CA. Pulse measurements were conducted on the same weekday during the first week (Visit 1), second week (Visit 2), and fourth week (Visit 3) of the program. The HTx patient did not participate the measurement for Visit 3. The subject recruitment, measurement setup, protocol, and detailed descriptions of extracted CV parameters are omitted here, as they remain identical to those described in Part I. Readers are referred to Part I for full methodological details, including sensor specifications, data acquisition, and signal processing. Table 1 summarizes the baseline characteristics of the seven subjects prior to the study.
2.2. Analysis Strategy
The same single-degree-of-freedom time–frequency (SDOF-TF) framework used in Part I was applied to both RA and CA signals in these seven cases. The same CV parameters as in Part I were extracted. Analyses were conducted for RA and CA measurements at rest and during post-exercise recovery, and longitudinal changes across repeated visits were assessed. Both RA and CA measurements were systematically compared to determine site-specific differences and to evaluate whether features observable at the CA are detectable at the RA, given the CA’s closer proximity to the heart.
All extracted parameter values were interpreted qualitatively, with an emphasis on relative patterns, longitudinal trends, and site-specific differences, consistent with the approach in Part I. As in Part I, the shape of the normalized APW, including its upstroke slope and dicrotic notch (DN), was qualitatively assessed as an indicator of arterial stiffness. This strategy facilitates the identification of atypical CV dynamics and subject-specific profiles that are not captured in the general cohort.
3. Results
3.1. Heart Rate (HR) and Heart Rate Variability (HRV)
All As shown in Figure 1, CR008 (HTx) exhibited the highest at-rest HR, consistent with reports in the literature describing elevated at-rest HR following heart transplantation [1,2,3,4,5,6]. The subject maintained a characteristic tachycardia of about 100bpm, reflecting the physiological consequence of surgical denervation and the absence of parasympathetic vagal modulation.
The low-DN group (CR002 and CR011) exhibited at-rest HR within the normal range. In contrast, the low-HR group (CR013 and CR035) showed marked bradycardia, with at-rest HR values of 55bpm and 50bpm, respectively. Notably, CR020 also demonstrated bradycardia (50bpm).
Two key findings emerge. First, at-rest HR remained relatively stable across visits for all subjects, indicating slight longitudinal variation. Second, HR values at rest and 30min post-exercise were comparable, suggesting recovery to near-baseline levels within this time frame.
Another important observation is the high degree of inter-site consistency. HR values derived from RA and CA measurements, both at rest and 30min post-exercise, were highly similar. This agreement indicates that both measurement sites reliably capture the underlying cardiac rhythm, regardless of disease state or physiological condition. Moreover, the consistency in HR between RA and CA within each subject, across both at-rest and post-exercise conditions, supports the interpretation that observed between-visit differences primarily reflect true physiological variation rather than measurement variability.
It is also worth noting that HR appears less sensitive to MA at the CA compared with time-sensitive metrics such as HRV, RR, and RM, which depend more strongly on fine morphological details of the pulse waveform. In contrast, HR is a more robust aggregate measure and therefore less affected by subtle signal distortions or artifacts that may impact waveform-dependent analyses.
As shown in Figure 2, the immediate CV response to exercise was quantified as the relative change in HR at 5min post-exercise compared to the at-rest baseline (ΔHR/HR). A key observation was a markedly blunted HR response in the special-case cohort, with maximal ΔHR/HR values substantially lower than those observed in the healthy reference. Notably, CR-013 and CR-035 exhibited negative ΔHR/HR values, indicating that their HR at 5min post-exercise fell below baseline levels.
For the remaining subjects, ΔHR/HR remained positive but modest, failing to reach the robust increases seen in the healthy reference. While CR-011 and CR-020 demonstrated relatively large longitudinal changes across visits, the other subjects showed minimal variation over time.
These post-exercise patterns were consistently observed at both RA and CA measurement sites, suggesting that the ΔHR/HR metric reflects genuine physiological dynamics, rather than measurement variability. A mild difference in ΔHR/HR between the two arterial sites was noted, which is likely attributable to elevated MA encountered at the CA 5min post-exercise.
As illustrated in Figure 3, CR008 (HTx) exhibited a markedly reduced at-rest HRV, consistent with the known impact of heart transplantation on CV autonomic function. The low-DN group (CR002 and CR011) also showed reduced at-rest HRV values. In contrast, the low-HR group demonstrated heterogeneous at-rest HRV: CR013 presented a low HRV value, whereas CR035 exhibited a higher HRV than the healthy reference.
Most subjects maintained longitudinally stable at-rest HRV across the three visits. Exceptions were CR019 and CR020, who displayed substantial variability over time. Notably, CR019 (AF and MI)— the only subject with AF—demonstrated a large swing in at-rest HRV across visits. Although AF is typically associated with elevated at-rest HRV, CR019 showed a high at-rest HRV only during the first visit. Similarly, CR020 (PCI) exhibited pronounced variability, with an exceptionally high at-rest HRV observed at the final visit.
For CR019 (AF and MI), intermittent APW variations at-rest were observed only during Visit 1, which explains the markedly elevated HRV at that time; HRV decreased in Visits 2 and 3 as the waveform stabilized (see Figure 11). Conversely, CR020 exhibited minimal intermittent variations at-rest in Visits 1 and 2, followed by pronounced fluctuations in Visit 3 (see Figure 12), corresponding to initially low at-rest HRV and a substantial increase at the final visit. The mechanisms underlying these dynamic shifts remain uncertain and may reflect post-surgical recovery, medication adjustments, or exercise-related effects.
The strong concordance of at-rest HRV values between RA and CA measurements underscores the reliability of the methodology, supporting the conclusion that the large longitudinal swings observed in CR019 and CR020 represent true physiological changes rather than measurement variability. As noted in Part I, the mild differences in at-rest HRV between the two arterial sites likely arise because MA is more pronounced at the CA site, and metrics related to fine features in time-domain—such as HRV, RR, and RM—are more sensitive to such artifacts than APW and HR.
The contribution of non-respiratory physiological factors (PF) to total HRV, expressed as HRVPF/HRV, is illustrated in Figure 4. By isolating non-respiratory components of HRV, HRVPF/HRV quantifies the extent to which cardiac rhythm is influenced by factors such as sympathetic surges, blood pressure fluctuations, or intrinsic rhythm instability.
Here, we focus on the results at the RA. For CR008 (HTx), HRVPF/HRV improved markedly from Visit 1 to Visit 2. The negative value observed in Visit 1 is attributable to MA affecting the instantaneous frequency extracted from the measured pulse signal and should be interpreted as a very low value rather than a physiologically meaningful negative contribution. The low-DN group and low-HR group exhibited HRVPF/HRV values at the final visit that were relatively comparable to the healthy reference. In contrast, CR019 and CR020 showed markedly reduced HRVPF/HRV relative to the healthy reference.
CR008 and CR020 exhibited the largest longitudinal variation in HRVPF/HRV across visits. However, the physiological significance of these longitudinal changes remains uncertain. Given the relatively small variation observed in CR019, the larger fluctuations seen in some subjects are more likely to reflect true physiological changes rather than measurement variability. Finally, a notable inter-site inconsistency in HRVPF/HRV was observed. This likely due to that CA measurements are subject to larger MA than RA measurements.
3.2. Respiratory Parameters: RR and RM
As shown in Figure 5, inter-site differences between at-rest and 30min post-exercise measurements become more pronounced, likely due to increased MA at the CA. Accordingly, the following analysis focuses solely on RA measurements. Because the absolute magnitude of RR is relatively small, differences across visits may appear proportionally large. Results from the third visit are emphasized here, except for CR008, for which no third visit was available and therefore data from the second visit were used
For At rest, CR008 (HTx) exhibited RR values lower than those of the healthy reference, with only minimal change at 30min post-exercise. The low-DN group showed divergent responses: CR002 presented low at-rest RR followed by a marked increase at 30min post-exercise, whereas CR011 exhibited elevated at-rest RR followed by a substantial reduction at 30min post-exercise. The low-HR group demonstrated consistently low at-rest RR with pronounced increases at 30min post-exercise, with CR035 showing an even greater post-exercise RR elevation.
CR019 displayed at-rest RR comparable to the healthy reference, whereas CR020 exhibited substantially lower at-rest RR. However, both subjects showed moderate reductions in RR at 30 min post-exercise relative to their respective at-rest values. Notably, the low at-rest RR observed in CR020, together with its low at-rest HR, is consistent with the pattern identified in the low-HR group.
As shown in Figure 6(a) and 6(b), similar to RR, the stronger influence of MA on CA measurements substantially affects their reliability compared with RA measurements. Therefore, the following analysis focuses exclusively on RM derived from RA measurements. The healthy reference exhibited RM values that increased with harmonic order, together with a relatively consistent increment between consecutive harmonics.
Compared with the healthy reference, CR008 (HTx) exhibited reduced at-rest RM, consistent with the known effects of heart transplantation on autonomic regulation. The low-DN group also demonstrated reduced RM. Within the low-HR group, CR013 showed low at-rest RM, whereas CR035 exhibited at-rest RM comparable to the healthy reference during the last two visits. Notably, CR035 had a CRT-D. Overall, both at-rest and 30 min post-exercise RM for these five subjects generally maintained an increasing trend with harmonic order, although the regular increment between consecutive harmonics was not consistently preserved.
CR019 (AF and MI) exhibited elevated at-rest RM during the first visit but reduced at-rest RM during the last two visits. In contrast, CR020 (PCI, 76-80yr) demonstrated reduced at-rest RM during the first two visits but substantially elevated at-rest RM during the third visit. For both subjects, the reduced at-rest RM profiles largely preserved the increasing trend with harmonic order, whereas the elevated at-rest RM profiles lost this orderly harmonic progression. Nevertheless, RM at 30 min post-exercise regained the increasing trend with harmonic order in both subjects.
To more clearly illustrate the differences between at-rest and 30 min post-exercise conditions, Figure 6(c) presents RM values averaged across harmonics. Relative to the at-rest condition, the healthy reference exhibited reduced RM at 30 min post-exercise, consistent with previous reports showing diminished respiration-related modulation of HRV following exercise [9]. CR008 (HTx) exhibited the opposite RM response during the first visit. Although the second visit followed the same directional trend as the healthy reference, the magnitude of change was minimal. The low-DN group demonstrated only slight RM changes between at-rest and 30 min post-exercise conditions. Similarly, CR013 in the low-HR group showed minimal RM change, whereas CR035 exhibited a substantially larger RM change, with the third visit reproducing the same directional pattern observed in the healthy reference. Both CR019 during visit 1 and CR020 during visit 3 demonstrated markedly elevated RM changes in the same direction as the healthy reference.
3.3. Normalized APW and Harmonic Analysis
3.3.1. Subject-Specific Comparison of Individual Normalized Harmonic Amplitudes at the RA and the CA
As shown in Figure 7, the analysis of normalized harmonic amplitudes across the 2nd-7th harmonics provides a detailed spectral characterization of the APW at-rest and during the recovery phase (5min and 10min post-exercise). These results highlight how different CV conditions influence the harmonic distribution of the pulse energy.
Variations are observed between the RA and CA in the 5min and 10min post-exercise harmonic responses of the healthy reference. However, both sites demonstrated an increase in the 2nd harmonic amplitude, together with increases in the 6th and 7th harmonic amplitudes. Notably, the differences between patient responses and the healthy reference were more clearly distinguished at the RA than at the CA.
At the RA, all patients exhibited a blunted increase in the 2nd harmonic amplitude (except CR002 in all visits and CR011 in Visit 1), heterogeneous changes in the 3rd–5th harmonics, and markedly blunted changes in the 6th and 7th harmonics. These harmonic response patterns differ from those observed in the general cases presented in Part I. Furthermore, both the 5min and 10min post-exercise response patterns varied substantially across patients, and the corresponding longitudinal changes also differed markedly between patients.
In contrast, no consistent harmonic amplitude changes were observed across patients at the CA. It should also be noted that harmonic amplitudes measured at the CA are more sensitive to variations in the TCS stack than those measured at the RA.
3.3.2. Cross-Subject and Longitudinal Comparison of Normalized Harmonic Amplitude Profiles at the RA
As shown in Figure 8, within the low-DN group, CR011 exhibited an extremely elevated 2nd harmonic amplitude, while CR002 showed marked increases in both the 2nd and 3rd harmonics, consistent with the lowered DN position observed in their APW. For the remaining patients, the 2nd harmonic amplitude was generally higher than that of the healthy reference across visits. Consistent with Part I, harmonics in the 5th–7th range remained lower than the healthy reference longitudinally, while the 3rd and 4th harmonics showed heterogeneous changes across patients. Overall, at-rest normalized harmonic profiles showed limited inter-patient separation, with the exception of the low-DN group, and no pronounced distinction among the remaining five patients relative to the healthy reference.
In contrast, the 5min post-exercise response more clearly differentiated patient-specific dynamics. CR002 and CR011 exhibited markedly different post-exercise harmonic patterns, with clear longitudinal variability. CR019 and CR020 also showed distinct post-exercise responses with observable longitudinal changes. In the low-HR group (CR013 and CR035), post-exercise responses were more similar, with only mild longitudinal variation. CR008 (HTx) demonstrated a pronounced deviation from the healthy reference in the post-exercise condition.
Figure 9 illustrates longitudinal variations in normalized harmonic amplitude profiling and its 5min post-exercise response for two patients, due to space limits. CR011 exhibited stable at-rest harmonic amplitude profiles across all visits, with no noticeable longitudinal change. However, its 5-minute post-exercise response varied substantially between visits. Although ΔHR/HR increased over time, the harmonic amplitude profiles did not track this trend directly. Despite this mismatch, the post-exercise response progressively approached the healthy reference profile.
In contrast, CR013 showed longitudinal variability in both at-rest and 5-minute post-exercise harmonic profiles, with consistent deviation from the healthy reference. Importantly, the post-exercise response more clearly reflected the underlying physiology, indicating a blunted response pattern. Correspondingly, ΔHR/HR showed no change across the first two visits and a negative change in the final visit.
3.3.3. Normalized APW At-Rest Between the RA and CA
Figure 10 compares the normalized at-rest APW of the subjects across visits with the healthy reference. As discussed in Part I, the location of the DN at the RA can serve as an indicator of arterial stiffness. For CR008 (HTx), the DN at the RA was markedly lower than that of the healthy reference, suggesting increased arterial stiffness. Meanwhile, the normalized APWs at the RA remained highly similar across the two visits. In contrast, the normalized APW at the CA showed substantial inter-visit variation. However, it remains unclear whether these differences primarily reflect true physiological changes or measurement variability, due to variation in TCS stack between the two artery sites.
The low-DN group (CR002 and CR011) both exhibited substantially lower DN locations at the RA than the healthy reference. For CR002, the normalized APWs at the CA also consistently showed a markedly lower DN than the healthy reference. Although some inter-visit variation was present at both arterial sites, the overall APW patterns remained relatively consistent, suggesting that variations in the TCS stack at the CA were comparatively mild for CR002. In contrast, for CR011, only the normalized APWs at the RA maintained similar longitudinal patterns, whereas the normalized APW at the CA varied dramatically across visits. Notably, CR011 had an extremely high BMI (48.6), suggesting that the CA measurements were likely strongly influenced by variations in the TCS stack.
For the low-HR group, both CR013 and CR035 exhibited DN locations at the RA comparable to the healthy reference. Their normalized APW at the RA also showed relatively consistent longitudinal patterns. However, the normalized APW at the CA revealed substantial inter-visit variation for CR013 but only mild variation for CR035. Again, it is unclear whether the large CA variation observed for CR013 reflects genuine physiological changes or measurement variability. It should also be noted that CR013 was diagnosed with NSTEMI, whereas CR035 (CRT-D) was diagnosed with chronic systolic heart failure. Both patients had normal BMI values.
For CR019 and CR020, both subjects exhibited lower DN locations at the RA than the healthy reference and demonstrated relatively consistent normalized APW patterns across visits at the RA. However, the normalized APWs at the CA showed substantial pattern variation between visits. As shown in the Supplementary Document, the measured pulse signals at the CA did not capture intermittent changes as distinctly as those at the RA, which may have affected the derivation of the normalized APWs at the CA.
3.3.4. Intermittent APW Variations in CR019 and CR020
Figure 11 and Figure 12 present the measured at-rest pulse signals at the RA for CR019 (AF and MI, 66-70yr) and CR020 (PCI, 76-80yr), respectively, where x0(t) denotes the measured pulse signal free of the baseline drift xbd(t). Both subjects clearly exhibited intermittent changes occurring every several pulse cycles, revealing transient and repetitive physiological instabilities that are largely obscured in the time-averaged APWs shown in Figure 10(f) and Figure 10(g).
For CR019, the intermittent pattern was most prominent during Visit 1, where the waveform exhibited a rhythmic “swing,” and the APW became both transformed and elongated every few beats. During post-exercise recovery, the frequency of these intermittent fluctuations progressively decreased from 5 min to 30min. Interestingly, this intermittent signature was absent at rest during Visits 2 and 3, suggesting stabilization of the pulse morphology. Similarly, no obvious intermittent signature was observed during post-exercise recovery in these later visits.
In contrast, CR020 demonstrated a progressive increase in intermittency at the RA across the three visits. During Visit 1, no discernible intermittent fluctuations were observed at rest, but slight intermittent fluctuations appeared at 5min post-exercise. In Visit 2, intermittent fluctuations remained absent at rest, but pronounced intermittent fluctuations emerged at 5 min post-exercise. By Visit 3, prominent intermittent fluctuations were also present at rest. However, similar to CR019 during Visit 1, the frequency of intermittent fluctuations progressively decreased during post-exercise recovery from 5 min to 30min.
Examination of the corresponding CA measurements indicated substantial contamination by MA, particularly respiratory motion during post-exercise recovery. Consequently, the CA measurements did not reveal additional physiological features beyond those already observed at the RA, while the RA measurements provided substantially clearer and more reliable visualization of the intermittent patterns. Additional RA measurements during post-exercise recovery, together with the corresponding CA measurements for CR019 and CR020, are provided in the Supplementary Document.
4. Discussion
In this study, the same SDOF–TF framework and arterial pulse analysis methodology developed in Part I were applied to a subset of seven patients exhibiting atypical CV characteristics. Although the cohort size was limited, the analysis revealed subject-specific CV features that differed markedly from those observed in the general cohort. Both RA and CA measurements were examined to evaluate inter-site differences. Due to the heterogeneous nature of both this subset and the general cohort in Part I, it is difficult to systematically identify all differences between the two groups. Nevertheless, one notable distinction was that the 5min and 10min post-exercise harmonic amplitude responses of these seven patients differed distinctly from those observed in the general cohort. Similar to Part I, the effects of cardiac rehabilitation were heterogeneous, with no consistent longitudinal trend across subjects or CV parameters. The methodological limitations of this study are identical to those discussed in Part I; therefore, the discussion here focuses primarily on the physiological implications of the analyzed results.
4.1. Common Features and Individualized CV Signatures
Despite substantial heterogeneity across subjects, several shared tendencies were observed. At-rest HR and HRV exhibited relatively limited longitudinal variation for most patients, while higher-order harmonics (5th–7th) remained consistently lower than the healthy reference across visits. In contrast, lower-order harmonics, particularly the 2nd and 3rd harmonics, showed clear inter-subject variability, especially in cases with altered DN morphology.
At the RA, waveform-derived features were generally stable across visits and provided consistent subject-specific profiles. In contrast, CA-derived parameters exhibited greater variability across visits, likely suggesting reduced robustness of CA measurements under the current acquisition conditions. Therefore, RA-based features are more reliable for identifying stable individual CV characteristics, whereas CA-derived variations must be interpreted cautiously due to potential measurement sensitivity to MA and the anatomical complexity at the CA.
4.2. Post-Exercise Recovery Better Distinguishes CV Condition than At-Rest Assessment
Across all patients, post-exercise recovery responses provided clearer inter-subject separation than at-rest measurements. At-rest harmonic amplitude profiles were often overlapping between patients, whereas 5-min post-exercise responses revealed stronger differentiation in both harmonic structure and longitudinal trends.
Blunted or altered recovery responses were particularly evident in patients with impaired CV regulation or abnormal clinical conditions. Importantly, post-exercise perturbation revealed dynamic behavior that was not observable under at-rest conditions, indicating that recovery-phase analysis provides a more sensitive window into CV functional differences than baseline assessment alone.
4.3. APW at the CA Warrants Further Investigation
Normalized APWs at the CA frequently differed from those at the RA and showed greater inter-visit variability. This variability was particularly pronounced in certain subjects (e.g., CR011), where large fluctuations were observed at the CA but not at the RA.
A major contributing factor is the higher sensitivity of CA measurements to variations in TCS stack and MA, particularly during post-exercise recovery. In contrast, RA waveforms remained more consistent across visits and subjects. While the CA may potentially contain additional information related to central arterial dynamics, its current reliability for fine waveform-based analysis is limited under the present measurement conditions. Further methodological improvements are required before CA-derived APW features can be interpreted with confidence comparable to RA-derived features.
4.4. Intermittent Changes in CR019 and CR020
CR019 and CR020 exhibited intermittent pulse waveform fluctuations that were not observed in other subjects. These fluctuations occurred over multiple pulse cycles and were clearly visible in raw RA signals, but were obscured in time-averaged APWs.
CR019 showed intermittent behavior primarily in Visit 1, which disappeared in later visits, indicating a stabilization of waveform dynamics over time. In contrast, CR020 exhibited a progressive increase in intermittency across visits, eventually becoming evident even at rest in Visit 3. In both cases, intermittency decreased during post-exercise recovery.
These intermittent features were significantly less clear in CA recordings due to higher noise levels, MA, as well as the complex sensor-artery interaction, reinforcing the superior reliability of RA measurements for capturing subtle temporal waveform instabilities.
4.5. Complexity and Individual Variability of CV Assessment
The analysis also highlights the large number of uncontrollable physiological and methodological factors affecting CV assessment. Even among subjects sharing the same CV diagnosis, substantial variability was observed due to differences in disease severity, medication effects, autonomic regulation, vascular condition, age, BMI, and individual physiological adaptation.
Furthermore, CV diseases themselves may alter the normal physiological relationships between CV parameters at rest and during post-exercise recovery. Pharmacological treatments may additionally modify these relationships, further increasing inter-subject variability. Consequently, group-level interpretation based on a limited number of CV parameters cannot adequately characterize the overall CV condition of an individual subject.
In contrast, simultaneous evaluation of the complete set of CV parameters enables a more comprehensive and individualized characterization of CV condition by capturing interactions between autonomic regulation, vascular mechanics, and waveform morphology. Such an approach is more compatible with personalized diagnosis, longitudinal monitoring, and individualized treatment evaluation, particularly in heterogeneous cardiac rehabilitation populations.
5. Conclusions
This study applied an SDOF-TF framework to arterial pulse signals in a subset of cardiac rehabilitation patients with atypical CV features. The results demonstrate that combining at-rest and post-exercise measurements provides a more complete characterization of CV dynamics than at-rest analysis alone, particularly in revealing recovery-dependent changes in harmonic profiling and waveform behavior. In selected cases (notably CR019 and CR020), intermittent waveform features and post-exercise responses revealed additional physiological information that was not captured by conventional time-averaged APW analysis.
Overall, substantial inter-subject variability was observed due to differences in diagnosis, medication status, and disease severity, underscoring the limitations of group-level interpretation of multi-parameter CV profiles. RA measurements provided more stable and interpretable waveform characteristics across visits, whereas CA measurements showed greater variability, likely due to sensitivity to TCS stack variations and MA under the current pulse measurement conditions. These findings support individualized multi-parameter waveform analysis for longitudinal CV monitoring and highlight the need for further validation in larger cohorts with improved and more controlled acquisition protocols, particularly for CA-based measurements.
Supplementary Materials
The following supporting information can be downloaded at: https://www.mdpi.com/article/doi/s1.
Author Contributions
Conceptualization, Z.H.; methodology, Z.H., M.H., M.R., and L.R.; software, Z.H., M.R., M.H.; validation, Z.H., M.H., M.R., L.R., J.M., and J.H.; formal analysis, M.R. and M.H.; investigation, M.H., M.R., and J.M.; resources, Z.H., J.M., and J.H.; data curation, M.H., M.R., and J.M.; writing—original draft preparation, Z.H.; writing—review and editing, Z.H., L.R., J.M., and J.H.; visualization, Z.H. and M.H.; supervision, Z.H.; project administration, Z.H.; funding acquisition, Z.H. and J.H. All authors have read and agreed to the published version of the manuscript.
Funding
This research received no external funding.
Institutional Review Board Statement
Human participant measurements were performed under the approval of the Eastern Virginia Medical School, Virginia Health Sciences IRB at Old Dominion University (IRB Approval #19-04-FB-0100) and the ODU Institutional Review Board (IRB #I RB24-166).
Informed Consent Statement
Informed consent has been obtained from the subjects involved in the study for publication.
Data Availability Statement
Due to institutional policy and applicable privacy regulations, individual-level patient data will not be shared with external investigators or repositories. These restrictions are necessary to protect patient confidentiality and comply with institutional governance of clinical data resources.
Acknowledgments
This material is based upon work supported by the National Science Foundation under Award No. 1936005.
Conflicts of Interest
The authors declare no conflicts of interest, except that a provisional patent application has been filed for the SDOF-TF method and its associated algorithms (patent pending). The SDOF-TF method and its associated algorithms will be developed into software for future commercial licensing, and the software implementation is protected by copyright owned by Old Dominion University.
Abbreviations
The following abbreviations are for CV diseases:
| CRT-D | Biventricular Implantable Cardioverter Defibrillator |
| HF | Heart Failure |
| MI | Myocardial Infarction |
| NSTEMI | Non-ST-segment Elevation Myocardial Infarction |
| PCI | Percutaneous Coronary Intervention |
| SR | Sinus Rhythm |
| AF | Atrial Fibrillation |
References
- Keeley, E.C.; Toth, Z.K.; Goldberg, A.D. Long-term assessment of heart rate variability in cardiac transplant recipients. J. Heart Lung Transplant. 2000, 19, 310–312. [Google Scholar] [CrossRef]
- Cornelissen, V.A.; Vanhaecke, J.; Aubert, A.E.; Fagard, R.H. Heart rate variability after heart transplantation: A 10-year longitudinal follow-up study. J. Cardiol. 2012, 59, 220–224. [Google Scholar] [CrossRef]
- Wdowczyk, J.; Makowiec, D.; Dorniak, K.; Gruchała, M. Visualization of heart rate variability of long-term heart transplant patient by transition networks: A case report. Front. Physiol. 2016, 7, 79. [Google Scholar] [CrossRef]
- Fernandes-Silva, M.M.; Almeida, F.D.M.; D'Avila, V.M.; Gellatti, M.P.; Guimarães, G.V. Cardiac rehabilitation in patients with heart failure: Clinical recommendation based on a review of the evidence. Heart Fail. Rev. 2025, 30, 1435–1442. [Google Scholar] [CrossRef]
- Vanderlaan, R.D.; Conway, J.; Manlhiot, C.; McCrindle, B.W.; Dipchand, A.I. Enhanced exercise performance and survival associated with evidence of autonomic reinnervation in pediatric heart transplant recipients. Am. J. Transplant. 2012, 12, 2157–2163. [Google Scholar] [CrossRef]
- de Lima, J.B.; Soares, D.D.S.; Ferrari, F.; Carvas Junior, N.; Carvalho, G.; Tobar Leitão, S.A.; Goldraich, L.A.; Clausell, N.; Stein, R. Exercise training modalities for heart transplant recipients: A systematic review and network meta-analysis protocol. BMJ Open 2020, 10, e044975. [Google Scholar] [CrossRef]
- Sidhu, J.; Marine, J.E. Evaluating and managing bradycardia. Trends Cardiovasc. Med. 2020, 30, 265–272. [Google Scholar] [CrossRef]
- Kusumoto, F.M.; Schoenfeld, M.H.; Barrett, C.; Edgerton, J.R.; Ellenbogen, K.A.; Gold, M.R.; Goldschlager, N.F.; Hamilton, R.M.; Joglar, J.A.; Kim, R.J.; et al. 2018 ACC/AHA/HRS guideline on the evaluation and management of patients with bradycardia and cardiac conduction delay: A report of the American College of Cardiology/American Heart Association Task Force on Clinical Practice Guidelines and the Heart Rhythm Society. J. Am. Coll. Cardiol. 2019, 74, e51–e156. [Google Scholar] [CrossRef]
- Hao, Z. Motion artifacts removal from measured arterial pulse signals at rest: A generalized SDOF-model-based time–frequency method. Sensors 2025, 25, 6808. [Google Scholar] [CrossRef]
- Rahman, M.M.; Hasan, M.; May, J.F.; Herre, J.M.; Reynolds, L.; Hao, Z. Radial and carotid arterial pulse signals for assessing cardiovascular function at rest and during post-exercise recovery in a heart transplant patient: A case study. Med. Sens. Imaging 2026. [Google Scholar] [CrossRef]
Figure 1.
HR at-rest and 30min post-exercise of the subjects (a) RA (b) CA.
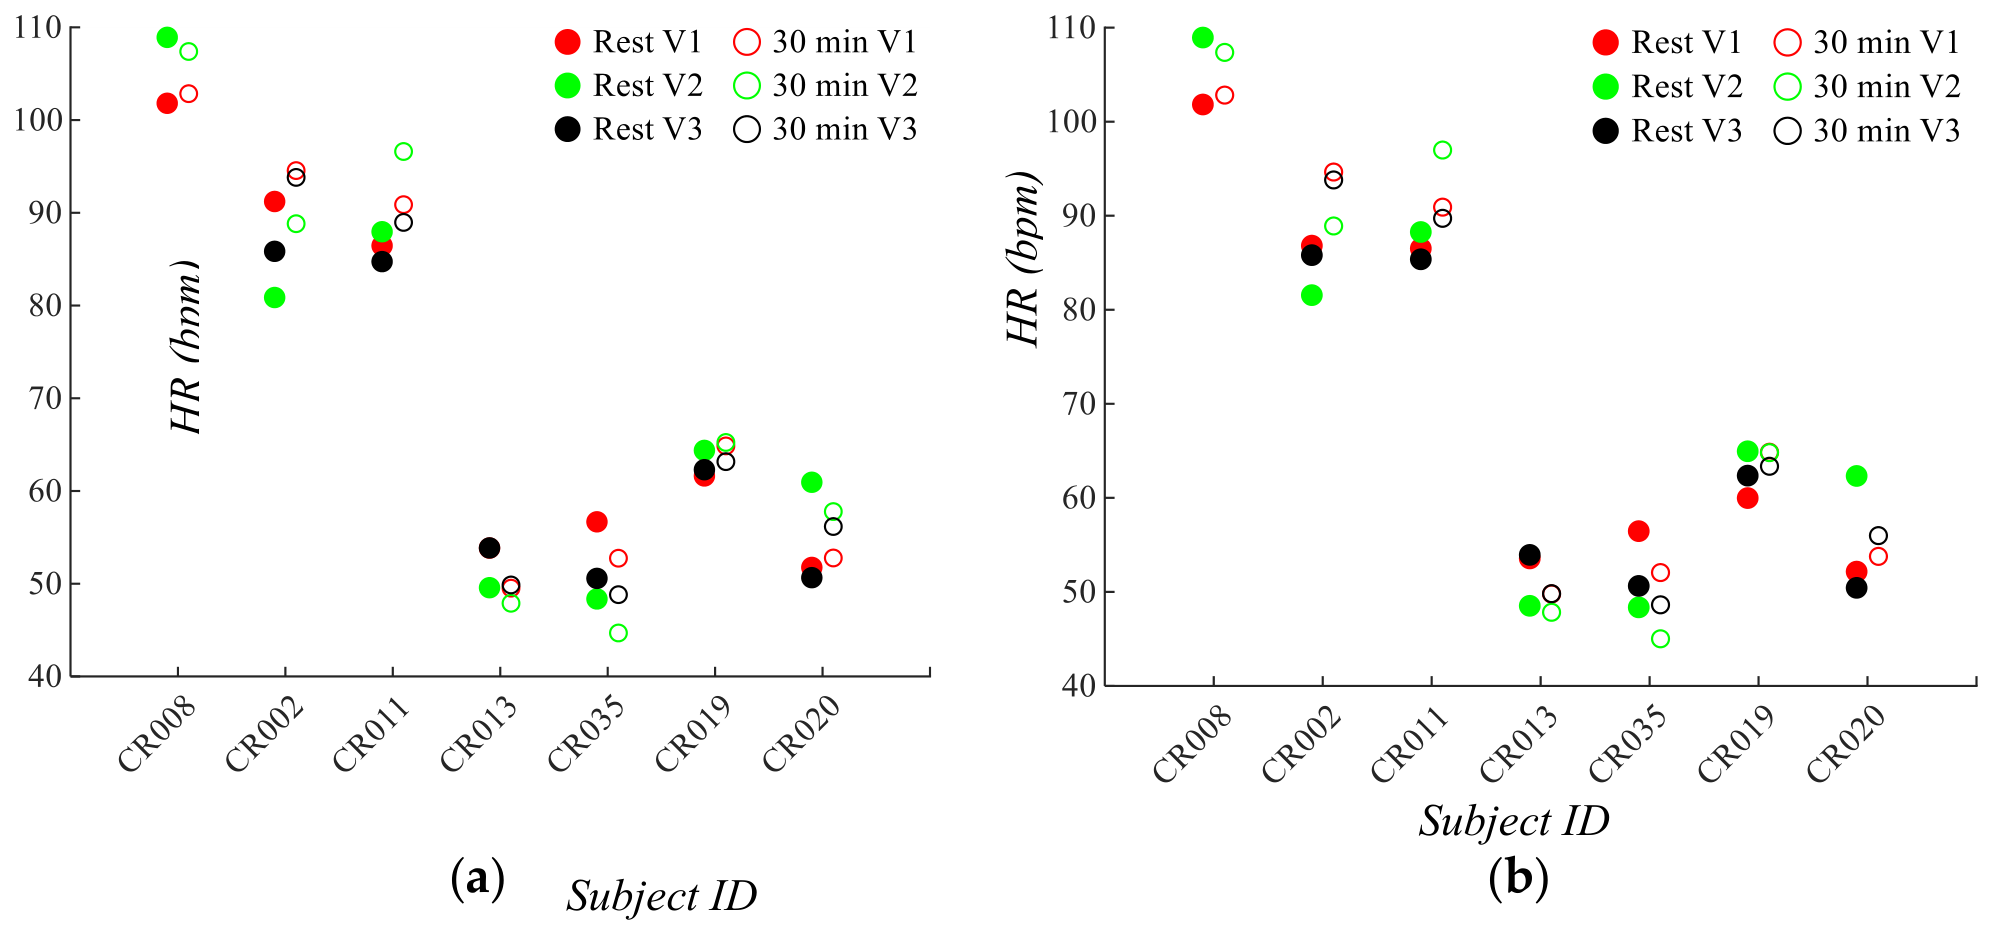
Figure 2.
The largest ΔHR/HR of the subjects in response to exercise (a) RA (b) CA.
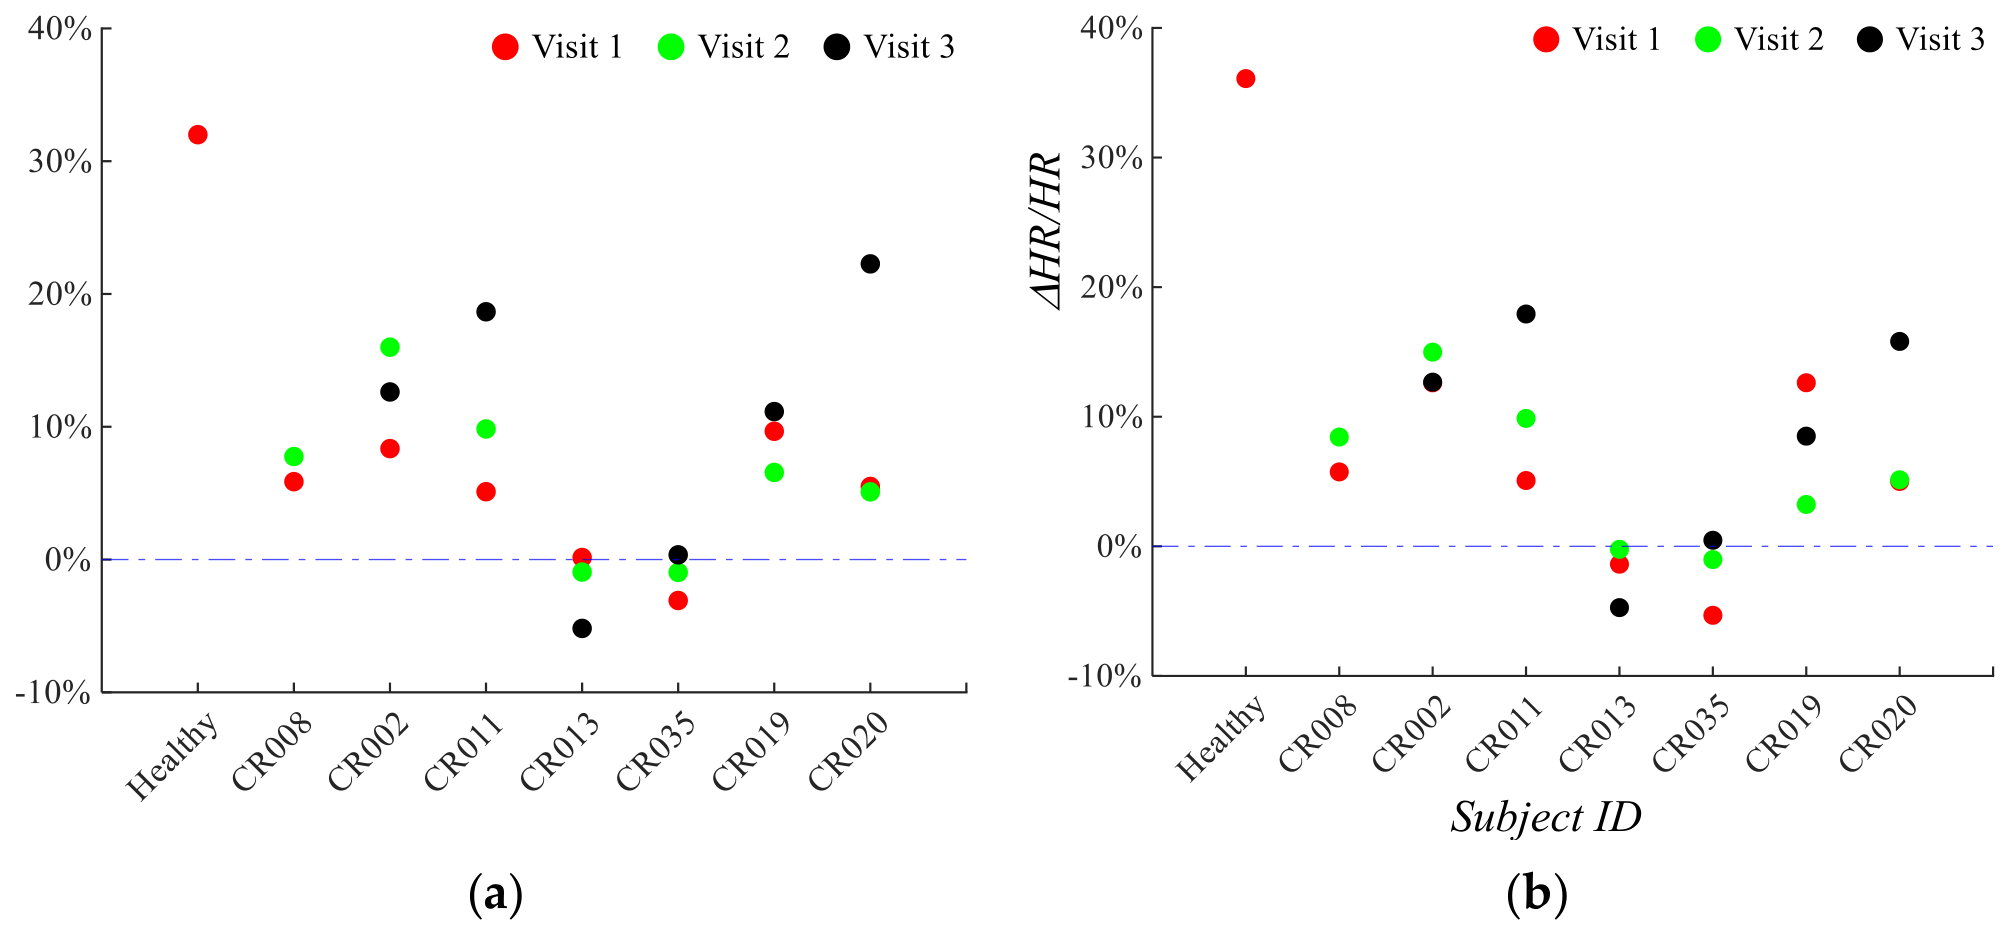
Figure 3.
HRV at-rest of the subjects (a) RA (b) CA.
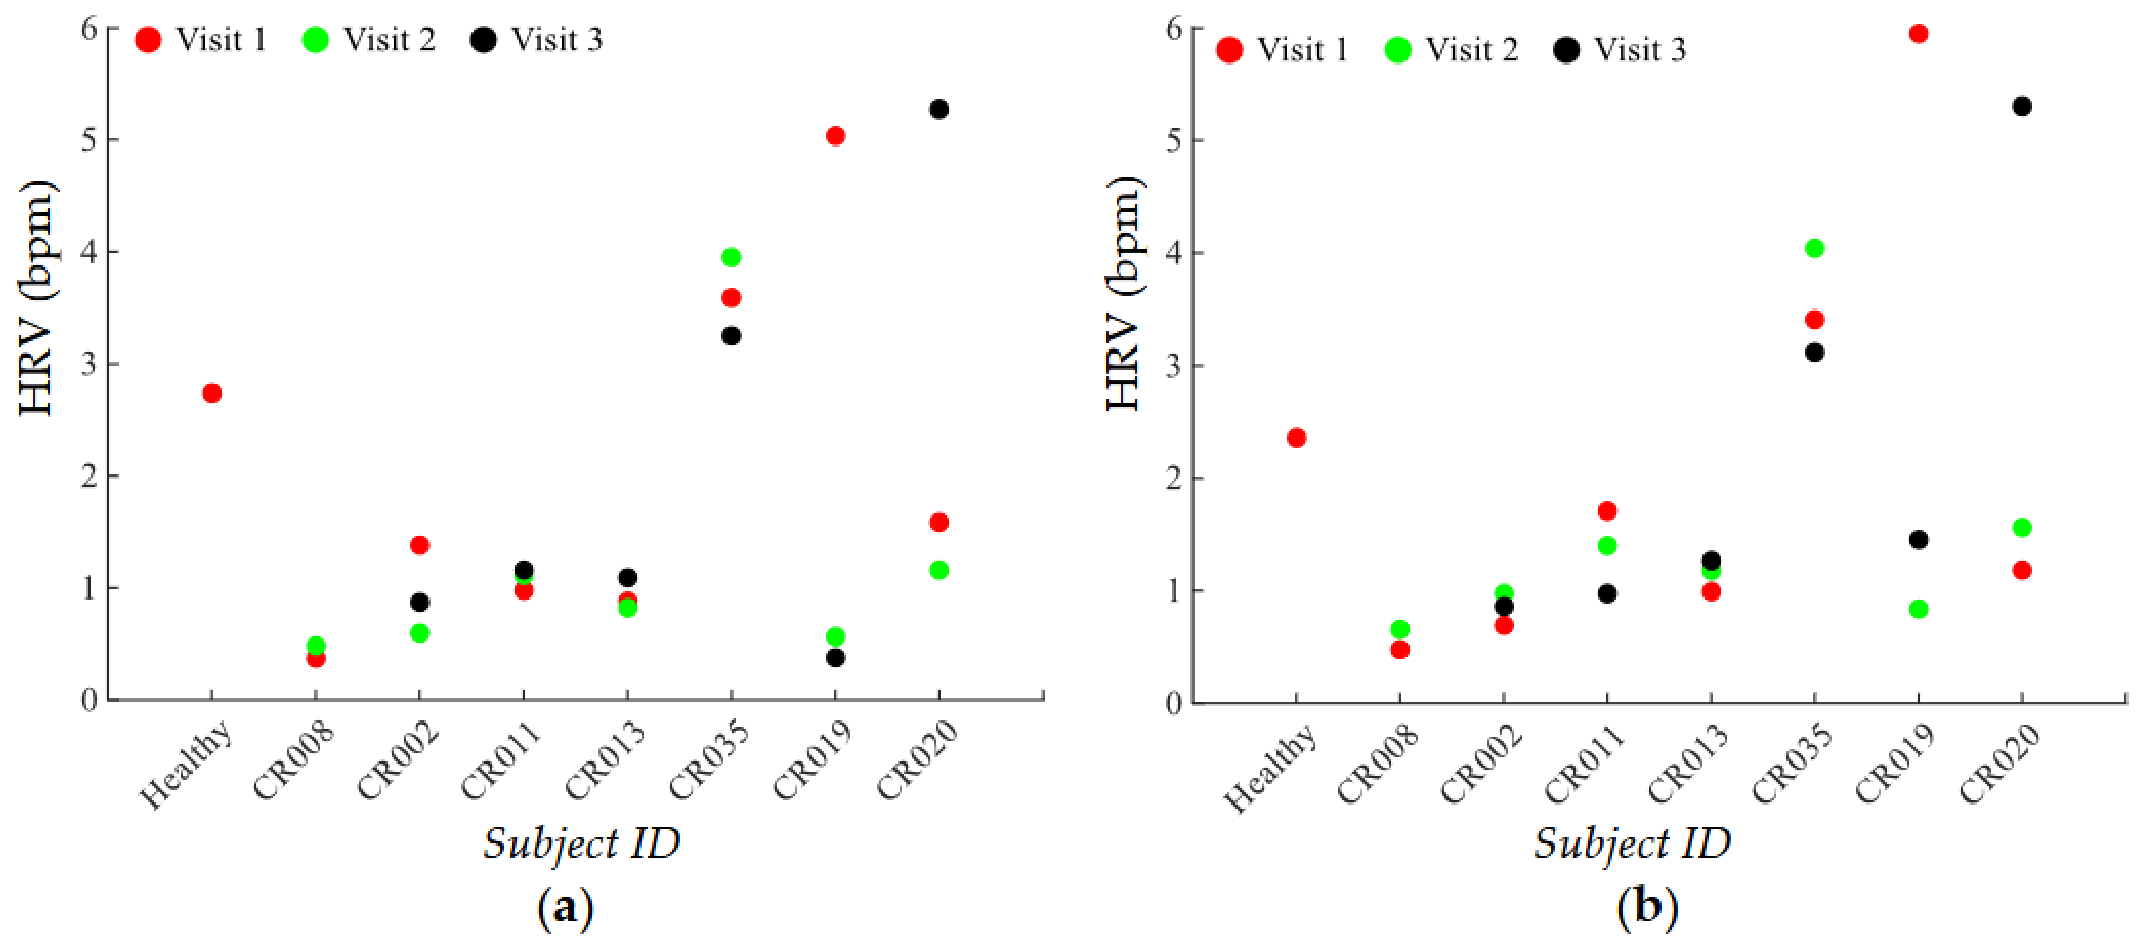
Figure 4.
The contribution of PF-induced HRV, HRVPF/HRV at-rest of the subjects (a) RA (b) CA.
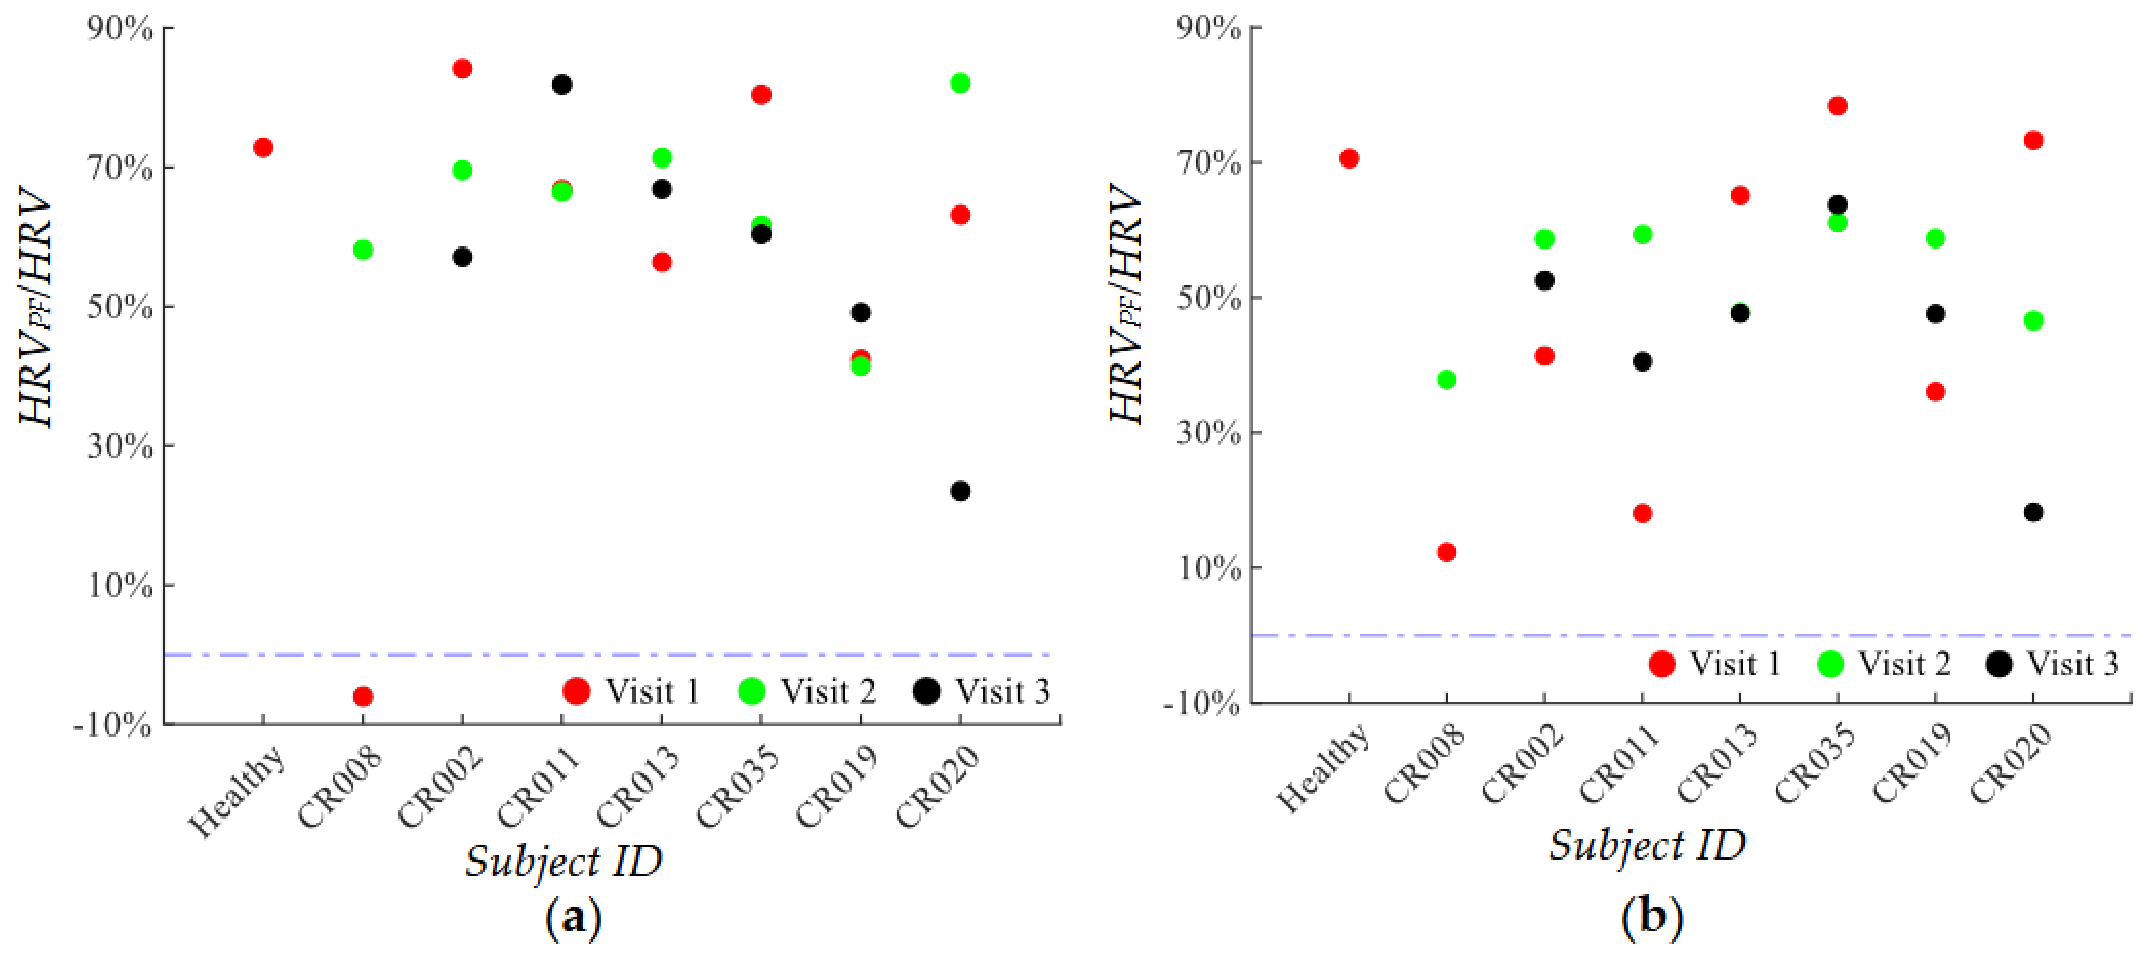
Figure 5.
RR at-rest and 30min post-exercise of the subjects with the mean ± SD (a) RA (b) CA.
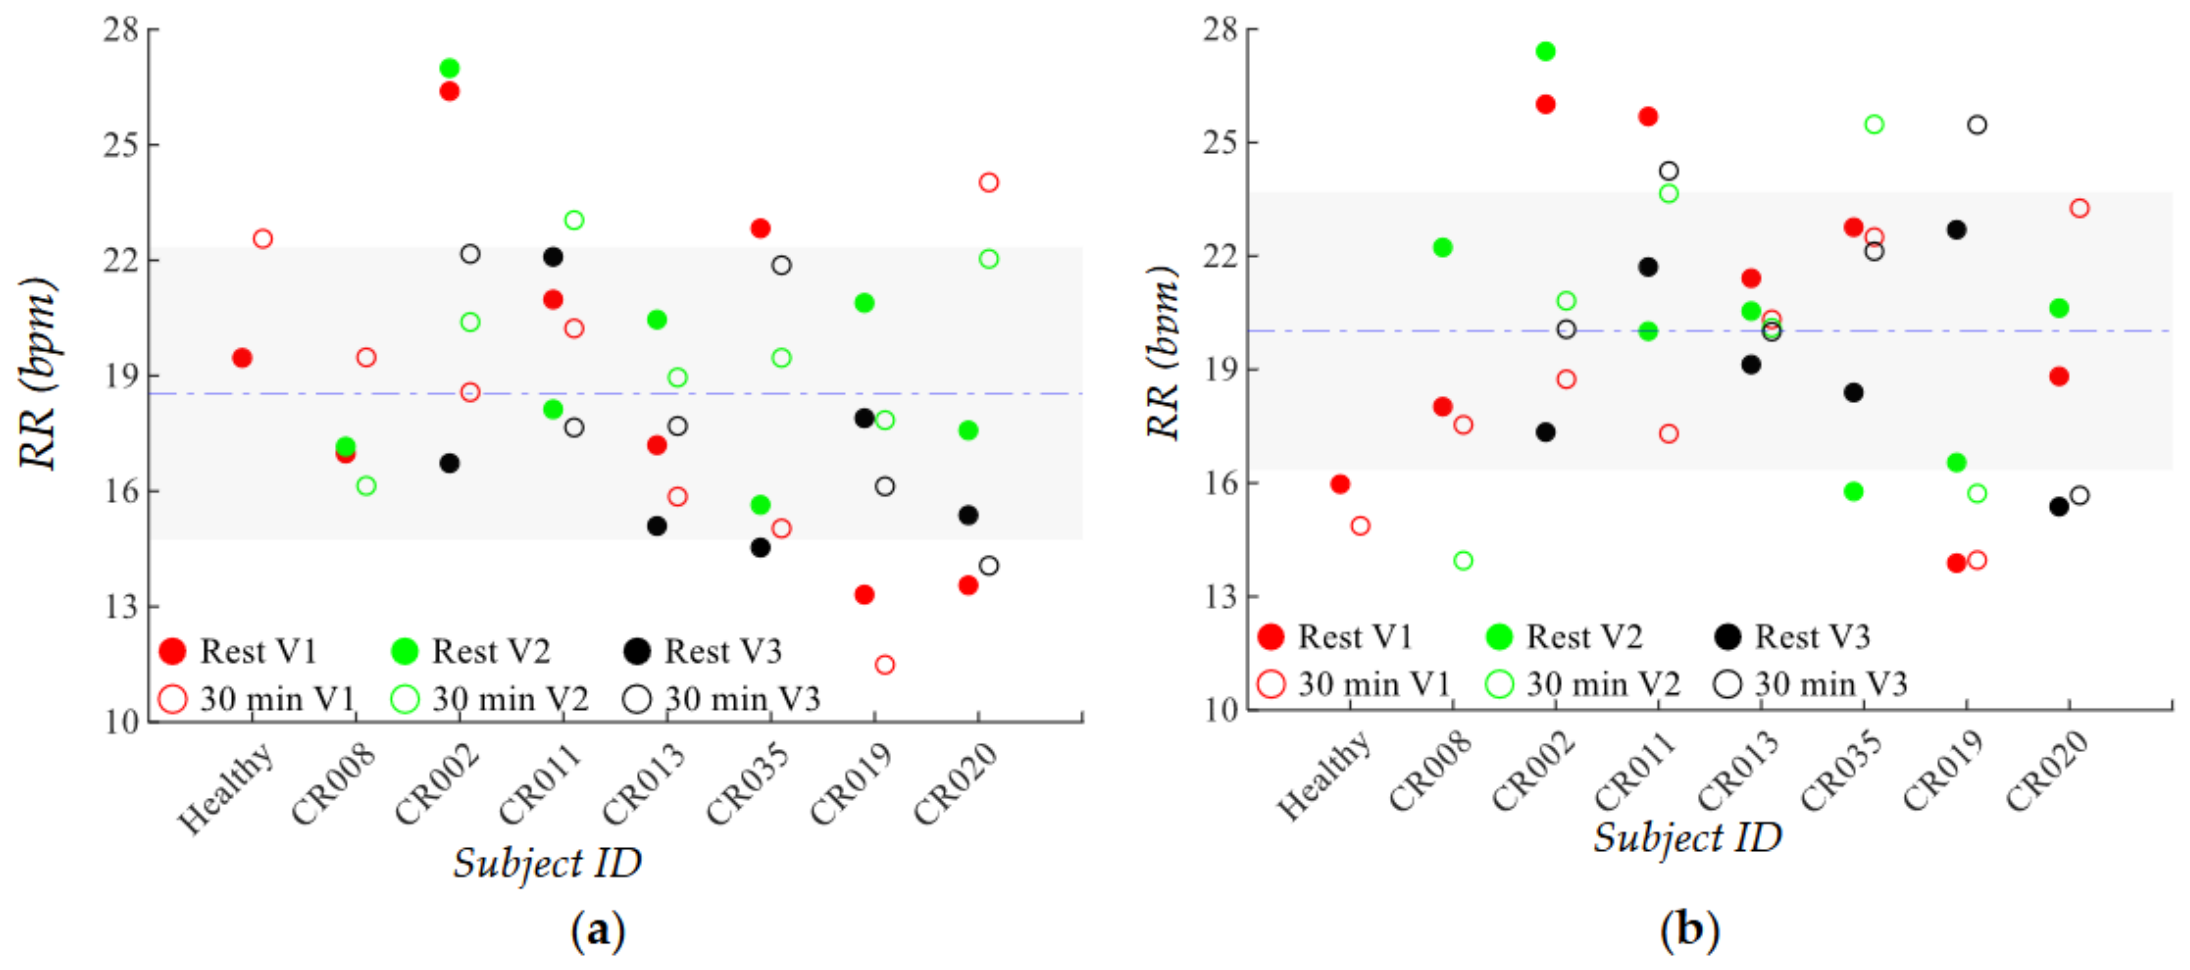
Figure 6.
The RM of the subjects (a) at-rest and 30min post-exercise RM of each harmonic at the RA (b) at-rest and 30min post-exercise RM of each harmonic at the CA (c) averaged RM at-rest and 30min post-exercise at the RA.
Figure 6.
The RM of the subjects (a) at-rest and 30min post-exercise RM of each harmonic at the RA (b) at-rest and 30min post-exercise RM of each harmonic at the CA (c) averaged RM at-rest and 30min post-exercise at the RA.
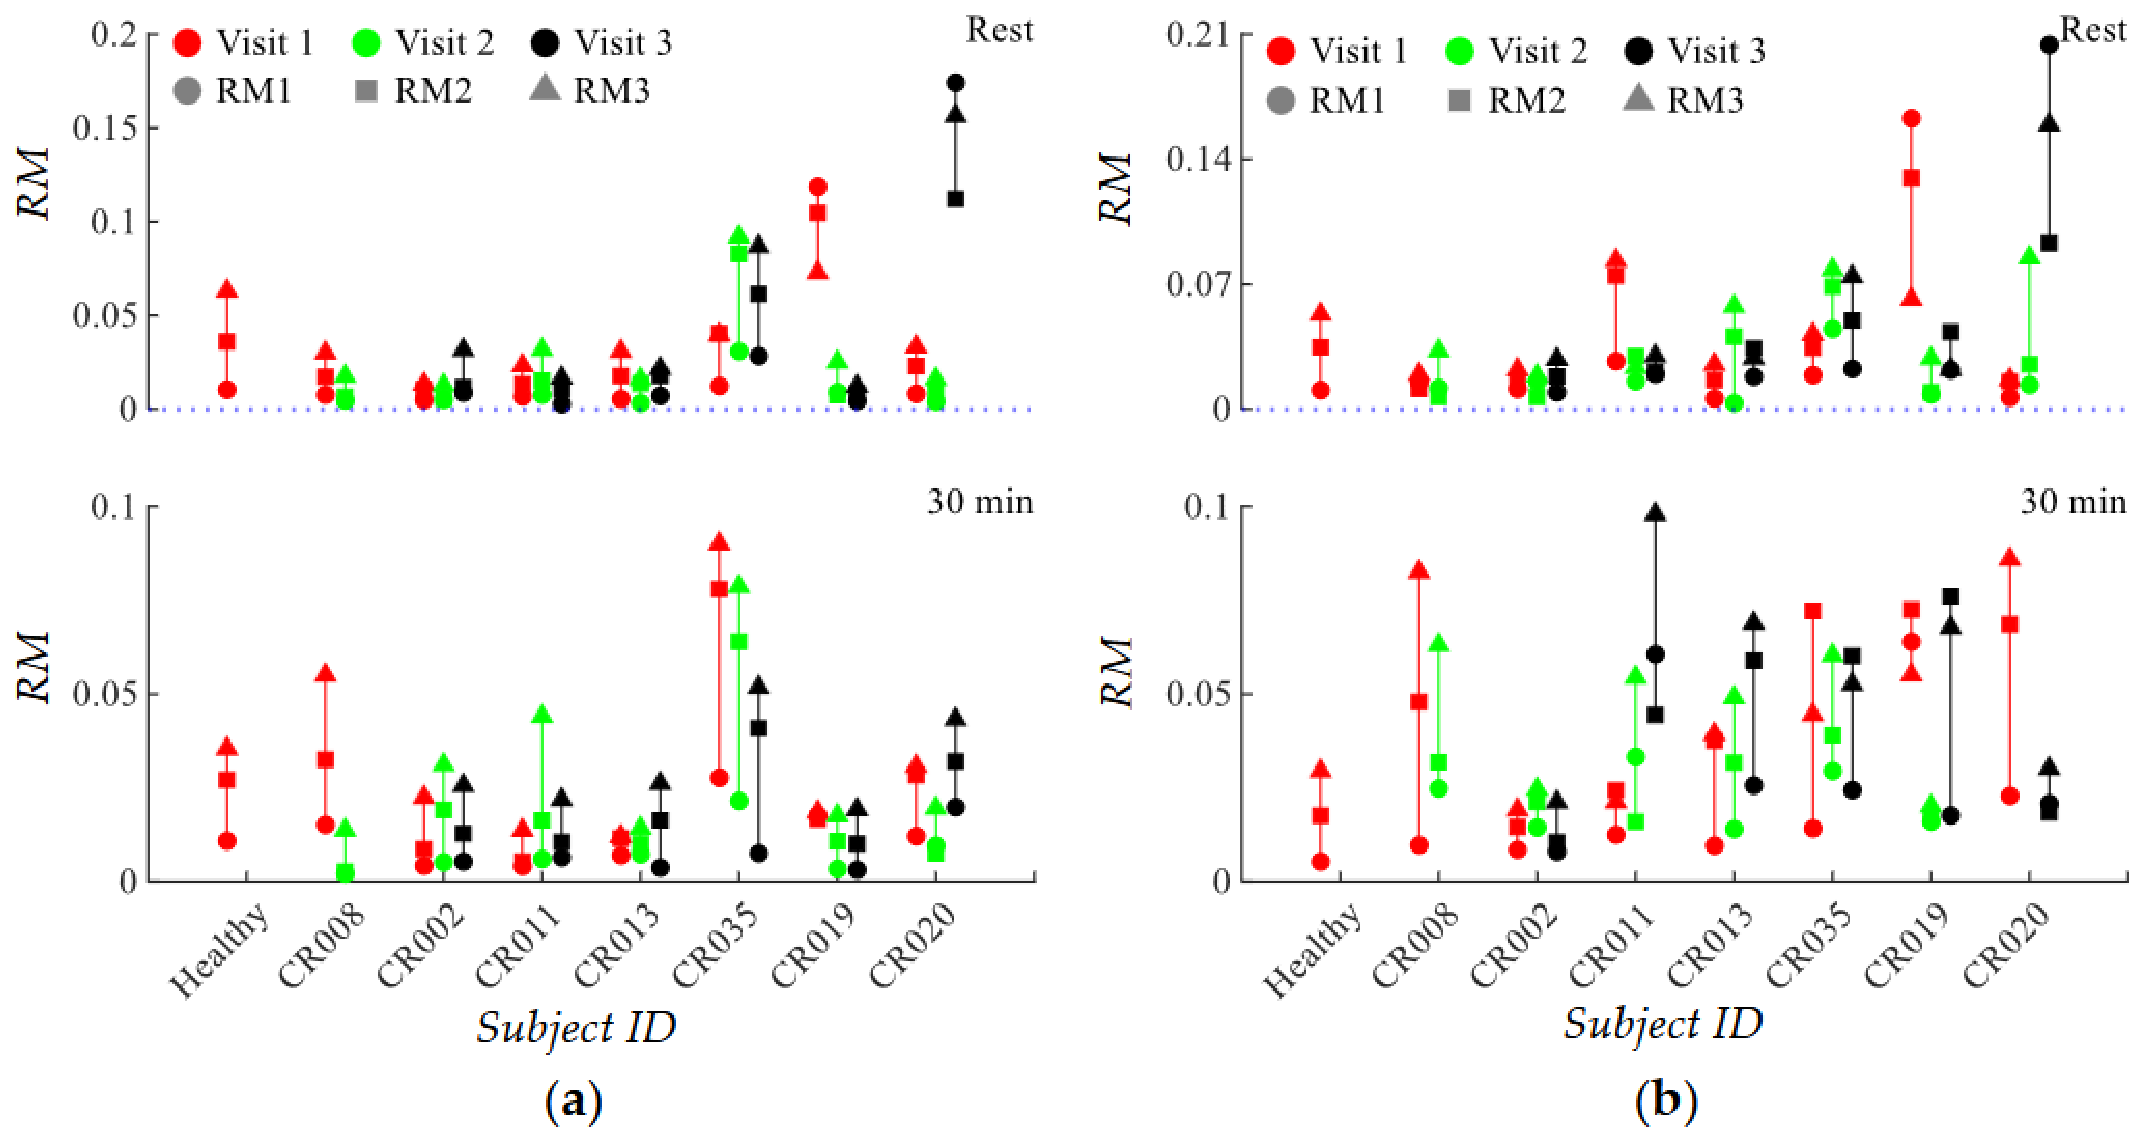
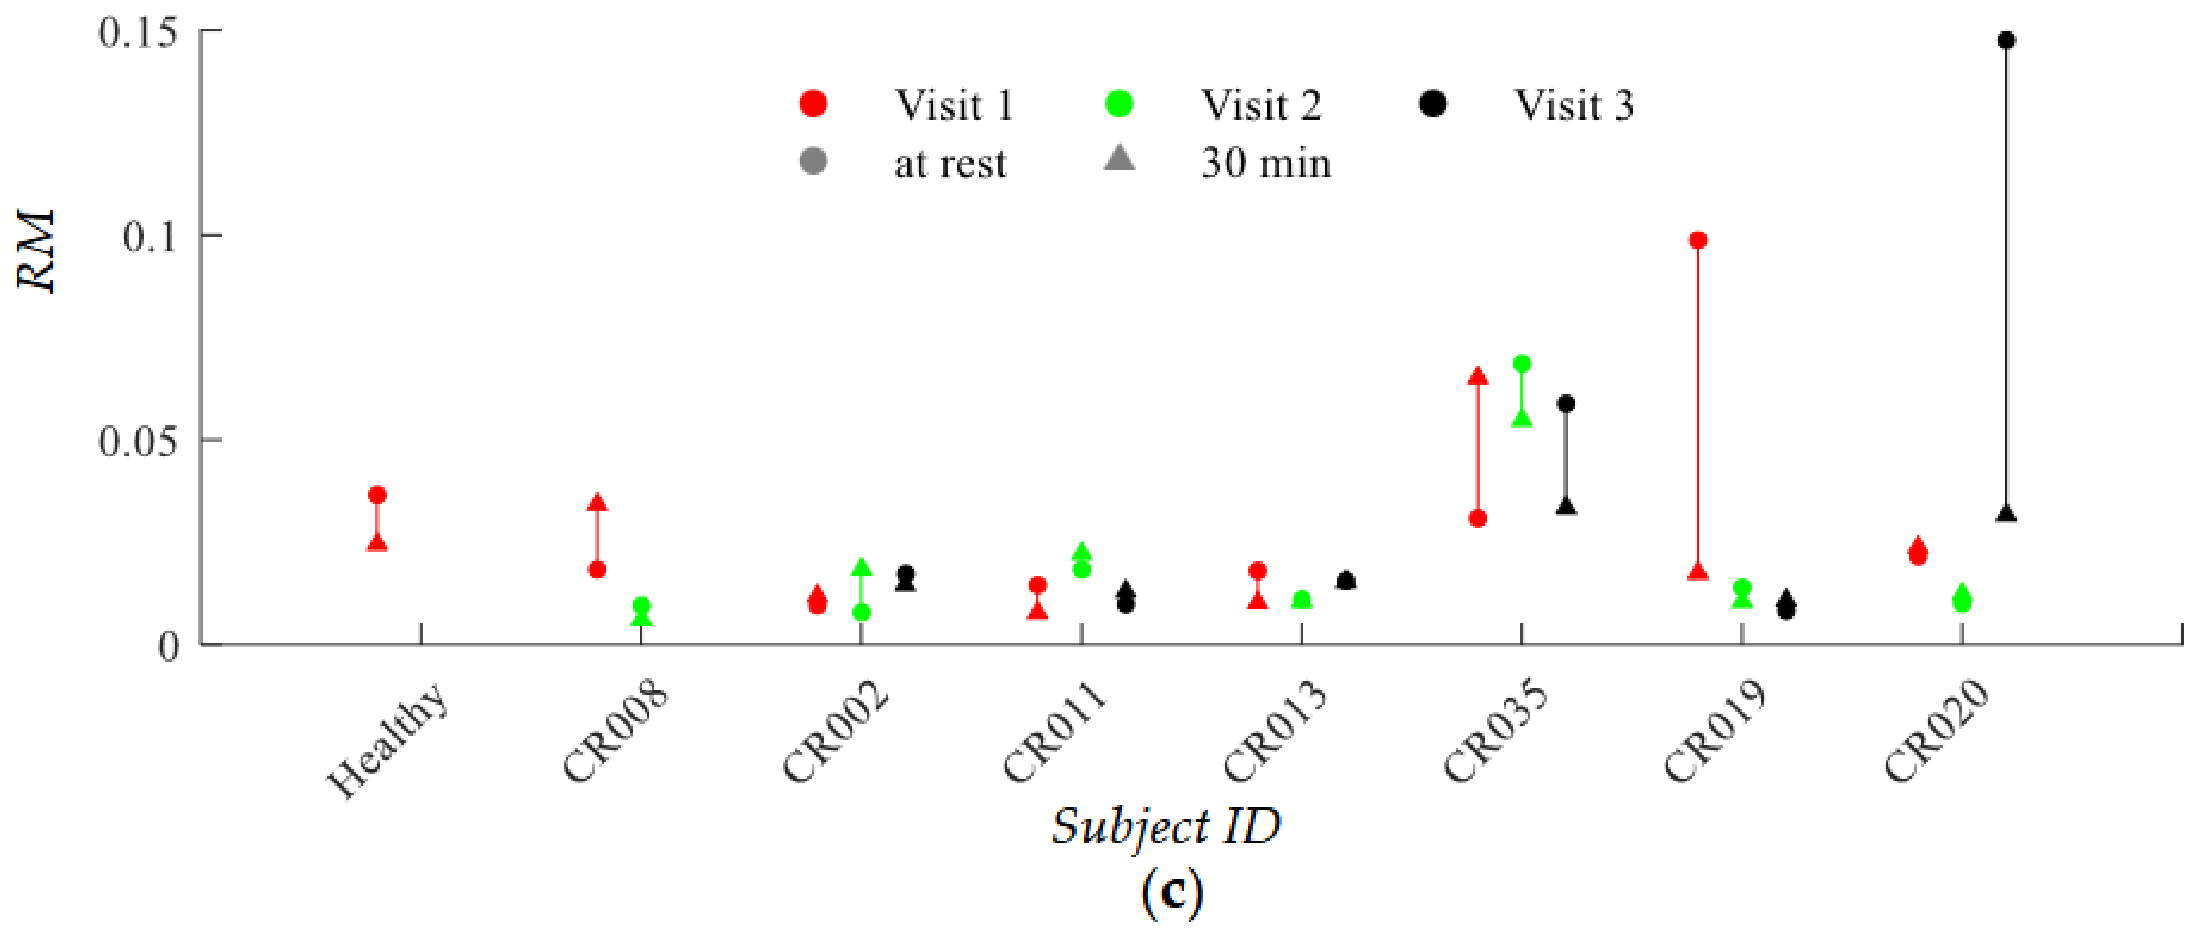
Figure 7.
Harmonic amplitudes in response to exercise, at-rest, 5min and 10min post-exercise of the subjects across three visists (left figure: RA; right right figure: CA) (a) 2nd harmonic (b) 3rd harmonic (c) 4th harmonic (d) 5th harmonic (e) 6th harmonic (f) 7th harmonic.
Figure 8.
Cross-subject comparison of normalized harmonic amplitude profiling (a) Visit 1 (b) Visit 2 (c) Visit 3 (note that Ai and ΔAi denote the ith normalized harmonic amplitude at-rest and the ith normalized harmonic change 5min post-exercise, relative to at-rest).
Figure 8.
Cross-subject comparison of normalized harmonic amplitude profiling (a) Visit 1 (b) Visit 2 (c) Visit 3 (note that Ai and ΔAi denote the ith normalized harmonic amplitude at-rest and the ith normalized harmonic change 5min post-exercise, relative to at-rest).
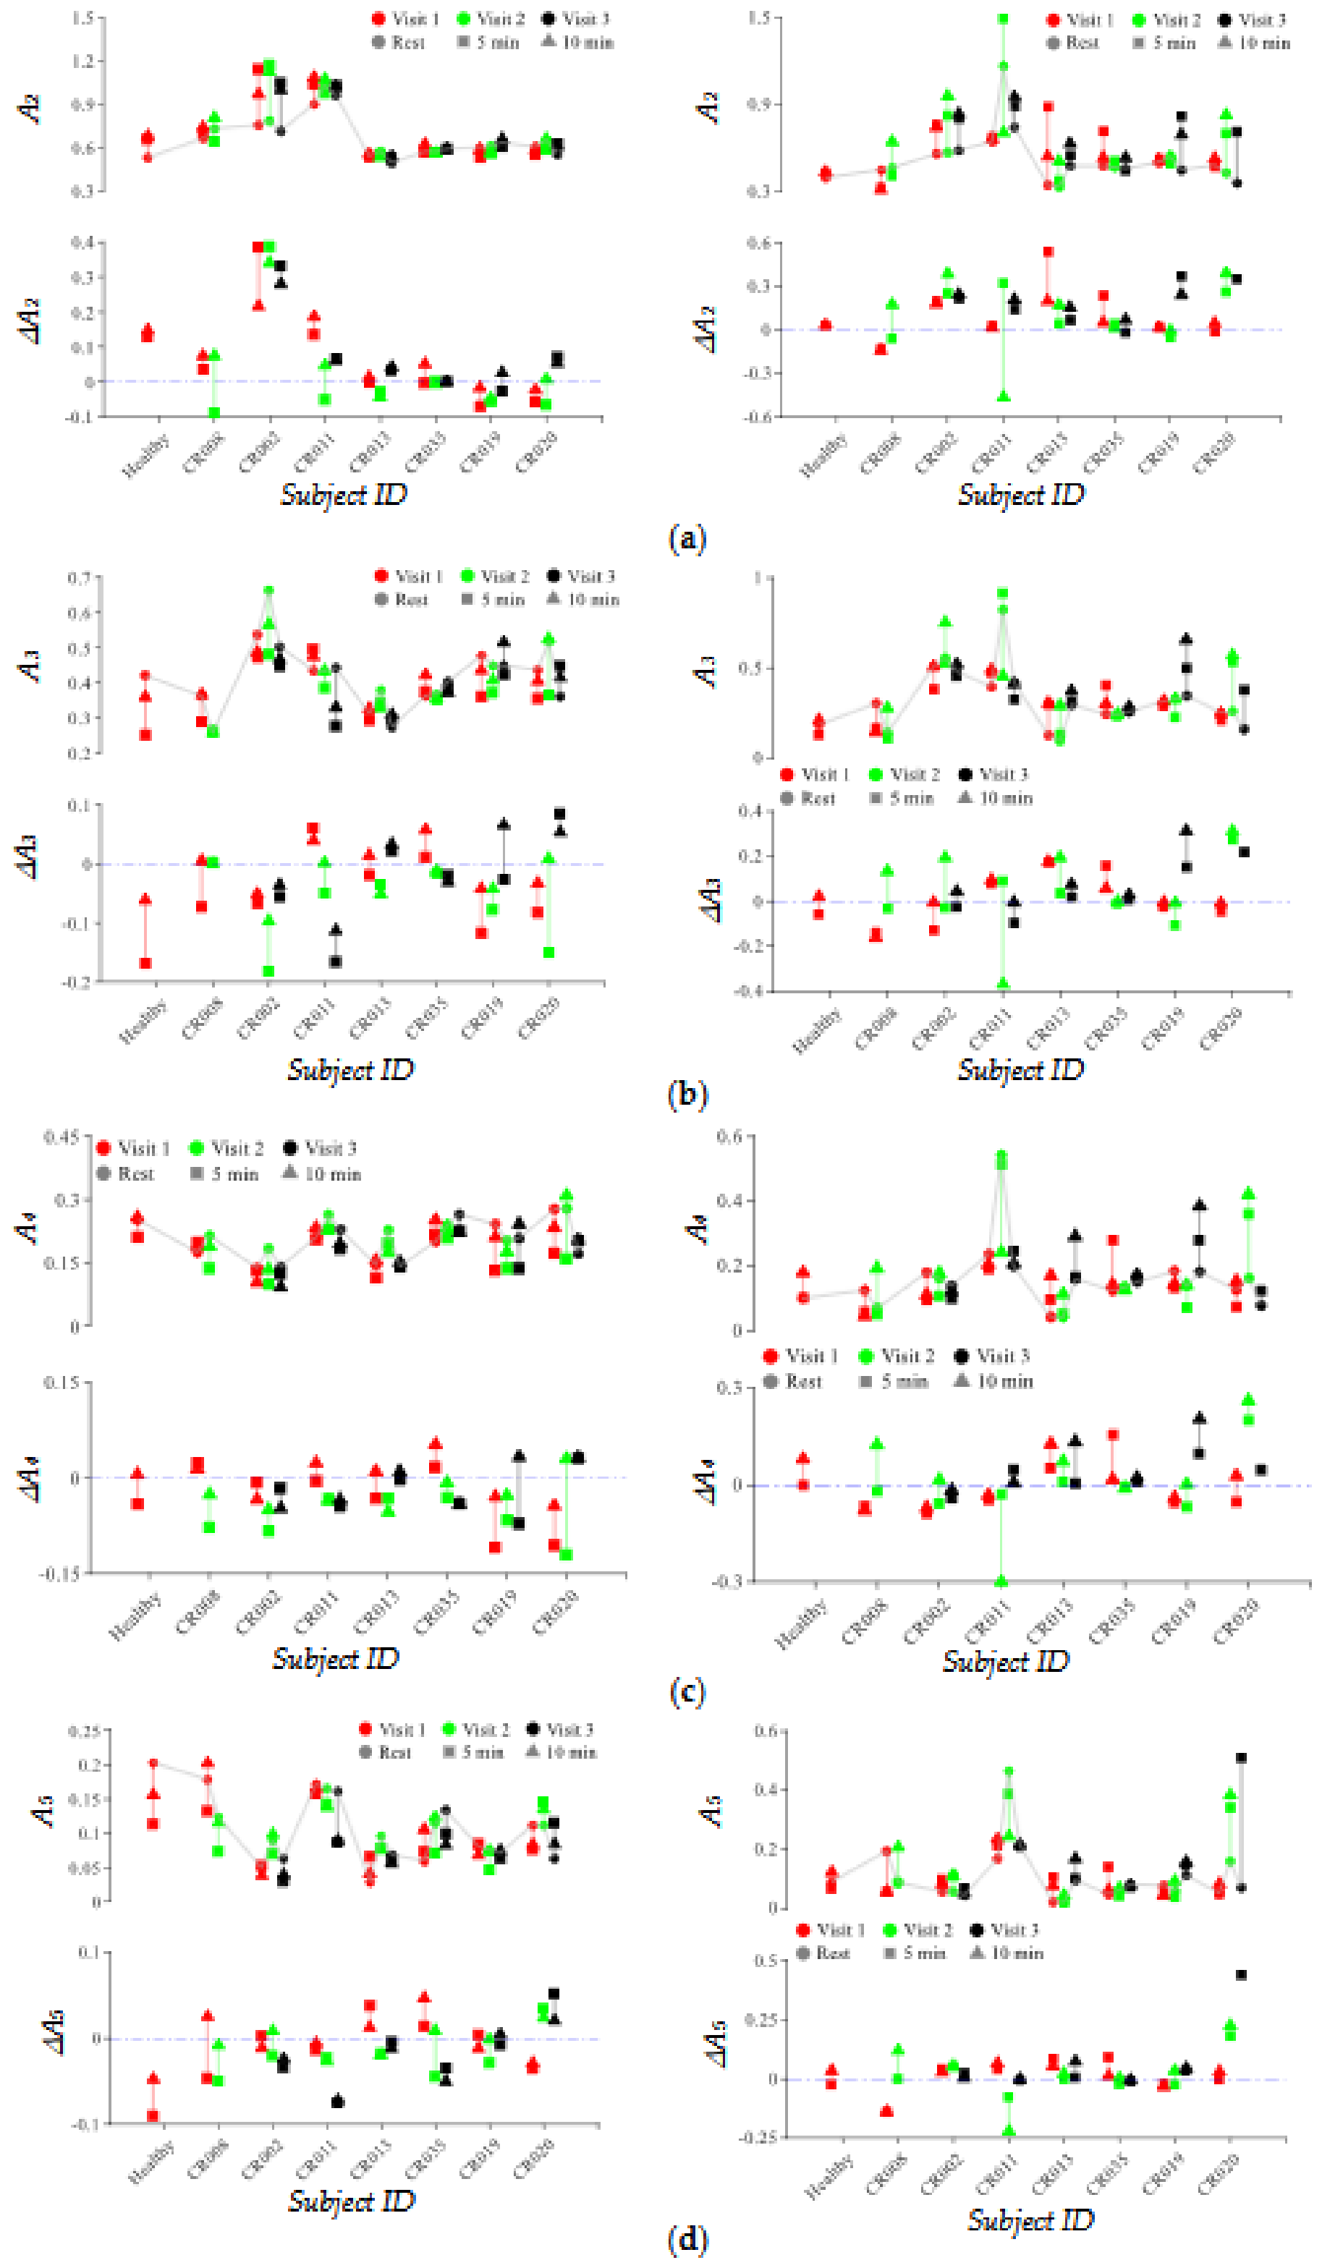
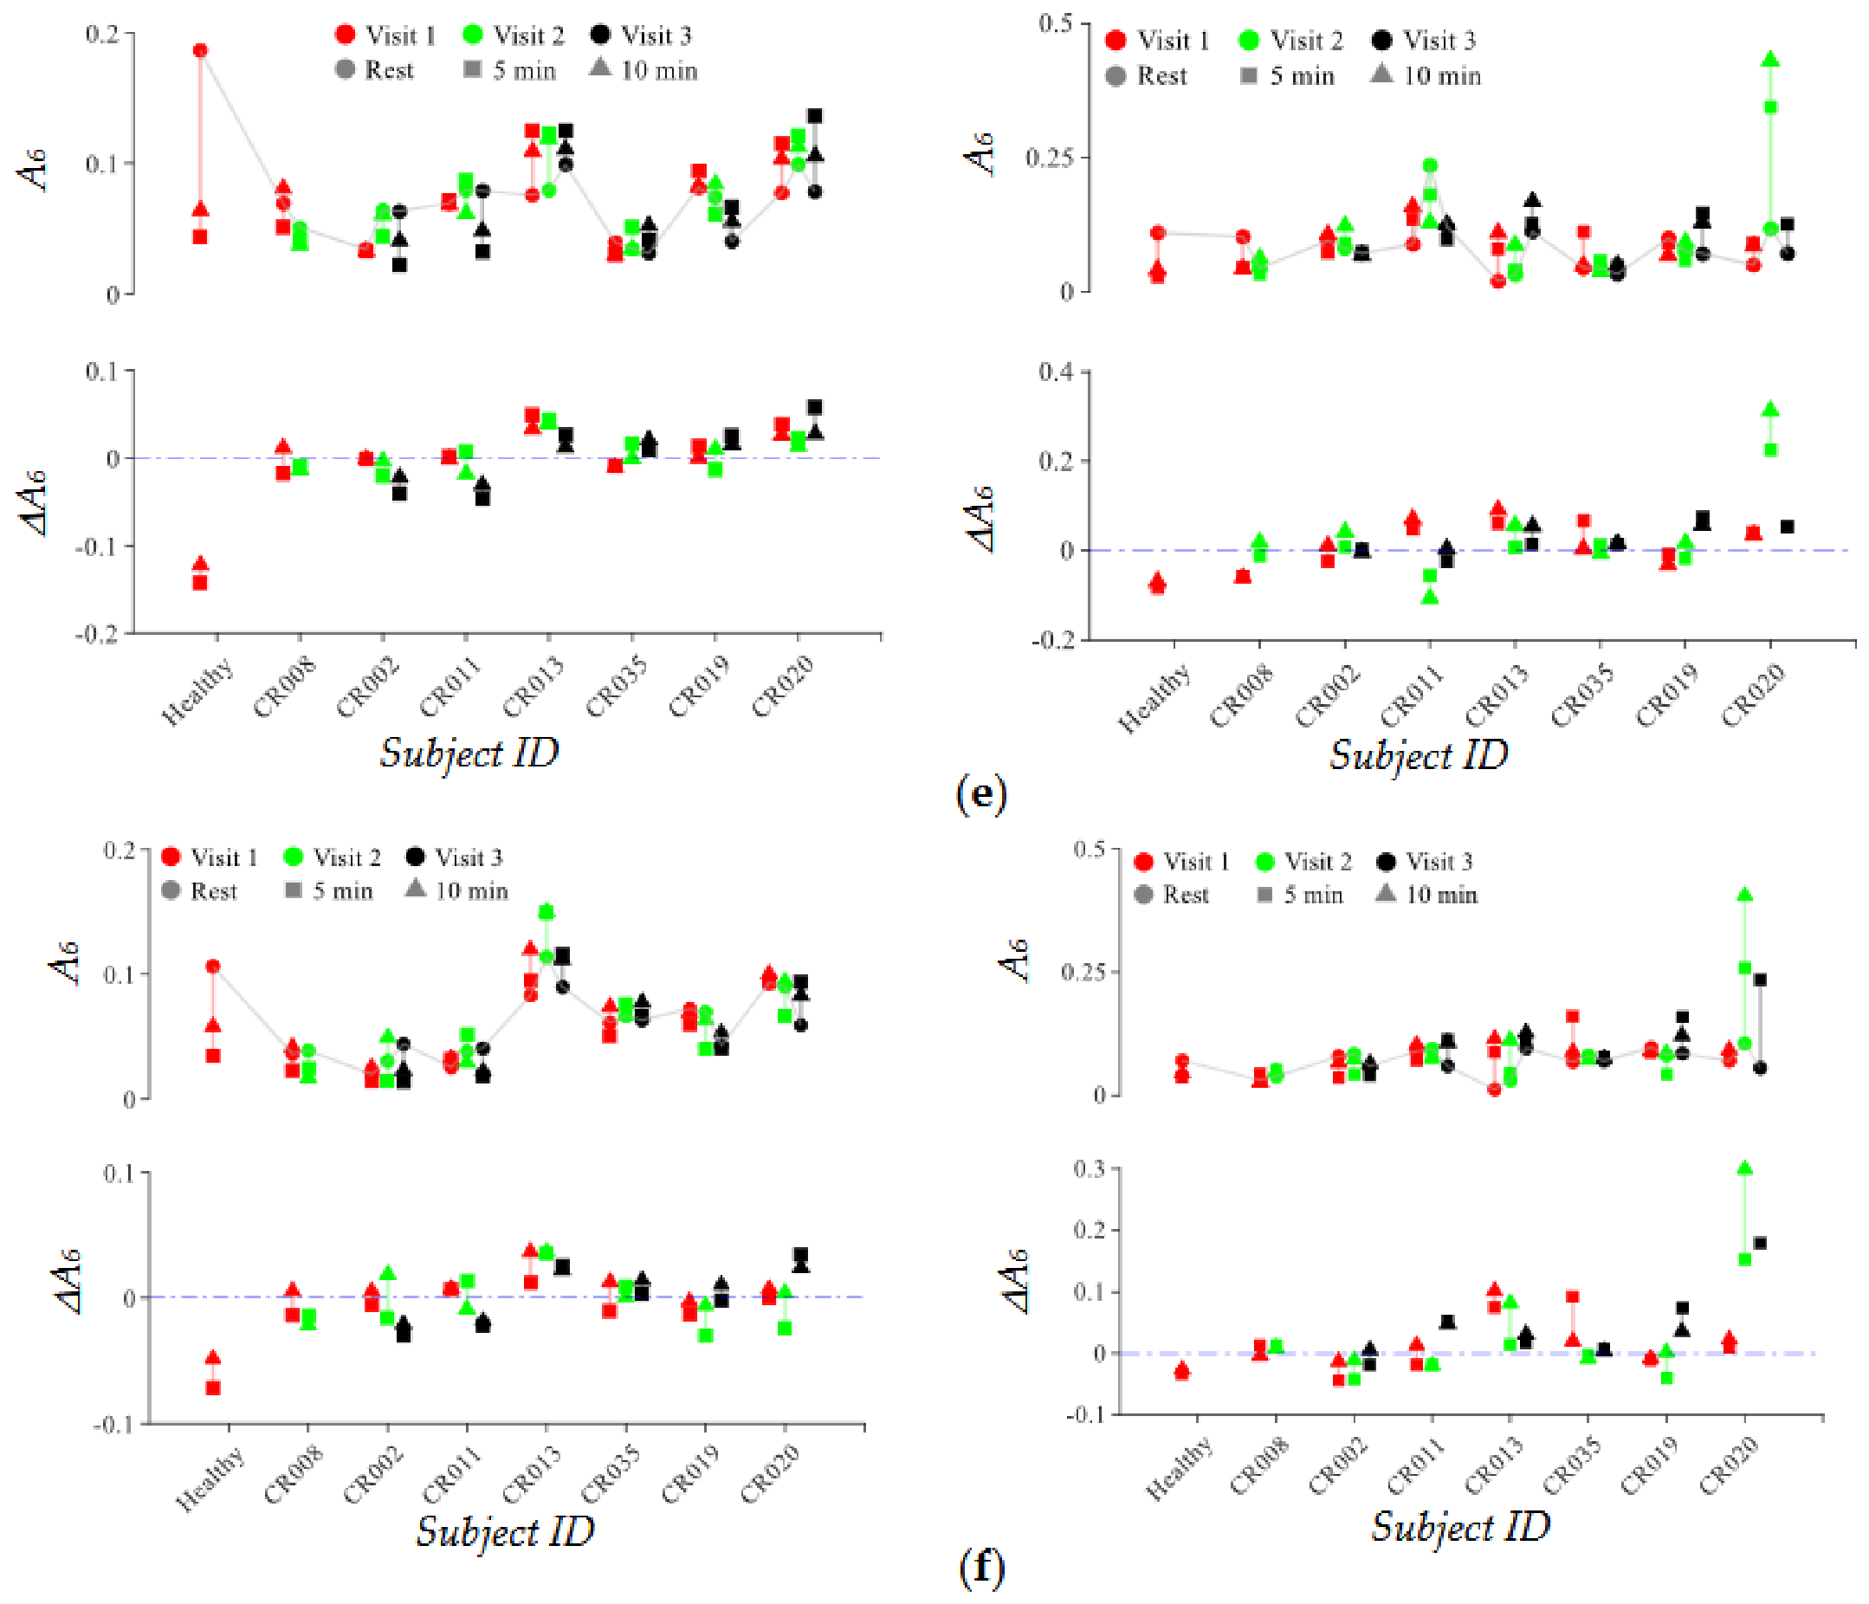
Figure 9.
Longitudinal changes of normalized harmonic amplitude profiling (a) CR029 (APAC) (b) CR041 (AF) (note that Ai and ΔAi denote the ith normalized harmonic amplitude at-rest and the ith normalized harmonic change 5min post-exercise, relative to at-rest and ΔHR/HR is also included.).
Figure 9.
Longitudinal changes of normalized harmonic amplitude profiling (a) CR029 (APAC) (b) CR041 (AF) (note that Ai and ΔAi denote the ith normalized harmonic amplitude at-rest and the ith normalized harmonic change 5min post-exercise, relative to at-rest and ΔHR/HR is also included.).
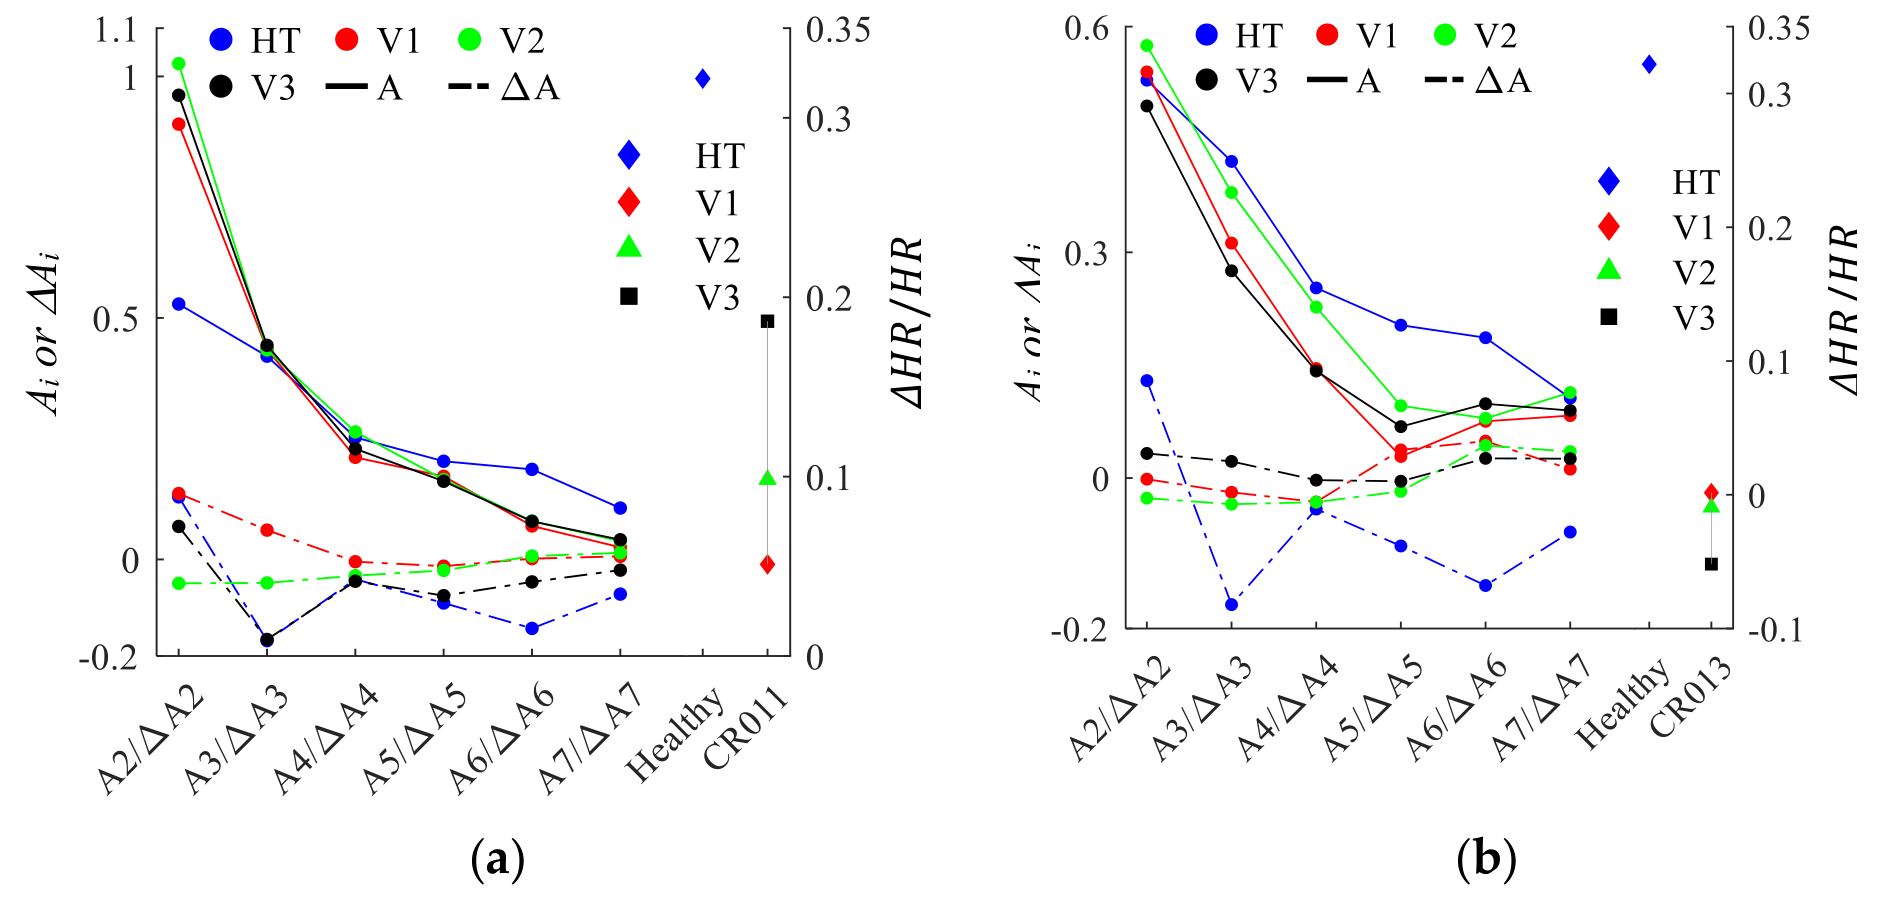
Figure 10.
Normalized APW at-rest of the subjects at the RA (left figure) and CA (right figure) (a) CR008 (b) CR002 (c) CR011 (d) CR013 (e) CR035 (f) CR019 (g) CR020.
Figure 10.
Normalized APW at-rest of the subjects at the RA (left figure) and CA (right figure) (a) CR008 (b) CR002 (c) CR011 (d) CR013 (e) CR035 (f) CR019 (g) CR020.
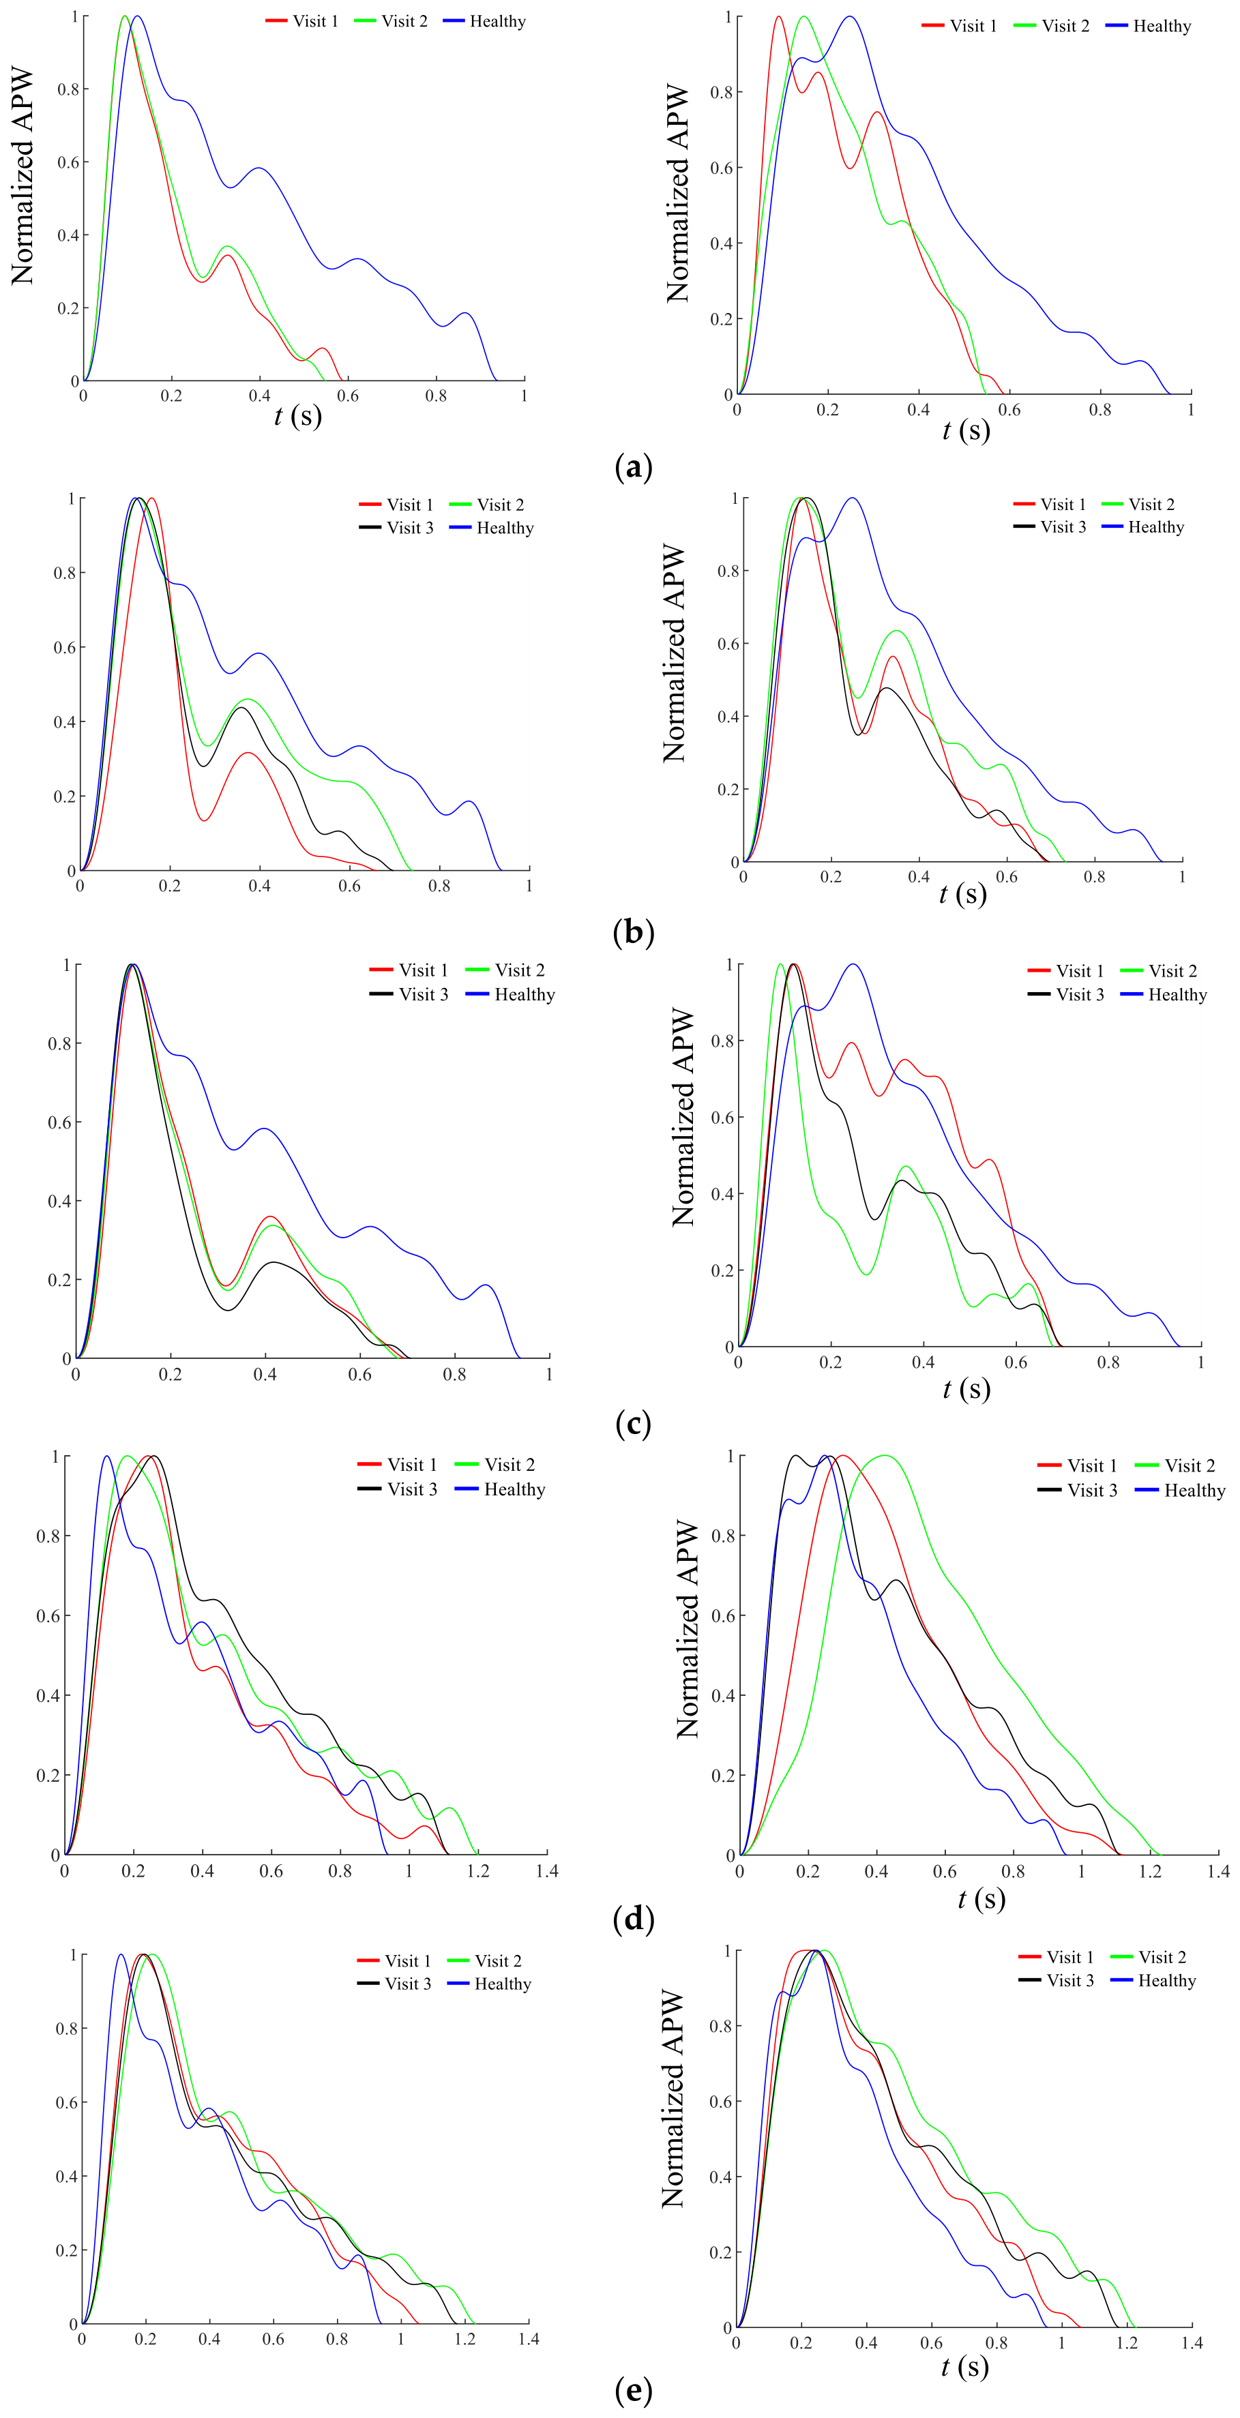
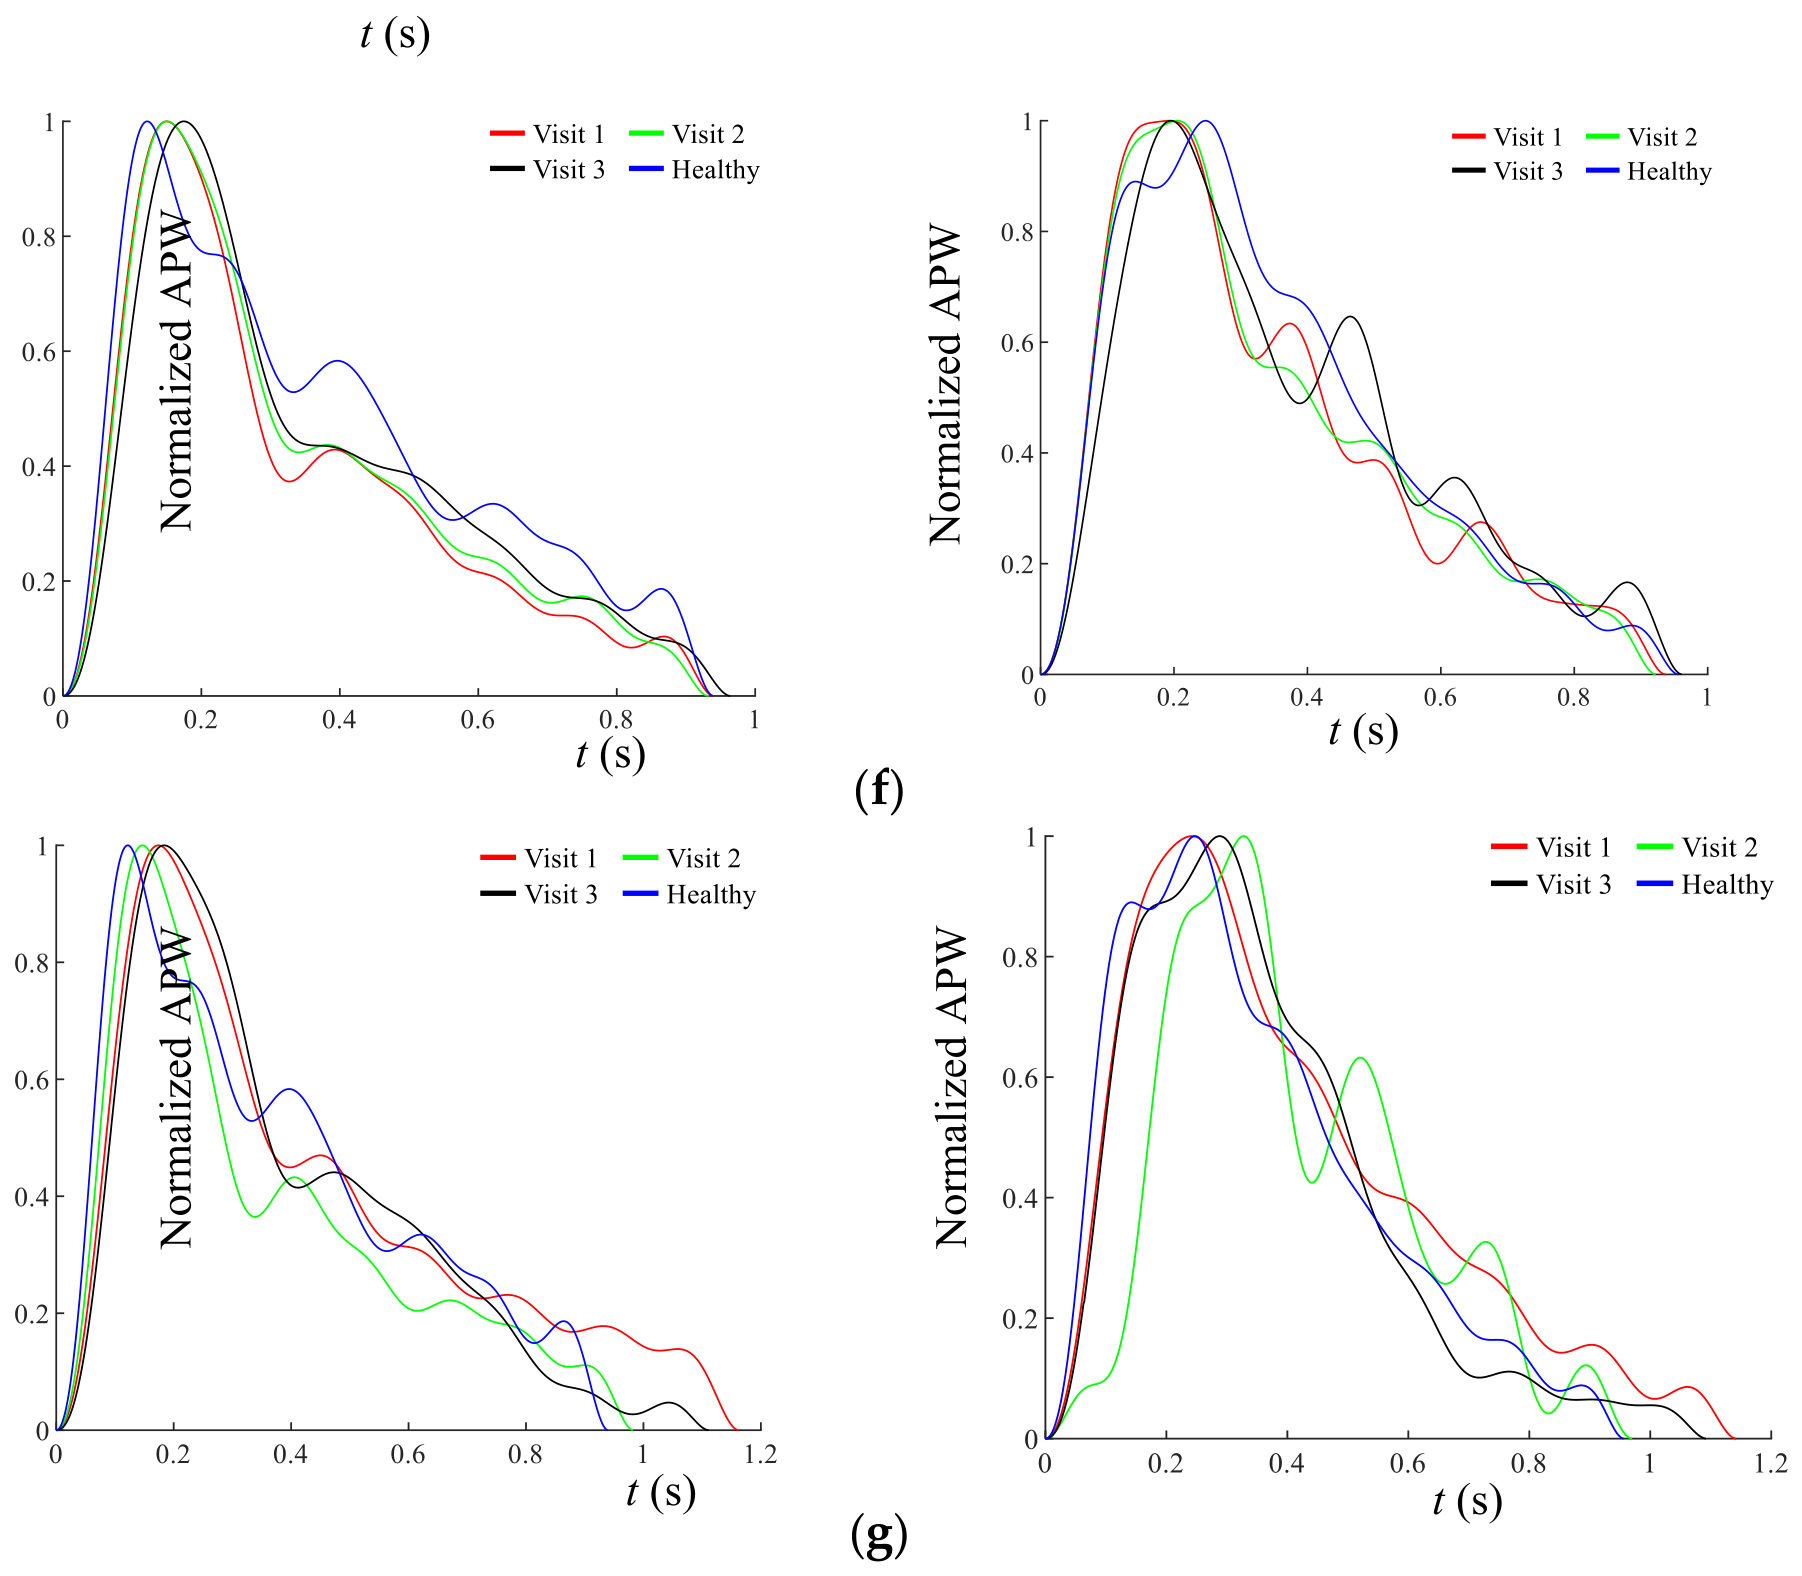
Figure 11.
Measured arterial pulse signals at the RA of CR019 at-rest (a) Visit 1 (b) Visit 2 (c) Visit 3.
Figure 11.
Measured arterial pulse signals at the RA of CR019 at-rest (a) Visit 1 (b) Visit 2 (c) Visit 3.
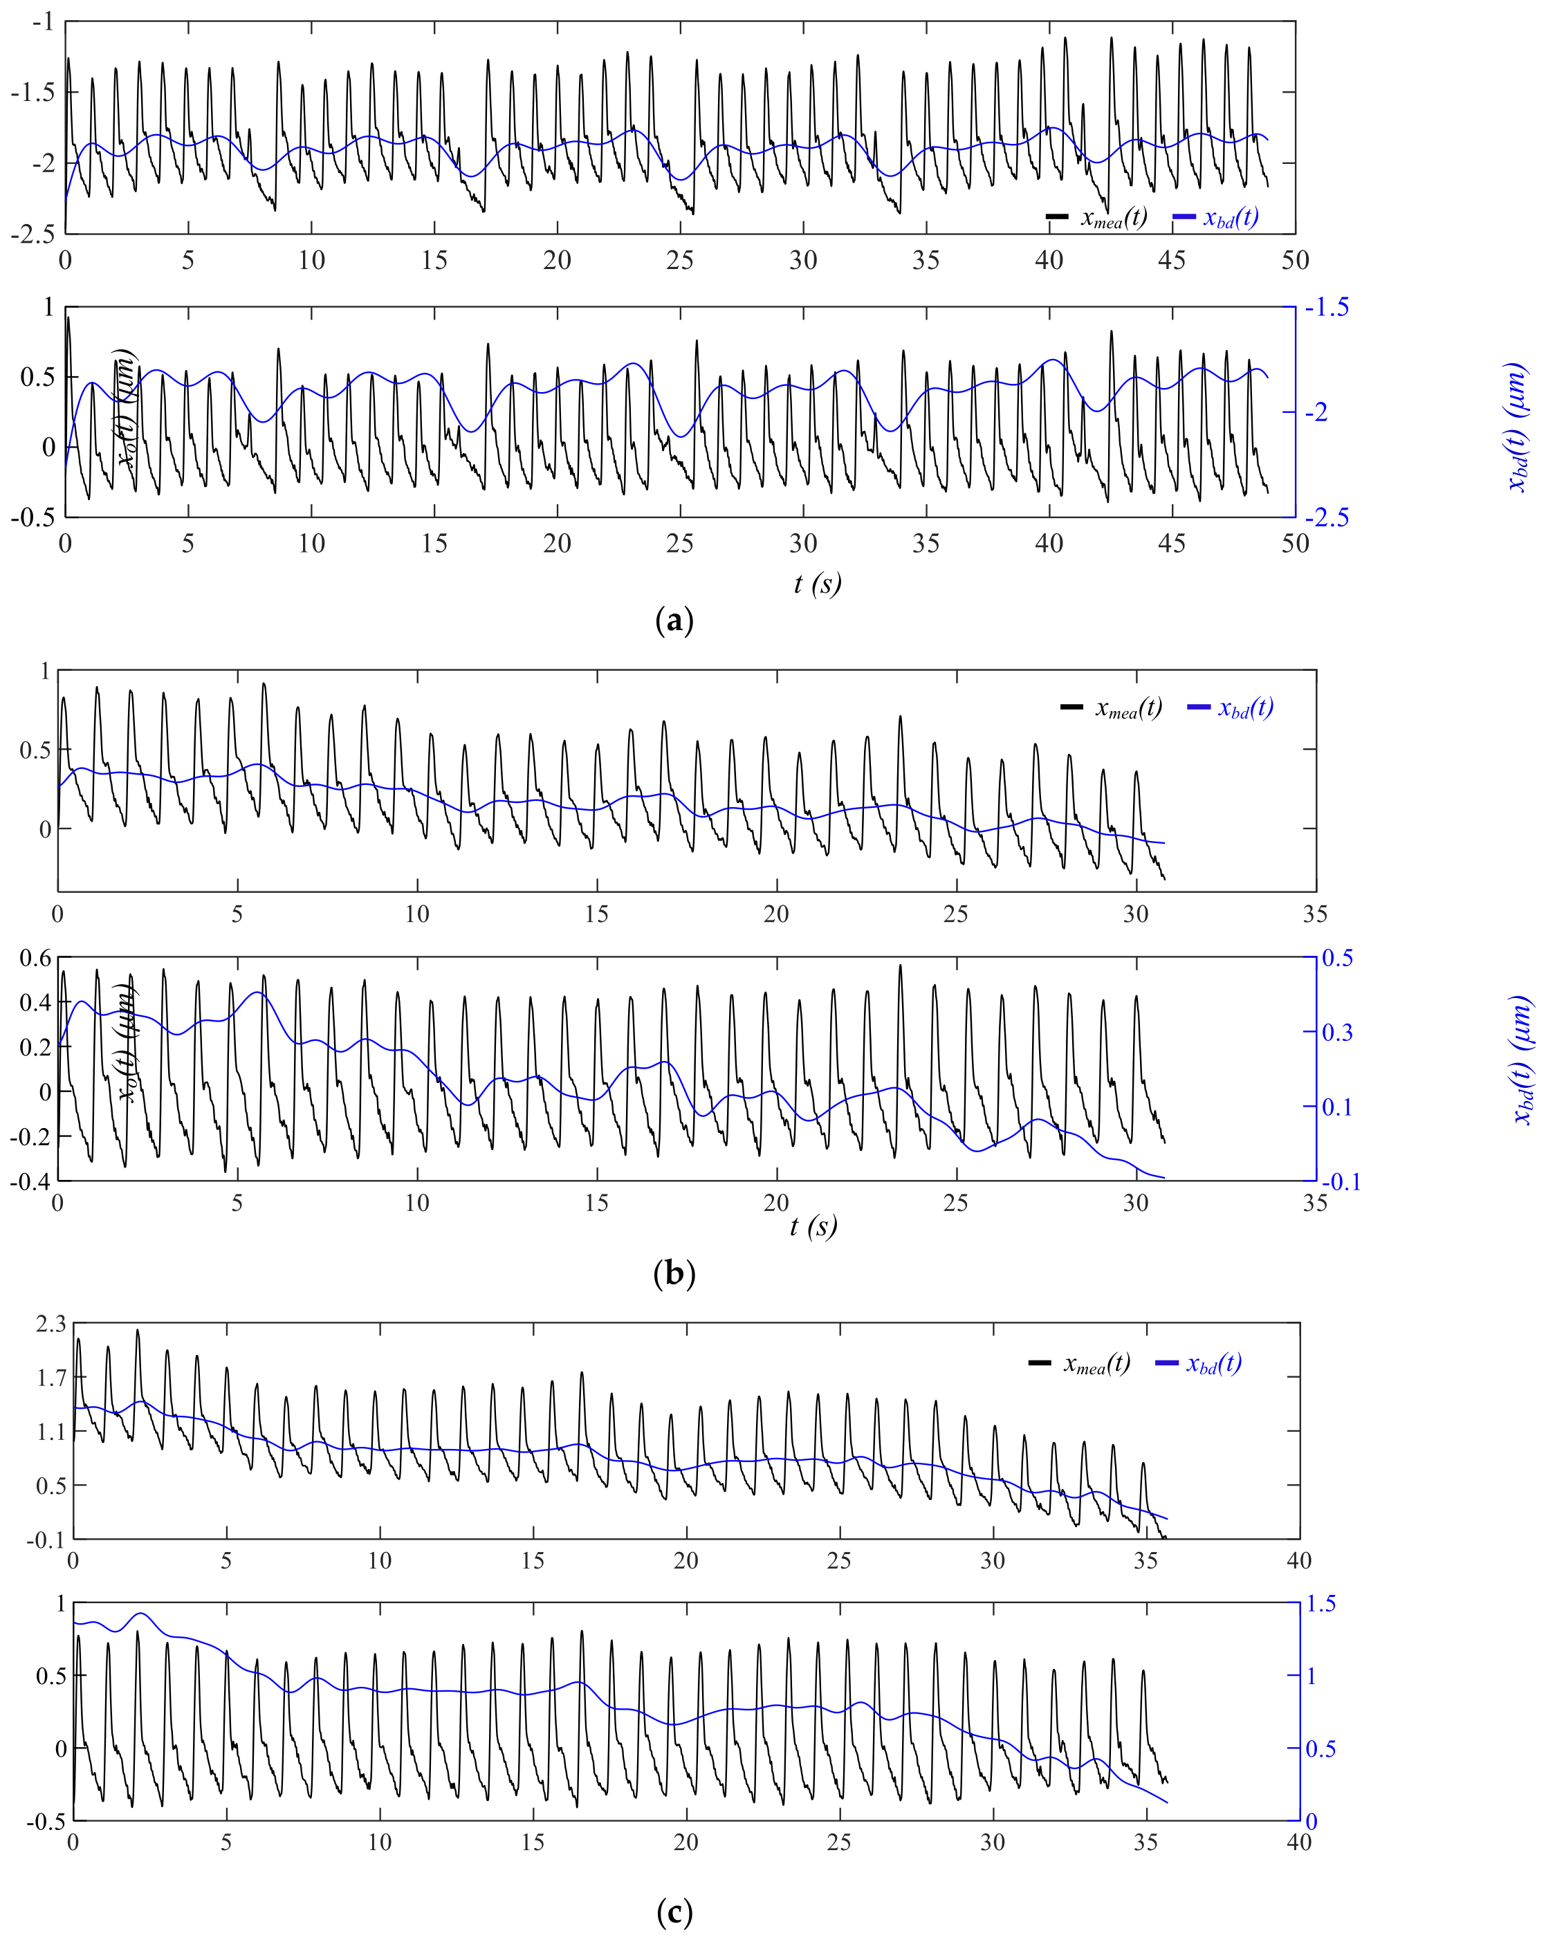
Figure 12.
Measured arterial pulse signals at the RA of CR020 at-rest (a) Visit 1 (b) Visit 2 (c) Visit 3.
Figure 12.
Measured arterial pulse signals at the RA of CR020 at-rest (a) Visit 1 (b) Visit 2 (c) Visit 3.
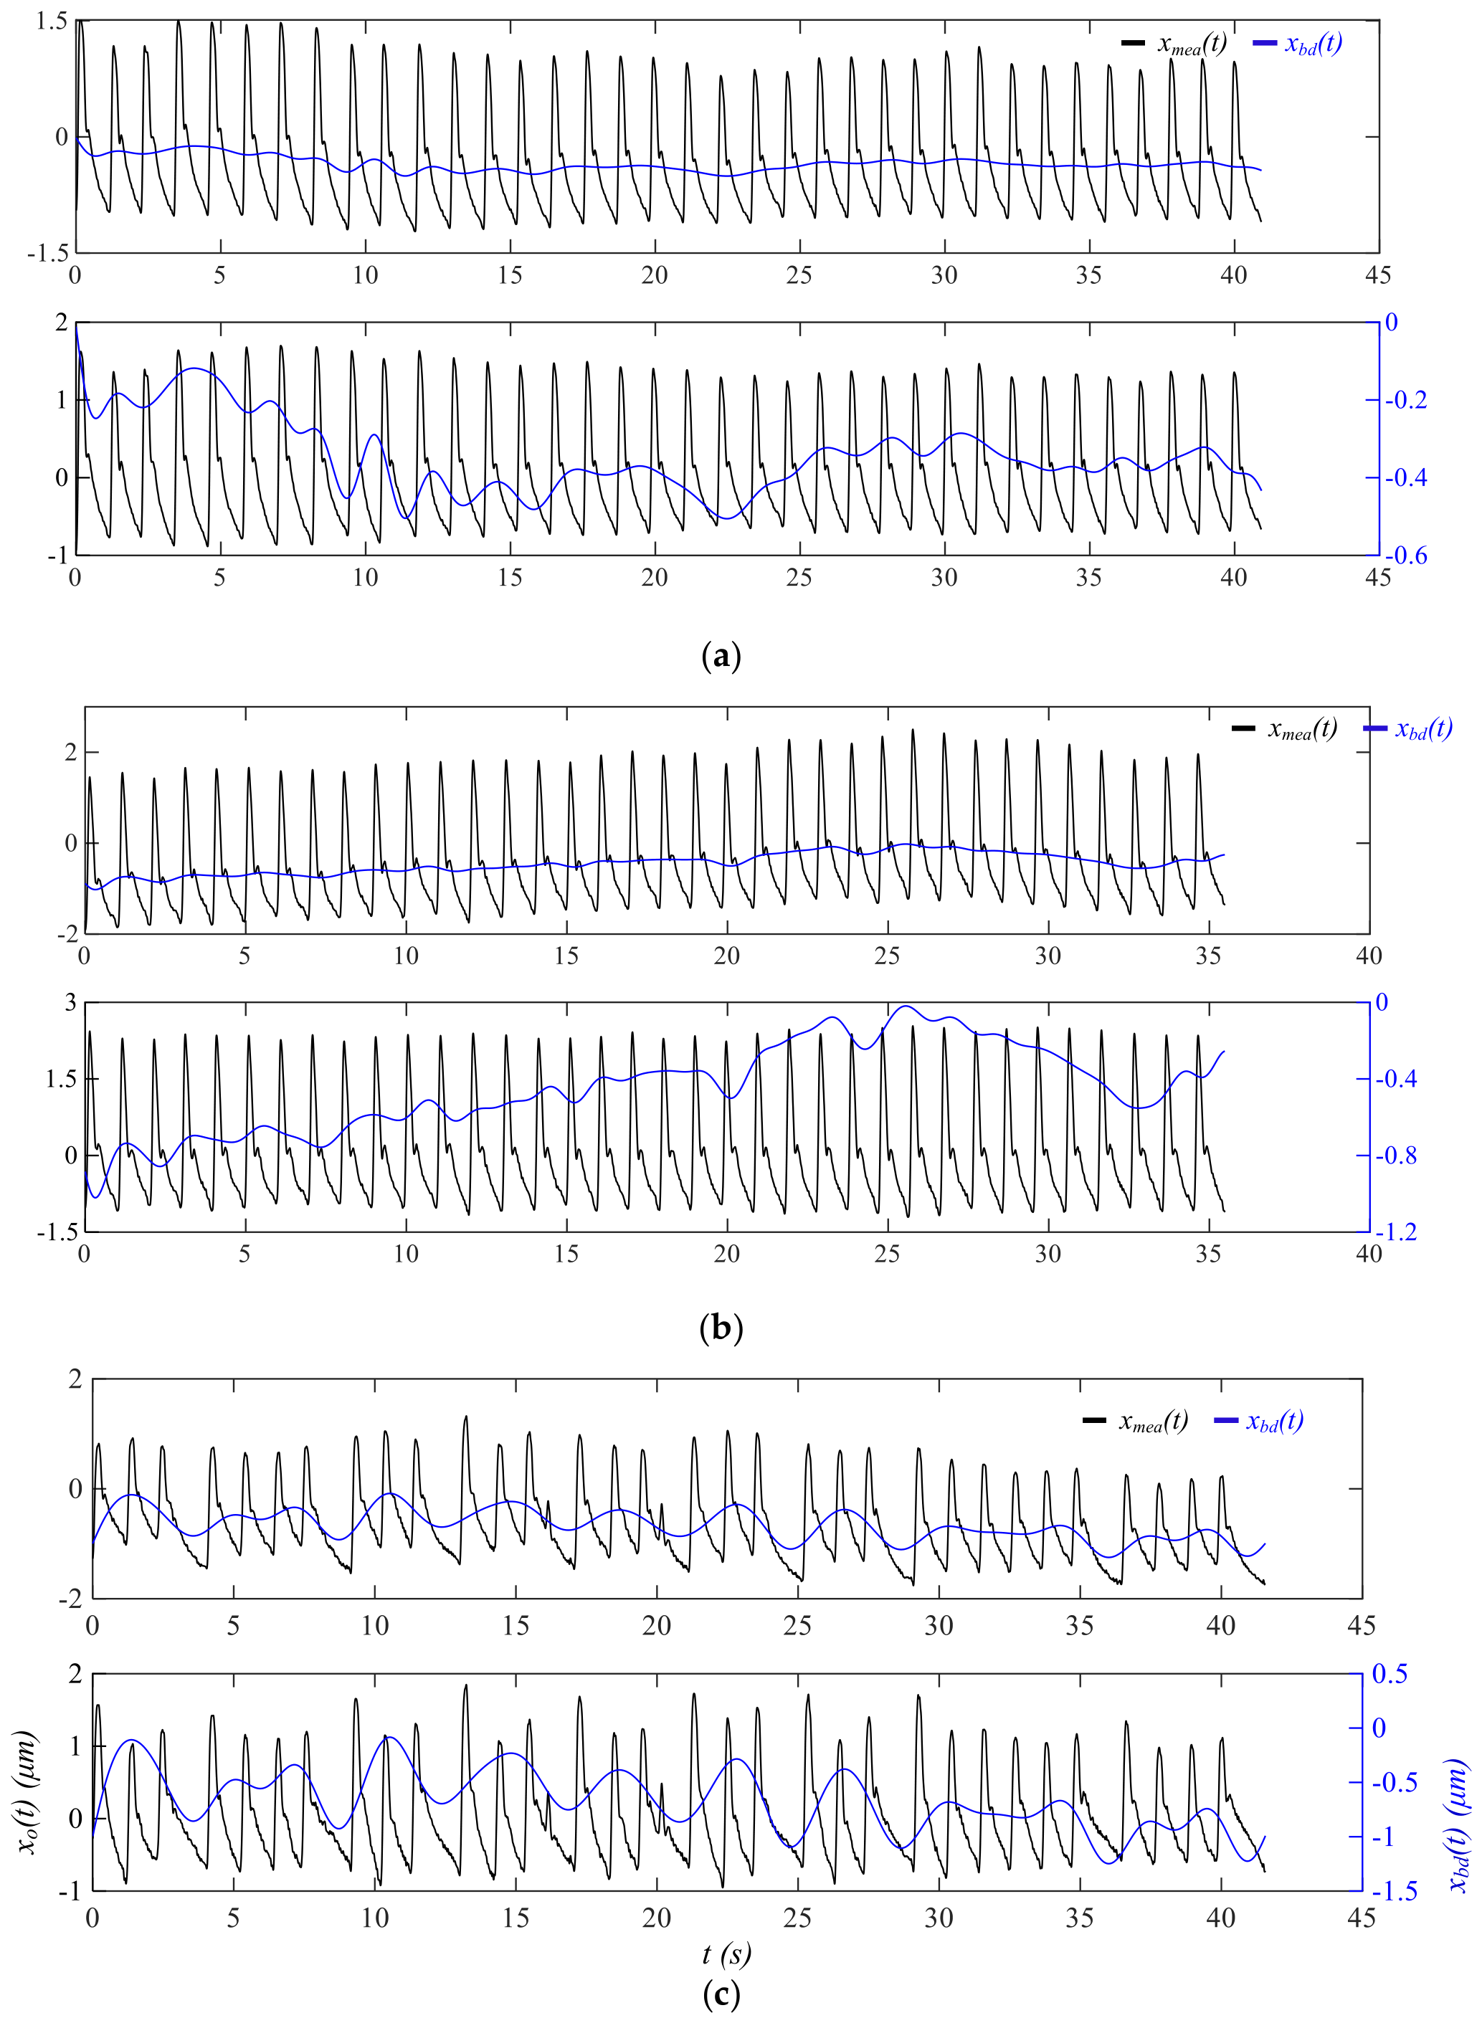

Table 1.
Baseline characteristics of the seven subjects.
| Subject ID | Gender | Age | BMI | Reason for Cardiac Rehab | Rhythm (Sinus/AF) | Devices |
|---|---|---|---|---|---|---|
| CR-008 | Male | 56-60 | 20.8 | HTx | SR | None |
| CR-002 | Male | 46-50 | 33.7 | PCI | SR | None |
| CR-011 | Male | 51-55 | 48.8 | NSTEMI and PCI | SR | None |
| CR-013 | Male | 61-65 | 24.2 | NSTEMI | SR | None |
| CR-035 | Male | 66-70 | 28.3 | HF | SR | CRT-D |
| CR-019 | Male | 66-70 | 27 | MI | AF | None |
| CR-020 | Male | 76-80 | 24.2 | PCI | SR | None |
Disclaimer/Publisher’s Note: The statements, opinions and data contained in all publications are solely those of the individual author(s) and contributor(s) and not of MDPI and/or the editor(s). MDPI and/or the editor(s) disclaim responsibility for any injury to people or property resulting from any ideas, methods, instructions or products referred to in the content. |
© 2026 by the authors. Licensee MDPI, Basel, Switzerland. This article is an open access article distributed under the terms and conditions of the Creative Commons Attribution (CC BY) license (http://creativecommons.org/licenses/by/4.0/).
Copyright: This open access article is published under a Creative Commons CC BY 4.0 license, which permit the free download, distribution, and reuse, provided that the author and preprint are cited in any reuse.