
Submitted:
29 August 2026
Posted:
31 August 2026
You are already at the latest version
Abstract
Aim: This study evaluates whether cardiovascular (CV) parameters derived from noninvasive arterial pulse signals can capture subject-specific physiological characteristics and longitudinal changes in patients with diverse heart diseases. Method: Arterial pulse signals at the radial artery (RA) and carotid artery (CA) were recorded using microfabricated tactile sensors and analyzed with a single-degree-of-freedom time–frequency (SDOF-TF) framework. Key CV parameters, including heart rate (HR), heart rate variability (HRV), respiration rate (RR), respiration modulation (RM), harmonic amplitudes, and normalized arterial pulse waveform (APW), were extracted from measurements at-rest and post-exercise across three visits in eighteen patients with heterogeneous CV conditions. Longitudinal changes in CV parameters within subjects and variability between subjects were assessed. Results: Compared to a healthy reference, patients exhibited altered CV profiles indicative of impaired autonomic regulation. Common trends included reduced HRV, blunted post-exercise CV responses, and attenuation of higher-order harmonics at the RA. CA-derived APW features showed enhanced sensitivity to systolic upstroke slope compared to the RA. Marked inter-subject variability was evident, reflected in at-rest values of key CV parameters and 5min post-exercise responses, highlighting the need for personalized interpretation. Longitudinal measurements revealed mixed effects of exercise on the CV system, likely influenced by concurrent medication and the short observation period. Conclusion: The SDOF-TF framework applied to arterial pulse signals effectively reveals both shared and individualized CV dysfunctions, capturing qualitative harmonic signatures, site-specific differences, and complex parameter interactions not detected by conventional methods, offering potential improvements in diagnosis and treatment monitoring for patients with diverse CV diseases.
Keywords:
arterial pulse signal
; arterial pulse waveform
; harmonic amplitude
; tactile sensor
; time-frequency analysis
; single-degree-of-freedom (SDOF)
; heart rate variability
; respiration
1. Introduction
Cardiovascular (CV) disease remains the leading cause of morbidity and mortality worldwide [1,2,3]. Effective clinical management requires not only accurate diagnosis but also continuous monitoring of CV function during disease progression, treatment, rehabilitation and recovery [4,5,6]. Conventional clinical assessments typically rely on multiple instruments, including electrocardiography (ECG), echocardiography, heart rate monitoring, blood pressure monitoring, and respiratory measurements, each providing only a partial description of CV physiology [7,8,9]. While ECG and echocardiography require specialized equipment and are relatively costly, blood pressure monitoring alone provides limited information about cardiac activity [7,8,9]. Consequently, comprehensive evaluation of CV function often requires measurements from multiple instruments [6,7,8,9]. However, each instrument may introduce device-specific errors, leading to inconsistent or non-comparable outcomes [4,5,6]. Such measurement variability can complicate the assessment of CV physiology and limit the reliability of multi-instrument evaluations, highlighting a fundamental challenge in achieving accurate, continuous, and routine CV monitoring.
Arterial pulse signals carry rich information related to cardiac activity, vascular properties, and cardiorespiratory coupling, thereby providing a unique opportunity for integrated CV assessment [10,11,12,13]. In principle, multiple CV features can be extracted from a single arterial pulse signal. However, despite more than a century of investigation since the introduction of arterial pulse analysis for CV assessment, its use remains largely confined to research settings. Two major challenges have prevented arterial pulse measurements from translating into routine clinical and home-based practice.
First, acquiring arterial pulse signals with high fidelity using tactile sensors remains relatively difficult in practice [14,15]. The measured signal is highly sensitive to measurement conditions (i.e., sensor alignment, contact pressure, and individual anatomy) and motion artifacts (MA), which include body motion and respiration [16,17,18,19,20,21]. All of these variables can distort arterial pulse morphology and reduce measurement reliability. Second, existing signal-processing techniques are often unable to effectively separate the true CV signal from MA and sensor noise [10,16,21]. As a result, extracting reliable CV features from measured pulse signals remains challenging in practice.
To date, the challenge of acquiring pulse signals with high fidelity has been partially addressed through advances in micro-fabricated tactile sensors. These sensors, developed in various forms, improve the conformity of the sensor to the artery and thereby enhance pulse signal transmission. In contrast, the development of signal-processing techniques capable of effectively removing MA and sensor noise while preserving physiologically meaningful information remains a critical challenge [10,16,22,23,24,25,26].
To address this challenge, we developed the single-degree-of-freedom time-frequency (SDOF-TF) method for the effective removal of MA and sensor noise from measured pulse signals [10]. This method is built upon a mechanical model of MA, where the tissue–contact–sensor (TCS) stack between the sensor and artery is modeled as a SDOF system for fully capturing the dynamic behavior of the TCS stack under the influence of MA during pulse measurements [27,28]. This method enables simultaneous extraction of multiple CV parameters from a single arterial pulse measurement, providing a unified and cost-effective approach for integrated CV assessment under both at-rest and post-exercise recovery conditions.
When applied to photoplethysmography (PPG) signals from a previously reported dataset of atrial fibrillation (AF) and non-AF patients, identified using gold-standard ECG recordings, the SDOF-TF method achieved 100% classification accuracy in distinguishing AF from non-AF subjects, outperforming other signal-processing techniques [13]. Several extracted CV parameters were identified as potential clinical markers contributing to this detection capability. More recently, the method was applied to three representative subjects [11]: a healthy individual, a heart-transplant (HTx) patient, and a percutaneous coronary intervention (PCI) patient with idiopathic pulmonary fibrosis (IPF). The analysis revealed both shared altered CV features across patients and distinct subject-specific characteristics, demonstrating the method’s ability to capture both disease-related patterns and individualized physiological signatures from pulse signals.
However, this prior study [11] was limited to a small number of representative cases and did not address the broader applicability of the method to a larger, heterogeneous patient population. In particular, substantial inter-individual variability may complicate interpretation when extending beyond case-based analysis, highlighting the need for systematic evaluation across a wider cohort.
In this paper, which constitutes Part I of our work, arterial pulse signals from eighteen patients with diagnosed heart diseases are examined. The SDOF-TF method is used to extract multiple CV parameters for patient-specific characterization. Measurements were obtained across three visits during an outpatient cardiac rehabilitation program, enabling simultaneous assessment of multiple CV parameters and their longitudinal changes.
Rather than focusing on group-level statistics, this paper emphasizes subject-specific characterization and the longitudinal changes of CV parameters within each individual (i.e., personalized diagnosis). Part II will focus on seven patients whose arterial pulse signals exhibit distinctive features, enabling detailed investigation of specific CV signatures identified using the SDOF-TF method. The objectives of this study are to: (1) examine whether CV parameters derived from pulse signals deviate from healthy patterns across patients, (2) investigate the degree of subject-specific variability, and (3) evaluate whether longitudinal measurements reveal individualized CV trajectories.
Through this work, we assess the potential of the SDOF-TF method for personalized CV diagnosis and monitoring, as well as patient-specific evaluation of disease progression and treatment response. More broadly, this study supports a shift from population-averaged assessment toward personalized medicine enabled by individualized CV profiling using arterial pulse signals, highlighting that patient-specific dynamics may provide clinically meaningful information beyond group-level trends.
2. Materials and Methods
The micro-fabricated tactile sensor and its pulse measurements and the SDOF-TF method have been described in the previous study [10,11,13]. For completeness, a brief description of them is provided here to facilitate a better understanding of the content in this paper.
2.1. Arterial Pulse Signal Acquisition
Arterial pulse signals were acquired using the same micro-fabricated tactile sensor and measurement configuration described previously. The sensor consists of a polydimethylsiloxane (PDMS) microstructure embedded with a resistive transducer array. When placed above an artery with contact pressure, the sensor detects the displacement of the arterial wall. Measurements were performed by positioning two sensors over the radial artery (RA) and the carotid artery (CA) simultaneously. The pulse signal recorded by the sensor is the displacement response of the tissue–contact–sensor (TCS) stack, which lies between the sensor and the artery, to the underlying arterial pulse.
Because of the existence of the TCS stack and unavoidable MA, which includes respiration and body motion, the measured signal reflects a transformed version of the true arterial pulse. The TCS stack acts as a harmonic-dependent mechanical filter, and its behavior can be modeled as a single-degree-of-freedom (SDOF) system [10]. MA introduces low-frequency baseline drift (BD) and time-varying system parameters (TVSP) of the TCS stack, perturbing the TCS stack’s response. Thus, the TCS stack filters the arterial pulse harmonically, while MA imposes additional disturbances on this mechanical filtering process.
2.2. SDOF-TF Method for Time-frequency Analysis of Measured Pulse Signals
Measured pulse signals are inherently nonstationary due to HRV and MA. To accurately extract CV parameters, the signals were analyzed using the previously developed time–frequency analysis framework based on an SDOF-TF method [10,13]. Within this framework, the arterial pulse signal is represented as a superposition of harmonics of the fundamental heart rate (HR) frequency. Time-frequency analysis yields instantaneous amplitude, frequency, and initial phase for each harmonic component. These instantaneous quantities provide the basis for extracting CV parameters with the effective removal of MA and accompanying sensor noise.
From a single measured pulse signal, the following CV parameters were derived:
- Heart rate (HR) averaged from the first three harmonics
- Heart rate variability (HRV) averaged from the first three harmonics, with HRV of each harmonic being calculated as root mean squared error (RMSE) of instantaneous HR over the analyzed period of the pulse signal.
- Standard deviation of HRV normalized to HRV across the first three harmonics (SHRV/HRV)
- Respiration rate (RR) averaged from the first three harmonics
- Respiration modulation (RM) of each of the first three harmonics
- HRV induced by physiological factors (PF), other than respiration, (HRVPF) averaged from the first three harmonics
- Normalized arterial pulse waveform (APW) (relative to the pulse amplitude) with constant HR, where HRV is removed to avoid APW variation across pulse cycles
- Normalized amplitude (Ai) of the ith harmonic (relative to the amplitude of the first harmonic) of the 2nd~7th harmonics ( i=2~7)
- Normalized amplitude change (ΔAi) of the ith harmonic 5min and 10min post-exercise (relative to the corresponding at-rest value) of the 2nd~7th harmonics (i=2~7)
The details about the extraction of the above parameters can be found in the literature [10,13]. RM is indicative of respiratory sinus arrhythmia (RSA), reflecting the influence of the parasympathetic nervous system on cardiac function and cardiorespiratory coupling [12,29].
As discussed previously [11], qualitative comparison of normalized APW and Ai of the higher harmonics (i=2~7) remain valid and can be compared between subjects and across visits at the same artery site. Note that their quantitative comparison requires accounting for the TCS stack, which varies with measurement conditions and individuals. For this reason, no quantitative indices of arterial stiffness were extracted from the measured pulse signals at either artery in this study.
2.3. Study Population and Measurement Protocol
The measurement protocol for the 25 patient subjects was approved by the Eastern Virginia Medical School, Virginia Health Sciences IRB at Old Dominion University (IRB Approval #19-04-FB-0100), and written informed consent was obtained from all participants. Patients diagnosed with various forms of CV disease were recruited from the outpatient cardiac rehabilitation program at Sentara Heart Hospital, where all patient measurements were conducted. Among the 25 recruited patients, 7 special-case patients—including a heart transplant (HTx) recipient and individuals with bradycardia, low dicrotic notch (DN), and intermittent APW changes—are presented in Part II of this work. The present study focuses on the remaining 18 patient subjects. In addition, one individual free from known CV disease was measured at Old Dominion University (ODU) under a separate protocol and included as a healthy reference for comparison. The measurement protocol for the healthy reference was approved by the ODU Institutional Review Board (IRB #I RB24-166), and written informed consent was obtained. Due to institutional policy and applicable privacy regulations, individual-level patient data will not be shared with external investigators or repositories. These restrictions are necessary to protect patient confidentiality and comply with institutional governance of clinical data resources.
Pulse signal measurements were obtained from each patient during three visits scheduled on the same weekday in the first (Visit 1), second (Visit 2), and fourth (Visit 3) weeks of the outpatient cardiac rehabilitation program to enable longitudinal assessment of CV status. During each visit, measurements were obtained at-rest (pre-exercise) and at 5, 10, 20, 30, and 60 minutes post-exercise. It should be noted that between 30 and 60 minutes post-exercise, patient activity could not be strictly controlled, and almost all the patients engaged in behaviors such as phone use. This lack of control was not initially accounted for during data acquisition but was identified during subsequent analysis, where the 60min post-exercise measurements exhibited substantially larger fluctuations compared to earlier time points. These fluctuations are therefore attributed to uncontrolled external influences rather than physiological recovery alone. Accordingly, the 60min post-exercise data were excluded from the analysis presented in Section 3.
Two identical micro-fabricated tactile sensors were used to simultaneously acquire arterial pulse signals at the RA and CA. For all CA measurements, a PDMS layer was interposed between the sensor and the skin to improve conformity with the arterial surface, thereby enhancing the quality of the acquired pulse signal. The healthy reference was measured during a single visit at ODU, with data collected at-rest and at 5, 10, and 25 minutes post-exercise using the same sensing system. All recorded pulse signals were processed using the SDOF-TF-based algorithm to extract comprehensive CV parameters for each patient.
Of the 18 patients in this study, the mean age was 65.2 years (SD = 8.8), and the mean BMI was 32.07 (SD = 5.22). At the initial cardiac rehabilitation evaluation, the mean blood pressure was 126 mmHg systolic (SD = 16.46) and 72.77 mmHg diastolic (SD = 8.00). The mean HR was 72.11 bpm (SD = 9.58). 6 patients had diastolic dysfunction, and 5 had systolic dysfunction. The most recent NT-proBNP level prior to cardiac rehabilitation ranged from 31 to 9,095pg/mL. 16 patients had normal sinus rhythm (SR). Four patients demonstrated left bundle branch block on EKG, and the mean QRS duration was 115 ms (SD = 36.8).
Table 1 summarizes the CV diseases and associated information of the 18 patient subjects. Subject numbering is non-consecutive because some individuals initially consented but later withdrew before completing any measurement visits. Additionally, not all subjects completed the third visit. All listed characteristics were recorded prior to the first visit. Note that CR039 is the subject of PCI with IPF included in the previous study [11].
2.4. Analytical Strategy
Given the heterogeneity of the study population and the diversity of underlying CV conditions, the analytical approach emphasizes within-subject physiological characterization rather than population-level statistical inference. Three complementary levels of analysis were performed:
- Subject-level characterization: Each subject’s CV parameter set was analyzed to identify distinctive physiological features and patterns, highlighting individual deviations from healthy reference profiles.
- Longitudinal comparison: Changes in parameters across the three visits were evaluated to assess potential improvement, stability, or deterioration in CV function. To distinguish true physiological changes from variability inherent to the measurements, the magnitude of parameter changes across visits was interpreted relative to the variability observed across subjects, as described in Section 3. Variations within the expected measurement error were considered indicative of no significant physiological change, reflecting the reproducibility of the SDOF-TF measurements. In contrast, changes exceeding this variability were interpreted as longitudinal changes, representing genuine alterations in the subject’s CV status over time. This framework enables careful interpretation of temporal trends while accounting for both measurement reliability and physiological dynamics.
- Cross-subject comparison: Qualitative comparisons were conducted across subjects to identify recurring patterns shared among multiple patients, as well as notable differences unique to specific individuals. This approach emphasizes the identification of both common disease-related signatures and patient-specific CV features.
Overall, this multi-level analytical framework enables physiologically meaningful interpretation of heterogeneous CV data by integrating subject-level characterization, longitudinal evaluation, and cross-subject comparison. The approach prioritizes within-subject assessment to capture individualized physiological features and temporal changes while also identifying recurring patterns and disease-related signatures shared across subjects. By distinguishing longitudinal changes from expected measurement variability, the framework enables more reliable interpretation of physiological trends in a diverse study population.
3. Results
As observed in the previous study [11], CA measurements were heavily affected by MA; therefore, only their normalized APW is included for comparison with the RA measurements. All analyses of HR, HRV, RR, and RM are based on RA measurements.
3.1. HR and HRV
As shown in Figure 1, at-rest HR varied across subjects, though most remained within the normal range. Across visits, HR changes were generally moderate: some subjects displayed increasing or decreasing trends, while others remained stable. Notable cases include CR001 (Chronic Systolic HF, ICD) and CR041 (AF, PCI), who consistently exhibited high HR; CR014 (CABGX6) and CR044 (CABGX4), showing pronounced longitudinal decreases; and CR037 (Chronic Systolic HF, CRT-D), maintaining an extremely stable HR.
Figure 1 also compares the HR changes between at-rest and 30 min post-exercise. Most patients exhibited slight to moderate changes across visits. Exceptions included CR014 (CABGX6), CR025 (MVR), and CR042 (CABG), who showed large HR increases in Visit 3, while CR037 remained unchanged at all visits. Given the extremely low variations in at-rest HR across visits for some subjects (e.g., CR001, CR037, and CR041), the observed differences in at-rest HR and 30min post-exercise HR across visits likely reflect true longitudinal physiological changes, rather than measurement variability.
Figure 2 plots the largest HR deviations relative to at-rest HR due to exercise, ΔHR/HR, of the subjects. The largest deviations from baseline typically occurred at 5 min post-exercise, although in some patients peak responses were observed at 10 min. A few patients exhibited lower HR post-exercise than at-rest one, and for these, ΔHR/HR was taken at 5 min. Overall, ΔHR/HR of all patients was much lower than that of the healthy reference, except for CR014 (CABGX6). Most subjects demonstrated a noticeable longitudinal increase in ΔHR/HR, with distinct patterns observed in several patients: CR025, CR030, and CR031 showed a notable decreasing trend; CR037 and CR041 showed minimal change; CR014 exhibited a large positive longitudinal change; and CR044 transitioned from a negative to a positive ΔHR/HR. Given the small variations of ΔHR/HR across visits for some subjects (e.g., CR001, CR029, CR036, and CR037), the observed differences in ΔHR/HR of each subject across visits likely reflect true longitudinal physiological changes, rather than measurement variability.
As shown in Figure 3, compared to the healthy reference, most patients exhibited low at-rest HRV, with minimal longitudinal changes. Several patients demonstrated distinct patterns: CR041 (AF, PCI), the only patient diagnosed with atrial fibrillation (AF), had the highest HRV, which is the well-established CV feature associated with AF, and the patient’s HRV decreased over time, which is consistent with the natural history of AF; CR042 (CABG) showed the largest longitudinal swings; CR029 (atrial paced) exhibited the most pronounced longitudinal decrease in HRV; and CR037 and CR039 (chronic HF) maintained the lowest HRV. Given the small variations of at-rest HRV across visits for some subjects (e.g., CR001, CR025, and CR037) and the extremely large at-rest HRV of CR041 (AF), the observed differences in at-rest HRV of each subject across visits likely reflect true longitudinal physiological changes, rather than measurement variability.
As shown in Figure 4, standard deviation of at-rest HRV across the first three harmonics, SHRV/HRV, was moderately elevated for most patients across visits, as compared to the heathy reference. Some patients with elevated SHRV/HRV in Visit 1 generally showed reductions by Visit 3, approaching healthy levels. Noticeably, CR037 (chronic HF, CRT-D) showed an exceptionally large increase, and CR007 exhibited a notable decrease. At-rest SHRV/HRV of CR041 (AF) was elevated, which is consistent with the previous finding on AF from finger PPG signals [13]. Given the small variations of at-rest SHRV/HRV across visits for some subjects (e.g., CR001, CR005, and CR044) and the elevated value for CR041 (AF), the observed differences in at-rest SHRV/HRV of each subject across visits likely reflect true longitudinal physiological changes, rather than measurement variability.
As shown in Figure 5, the contribution of other physiological factors (PF), rather than respiration, to at-rest HRV, HRVPF/HRV, was generally reduced, reflecting impaired autonomic modulation. Notably, CR014 (CABGX6) showed the largest decrease from Visit 1 to Visit 3, and CR025 (MVR) and CR037 exhibited the largest increases from Visit 1 to Visit 3. Given the small variations of at-rest HRVPF/HRV across visits for some subjects (e.g., CR042, and CR044), the observed differences in at-rest HRVPF/HRV of each subject across visits likely reflect true longitudinal physiological changes, rather than measurement variability.
3.2. Respiration Parameters: RR and RM
As shown in Figure 6, at-rest RR was moderately elevated in most patients. Because the absolute magnitude of RR is relatively small, inter-visit differences may appear proportionally large. Distinct patterns were observed in several cases: CR039 (IPF) exhibited the highest RR, consistent with the subject’s underlying pulmonary pathology; CR025 (MVR) and CR042 (CABG) showed the largest longitudinal reductions; CR016 (Chronic HF) demonstrated the largest increase; and CR014 (CABGX6) and CR044 (CABGX4) maintained the lowest RR.
Post-exercise RR remained slightly elevated (from 19bmp to 22bmp) in the healthy reference, while patient responses were more variable. CR001, CR016, and CR039, all with elevated at-rest RR, exhibited marked reductions post-exercise. CR026 and CR038, despite normal at-rest RR, also showed large post-exercise decreases. In contrast, CR014, CR025, and CR042, all with low at-rest RR, displayed substantial post-exercise increases, whereas CR044, despite the lowest at-rest RR, showed only a moderate elevation. These observations suggest that post-exercise RR responses are influenced by baseline RR and underlying CV or pulmonary conditions.
Given the small variations of at-rest RR across visits for some subjects (e.g., CR005, and CR007), the observed differences in at-rest RR and 30min post-exercise RR of each subject across visits likely reflect true longitudinal physiological changes, rather than measurement variability.
As shown in Figure 7(a), the healthy reference revealed an increasing trend of at-rest RM with harmonic order, with a similar increase between consecutive harmonics. At-rest RM behavior exhibited mixed patterns across patients: while many preserved the expected increasing trend with harmonic order, others showed weakened or disrupted trends, often accompanied by reduced at-rest RM magnitude. Among the patients, CR041(AF) registered the highest at-rest RM values and maintained a consistent increasing trend of at-rest RM with harmonic order, notably as the only patient diagnosed with AF. The high RM observed for CR041 (AF) is consistent with findings from the study [13] on AF detection from finger PPG signals using the SDOF-TF method, in which AF subjects exhibited elevated at-rest RM values compared with non-AF subjects. At the other extreme, several patients exhibited very low at-rest RM values, particularly in Visit 3, including CR005, CR016, CR034, CR037, CR038, and CR039.
Longitudinally, some still preserved the increasing trend of at-rest RM with harmonic order, whereas others showed a disrupted or weak trend. Moreover, several patients demonstrated noticeable changes in at-rest RM behavior. For example, CR014 and CR042 showed an improved increasing trend of RM with harmonic order, together with an increase in their absolute RM values from Visit 1 to Visit 3, whereas CR036 exhibited a marked reduction in RM from Visit 1 to Visit 3, while the increasing trend with harmonic order was still preserved. In contrast, CR031, CR034, and CR037 exhibited a disrupted at-rest RM trend with harmonic order in Visit 3.
For the healthy reference, post-exercise RM generally sustained its increasing trend with harmonic order. As to the patient group, RM also sustained its increasing trend with harmonic order for some patients, but for others such increasing trend was disrupted. To clearly reveal the difference in RM between at-rest and 30 min post-exercise conditions, the RM values averaged across the three harmonics are plotted in Figure 7(b). Compared with the at-rest condition, RM decreased 25min post-exercise for the healthy reference, consistent with reports in the literature showing reduced respiration-induced modulation of HRV following exercise [10]. Similarly, RM consistently decreased 30 min post-exercise for CR029 across all three visits. In contrast, for the remaining patients, RM either increased or decreased across the three visits, indicating less consistent post-exercise respiratory modulation behavior. CR041 again stood out: this subject’s RM values at 30 min post-exercise remained high compared with those of the healthy reference. Although the first visit showed a reduction in RM at 30 min post-exercise, the second and third visits showed increases instead. Moreover, during the third visit, RM failed to maintain the consistent increasing trend with harmonic order observed in the healthy reference, further suggesting abnormal post-exercise respiratory modulation behavior.
Given the small variations of at-rest RM across visits for some subjects (e.g., CR005, and CR025), the observed differences in at-rest RM and 30min post-exercise RM of each subject across visits likely reflect true longitudinal physiological changes, rather than measurement variability.
3.3. Normalized Harmonic Amplitudes and Normalized APW
3.3.1. Subject-Specific Comparison of Individual Normalized Harmonic Amplitudes
It is well established that low arterial stiffness is associated with relatively large higher-harmonic amplitudes [30]. Figure 8 shows the normalized amplitudes, Ai, of the first seven harmonics relative to the first harmonic. Comparisons of initial phases are omitted due to their high sensitivity to MA and sensor noise [10,11].
Compared with the healthy reference, the patients generally exhibited slightly higher 2nd harmonic amplitudes, comparable 3rd–4th harmonic amplitudes, and markedly lower 5th–7th harmonic amplitudes. This pattern reflects increased arterial stiffness, as higher-order harmonics are known to attenuate with stiffening [30].
Exercise modulated harmonic amplitudes in a systematic manner in the healthy reference: the 2nd harmonic increased notably, the 4th changed minimally, and the 3rd and 5th–7th harmonics decreased markedly. The largest deviations from baseline occurred at 5min post-exercise, with partial recovery by 10min. In comparison, patients generally exhibited a blunted response to exercise. Longitudinally, heterogeneous patterns were observed, with some patients showing improvement in specific harmonic features, while others demonstrated minimal change or deterioration. These longitudinal interpretations should be made with caution, as variability in the TCS stack may introduce small fluctuations in normalized harmonic amplitudes. Accordingly, minor changes across visits are likely attributable to measurement variability, whereas larger changes are more indicative of true physiological adaptations.
CR029 displayed a particularly pronounced response. In Visit 1, this patient exhibited an exceptionally large increase in the 2nd–4th harmonic amplitudes at 5 min post-exercise, followed by a marked decrease between 5 and 10 min. CR029 is the only patient with atrial paced. Abnormal atrial pacing and impaired ventricular function likely altered ventricular filling and pulse generation dynamics, contributing to the unusually large harmonic variations. However, these pronounced features were not observed in subsequent visits. Given that CR029 is the only patient exhibiting this distinct pattern, it is likely that the observed features reflect subject-specific physiological conditions rather than measurement variability.
3.3.2. Cross-Subject and Longitudinal Comparison of Normalized Harmonic Amplitude Profiles
In contrast to Section 3.3.1, which presents a full subject-level decomposition of individual normalized harmonic amplitudes across all 18 patients, here, we focus on representative and consolidated comparisons to highlight overall patterns rather than exhaustive individual harmonic variability. Specifically, the number of subjects for cross-subject comparison and longitudinal analysis is reduced to ensure visual clarity and interpretability. This approach differs from the above in that it emphasizes comparative profiling and temporal trends using selected representative subjects, rather than a complete subject-by-subject presentation of each harmonic. Besides CR029 (atrial paced) and CR041 (AF), Here, CR014 (CABG×6), CR034 (CABG), CR036 (CABGX5), CR044(CABGX4), CR037 (HF, CRT-D) are chosen for cross-subject comparison; CR029 and CR041 are chosen for longitudinal comparison.
As shown in Figure 9, the normalized harmonic amplitude profiles at rest vary across patients in each visit. Overall, the 2nd harmonic amplitude is higher and the higher-order harmonic amplitudes (5th–7th) are lower compared with the healthy reference. In contrast, the 3rd and 4th harmonic amplitudes show heterogeneous behavior across patients, with values being either higher or lower than those of the healthy reference. In the meantime, the harmonic change profiles reveal more pronounced inter-subject differences within each visit. Specifically, the harmonic change profiles exhibit the following patterns across patients and visits: (1) the amplitude changes in the 5th, 6th, and 7th harmonics remain consistently smaller than those of the healthy reference; (2) the amplitude change in the 4th harmonic shows heterogeneous behavior, with patient values distributed both above and below the healthy reference; (3) the amplitude change in the 3rd harmonic is generally smaller than that of the healthy reference across patients, except for CR034 in the third visit; and (4) longitudinally, an increasing number of patients exhibit elevated 2nd harmonic changes exceeding the healthy reference.
As shown in Figure 10(a), the 2nd and 3rd harmonic amplitudes both exhibit noticeable increases, whereas the 4th–7th harmonic amplitudes show marked decreases in CR029 at-rest across visits, compared with the healthy reference. Although ΔHR/HR is lowest in the first visit, the harmonic change profile is largest in that visit and differs substantially from the subsequent two visits. In contrast to the steady longitudinal increase observed in ΔHR/HR, the harmonic change profile does not exhibit a corresponding steady trend.
As shown in Figure 10(b), only the 2nd harmonic amplitude increases while all the other harmonic amplitudes decrease in CR041 at-rest across visits. Although ΔHR/HR is very close between the first and the third visits, the harmonic change profiling is distinctly different. In particular, the harmonic change profiling in the third visit moves closer to that of the healthy reference.
Interestingly, despite the harmonic amplitude profiles at rest appearing relatively similar across visits, the harmonic change profiles reveal clear inter-visit differences, suggesting that disease-related effects may be more prominently reflected in autonomic regulation as captured by harmonic dynamics than in resting amplitude patterns alone. There exists no relation between ΔHR/HR and the harmonic change profile.
3.3.3. Normalized APW Between the RA and CA
To illustrate site-specific effects, a subset of representative subjects was selected: CR041 (AF) and CR029 (APAC), both exhibiting abnormal RSA, together with CR001 and CR005 for comparison. Including all individual participants would be impractical, as it would amount to individualized interpretation of all 18 patients and is not suitable for paper presentation. Conversely, aggregated or averaged summaries may obscure important subject-specific physiological signatures.
As shown in Figure 11, at the RA, the upstroke slope was similar between patients and the healthy reference, consistent with previous findings for CR039 [11]. In contrast, measurements at the CA showed more pronounced differences in upstroke slope between patients and the healthy reference, suggesting greater sensitivity of the CA waveform to stiffness-related changes when using upstroke slope as an indicator. Across all the subjects, HR measured at the RA and CA was comparable. Additionally, the DN was consistently located at a lower relative position in the RA waveform, consistent with known physiological differences between central and peripheral arterial sites.
For CR001, RA upstroke slope was comparable to the healthy reference, while CA upstroke slope was elevated. The DN followed the expected physiological pattern, lower at the RA than the CA.
For CR005, longitudinal changes were observed. Although at-rest HR decreased over time, the relative change (ΔHR/HR) increased. Upstroke slope at the RA remained similar to that of the healthy reference, while upstroke slope at the CA was higher during the first two visits. From visit 2 to visit 3, the change in resting HR was accompanied by noticeable changes in normalized APW and upstroke slope, suggesting that cardiac activity may modulate these parameters. A substantial change in normalized APW during visit 3 was observed simultaneously at both the RA and CA, indicating that this effect is unlikely measurement artifacts, but true physiological changes. The DN remained consistently lower at the RA, and HR remained similar between the two artery sites.
For CR029, at-rest HR in visit 3 deviated more from the first two visits; however, normalized APW did not show a corresponding significant change, unlike in CR005. This may suggest that the relationship between normalized APW and at-rest HR may vary between subjects. Upstroke slope in Visit 3 was similar to that of the healthy reference at the RA and only slightly elevated at the CA. The DN remained lower at the RA across all visits, and HR remained consistent between the two artery sites.
For CR041, upstroke slope at the RA was comparable to that of the healthy reference but consistently higher at the CA across all visits. HR remained similar between the two sites. Although the DN was higher at the RA than at the CA in the first visit, it became notably lower in subsequent visits, aligning with normal CV physiology.
3.3.4. Features in Normalized APW at the RA and CA
By comparing the location of the DN at the RA in Figure 11 with the harmonic amplitudes in Figure 8, it can be inferred that the 2nd and 3rd harmonics largely govern the DN location in APW, determining whether it appears higher or lower. With increasing arterial stiffness, as observed in aging, lower-order harmonic amplitudes tend to increase while higher-order harmonic amplitudes (5th -7th decrease [30]; however, these higher harmonics are not explicitly visible in APW. This explains why the DN location at the RA may reflect stiffness-related changes, even though the underlying harmonic shifts are not directly observable for higher-order harmonics. In contrast, the upstroke slope at the RA remained comparable to that of the healthy reference in the patient group, indicating limited sensitivity of this feature at the peripheral site.
At the CA, however, the opposite trend was observed: changes in the upstroke slope were more pronounced, while shifts in DN location were less evident. These findings suggest that the DN at the RA and the upstroke slope at the CA provide complementary, site-specific indicators of arterial stiffness. Nevertheless, these indicators are relative rather than absolute and may be influenced by CV pathologies that alter the relationship between harmonic distribution and waveform morphology. Therefore, while the radial DN and carotid upstroke slope offer useful insights into stiffness-related changes, their interpretation should be made with caution, particularly given inter-subject variability from diverse CV conditions and the limited sample size of the present cohort.
3.3.5. Normalized APW Between the RA and CA of CR029 in Visit 1
Given the pronounced changes in normalized harmonic amplitudes during the post-exercise response in Visit 1 of CR029 (atrial paced), the normalized APW at rest, and at 5 min and 10 min post-exercise, is presented in Figure 12. The substantial increase in the 2nd–3rd harmonic amplitudes markedly altered the location of DN at the RA.
At 5 min post-exercise, the upstroke slope at the RA increased compared to both at-rest and 10 min post-exercise, accompanied by an elevated HR—findings consistent with normal CV physiology. By 10 min post-exercise, both the upstroke slope and HR showed recovery toward baseline. At the CA, a similarly pronounced shift in DN was observed at 5 min post-exercise, along with corresponding changes in upstroke slope and HR that followed expected physiological trends. Notably, the increase in upstroke slope at the CA at 5 min post-exercise was substantially greater than that at the RA, further confirming the higher sensitivity of the CA to central hemodynamic dynamics.
Across all visits, HR measured at the RA and CA was comparable. Additionally, the DN was consistently located at a lower relative position in the RA waveform, consistent with known physiological differences between central and peripheral arterial sensitivity of the CA to stiffness-related changes when assessed using upstroke slope, as observed in Figure 9; the upstroke slope at the RA may become sensitive when used to assess arterial stiffness within the same subject under different physiological conditions.
Overall, the consistent behavior of APW features, arterial stiffness, and HR across both arterial sites suggests that the observed pronounced changes arise from physiological alterations in C029 rather than measurement variability. However, the unusually low position of the DN warrants further investigation.
3.3.6. Qualitative Evaluation of Normalized APW and Harmonic Amplitudes
As discussed in the previous study [10,11], the dependence of the normalized APW and harmonic amplitudes on the TCS stack limits the reliability of quantitative comparisons of APW-derived metrics across subjects or across arterial sites. However, qualitative comparisons—such as relative differences between subjects or longitudinal changes within the same subject at the same artery site—remain meaningful and comparatively reliable, as evidenced in Figure 12. Therefore, the interpretation of APW features in this study is primarily based on qualitative trends rather than absolute quantitative values.
3.5. Summary of Observations
Overall, the results reveal common yet heterogeneous patterns in CV dynamics across subjects. In this study, “most” refers to the majority of the 18 patients, while acknowledging that a small subset may exhibit distinct or even opposing patterns due to individual physiological variability. As noted in Section 3.1 and Section 3.2, the observed inter-visit differences are likely to reflect true physiological changes, supported by the minimal variability in extracted CV parameters for one or two subjects across visits.
First, HR and HRV analyses indicate that most patients exhibit impaired autonomic regulation compared with the healthy reference. While at-rest HR generally falls within the normal range, ΔHR/HR during post-exercise recovery is markedly reduced in most patients, suggesting attenuated CV responsiveness. At-rest HRV is consistently lower in patients, mostly registering a very limited longitudinal changes, although a few subjects revealed large swings of at-rest HRV across visits. Notably, CR041, the only AF patient, consistently exhibited high at-rest HRV (see Appendix A in the Supplementary Document, where even HRV during post-exercise recovery also remains elevated, as reflected by markedly fluctuating pulse-cycle intervals.). Elevated at-rest SHRV/HRV further suggests reduced physiological modulation in most patients, with CR007 exhibiting the largest recovery and CR037 demonstrating the largest deterioration longitudinally. Compared to the healthy reference, HRVPF/HRV at-rest was reduced for the patient group, signifying impaired autonomic regulation.
Second, respiratory parameters, RR and RM, demonstrate substantial inter-subject variability. At-rest RR is elevated in most patients and shows mixed post-exercise responses, likely influenced by both baseline respiratory status and comorbid conditions. At-rest and 30min post-exercise RM reveals that while some patients preserve the normal increasing trend with harmonic order, others exhibit disrupted patterns and/or markedly reduced values. The only patient with AF (CR041) consistently showed elevated RM, aligning with the prior finding [13].
Third, harmonic analysis of normalized APW at the RA indicates increased arterial stiffness in patients, as evidenced by qualitative patterns in harmonic amplitudes rather than absolute values. Compared with the healthy reference, patients generally exhibit slightly elevated 2nd harmonic amplitudes and markedly reduced higher-order harmonics (5th–7th), consistent with known effects of arterial stiffening.
Fourth, comparison of normalized APW between the RA and CA of a subset of subjects reveals site-specific differences. At the RA, the upstroke slope does not clearly differentiate patients from the healthy reference, indicating limited sensitivity of this feature at the peripheral site. In contrast, attenuation of higher-order harmonics provides a more sensitive indicator of stiffness-related changes. While arterial stiffness at the RA generally appears comparable between patients and the healthy reference when assessed using upstroke slope alone, the CA demonstrates greater sensitivity to stiffness-related differences in APW morphology. Meanwhile, the location of DN at the RA is more indicative of arterial stiffness than at the CA. Although MA significantly affects the extraction of HRV, RR, and RM at the CA, the normalized APW derived using the SDOF-TF method remains qualitatively reliable due to effective removal of MA and sensor noise. Across subjects, HR remains consistent between the two arterial sites, and the DN is typically lower at the RA than at the CA, consistent with normal CV physiology. These findings suggest that CA-based APW analysis provides enhanced qualitative sensitivity for detecting arterial stiffness changes, whereas RA-based harmonic features and the location of DN complement this assessment. The observed differences between the two arterial sites are consistent with CV physiology, as the CA more directly reflects the central aortic waveform because of its close anatomical proximity to the aorta.
Fifth, exercise induces systematic but generally blunted changes in ΔHR/HR and harmonic amplitudes in patients, with peak deviations typically occurring at 5 min post-exercise, although in some patients the peak response shifts to 10 min and even negative response occurs. Longitudinal trends remain heterogeneous, with some patients showing improvement and others deterioration. However, no relation was observed between ΔHR/HR and harmonic amplitude changes.
Sixth, the case study of CR029 in Visit 1 highlights the internal consistency of the measured parameters. Despite unusually large changes in harmonic amplitudes and DN during post-exercise recovery, concurrent changes in arterial stiffness follow expected physiological trends. This supports the internal coordination of the extracted CV parameters, in which arterial stiffness increases in response to exercise demand. However, the influence of measurement artifacts and the TCS stack cannot be entirely excluded.
Seventh, compared with individual normalized harmonic amplitudes and their changes at 5 min and 10 min post-exercise relative to at-rest, the combined use of normalized harmonic amplitude profiling at rest and harmonic change profiling at 5 min post-exercise provides a more complete characterization of each patient across visits. In particular, these two representations together help explain the observed differences in the normalized APW between the at-rest and 5 min post-exercise conditions. For instance, the downward shift in the DN at 5 min post-exercise relative to at-rest is primarily associated with the increase in the 2nd harmonic amplitude.
Finally, longitudinal measurements were conducted three times over four weeks (week 1, week 2, week 4) during the rehabilitation program. Analysis of pulse-derived CV parameters showed heterogeneous trends: some parameters improved, others remained unchanged, and a few even deteriorated. These changes were observed while all patients were under medication, which could influence the outcomes. The short time span further limits the detection of physiologically meaningful adaptations.
In summary, the combined analysis of HR, HRV, RR, RM, harmonic content, and APW morphology at-rest and during post-exercise recovery provides a coherent picture of altered CV dynamics in patients. While general trends reflect impaired autonomic and vascular function, substantial inter-subject and intra-subject variability underscores the importance of individualized assessment.
4. Discussion
In this study, we investigated CV function across patients with diverse CV conditions using radial pulse waveform analysis, capturing HR, ΔHR/HR, HRV, standard deviation of HRV across the first three harmonics (SHRV/HRV), RM, RR, and normalized APW including harmonic amplitudes. The SDOF-TF method was employed to analyze the measured pulse signals, enabling high-resolution decomposition of harmonics and variability components over time. This approach provides insights into both autonomic regulation and vascular dynamics beyond conventional time-domain measures and allowed us to quantify CV dynamics at-rest and during post-exercise recovery, revealing subject-specific CV patterns.
4.1. Common Features: At-Rest and Post-Exercise Response
Several common physiological patterns emerge across the cohort despite underlying heterogeneity. At rest, most patients exhibit HR within the normal range but reduced HRV, indicating impaired autonomic regulation. This observation is further supported by a reduced ΔHR/HR during post-exercise recovery compared with the healthy reference, suggesting a blunted CV response to physiological stress.
Post-exercise responses in terms of APW morphology and harmonic amplitudes further reinforce this reduced ΔHR/HR. In some patients, the largest deviations in harmonic amplitudes and APW features occur at 5 min post-exercise, followed by partial recovery at 10 min. In others, the peak deviation occurs at 10 min post-exercise, indicating variability in recovery dynamics. Compared with the healthy reference, however, these responses are generally attenuated, reflecting reduced CV adaptability. In a few cases, even paradoxical or negative HR responses were observed at 5 min post-exercise, further indicating impaired autonomic regulation.
Despite these attenuated responses, the overall trends in arterial stiffness–related features and HR during recovery remain broadly consistent with expected CV physiology. This suggests that, while the magnitude and timing of responsiveness are altered, the underlying regulatory mechanisms are not entirely disrupted.
Harmonic analysis of normalized APW at-rest reveals a common qualitative signature of increased arterial stiffness in patients. Specifically, elevated 2nd harmonic amplitudes combined with marked attenuation of higher-order harmonics (5th–7th) are consistently observed at the RA. However, the 3rd and 4th harmonic amplitudes show heterogeneous behavior across patients, with values being either higher or lower than those of the healthy reference. Physiologically, this pattern suggests an altered baseline balance in arterial pulse dynamics, where the global low-frequency component (2nd harmonic) becomes more dominant, while fine waveform features represented by higher-order harmonics are attenuated. The variability in the 3rd and 4th harmonics further indicates inter-subject differences in intermediate-scale waveform structure, reflecting subject-specific differences in arterial waveform formation even at rest, likely related to variations in ventricular–arterial interaction and wave transmission characteristics.
At 5min post-exercise, the observed redistribution of harmonic amplitudes—characterized by an increase in the 2nd harmonic, relative stability of the 4th harmonic, and attenuation of the 3rd harmonic and higher-order harmonics (5th–7th)—indicates a shift in the APW toward lower-frequency dominance and reduced harmonic richness. This pattern reflects a reduced contribution of higher-order harmonics associated with rapid waveform transitions and finer structural components of the APW, while the 2nd harmonic becomes more prominent in shaping the overall waveform contour. Physiologically, this adjustment is consistent with early post-exercise recovery, during which the CV system transitions from an exercise-driven state toward re-establishment of baseline hemodynamic conditions. In this phase, the pulsatile pressure waveform becomes less dominated by higher-frequency components associated with rapid cardiac ejection dynamics and more governed by global circulatory behavior, reflecting a temporary reorganization of CV control as the system restores resting-level interaction between ventricular stroke volume and the arterial response.
These patterns are interpreted qualitatively, as absolute harmonic amplitudes depend on the TCS stack and are not directly comparable across subjects or arterial sites. The DN of APW at the RA is markedly lower than that of the healthy reference, compared with the CA. At the RA, the upstroke slope of the APW does not show meaningful differences between patients and the healthy reference, indicating limited sensitivity of this feature. In contrast, CA-based APW morphology reveals more pronounced differences in upstroke slope, suggesting greater sensitivity to stiffness-related alterations when assessed via upstroke slope.
Although MA affects other parameters at the CA, the normalized APW remains qualitatively reliable following SDOF-TF processing than HRV, RR and RM, which need fine time-derivative of the instant frequency in a measured pulse signal. Accordingly, APW-related features are interpreted with emphasis on relative patterns and longitudinal changes rather than absolute quantitative values. The harmonic amplitude distributions shown in Figs. 8–10 provide an explanation for the observed changes in the normalized APW in Figs. 11 and 12 across subjects and visits. It should be noted that, because the normalized APW depends on instantaneous phase values that are more susceptible to measurement artifacts, even after removal of MA and sensor noise, qualitative features such as upstroke slope and DN location are considered to have reliability comparable to that of the normalized harmonic amplitudes. However, fine-scale waveform details within the APW should be interpreted with caution.
RR and RM exhibit more variable behavior but still reflect common trends. Many patients show elevated at-rest RR and heterogeneous post-exercise responses, likely influenced by both CV and pulmonary factors. RM generally preserves its increasing trend with harmonic order, although its magnitude is often reduced. Together, these findings suggest a systemic reduction in physiological modulation across CV and respiratory domains. Finally, none of the patients exhibited a CV profile comparable to the healthy reference.
4.2. Individualized CV Profiles
Beyond common trends, the results highlight substantial inter-subject and intra-subject variability, underscoring the importance of individualized CV profiling. Distinct subject-specific patterns emerge across multiple metrics, reflecting different underlying CV phenotypes. The AF subject (CR041) consistently exhibits elevated HRV and RM, consistent with irregular rhythm and enhanced beat-to-beat variability in hemodynamic dynamics. In contrast, chronic systolic HF patients (CR037 and CR001) demonstrate persistently reduced HRV and RM, indicative of impaired autonomic and CV function. CR037 (CRT-D) shows the largest longitudinal deterioration in SHRV/HRV, whereas CR001 (ICD) exhibits very low temporal variation in SHRV/HRV across visits. Despite similar HF classification, the two subjects also differ in at-rest HR, with CR001 presenting a relatively elevated at-rest HR (~90 bpm) and CR037 showing a lower at-rest HR (~60 bpm), further reflecting heterogeneity in compensatory CV regulation within the same disease category.
CR014 (male, 71-75yr, CABG ×6, beta blocker) and CR044 (male, 66-70yr, CABG ×4, no beta blocker) exhibited the lowest at-rest RR among the cohort, yet both demonstrated pronounced longitudinal changes in at-rest HR and ΔHR/HR across visits. However, their longitudinal trajectories differ: CR014 shows a substantial decrease in at-rest HR over time, whereas CR044 exhibits a marked increase. Despite these opposing trends in baseline HR, both subjects display a clear longitudinal increase in ΔHR/HR, indicating progressively enhanced post-exercise heart rate modulation. Both patients have histories of extensive CABG without significant arrhythmias and maintained sinus rhythm throughout the study. Their stable cardiac rhythm and absence of implantable devices suggest that the observed HRV reflects genuine physiological adaptation or recovery post-revascularization, possibly indicating improvements in autonomic regulation or cardiac function over time. In contrast, CR036 (female, 51-55yr, CABG ×5) did not exhibit similar CV patterns despite a comparable surgical history. She maintained relatively stable at-rest HR and ΔHR/HR values longitudinally, which may be influenced by her younger age and sex, factors known to affect autonomic and CV recovery. This contrast highlights the heterogeneity of CV recovery and adaptation among patients with similar interventions, underscoring the importance of individualized monitoring in clinical practice.
The relationship between HR, APW morphology, and arterial stiffness also varies between individuals. In CR005, longitudinal changes in HR are accompanied by corresponding changes in normalized APW and arterial stiffness, suggesting a strong coupling between cardiac activity and vascular response. However, this relationship is not universal; for instance, CR029 shows relatively large HR variation without corresponding changes in normalized APW, indicating subject-specific differences in CV regulation. These observations further highlight that relationships between CV parameters are subject-specific and should be interpreted in a relative, rather than absolute, sense due to the influence of individual physiology.
The comparison between RA and CA measurements further supports the value of site-specific assessment. While RA-derived arterial stiffness often appears similar between patients and the healthy reference, CA measurements reveal more pronounced differences in arterial stiffness, particularly in terms of the upstroke slope of APW, suggesting higher sensitivity to pathological changes. Meanwhile, the DN in APW at the RA remains informative, often more revealing than at the CA. This site-specific distinction may be particularly important for early detection and monitoring of CV disease.
The case of CR029 in Visit 1 illustrates the complexity of individualized responses. This subject exhibits extreme, transient changes in harmonic amplitudes and APW morphology during post-exercise recovery, likely influenced by atrial paced and underlying cardiac dysfunction. Despite these atypical features, concurrent changes in arterial stiffness between at-rest and 5min and 10min post-exercise remain physiologically consistent, but no relation between ΔHR/HR and normalized APW changes underscores the importance of interpreting multiple parameters jointly rather than in isolation.
The effect of the outpatient cardiac rehabilitation program on the subjects was mixed. RA-derived parameters exhibited trends of improvement, stability, or deterioration, with patterns varying across CV parameters and across subjects. However, these changes cannot be attributed solely to the program, as longitudinal trajectories differed between subjects and derived parameters. All patients were on medication, and the short four-week observation period likely limits detection of physiologically meaningful CV adaptations. Cardiac rehabilitation is a 12-week program; therefore, measurements at 4 weeks may reflect an incomplete stage of rehabilitation. In addition, the results may be influenced by variability in the time interval between the intervention and the initiation of rehabilitation across patients. Future studies with longer follow-up, larger cohorts, and appropriately designed comparison cohorts are needed to better isolate program-specific effects from medication effects and natural disease progression.
4.3. HRV Calculated Based on Instantaneous HR and Instantaneous Initial Phase
Conventional HRV analysis [31,32,33,34] partitions RR interval variability in an ECG signal into frequency bands: very low frequency (VLF, <0.04 Hz), low frequency (LF, 0.04–0.15 Hz), and high frequency (HF, 0.15–0.4 Hz). In short-term recordings (~5 min), analysis mainly focuses on LF and HF components because reliable estimation of VLF oscillations is difficult over limited durations. HF power is commonly associated with respiration-related vagal activity, whereas LF reflects slower autonomic modulation. Power spectral density (PSD) analysis, typically performed using fast Fourier transform (FFT)- or autoregressive (AR)-based methods, assumes approximate stationarity and often requires interpolation of uneven RR intervals, which may affect estimation of slower variability components.
Conventional interpretations of CV autonomic regulation are primarily based on short-term HRV measures, where Root Mean Square of Successive Differences (RMSSD) and HF power are used as proxies of vagally mediated respiration-related modulation [31,32,33,34]. Within this framework, CV disease is generally associated with reduced parasympathetic (vagal) activity and relatively increased sympathetic dominance.
In contrast, the present study defines HRV through instantaneous CV dynamics derived from the SDOF-TF framework [11,35]. Specifically, instantaneous HR captures the overall HRV. The respiration-induced HRV is further extracted using the instantaneous initial phase information, while the PF-induced HRV is obtained as the residual component after removing respiration-induced HRV. This decomposition provides a direct separation between respiration-driven modulation and other physiological sources of CV variability, rather than relying on frequency-band partitioning or beat-to-beat statistics.
Accordingly, the present findings should be interpreted in the context of established literature showing that CV disease is associated with reduced parasympathetic (vagal) activity and relatively increased sympathetic dominance. Conventional short-term HRV measures (e.g., RMSSD and HF power) primarily reflect respiration-related modulation (omitting VLF) and therefore typically decrease in disease states. In the present framework, the respiration-induced component is explicitly isolated, while the PF-induced component reflects remaining CV variability beyond respiration (accounting for VLF). Therefore, changes in PF-induced HRV should be interpreted as alterations in non-respiratory CV dynamics rather than a direct contradiction of established autonomic findings. This provides a complementary perspective by enabling separation of distinct physiological contributions to HRV.
Nevertheless, the calculated HRV has demonstrated strong discriminatory ability, including 100% accuracy in AF detection [13], and clearly distinguishes the sole AF patient from the remaining subjects, indicating that the proposed decomposition retains sensitivity to abnormal CV dynamics.
4.4. Study Limitations
Several limitations should be considered when interpreting the findings of this study.
First, CA measurements are affected by substantial MA, which limits their use primarily to qualitative analysis of APW morphology. Consequently, key parameters such as HR, HRV, RR, and RM are derived exclusively from RA measurements, which may restrict comprehensive cross-site comparisons.
Second, the sample size is limited, and the cohort is heterogeneous with respect to underlying CV and pulmonary conditions. While this diversity enables the identification of subject-specific CV signatures, it limits the generalizability of the findings and precludes population-level statistical inference.
Third, the study includes a single healthy reference. Although the observed CV parameter patterns for this subject are consistent with established physiological findings reported in the literature [26,36], this does not capture the full range of normal inter-individual variability. Importantly, due to the dependence of arterial pulse measurements on the TCS stack, meaningful comparison requires that the reference be obtained using the same sensing configuration. Therefore, the healthy subject serves as a device-specific baseline rather than a population-level normative reference. Future studies incorporating a larger healthy cohort measured under identical conditions are needed to strengthen comparative analysis.
Fourth, although the SDOF-TF framework has demonstrated strong performance in prior studies—including AF detection from an independent PPG dataset [13] and physiologically interpretable results in representative clinical cases [11]—formal validation of the present sensing modality against established clinical gold standards was not performed in this study. Such validation remains an important direction for future work.
Fifth, the interpretation of normalized APW and harmonic amplitudes is primarily qualitative. This is due to the influence of the TCS stack, which affects the quantitative values of waveform-derived features and limits their direct comparison across subjects or arterial sites. While qualitative trends and within-subject longitudinal changes remain meaningful, the lack of robust quantitative indices constrains the ability to establish standardized clinical metrics.
Sixth, although efforts were made to suppress MA and sensor noise, residual effects may still influence the accuracy of higher-order harmonic components and phase-dependent APW reconstruction, particularly at the CA. As a result, some observed variations may reflect a combination of physiological changes and measurement-related factors.
Seventh, the longitudinal assessment was conducted over a relatively short duration (four weeks, across three visits), during which all patients were under ongoing medical treatment. The combined effects of medication, outpatient cardiac rehabilitation, lifestyle changes, and natural disease progression cannot be fully separated, and the short observation window may limit the detection of sustained physiological adaptations. In addition, the current protocol includes at-rest and extended post-exercise monitoring up to 1 hour, which appears unnecessarily long based on the present findings. The results indicate that patient-specific CV signatures can already be reliably captured using measurements at rest, and 5min and 10min post-exercise. Importantly, from a practical standpoint, prolonged post-exercise monitoring may discourage patient participation and reduce recruitment feasibility, as observed in this study.
Finally, traditional CV assessment often focuses on isolated parameters and their temporal changes. In contrast, the present study demonstrates that simultaneous assessment of multiple CV parameters provides a more comprehensive characterization of CV dynamics. The proposed framework enables extraction of multiple physiologically related parameters within a unified formulation, allowing evaluation of both individual parameter behavior and their collective evolution across visits. Pronounced individualized variations across multiple CV parameters suggest that inter-parameter relationships are also patient-specific and may differ across individuals. However, due to the strong variability in individual parameter magnitudes, these relationships cannot be reliably inferred through direct visual inspection of plots and warrant further quantitative investigation.
4.5. Additional Considerations and Future Work
The present findings indicate that RA pulse measurements combined with SDOF-TF-based analysis provide a comprehensive and effective framework for evaluating CV function. However, future studies should include larger and more diverse cohorts to improve generalizability. Further development of MA suppression techniques at the CA site is also required to fully exploit CA-based measurements.
In addition, the integration of machine learning approaches may facilitate automated and efficient characterization of individualized CV signatures, thereby improving diagnostic and prognostic capabilities. Notably, implementation of the SDOF-TF algorithm for pulse signal analysis is computationally efficient and straightforward. The primary challenge lies not in the signal processing required to extract CV parameters, but in the longitudinal interpretation of extracted CV parameters, both within and across subjects, particularly when comparing at-rest and post-exercise states, owing to the substantial inter- and intra-subject variability in individualized CV profiles.
Overall, the long-term value of this work lies in its potential to support patient-specific CV assessment and enable more personalized therapeutic and rehabilitation strategies. In particular, the simplicity of both the tactile sensor-based pulse measurement and the proposed SDOF-TF framework enables rapid, on-the-spot assessment of CV responses. This makes the approach potentially useful for monitoring the effects of medication and rehabilitation in real time. Such capability may facilitate more adaptive and personalized clinical decision-making, where changes in CV function can be tracked longitudinally with minimal measurement and signal-processing burden, ultimately supporting personalized patient management.
5. Conclusions
This study demonstrates that RA pulse signal analysis using the SDOF-TF method provides a robust and nuanced framework for evaluating CV function across a heterogeneous patient cohort. Common patterns of reduced autonomic regulation, increased arterial stiffness, reflected in qualitative harmonic signatures and the relative location of DN in APW, and blunted post-exercise responses were observed alongside substantial individual variability in CV dynamics, highlighting the importance of personalized CV profiling. While RA metrics capture essential features, CA-based APW analysis reveals greater sensitivity to the upstroke slope, underscoring the value of site-specific and multimodal assessment.
Despite limitations related to MA, sample size, and reliance on a single healthy reference, this approach effectively captures both common trends and subject-specific CV features, supporting its potential for noninvasive and personalized evaluation. Future work incorporating larger and more diverse populations, improved MA suppression at the CA site, and machine learning-driven analysis of individualized CV signatures will be critical to unlocking the full potential of individualized CV diagnostics and prognostics.
Supplementary Materials
The following supporting information can be downloaded at: Preprints.org.
Author Contributions
Conceptualization, Z.H.; methodology, Z.H., M.R., M.H., and L.R.; software, Z.H., M.R., M.H.; validation, Z.H., M.R., M.H., L.R., J.M., and J.H.; formal analysis, M.R. and M.H.; investigation, M.R., M.H., and J.M.; resources, Z.H., J.M., and J.H.; data curation, M.R., M.H., and J.M.; writing—original draft preparation, Z.H.; writing—review and editing, Z.H., L.R., J.M., and J.H.; visualization, Z.H. and M.R.; supervision, Z.H.; project administration, Z.H.; funding acquisition, Z.H. and J.H. All authors have read and agreed to the published version of the manuscript.
Funding
This research received no external funding.
Institutional Review Board Statement
Human participant measurements were performed under the approval of the Eastern Virginia Medical School, Virginia Health Sciences IRB at Old Dominion University (IRB Approval #19-04-FB-0100) and the ODU Institutional Review Board (IRB #I RB24-166).
Informed Consent Statement
Informed consent has been obtained from the subjects involved in the study for publication.
Data Availability Statement
Due to institutional policy and applicable privacy regulations, individual-level patient data will not be shared with external investigators or repositories. These restrictions are necessary to protect patient confidentiality and comply with institutional governance of clinical data resources.
Acknowledgments
This material is based upon work supported by the National Science Foundation under Award No. 1936005.
Conflicts of Interest
The authors declare no conflicts of interest, except that a provisional patent application has been filed for the SDOF-TF method and its associated algorithms (patent pending). The SDOF-TF method and its associated algorithms will be developed into software for future commercial licensing, and the software implementation is protected by copyright owned by Old Dominion University.
Abbreviations
The following abbreviations for CV diseases are used in this manuscript:
| CRT-D | Biventricular Implantable Cardioverter Defibrillator |
| ICD | Implantable Cardioverter-Defibrillator |
| CABG | Coronary Artery Bypass Grafting |
| HF | Heart Failure |
| SR | Heart Failure with reduced Ejection Fraction |
| IPF | Idiopathic Pulmonary Fibrosis |
| MR | Mitral Regurgitation |
| MI | Myocardial Infarction |
| MVR | Mitral Valve Repair |
| NSTEMI | Non-ST-segment Elevation Myocardial Infarction |
| PCI | Percutaneous Coronary Intervention |
| SR | Sinus Rhythm |
| TAVR | Transcatheter Aortic Valve Replacement |
| AF | Atrial Fibrillation |
References
- Chong, B.; Jayabaskaran, J.; Jauhari, S.M.; Chan, S.P.; Goh, R.; Kueh, M.T.W.; Li, H.; Chin, Y.H.; Kong, G.; Anand, V.V.; et al. Global burden of cardiovascular diseases: projections from 2025 to 2050. Eur. J. Prev. Cardiol. 2025, 32, 1001–1015. [Google Scholar] [CrossRef] [PubMed]
- Naeem, U.; Deo, S.; Sahebkar, A.; Sheikh, S.; Khoja, A.; Vaughan, E.M.; Abdul Jabbar, A.B.; Kalra, D.K.; Slipczuk, L.; Virani, S.S. Global Burden of Cardiovascular Disease: What Should Be Expected in the Next 25 Years? Curr. Cardiol. Rep. 2026, 28. [Google Scholar] [CrossRef] [PubMed]
- 2026 Heart Disease and Stroke Statistics Update Fact Sheet: At-a-Glance; American Heart Association: Dallas, TX, 2026.
- Shiwani, M.A.; Chico, T.J.A.; Ciravegna, F.; Mihaylova, L. Continuous Monitoring of Health and Mobility Indicators in Patients with Cardiovascular Disease: A Review of Recent Technologies. Sensors 2023, 23. [Google Scholar] [CrossRef] [PubMed]
- Brown, T.M.; Pack, Q.R.; Aberegg, E.; Brewer, L.C.; Ford, Y.R.; Forman, D.E.; Gathright, E.C.; Khadanga, S.; Ozemek, C.; Thomas, R.J. Core Components of Cardiac Rehabilitation Programs: 2024 Update: A Scientific Statement From the American Heart Association and the American Association of Cardiovascular and Pulmonary Rehabilitation. Circulation 2024, 150, e328–e347. [Google Scholar] [CrossRef] [PubMed]
- Chen, J.; Jastrzebska-Perfect, P.; Chai, P.; Say, M.G.; Tu, J.; Gao, W.; Halperin, F.; Korzenik, J.; Huang, H.W.; Katabi, D.; et al. Barriers to translating continuous monitoring technologies for preventative medicine. Nat. BioMed Eng. 2025, 9, 1797–1815. [Google Scholar] [CrossRef] [PubMed]
- Presacan, O.; Dorobanţiu, A.; Isaksen, J.L.; Willi, T.; Graff, C.; Riegler, M.A.; Sridhar, A.R.; Kanters, J.K.; Thambawita, V. Evaluating the feasibility of 12-lead electrocardiogram reconstruction from limited leads using deep learning. Commun. Med. 2025, 5, 139. [Google Scholar] [CrossRef] [PubMed]
- Stracina, T.; Ronzhina, M.; Redina, R.; Novakova, M. Golden Standard or Obsolete Method? Review of ECG Applications in Clinical and Experimental Context. Front. Physiol. 2022, 13. [Google Scholar] [CrossRef] [PubMed]
- Khunti, K. Accurate interpretation of the 12-lead ECG electrode placement: A systematic review. Health Educ. J. 2014, 73, 610–623. [Google Scholar] [CrossRef]
- Hao, Z. Motion Artifacts Removal from Measured Arterial Pulse Signals at Rest: A Generalized SDOF-Model-Based Time–Frequency Method. Sensors 2025, 25, 6808. [Google Scholar] [CrossRef] [PubMed]
- Rahman, M.M.; Hasan, M.; May, J.; Herre, J.; Reynolds, L.; Hao, Z. Radial and carotid arterial pulse signals for assessing cardiovascular function at rest and during post-exercise recovery in a heart transplant patient: a case study. Med. Sens. Imaging 2026. [Google Scholar] [CrossRef]
- Chon, K.H.; Dash, S.; Ju, K. Estimation of Respiratory Rate From Photoplethysmogram Data Using Time–Frequency Spectral Estimation. IEEE Trans. Biomed. Eng. 2009, 56, 2054–2063. [Google Scholar] [CrossRef] [PubMed]
- Hasan, M.; Hao, Z. Atrial Fibrillation Detection from At-Rest PPG Signals Using an SDOF-TF Method. Sensors 2026, 26, 416. [Google Scholar] [CrossRef] [PubMed]
- Wang, D.; Shen, J.; Mei, L.; Qian, S.; Li, J.; Hao, Z. Performance Investigation of a Wearable Distributed-Deflection Sensor in Arterial Pulse Waveform Measurement. IEEE Sens. J. 2017, 17, 3994–4004. [Google Scholar] [CrossRef]
- Hao, Z.; Wang, D. Arterial Pulse Signal Amplification by Adding a Uniform PDMS Layer to a Pyrex-Based Microfluidic Tactile Sensor. IEEE Sens. J. 2020, 20, 2164–2172. [Google Scholar] [CrossRef]
- Elgendi, M. On the analysis of fingertip photoplethysmogram signals. Curr. Cardiol. Rev. 2012, 8, 14–25. [Google Scholar] [CrossRef] [PubMed]
- Wang, H.; Wang, L.; Sun, N.; Yao, Y.; Hao, L.; Xu, L.; Greenwald, S.E. Quantitative Comparison of the Performance of Piezoresistive, Piezoelectric, Acceleration, and Optical Pulse Wave Sensors. Front Physiol. 2019, 10, 1563. [Google Scholar] [CrossRef] [PubMed]
- Wang, D.; Reynolds, L.; Alberts, T.; Vahala, L.; Hao, Z. Model-based analysis of arterial pulse signals for tracking changes in arterial wall parameters: a pilot study. Biomech. Model Mechanobiol. 2019, 18, 1629–1638. [Google Scholar] [CrossRef]
- Xu, L.; Zhou, S.; Wang, L.; Yao, Y.; Hao, L.; Qi, L.; Yao, Y.; Han, H.; Mukkamala, R.; Greenwald, S.E. Improving the accuracy and robustness of carotid-femoral pulse wave velocity measurement using a simplified tube-load model. Sci. Rep. 2022, 12, 5147. [Google Scholar] [CrossRef] [PubMed]
- Ding, X.; Yan, B.P.; Zhang, Y.-T.; Liu, J.; Zhao, N.; Tsang, H.K. Pulse Transit Time Based Continuous Cuffless Blood Pressure Estimation: A New Extension and A Comprehensive Evaluation. Sci. Rep. 2017, 7, 11554. [Google Scholar] [CrossRef] [PubMed]
- Hao, Z. A 2-DOF Model of the Artery-Sensor System for Interpreting Variability in Measured Arterial Pulse Waveform. IEEE Sens. J. 2023, 23, 22668–22678. [Google Scholar] [CrossRef]
- Liu, H.; Chen, F.; Hartmann, V.; Khalid, S.G.; Hughes, S.; Zheng, D. Comparison of different modulations of photoplethysmography in extracting respiratory rate: from a physiological perspective. Physiol. Meas. 2020, 41, 094001. [Google Scholar] [CrossRef] [PubMed]
- Xu, L.; Zhang, D.; Wang, K.; Li, N.; Wang, X. Baseline wander correction in pulse waveforms using wavelet-based cascaded adaptive filter. Comput Biol. Med. 2007, 37, 716–731. [Google Scholar] [CrossRef] [PubMed]
- Afandizadeh Zargari, A.H.; Aqajari, S.A.H.; Khodabandeh, H.; Rahmani, A.-M.; Kurdahi, F.J. An Accurate Non-accelerometer-based PPG Motion Artifact Removal Technique using CycleGAN. ACM Trans. Comput. Healthc. 2021, 4, 1–14. [Google Scholar]
- Pollreisz, D.; TaheriNejad, N. Detection and Removal of Motion Artifacts in PPG Signals. Mob. Netw. Appl. 2022, 27, 728–738. [Google Scholar] [CrossRef]
- Rahman, M.M.; Hasan, M.; Hao, Z. Motion Artifacts (MA) At-Rest in Measured Arterial Pulse Signals: Time-Varying Amplitude in Each Harmonic and Non-Flat Harmonic-MA-Coupled Baseline. Biosensors 2025, 15, 578. [Google Scholar] [CrossRef] [PubMed]
- Rahman, M.M.; Toraskar, S.; Hasan, M.; Hao, Z. An Analytical Model of Motion Artifacts in a Measured Arterial Pulse Signal—Part I: Accelerometers and PPG Sensors. Sensors 2025, 25, 5710. [Google Scholar] [CrossRef] [PubMed]
- Rahman, M.M.; Toraskar, S.; Hasan, M.; Hao, Z. An Analytical Model of Motion Artifacts in a Measured Arterial Pulse Signal—Part II: Tactile Sensors. Sensors 2025, 25, 5700. [Google Scholar] [CrossRef] [PubMed]
- Chen, Z.; Brown, E.N.; Barbieri, R. Assessment of autonomic control and respiratory sinus arrhythmia using point process models of human heart beat dynamics. IEEE Trans. BioMed Eng. 2009, 56, 1791–1802. [Google Scholar] [CrossRef] [PubMed]
- Hao, Z. Harmonics of Pulsatile Pressure at Different Ages and Its Effect on Other Pulsatile Parameters and Waveform-Based Clinical Indices. J. Eng. Sci. Med. Diagn. Ther. 2023, 7. [Google Scholar] [CrossRef]
- Electrophysiology, T.F.o.t.E.S.o.C.t.N.A.S.o.P. Heart Rate Variability. Circulation 1996, 93, 1043–1065. [Google Scholar] [CrossRef]
- Berntson, G.G.; Thomas Bigger, J., Jr.; Eckberg, D.L.; Grossman, P.; Kaufmann, P.G.; Malik, M.; Nagaraja, H.N.; Porges, S.W.; Saul, J.P.; Stone, P.H.; et al. Heart rate variability: Origins, methods, and interpretive caveats. Psychophysiology 1997, 34, 623–648. [Google Scholar] [CrossRef] [PubMed]
- Shaffer, F.; Ginsberg, J.P. An Overview of Heart Rate Variability Metrics and Norms. Front. Public Health 2017, 5. [Google Scholar] [CrossRef] [PubMed]
- Ernst, G. Heart-Rate Variability—More than Heart Beats? Front. Public Health 2017, 5. [Google Scholar] [CrossRef] [PubMed]
- Hasan, M.; Hao, Z. Influence of motion artifacts on instantaneous frequencybased heart rate variability of arterial pulse signals measured by a tactile sensor: an analytical study. Medical Sensors & Imaging 2026.
- Hao, Z.; Wang, D.; Reynolds, L. Post-exercise Response of Arterial Parameters for Arterial Health Assessment Using a Microfluidic Tactile Sensor and Vibration-Model-Based Analysis: A Proof-of-Concept Study. Cardiovasc. Eng. Technol. 2020, 11, 295–307. [Google Scholar] [CrossRef] [PubMed]
Figure 1.
At-rest and 30min post-exercise HR of the subjects (note: some subjects did not reveal a consistent increasing or decreasing trend of at-rest HR across the three visits).
Figure 1.
At-rest and 30min post-exercise HR of the subjects (note: some subjects did not reveal a consistent increasing or decreasing trend of at-rest HR across the three visits).
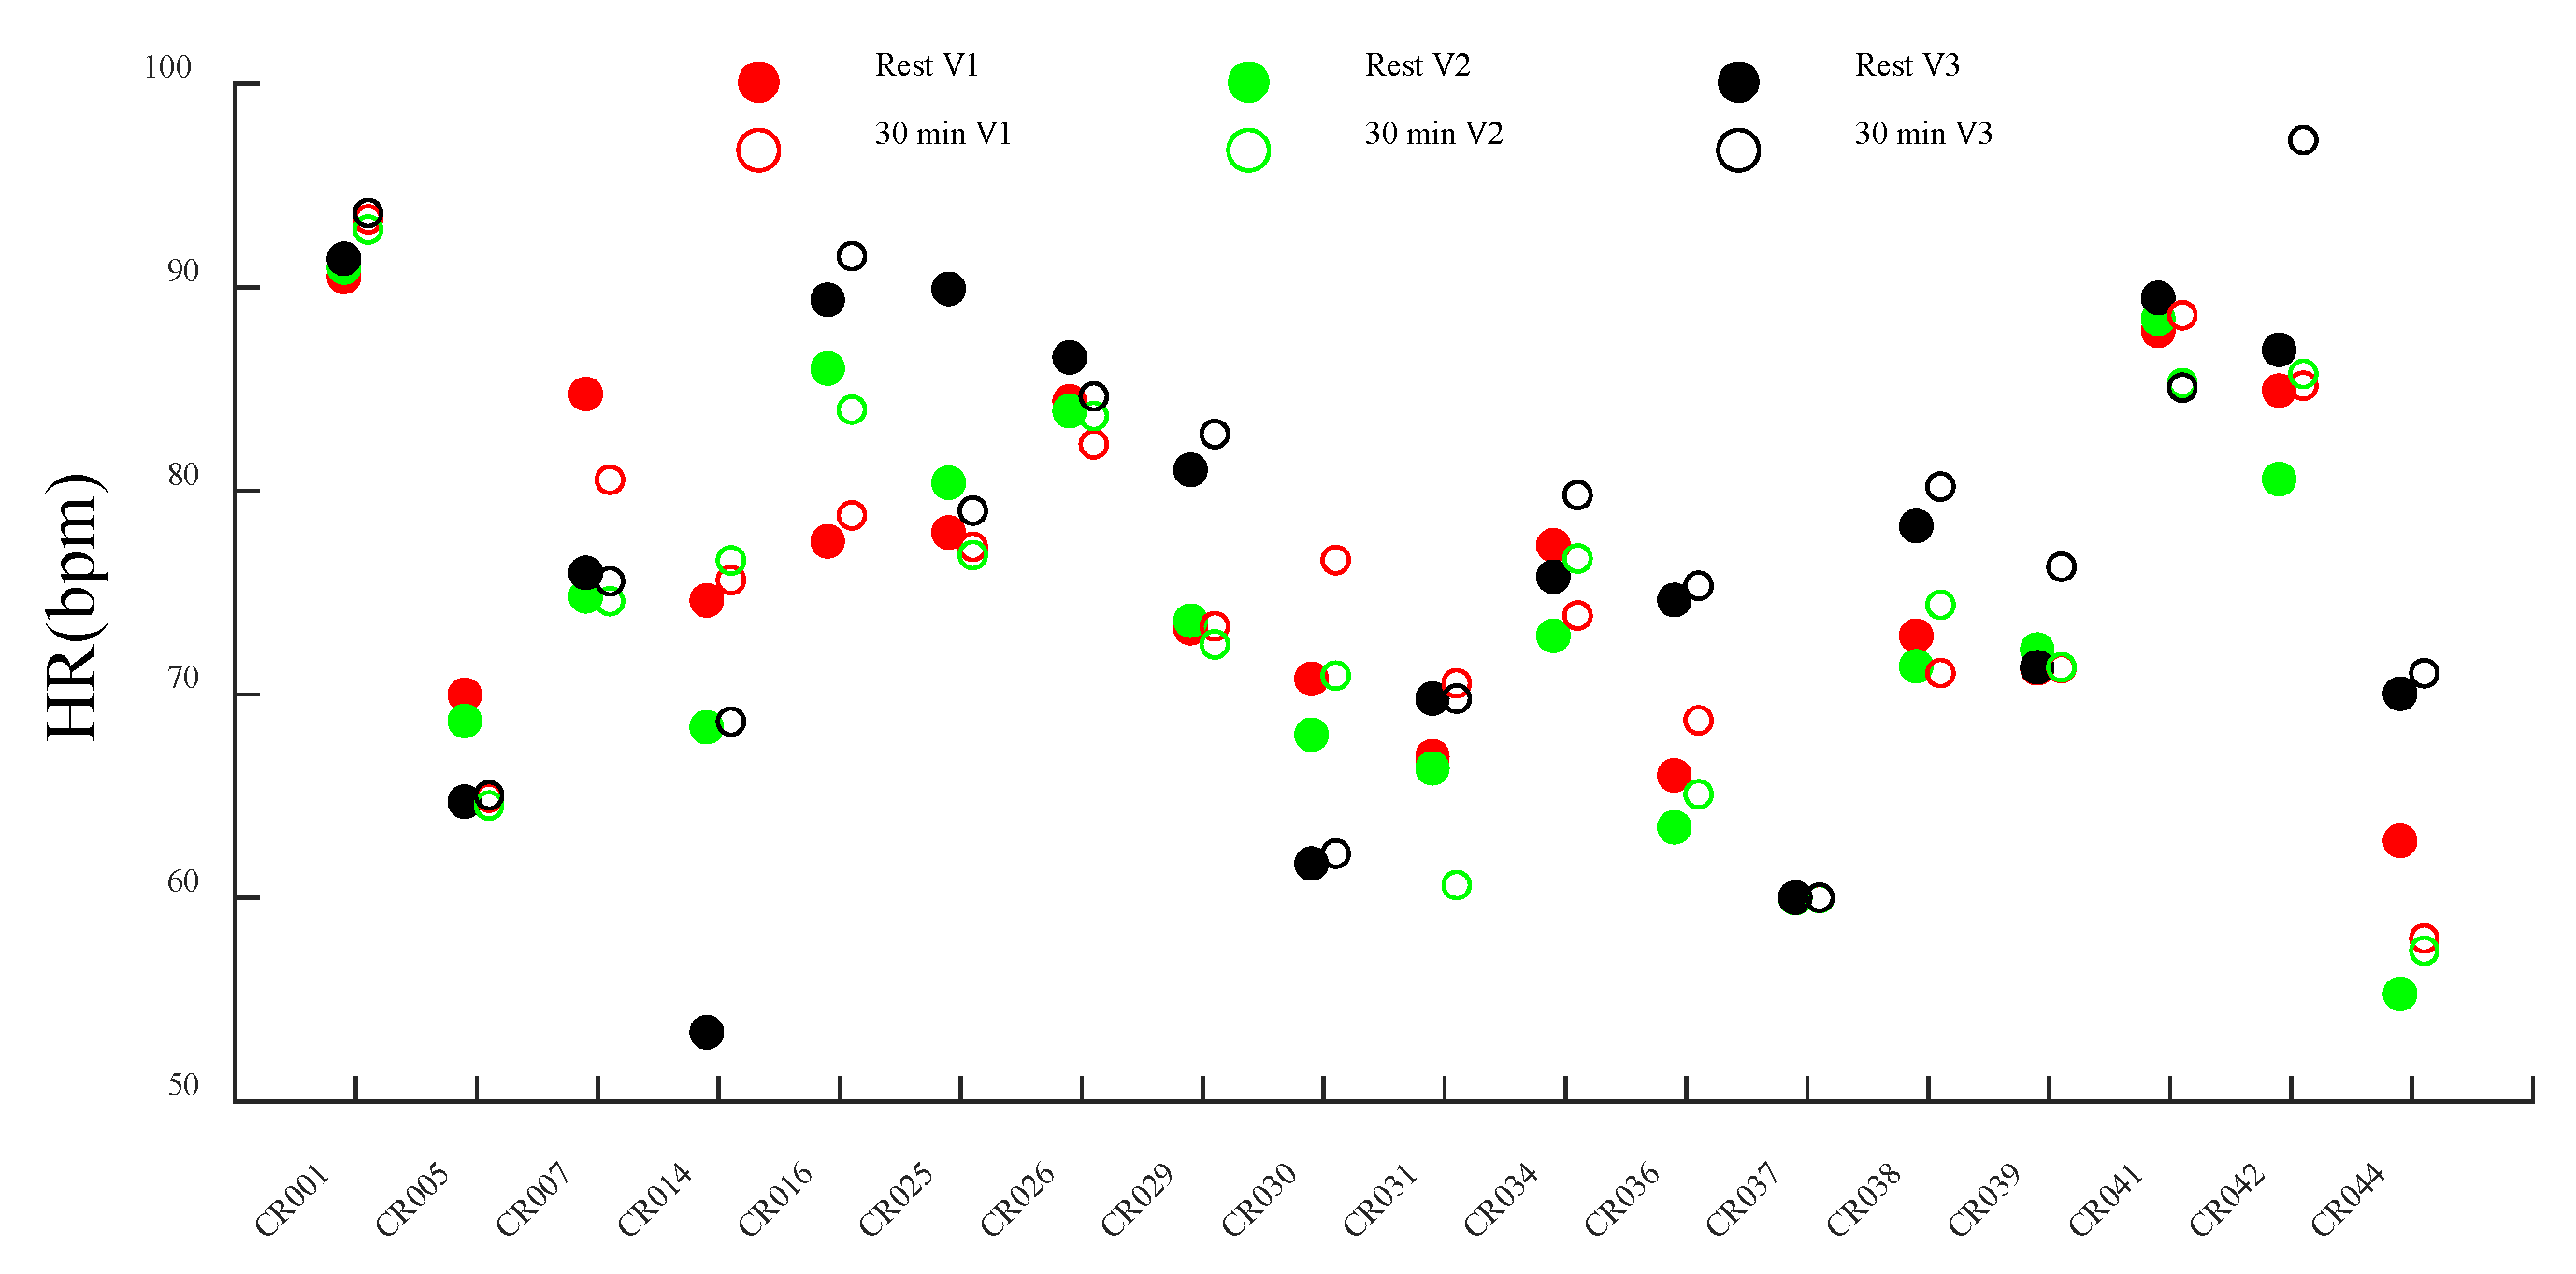
Figure 2.
The highest observed ΔHR/HR during post-exercise recovery of the subjects (note: some subjects did not reveal a consistent increasing or decreasing trend of at-rest HR across the three visits).
Figure 2.
The highest observed ΔHR/HR during post-exercise recovery of the subjects (note: some subjects did not reveal a consistent increasing or decreasing trend of at-rest HR across the three visits).
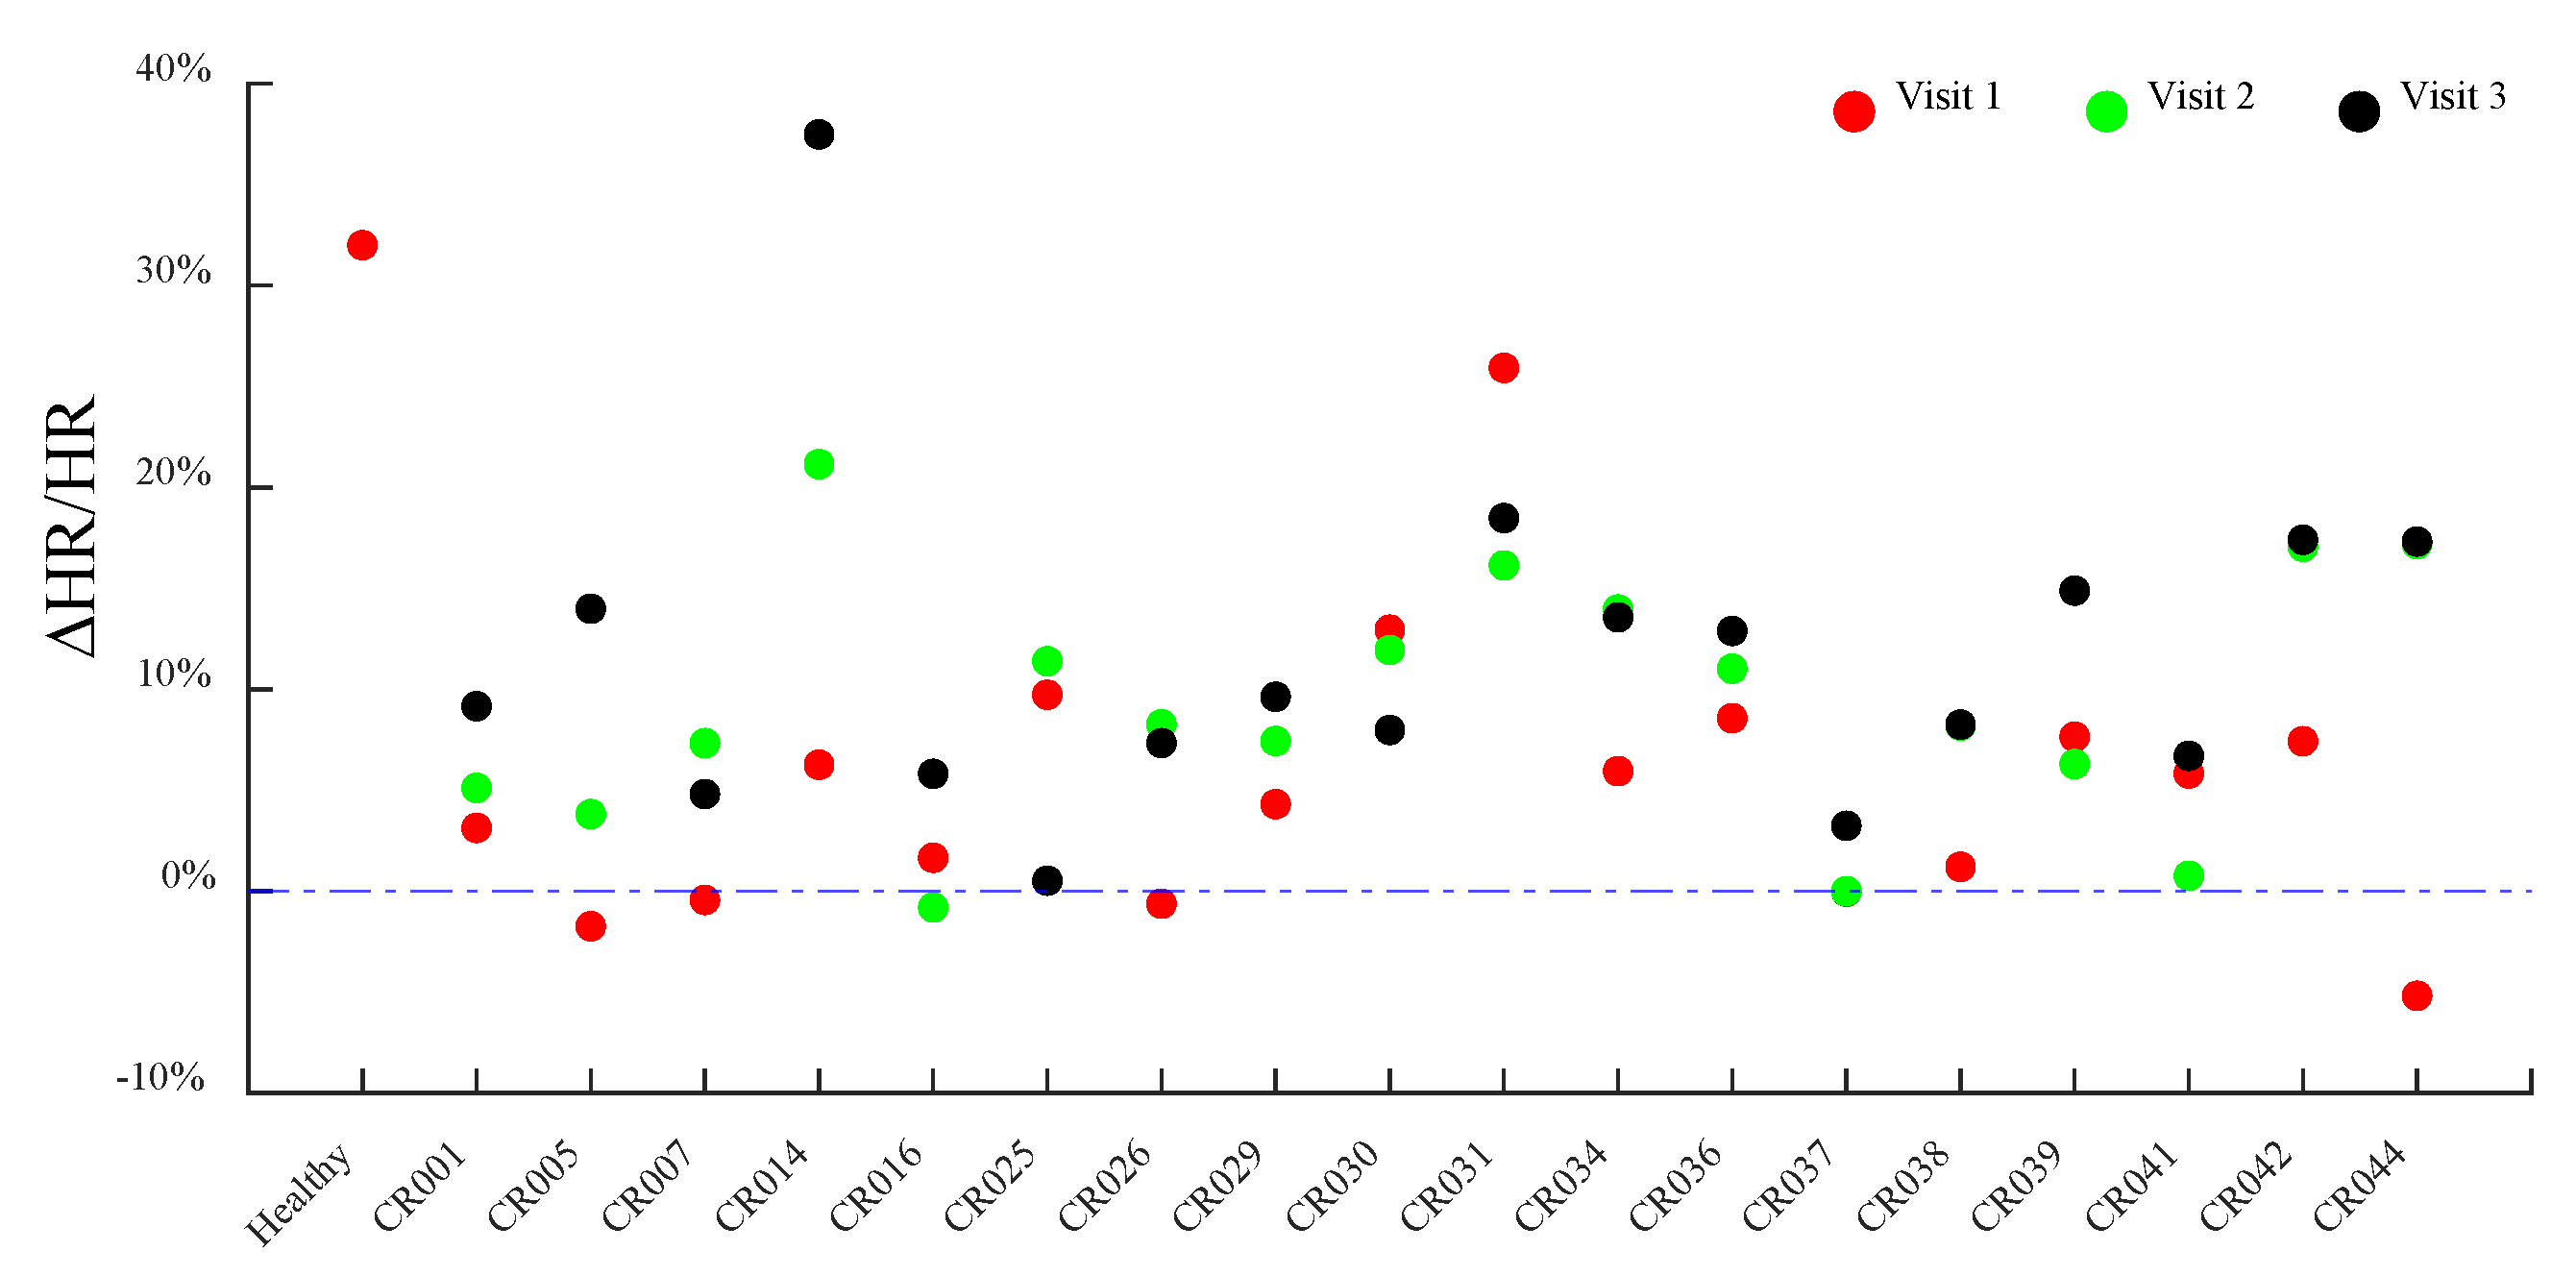
Figure 3.
At-rest HRV of the subjects.
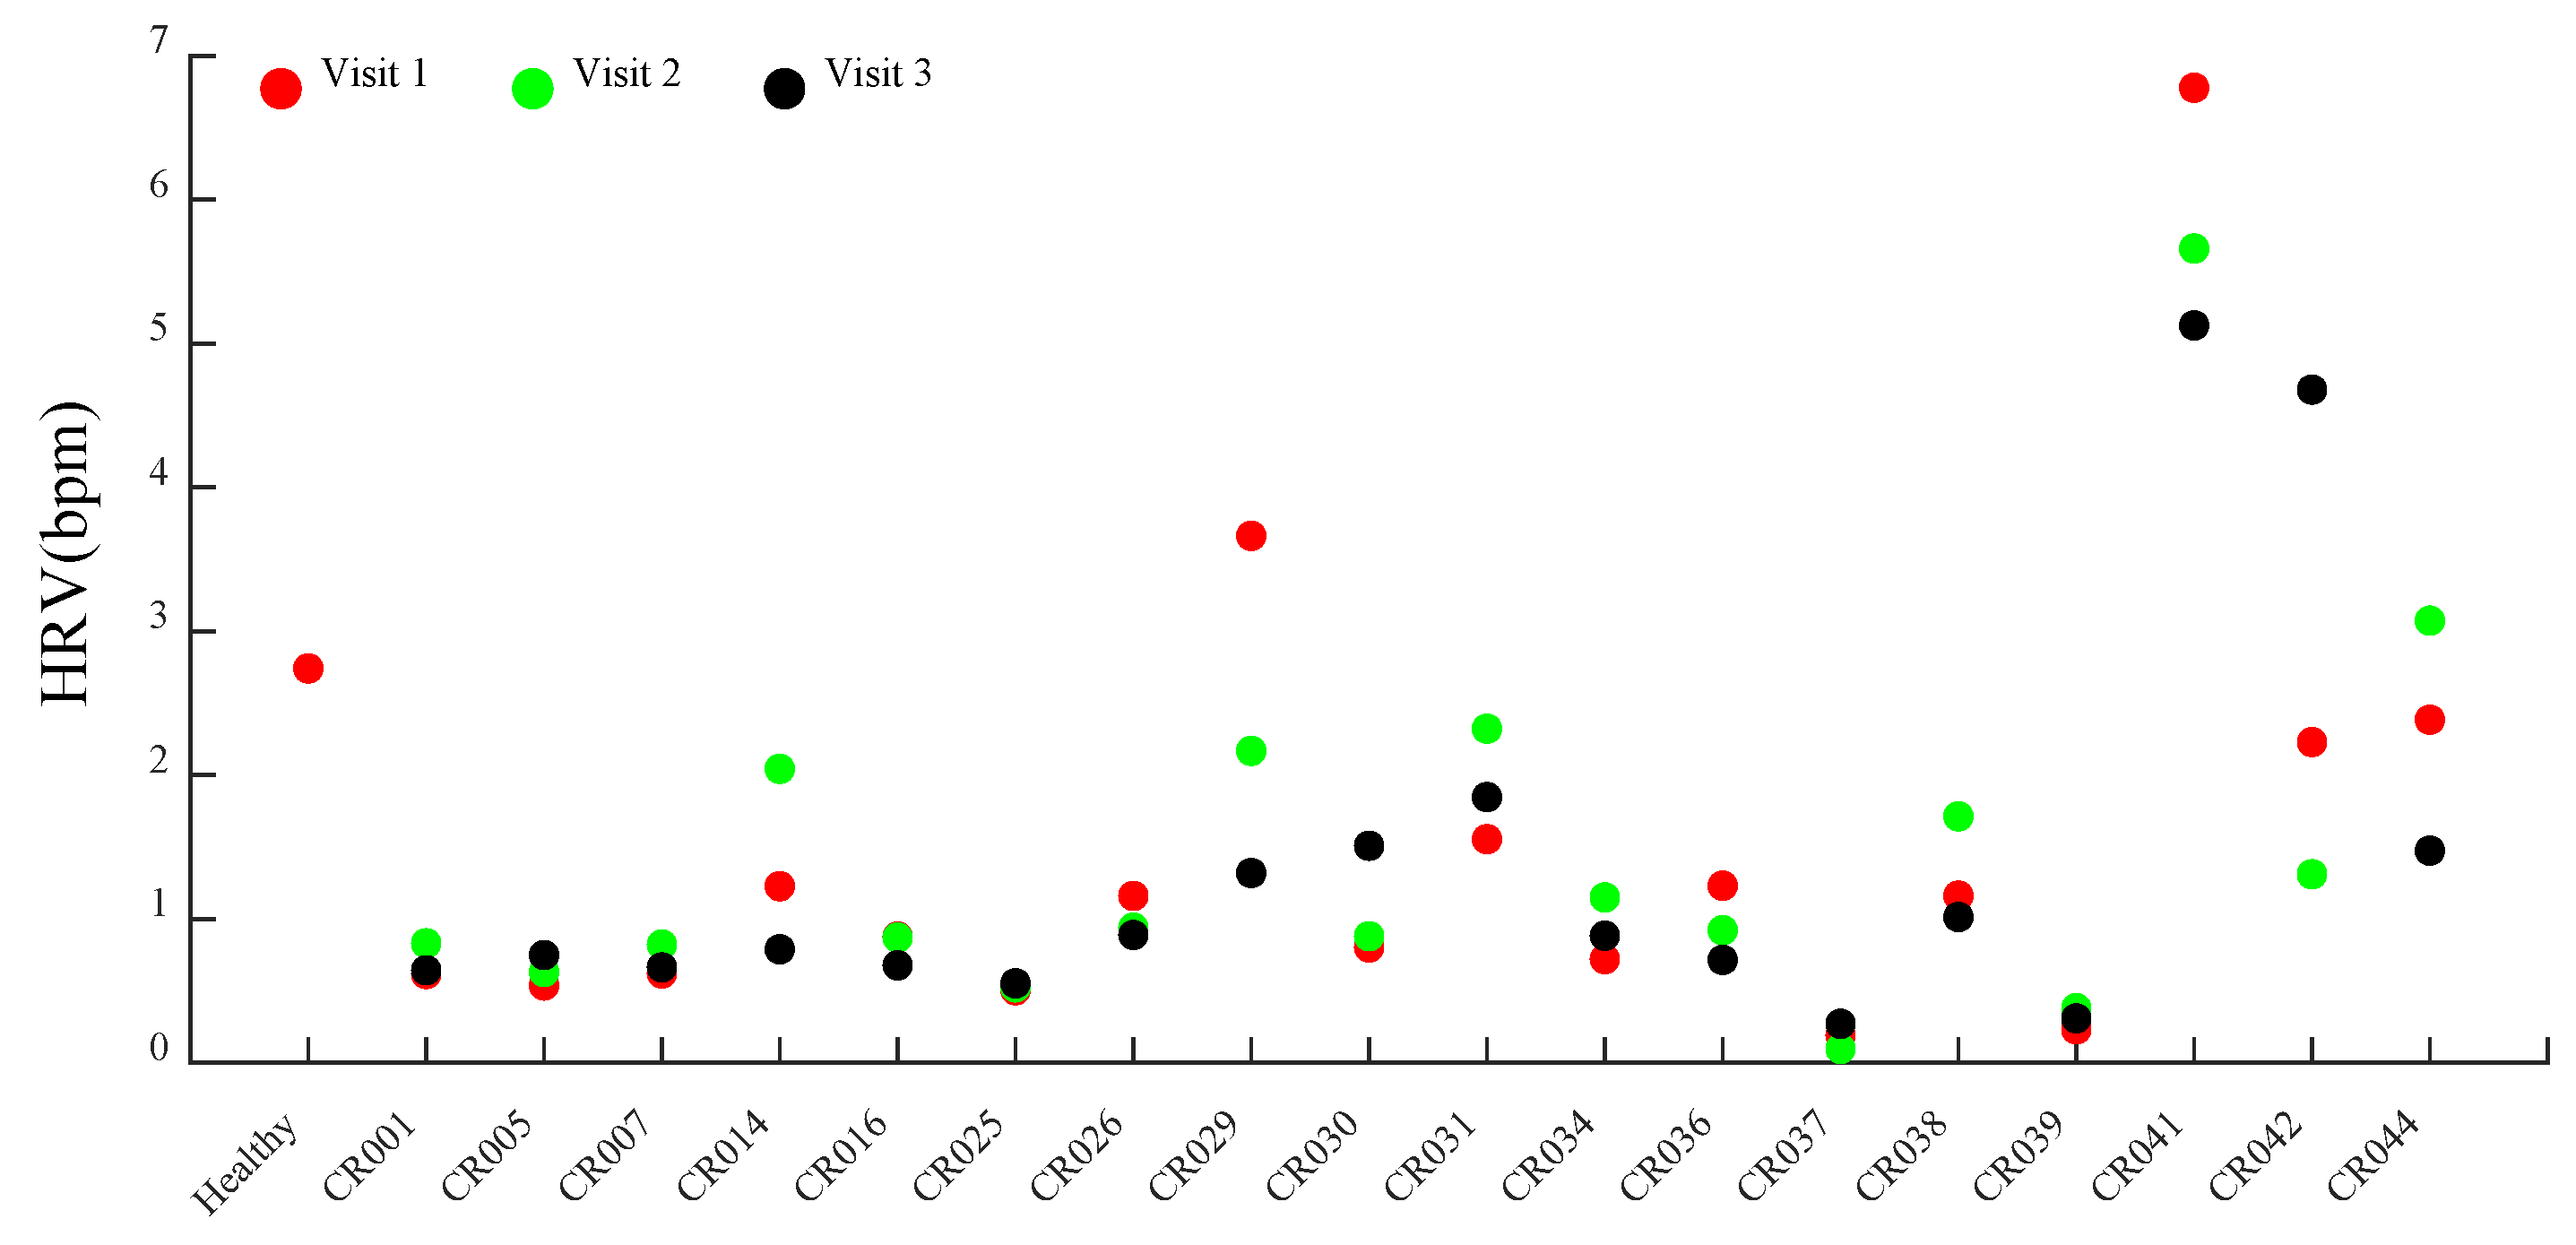
Figure 4.
At-rest SHRV/HRV of the subjects.
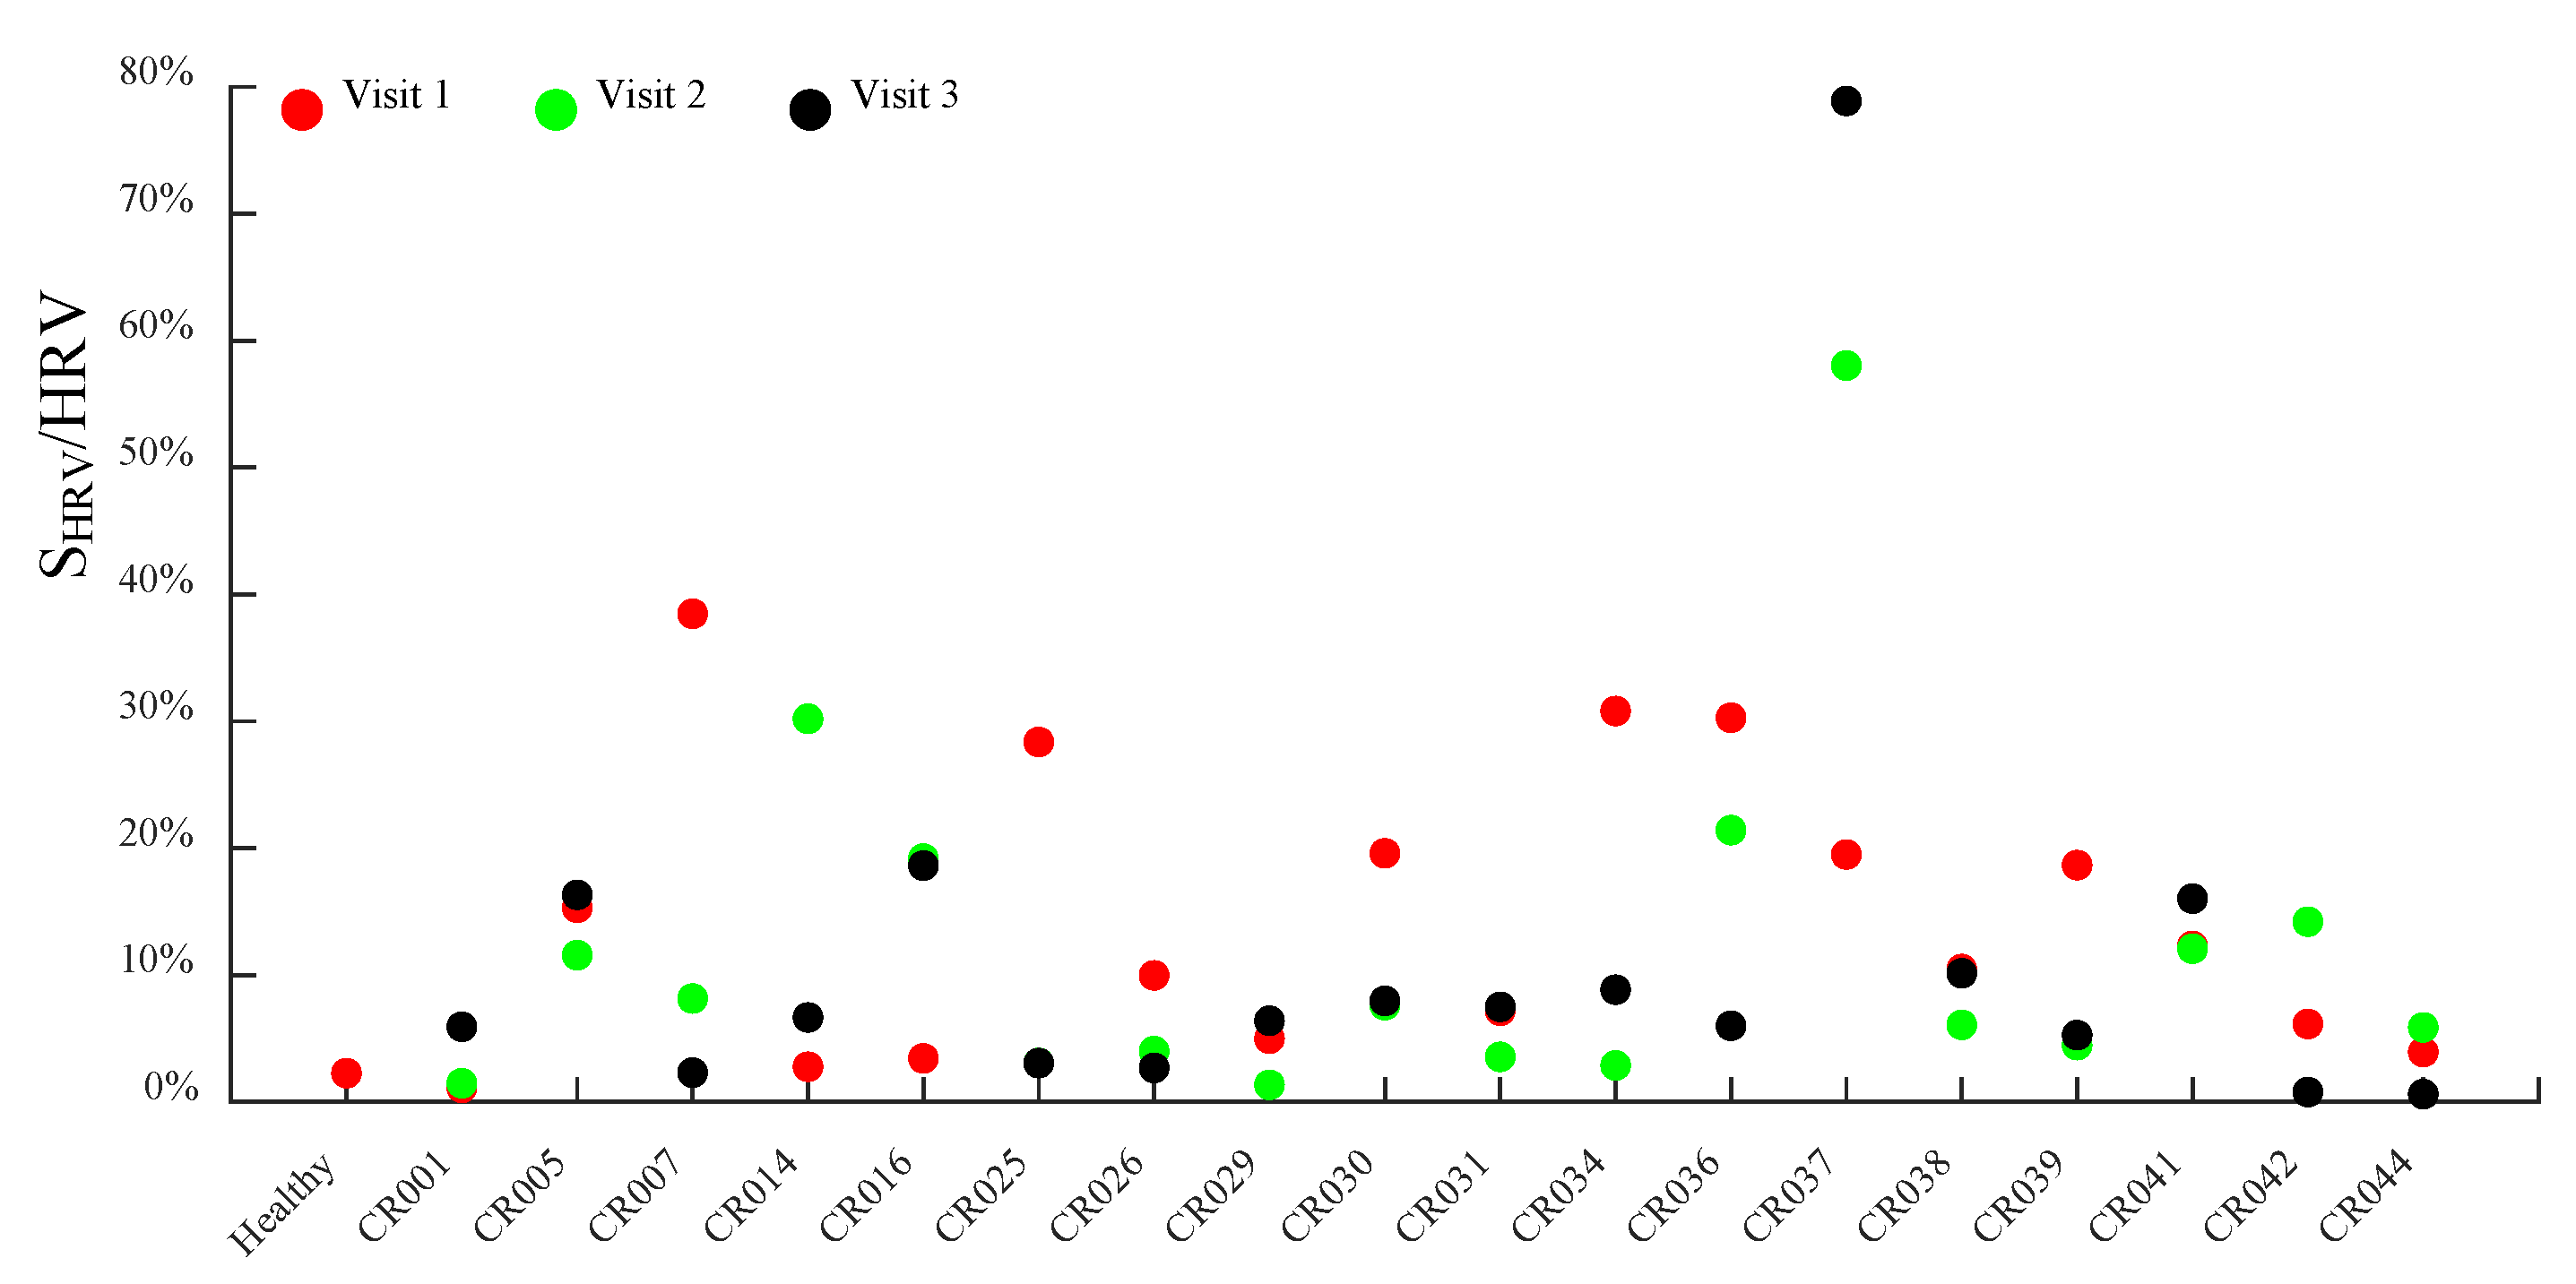
Figure 5.
At-rest HRVPF/HRV of the subjects.
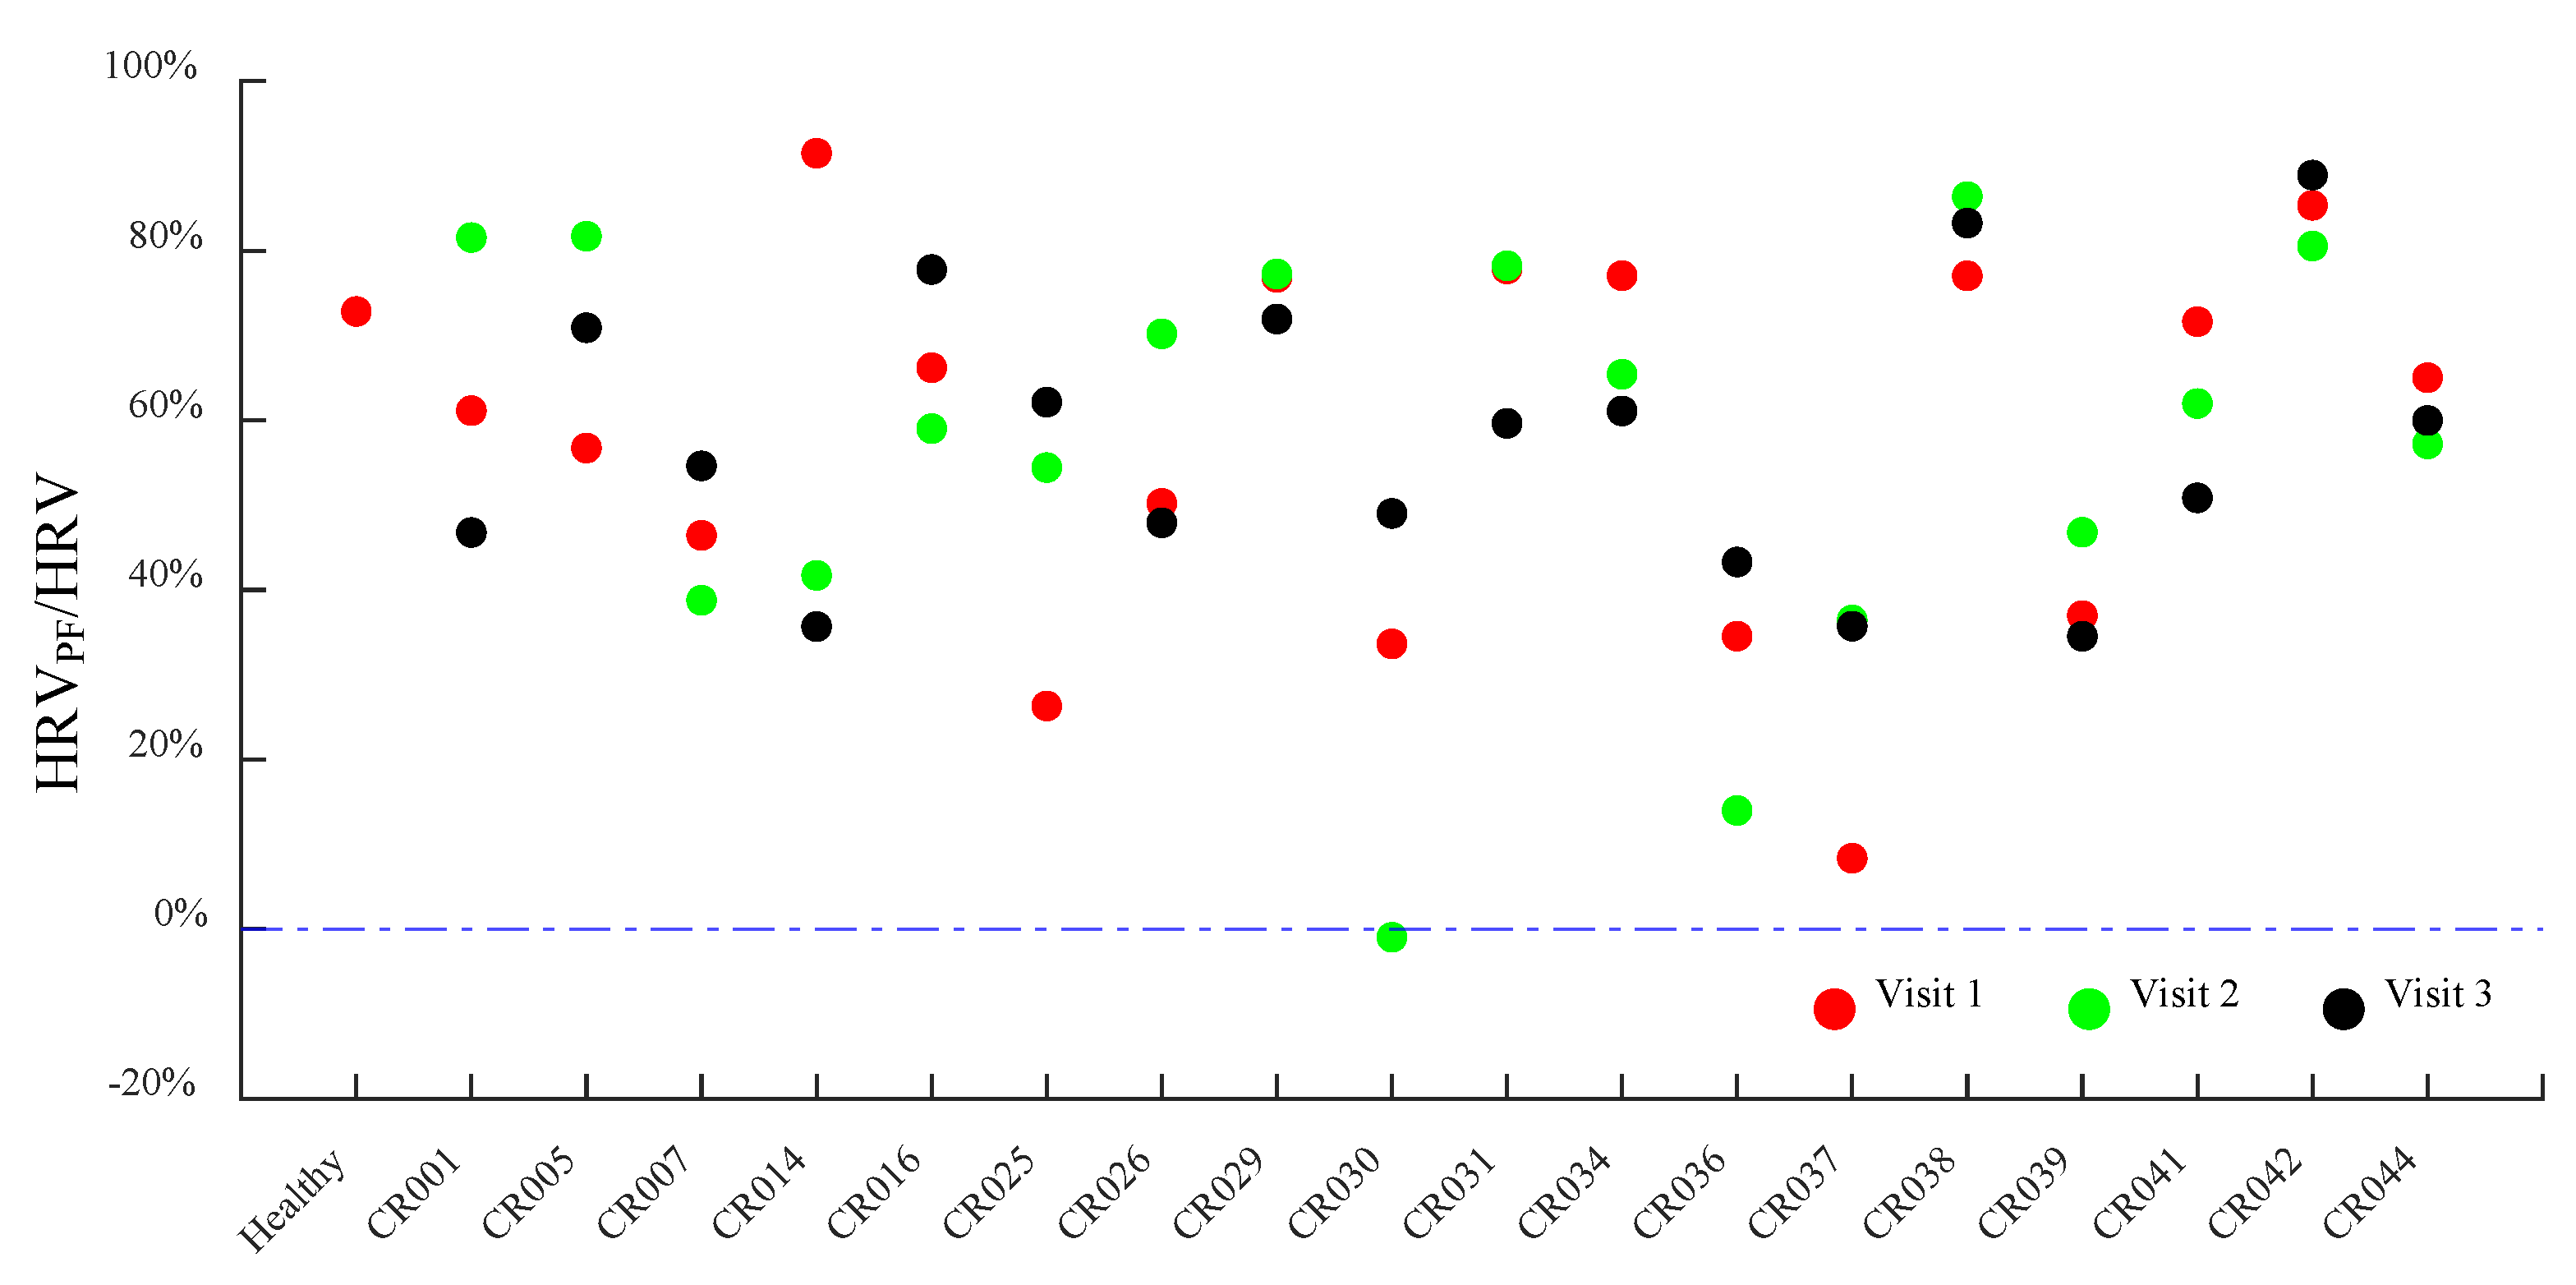
Figure 6.
At-rest and 30 min post-exercise RR of the subjects (note: the lines represent the mean ± standard deviation (SD) of the patient group, excluding the healthy reference).
Figure 6.
At-rest and 30 min post-exercise RR of the subjects (note: the lines represent the mean ± standard deviation (SD) of the patient group, excluding the healthy reference).
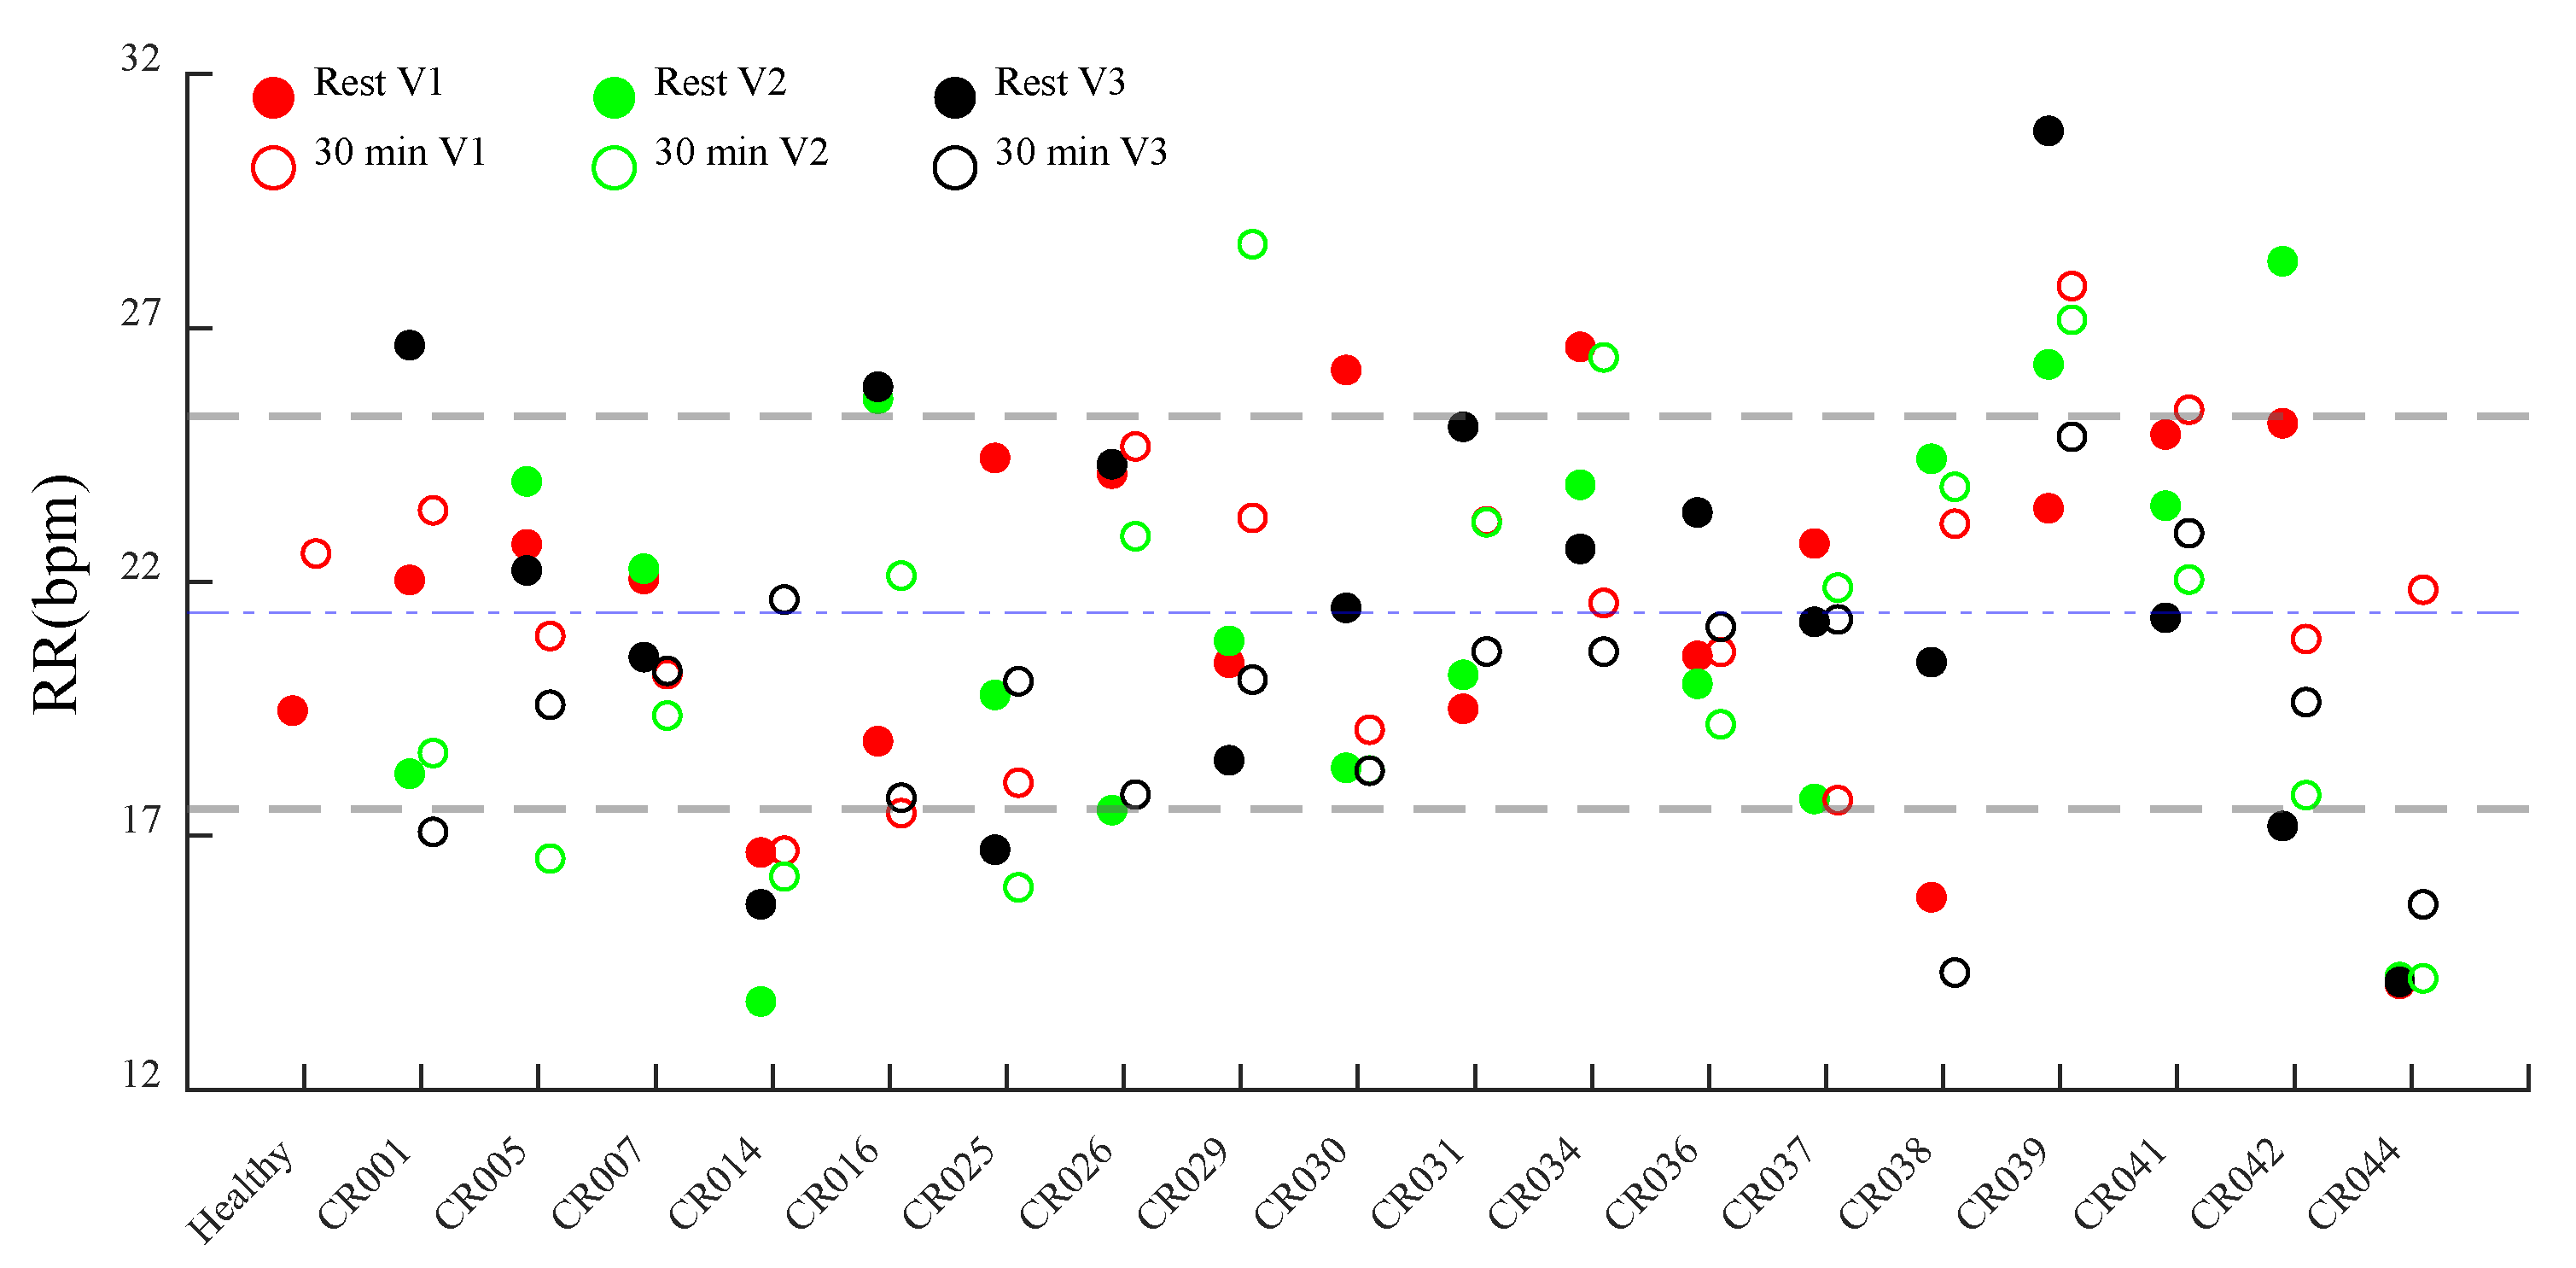
Figure 7.
At-rest and 30min post-exercise RM of the subjects (a) RM of each harmonic (b) averaged RM across the three harmonics.
Figure 7.
At-rest and 30min post-exercise RM of the subjects (a) RM of each harmonic (b) averaged RM across the three harmonics.
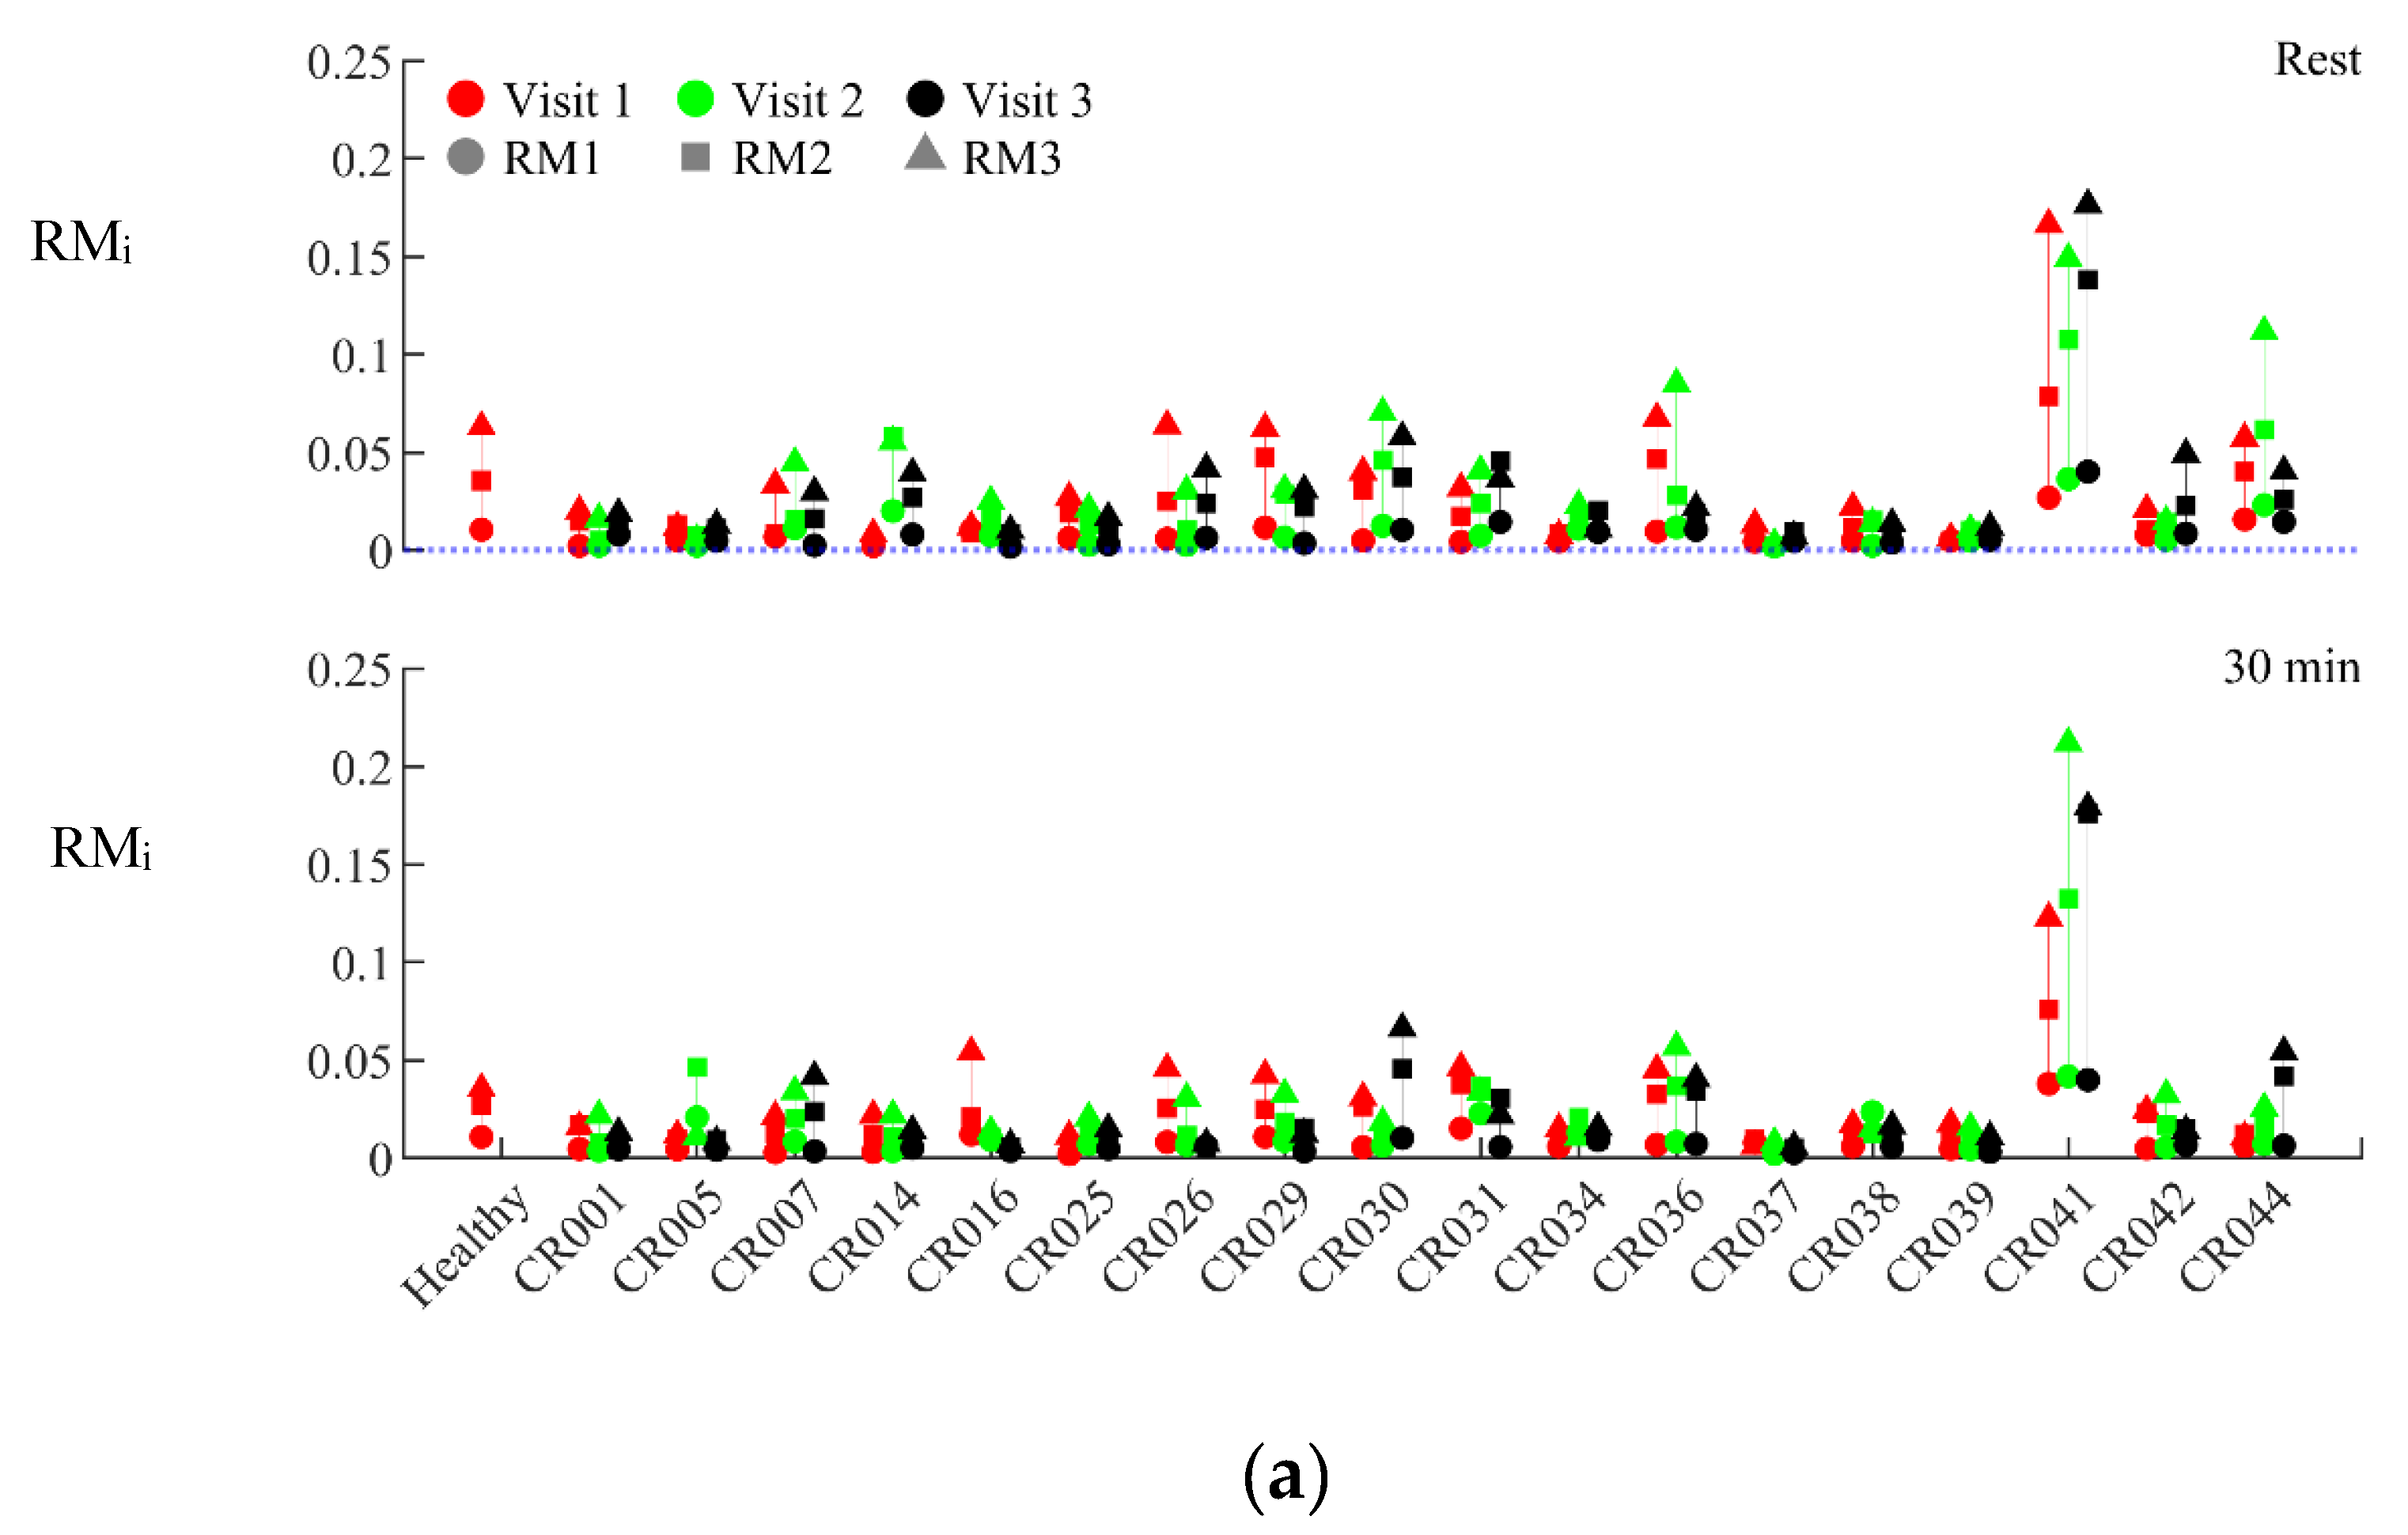
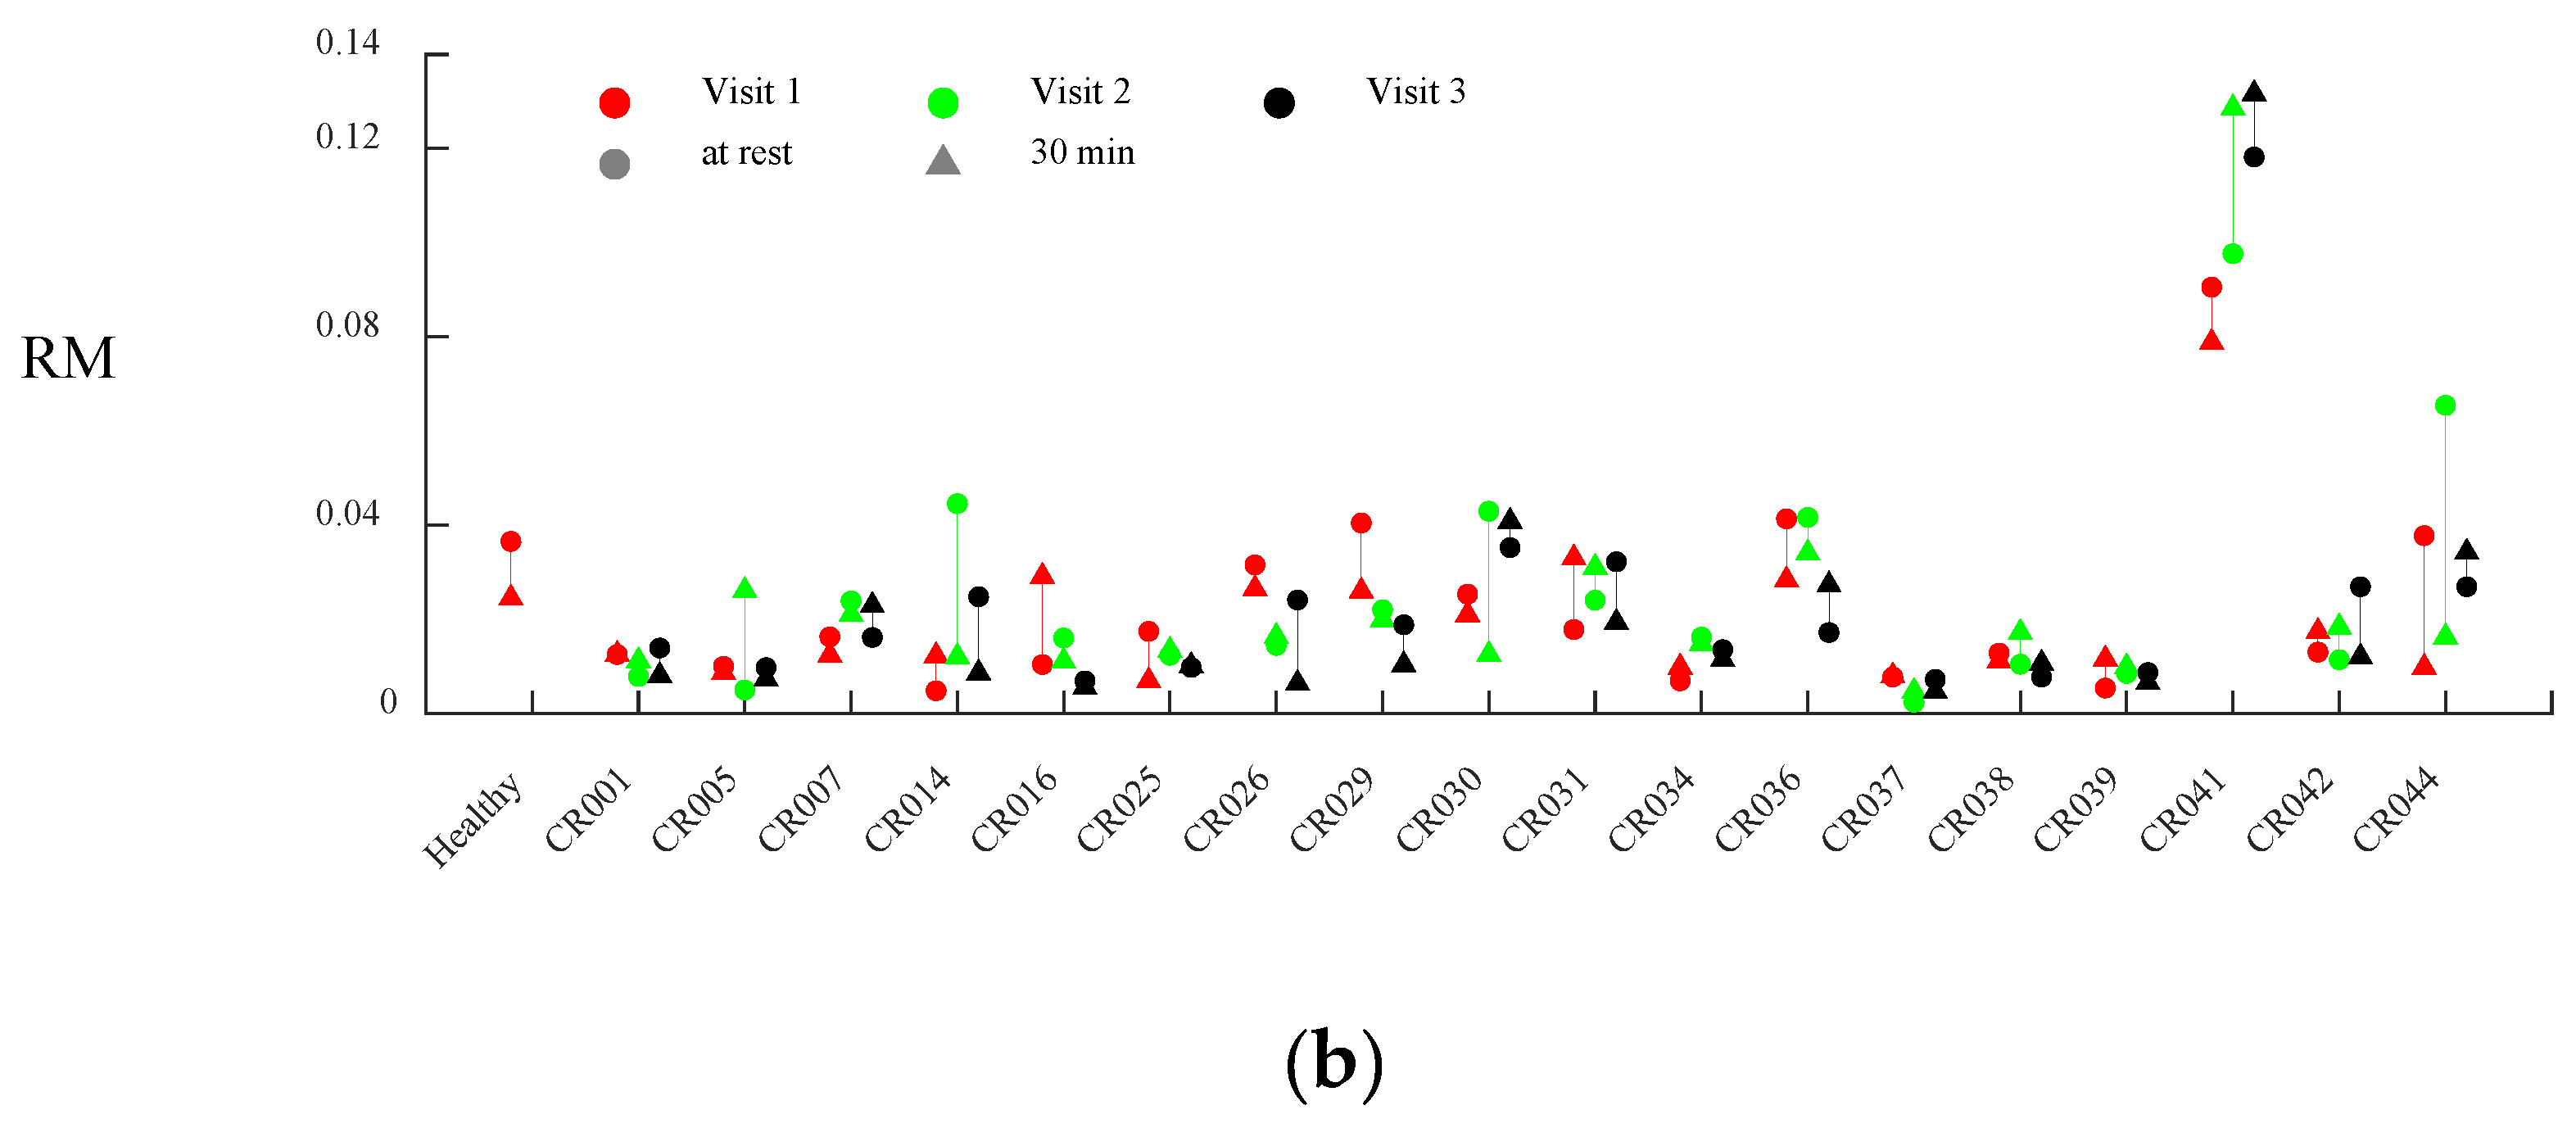
Figure 8.
Normalized amplitudes of the higher harmonics (n>1) and their changes in response to exercise (a) 2nd harmonic (b) 3rd harmonic (c) 4th harmonic (d) 5th harmonic (e) 6th harmonic (f) 7th harmonic (note: note that Ai and ΔAi denote the ith normalized harmonic amplitude at-rest and the ith normalized harmonic change 5min post-exercise, relative to at-rest).
Figure 8.
Normalized amplitudes of the higher harmonics (n>1) and their changes in response to exercise (a) 2nd harmonic (b) 3rd harmonic (c) 4th harmonic (d) 5th harmonic (e) 6th harmonic (f) 7th harmonic (note: note that Ai and ΔAi denote the ith normalized harmonic amplitude at-rest and the ith normalized harmonic change 5min post-exercise, relative to at-rest).
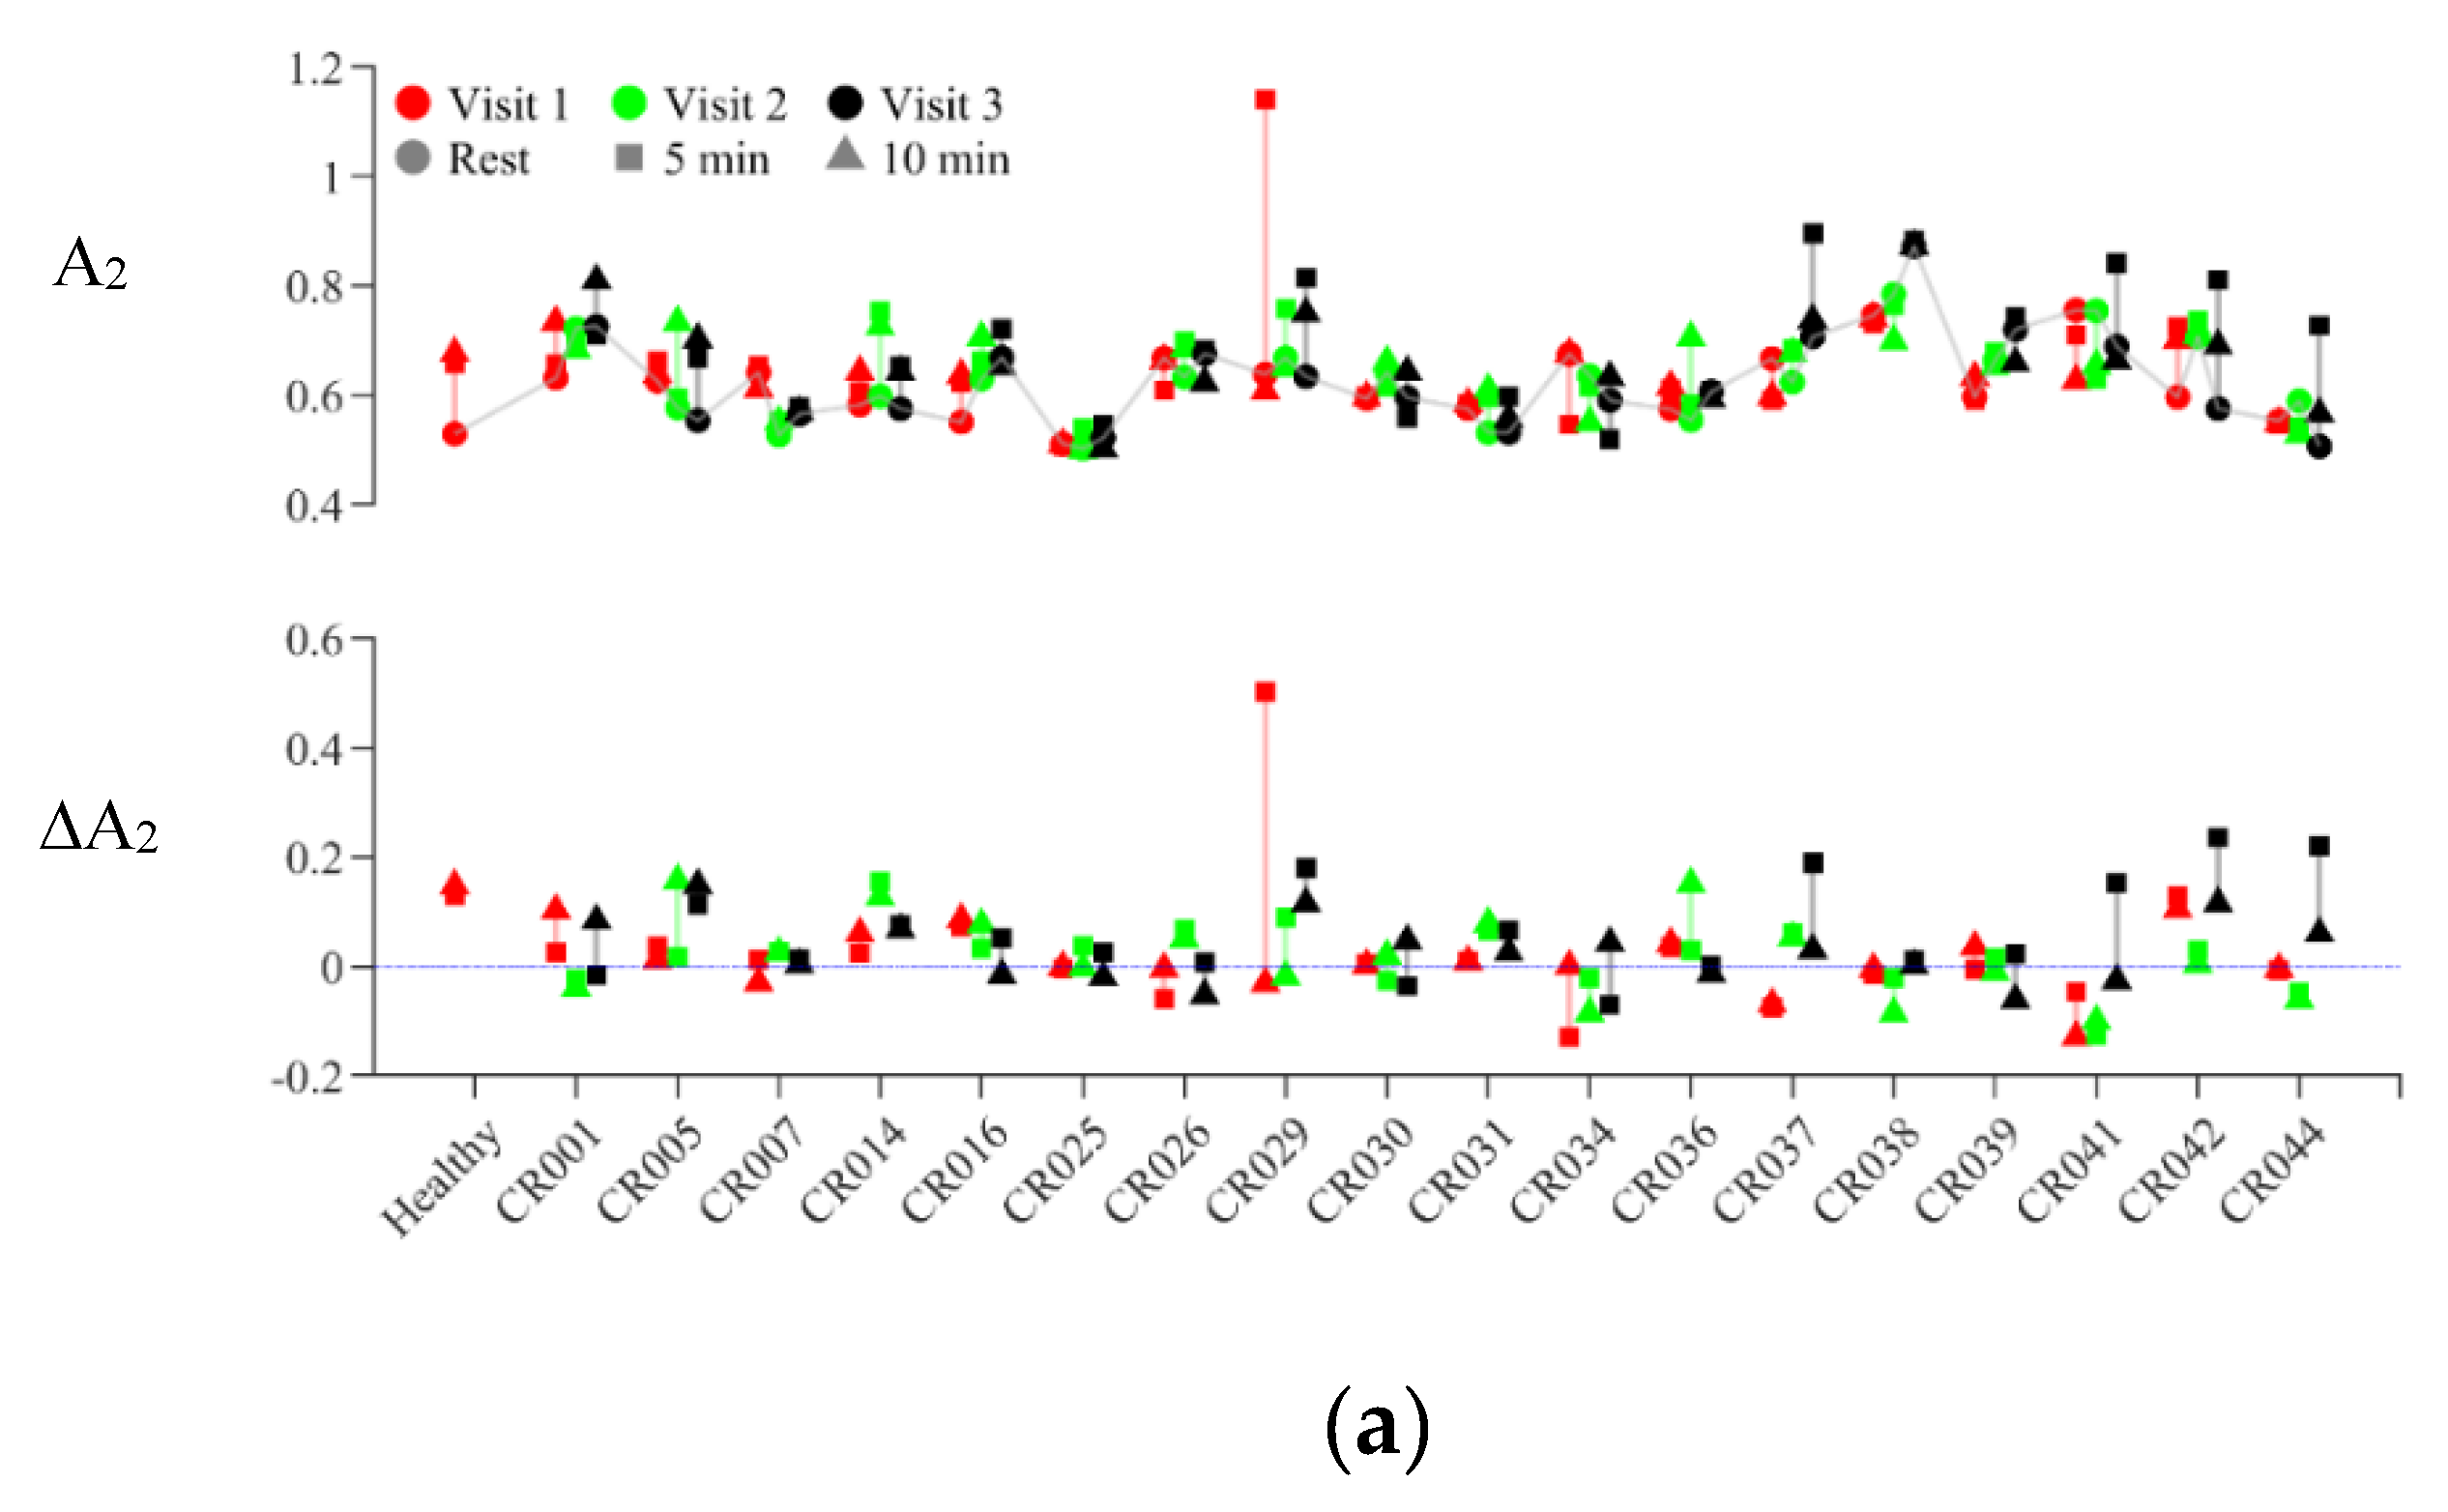
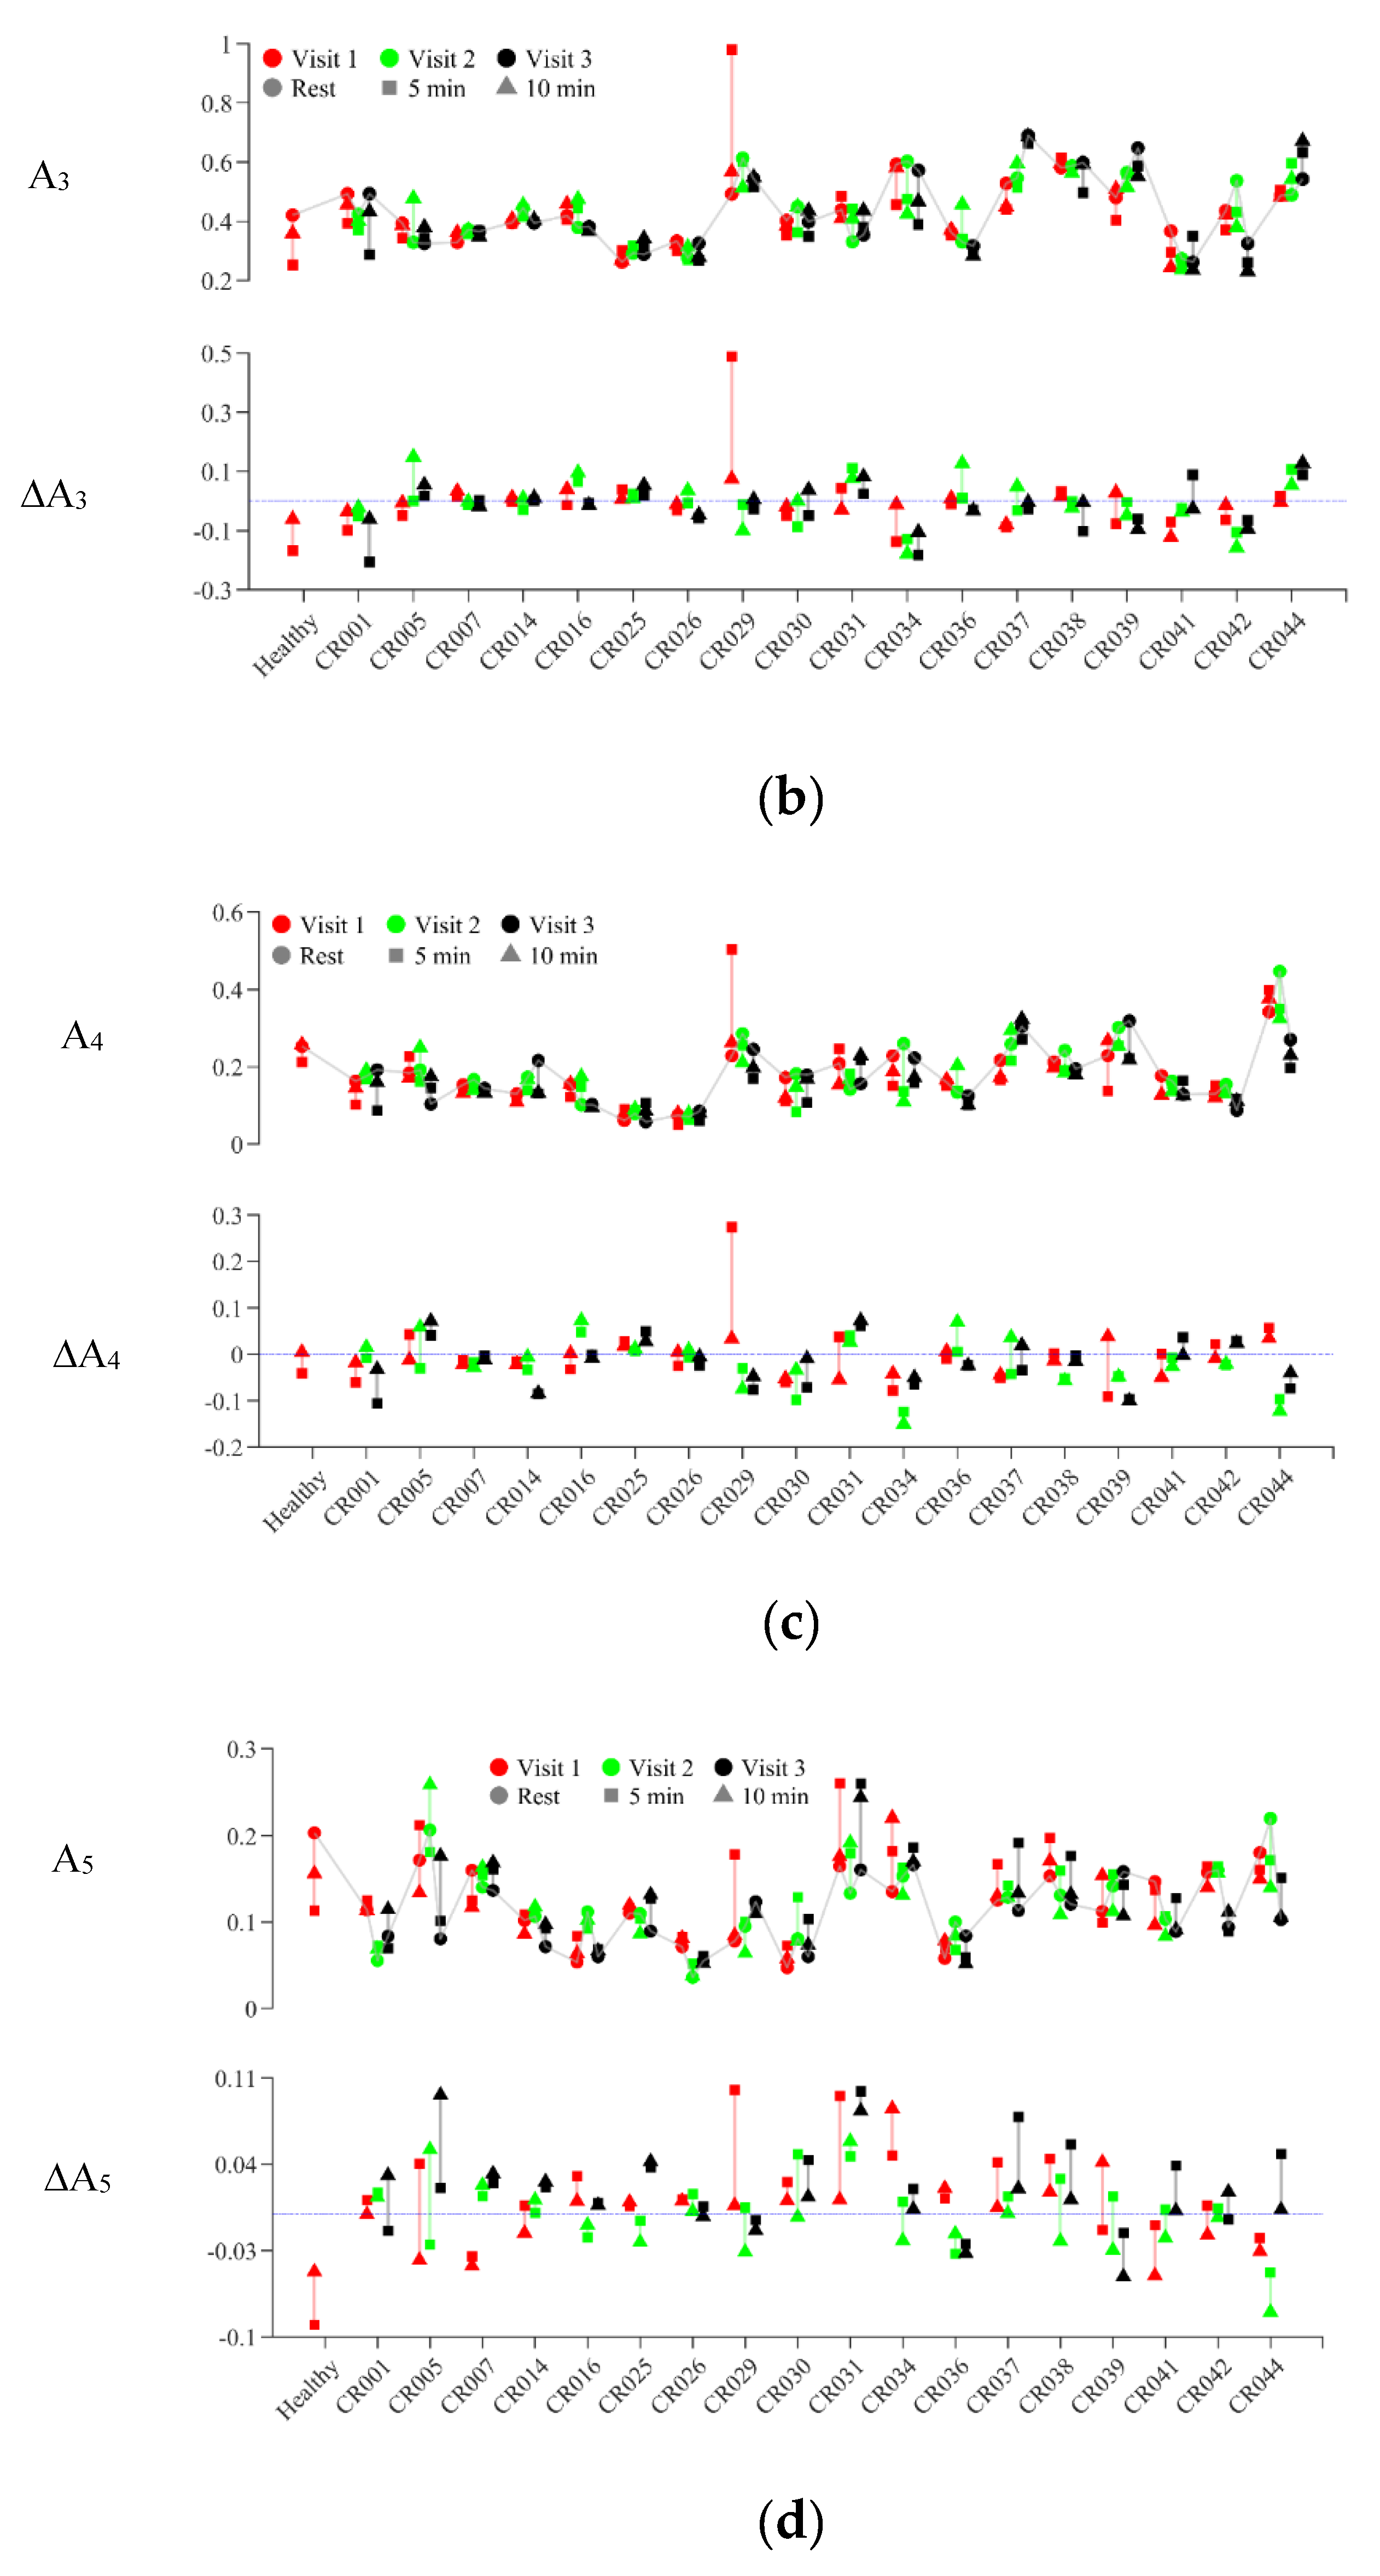
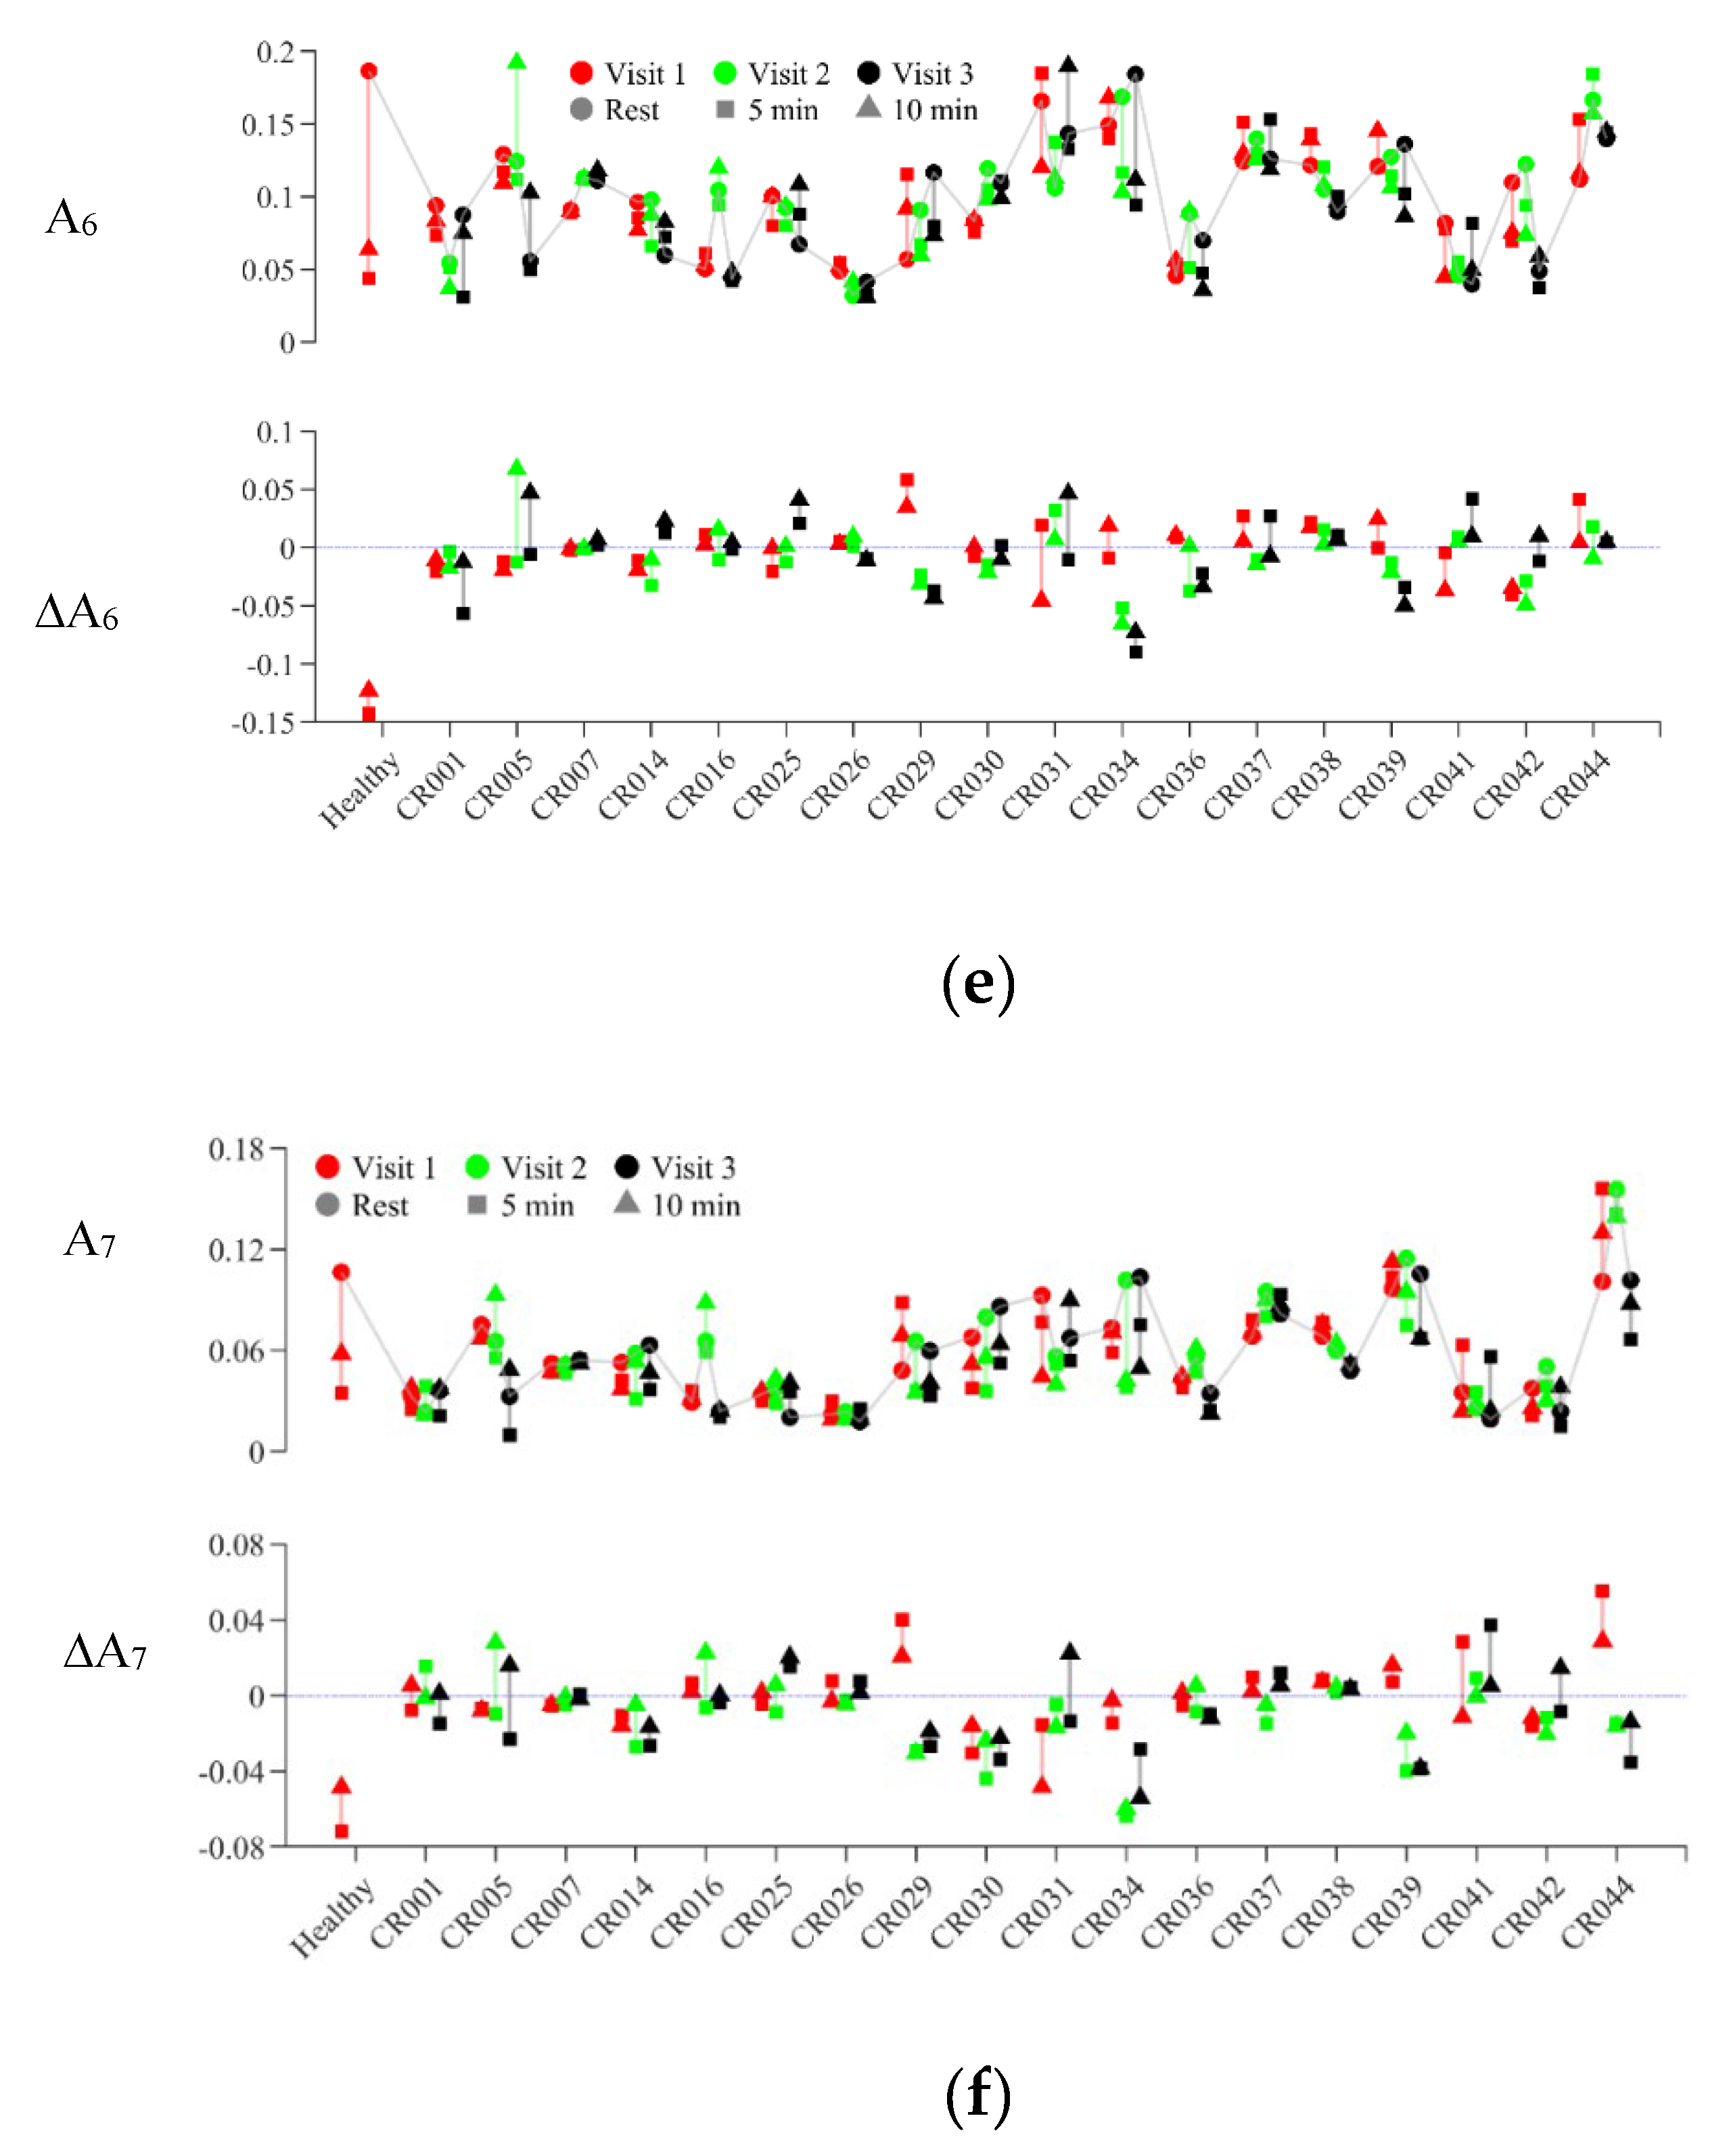
Figure 9.
Cross-subject comparison of normalized harmonic amplitude profiling (a) Visit 1 (b) Visit 2 (c) Visit 3 (note that Ai and ΔAi denotes the ith normalized harmonic amplitude at-rest and the ith normalized harmonic change 5min post-exercise, relative to at-rest).
Figure 9.
Cross-subject comparison of normalized harmonic amplitude profiling (a) Visit 1 (b) Visit 2 (c) Visit 3 (note that Ai and ΔAi denotes the ith normalized harmonic amplitude at-rest and the ith normalized harmonic change 5min post-exercise, relative to at-rest).
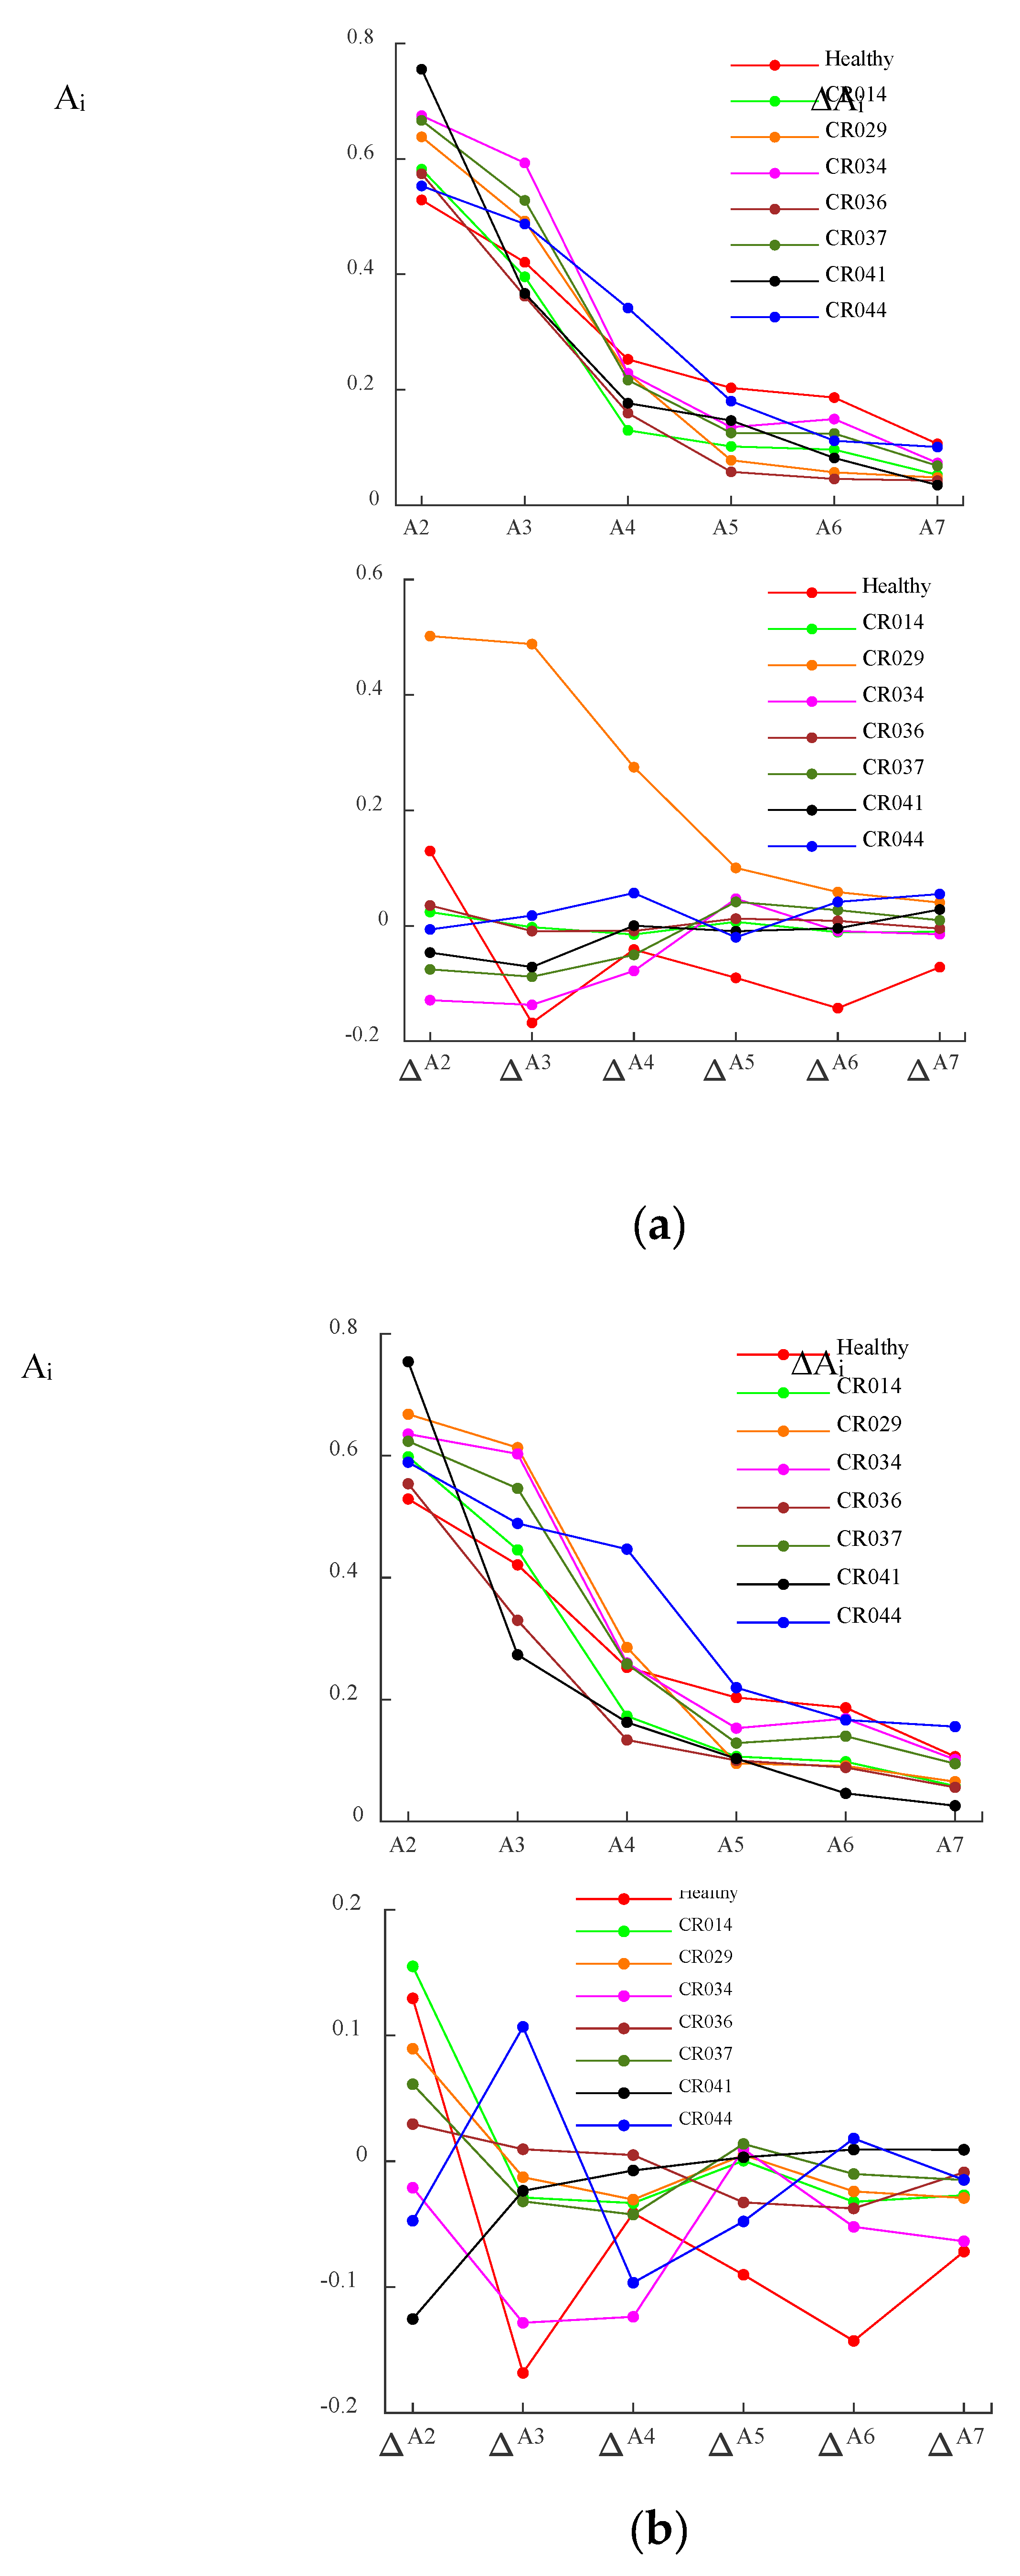
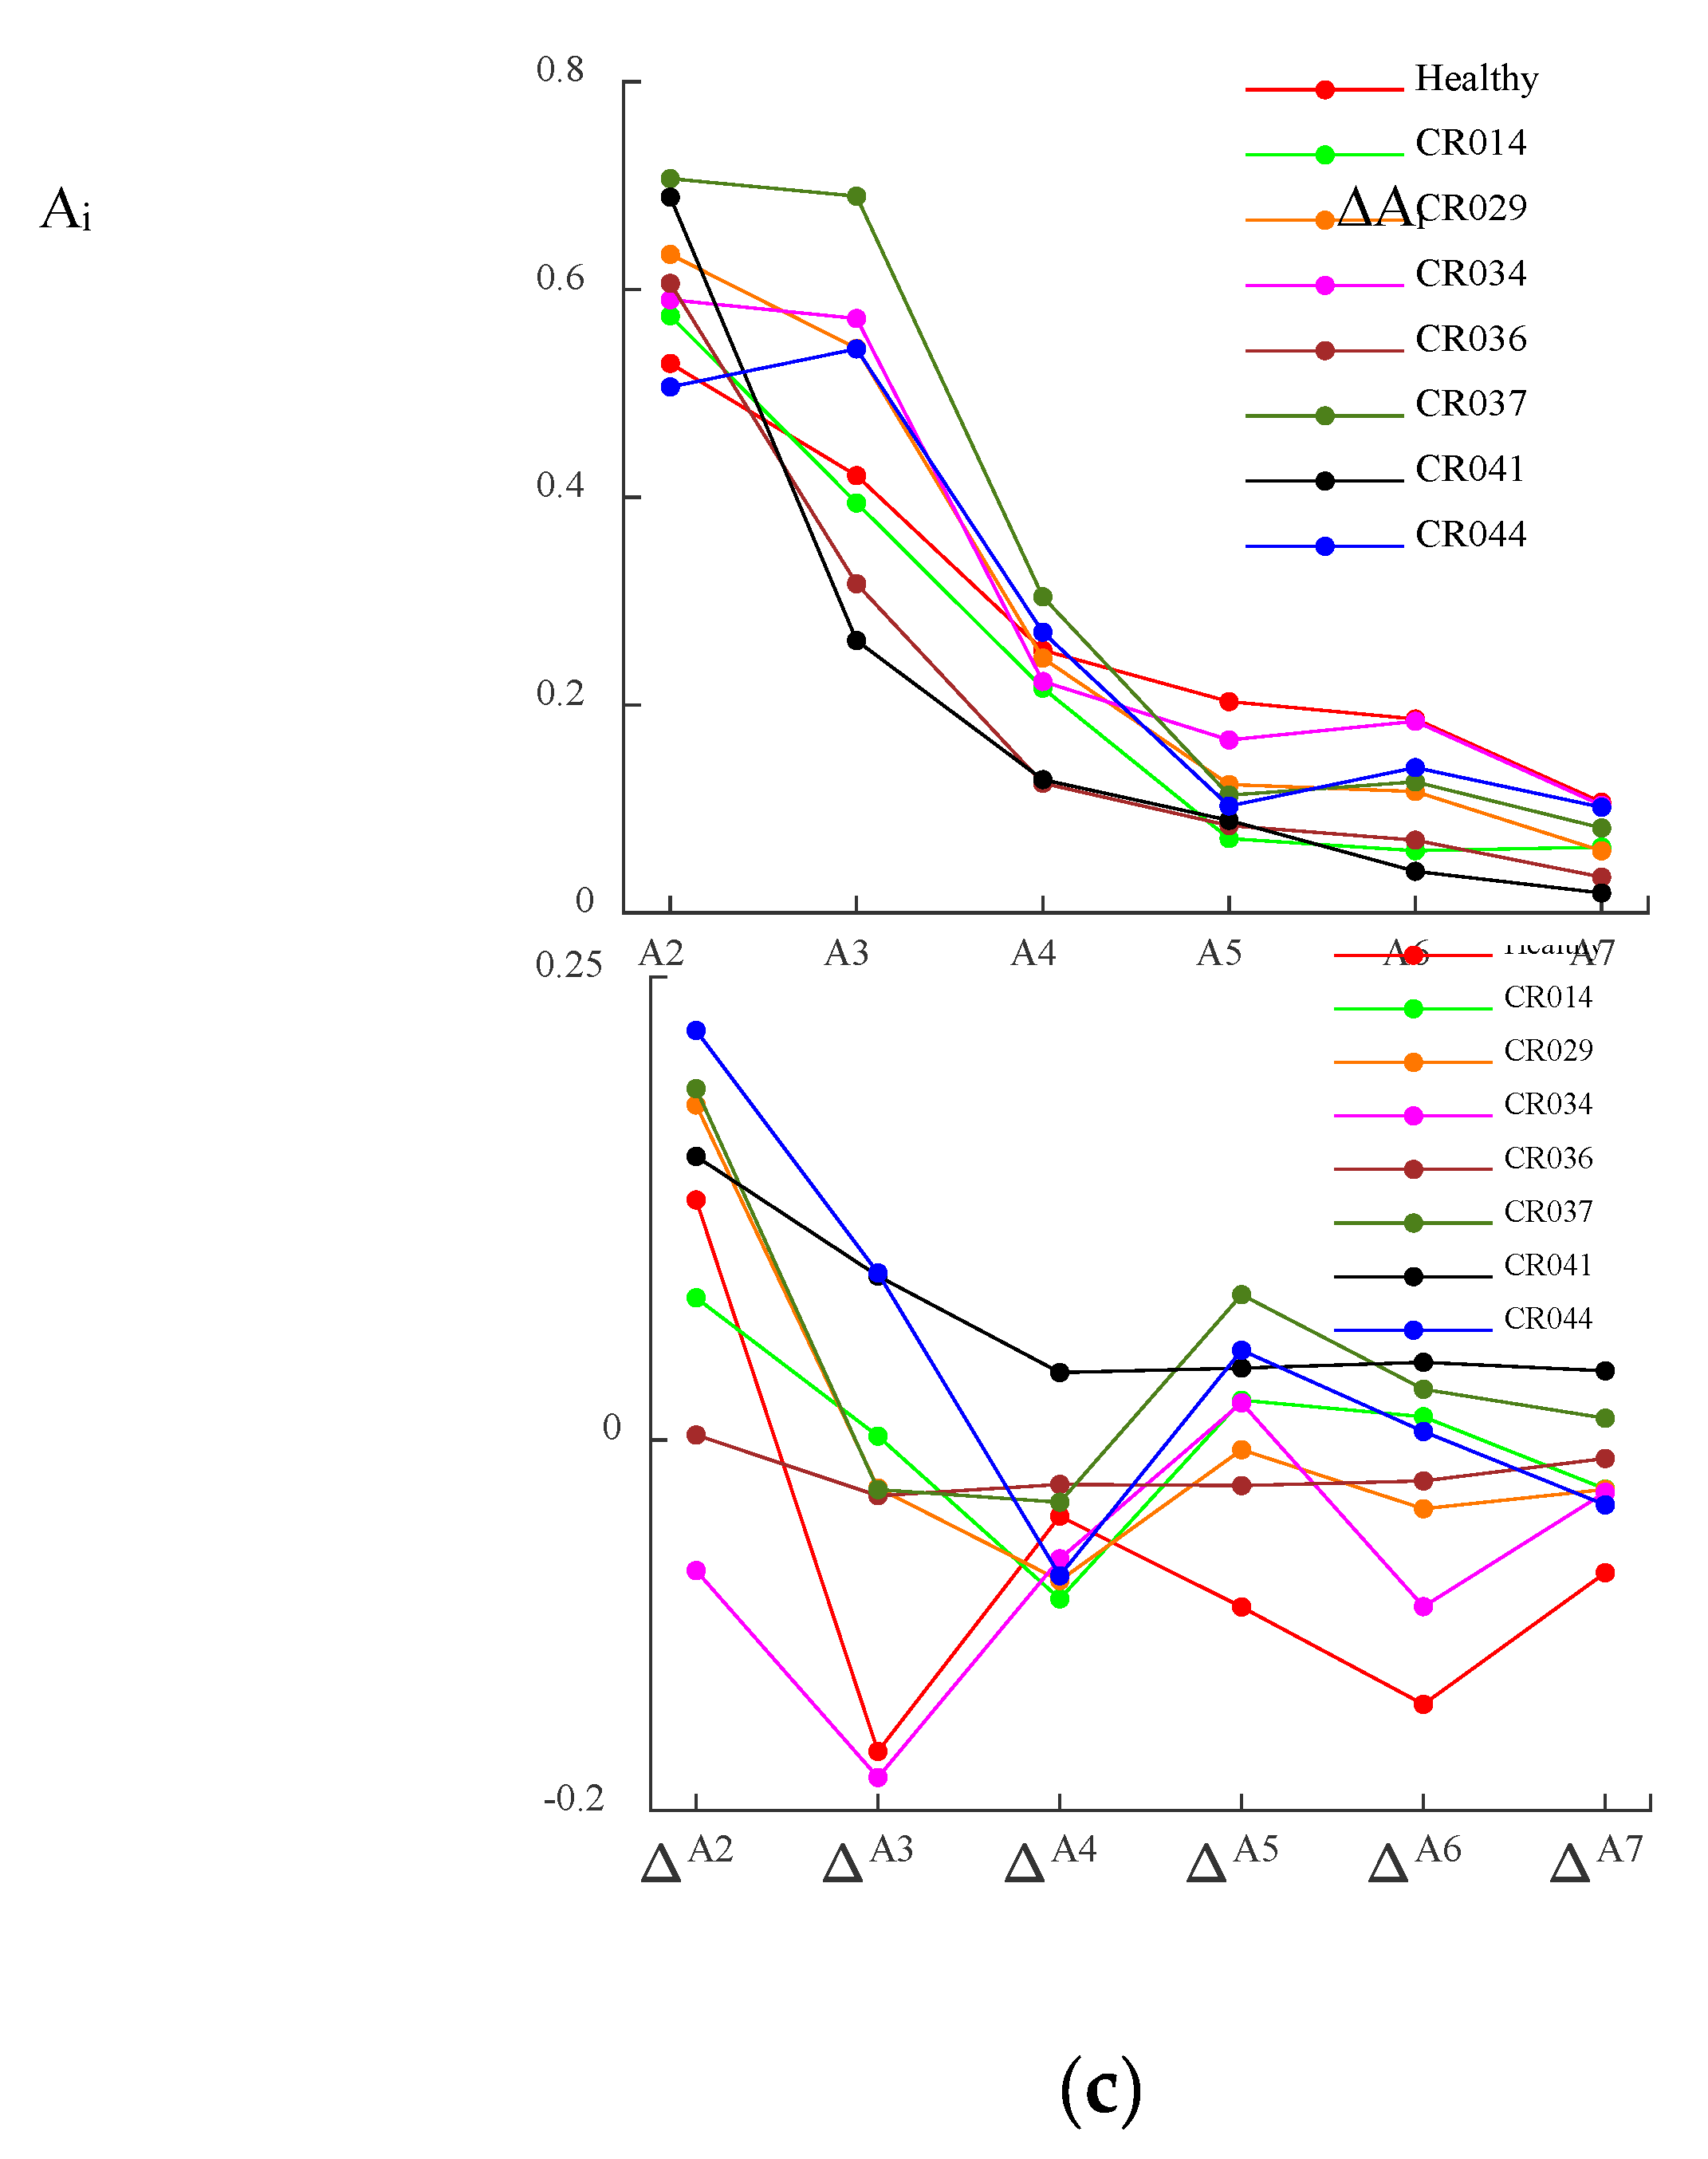
Figure 10.
Longitudinal changes of normalized harmonic amplitude profiling (a) CR029 (atrial-paced) (b) CR041 (AF) (note that Ai and ΔAi denote the ith normalized harmonic amplitude at-rest and the ith normalized harmonic change 5min post-exercise, relative to at-rest and ΔHR/HR is also included).
Figure 10.
Longitudinal changes of normalized harmonic amplitude profiling (a) CR029 (atrial-paced) (b) CR041 (AF) (note that Ai and ΔAi denote the ith normalized harmonic amplitude at-rest and the ith normalized harmonic change 5min post-exercise, relative to at-rest and ΔHR/HR is also included).
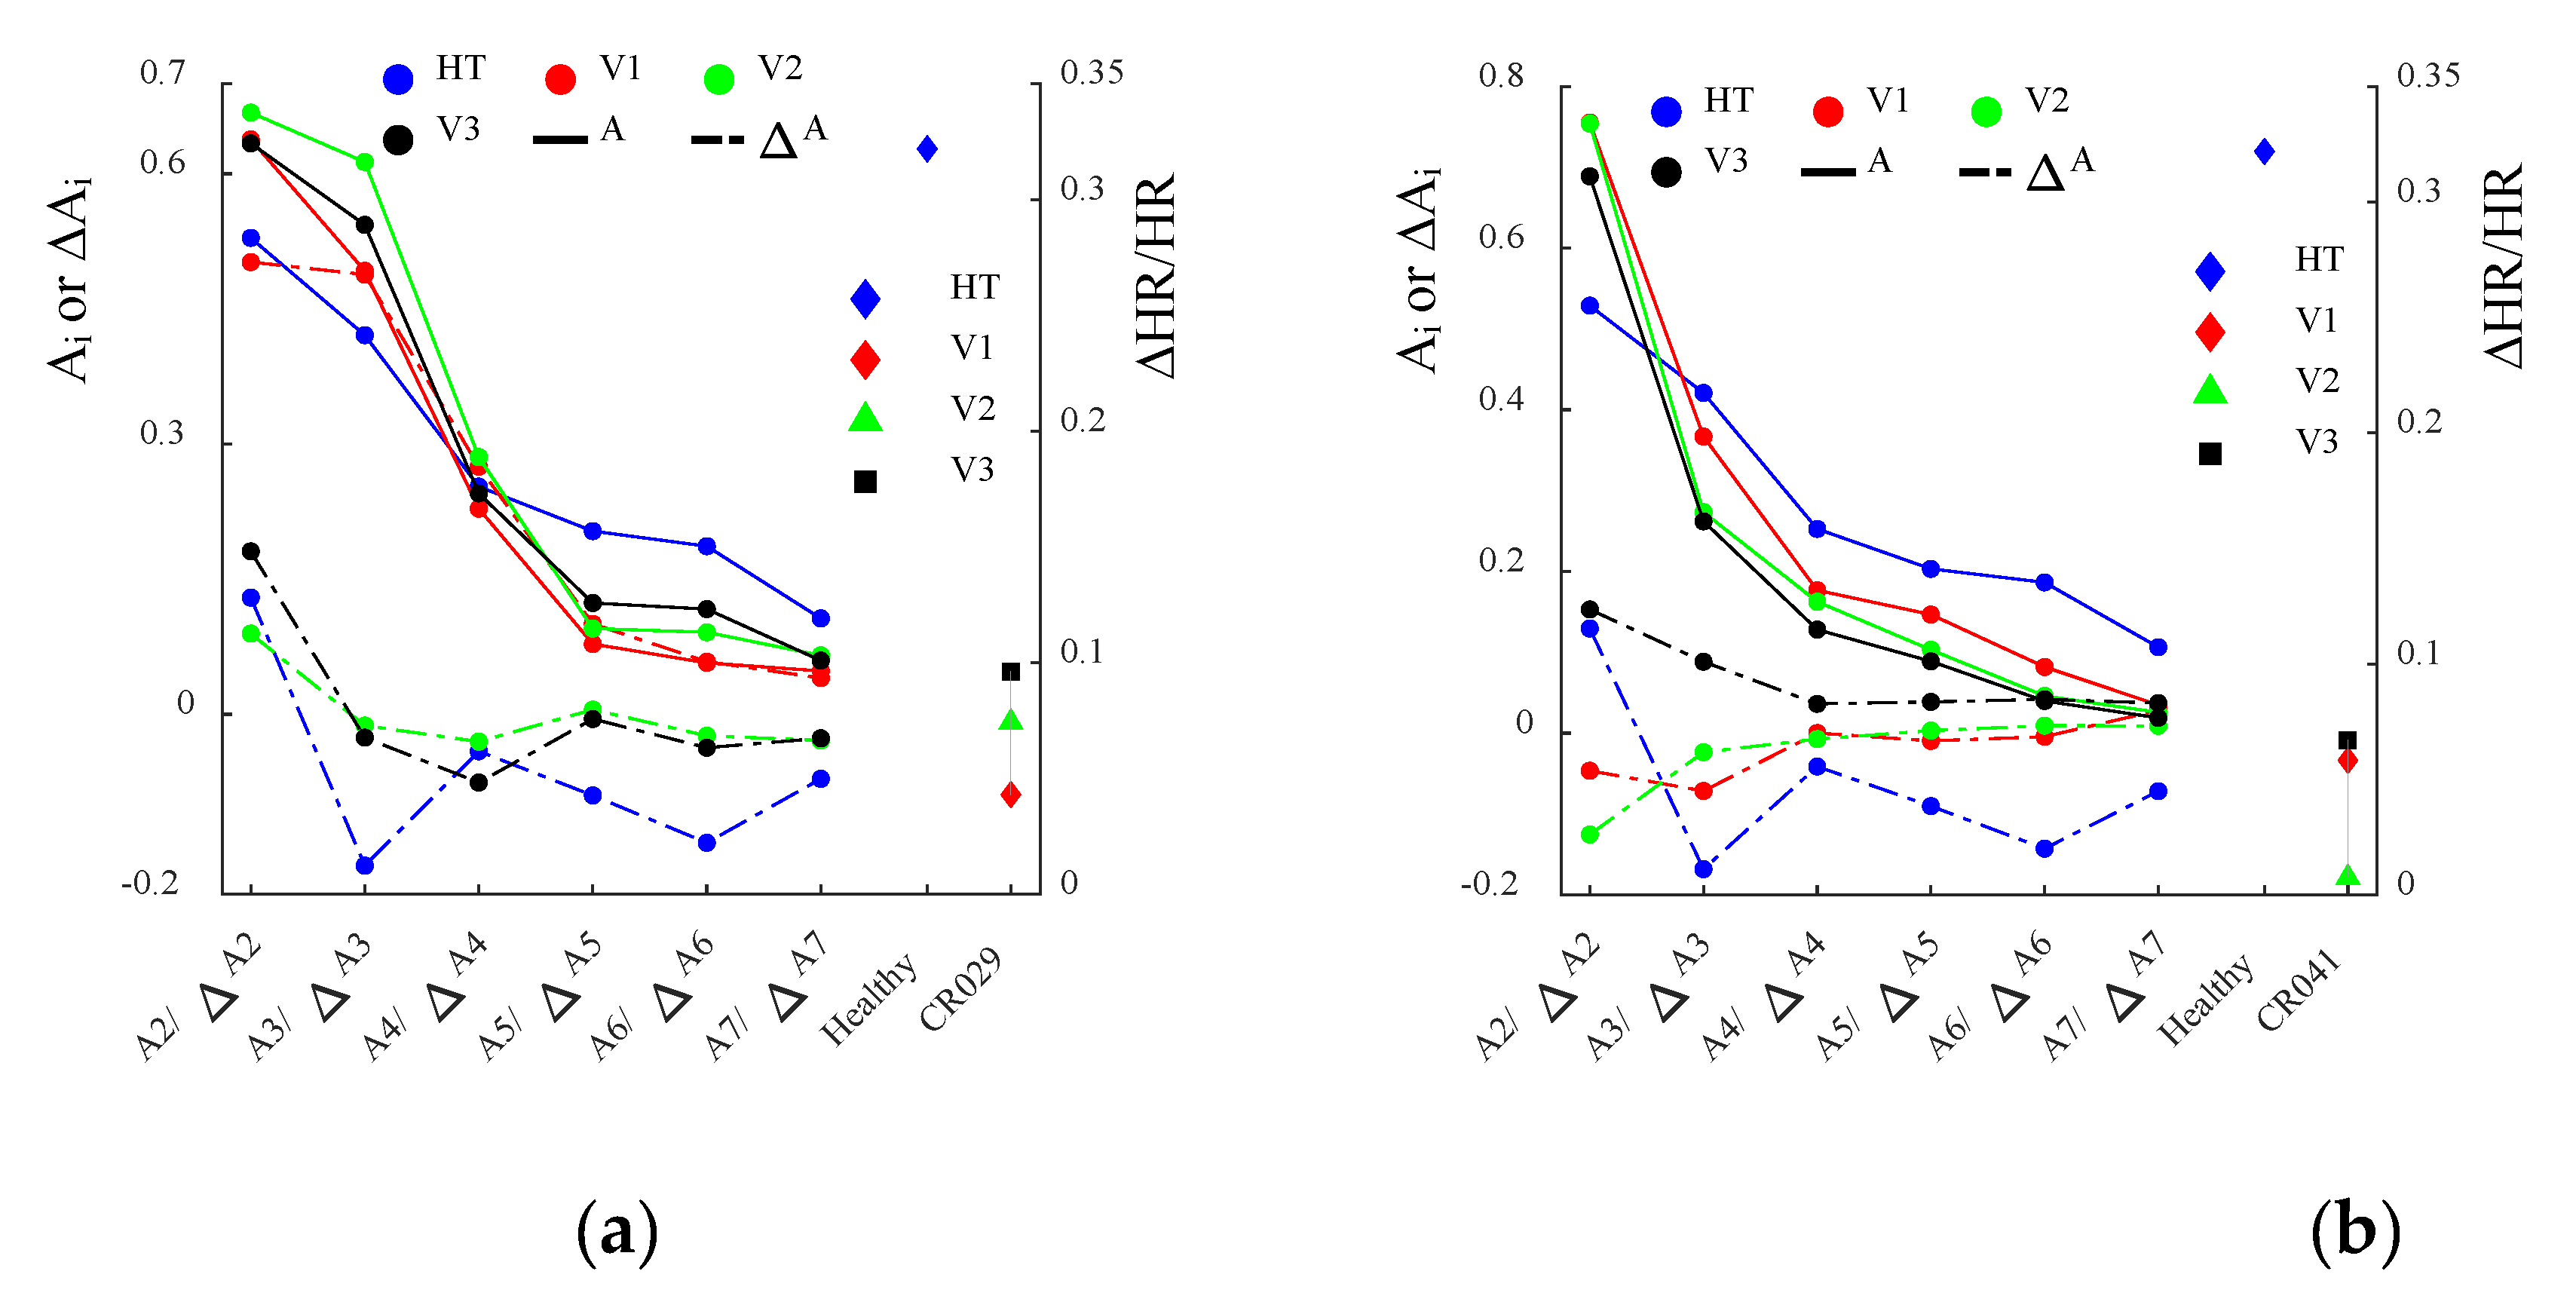
Figure 11.
Comparison of normalized APW at-rest between RA (left figure) and CA (right figure) across three visits of 5 subjects (a) CR001 (b) CR005 (c) CR029 (atrial paced) (d) CR041 (AF).
Figure 11.
Comparison of normalized APW at-rest between RA (left figure) and CA (right figure) across three visits of 5 subjects (a) CR001 (b) CR005 (c) CR029 (atrial paced) (d) CR041 (AF).
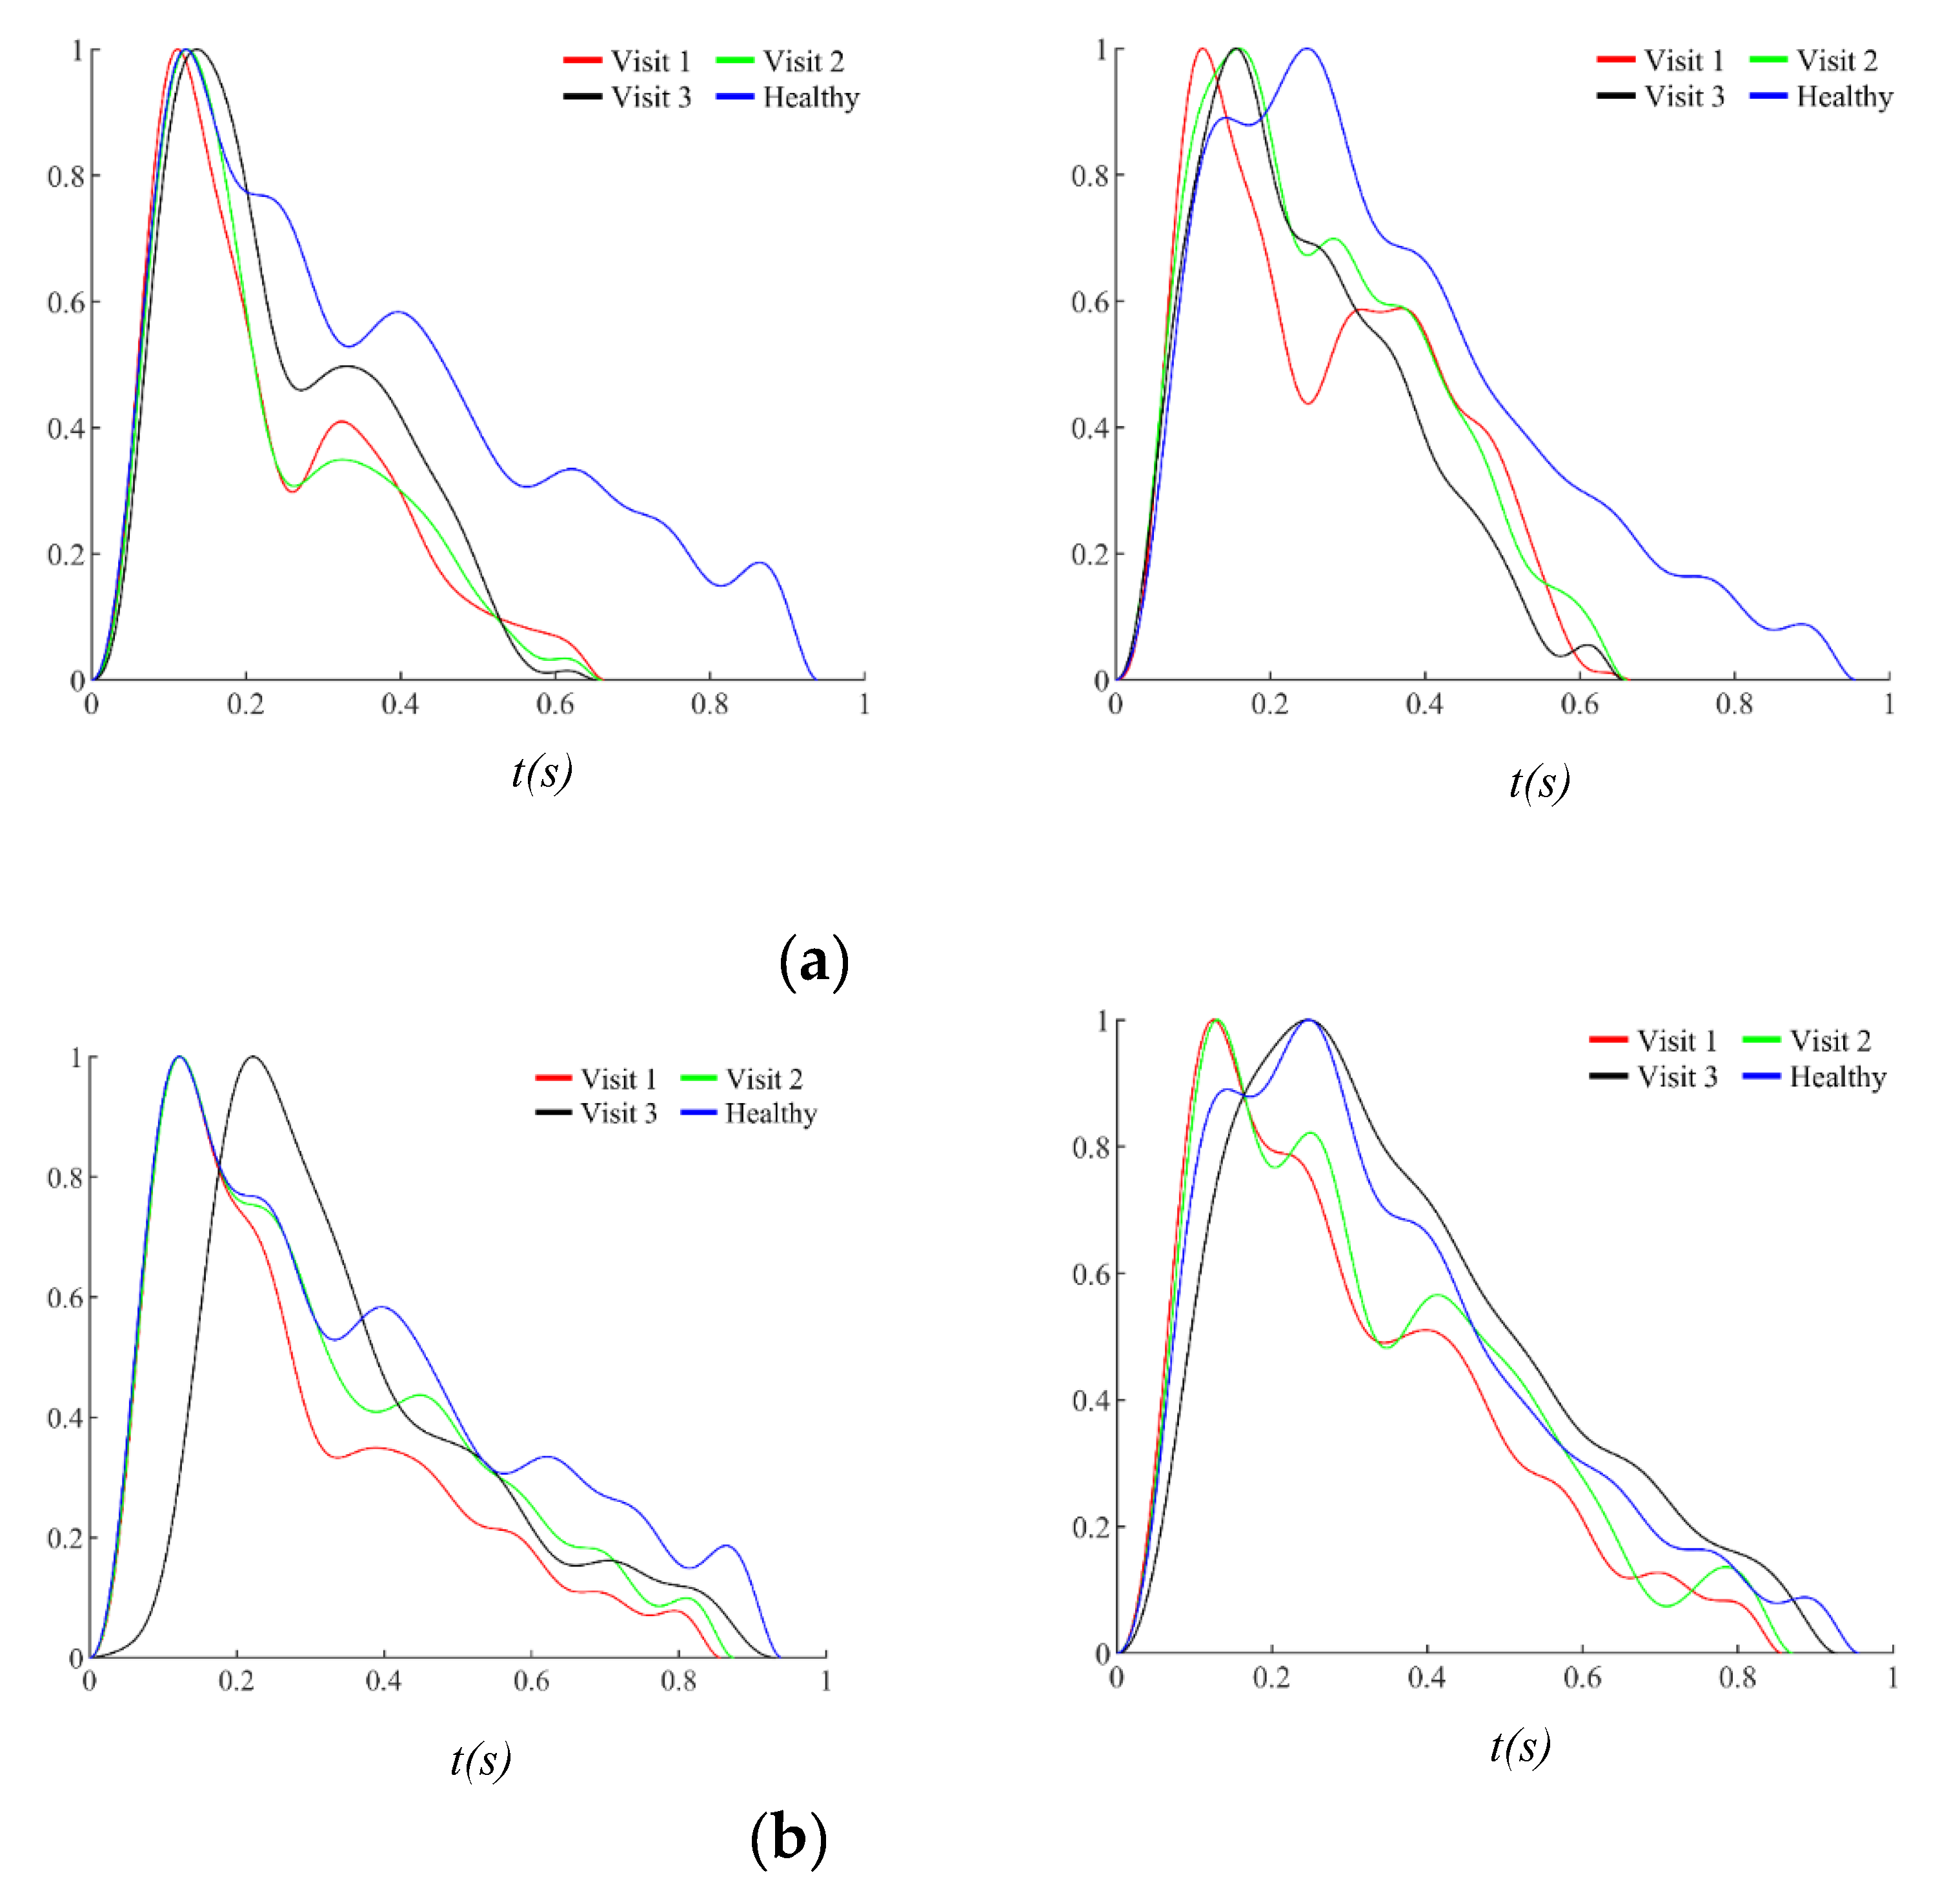
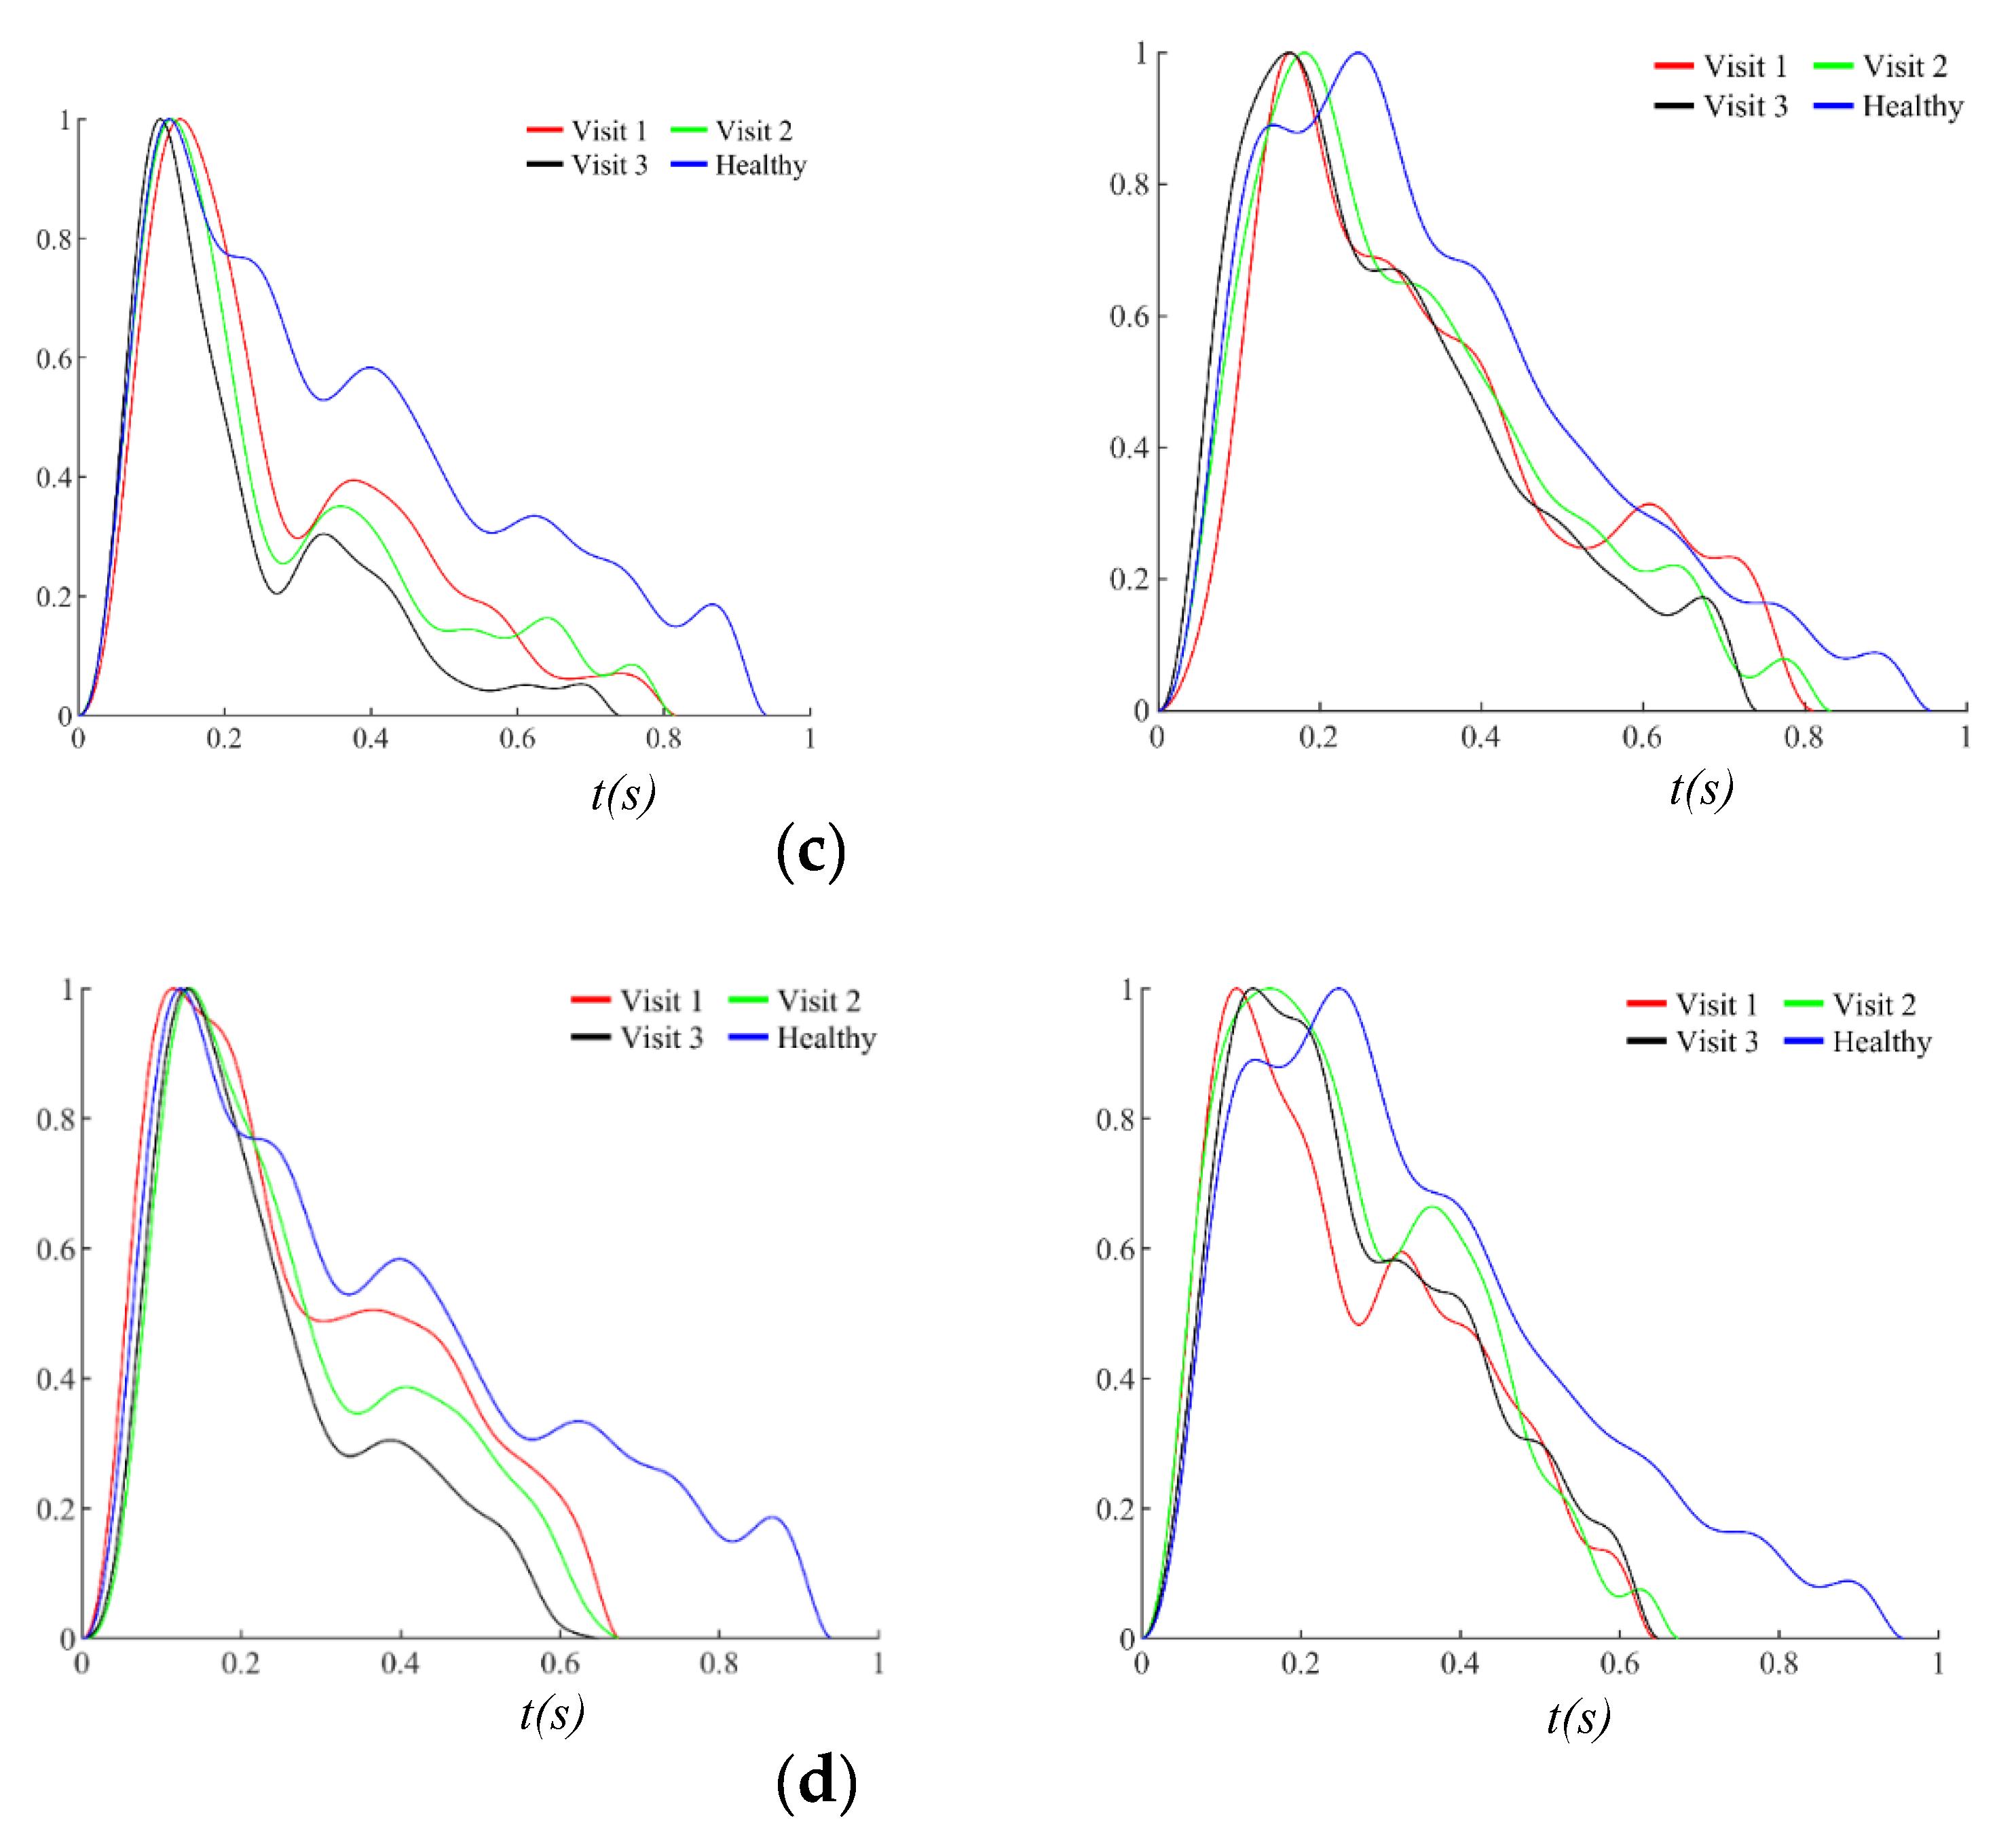
Figure 12.
Normalized APW of CR029 at rest, 5min and 10min post-exercise in Visit 1 (a) RA (b) CA.
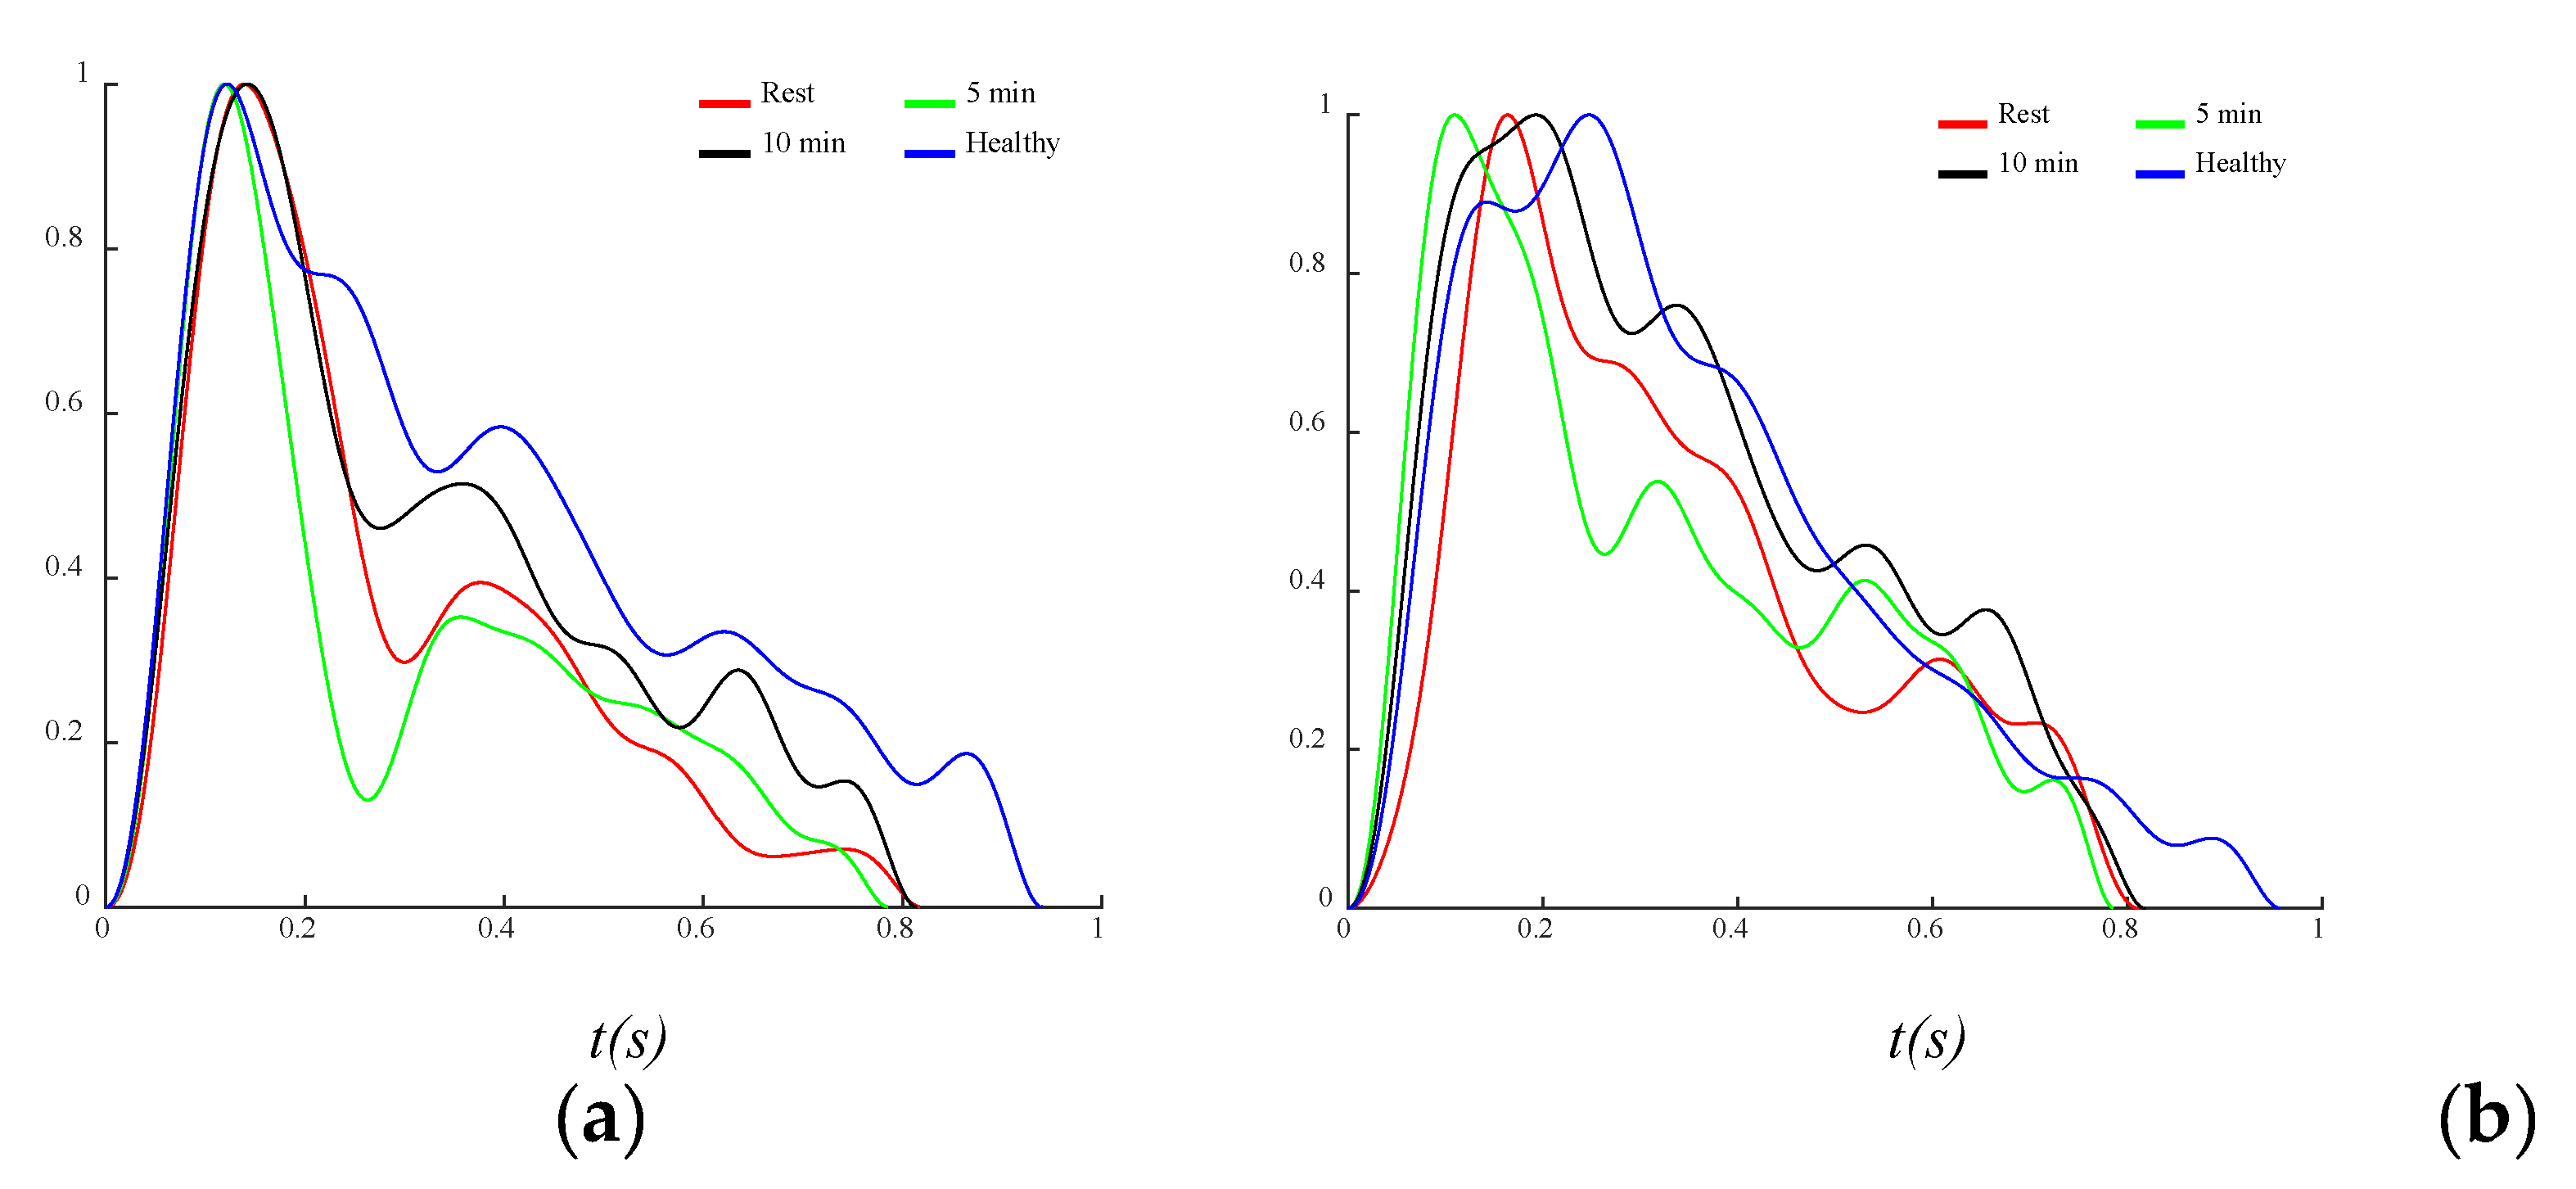

Table 1.
Baseline characteristics of the patient subjects.
| Subject ID | Gender | Age | BMI | Reason For Cardiac Rehab | Rhythm (sinus/AF) | Devices |
|---|---|---|---|---|---|---|
| CR-001 | Female | 66-70 | 29.8 | HF | SR | ICD |
| CR-005 | Male | 46-50 | 36.3 | PCI | SR | None |
| CR-007 | Female | 66-70 | 38.2 | NSTEMI | SR | None |
| CR-014 | Male | 71-75 | 34.5 | CABG x 6 | SR | None |
| CR-016 | Female | 56-60 | 24.1 | HF | SR | None |
| CR-025 | Female | 51-55 | 25.9 | MVR | SR | None |
| CR-026 | Male | 76-80 | 36.3 | TAVR | SR | None |
| CR-029 | Female | 66-70 | 25.6 | HF | atrial paced | ICD |
| CR-030 | Female | 66-70 | 29.6 | MI | SR | None |
| CR-031 | Male | 51-55 | 35.7 | PCI and MI | SR | None |
| CR-034 | Male | 66-70 | 38.3 | CABG | SR | None |
| CR-036 | Female | 51-55 | 35.2 | CABG x5 | SR | None |
| CR-037 | Male | 66-70 | 37.8 | HF | SR | CRT-D |
| CR-038 | Male | 61-65 | 30.2 | PCI | SR | None |
| CR-039 | Male | 71-75 | 22.6 | PCI | SR | None |
| CR-041 | Male | 76-80 | 37.6 | PCI | AF | None |
| CR-042 | Male | 66-70 | 29 | CABG | SR | None |
| CR-044 | Male | 66-70 | 30.8 | CABG x4 | SR | None |
* Note: 1. Age ranges rather than exact ages are reported to protect the identities and confidentiality of the subjects. 2. The list of all the medications prescribed to different individuals in the cohort: ACEi, beta blocker, ARB, aldosterone antagonist, HMG-CoA reductase inhibitor (statin) allopurinol, diuretics (furosemide), bumetanide, ARN-I, and SGLT-2.
Disclaimer/Publisher’s Note: The statements, opinions and data contained in all publications are solely those of the individual author(s) and contributor(s) and not of MDPI and/or the editor(s). MDPI and/or the editor(s) disclaim responsibility for any injury to people or property resulting from any ideas, methods, instructions or products referred to in the content. |
© 2026 by the authors. Licensee MDPI, Basel, Switzerland. This article is an open access article distributed under the terms and conditions of the Creative Commons Attribution (CC BY) license.
Copyright: This open access article is published under a Creative Commons CC BY 4.0 license, which permit the free download, distribution, and reuse, provided that the author and preprint are cited in any reuse.