

Submitted:
28 August 2026
Posted:
31 August 2026
You are already at the latest version
Abstract
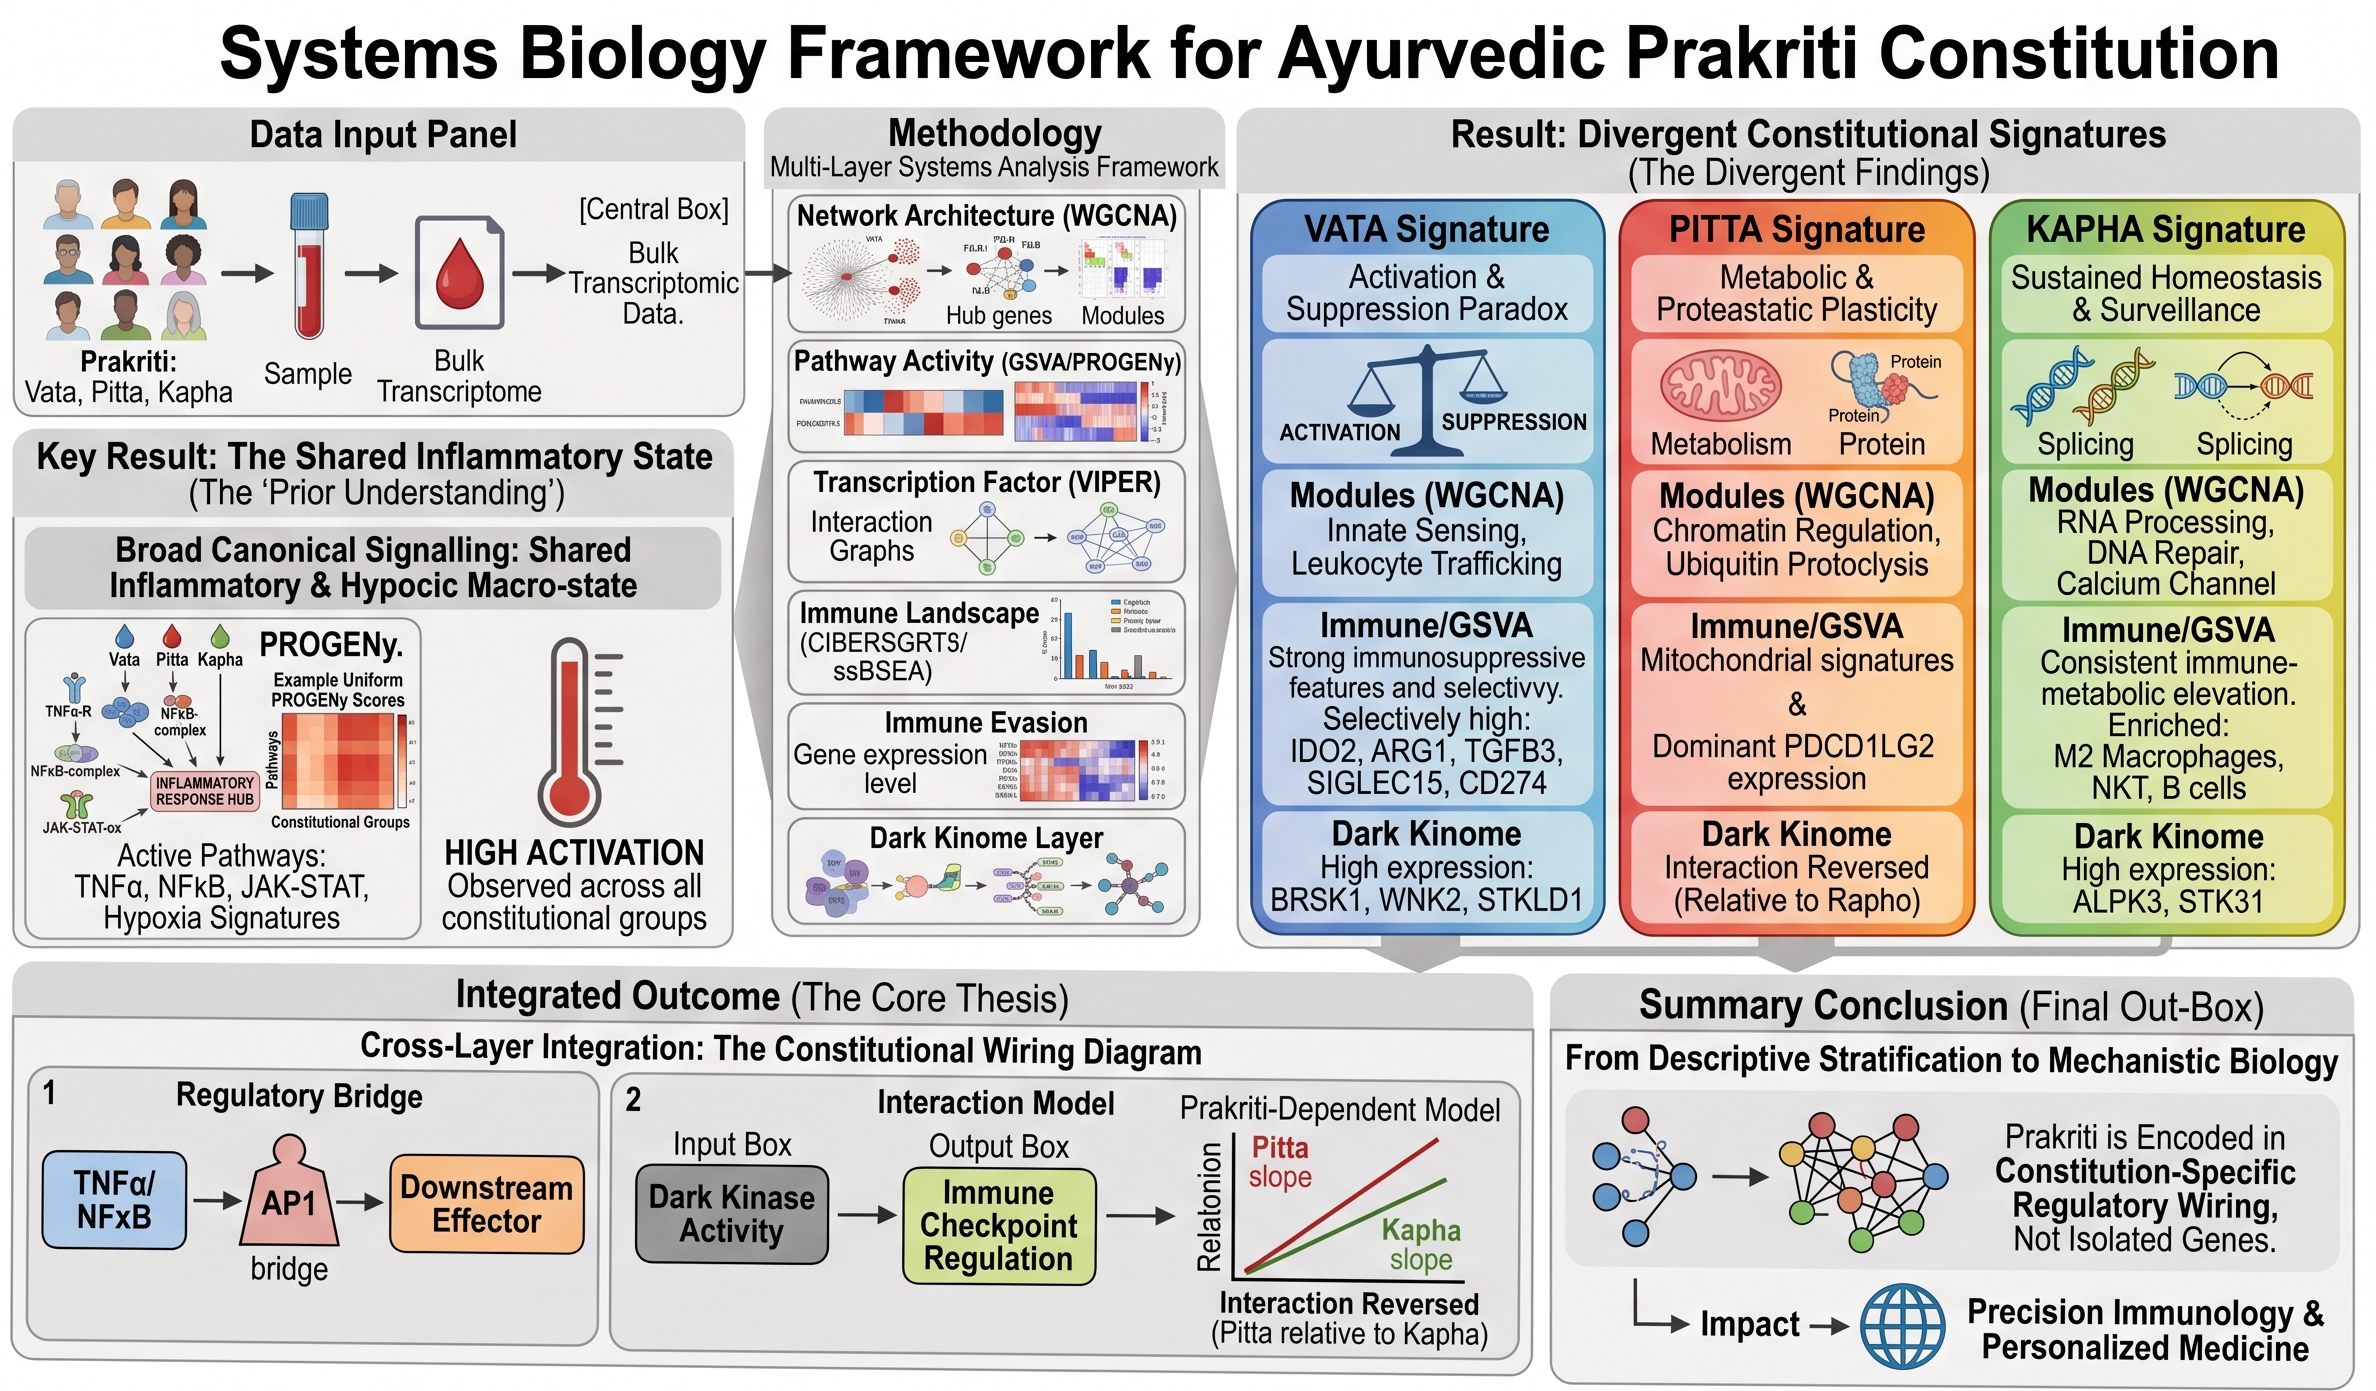
Prakriti, the constitutionally determined phenotypic framework described in Ayurveda, is thought to capture biologically meaningful inter-individual variation in physiology, disease susceptibility and therapeutic response. Although prior Ayurgenomics studies have identified constitution-linked differences in gene expression, genetic variation and epigenetic state, the regulatory architecture underlying these phenotypes remains poorly understood. We applied a multi-layer systems biology framework to Prakriti-stratified bulk transcriptomic data. Weighted gene co-expression network analysis was used to identify Prakriti-associated modules and hub genes. Pathway activity was inferred using PROGENy and GSVA; transcription factor activity was estimated using VIPER; immune composition was assessed using ssGSEA, CIBERSORTx, and xCell; and immune-evasion markers were analysed using differential expression and clustering approaches. Dark kinase activity was profiled as a dedicated analytical layer, and cross-layer integration was performed using z-score-standardised feature matrices, correlation analysis, principal component analysis and linear interaction modelling. Eighteen co-expression modules were identified, of which three showed strong Prakriti associations: a Vata-linked module enriched for innate immune sensing and leukocyte trafficking, a Pitta-linked module enriched for chromatin regulation and ubiquitin-mediated proteolysis, and a Kapha-linked module enriched for RNA processing, DNA repair, adhesion and calcium-channel biology. PROGENy revealed a largely shared inflammatory and hypoxic macro-state across constitutions, indicating that broad canonical signalling did not itself explain group separation. Finer-resolution analyses uncovered marked divergence across regulatory layers. Vata combined innate immune activation with strong immunosuppressive features, including selective elevation of IDO2, ARG1, TGFB3, SIGLEC15 and CD274. Pitta showed mitochondrial and proteostatic signatures together with dominant PDCD1LG2 expression. Kapha displayed the most consistent GSVA elevation across immune-metabolic pathways and was enriched for M2 macrophages, NKT cells and B cells. Dark kinome profiling identified reciprocal constitutional patterns: ALPK3 and STK31 were enriched in Kapha, and BRSK1, WNK2, and STKLD1 were enriched in Vata. Cross-layer integration revealed a coherent TNFa/NFkB-to-AP1 regulatory bridge. It showed that dark kinase activity was significantly coupled to immune-evasion outputs, with checkpoint regulation displaying a Prakriti-dependent interaction that reversed in Pitta relative to Kapha. Prakriti-associated molecular divergence is not primarily encoded in isolated genes or broad pathway shifts, but in constitution-specific regulatory wiring across co-expression, transcription factor, immune, metabolic and dark kinase-linked layers. These findings move Ayurgenomics beyond descriptive stratification towards a systems-level mechanistic framework for constitutional biology and provide a basis for future validation in precision immunology and personalised medicine.
Keywords:
Ayurgenomics
; Prakriti
; transcriptomics
; systems biology
; WGCNA
; transcription factor activity
; immune deconvolution
; dark kinome
; immune evasion
; precision medicine
Introduction
Two individuals who have the same disease-risk score and are raised in the same environment can react differently to the same drug. This is not just a random variation, but also a difference in the biology that we don’t yet understand. One of the earliest attempts at systematizing individual variation came in the form of Prakriti in Ayurveda, which was developed more than 3000 years ago. Prakriti is an inherited and constitutionally determined phenotypic identity which determines the baseline health, disease risk and treatment response of an individual [1,2]. All of us are born with a Prakriti that influences our response to diet, medicine, stress and environment, and diseases [3]. The framework divides the constitutional identity into three archetypes or Tridoshas: Vata, governing neuromotor activity, circulation and catabolism; Pitta, governing metabolic processes, inflammation and temperature regulation; Kapha, governing building processes, structural integrity, immune function. A fourth is called Sama Prakriti, those in whom none of the doshas are predominant, and are constitutionally balanced [4]. Ayurveda classifies the entire human population into seven constitutional types based on the dominance of a single dosha or a combination of two or three doshas: the three single-dosha (Ekadosha) types Vata, Pitta, and Kapha; the three dual-dosha (Dvandvaja) types Vata-Pitta, Pitta-Kapha, and Vata-Kapha; and one tridoshic type, Sama Prakriti, in which all three doshas are present in relative equilibrium [5]. Most people are a combination of all three doshas, but individuals with a predominance of one or two doshas, with pure Vata, Pitta or Kapha are biological reference points for molecular analysis. The constitutional types are not directly linked to particular diseases, but rather represent a setting in which the distribution of disease risk and resilience is spread across a population.
The scientific research of Prakriti with molecular tools resulted in the development of Ayurgenomics which is aimed at understanding the genomic and systems level basis of different constitutional phenotypes [5]. A preliminary study revealed significant biochemical and transcriptomic differences among healthy individuals with various Prakriti types [6]. In a 2012 study, inflammatory genes such as IL1β and CD40 were found to be the primary determinants in the Vata subgroup of rheumatoid arthritis patients, whereas oxidative stress pathway genes including SOD3 and PON1 were observed predominantly in Pitta and Kapha subgroups [7]. 52 SNPs were found to be significantly different between the three Prakriti types and DNA methylation signatures differentiating each Prakriti was identified in 2015 [8,9]. Ever since then, molecular correlates of Prakriti have been investigated at genetic, epigenetic, transcriptomic and metagenomic levels, and have been substantiated in cell and disease models [10]. These studies all establish that Prakriti classification is valid, as it shows biological differences between persons. But do they indicate a deeper constitutional difference, or are they merely isolated molecular differences, and if the latter is true, why is this? Both these questions require an examination of several layers of regulation simultaneously. This constitutional stratification of baseline disease risk and treatment response is, in principle, well suited to the predictive, preventive, personalized, and participatory (P4) medicine paradigm, in which molecularly defined constitutional subgroups rather than a population-wide average form the basis for anticipating disease trajectory and tailoring intervention before disease onset [12]. In this study, a bulk RNA-sequencing dataset was analysed across the Kapha, Pitta, Vata, and Sama Prakriti groups, and which for the first time allows for comprehensive multi-layer systems-level integration of constitutional transcriptomic phenotypes.
Despite recent advances, there is a critical gap in the field, as the majority of the studies in Ayurgenomics have focused on the molecular level and simply catalogued genes or SNPs without understanding the regulatory architecture that brings the differences into a system-wide phenotype. There are three regulatory layers which have not been systematically studied in Prakriti biology that are critical to gene regulation: the transcription factor (TF) activity landscape, which has not been studied in detail across Prakriti; differential mRNA levels do not provide information as to whether differences are due to regulation upstream or metabolic states. Second, the relationship of phenotype to metabolic flux, particularly with respect to immune function has not been characterized at the pathway level. Third, the dark kinome which accounts for another third of kinases, for which there is very little functional information, remains unstudied in Prakriti, although it is known to be involved in disease states and drug responses [11]. Dark kinases are frequently differentially expressed or mutated in disease databases such as The Cancer Genome Atlas, and investigational and approved kinase inhibitors appear to engage them as off-target activities [12], suggesting their relevance in immune-related conditions such as those differentiating Prakriti types. How genomic, regulatory, metabolic, and immune features relate to one another across Prakriti types is not known without a multi-layered analytical framework.
We address this deficit by taking a multi-layered approach to systems biology of the whole-transcriptome, with a Prakriti constitution classification of global transcriptomic data. Prakriti-specific co-expression structures and hub genes are identified by using weighted gene co-expression network analysis (WGCNA). The activity of the 14 known cancer and signaling pathways are predicted from the gene expression data using PROGENy. The metabolic states are calculated by gene set variation analysis (GSVA) of curated metabolic gene sets. VIPER infers transcription factor activity, which is based on the relationship between differential gene expression and upstream regulation. The composition of immune cells is determined by ssGSEA and CIBERSORTx, which can be compared between constitutional types. Additionally, given that identification of substrates and disease associations for understudied kinases provides actionable information for new drug development and exploration of pathophysiology using signalling network approaches [13], we specifically investigate whether transcriptomic changes associated with Prakriti modulate the expression of dark kinases in ways that correlate with immune differences. This multi-layered integration highlights that inter-type differences are not only mediated by the gene itself but by different regulatory programs such as co-expression, TF activity, metabolic and immune profiles. Typical signaling processes are recognized and specific downstream features. Dark kinase is a part of the kinome that has received less attention, and its expression levels are correlated with immune signatures as dictated by the Prakriti, which are immune differences that are characteristic of these ancient categories. By resolving these constitutional differences at the level of co-expression architecture, transcription factor activity, and immune-metabolic wiring, this multi-layer framework moves Ayurgenomics toward the predictive and personalized aims of P4 medicine, in which constitutional profiling could eventually inform pre-symptomatic risk stratification and individualized therapeutic selection.
Materials and Methods
Study Cohort and Sample Composition
Bulk RNA sequencing was performed on peripheral blood mononuclear cells (PBMCs) isolated from 168 healthy adults classified by Prakriti constitution into four equal groups (n = 42 each): Kapha, Pitta, Vata, and Sama. Sama Prakriti, denoting constitutional balance with no dominant dosha, served as the reference group for directional enrichment analyses. The study participants were assessed for Prakriti using the CCRAS Prakriti Assessment Scale (PAS) [14,15]. All subjects were healthy adults with no active disease at the time of sampling. Health status was evaluated using the Swasthya Assessment Scale[16], while Agni was assessed using the Self-Assessment Tool to Estimate Agnibala, both developed by CCRAS. Sequencing reads were aligned to the GRCh38 reference genome using HISAT2 and quantified with featureCounts.
Data Preprocessing and Annotation
Counts were normalized two ways: VST (DESeq2 [14], for network construction/linear modeling, and TPM for gene-set scoring methods requiring continuous input. Ensembl IDs were mapped to HGNC symbols (org.Hs.eg.db); duplicate symbols were collapsed to the highest mean-expression transcript. Prakriti labels were one-hot encoded for trait-correlation analyses. UMAP (umap package, Euclidean distance; n_neighbors = 15, min_dist = 0.1, n_components = 2, n_epochs = 200) was run unsupervised on the top-500 variable genes (VST) to test whether Prakriti stratification emerges without label input, then supervised (labels as y) to confirm cluster correspondence.
Weighted Gene Co-Expression Network Analysis (WGCNA)
Weighted gene co-expression networks were built with VST normalized expression data, using the package WGCNA [15]. Signed/unsigned networks were built from VST data (soft-threshold β = 7, R² ≥ 0.85). TOM-based dissimilarity was hierarchically clustered (deepSplit = 2, minClusterSize = 30); modules were merged at eigengene correlation cutHeight = 0.25. Module eigengenes (1st PC) were Pearson-correlated with one-hot Prakriti traits (Student asymptotic significance) and retained as quantitative features.
Functional Enrichment and Pathway Activity Inference
Over-representation analysis was performed using clusterProfiler [16] against Gene Ontology (Biological Process, Molecular Function, Cellular Component) and KEGG databases, with Benjamini-Hochberg correction for multiple testing [17], results were visualized as dot plots, bar plots, and enrichment networks. Pathway activity inference was done using PROGENy [18] on the VST-normalized matrix, applying the top 500 responsive genes per pathway in the human PROGENy model with 1,000 permutations to derive activity z-scores (positive, relative activation; negative, relative suppression). Gene set variation analysis (GSVA) [19] was performed on harmonized VST-normalized data (kcdf = Gaussian) using KEGG-legacy and Hallmark (MSigDB) gene sets (10–500 genes per set) to derive sample-wise pathway enrichment scores. A metabolism-focused subset of KEGG and Reactome pathways was additionally selected using keyword filtering (biosynthesis, degradation, oxidation, glycolysis, TCA cycle, phosphorylation, transport, mitochondrial metabolism, lipid metabolism, amino acid metabolism, carbohydrate metabolism, nucleotide metabolism, vitamins, cofactors).
Modeling Transcription Factor and Dark Kinase Activity
Transcription factor activity was inferred from the expression matrix obtained by VST-normalization of the expression matrix using DoRothEA [20] regulons coupled with VIPER[21], to identify Prakriti-associated differences in the transcriptional regulatory programs. DoRothEA regulons (confidence A-C, ≥10 targets) + VIPER on VST data yielded TF-by-sample activity. Group differences: Kruskal-Wallis + BH-FDR [17]; features at FDR < 0.20 underwent Dunn’s post-hoc testing. Dominant Prakriti group = highest mean activity per TF; intergroup range quantified regulatory divergence. Top TFs (by adjusted p) shown as z-scored, clustered heatmaps (Prakriti-annotated) and dot plots (mean ± SE).
Dark kinase activity was measured in terms of mean row-wise z-scores for specific groups of kinases defined using a list of nominated kinase genes provided by the Illuminating the Druggable Genome (IDG) project [22]. The gene expression values within each gene set in the dark kinase set were z-scored across the cohort and the average of these z-scored values within gene sets was calculated for each sample to create a composite activity score of each gene set. This method allows for an expression-based surrogate measurement of functional kinase activity without direct measurement of phosphoproteomic data.
Immune Microenvironment Deconvolution
Immune cell composition was estimated using three complementary methods applied to TPM-normalized data, consistent with each method’s calibration. Single-sample GSEA (ssGSEA; GSVA package) [23] cored 29 immune cell-type and functional-state signatures from Charoentong et al. [24], subsequently collapsed into 10 immune functional modules. xCell was applied per the original TPM-based [25]. CIBERSORTx was run in absolute mode with B-mode batch correction and the LM22 leukocyte reference signature [26,27], was used as the deconvolution reference using 1,000 permutations for significance estimation.
IEMA Defines Immune Evasion Marker Analysis
A curated panel of immune evasion-associated genes, spanning checkpoint molecules (PD-1/PD-L1, CTLA-4, TIM-3, LAG-3, TIGIT), immunometabolic regulators (IDO/TDO, adenosine axis, HIF1A, LDHA, PKM), immunosuppressive cytokines (TGF-β, IL-10, VEGF), antigen presentation machinery (HLA class I, B2M, TAP1/2, PSMB8/9), myeloid-derived suppressor cell markers (ARG1, NOS2), regulatory T-cell markers (FOXP3, IL2RA, IKZF2), tumor-associated macrophage markers (CSF1R, CD163, MRC1), and additional co-inhibitory molecules (VSIR, BTLA, CD276, VTCN1, SIGLEC15) was evaluated in VST-normalized data. Where fewer than 30 markers were detected, the top 50 most variable genes by coefficient of variation were added. Group differences were assessed by one-way ANOVA with Benjamini-Hochberg correction and BH-adjusted pairwise t-tests [17].
Prakriti-Disease Gene Signature Cross-Mapping
Disease-associated gene sets (GMT format, Enrichr) were screened against curated gene lists for three Vyadhi categories from Charak Samhita and Madhav Nidhan namely, Vataja, Pittaja, and Kaphaja Nanatmaja (86, 91, and 64 genes, respectively) with symptom and disease-hint keywords expanded via a curated synonym dictionary. MN symptoms and keywords were expanded using a curated synonym dictionary (e.g., burning → pyrosis, heartburn; paralysis → palsy, paresis; bleeding → haemorrhage, hemorrhagic) to improve string-matching recall. Diseases sharing ≥2 genes with a given Prakriti list were retained and ranked by a composite score integrating gene overlap, keyword similarity, and modern disease-hint similarity. A gene overlap score defined as:
where is the number of shared genes and is the total disease gene set size; The composite score was computed as:
A keyword similarity score, the proportion of expanded MN keywords matching the disease name string; A modern disease hint score a graded, scaled proportion of curated hint terms matching the disease name, capped at 1.
Cross-Layer Statistical Integration & Modelling
Per-sample scores from six analytical layers, WGCNA module eigengenes, PROGENy pathway activity, GSVA enrichment (KEGG, Hallmark, Reactome), ssGSEA immune abundance, VIPER TF activity, and dark kinase composite scores were merged into a unified feature matrix. Features with variance < 0.05 were excluded, and remaining features were independently z-scored within each layer prior to integration to prevent scale-driven bias across analytical modalities. Principal component analysis (prcomp, centered and scaled) was applied to the integrated matrix to assess dominant axes of variance and Prakriti group separation.
Statistical Analysis
Group-wise comparisons (Kapha, Pitta, Vata) were performed using one-way ANOVA or Kruskal-Wallis tests as appropriate, with post-hoc pairwise testing where indicated. Enrichment and pathway-based results were corrected for multiple testing using the Benjamini-Hochberg procedure; features meeting the pre-specified FDR threshold were considered significant. For cross-layer integration, z-score standardized feature matrices were combined and evaluated by principal component analysis to assess group-level separation across Prakriti classes.
Results
Transcriptomic Profiling Reveals Robust Prakriti-Concordant Stratification
Unsupervised UMAP of variance-stabilized expression, computed without phenotypic labels, resolved three spatially distinct, non-overlapping clusters with no inter-cluster bridging (Figure 1A), indicating that the dominant axes of transcriptomic variance form discrete rather than continuous phenotypic states. Superimposing Prakriti labels showed exact one-to-one correspondence between clusters and constitutional type (Figure 1B). Vata occupied a compact cluster at positive UMAP1, while Kapha and Pitta both localized to negative UMAP1 space but separated along UMAP2 (Kapha lower, Pitta higher). This complete spatial congruence establishes constitutional classification as a primary organizing axis of transcriptomic identity, recoverable without prior group information.
Weighted Gene Co-Expression Network Analysis Reveals Prakriti-Specific Transcriptomic Modules
WGCNA on 168 VST-normalized samples (β = 7, R² ≥ 0.85; deepSplit = 2, minClusterSize = 30; eigengene merging at cutHeight = 0.25) yielded 18 modules (Figure 2A–D). Three showed strong trait correlations: royalblue–Vata (r = 0.78, p ≈ 2.5 × 10⁻⁷), lightgreen–Pitta (r = 0.72, p ≈ 1.3 × 10⁻¹⁵), and lightyellow–Kapha (r = 0.75, p = 1.39 × 10⁻⁴); no other module-trait pair approached these magnitudes (Figure 2A-C). Pearson correlation between module eigengenes and one-hot encoded Prakriti categories identified three modules with strong, statistically significant trait associations (Figure 2D). Hub genes indicate distinct biology per module. Royalblue (Vata): UBE2A, BCL2L13, DMC1, ANKRD12, SLC35A2 - ubiquitin conjugation, mitochondrial apoptotic signaling, DNA repair. Lightgreen (Pitta): MAD1L1, KMT2E, MTMR11, PRDM6, SPAG4 - mitotic checkpoint control, histone methylation. Lightyellow (Kapha): LIG3, TRPC5, DDX1, LAMB4, TFIP11 - single-strand break repair, TRP channel activity, ECM organization.
Functional Annotation of Prakriti-Associated Modules Uncovers Distinct Biological Landscapes
ORA of the three Prakriti-associated WGCNA modules produced biologically distinct enrichment profiles with no meaningful functional overlap between them.
Lightyellow (Kapha): Top BP terms were tRNA/RNA splicing via endonucleolytic cleavage and ligation, followed by DNA ligation/double-strand break repair, regulation of bone resorption/remodeling, and phospholipid/lipid translocation. CC terms: integrin complex, cell-adhesion protein complex, calcium channel complex, CatSper complex (consistent with TRPC5/CATSPER3 hubs). MF terms: store-operated calcium channel activity, death receptor activity, TNF-receptor activity, H3K36-demethylase activity (distinct from the H3K4-methylation signature in lightgreen). KEGG returned one significant term, nucleocytoplasmic transport; the sparse pathway yield reflects limited KEGG-annotated hub genes rather than lack of specificity. (Figure 3A).
Lightgreen (Pitta): BP dominated by extracellular matrix/structure organization and H3K4 trimethylation/regulation (Figure 3B), CC enriched for transcriptionally active chromatin. MF dominated by ubiquitin- and ubiquitin-like-conjugating enzyme activity. KEGG: ubiquitin-mediated proteolysis, motor proteins, lysine degradation, and GABAergic synapse. Ceramide biosynthesis and spermatid nucleus differentiation were also BP-enriched, with no counterpart in the other two modules.
Royalblue (Vata): Innate immune signature consistent across all three GO ontologies and KEGG (Figure 3C). BP led by LPS-mediated signaling, TLR signaling, macropinocytosis, pattern-recognition signaling, chronic inflammatory response. CC dominated by specific/secretory granule lumen. MF: pattern-recognition receptor activity, NAD+ nucleosidase activity, protein serine kinase activity. KEGG returned ten significant terms, led by chemokine signaling, with NK-cell-mediated cytotoxicity, TLR signaling, leukocyte transendothelial migration, and viral protein–cytokine/cytokine-receptor interaction also significant. This defines a Vata transcriptome of pathogen recognition, innate immune mobilization, and cytokine-driven trafficking.
Transcriptomic Footprinting Reveals Differential Signaling Pathway Activity Across Prakriti Phenotypes
Of 14 pathways tested, eight were significantly activated cohort-wide: JAK-STAT, TNFa, NFkB, VEGF, Hypoxia, Androgen, WNT, and p53. Six were significantly suppressed in all groups (p < 0.001 each): TGFb, PI3K, MAPK, Estrogen, EGFR, Trail - describing broad inflammatory/hypoxic activation with suppressed mitogenic/growth-factor signaling.
This directional profile was identical across Kapha, Pitta, and Vata for all 14 pathways. Hierarchical clustering of per-sample scores did not recover Prakriti structure; within- and between-group variance were comparable for every pathway (Figure 4A). indicating the WGCNA/ORA-level constitutional architecture is not visible at this canonical-pathway resolution. However, per-sample pairwise analysis revealed selective between-group differences in pathway magnitude (Figure 4B, Supplementary Figure 1). Biclustering separated the eight activated from six suppressed pathways as row clusters, but columns did not organize by Prakriti. Within the activated cluster, JAK-STAT showed the widest per-sample dynamic range, with a Vata subset reaching cohort-wide maximal z-scores though non-uniformly, so this did not constitute a group-level signal. PROGENy thus resolves a shared inflammatory scaffold plus selective, sample-level constitutional differences in pathway magnitude.
Regulatory Network Profiling Reveal Phenotype-Specific Activity Signatures
VIPER-based differential TF activity was assessed across 242 regulators (VST data; FDR < 0.20, the appropriate threshold for network-inferred, effect-compressed VIPER scores rather than the conventional 0.05). Fourteen TFs met FDR < 0.20 and effect size ≥ 0.5 (Figure 5B).
The Kapha phenotype was characterized by the dominant activity of seven TFs: TP63, NFIC, HNF1B, PPARA, FOXA1, FLI1, and FOS. Hierarchical clustering of the top 30 TFs confirmed consistent, individual-level co-activation of TP63, NFIC, NFKB2, and FOXA1 within this cohort. Functionally, this regulatory signature exhibits strong biological convergence with the lightyellow module’s over-representation analysis (ORA). TP63 governs epithelial-barrier/immune programs; FOXA1 remodels myeloid enhancers and co-occupies lipid-metabolism loci with PPARA consistent with the bone-remodeling, lipid-translocation, and RNA-repair terms of the lightyellow ORA. In the Pitta cohort, four TFs demonstrated significant elevation: DUX4, JUN, OTX2, and MEIS1. JUN, a core AP-1 subunit regulating cytokine transcription and ubiquitin-pathway genes, shows the clearest cross-layer convergence with the lightgreen ORA. DUX4’s somatic role and co-occurrence with OTX2 requires resolution via the integration matrix. Finally, the Vata phenotype was uniquely driven by two primary TFs: PROX1 and NFE2L1 (NRF1).PROX1 and NFE2L1/NRF1. PROX1 governs lymphatic endothelial identity and immune trafficking, aligning with royalblue’s chemokine/transendothelial-migration enrichment; NFE2L1 drives proteasomal gene expression under proteotoxic stress. The low Vata TF count may reflect regulatory architecture driven more by post-translational (TLR/cytokine receptor) mechanisms than by expression-level TF activity.
Gene Set Variation and Directional Enrichment Reveal Divergent Pathway Signatures Across Phenotypes
GSVA showed Kapha most consistently elevated, Vata most suppressed, and Pitta intermediate across most of the highest-variance pathways. Kapha highest for pathogenic E. coli infection, leukocyte transendothelial migration, chemokine signaling, Fcγ-R-mediated phagocytosis, NK-cell cytotoxicity, oxidative phosphorylation, spliceosome. Kapha highest for ROS pathway, heme metabolism, TGF-β signaling, PI3K-AKT-mTOR, apoptosis, IFN-γ response, TNFa-via-NFkB reveled broad Kapha elevation across immune, redox, and growth-factor sets, reinforcing lightyellow WGCNA biology (Figure 6).
Vata showed modest KEGG enrichment in amino-acid catabolism: glycine/serine/threonine metabolism, alanine/aspartate/glutamate metabolism, butanoate metabolism, valine/leucine/isoleucine degradation, the only KEGG sets with Vata as top group and range > 0.18. No Vata-dominant Hallmark term reached comparable range. Pitta showed the weakest specificity: KEGG asthma, complement/coagulation cascades, cytokine-cytokine receptor interaction; Hallmark KRAS-signaling-up, Hedgehog signaling (0.059). Vata-vs-Sama KEGG GSEA identified four significant pathways: ribosome (most significant overall; NES = 2.559, padj = 2.78 × 10⁻¹⁰), cell adhesion molecules (NES = 1.683, padj = 0.047), basal cell carcinoma pathway (NES = 1.786, padj = 0.050), and downregulated Leishmania infection (NES = -1.962, padj = 0.003). The ribosome result, combined with royalblue hub genes, implicates translational machinery as a consistent Vata feature. Per-pathway violin plots for the most variable gene sets are provided in Supplementary Figures 2–3.
Consensus Immune Deconvolution Reveals Distinct Cellular Landscapes Across Prakriti Phenotypes
Three TPM-based methods were applied: ssGSEA (29 signatures), CIBERSORTx (absolute mode, B-mode correction, 22 subtypes), and xCell (spillover-compensated, 64 types). Gross composition was broadly conserved: CIBERSORTx showed monocyte dominance in all samples regardless of Prakriti, with stable CD4+-memory/CD8+ fractions; xCell similarly showed NKT cells, memory CD4+ T-cells, and eosinophils highest across all groups, with within-group variance comparable to between-group variance (Figure 7).
FDR-filtered xCell testing identified five significant populations: macrophages M2 and NKT cells, B-cells, plasma cells, and NK cells. The Kapha M2-macrophage/B-cell findings align with the integrin/cell-adhesion/ECM terms from lightyellow and lightgreen ORA. The Pitta/Vata plasma-cell asymmetry has no direct WGCNA/ORA counterpart (Figure 7B).
ssGSEA across 29 signatures produced a consistent two-cluster structure across all four Prakriti groups (including Sama): one broadly activated cluster (HLA, MHC-I, iDC, cytolytic activity, CD8 T-cell, TIL, B-cell, Type I/II IFN, APC, neutrophil, NK cell, T-helper, inflammation-promoting, parainflammation) and one broadly suppressed cluster (T-cell co-stimulation, APC co-stimulation, Th1, CCR, T-cell co-inhibition, mast cell, pDC, Treg, checkpoint). Neither cluster split by Prakriti, matching the PROGENy finding of a cohort-wide, non-discriminating innate-activation/checkpoint-suppression state (Figure 7E).
Prakriti-Specific Gene Expression Signatures Map onto Modern Disease Phenotypes with Distinct Molecular Profiles
Cross-mapping of Manas-Nija (MN) symptoms to disease gene sets across the three Nanatmaja Prakriti types (Figure 9) was scaled via UpSet plot across full disease-association sets (Vata n = 1,492; Pitta n = 1,282; Kapha n = 863; Supplementary Figure 4).
Figure 8.
Prakriti-associated Nanatmaja Doshas share distinct gene signatures with modern disease phenotypes. (A) Dot plot illustrates the number of shared genes between Prakriti-specific Nanatmaja Dosha classifications (Kaphaja, Pittaja, and Vataja) and a panel of modern disease phenotypes. Dot size reflects the disease score (range: 0.26–0.34), and dot color represents the corresponding Dosha category. Statistical significance of overlap was assessed using BH-adjusted hypergeometric p-values (★★★ p<0.05, ★★ p<0.1, ★ p<0.2; ns = not significant).(B) Heatmap depicting gene expression levels of disease-associated shared gene signatures across the three Nanatmaja Dosha subtypes (Vataja, Kaphaja, and Pittaja). Rows represent individual genes, and columns correspond to Dosha subtypes. Color intensity reflects normalized expression levels (scale: 0.000–0.342). Disease categories are annotated on the right axis via a color-coded legend.
Figure 8.
Prakriti-associated Nanatmaja Doshas share distinct gene signatures with modern disease phenotypes. (A) Dot plot illustrates the number of shared genes between Prakriti-specific Nanatmaja Dosha classifications (Kaphaja, Pittaja, and Vataja) and a panel of modern disease phenotypes. Dot size reflects the disease score (range: 0.26–0.34), and dot color represents the corresponding Dosha category. Statistical significance of overlap was assessed using BH-adjusted hypergeometric p-values (★★★ p<0.05, ★★ p<0.1, ★ p<0.2; ns = not significant).(B) Heatmap depicting gene expression levels of disease-associated shared gene signatures across the three Nanatmaja Dosha subtypes (Vataja, Kaphaja, and Pittaja). Rows represent individual genes, and columns correspond to Dosha subtypes. Color intensity reflects normalized expression levels (scale: 0.000–0.342). Disease categories are annotated on the right axis via a color-coded legend.
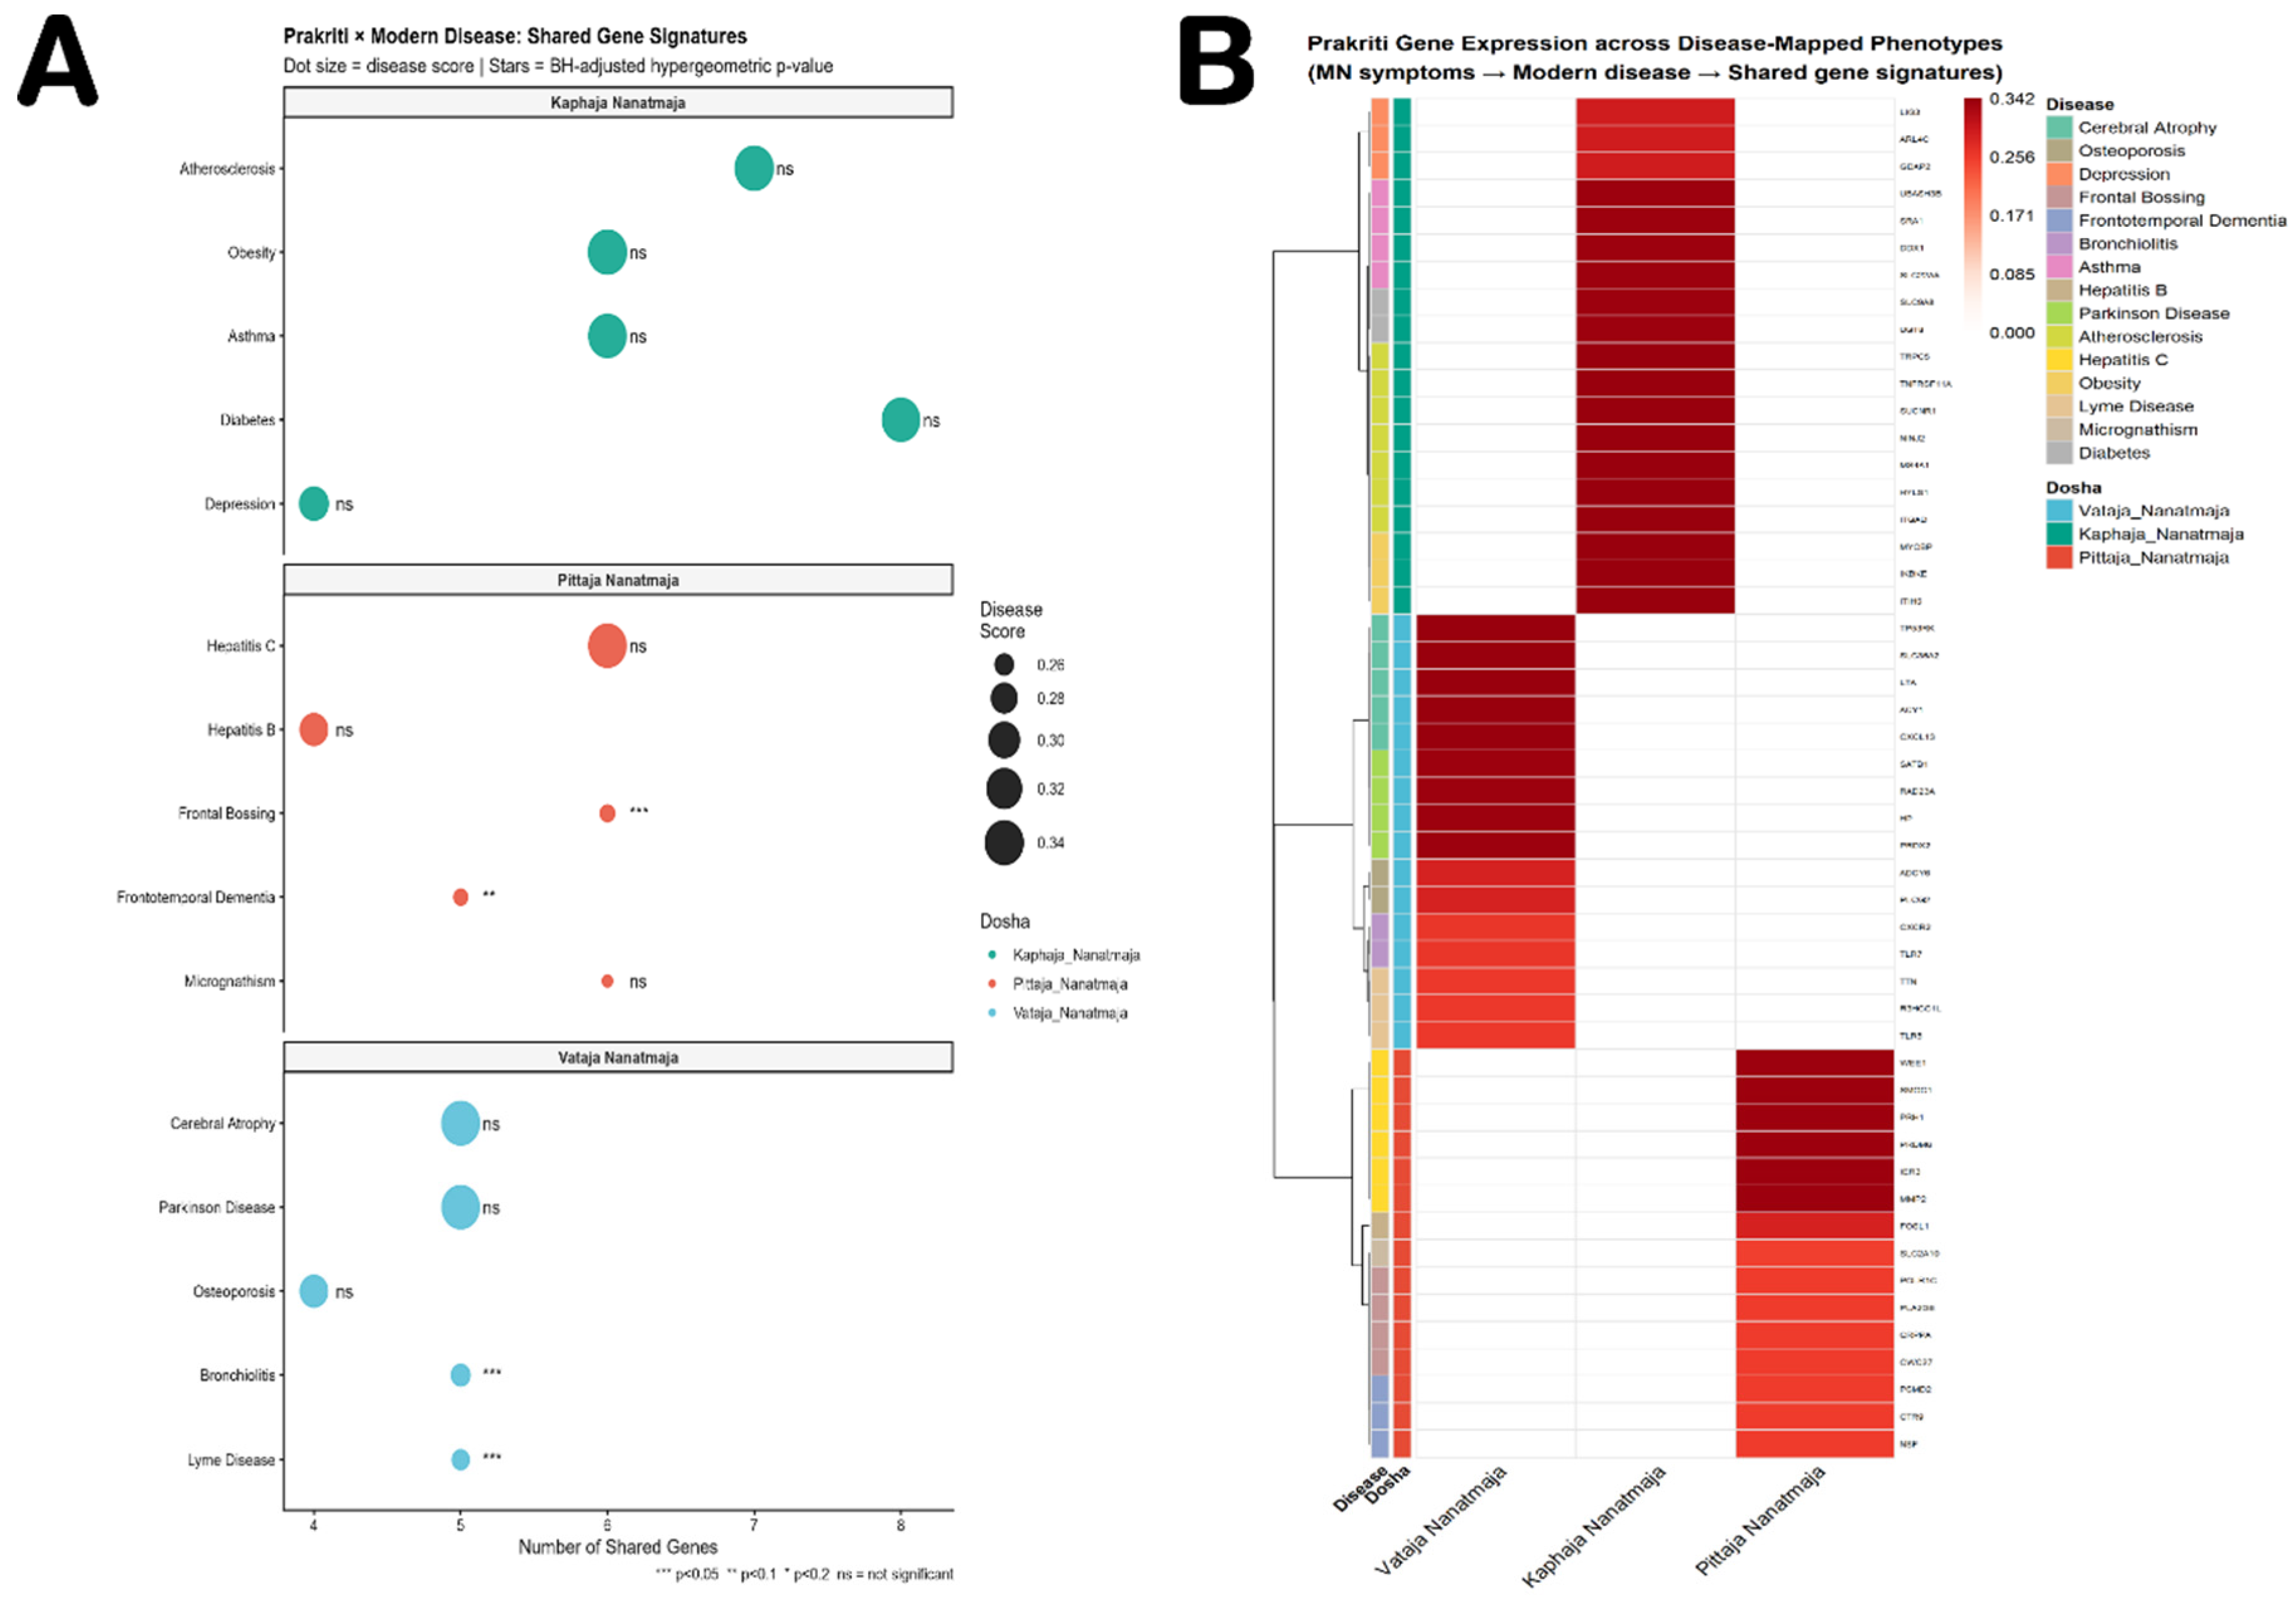
Figure 9.
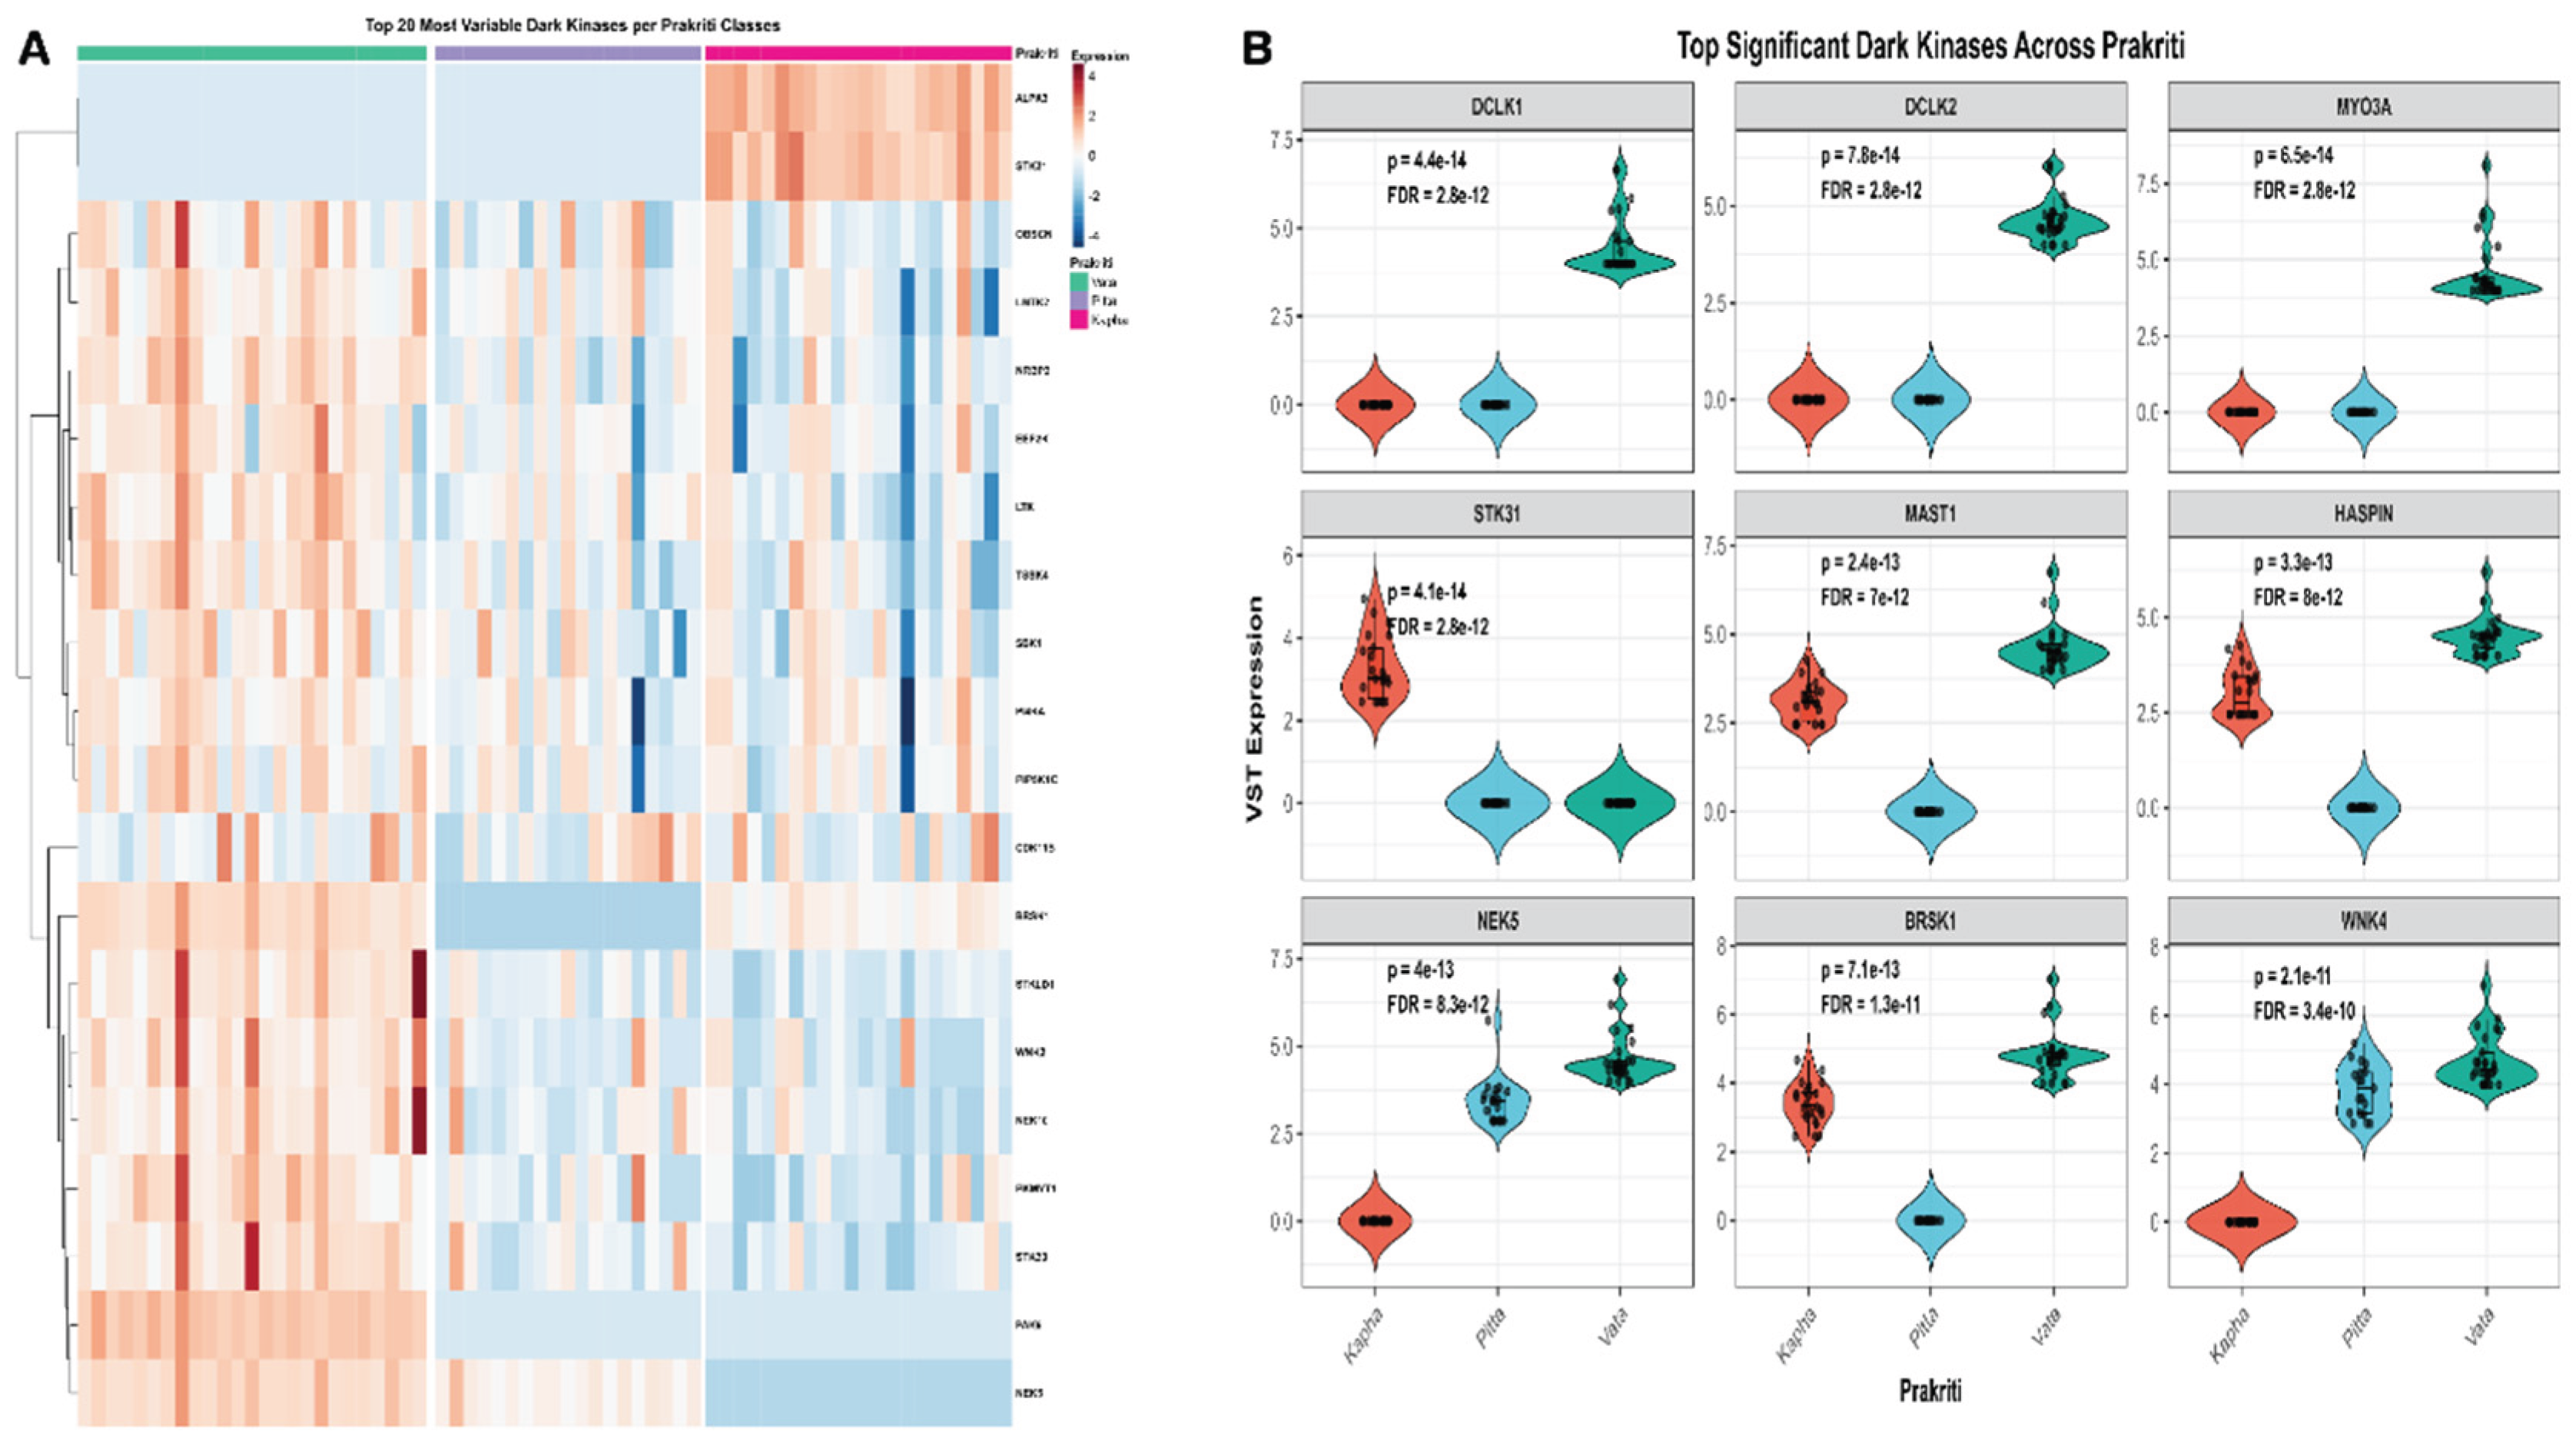
Heatmap of the top 20 most variable dark kinases reveals Prakriti-stratified expression patterns across understudied kinase regulators. (A) Dark kinases are defined as members of the human kinome that remain largely uncharacterized with respect to substrate specificity and biological function. Gene rows are ordered by hierarchical clustering (left dendrogram), revealing co-expressed dark kinase modules with shared Prakriti-concordant expression patterns. The red-blue diverging color scale represents normalized expression (range: -4 to +4), with red indicating elevated and blue indicating suppressed expression B) Differential Expression of Significant Dark Kinases: Violin plots illustrate the VST (Variance Stabilizing Transformation) expression levels for nine high-significance kinases (DCLK1, DCLK2, MYO3A, STK31, MAST1, HASPIN, NEK5, BRSK1, and WNK4) across the Prakriti groups. Statistical significance is indicated by p-values and False Discovery Rate (FDR) values, highlighting the molecular heterogeneity between Vata, Pitta, and Kapha cohorts.
Figure 9.
Heatmap of the top 20 most variable dark kinases reveals Prakriti-stratified expression patterns across understudied kinase regulators. (A) Dark kinases are defined as members of the human kinome that remain largely uncharacterized with respect to substrate specificity and biological function. Gene rows are ordered by hierarchical clustering (left dendrogram), revealing co-expressed dark kinase modules with shared Prakriti-concordant expression patterns. The red-blue diverging color scale represents normalized expression (range: -4 to +4), with red indicating elevated and blue indicating suppressed expression B) Differential Expression of Significant Dark Kinases: Violin plots illustrate the VST (Variance Stabilizing Transformation) expression levels for nine high-significance kinases (DCLK1, DCLK2, MYO3A, STK31, MAST1, HASPIN, NEK5, BRSK1, and WNK4) across the Prakriti groups. Statistical significance is indicated by p-values and False Discovery Rate (FDR) values, highlighting the molecular heterogeneity between Vata, Pitta, and Kapha cohorts.
Panel 8A Kaphaja showed greatest overlap with Diabetes, Atherosclerosis/Obesity/Asthma, Depression. Pittaja showed significant associations with Frontal Bossing and Frontotemporal Dementia, plus non-significant overlap with Hepatitis C/B and Micrognathism. Vataja showed significant overlap with Bronchiolitis and Lyme Disease, and non-significant overlap with Cerebral Atrophy, Parkinson Disease, Osteoporosis. Panel 8B hierarchical clustering of expression along the MN-symptom→disease→gene axis produced three non-overlapping, Dosha-anchored clusters. Kaphaja (19 genes: LIG3, ARL4C, GDAP2, UBASH3B, SRA1, DDX1, SLC22A5, SLC8A8, UGT8, TRPC5, TNFRSF11A, SUCNR1, NINJ2, MS4A1, HYLS1, ITGAD, MYCBP, IKBKE, ITIH5) mapped to Atherosclerosis, Obesity, Depression, Diabetes, Asthma. Vataja (16 genes: TP53RK, SLC35A2, LTA, ACY1, CXCL13, SATB1, RAD23A, HP, PRDX2, ADCY6, PLCG2, CXCR2, TLR7, TTN, R3HCC1L, TLR5) mapped to Cerebral Atrophy, Osteoporosis, Bronchiolitis, Lyme Disease, Parkinson Disease; several genes (LTA, ACY1, CXCL13, PLCG2) have immune/lipid roles. Pittaja (15 genes: WEE1, SMOC1, PRH1, PRDM6, IER3, MMP2, FOSL1, SLC2A10, POLR1C, PLA2G6, CRPPA, CWC27, PSMD2, CTR9, NSF) mapped to Hepatitis B/C, Frontal Bossing, Frontotemporal Dementia, Micrognathism; MMP2/FOSL1 implicate ECM remodeling and stress-response activation. Non-overlapping, disease-specific clustering across all three types supports genuinely distinct molecular states underlying constitutional classification.
Dark Kinome Activity and Immune Evasion Signatures Reveal Phenotype-Specific Vulnerabilities
Dark kinase activity (mean row-wise z-scores, IDG-nominated genes, VST data) was assessed by linear modeling. Clustering of the top 20 variable dark kinases resolved two reciprocal modules (Figure 9A/B): ALPK3 and STK31 elevated in Kapha (vs. Vata/Sama); BRSK1, WNK2, and STKLD1 elevated in Vata and suppressed in Kapha. ALPK3 (cardiomyocyte mechanosensitive signaling) and STK31 (germline serine/threonine kinase, somatic role uncharacterized) mark Kapha; BRSK1 (neuronal polarity/axonal microtubule organization) and WNK2 (MAPK signaling/cell-volume homeostasis) mark Vata, aligning with GSVA neurotrophin/axon-guidance enrichment and PROX1 TF activity in that group.
A curated immune-evasion panel (checkpoint receptors/ligands, immunometabolic enzymes, antigen presentation, cytokines, NK receptors, myeloid/macrophage markers, Treg markers, VEGF family, apoptosis regulators, ECM genes) was tested by one-way ANOVA (BH) and pairwise Wilcoxon (BH). Clustering of the top 50 variable markers separated samples by Prakriti (Figure 10A): Kapha elevated for CD86, CD274, SIGLEC15, with suppressed VEGF/immunometabolic markers; Vata co-elevated checkpoint ligands, IDO2, ARG1, myeloid surface antigens, and ANGPT2 within the same cluster; Pitta distinguished by PDCD1LG2 elevation with relative suppression of Vata’s metabolic-immunosuppression genes.
PDCD1LG2 was the single most significant marker overall (highest in Pitta; Kapha/Vata both significantly lower). IDO2 was second-most significant, with opposite directionality (markedly elevated in Vata; near-zero in Kapha/Pitta). IDO2 depletes tryptophan and generates immunosuppressive kynurenine, identifying metabolic T-cell suppression as a Vata-specific mechanism distinct from Pitta’s PD-L2 axis. ARG1, also Vata-highest, is the canonical M2-macrophage/MDSC effector depleting arginine, corroborating the xCell M2-macrophage finding. TGFB3 followed the same Vata-dominant pattern, adding a third immunosuppressive mechanism. SIGLEC15, a PD-L1-independent myeloid checkpoint expressed on TAMs, was also Vata-elevated alongside IDO2/ARG1/TGFB3, indicating at least four mechanistically distinct, simultaneously active immunosuppressive programs in Vata. MMP9 was likewise Vata-highest, consistent with royalblue ECM/transendothelial-migration enrichment. CD274 (PD-L1, Vata) and PDCD1LG2 (PD-L2, Pitta) being elevated in different groups shows both PD-1 ligand-axis arms are active in this cohort but partitioned across Prakriti rather than co-expressed.
Cross Layer Phenotype-Specific Vulnerabilities
PCA of the integrated matrix (WGCNA, PROGENy, GSVA, VIPER, dark kinase; z-scored, near-zero-variance filtered) gave PC1 = 24.0%, PC2 = 17.8% (Figure 11C). Composite scores mirrored this separation: Vata was positive across all immune sub-modules, Kapha negative. Pitta’s Dark Kinome mean (-0.413) matched Kapha’s, but its ImmuneEvasion score was higher (-0.286), indicating a checkpoint/TGFβ/IL-10–driven rather than myeloid/metabolic-driven immunosuppressive profile.
Spearman correlations (Figure 11A/B) revealed three co-regulatory clusters. TNFa/NFkB–AP-1: PROGENy NFkB and TNFa correlated with Hallmark TNFa-via-NFkB (ρ = 0.834/0.823, FDR = 2.97×10⁻¹⁵/1.12×10-14) and with JUN (ρ = 0.813/0.811) and FOS (ρ = 0.813/0.728; all FDR < 10-9) as the strongest cross-layer signal in the matrix. Metabolic-dark kinase: KEGG oxidative phosphorylation and Parkinson’s disease co-varied (ρ = 0.976, FDR = 2.9×10-39, expected ETC-gene overlap); LMTK2 correlated negatively with both (ρ ≈ -0.82, FDR ≈ 10-14), consistent with Kapha’s fingerprint (ALPK3/STK31 up, mean z 1.44/1.42; LMTK2 down, z = -0.657; highest oxidative-phosphorylation GSVA). Hallmark oxidative phosphorylation, KEGG proteasome, and MYC Targets V1 further co-clustered (ρ = 0.90 and 0.89), marking a MYC-anchored metabolic-translational signature in Kapha. TF-kinase: PROX1↔OBSCN (ρ = 0.763, FDR = 1.8×10⁻¹¹), both Vata-dominant; PROGENy TGFb↔TP63 (ρ = 0.663), consistent with Kapha’s TGFb/TP63 program; PROGENy Androgen and VEGF↔BRSK1 (ρ = -0.692/-0.645), reflecting BRSK1’s Vata-high/Pitta-low pattern; Hallmark WNT-β-catenin↔PI4KA (ρ = 0.818), tracking PI4KA’s Kapha-low/Vata-high expression.
Interaction models (Outcome ~ DarkKinome × Prakriti, Kapha reference) across ten immune sub-modules showed significant DarkKinome main effects for six, largest for Checkpoint (β = 0.970, FDR = 2.0×10⁻¹⁰), Myeloid (β = 1.242, FDR = 1.7×10⁻⁸), and ImmuneEvasion (β = 0.704, FDR = 1.7×10⁻⁸). The DarkKinome×Pitta interaction was significant for Checkpoint (β = -0.780, t = -3.96, FDR = 0.0006), reversing the positive Kapha slope, and for Complement (β = 1.041, FDR = 0.011), steepening it. No Vata interaction reached significance for any module despite higher absolute dark-kinase activity, Vata’s regulatory slope matches Kapha’s, whereas Pitta shows distinct checkpoint/complement wiring (Figure 11C).
Discussion
Our multi-layered integration of co-expression networks, transcription factor (TF) activity, and immune deconvolution reveals that Ayurvedic constitutional phenotypes (Prakriti) are not driven by simple differential gene expression, but rather by distinct architectural differences in regulatory connectivity [6,8]. The most critical insight from this study is the marked dissociation between upstream canonical signaling and downstream effector regulation. While PROGENy analysis indicates that core signaling nodes including JAK-STAT, TNF-α, NF-κB, and hypoxia pathways fire uniformly across all three phenotypes, the downstream transcriptional and immunological outputs diverge significantly. This suggests that constitutional divergence manifests not in the activation of a pathway, but in how that activation is wired to downstream effectors within a specific molecular background.
The Vata phenotype presents a complex, paradoxical regulatory state, coupling robust innate immune activation with an extensive, multi-axis immunosuppressive program. The simultaneous elevation of TLR signaling and chemokine trafficking alongside five distinct regulatory brakes namely, IDO2, ARG1, TGFB3, SIGLEC15, and CD274 (PD-L1) suggests a hardwired mechanism for rapid mobilization and concurrent restraint. This architecture closely mirrors the complex immunosuppressive microenvironments observed in primary resistance to single-agent PD-1/PD-L1 blockade [31,32]. In contrast, Pitta diverges via a mechanistically distinct, highly plastic chromatin-driven program. The co-enrichment of H3K4 trimethylation and ubiquitin-mediated proteolysis in Pitta, governed primarily by the JUN/AP-1 transcriptional node, facilitates rapid, reversible transcriptional reprogramming. Furthermore, Pitta’s immune evasion relies predominantly on the narrower PDCD1LG2 (PD-L2) axis, highlighting a fundamentally different mechanism of immune restraint that could predict distinct sensitivities to targeted immunotherapies.
The Kapha phenotype exhibits the most internally consistent profile, characterized by sustained maintenance and quality-control mechanisms, including DNA repair, RNA splicing, and lipid translocation. Driven by TFs such as TP63, FOXA1, and PPARA/HNF1B, alongside tonically elevated oxidative phosphorylation and ROS signaling, this profile defines an active state of tissue homeostasis rather than immune quiescence. The enrichment of M2 macrophages and B-cells further supports a baseline of active surveillance and repair [33]. Notably, these molecular signatures provide a robust biological grounding for classical empirical observations regarding physiological resilience. In Ayurveda, Ojas is regarded as the ultimate essence of the seven Dhatu (fundamental bodily tissues), playing a crucial role in sustaining life, maintaining physiological stability [34,35], and providing Bala (strength) and Vyadhikshamatva (disease resistance) [36]. Ojas represents a comprehensive biological construct spanning vitality, tissue integrity, resilience, and immune competence. A balanced state of Kapha is considered the physiological manifestation of Ojas, contributing to tissue nourishment and host defense [37]. Classical Ayurvedic texts describe individuals with Kapha Prakriti as Ojasvi and Balavanta [38], indicating optimal Ojas and superior Bala, whereas those with Vata Prakriti are characterized as Alpaujas and Alpa Bala [39], reflecting comparatively lower physiological strength and disease resistance. Supporting these classical concepts, our transcriptomic analysis confirms an enrichment of active immune surveillance and repair pathways in Kapha, juxtaposed against the complex, multi-axis immune suppression observed in Vata.
Beyond individual phenotypes, the classical Ayurvedic principles of Guna (inherent qualities) and Karma (physiological functions) offer a valuable translational framework for contextualizing these transcriptomic variations [10,40]. The Shighra (rapid) quality of Vata closely associates with the enhanced leukocyte trafficking, dynamic immune responsiveness, and rapid cellular communication observed in our network analysis [40,43]. In contrast, the Sthira (stable) and Guru (heavy/nourishing) qualities of Kapha align directly with our findings of sustained tissue homeostasis, extracellular matrix organization, DNA repair, and regenerative processes. Furthermore, the enrichment of ubiquitin-mediated proteolysis and metabolic pathways in Pitta corresponds mechanistically with the concept of Pitta–Agni, where the predominance of the Ushna (hot) attribute governs cellular transformation (Parinama), metabolism, and cellular homeostasis [44]. Collectively, these findings provide molecular evidence that the functional characteristics traditionally associated with the three Doshas have identifiable, distinct biological correlates that can be rigorously mapped via modern systems biology.
Expanding our analysis into the functionally unannotated “dark” kinome [41,42] confirmed that this phenotype-specific regulatory architecture extends beyond canonical pathways. We identified a context-dependent kinase output: composite dark kinase expression correlated positively with checkpoint gene expression in Kapha, but negatively in Pitta. This inverse relationship underscores that identical kinase inputs can yield opposing regulatory outputs depending on the underlying constitutional topology. Cross-layer integration further isolated a highly conserved TNF-α/NF-κB & AP-1 relay across the entire cohort. This relay appears to act as a constitutive transcriptional scaffold upon which phenotype-specific circuits such as the PROX1-lymphatic axis in Vata and the TP63-TGFβ maintenance axis in Kapha, are differentially wired.
While these findings provide a framework for understanding regulatory individuality, several limitations must be addressed. First, the reliance on bulk RNA-seq data inevitably obscures cellular heterogeneity; the co-occurrence of activation and suppression signatures in the Vata cohort could reflect true intracellular co-expression or merely a mixture of distinct, opposing cell populations. Subsequent single-cell RNA-sequencing (scRNA-seq) is required to resolve this cellular origin [43,44]. Second, TF activities (VIPER) [24], pathway engagement (PROGENy), and dark kinase impacts were computationally inferred from transcript abundance rather than measured directly. Direct mechanistic validation via phosphoproteomic profiling and functional perturbation is necessary to confirm post-translational regulatory behaviors. Furthermore, the use of a relaxed false discovery rate (FDR < 0.20) for TF inference necessitates independent cohort replication.
Ultimately, these findings propose that inter-individual variability in drug response and immune trajectory is deeply embedded in network wiring. If validated clinically, this constitutional framework could inform the design of stratified precision medicine protocols, particularly in oncology and chronic inflammatory diseases. Recognizing whether a patient’s baseline molecular architecture defaults to multi-axis suppression, chromatin plasticity, or active maintenance may prove critical in predicting whether they require single-agent targeted therapy or synergistic combinatorial approaches [45].
Conclusion
In conclusion, this study shows that Prakriti-associated molecular variation is not defined by isolated genes or single pathways, but by distinct regulatory configurations that emerge only when transcriptomic data are analysed across multiple layers. Although all three constitutions shared a broad inflammatory macro-state, they diverged in how this background was organized into phenotype-specific co-expression modules, transcription factor activity patterns, pathway states, immune-cell features and immune-evasion programs. Vata was characterized by innate immune mobilization coupled to strong immunosuppressive buffering, Pitta by chromatin-regulatory and mitochondrial-proteostatic specialization with a dominant PD-L2 axis, and Kapha by repair-oriented, immune-metabolic and structurally coordinated programmes.
Importantly, the inclusion of the dark kinome revealed that understudied kinases are not peripheral features, but part of the core regulatory architecture that distinguishes constitutional states. Their coupling with immune-evasion outputs, and the Prakriti-dependent reversal of checkpoint regulation in Pitta relative to Kapha, suggests that constitutional background shapes not only molecular abundance but also the logic of cross-layer signalling itself. Together, these findings move Ayurgenomics beyond descriptive stratification and towards a systems-level, mechanistic framework for constitutional biology, while also providing a foundation for future validation in precision immunology, kinase biology and personalised medicine.
Supplementary Materials
The following supporting information can be downloaded at the website of this paper posted on Preprints.org.
Funding
The author(s) acknowledge the funds received by Rupesh Chaturvedi from the Central Council for Research in Ayurvedic Sciences (Grant No: HQ-PROJ011/33/2024-PROJ), also funds received by Rana Pratap Singh from the Central Council for Research in Ayurvedic Sciences (Grant No: PAC/SCSM/RPS/CCRAS/1616).
Acknowledgments
The authors express their sincere gratitude to Vaidya Rajesh Kotecha, Secretary, Ministry of Ayush, Government of India, for his valuable guidance and unwavering support throughout the study. The authors also extend their heartfelt thanks to the Vice Chancellor of Jawaharlal Nehru University (JNU), New Delhi, for providing institutional support in conducting this collaborative study. The authors are deeply grateful to the Directors/In-Charges of the CCRAS institutes, namely NARIP, Cheruthuruthy; CARI, Bhubaneswar; Raja Ramdeo Anandilal Podar CARI, Mumbai; CARI, Guwahati; CARI, Patiala; RARI, Lucknow; and RARI, Gangtok, for their continuous support and cooperation throughout the study. Finally, the authors wish to express their profound appreciation to all the study participants. Their willingness to participate and valuable contribution made this study possible.
Authorship Contribution Statement
Dyumn Dwivedi: Writing - Original Draft, Writing - Review & Editing, Visualization; Dr. Renu Singh, Dr. B.C.S Rao: Conceptualization, designing, Supervision, Funding acquisition, Writing - Review & Editing; Dr. Lalita Sharma, Dr. Adarsh Kumar, Dr. Pratap Makhija, Dr. N. Srikanth, Prof. Vd. Rabinarayan Acharya, Prof. Vaidya Kartar Singh Dhiman: Conceptualization, designing, Supervision, Funding acquisition; Dr. Saylee Deshmukh, Dr. Harbans Singh: served as study investigators at their respective centers and contributed to participant recruitment, informed consent procedures, clinical evaluations, Prakriti assessment, data collection, and sample collection, Writing - Review & Editing of draft manuscript; Dr. Kuldeep Choudhary, Dr. Sandip Baheti, Dr. Rohit KS, Dr. Sreedeepthi, Dr. Krishna Kumar Venugopal, Dr. Banamali Das, Dr. Indu Sabu, Dr. Ekta Dogra, Dr. Jeutirani Das, Dr. Alok Srivastava, Dr. Anjali Prasad, Dr. Ashok Sinha, Dr. Sariga KS, Dr. Rahul Ghuse: served as study investigators at their respective centers and contributed to participant recruitment, informed consent procedures, clinical evaluations, Prakriti assessment, data collection, and sample collection; Bishal Patgiri, Maya Chaturvedi, Pallavi Somvanshi, Hemant Ritturaj Kushwaha: Writing - Review & Editing; Rana Pratap Singh: Conceptualization, Funding acquisition, Project administration, Supervision, Writing - review & editing; Rupesh Chaturvedi: Conceptualization, Funding acquisition, Project administration, Supervision, Writing - review & editing.
Conflicts of Interest
The author(s) report no conflict of interest.
Data and Materials Availability
The transcriptomic datasets generated and/or analyzed during the current study are available from the corresponding author on reasonable request.
Declaration of generative AI and AI-assisted technologies in the writing process
The writing of this review paper involved the use of generative AI and AI-assisted technologies only to enhance the clarity, coherence, and overall quality of the manuscript. The authors acknowledge the contributions of AI in the writing process while ensuring that the final content reflects the author’s own insights and interpretations of the literature. All interpretations and conclusions drawn in this manuscript are the sole responsibility of the author.
References
- Tiwari, P.; et al. Recapitulation of Ayurveda constitution types by machine learning of phenotypic traits. PLoS ONE 2017, 12, e0185380. [Google Scholar] [CrossRef] [PubMed]
- Venkatesh, A.; et al. Prakriti (constitutional typology) in Ayurveda: a critical review of Prakriti assessment tools and their scientific validity. Front. Med. 2025, 12, 1656249. [Google Scholar] [CrossRef] [PubMed]
- Prasher, B.; et al. Ayurgenomics for stratified medicine: TRISUTRA consortium initiative across ethnically and geographically diverse Indian populations. J. Ethnopharmacol. 2017, 197, 274–293. [Google Scholar] [CrossRef] [PubMed]
- Abbas, T.; et al. Genetic differences between extreme and composite constitution types from whole exome sequences reveal actionable variations. Genomics 2020. [Google Scholar] [CrossRef]
- Prasher, B.; et al. Whole genome expression and biochemical correlates of extreme constitutional types defined in Ayurveda. J. Transl. Med. 2008, 6, 48. [Google Scholar] [CrossRef] [PubMed]
- Aryal, S.; et al. Combating Hypertension Beyond GWAS: Microbiome and Artificial Intelligence as Opportunities for Precision Medicine. Camb. Prism. Precis. Med. 2023, 1–65. [Google Scholar] [CrossRef] [PubMed]
- Prasher, B.; et al. Whole genome expression and biochemical correlates of extreme constitutional types defined in Ayurveda. J. Transl. Med. 2008, 6, 48. [Google Scholar] [CrossRef] [PubMed]
- Juyal, R. C.; Negi, S.; Wakhode, P.; Bhat, S.; Bhat, B.; Thelma, B. K. Potential of Ayurgenomics Approach in Complex Trait Research: Leads from a Pilot Study on Rheumatoid Arthritis. PLoS ONE 2012, 7, e45752. [Google Scholar] [CrossRef] [PubMed]
- Govindaraj, P.; et al. Genome-wide analysis correlates Ayurveda Prakriti. Sci. Rep. 2015, 5, 15786. [Google Scholar] [CrossRef] [PubMed]
- Rotti, H.; et al. DNA methylation analysis of phenotype specific stratified Indian population. J. Transl. Med. 2015, 13, 151. [Google Scholar] [CrossRef] [PubMed]
- Mukerji, M. Ayurgenomics-based frameworks in precision and integrative medicine: Translational opportunities. Camb. Prism. Precis. Med. 2023, 1, e29. [Google Scholar] [CrossRef] [PubMed]
- Wallace, R. K. Ayurgenomics and Modern Medicine. Medicina (Mex.) 2020, 56, 661. [Google Scholar] [CrossRef] [PubMed]
- Gomez, S. M.; et al. Illuminating function of the understudied druggable kinome. Drug Discov. Today 2024, 29, 103881. [Google Scholar] [CrossRef] [PubMed]
- Moret, N.; et al. A resource for exploring the understudied human kinome for research and therapeutic opportunities. Systems Biology 2020. [Google Scholar] [CrossRef]
- Hamoud, A.; et al. Illuminating the dark kinome: utilizing multiplex peptide activity arrays to functionally annotate understudied kinases. Cell Commun. Signal. 2024, 22, 501. [Google Scholar] [CrossRef] [PubMed]
- “Development of a standardized assessment scale...: AYU (An International Quarterly Journal of Research in Ayurveda),” Ovid. Available online: https://www.ovid.com/jnls/aayu/fulltext/10.4103/ayu.ayu_239_22~development-of-a-standardized-assessment-scale-for-assessing (accessed on 29 July 2026).
- Development of Standardized Prakriti Assessment. Journal of Research in Ayurvedic Sciences, Ovid. Available online: https://www.ovid.com/jnls/jras/fulltext/10.5005/jp-journals-10064-0019~development-of-standardized-prakriti-assessment-tool-an (accessed on 6 August 2026).
- Ram, J. B.; et al. Swasthya Assessment Scale (SAS)-Ayurveda based health assessment tool-insights on its development and validation. AYU Int. Q. J. Res. Ayurveda 2021, 42, 151–155. [Google Scholar] [CrossRef] [PubMed]
- Love, M. I.; Huber, W.; Anders, S. Moderated estimation of fold change and dispersion for RNA-seq data with DESeq2. Genome Biol. 2014, 15, 550. [Google Scholar] [CrossRef] [PubMed]
- Langfelder, P.; Horvath, S. WGCNA: an R package for weighted correlation network analysis. BMC Bioinform. 2008, 9, 559. [Google Scholar] [CrossRef] [PubMed]
- Yu, G.; Wang, L.-G.; Han, Y.; He, Q.-Y. clusterProfiler: an R Package for Comparing Biological Themes Among Gene Clusters. OMICS J. Integr. Biol. 2012, 16, 284–287. [Google Scholar] [CrossRef] [PubMed]
- Benjamini, Y.; Hochberg, Y. Controlling the False Discovery Rate: A Practical and Powerful Approach to Multiple Testing. J. R. Stat. Soc. Ser. B Stat. Methodol. 1995, 57, 289–300. [Google Scholar] [CrossRef]
- Schubert, M.; et al. Perturbation-response genes reveal signaling footprints in cancer gene expression. Nat. Commun. 2018, 9, 20. [Google Scholar] [CrossRef] [PubMed]
- Hänzelmann, S.; Castelo, R.; Guinney, J. GSVA: gene set variation analysis for microarray and RNA-Seq data. BMC Bioinform. 2013, 14, 7. [Google Scholar] [CrossRef] [PubMed]
- Garcia-Alonso, L.; Holland, C. H.; Ibrahim, M. M.; Turei, D.; Saez-Rodriguez, J. Benchmark and integration of resources for the estimation of human transcription factor activities. Genome Res. 2019, 29, 1363–1375. [Google Scholar] [CrossRef] [PubMed]
- Alvarez, M. J.; et al. Functional characterization of somatic mutations in cancer using network-based inference of protein activity. Nat. Genet. 2016, 48, 838–847. [Google Scholar] [CrossRef] [PubMed]
- Moret, N.; et al. A resource for exploring the understudied human kinome for research and therapeutic opportunities. Systems Biology 2020. [Google Scholar] [CrossRef]
- Hänzelmann, S.; Castelo, R.; Guinney, J. GSVA: gene set variation analysis for microarray and RNA-Seq data. BMC Bioinform. 2013, 14, 7. [Google Scholar] [CrossRef] [PubMed]
- Charoentong, P.; et al. Pan-cancer Immunogenomic Analyses Reveal Genotype-Immunophenotype Relationships and Predictors of Response to Checkpoint Blockade. Cell Rep. 2017, 18, 248–262. [Google Scholar] [CrossRef] [PubMed]
- Aran, D.; Hu, Z.; Butte, A. J. xCell: digitally portraying the tissue cellular heterogeneity landscape. Genome Biol. 2017, 18, 220. [Google Scholar] [CrossRef] [PubMed]
- Newman, A. M.; et al. Determining cell type abundance and expression from bulk tissues with digital cytometry. Nat. Biotechnol. 2019, 37, 773–782. [Google Scholar] [CrossRef] [PubMed]
- Newman, M.; et al. Robust enumeration of cell subsets from tissue expression profiles. Nat. Methods 2015, 12, 453–457. [Google Scholar] [CrossRef] [PubMed]
- Sharma, P.; Hu-Lieskovan, S.; Wargo, J. A.; Ribas, A. Primary, Adaptive, and Acquired Resistance to Cancer Immunotherapy. Cell 2017, 168, 707–723. [Google Scholar] [CrossRef] [PubMed]
- Jenkins, R. W.; Barbie, D. A.; Flaherty, K. T. Mechanisms of resistance to immune checkpoint inhibitors. Br. J. Cancer 2018, 118, 9–16. [Google Scholar] [CrossRef] [PubMed]
- Wynn, T. A.; Vannella, K. M. Macrophages in Tissue Repair, Regeneration, and Fibrosis. Immunity 2016, 44, 450–462. [Google Scholar] [CrossRef] [PubMed]
- Sushruta, “Sutrasthana,” in Sushruta Samhita of Sushruta, 4th Edition., T. Jadavji, Ed., Varanasi: Chaukhamba Sanskrit Sansthan, 1980, p. 71.
- Agnivesha, “Sutrasthana,” in Charaka Samhita of Agnivesha, Reprint Edition., T. Jadavji, Ed., Varanasi: Chaukhamba Sanskrit Sansthan, 2011, p. 184.
- Agnivesha, “Sutrasthana,” in Charaka Samhita of Agnivesha, Reprint Edition., T. Jadavji, Ed., Varanasi: Chaukhamba Sanskrit Sansthan, 2011, p. 105.
- Vagbhata, “Sutrasthana,” in Ashtanga Hridaya of Vagbhata, 7th Edition., S. H. Paradakar, Ed., Varanasi: Chaukhamba Sanskrit Sansthan, 1982, p. 183.
- Agnivesha, “Vimanasthana,” in Charaka Samhita of Agnivesha, Reprint Edition., T. Jadavji, Ed., Varanasi: Chaukhamba Sanskrit Sansthan, 2011, p. 277.
- Agnivesha, “Vimanasthana,” in Charaka Samhita of Agnivesha, Reprint Edition., T. Jadavji, Ed., Varanasi: Chaukhamba Sanskrit Sansthan, 2011, p. 277.
- Sethi, T. P.; Prasher, B.; Mukerji, M. Ayurgenomics: A New Way of Threading Molecular Variability for Stratified Medicine. ACS Chem. Biol. 2011, 6, 875–880. [Google Scholar] [CrossRef] [PubMed]
- Agnivesha, “Sutrasthana,” in Charaka Samhita of Agnivesha, Reprint Edition., T. Jadavji, Ed., Varanasi: Chaukhamba Sanskrit Sansthan, 2011, p. 109.
- Sushruta, “Sutrasthana,” in Sushruta Samhita of Sushruta, 4th Edition., T. Jadavji, Ed., Varanasi: Chaukhamba Sanskrit Sansthan, 1980, p. 83.
- Fedorov, O.; et al. A systematic interaction map of validated kinase inhibitors with Ser/Thr kinases. Proc. Natl. Acad. Sci. 2007, 104, 20523–20528. [Google Scholar] [CrossRef] [PubMed]
- Berginski, M. E.; Moret, N.; Liu, C.; Goldfarb, D.; Sorger, P. K.; Gomez, S. M. The Dark Kinase Knowledgebase: an online compendium of knowledge and experimental results of understudied kinases. Nucleic Acids Res. 2021, 49, D529–D535. [Google Scholar] [CrossRef] [PubMed]
- Hwang, B.; Lee, J. H.; Bang, D. Single-cell RNA sequencing technologies and bioinformatics pipelines. Exp. Mol. Med. 2018, 50, 1–14. [Google Scholar] [CrossRef] [PubMed]
- Stuart, T.; Satija, R. Integrative single-cell analysis. Nat. Rev. Genet. 2019, 20, 257–272. [Google Scholar] [CrossRef] [PubMed]
- Ginsburg, G. S.; Phillips, K. A. Precision Medicine: From Science To Value. Health Aff. (Millwood) 2018, 37, 694–701. [Google Scholar] [CrossRef] [PubMed]
Figure 1.
Unsupervised and supervised dimensionality reduction reveals Prakriti-concordant transcriptomic stratification. A) Unsupervised Uniform Manifold Approximation and Projection (UMAP) of the same dataset, depicting intrinsic low-dimensional structure without prior group labelling; two topologically distinct clusters are apparent, consistent with latent biological heterogeneity in the cohort. (B) Supervised UMAP with samples coloured by Prakriti class and 68% confidence ellipses, demonstrating near-complete spatial segregation of all three Prakriti types into discrete, non-overlapping transcriptomic clusters.
Figure 1.
Unsupervised and supervised dimensionality reduction reveals Prakriti-concordant transcriptomic stratification. A) Unsupervised Uniform Manifold Approximation and Projection (UMAP) of the same dataset, depicting intrinsic low-dimensional structure without prior group labelling; two topologically distinct clusters are apparent, consistent with latent biological heterogeneity in the cohort. (B) Supervised UMAP with samples coloured by Prakriti class and 68% confidence ellipses, demonstrating near-complete spatial segregation of all three Prakriti types into discrete, non-overlapping transcriptomic clusters.
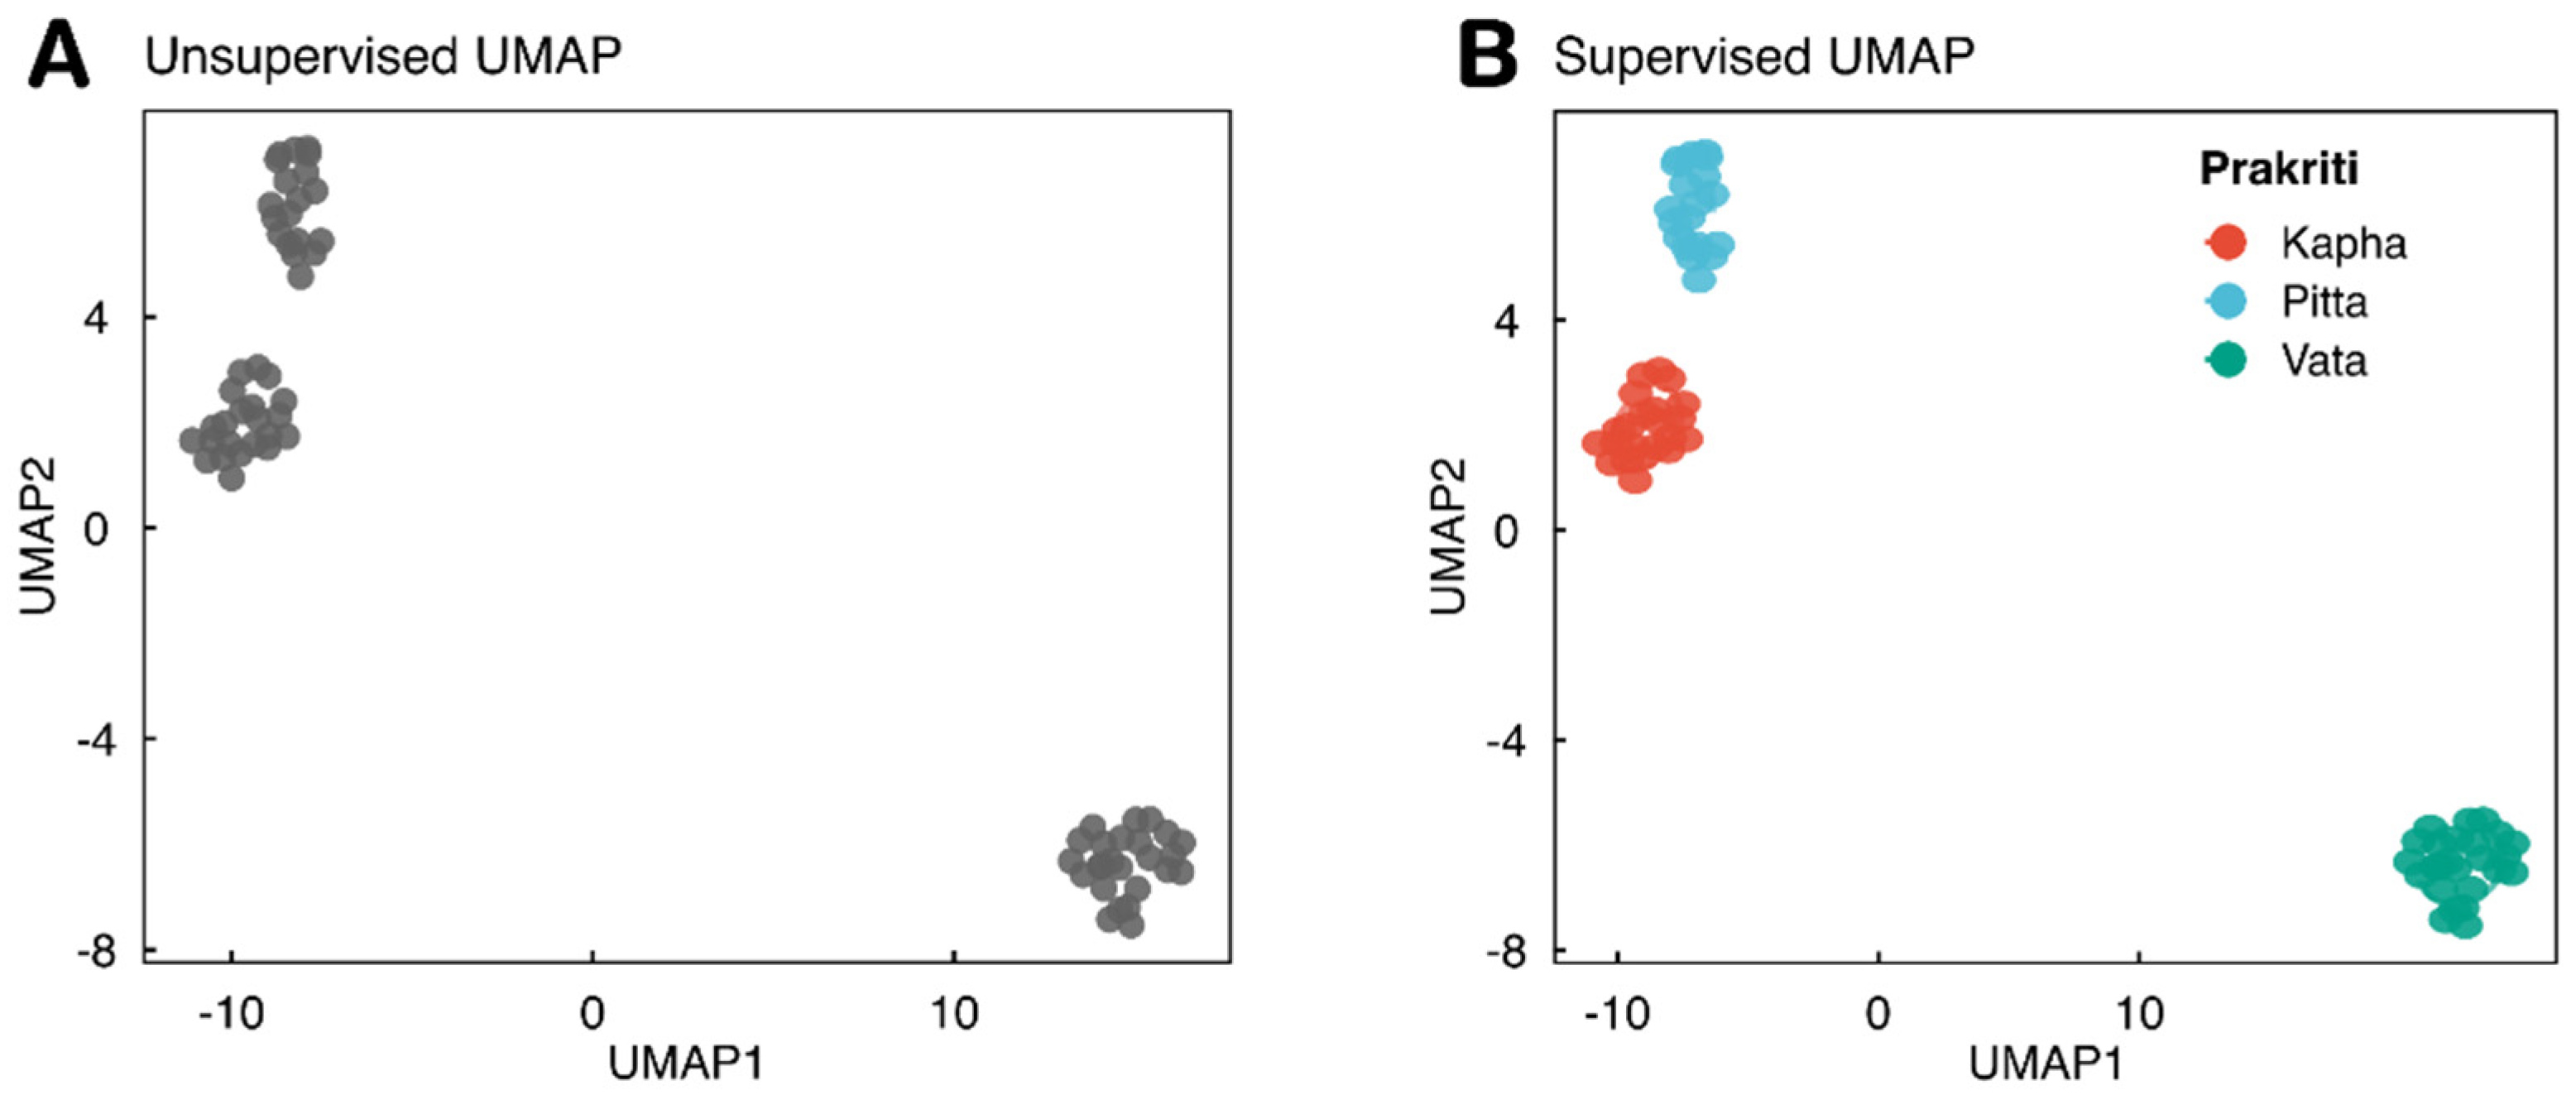
Figure 2.
Weighted Gene Co-expression Network Analysis (WGCNA) identifies Prakriti-associated transcriptomic modules. (A) Hierarchical clustering dendrogram of module eigengenes based on dissimilarity (1 minus Pearson r), illustrating the relatedness of co-expression modules. The dashed red line marks the cut height of 0.25, used to merge highly correlated modules prior to downstream analysis. (B) Scale-free topology model fit (R²) plotted against soft-thresholding power (beta = 1 to 20), used to determine the optimal power parameter for network construction. The curve plateaus at higher power values, confirming adherence to a scale-free topology, a prerequisite for biologically meaningful WGCNA. (C) Gene dendrogram constructed by average linkage hierarchical clustering of genes using the topological overlap matrix (TOM)-based dissimilarity measure. The color bar beneath the dendrogram indicates module assignments, with each color representing a distinct co-expression module identified by dynamic tree cutting. WGCNA, Weighted Gene Co-expression Network Analysis; TOM, Topological Overlap Matrix; ME, Module Eigengene; R², coefficient of determination. (D) Module-trait relationship heatmap displaying Pearson correlation coefficients between module eigengenes (rows) and Ayurvedic Prakriti phenotypes (columns: Vata, Pitta, Kapha, and Sama). Each cell reports the correlation coefficient (upper value) and associated p-value (lower value, in parentheses). Color intensity reflects correlation magnitude, with red indicating positive and green indicating negative associations (scale: +1 to -1). Statistically significant module-trait pairs are highlighted by the intensity of cell color.
Figure 2.
Weighted Gene Co-expression Network Analysis (WGCNA) identifies Prakriti-associated transcriptomic modules. (A) Hierarchical clustering dendrogram of module eigengenes based on dissimilarity (1 minus Pearson r), illustrating the relatedness of co-expression modules. The dashed red line marks the cut height of 0.25, used to merge highly correlated modules prior to downstream analysis. (B) Scale-free topology model fit (R²) plotted against soft-thresholding power (beta = 1 to 20), used to determine the optimal power parameter for network construction. The curve plateaus at higher power values, confirming adherence to a scale-free topology, a prerequisite for biologically meaningful WGCNA. (C) Gene dendrogram constructed by average linkage hierarchical clustering of genes using the topological overlap matrix (TOM)-based dissimilarity measure. The color bar beneath the dendrogram indicates module assignments, with each color representing a distinct co-expression module identified by dynamic tree cutting. WGCNA, Weighted Gene Co-expression Network Analysis; TOM, Topological Overlap Matrix; ME, Module Eigengene; R², coefficient of determination. (D) Module-trait relationship heatmap displaying Pearson correlation coefficients between module eigengenes (rows) and Ayurvedic Prakriti phenotypes (columns: Vata, Pitta, Kapha, and Sama). Each cell reports the correlation coefficient (upper value) and associated p-value (lower value, in parentheses). Color intensity reflects correlation magnitude, with red indicating positive and green indicating negative associations (scale: +1 to -1). Statistically significant module-trait pairs are highlighted by the intensity of cell color.
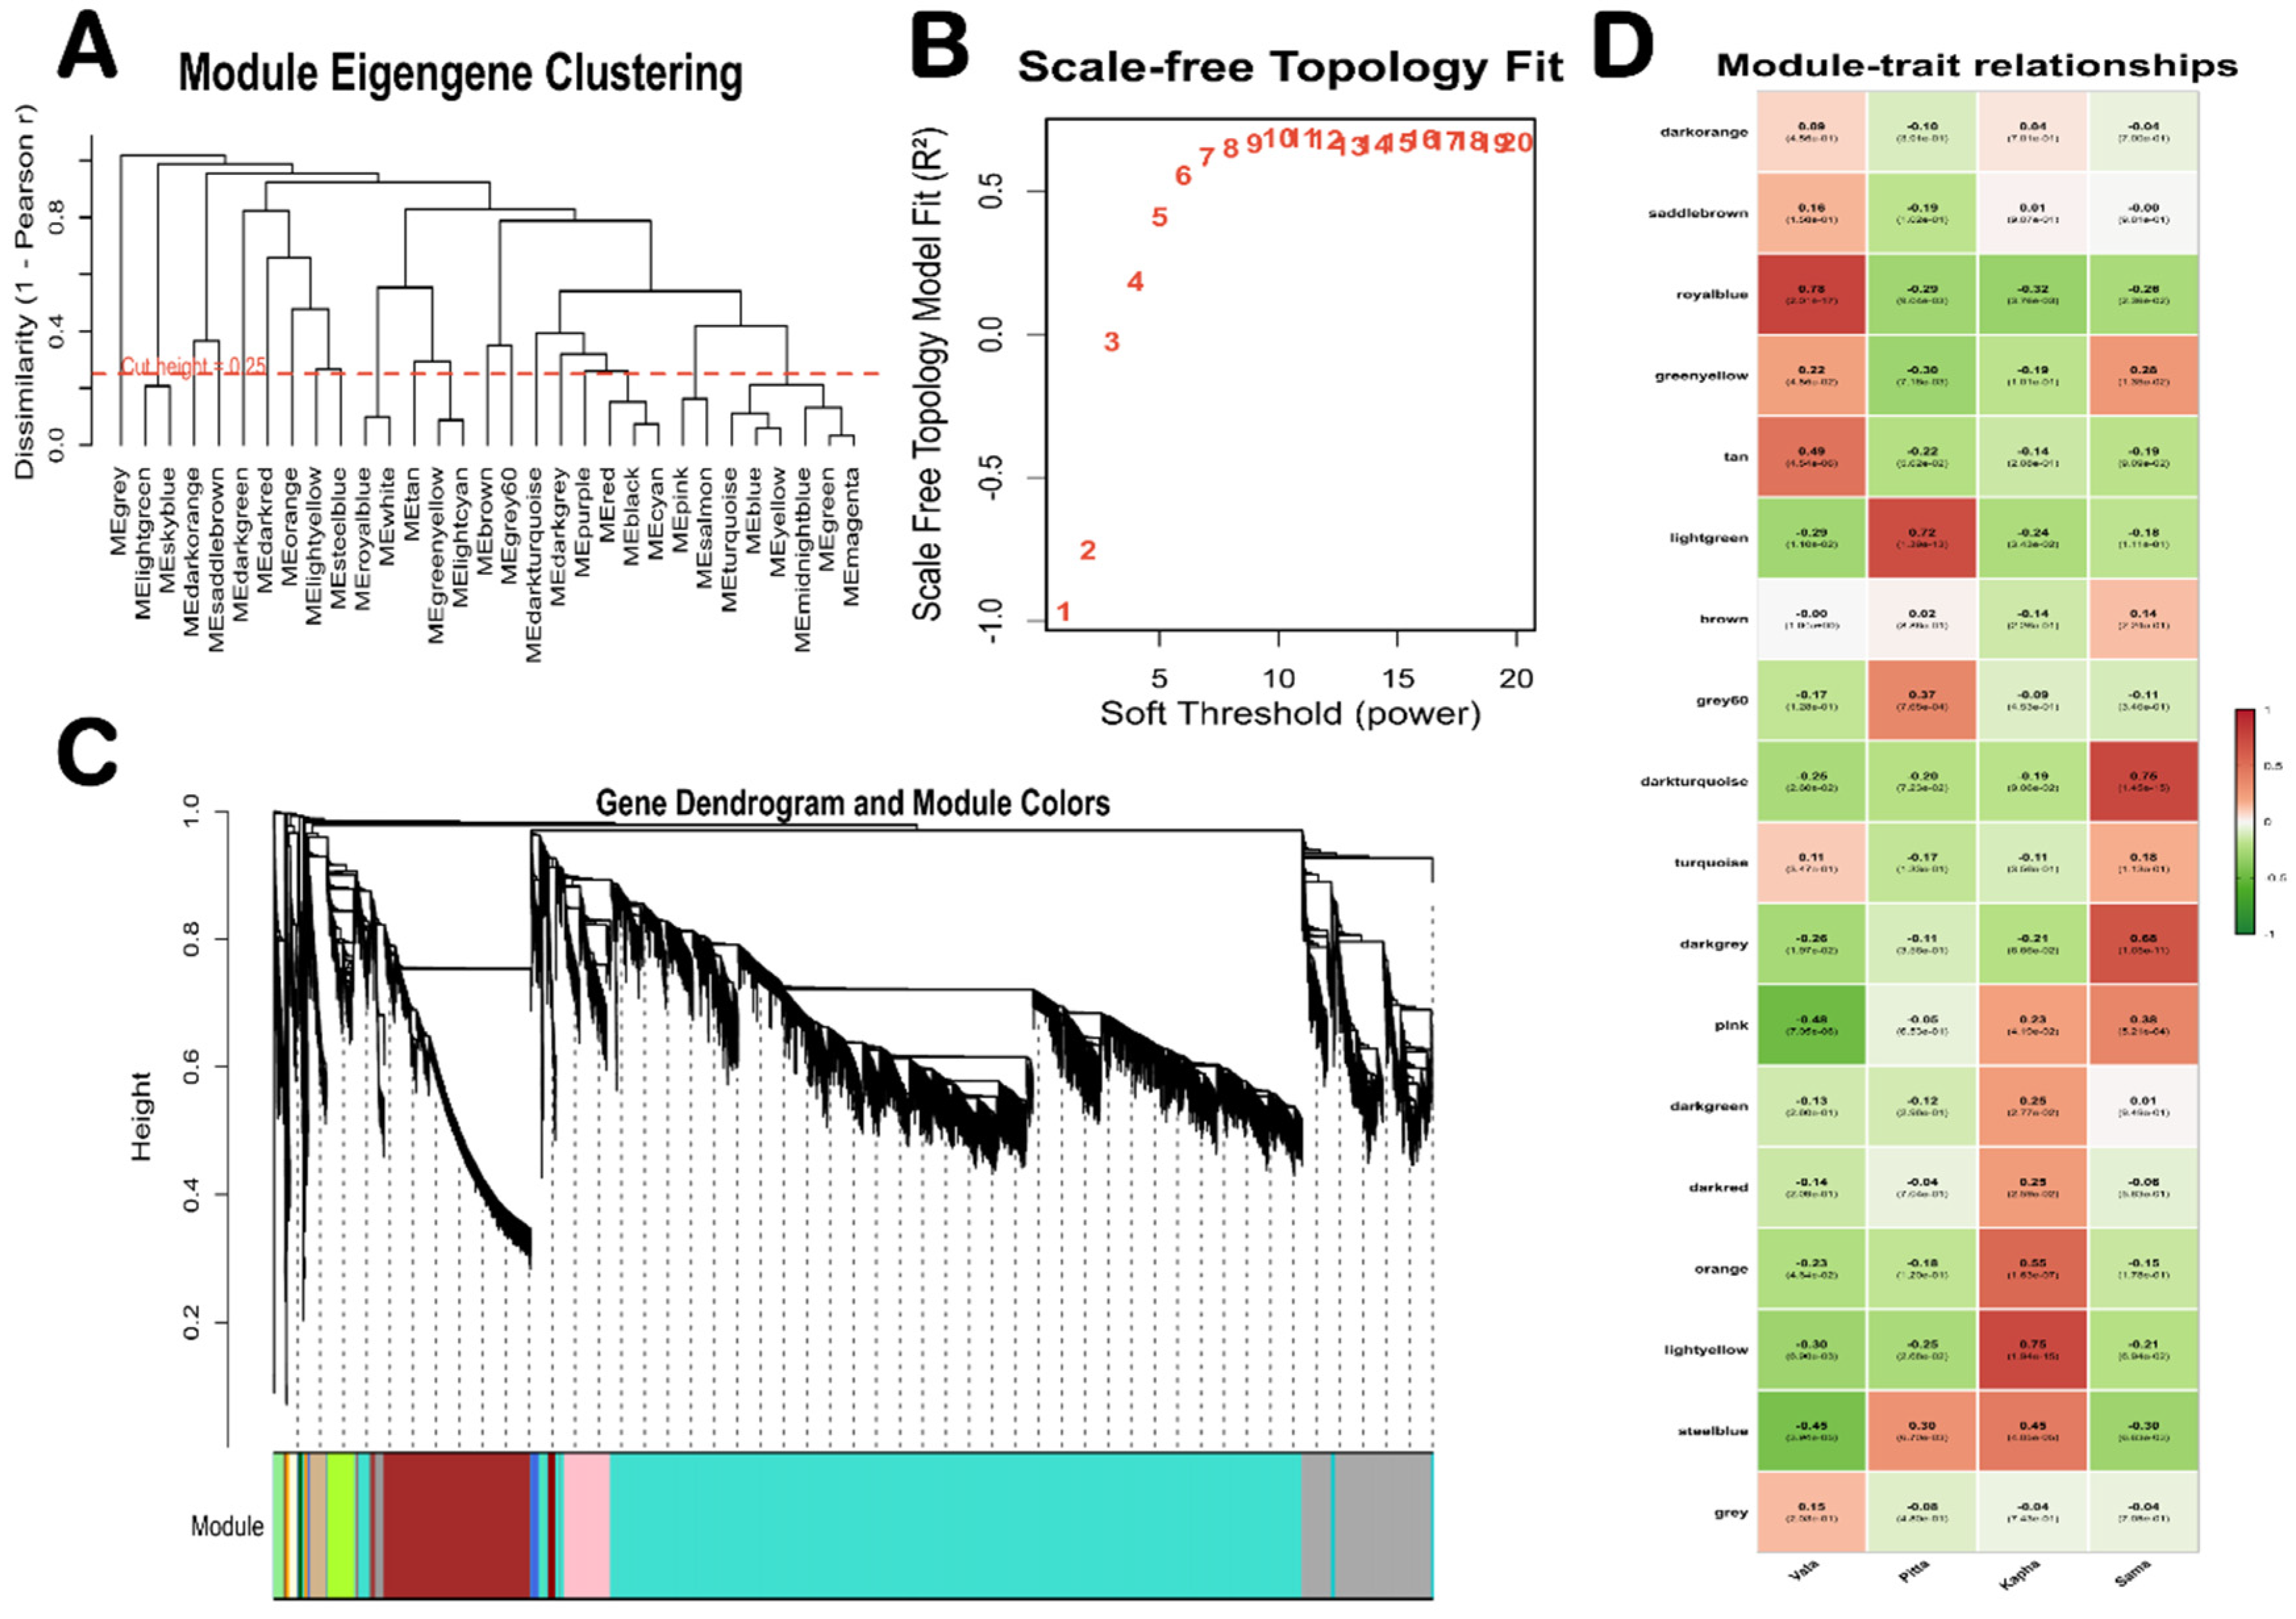
Figure 3.
Gene Ontology over-representation analysis reveals distinct biological processes, molecular functions, and cellular components enriched across Prakriti constitutions. (A, B, C) Dot plots depicting Gene Ontology (GO) over-representation analysis for genes significantly associated with Kapha (A), Pitta (B), and Vata (C) Prakriti types, respectively. Each panel is subdivided into three GO categories: Biological Process (BP), Molecular Function (MF), and Cellular Component (CC). The x-axis represents the Gene Ratio, defined as the proportion of Prakriti-associated genes annotated to each GO term relative to the total number of genes in the reference set. Dot size is proportional to the number of genes contributing to each term (Gene Count), and dot color reflects the adjusted p-value, with red indicating higher statistical significance and blue indicating lower significance.
Figure 3.
Gene Ontology over-representation analysis reveals distinct biological processes, molecular functions, and cellular components enriched across Prakriti constitutions. (A, B, C) Dot plots depicting Gene Ontology (GO) over-representation analysis for genes significantly associated with Kapha (A), Pitta (B), and Vata (C) Prakriti types, respectively. Each panel is subdivided into three GO categories: Biological Process (BP), Molecular Function (MF), and Cellular Component (CC). The x-axis represents the Gene Ratio, defined as the proportion of Prakriti-associated genes annotated to each GO term relative to the total number of genes in the reference set. Dot size is proportional to the number of genes contributing to each term (Gene Count), and dot color reflects the adjusted p-value, with red indicating higher statistical significance and blue indicating lower significance.
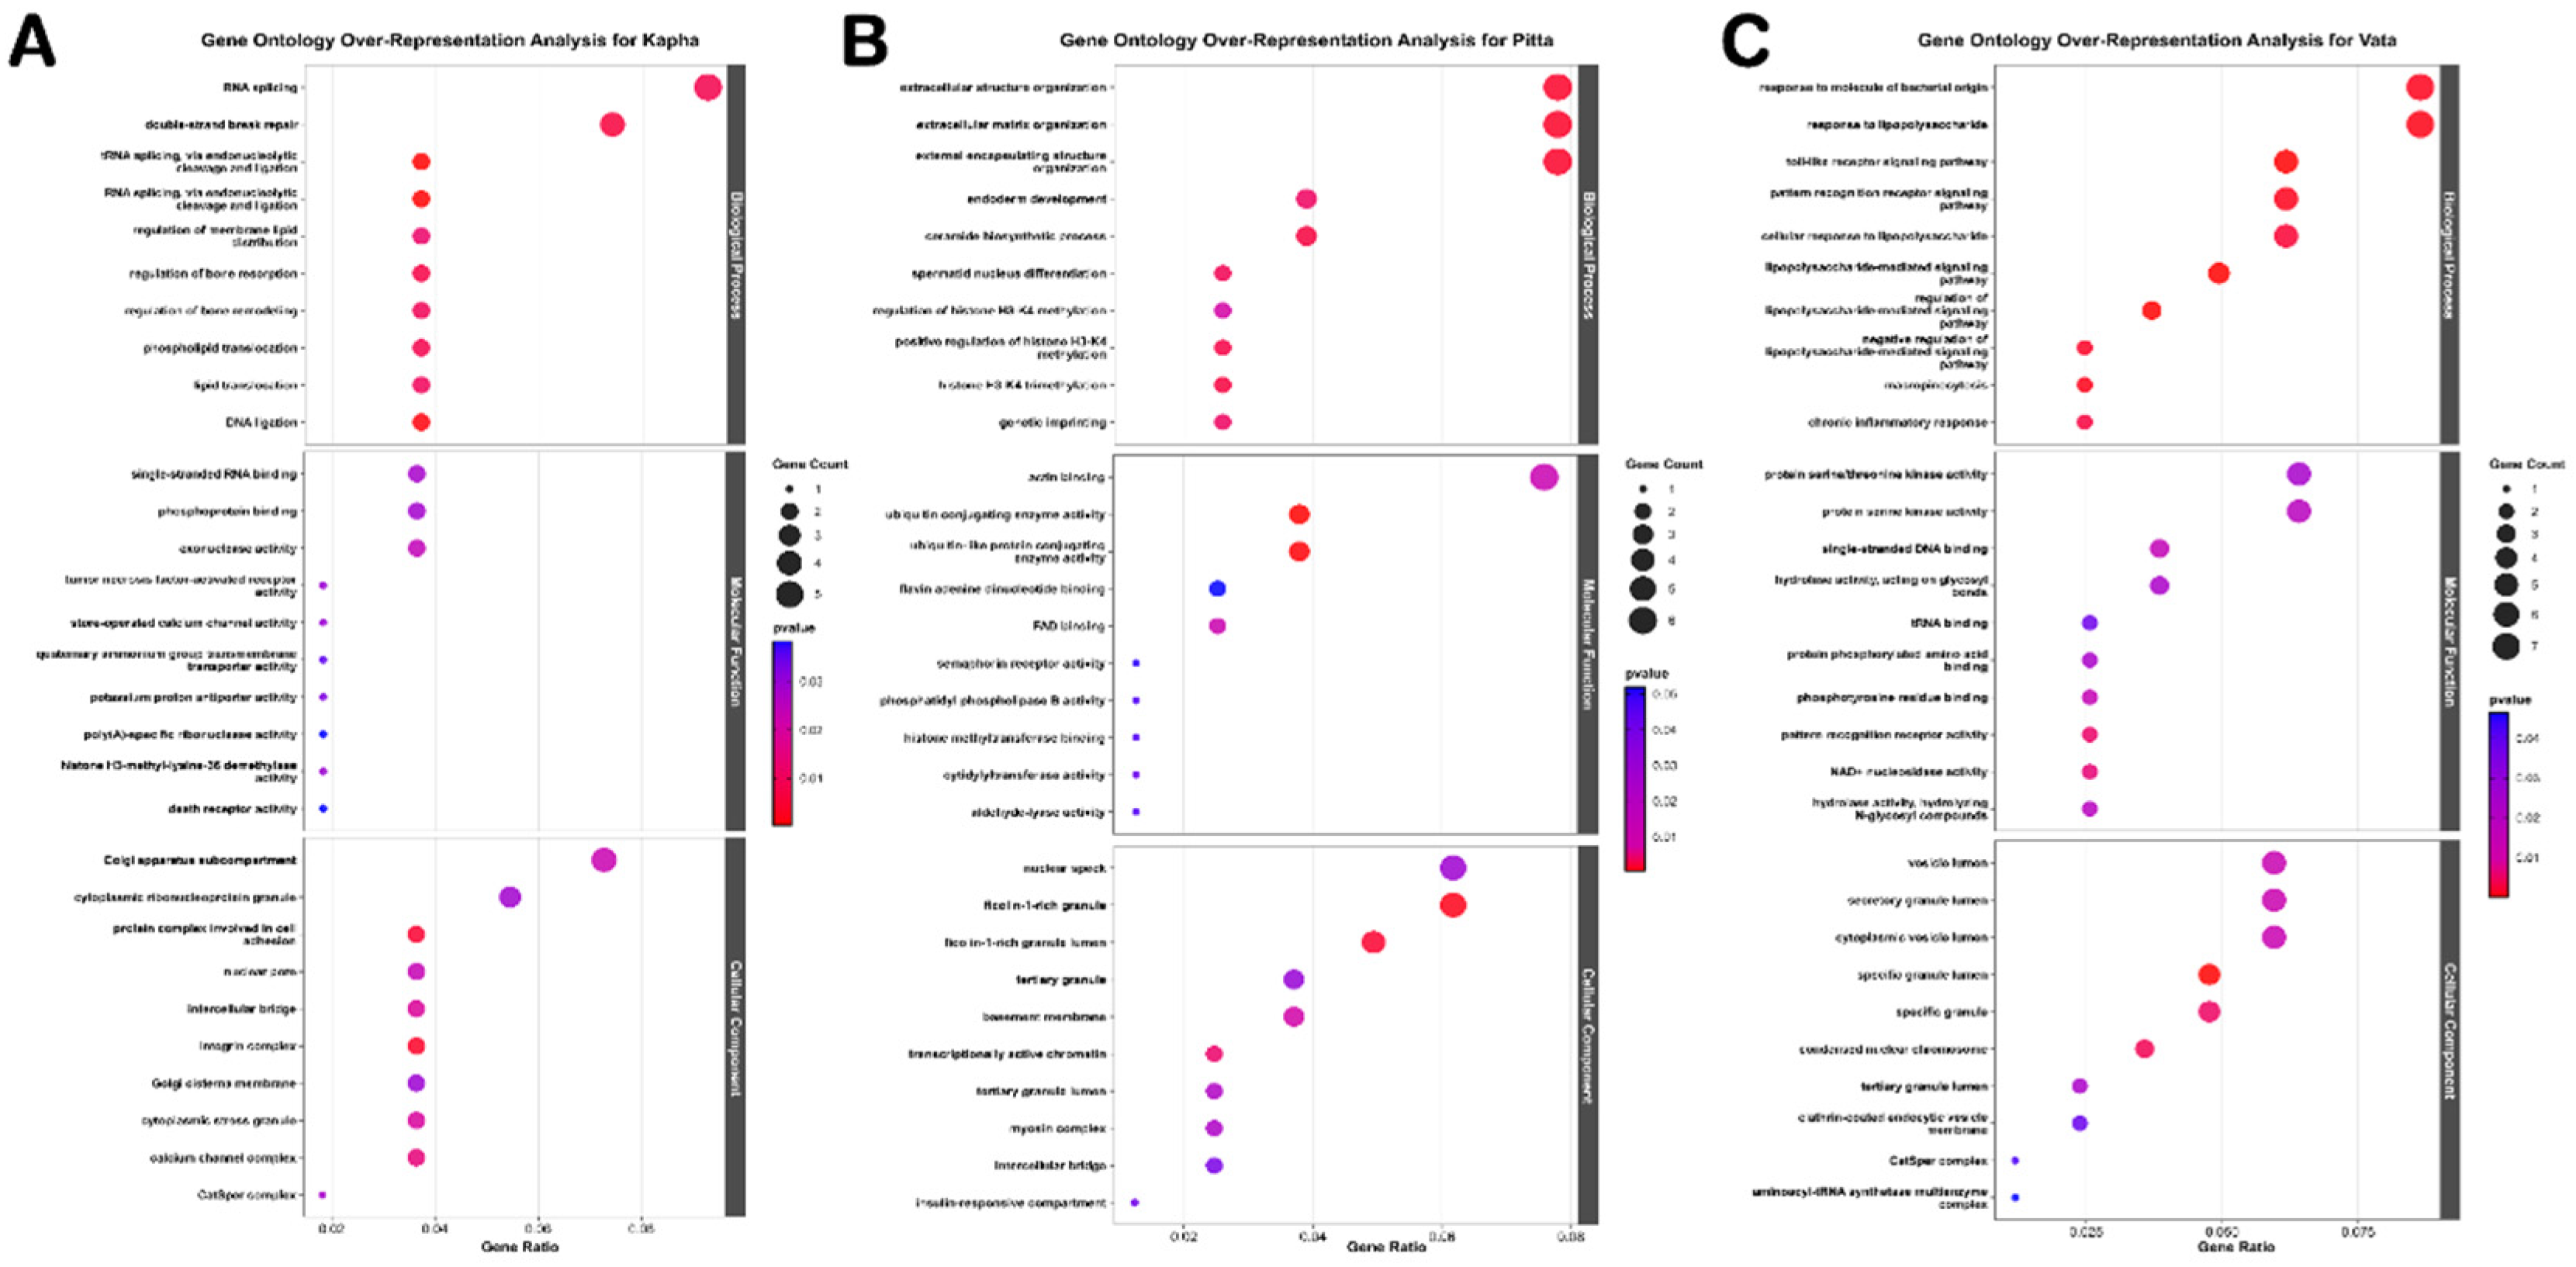
Figure 4.
PROGENy-based pathway activity inference reveals conserved and Prakriti-specific oncogenic and immune signaling landscapes. (A) Bar plots depicting mean pathway activity z-scores derived from PROGENy analysis for 14 canonical signaling pathways across Kapha, Vata, and Pitta Prakriti types (left to right). Red bars denote statistically significant pathway activation and blue bars denote suppression relative to a null distribution (one-sample t-test vs. 0, Benjamini-Hochberg adjusted; p < 0.05, p < 0.01, p < 0.001). (B) Heatmap of per-sample PROGENy pathway activity z-scores across all subjects, grouped by Prakriti class (Pitta: orange; Vata: pink/red; Kapha: green) with hierarchical biclustering applied to both samples (columns) and pathways (rows). Color scale represents z-score intensity (range: -5 to +15), with warm colors indicating higher pathway activity. The heatmap corroborates the bar plot findings and further reveals inter-individual variability within each Prakriti group.
Figure 4.
PROGENy-based pathway activity inference reveals conserved and Prakriti-specific oncogenic and immune signaling landscapes. (A) Bar plots depicting mean pathway activity z-scores derived from PROGENy analysis for 14 canonical signaling pathways across Kapha, Vata, and Pitta Prakriti types (left to right). Red bars denote statistically significant pathway activation and blue bars denote suppression relative to a null distribution (one-sample t-test vs. 0, Benjamini-Hochberg adjusted; p < 0.05, p < 0.01, p < 0.001). (B) Heatmap of per-sample PROGENy pathway activity z-scores across all subjects, grouped by Prakriti class (Pitta: orange; Vata: pink/red; Kapha: green) with hierarchical biclustering applied to both samples (columns) and pathways (rows). Color scale represents z-score intensity (range: -5 to +15), with warm colors indicating higher pathway activity. The heatmap corroborates the bar plot findings and further reveals inter-individual variability within each Prakriti group.
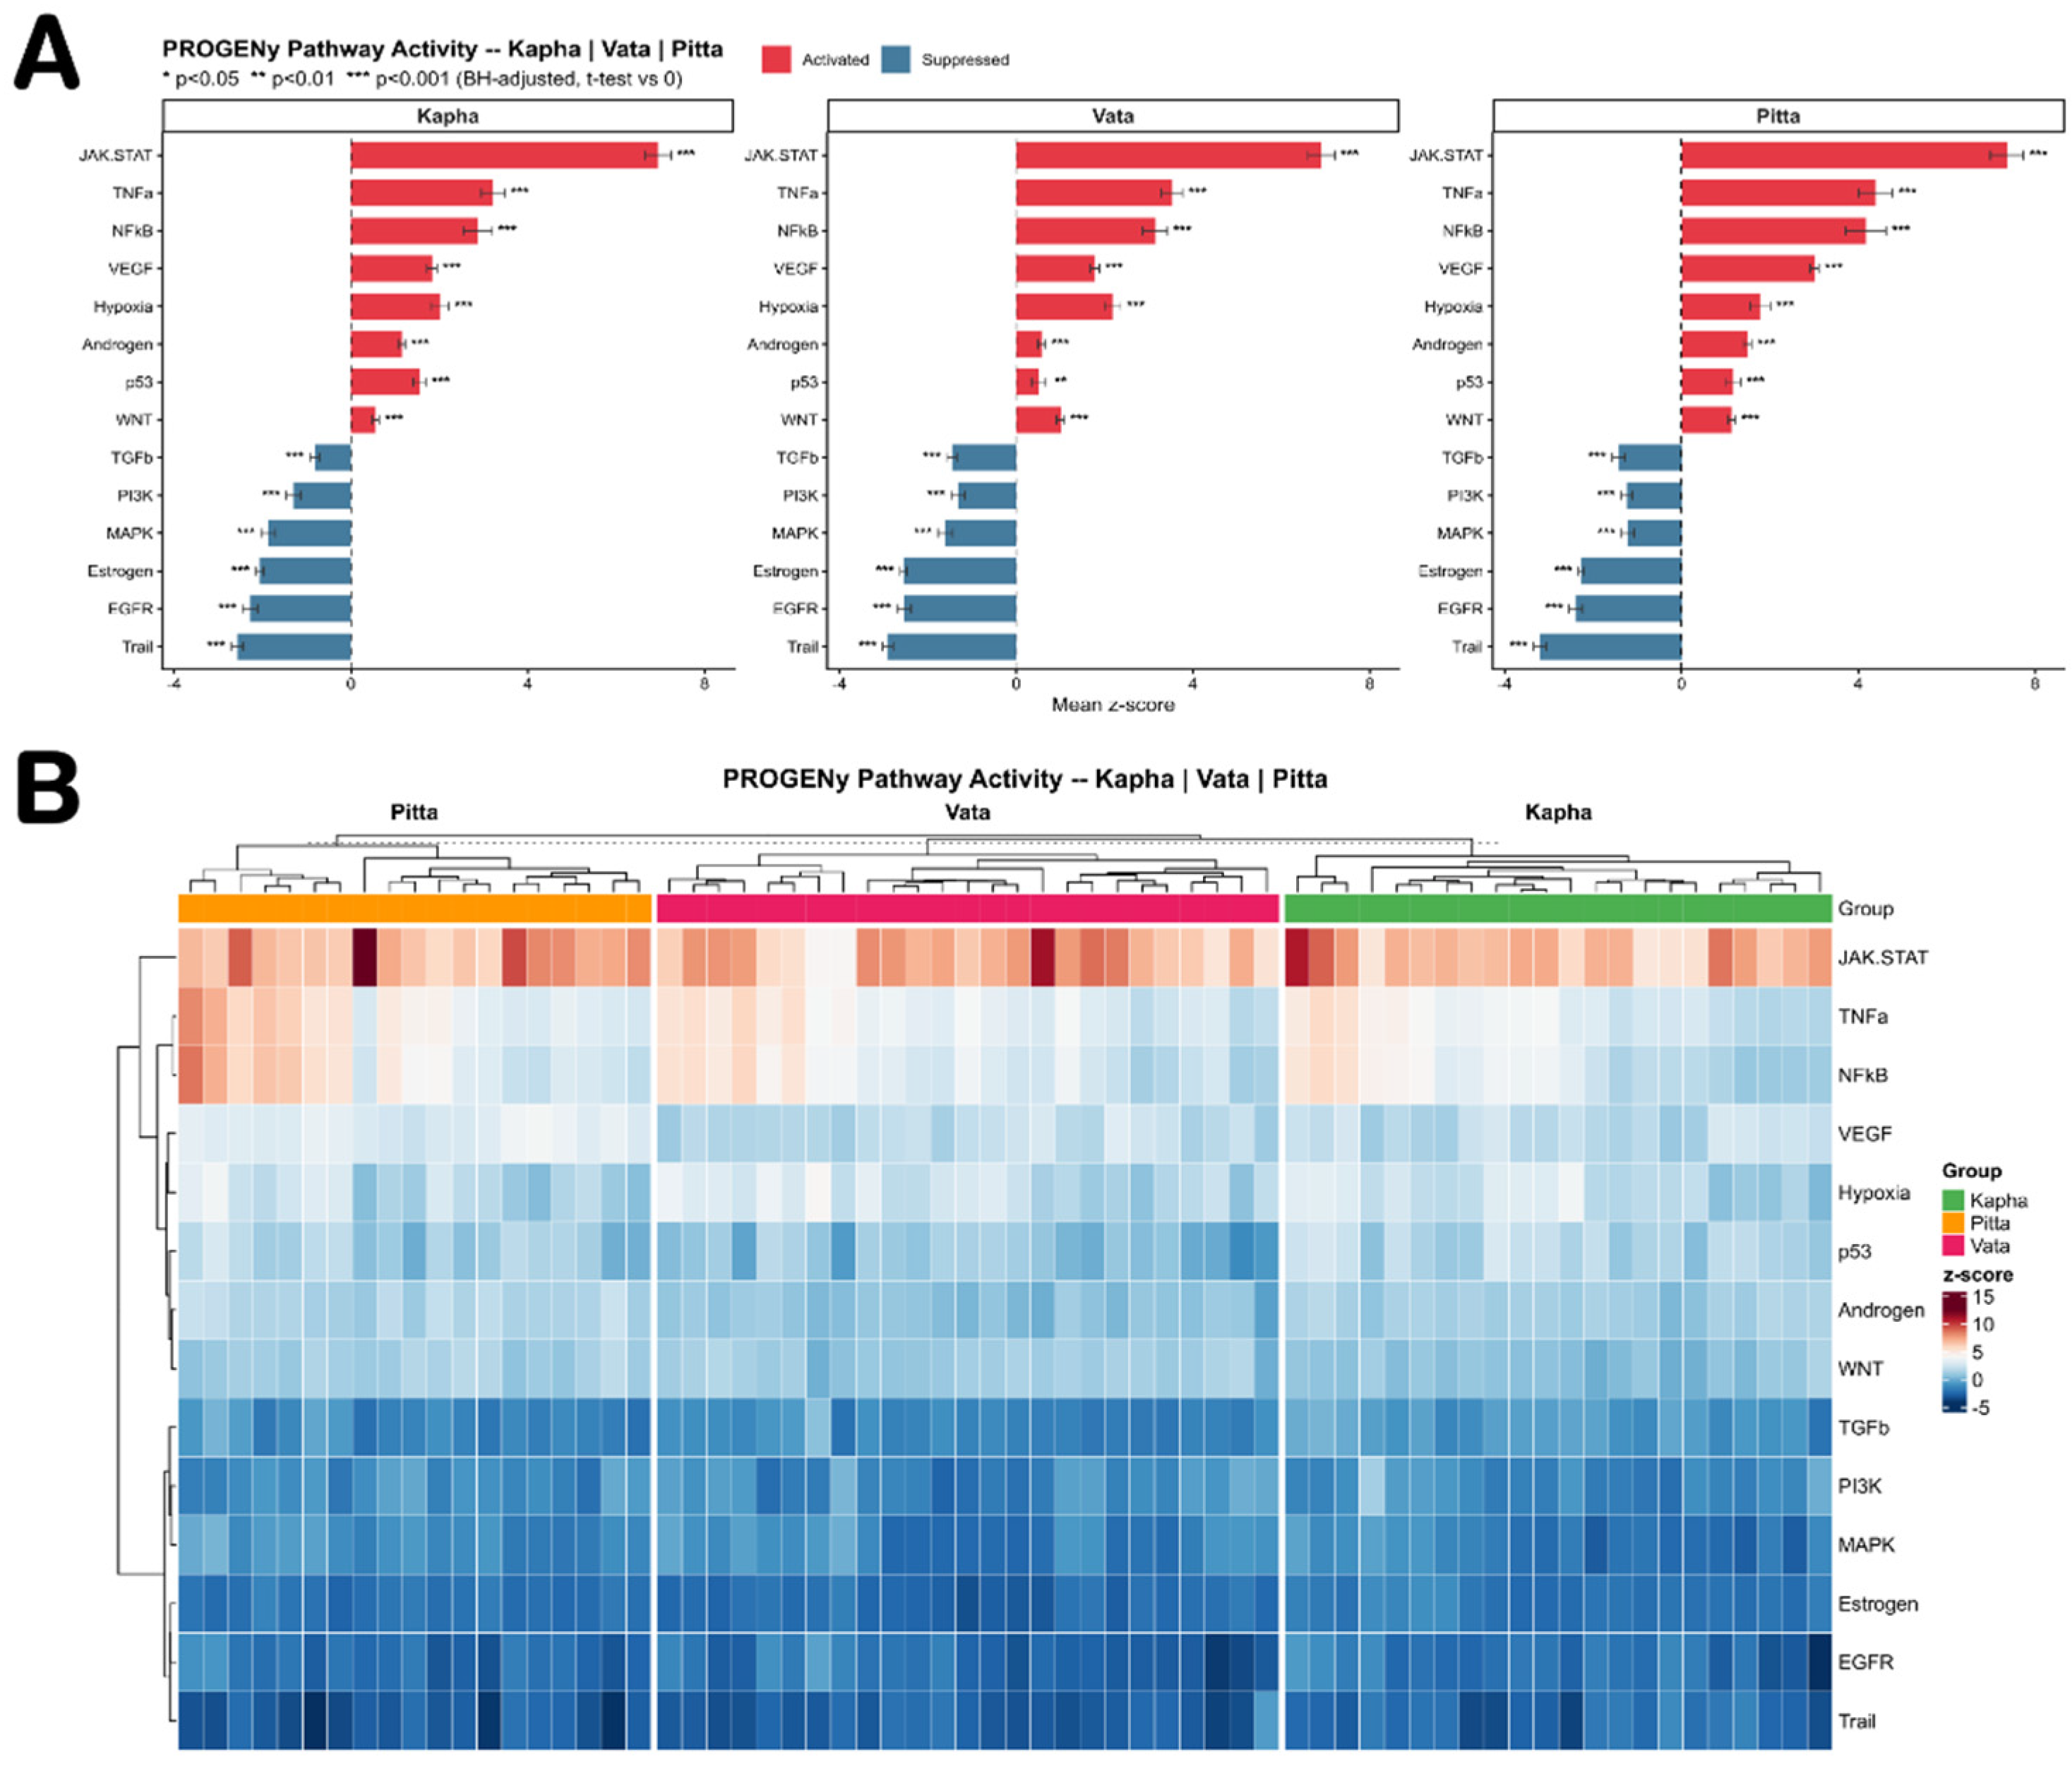
Figure 5.
Transcription factor activity inference identifies Prakriti-specific regulatory programs governing differential gene expression. (A) Heatmap displaying the top 30 differentially active transcription factors (TFs) inferred using VIPER across all subjects, grouped by Prakriti class (Vata: blue; Pitta: orange; Kapha: green). TF activity scores (z-score normalized) are shown in a red-blue color scale, with red indicating higher and blue indicating lower activity. (B) Bubble plot depicting differential TF activity across Prakriti groups. The x-axis represents the effect size (activity range across groups) and the y-axis represents statistical significance (negative log10 of BH-adjusted FDR). Dot color indicates the dominant Prakriti group (Kapha: green; Pitta: orange; Vata: blue) in which each TF is most active, and dot size encodes the absolute log10-transformed contrast ratio. (C) Box plots comparing per-sample TF activity scores for the six top-ranked differentially active TFs (TP63, NFIC, NFC1, DUX4, HNF1B, YY1, and PPARA) stratified by Prakriti class. Statistical comparisons between groups were performed using pairwise Wilcoxon tests with BH correction ( p < 0.05, p < 0.01, p < 0.001).
Figure 5.
Transcription factor activity inference identifies Prakriti-specific regulatory programs governing differential gene expression. (A) Heatmap displaying the top 30 differentially active transcription factors (TFs) inferred using VIPER across all subjects, grouped by Prakriti class (Vata: blue; Pitta: orange; Kapha: green). TF activity scores (z-score normalized) are shown in a red-blue color scale, with red indicating higher and blue indicating lower activity. (B) Bubble plot depicting differential TF activity across Prakriti groups. The x-axis represents the effect size (activity range across groups) and the y-axis represents statistical significance (negative log10 of BH-adjusted FDR). Dot color indicates the dominant Prakriti group (Kapha: green; Pitta: orange; Vata: blue) in which each TF is most active, and dot size encodes the absolute log10-transformed contrast ratio. (C) Box plots comparing per-sample TF activity scores for the six top-ranked differentially active TFs (TP63, NFIC, NFC1, DUX4, HNF1B, YY1, and PPARA) stratified by Prakriti class. Statistical comparisons between groups were performed using pairwise Wilcoxon tests with BH correction ( p < 0.05, p < 0.01, p < 0.001).
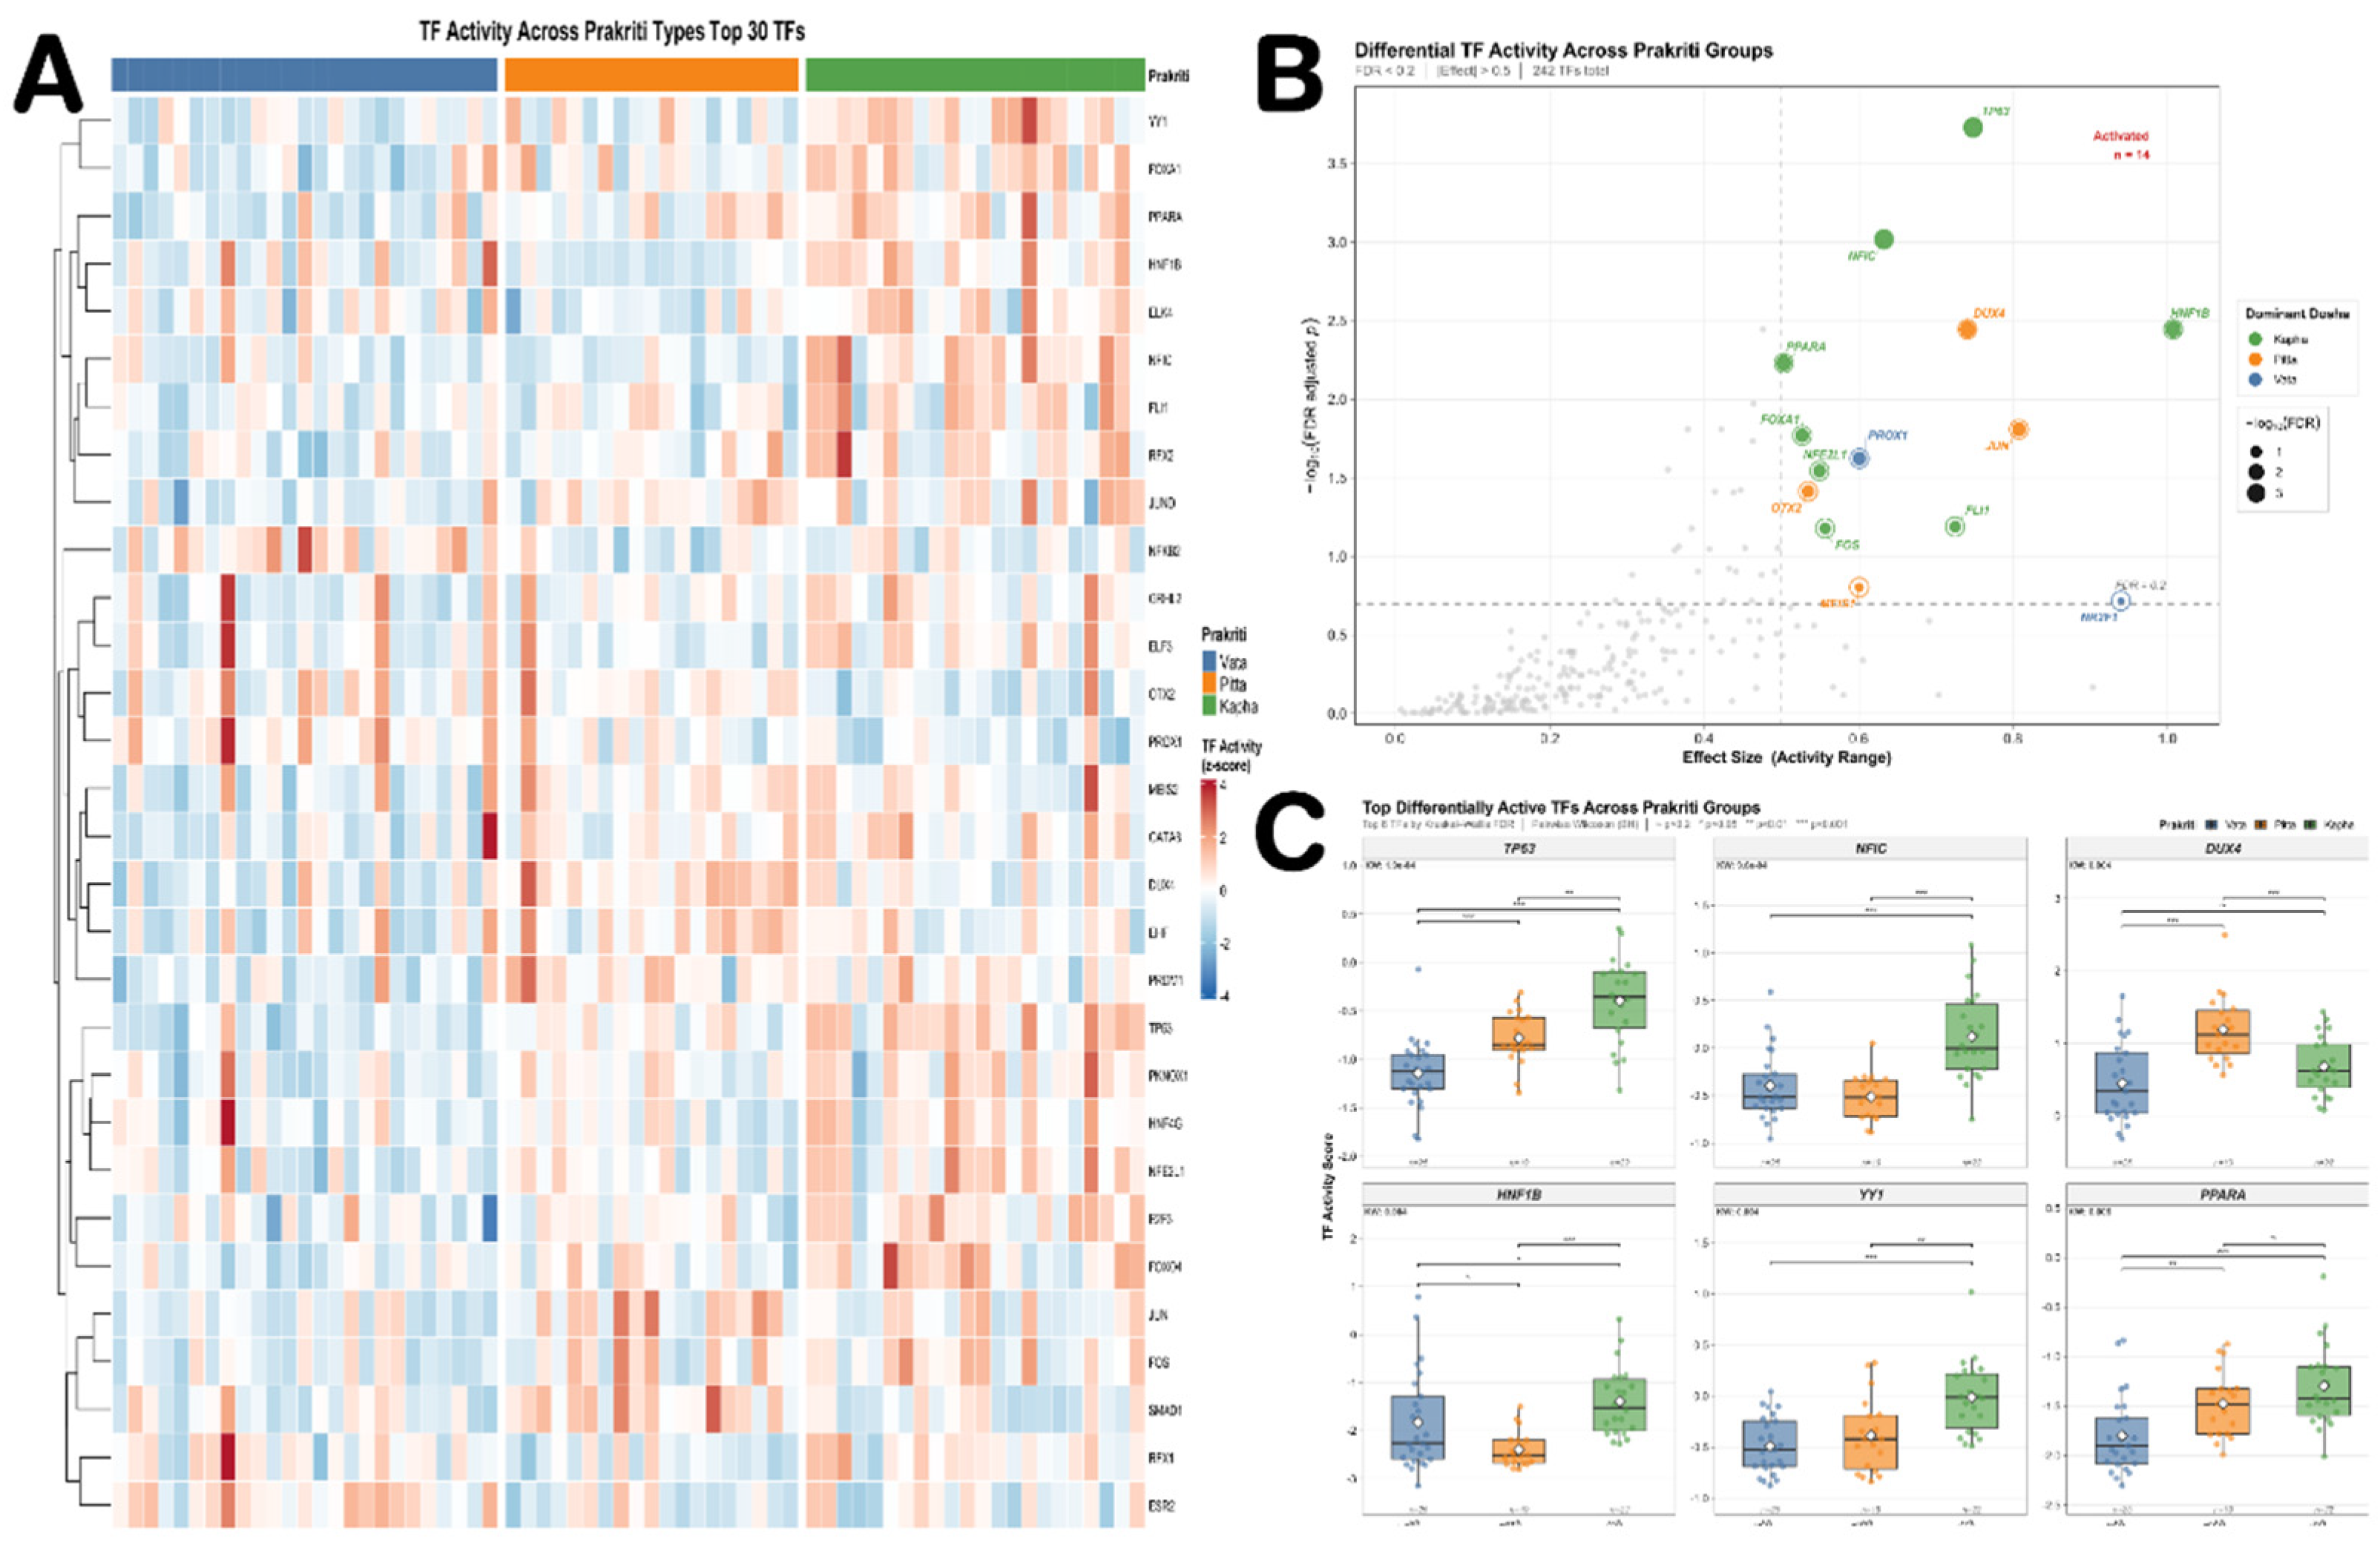
Figure 6.
Gene Set Variation Analysis uncovers Prakriti-concordant metabolic, Hallmark, and KEGG pathway enrichment signatures. (A) Heatmap of GSVA enrichment scores for curated metabolic gene sets across all subjects, grouped by Prakriti class (Vata: blue; Pitta: orange; Kapha: green). Each row represents a distinct metabolic pathway, and each column represents an individual subject. GSVA scores (z-score normalized, range: -2 to +2) are displayed on a red-blue diverging scale, with red indicating positive enrichment and blue indicating suppression. (B) Heatmap of GSVA enrichment scores for the top 10 most variable MSigDB Hallmark gene sets across Prakriti groups. Subjects are grouped by Prakriti class (Kapha, Pitta, Vata), and hierarchical clustering is applied to pathways. (C) Heatmap of GSVA enrichment scores for the top 10 most variable KEGG pathways, grouped and clustered analogously to panel B.
Figure 6.
Gene Set Variation Analysis uncovers Prakriti-concordant metabolic, Hallmark, and KEGG pathway enrichment signatures. (A) Heatmap of GSVA enrichment scores for curated metabolic gene sets across all subjects, grouped by Prakriti class (Vata: blue; Pitta: orange; Kapha: green). Each row represents a distinct metabolic pathway, and each column represents an individual subject. GSVA scores (z-score normalized, range: -2 to +2) are displayed on a red-blue diverging scale, with red indicating positive enrichment and blue indicating suppression. (B) Heatmap of GSVA enrichment scores for the top 10 most variable MSigDB Hallmark gene sets across Prakriti groups. Subjects are grouped by Prakriti class (Kapha, Pitta, Vata), and hierarchical clustering is applied to pathways. (C) Heatmap of GSVA enrichment scores for the top 10 most variable KEGG pathways, grouped and clustered analogously to panel B.
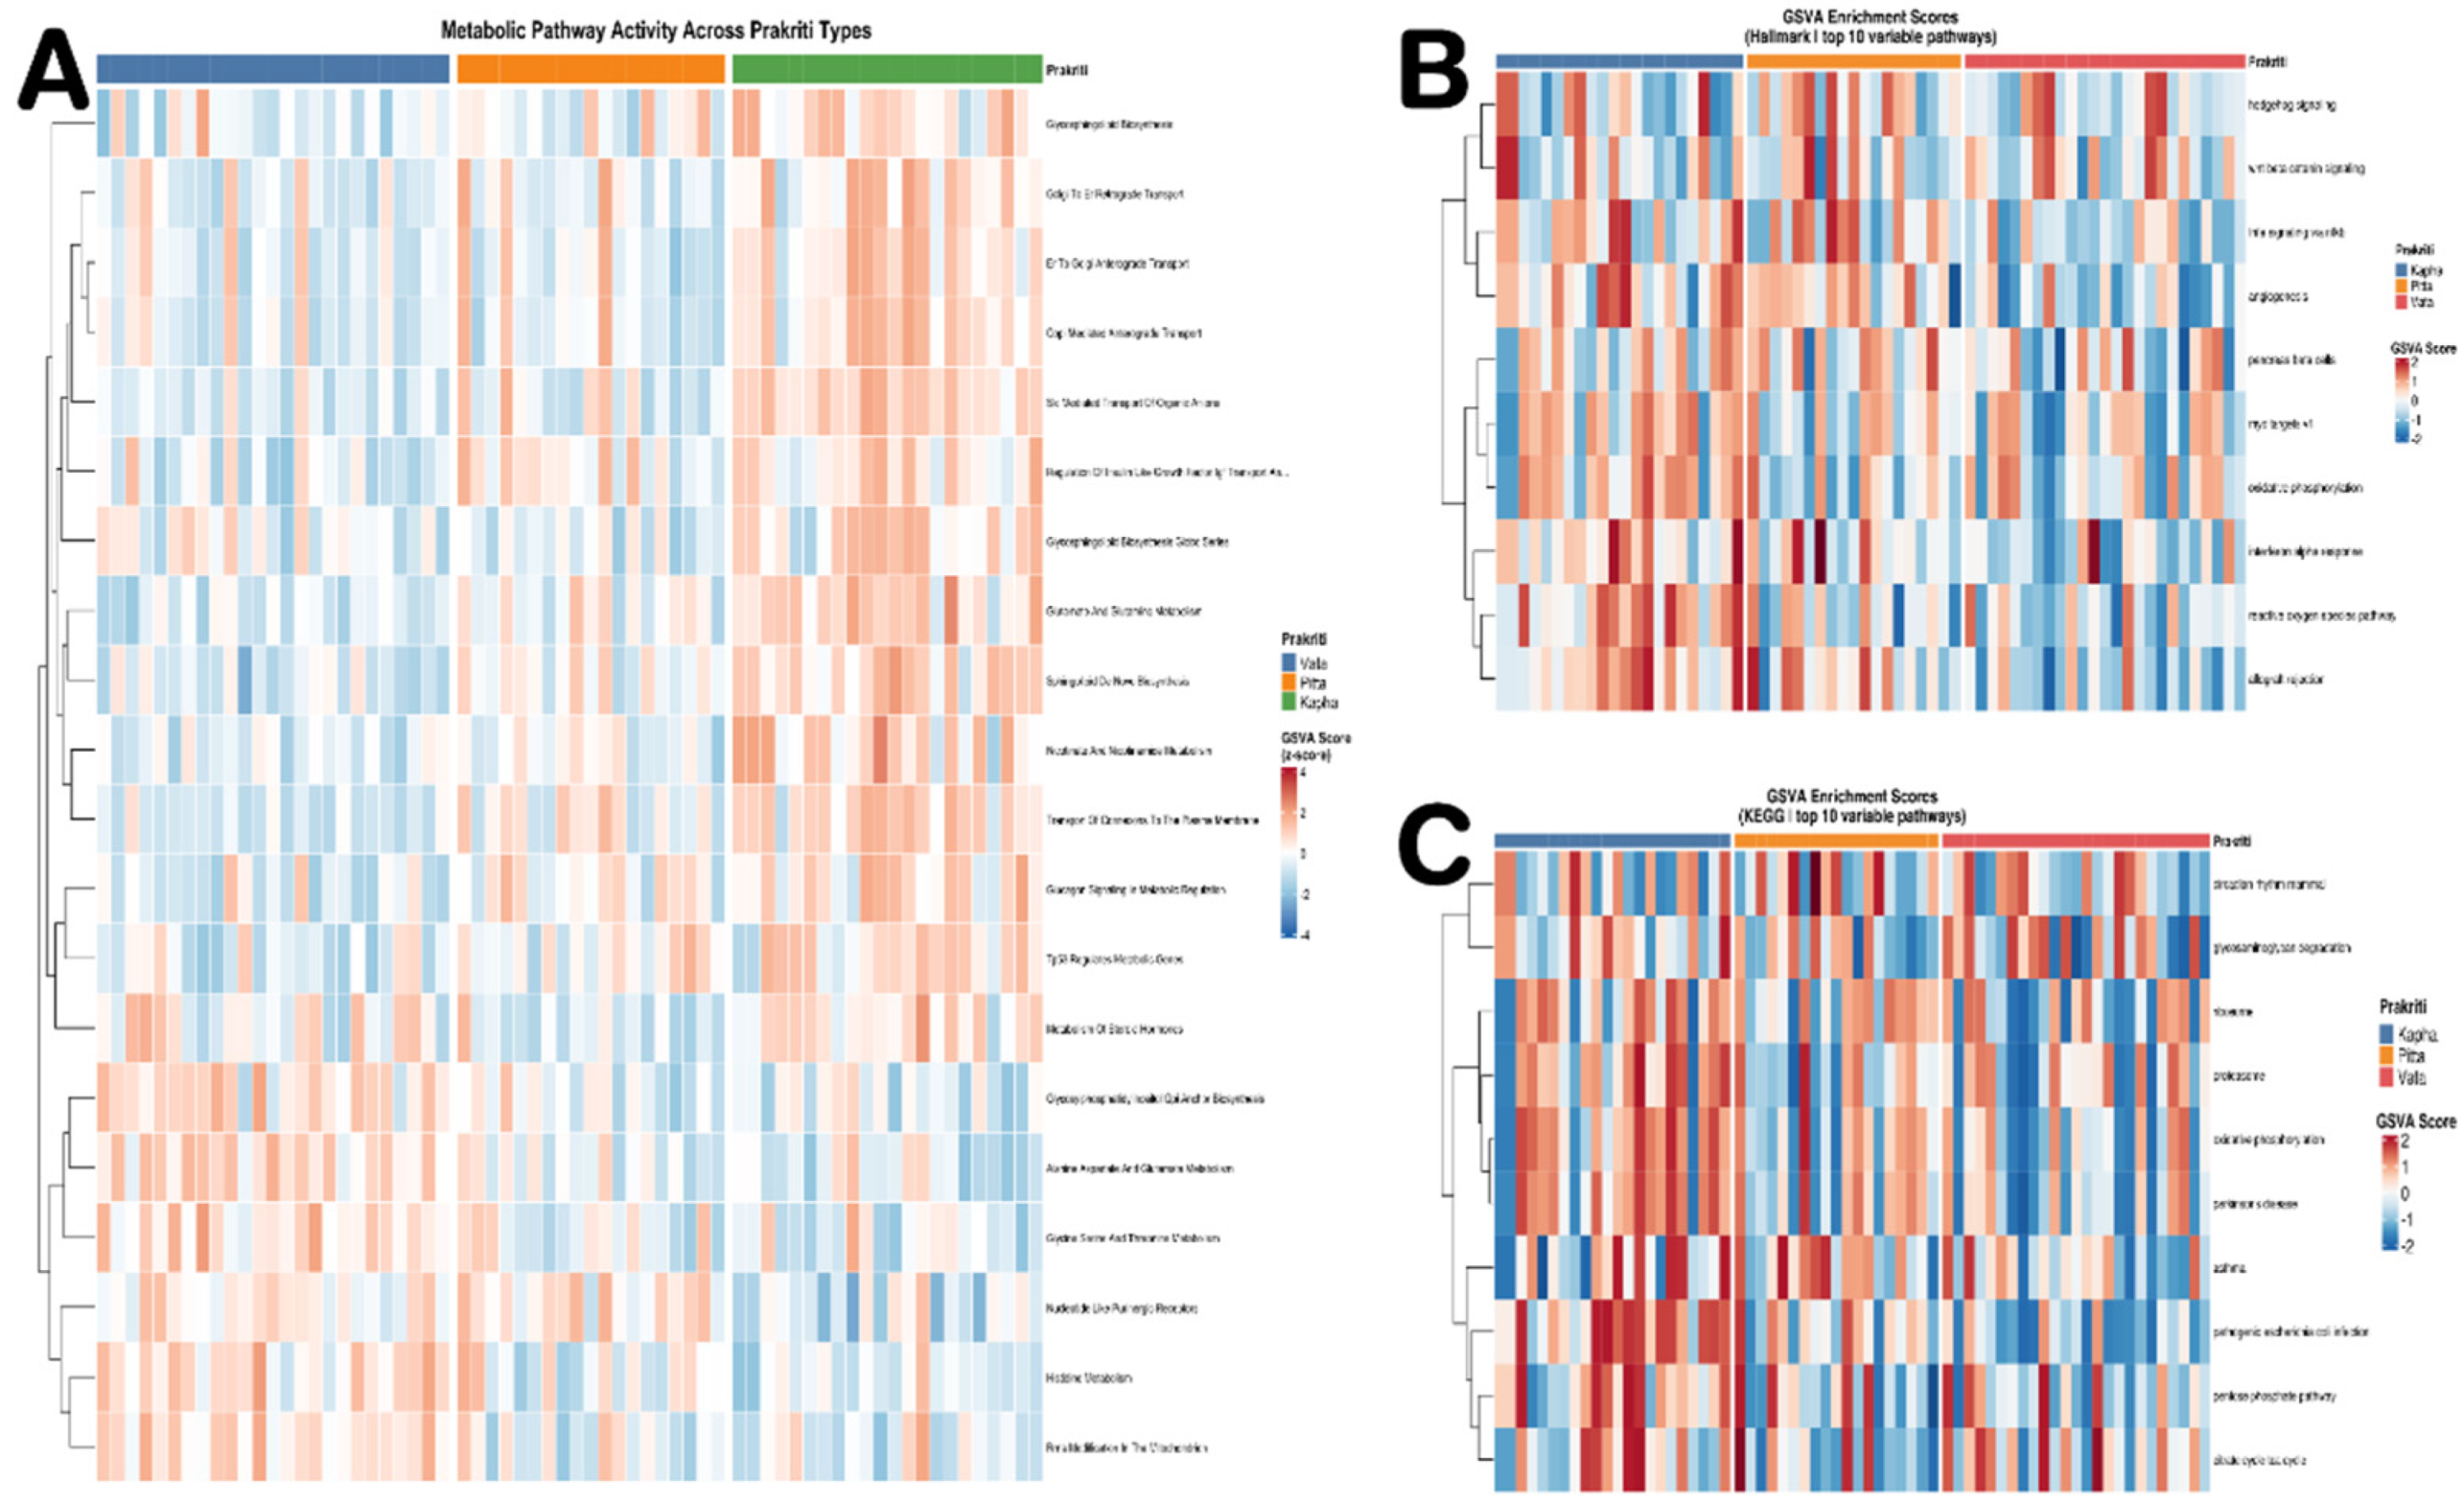
Figure 7.
Immune cell deconvolution reveals Prakriti-associated variation in immune landscape composition, intercellular interactions, and functional states. (A) Stacked bar plots depicting the relative proportion of 35 immune cell types estimated by xCell deconvolution for each subject, grouped by Prakriti class (Kapha, Pitta, Vata). Each color represents a distinct immune cell type as annotated in the legend. (B) Box plots comparing xCell enrichment scores for immune cell types that passed significance thresholds (FDR-adjusted median p-value filter), stratified by Prakriti class (Kapha: green; Pitta: red; Vata: blue). Statistical significance annotations above each cell type denote pairwise group comparisons ( p < 0.05, p < 0.01, p < 0.001, p < 0.0001). (C) Heatmap of relative immune cell fractions estimated by CIBERSORTx deconvolution across all subjects, grouped by Prakriti class (Kapha, Pitta, Vata). Each row represents a distinct immune cell type and color intensity reflects the estimated cell fraction, with hierarchical clustering applied to cell type rows. (D) Heatmap of absolute xCell enrichment scores for all deconvolved immune cell types across subjects grouped by Prakriti class, using a white-to-blue color scale. (E) Comprehensive ssGSEA-based immune category heatmap grouping immune features into functional categories including Antigen Presentation, APCs, B cells, Checkpoints, Chemokines, Co-stimulation, Cytotoxicity, DCs, Interferon, Inflammation, Macrophages, Mast cells, Myeloid, NK cells, T cells, and Treg, across subjects stratified by Prakriti class.
Figure 7.
Immune cell deconvolution reveals Prakriti-associated variation in immune landscape composition, intercellular interactions, and functional states. (A) Stacked bar plots depicting the relative proportion of 35 immune cell types estimated by xCell deconvolution for each subject, grouped by Prakriti class (Kapha, Pitta, Vata). Each color represents a distinct immune cell type as annotated in the legend. (B) Box plots comparing xCell enrichment scores for immune cell types that passed significance thresholds (FDR-adjusted median p-value filter), stratified by Prakriti class (Kapha: green; Pitta: red; Vata: blue). Statistical significance annotations above each cell type denote pairwise group comparisons ( p < 0.05, p < 0.01, p < 0.001, p < 0.0001). (C) Heatmap of relative immune cell fractions estimated by CIBERSORTx deconvolution across all subjects, grouped by Prakriti class (Kapha, Pitta, Vata). Each row represents a distinct immune cell type and color intensity reflects the estimated cell fraction, with hierarchical clustering applied to cell type rows. (D) Heatmap of absolute xCell enrichment scores for all deconvolved immune cell types across subjects grouped by Prakriti class, using a white-to-blue color scale. (E) Comprehensive ssGSEA-based immune category heatmap grouping immune features into functional categories including Antigen Presentation, APCs, B cells, Checkpoints, Chemokines, Co-stimulation, Cytotoxicity, DCs, Interferon, Inflammation, Macrophages, Mast cells, Myeloid, NK cells, T cells, and Treg, across subjects stratified by Prakriti class.
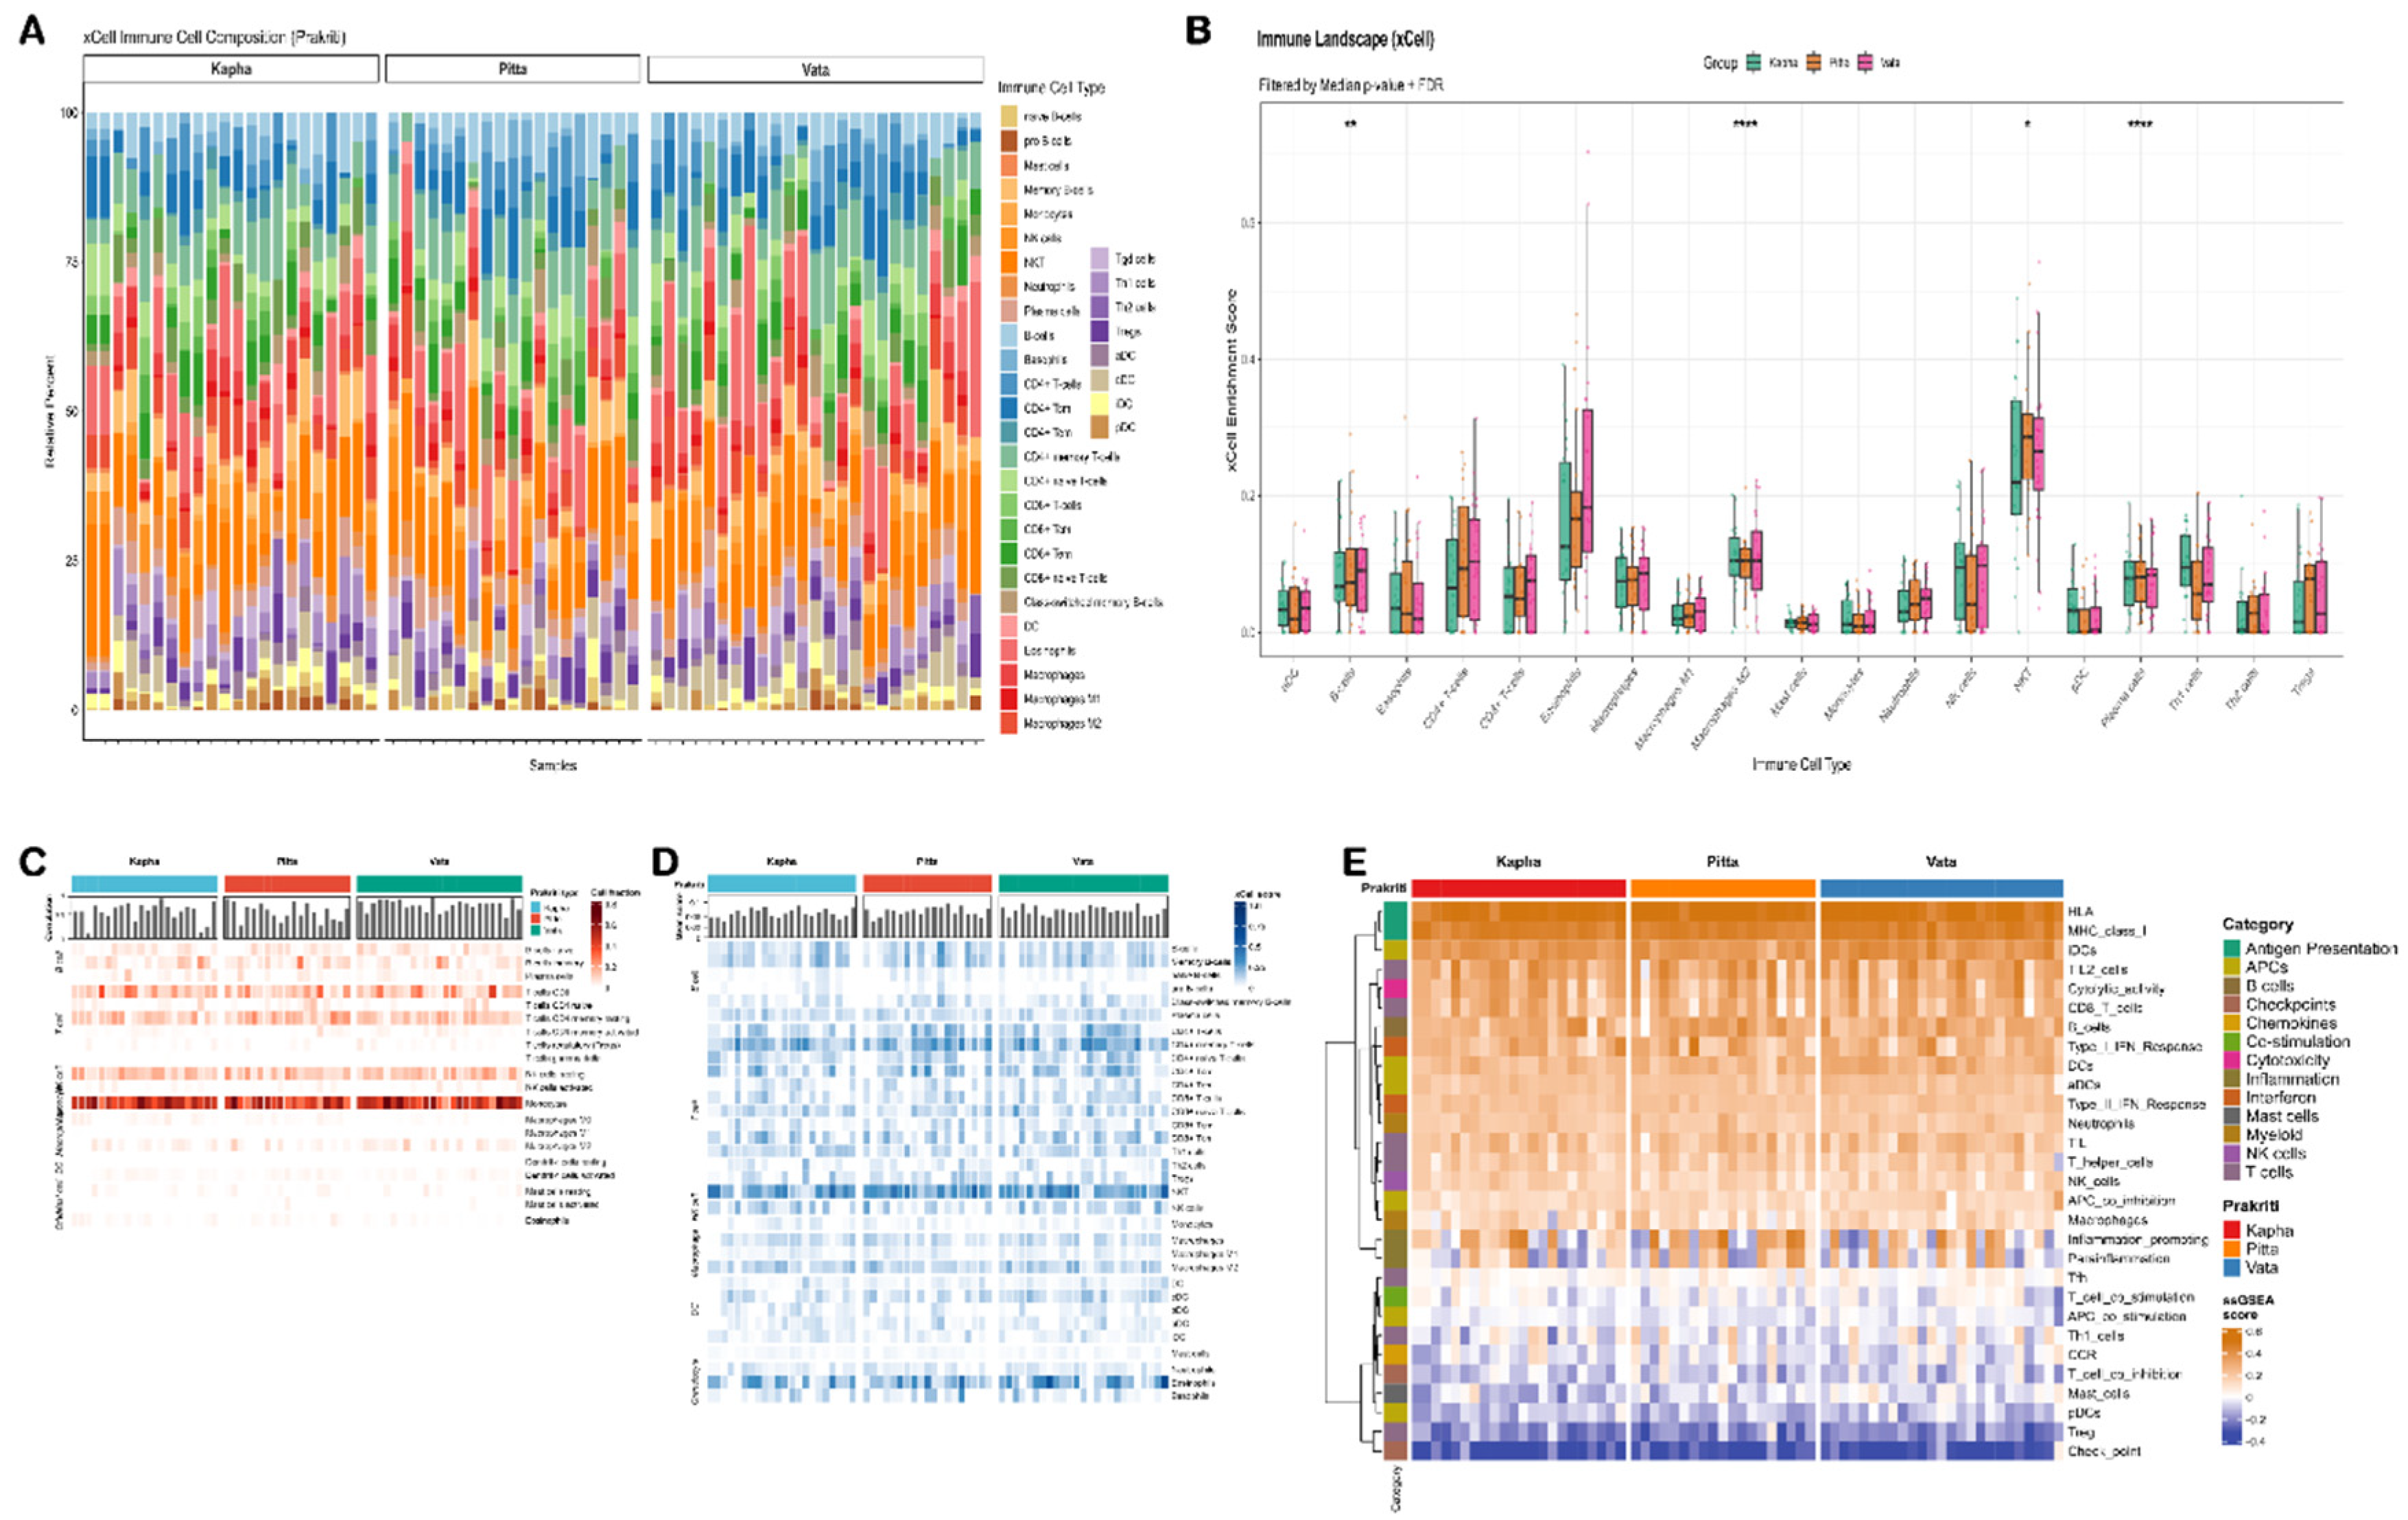
Figure 10.
Prakriti-stratified transcriptomic profiling reveals differential expression of immune evasion and checkpoint regulatory genes. (A) Heatmap of VST-normalized expression values for a curated panel of immune evasion, checkpoint, and immunomodulatory genes across all subjects grouped by Prakriti class (K: Kapha; P: Pitta; V: Vata). B) Violin plots overlaid with box plots and individual data points (beeswarm) depicting VST-normalized expression of nine top-ranked immune evasion markers across Prakriti groups (Kapha: red; Pitta: blue; Vata: green). Pairwise comparisons were performed using Wilcoxon rank-sum tests with Benjamini-Hochberg correction ( p < 0.05, p < 0.01, p < 0.001).
Figure 10.
Prakriti-stratified transcriptomic profiling reveals differential expression of immune evasion and checkpoint regulatory genes. (A) Heatmap of VST-normalized expression values for a curated panel of immune evasion, checkpoint, and immunomodulatory genes across all subjects grouped by Prakriti class (K: Kapha; P: Pitta; V: Vata). B) Violin plots overlaid with box plots and individual data points (beeswarm) depicting VST-normalized expression of nine top-ranked immune evasion markers across Prakriti groups (Kapha: red; Pitta: blue; Vata: green). Pairwise comparisons were performed using Wilcoxon rank-sum tests with Benjamini-Hochberg correction ( p < 0.05, p < 0.01, p < 0.001).
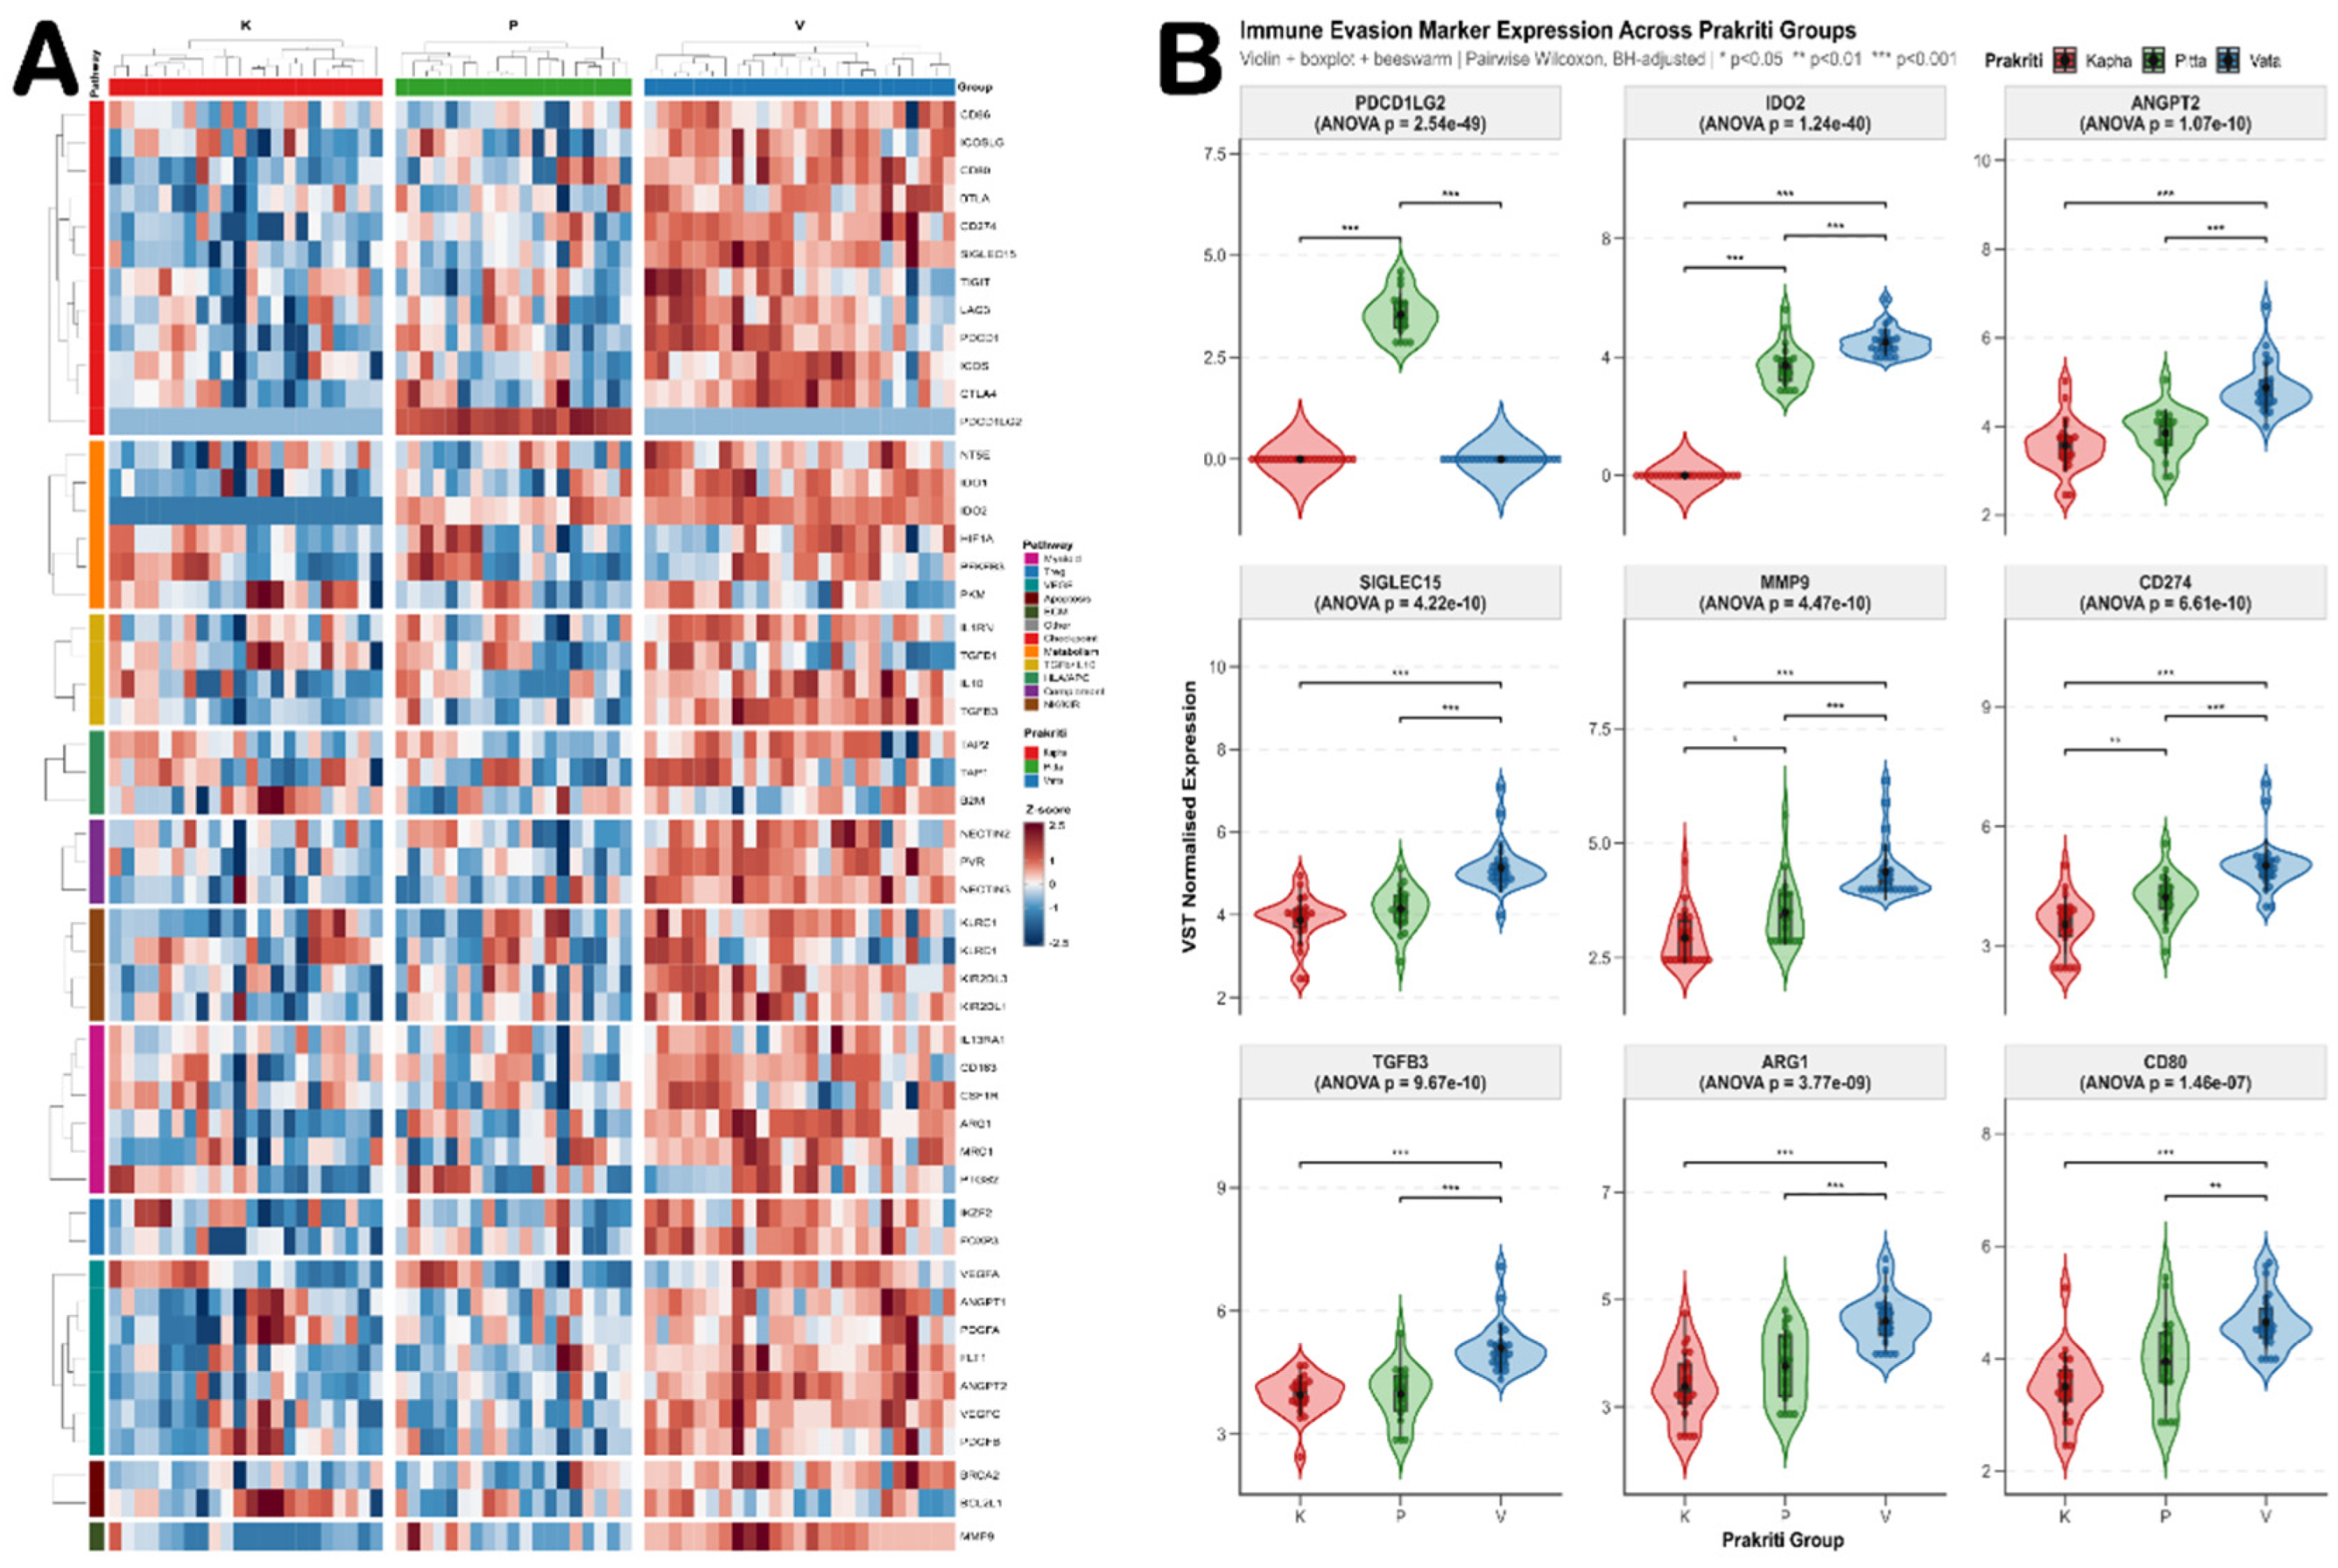
Figure 11.
Integrative multi-layer molecular profiling consolidates Prakriti-specific regulatory architecture across transcriptomic, pathway, kinase, and transcription factor layers. (A) Composite heatmap displaying integrated molecular activity scores across four analytical layers: Hallmarks and KEGG pathway enrichment, kinase activity, PROGENy pathway scores, and transcription factor (TF) activity, for all subjects grouped by Prakriti class (Kapha: green; Pitta: orange; Vata: pink). Each column represents an individual subject and each row represents a molecular feature within its respective layer, annotated on the left margin by layer identity. The red-blue diverging color scale reflects normalized activity scores, with red indicating elevated and blue indicating suppressed activity. (B) Cross-layer Spearman correlation heatmap depicting pairwise correlations between molecular features spanning PROGENy, TF, Kinase, and Hallmarks and KEGG layers, restricted to feature pairs with FDR-adjusted significance (FDR < 0.05). Color intensity reflects Spearman r values (range: -1 to +1), with red indicating positive and blue indicating negative cross-layer associations. (C) Principal component analysis of concatenated multi-layer activity scores for all subjects, colored by Prakriti class with 95% confidence ellipses. PC1 and PC2 together explain 41.8% of integrated multi-layer variance (PC1 = 24.0%, PC2 = 17.8%), and the three Prakriti groups achieve partial but meaningful spatial separation, confirming that the combined multi-omics regulatory landscape encodes Prakriti-associated molecular phenotypes more robustly than any single analytical layer in isolation.
Figure 11.
Integrative multi-layer molecular profiling consolidates Prakriti-specific regulatory architecture across transcriptomic, pathway, kinase, and transcription factor layers. (A) Composite heatmap displaying integrated molecular activity scores across four analytical layers: Hallmarks and KEGG pathway enrichment, kinase activity, PROGENy pathway scores, and transcription factor (TF) activity, for all subjects grouped by Prakriti class (Kapha: green; Pitta: orange; Vata: pink). Each column represents an individual subject and each row represents a molecular feature within its respective layer, annotated on the left margin by layer identity. The red-blue diverging color scale reflects normalized activity scores, with red indicating elevated and blue indicating suppressed activity. (B) Cross-layer Spearman correlation heatmap depicting pairwise correlations between molecular features spanning PROGENy, TF, Kinase, and Hallmarks and KEGG layers, restricted to feature pairs with FDR-adjusted significance (FDR < 0.05). Color intensity reflects Spearman r values (range: -1 to +1), with red indicating positive and blue indicating negative cross-layer associations. (C) Principal component analysis of concatenated multi-layer activity scores for all subjects, colored by Prakriti class with 95% confidence ellipses. PC1 and PC2 together explain 41.8% of integrated multi-layer variance (PC1 = 24.0%, PC2 = 17.8%), and the three Prakriti groups achieve partial but meaningful spatial separation, confirming that the combined multi-omics regulatory landscape encodes Prakriti-associated molecular phenotypes more robustly than any single analytical layer in isolation.
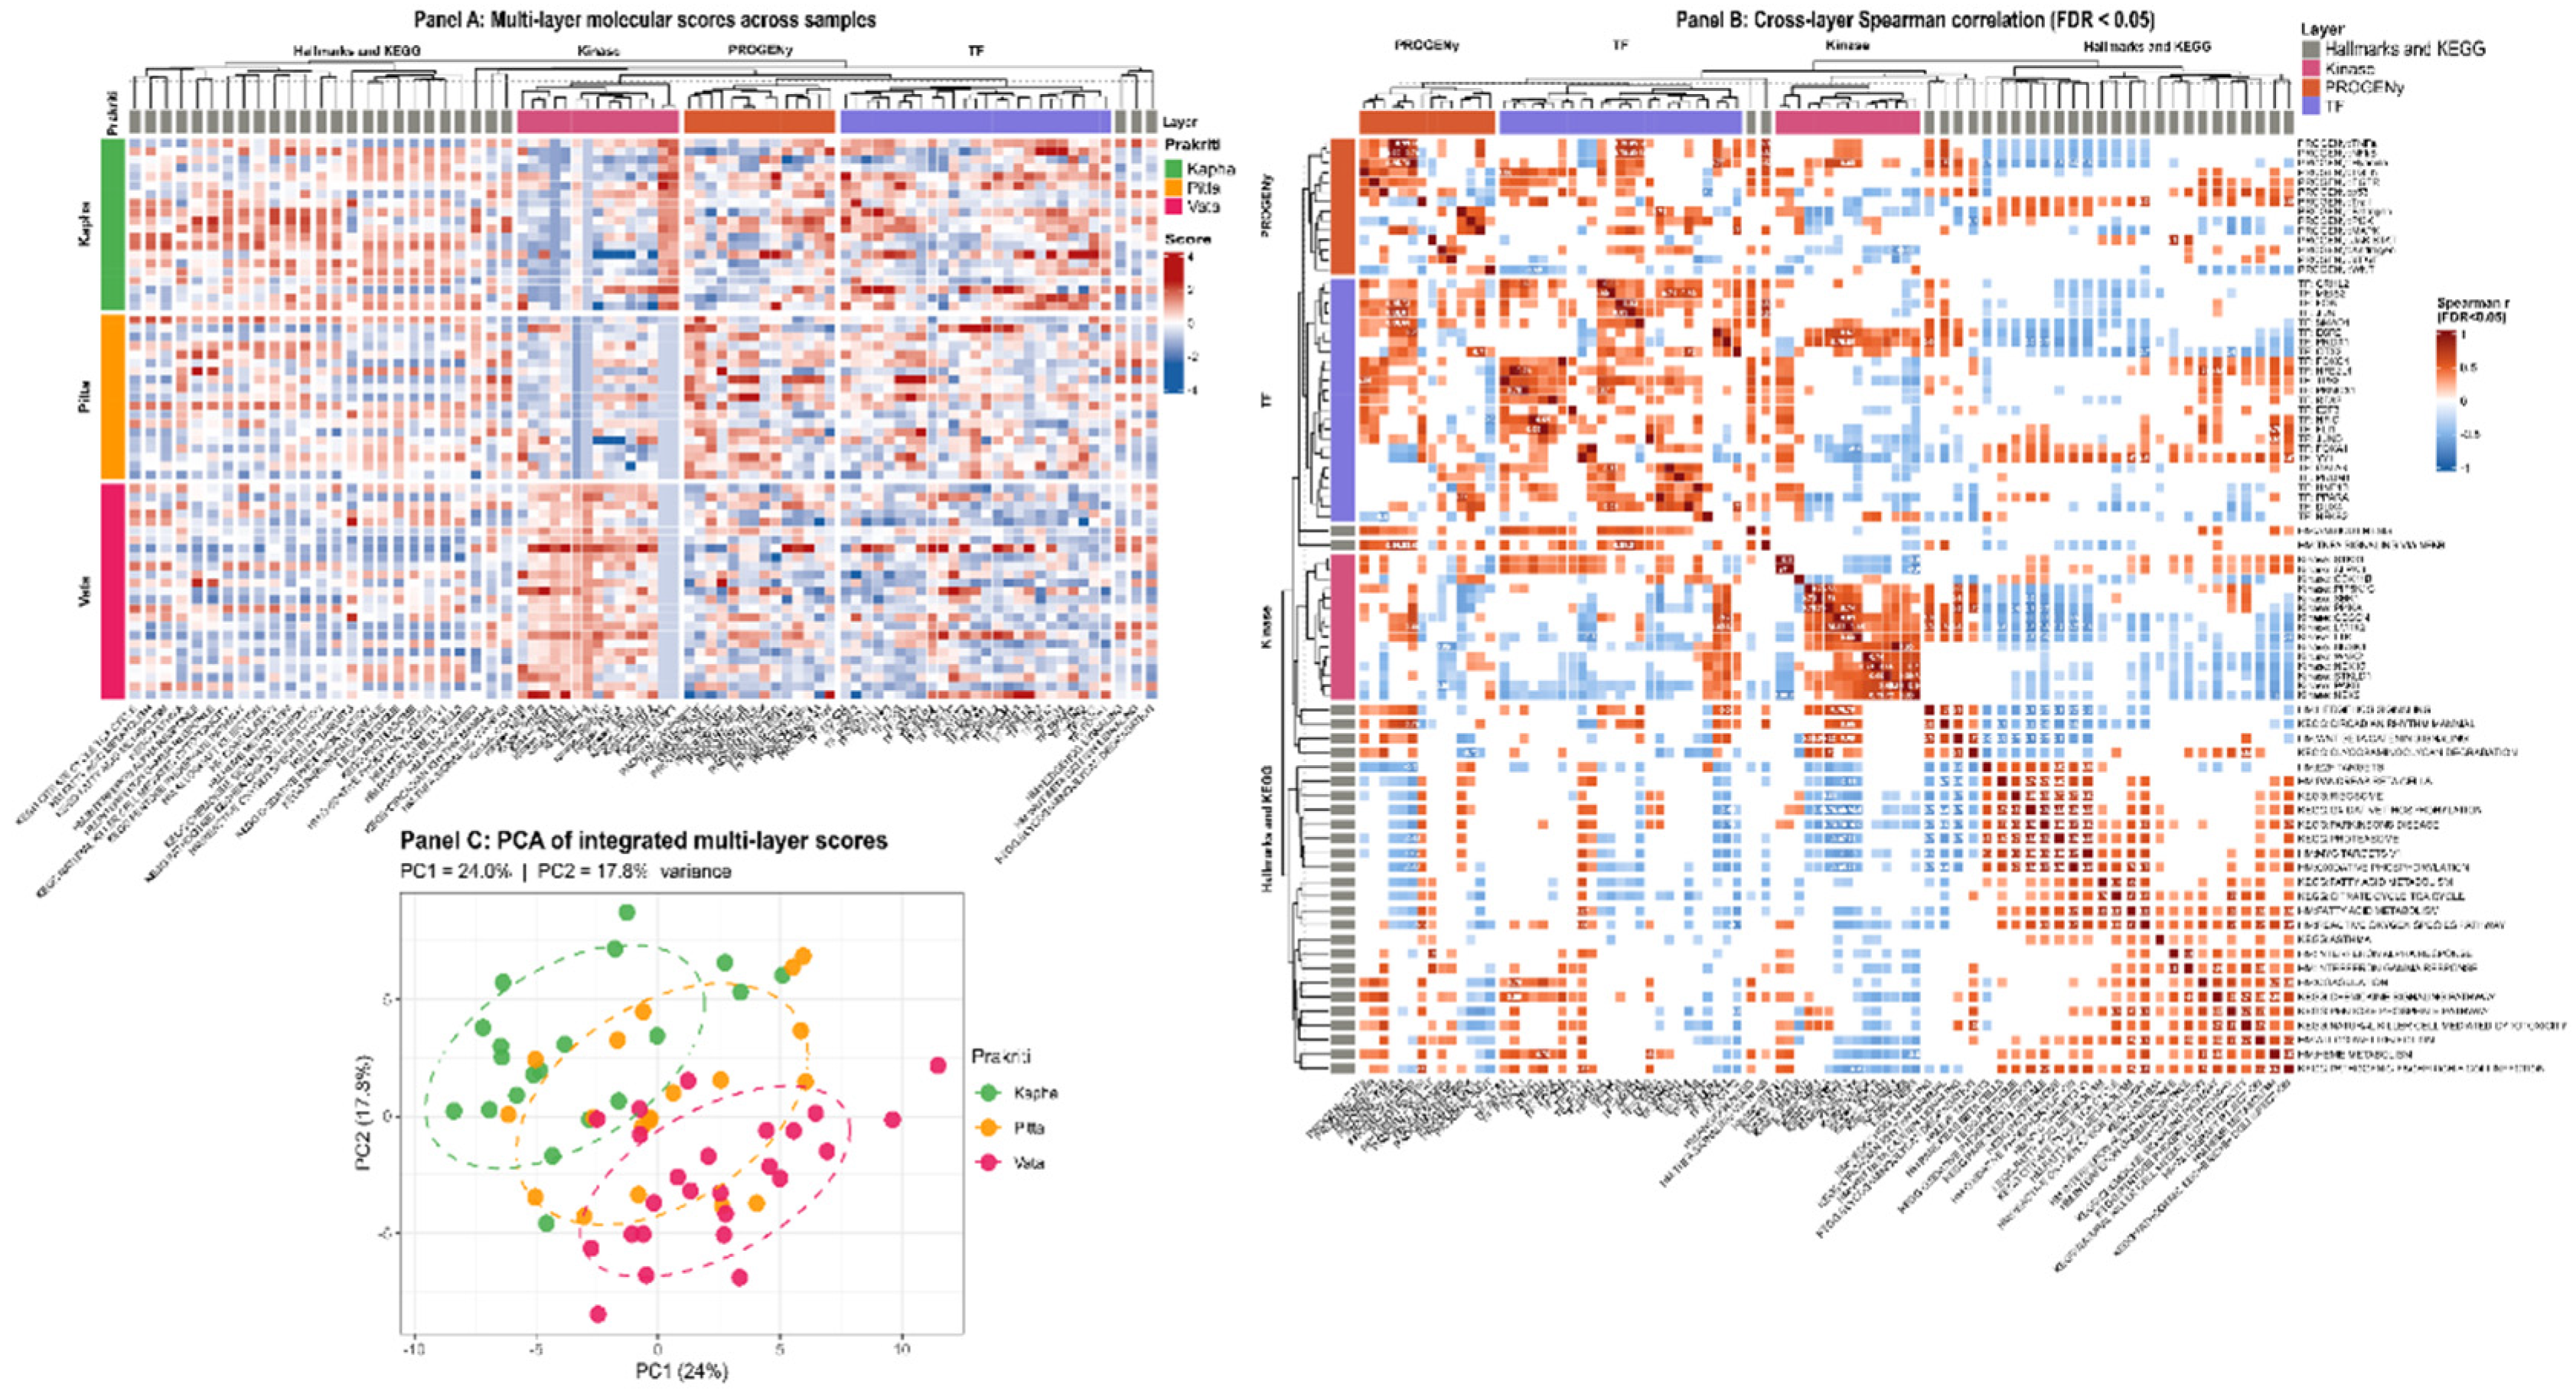
Disclaimer/Publisher’s Note: The statements, opinions and data contained in all publications are solely those of the individual author(s) and contributor(s) and not of MDPI and/or the editor(s). MDPI and/or the editor(s) disclaim responsibility for any injury to people or property resulting from any ideas, methods, instructions or products referred to in the content. |
© 2026 by the authors. Licensee MDPI, Basel, Switzerland. This article is an open access article distributed under the terms and conditions of the Creative Commons Attribution (CC BY) license (http://creativecommons.org/licenses/by/4.0/).
Copyright: This open access article is published under a Creative Commons CC BY 4.0 license, which permit the free download, distribution, and reuse, provided that the author and preprint are cited in any reuse.