

Submitted:
15 August 2026
Posted:
31 August 2026
You are already at the latest version
Abstract
The rubber antioxidant 6PPD and its toxic quinone transformation product 6PPD-Q are emerging aquatic contaminants with fragmented global occurrence data. This study constructed a full-process data mining framework integrating literature retrieval, lexical matching, attention-augmented neural network modelling and tabular extraction to compile 6PPD/Q records from 6360 Web of Science papers, achieving 85%-95% entity recognition accuracy. The compiled dataset revealed a pronounced mid-latitude enrichment pattern (30° N-45° N) correlated with population density and traffic intensity, with ultra-high hotspots in Los Angeles runoff (up to 6.10 μg/L) and Lake Sihwa sediment (330 ng/g). Toxicity assessment across 26 species confirmed 6PPD-Q is far more acutely toxic than 6PPD, especially to salmonids. Global risk quotient mapping consistently locked ecological hotspots to the Northern-Hemisphere mid-latitude belt, with the North-American west coast as the highest-risk zone. This work provides a reusable framework and the most comprehensive global 6PPD/Q dataset to support regulatory formulation and ecological risk mitigation.
Keywords:
N-(1
; 3-dimethylbutyl)-N’-phenyl-p-phenylenediamine (6PPD)
; 3-dimethylbutyl)-N’-phenyl-p-benzoquinonediimine (6PPD-Q/6PPD-Quinone)
; global aquatic environmental distribution
; text mining
1. Introduction
p-Phenylenediamine antioxidants (PPDs) released throughout tire service cycles, alongside their photochemically transformed quinone derivatives (PPDs-Q), have emerged as pervasive emerging aquatic contaminants worldwide, drawing widespread attention to their ecological hazards and environmental risks [52,105,109]. Boasting outstanding anti-oxidative properties, PPDs make up over 70% of all tire additives. The global market for rubber antioxidants continues to expand, hitting USD 1.372 billion in 2024 with a projected rise to USD 1.46 billion by 2028. Annual global tire output has surpassed two billion units and keeps growing, driving a sharp rise in environmental PPD emissions [31,34,37,38,39,40,43,45,90,91,93,95]. Released via tire abrasion, surface runoff and atmospheric transport, these compounds eventually accumulate extensively in natural aquatic ecosystems across the globe. Featuring benzene ring skeletons, PPDs readily undergo photochemical ozonation under natural environmental conditions to form PPDs-Q, transformation products far more toxic than their parent compounds [52,68,101,102,103,104,110,111]. These quinone byproducts feature persistent traits, long-range mobility and strong bioaccumulation potential, and have been widely detected in water, soil, sediment and biota across numerous global regions. Representative quinone variants such as 6PPD-Q and IPPD-Q exert severe toxic impacts on aquatic organisms, with acute lethal concentrations for fish, daphnia and other aquatic invertebrates reaching the microgram-per-liter range. They also trigger severe chronic toxicity and neurological damage, impairing reproduction and locomotion in invertebrates and posing persistent latent threats to the structure and function of aquatic ecosystems [32,33,42,46,113,114,115,116,121,122]. As the dominant antioxidant additive in tire rubber, 6PPD remains underrepresented in existing research literature. This underscores the urgent need to systematically compile global concentration records and conduct comprehensive risk evaluations for 6PPD and its quinone oxidation derivatives [47,94,124,125,132]. Existing environmental research on 6PPD and 6PPD-Q mostly centers on toxic responses of model organisms exposed to individual pollutants, lacking systematic collation of their global aquatic occurrence patterns and pollution magnitudes [36,45,47,136,138,149]. Conventional datasets largely rely on manual literature screening and basic text analysis, which suffer from low efficiency, biased sampling and substantial analytical errors, making it hard to capture a full, unbiased picture of worldwide contamination [10]. Globally, unified regulatory frameworks governing PPDs and PPDs-Q have yet to be established; only a small number of jurisdictions including the United States have introduced production restrictions and alternative chemical assessments [52]. Targeted regulatory standards and complete datasets to support ecological risk evaluations remain absent within China [29,30,53,63]. Against this backdrop, efficient, rigorous text analytical approaches are required to systematically unravel the distribution patterns of 6PPD and 6PPD-Q in global aquatic environments [10]. Conventional text analysis workflows primarily adopt Boolean search logic on the Web of Science (WOS) database to retrieve literature by publication year, yet this approach carries substantial selection bias [10,69,70,78,82,89]. Researchers commonly apply restrictive keywords to retrieve papers focused on specific chemicals, but inconsistent author writing styles and varied screening preferences often lead to incomplete capture of relevant studies. Manual full-text review is another widely adopted strategy for extracting pollutant data, though this practice delivers extremely low throughput amid large volumes of heterogeneous literature, and performs far less effectively than standardized WOS-based text screening when confronted with abundant irrelevant textual information.
Our study constructs a full-process text mining framework as a technical tool, with the core scientific objective to systematically aggregate global aquatic 6PPD-Q monitoring data, reveal mid-latitude enrichment characteristics, and provide data basis for aquatic ecological risk assessment rather than merely developing natural language processing algorithms.
2. Materials and Methods
2.1. Overall Research Framework
We established a literature sorting framework following the logic of retrieval, screening, extraction, clustering and collation to systematically organize global environmental monitoring records of 6PPD and its toxic transformation product 6PPD-Q [2,5,12,18,25]. The whole analytical system contained six interrelated analytical segments: original lexical matching of literature contents, document retrieval based on Web of Science, preliminary screening of collected papers, semantic entity identification via textual neural analysis, keyword clustering of environmental descriptors, and unified collation of pollutant concentration data extracted from tables. All analytical steps cooperated to realize full sorting of pollutant occurrence information from original published papers to standardized global spatial datasets (Figure 1A).
2.2. Literature Retrieval and Preprocessing
2.2.1. Lexical matching of literature texts
A multi-class environmental vocabulary system was constructed based on the glossary released by the U.S. Environmental Protection Agency, including single-word, two-word and multi-word environmental descriptors [10]. Single-word vocabulary was selected as the core analytical unit for simplified text interpretation (The meaning of the symbol and their explanation can be viewed at Table 1). A random set of 2000 paper titles and abstracts was selected for lexical matching against the established environmental vocabulary library, and high-frequency root words including p-phenylenediamine, quinone, and tire wear were summarized as core retrieval terms [10,35,41,47,52]. Unified normalization rules were set to standardize raw lexical fragments:
t* = Lower(Clean(t))
Where Clean() removes punctuation and invalid symbols, and Lower() converts all characters to lowercase [10,14,71,73,80,85]. The standardized single-word lexicon set is defined as:
ED1 = {t1*, t2*, …, tV*}
The matching set of environment-related lexical units is defined as:
Match = {t* | t* ∈ ED1 and t* ∈ Tnorm}
2.2.2. WOS document retrieval and preliminary screening
Core descriptors summarized from lexical matching were adopted for unified retrieval on the Web of Science database, reducing bias caused by inconsistent author writing styles [10,54,56]. All retrieved papers were split into seven independent datasets: six groups of 1000 papers and one residual group of 360 papers. SHapley Additive exPlanations (SHAP) visualization quantified the explanatory weight of each environmental keyword [11,70]. A total of 6360 papers were collected, among which 2000 samples were randomly selected for SHAP analysis to screen core feature words via marginal contribution values [70,81,84,86]. Text feature standardization was conducted and combined with the lexical normalization formula above to build reference criteria for subsequent text analysis [31]. After counting keyword frequency, abundance and density, irrelevant documents were eliminated to form standardized analytical datasets.
2.3. Textual Neural Analysis for Environmental Entities
Multiple natural language analytical logics were compared to extract pollutant categories, sampling locations, concentration values and medium information from academic texts [1,2,12]. SpaCy linguistic processing was used for word segmentation and text noise reduction, and fully connected neural analysis was selected as the basic analytical framework due to its compatibility with sorted structured text [11,17,22,28]. Three attention analysis modes were compared to fix the equal-weight defect of basic analysis frameworks. Multi-head attention and MCP contextual analysis were finally integrated. Multi-head attention captures multi-layer semantic links of environmental terms; MCP logic realizes joint interpretation of text and table content in papers [3]. After repeated training, the model maintained 85%-95% recognition accuracy for pollutants, sampling sites and media. (The comparison of each structure can be viewed at Table S2 and Figure S2) Early stopping criteria were adopted to avoid overfitting, and GLUE (General Language Understand Exam) benchmarks were referenced to verify overall analytical performance [3]. The Softmax function was used to output classification probabilities of standardized entities including pollutants, aquatic organisms, water and sediment [10,11,12,13,14,15,16,17,18,19,20,21,22,23,24,25]. (The computer sciences structural design can be viewed at Figure S1A, Figure S1B, Table S1, Figure S1C)
2.4. Environmental Keyword Clustering Analysis
Unified text segmentation criteria were formulated to split full texts into paragraphs and complete semantic sentences by punctuation marks [4,5,6,7,8,9,10,11,12,13,14]. The character index of each sentence was recorded for entity positioning. A fixed entity classification system covering pollutants, concentrations, sampling regions and organisms was preset. The coordinate interval of entity e in the full text:
C(e) = [s(e), t(e)]
Where s(e) = starting character subscript, t(e) = ending character subscript. Standard analysis sample format:
S = (text: Sk,i, entities: [(C(e), Eq)])
All labeled samples were stored as structured data for entity identification analysis. (Figure 1B)
2.5. Collation of Pollutant Concentration Data from Document Tables
Unified sorting criteria were formulated for tabular concentration data in PDF, Word and Excel literatures [8,10,11,12,13,14,15,16,17,21,23,72,77,80,87,92]. The universal data cleaning formula:
Dclean= DropNA(Rename(Strip(Replace(Draw,”nan”,”“))))
This formula removes blank rows, blank columns and null values from raw data [10,97,98,99]. Two data quality evaluation indicators: Extraction success rate:
S = Nextracted / Ntotal
Valid data integrity:
I = Mvalid / Mtotal
All processed data can be exported as Excel, CSV files with source information retained. Actual collation results showed over 90% table extraction rate and more than 85% valid cell proportion, supporting global pollution mapping (Figure 1C; overall repository will be seen at: https://13579-pr.github.io/CMJS).
2.6. Risk Quotient Calculation Methodology
Toxicity threshold data of 6PPD and 6PPD-Q for common aquatic model organisms were collected from two sources. The first source was the USEPA ECOTOX database at http://cfpub.epa.gov. The second source was published relevant literatures. All adopted toxicity indicators were LC50 and EC50 values from standard toxicity tests.Predicted no-effect concentration (PNEC) was calculated directly with the minimum LC50 (Lethal Concentration of 50% Species) and EC50 (Effect Concentration of 50% Species) values. The calculation formula is shown below:
PNEC=min{LC50, EC50}/AF
AF (Affect Factor) refers to the assessment factor. Its value was determined based on the integrity of toxicity data. AF was set as 100 when toxicity data covered fish, cladocerans and algae, three complete trophic levels. AF was adjusted to 1000 if only two trophic levels had available toxicity records. AF was set to 10000 when only single-species acute toxicity data could be obtained. If chronic NOEC and LOEC data of three trophic levels were supplemented, AF was assigned as 10 (Table S3A, so we set AF=1000 in 6PPD-Q exposure group).The risk quotient RQ was calculated using PNEC and site-specific measured environmental concentration (MEC). The corresponding formula is as follows:
RQ=MEC/PNEC
MEC represented field-measured pollutant concentration at each geographic point of global water bodies. RQ (Risk Quotient) was solved separately for every coordinate point to support subsequent spatial risk mapping.Calculated RQ values were used to classify aquatic ecological risk. Areas with RQ < 1 were defined as low-risk regions with no obvious biological hazards. Areas with 1 ≤ RQ < 10 belonged to medium-risk zones with potential chronic toxicity to sensitive aquatic organisms. Areas with RQ ≥ 10 were high-risk regions that may cause acute lethal damage to aquatic populations.Prior to formal calculation, abnormal outlier concentration data were removed. Toxicity records missing clear test species or exposure duration information were also excluded. These steps guaranteed reliable PNEC and RQ results. (Table S3B)
For plotting and characterization of computational performance data, all figures were generated using Matplotlib in Python 3.8 within the PyCharm IDE. For ecological and ecotoxicological analyses, graphing was performed with Origin 2022 and the toxicology analysis software Prism. All heatmaps were constructed based on longitude, latitude and corresponding values, including concentrations (ng/L) and risk quotient (RQ) values. In 6PPD exposure, the species meet the requirements of SSD (Species Sensitivity Distribution curve), the Eq. 9 is not suitable for the PNEC calculation, in which we use HC5, details about this method can be viewed via SM.
3. Results and Discussion
3.1. Analysis on Contribution and Relevance of Environmental Keywords in Literature Texts (N=5000 from 6360, random)
A total of 6360 retrieved potential literatures were pre-screened via keyword retrieval as aforementioned to obtain textual datasets. With the aid of SHAP-based feature importance quantification and correlation heatmap analysis, we systematically analyzed the contribution of environmental keywords and the correlation patterns among characteristic factors (see Figure S4 and the construction of the Environmental Dictionary in Figure 1B). The results provided fundamental supporting data for the entity recognition model integrated with neural networks and the multi-head attention mechanism of MCP [11,70,74], laying a theoretical foundation for the accurate extraction of entities related to 6PPD and 6PPD-Q. All results were checked by human.
As illustrated in Figure S4, the environmental keywords extracted from the pre-screened 6360 literatures exhibited an obvious core-periphery hierarchical structure. Keywords of core pollutants dominated the overall keyword distribution. Based on these findings, core anchor points for identifying pollutant entities and inferring the pollutant-distribution-characteristics relationships were established (Table 2). This result is consistent with the research objectives. It also indicates that relevant terms appear frequently in valid literature with high information density, which enables accurate identification of core entities. Notably, besides core pollutant entities, environmental medium-related keywords including aquatic, water, sediment and biota rank second in weight in the bubble plot of Figure S4, as presented in Table 3. However, the non-academic vocabularies are not obviously.
Based on the SHAP results in Figure S4F-J, more pronounced patterns can be observed.The mean SHAP values of 6PPD-Q, 6PPD and p-phenylenediamine are 1.38, 1.29 and 1.17, respectively. All values exceed 1.0, falling within the high contribution range. These terms serve as core positive features for the model to identify pollutant entities, and their occurrence substantially increases the recognition probability of pollutant entities. Among the environmental medium keywords, the mean SHAP values of water, sediment and biota are 0.98, 0.87 and 0.76, respectively, which are moderately high positive features. The occurrence of these keywords provides critical clues about the occurrence environments of pollutants and facilitates the accurate localization of core entities.The SHAP values of other non-academic terms are relatively low (< 0.2), which is consistent with the results of the bubble plots in Figure S4A-E. Training the neural network on these data enables the model to effectively distinguish core information from irrelevant content and eliminate interfering correlations.
3.2. Analysis of Keyword Matching for Literature Text Extraction (N=6360)
Matching analysis across the full literature corpus was conducted using core keywords screened from the SHAP swarm plot. We adopted Python 3.8 to statistically analyze the keywords and their categories in all literature abstracts. As shown in Figure S5A-G, mathematical statistics were performed on the scatter distribution of keyword density and abundance in the collected literature. Overall, the valid scatter points of each subplot exhibit distinct differences in keyword density, abundance distribution, and fitting performance of the 95% confidence interval (CI). One group presents the most compact distribution range, with a keyword density of 1-2 per paper and an abundance of 2-4 per paper. The 95% CI curve almost encloses all valid scatter points without data overflow. Several groups fully cover the entire range of core thresholds, with uniform CI fitting at the boundary ranges. Some samples show an upward shift in the abundance dimension or a rightward shift in the density dimension, and the corresponding CI curves achieve superior fitting and convergence at the marginal intervals. Certain groups contract toward low-value ranges in both density and abundance, with optimal CI fitting at the left and lower boundaries. By contrast, other groups shift toward high-value ranges in both dimensions, and their Cis exhibit the strongest enclosure effect at the right and upper boundaries. Additionally, one group shows a distribution range completely consistent with the core thresholds, maintaining a high level of CI fitting across the entire interval. (Keywords were referenced by Figure 1B ED, and the supplement material)
Combined with the identification data from Figure S5A-G, we quantitatively summarized the detection proportions of three environmental media: water/aquatic, biota and sediment. All subplots revealed a consistent trend that the detection proportion was highest for biota, followed by the water/aquatic, and lowest for sediment. Besides, no obvious batch fluctuation was observed in the detection proportion of the same medium across different subplots.
The quantitative results derived from the bar charts are as follows: For Subplot A (literatures 1-1000), the proportions of the water/aquatic, biota and sediment were 33%, 51% and 16%, respectively. The corresponding values were 32%, 49% and 19% for Subplot B (literatures 1001-2000); 31%, 52% and 17% for Subplot C (literatures 2001-3000); 35%, 48% and 17% for Subplot D (literatures 3001-4000); 33%, 51% and 16% for Subplot E (literatures 4001-5000); 34%, 52% and 14% for Subplot F (literatures 5001-6000); and 33%, 49% and 18% for Subplot G (literatures 6001-6360).
Overall, across the seven groups, the proportion of biota remained stable at 48%-52%, while that of the water/aquatic ranged from 31% to 35%. Sediment consistently accounted for 17% in all subplots. The hierarchical order of detection proportions for the three media remained unchanged throughout Figure S5A-G, demonstrating an extremely regular distribution pattern (Figure 2).
Although the SHAP swarm plot cannot explain the subtle numerical differences observed in the bar chart results of each subplot, the within-group quantitative ranking of keyword contribution, i.e., biota > water > sediment, is highly consistent with the rankings of keyword counts and detection proportions for the three media. This further verifies the scientific validity and effectiveness of the core keyword system screened in this study. Meanwhile, the keyword matching results from the literature texts, the detection proportion results from actual environmental media, and the keyword contribution results from the SHAP swarm plot form a mutually supportive logical closed loop. These findings provide dual support of precise text data and actual environmental data for subsequent compilation of environmental fate information on 6PPD and 6PPD-Q, and also offer a reusable analytical framework for literature data mining and environmental occurrence characterization of similar emerging environmental pollutants. However, manual verification revealed that many biota-related records were mild duplicates (after clean(), explanation can be seen in SM).
3.3. Geographic data compilation based on machine learning and text mining
Relying on 6PPD/Q concentration data and geospatial information extracted by the neural network model integrated with attention mechanisms, we adopted Python geographic visualization tools to map the geographical distribution and concentration density patterns of 6PPD/Q in the aqueous and sediment phases across typical global regions. Latitude and longitude coordinate calibration and concentration density normalization were performed to visualize the spatial distribution and concentration characteristics of 6PPD/Q at the global scale, which clarified its geographical differentiation and concentration density profiles across diverse environmental media. The corresponding results are illustrated in Figure 3 (origin data can be seen via repository).
The geographical distribution and concentration density of 6PPD/Q in global water bodies exhibit prominent spatial heterogeneity and latitudinal zonation (Figure 3A). The latitude-longitude scatter plot reveals that detection points of 6PPD/Q in aquatic environments are predominantly concentrated in the mid-latitude zone of the Eastern Hemisphere (20° E-160° E, 20° N-60° N) and the mid-low latitude zone of the Western Hemisphere (80° W-20° W, 0° N-40° N), covering densely populated, highly industrialized regions with intensive tire consumption including Western Europe, East Asia, Southeast Asia and Eastern North America. By contrast, detection points are extremely scarce in high-latitude polar zones, remote low-latitude tropical areas and central oceanic regions, demonstrating that anthropogenic activity intensity serves as the primary driver shaping the spatial distribution of 6PPD/Q in water bodies.
The correlation plot between concentration density and latitude presents a unimodal distribution of aquatic 6PPD/Q concentrations, with peak values ranging from 0.030 to 0.035 observed within the 30° N-40° N latitudinal belt. This zone hosts dense urban agglomerations and transportation networks, where tire abrasion and surface runoff deliver far higher pollutant fluxes than other areas. Concentration density gradually declines toward both higher and lower latitudes, with values below 0.010 north of 60° N and across all Southern Hemisphere latitudes, consistent with the latitudinal gradient of human activity intensity.
The histogram of 6PPD/Q concentration density shows a distinct right-skewed distribution. Over 75% of all detection points fall within the range of 0.005-0.020, while points with high concentrations (>0.030) account for less than 10% of the total dataset. This indicates that 6PPD/Q generally occurs at moderate to low concentrations in global water bodies, with high-concentration accumulation limited to localized zones with intense human interference.
The geographical distribution pattern of 6PPD/Q in sediment phases is highly consistent with that in aqueous phases, yet remarkable medium-specific differences exist in concentration density and distribution features (Figure 3B). The latitude-longitude scatter plot demonstrates a high spatial overlap between sediment and aquatic detection points, which are likewise concentrated in mid-latitude densely populated regions including Western Europe, East Asia and Eastern North America. Most sediment sampling sites are located in low hydrodynamic depositional environments such as river estuaries, lake littoral zones and coastal seas, implying that the spatial distribution of sedimentary 6PPD/Q is jointly governed by anthropogenic pollution sources and the transport-deposition effects driven by hydrodynamic conditions.
The plot linking concentration density to latitude also exhibits a unimodal distribution for sedimentary 6PPD/Q, with peak values of 0.060-0.070 occurring within the 35° N-45° N latitudinal belt. Compared with water bodies, the peak latitudinal zone shifts slightly northward, accompanied by distinctly higher peak concentrations, which can be attributed to the adsorption and enrichment capacity of sediments. Mid-latitude temperate zones feature abundant suspended solids and strong sediment adsorption, facilitating long-term accumulation of pollutants. Concentration density declines more rapidly toward both higher and lower latitudes from the peak zone; values fall below 0.020 north of 50° N. Low-latitude regions present weak enrichment effects due to vigorous hydrodynamic forces and low sedimentation rates, thus maintaining low concentration levels as well.
The histogram of sedimentary 6PPD/Q concentration density displays a narrow right-skewed distribution. Over 80% of detection points cluster within the range of 0.020-0.050, while high-concentration sites (>0.050) account for less than 8% and low-concentration sites (<0.010) merely make up 5%. These results reveal that sedimentary 6PPD/Q concentrations are more compactly distributed than those in water, with scarce discrete low-concentration points resulting from sediment enrichment.
Comparisons of geographical and concentration patterns between aqueous and sedimentary 6PPD/Q reveal shared spatial characteristics: enrichment in mid-latitude human-intensive zones and scarcity at high/low latitudes, alongside a unimodal latitudinal concentration profile for both media. This indicates that anthropogenic activity constitutes the dominant factor governing the global biogeography of 6PPD/Q, whereas inherent medium properties and environmental behaviors lead to significant disparities in peak latitude, concentration magnitude and distribution dispersion.
As a transport medium, water directly reflects instantaneous pollutant input fluxes and is strongly modulated by surface runoff and water exchange, leading to wider distribution dispersion and lower peak concentrations. By contrast, sediments act as long-term accumulation sinks that record persistent pollutant input and enrichment. Constrained by depositional settings and adsorption capacity, sediment concentrations are more concentrated with higher peak values, and their peak latitudinal band shifts moderately due to varying sedimentary conditions.
3.4. Compilation of In Vivo Concentration Datasets and Analysis of Occurrence Patterns and Spatial Heterogeneity of 6PPD/Q Across Global Water Bodies and Sediments via Machine Learning and Text Mining
Combining attention-augmented neural networks and Python batch data extraction tools, we accurately extracted concentration and exposure information of 6PPD, 6PPD-Q and their chiral derivatives from 153 valid published articles. The biomatrices covered human blood, serum, urine, breast milk, fish tissues and mouse liver, among others. All concentration values were standardized and expressed in scientific notation with the unit of ng/L to systematically characterize the in vivo occurrence and exposure patterns of target pollutants, providing standardized datasets for assessing bioaccumulation potentials and human health risks of this contaminant class.
6PPD exhibited prominent matrix-specific and regional discrepancies in biotic occurrence. Blood samples collected from Tianjin presented 6PPD concentrations ranging from 0 to 1.35×10² ng/L, indicating moderate population exposure risks in this region. Breast milk samples from South China contained 4.13×10³ ng 6PPD per liter, implying potential infant health hazards via maternal-fetal transmission. In serum matrices, healthy residents in South China had a baseline concentration of 6.30×10¹ ng/L, while patients with non-alcoholic fatty liver disease (NAFLD) showed concentrations of 0-7.82×10² ng, and general populations ranged from 1.14×10² to 4.30×10² ng/L, suggesting a potential correlation between 6PPD exposure and specific metabolic disorders.
Urine, a critical biomarker matrix for external exposure, displayed substantial interregional concentration gaps. Urinary 6PPD concentrations of average adults in South China fell within 1.51×10¹-6.83×10¹ ng/L, samples from Quzhou ranged from 4.13×10² to 3.86×10³ ng/L, and Guangzhou samples were 0-5.42×10² ng/L. After creatinine normalization, urinary levels for adults, children and pregnant women in South China were 2.00×10¹ ng/L, 1.53×10¹ ng/L and 7.31×10¹ ng/L, respectively. Such regional disparities are closely linked to industrial layout and traffic activity intensities, as well as residents’ daily lifestyles. Moreover, hepatic concentrations in laboratory mice reached 1.54×10⁵-5.21×10⁶ ng/L, far exceeding levels detected in human biological specimens, which reflects high-dose exposure conditions in laboratory toxicological assays.
As the primary transformation product of 6PPD, 6PPD-Q possessed unique detection frequency and concentration profiles in biological matrices. For serum samples from South China, the concentration ranges of healthy controls, NAFLD patients and general populations were 0-1.06×10³ ng/L, 0-7.83×10² ng/L and 1.10×10²-4.30×10² ng/L, respectively, with magnitudes comparable to parent 6PPD, demonstrating strong bioaccumulation capacity of quinone transformation products. In urine matrices, 6PPD-Q concentrations of children, pregnant women and adults in Guangzhou were 0-7.82×10² ng/L, 2.61×10³-8.58×10³ ng/L and 5.52×10¹-2.11×10³ ng/L; adult samples from Shanghai ranged 1.41×10²-6.33×10³ ng/L; general populations in Tianjin recorded 0-7.30×10¹ ng/L; and adults of all age groups in Taizhou showed 7.00×10²-2.40×10³ ng/L, with the maximum urinary concentration of 8.58×10³ ng/L observed among pregnant women, highlighting the high exposure susceptibility of vulnerable groups.
Cerebrospinal fluid (CSF) samples from Parkinson’s disease (PD) patients in Shenzhen contained 1.19×10⁴ ng/L 6PPD-Q, versus 5.07×10³ ng/L in healthy controls, which hints a potential association between this pollutant and neurological disorders and necessitates targeted follow-up research.
6PPD-Q, the most toxic quinone metabolite, draws extensive research attention regarding its biotic accumulation and health threats. Serum concentrations in South China averaged 1.53×10² ng/L, consistent with 6PPD exposure levels; urinary concentrations in the same region ranged from 7.61×10¹ to 2.91×10³ ng/L. After creatinine correction, adult, child and pregnant urinary concentrations were 5.10×10² ng/L, 9.30×10¹ ng/L and 2.76×10³ ng/L, respectively, with the high levels among pregnant populations requiring urgent concern.
No detectable 6PPD-Q (0.00 ng/L) was found in commercially available fish collected from Beijing. Laboratory acute toxicity tests revealed significant regional and chiral differences in fish LC₅₀ values of 6PPD-Q: LC₅₀ values in Chinese test systems ranged from 9.00×10² to 2.20×10⁶ ng/L, American datasets 5.90×10²-1.96×10³ ng/L, and Japanese tests recorded a single value of 5.10×10² ng/L. For chiral derivatives, both R-6PPD and S-6PPD shared an LC₅₀ of 2.01×10⁵ ng/L, while R-6PPD-Q, racemic 6PPD-Q (rac-6PPD-Q) and S-6PPD-Q exhibited LC₅₀ of 4.31×10³ ng/L, 2.26×10³ ng/L and 1.66×10³ ng/L, respectively. Marked chiral toxicity differences were observed, with the S-configured quinone isomer showing the strongest toxic potency, providing precise control targets for subsequent pollutant risk governance.
Comparative analysis of biotic occurrence patterns revealed a universal concentration hierarchy of urine > serum > blood > breast milk for both 6PPD and its quinone derivatives. Transformation products frequently exceeded parent 6PPD in multiple matrices, indicating biotransformation may amplify the bioaccumulation potential of tire-derived contaminants. Spatially, widespread detections were documented across South, East and North China, with elevated concentrations observed in industrial and traffic-intensive zones such as Quzhou and Guangzhou, proving anthropogenic activity intensity acts as the core driver of biotic pollutant exposure.
All extracted biotic concentration data were fully matched with cited literature records covering pollutant occurrence, analytical methodologies, ecotoxicological effects and human health risks. The standardized dataset provides unified quantitative benchmarks for cross-region and cross-matrix comparison of exposure magnitudes and health risk assessment (Figure 4B).
3.4.1. Analysis of occurrence characteristics and spatial heterogeneity of 6PPD/Q in global aquatic and sedimentary environments
This study systematically compiled global monitoring datasets of parent 6PPD and its oxidation product 6PPD-Q [43,44,48,49,117,118,119,120], establishing the most comprehensive environmental occurrence database to date. The dataset covered a broad geographic gradient from tropical equatorial zones to cool temperate regions, spanning the Pearl River Delta in China to the western coast of North America, and incorporating a total of 217 valid sampling records. Geographic coordinate-based heatmaps (Figure 4A) were generated to intuitively visualize global diffusion and spatial aggregation patterns of target pollutants. The color gradient of heatmaps clearly illustrated the migration trajectory of contaminants spreading from high-density transportation networks to adjacent water bodies and sediments. Hotspots colored in red/orange were not randomly distributed but closely clustered alongside major urban agglomerations and industrial corridors, directly demonstrating a positive correlation between traffic intensity and environmental contamination levels. Based on heatmap spatial patterns and complete monitoring records, a full-scale elaboration of 6PP/Q occurrence in aquatic and sedimentary media across China and worldwide is presented below [140,141,142,143,144,145,146,147,148,150].
3.4.2. Comprehensive occurrence profile of 6PPD/Q in water and sediments of China
Dataset collation revealed remarkable inter-basin and inter-medium disparities of 6PPD-Q nationwide. The Pearl River Delta in South China possessed the densest monitoring records, corresponding to its high urbanization degree. Extremely high 6PPD-Q peaks of 1.56×10³ ng/L and 8.75×10² ng/L were detected in urban road runoff samples from Dongguan and Huizhou, respectively. As receiving water bodies, the Dongjiang River and main Pearl River channel recorded aqueous concentrations ranging 0.26-11.3 ng/L, reflecting dilution effects in fluvial systems. Wastewater treatment plant (WWTP) effluents from Guangzhou and Hong Kong still retained 6PPD-Q at the order of 10¹-10² ng/L even after biological treatment. For sediment phases, urban rivers in Guangzhou recorded maximum 6PPD loads of 468 ng/g, whereas corresponding 6PPD-Q levels remained relatively low (1.87-18.2 ng/g), implying the stability of parent 6PPD under anoxic depositional conditions.
In East China coastal regions (Taizhou, Ningbo, Xiamen), aqueous 6PPD-Q concentrations generally fell within 0.465-21.2 ng/L. Notably, snowmelt samples from Yantai, Shandong, contained up to 2.10×10² ng/L 6PPD-Q, revealing pulsed contaminant release during winter snowmelt in cold northern zones. Water samples from North China (Beijing, Tianjin, Hebei) recorded relatively high concentrations of 1.31×10²-8.19×10² ng/L, markedly higher than background levels of southern rivers. Sediment samples from coastal Zhejiang and the Huangpu River (Shanghai) ranged 0.465-46.6 ng/g, with an extreme hotspot of 466 ng 6PPD-Q per gram detected at one Taizhou site, indicating severe localized point-source pollution. In remote western provinces (Qinghai, Xinjiang, Xizang), detection frequencies of 6PPD-Q were low with concentrations mostly below 28.2 ng/L, consistent with the positive linkage between human disturbance and pollutant loads. Only trace levels of 6PPD (<3 ng/g) were detected in deep-sea sediments of the South China Sea and Okinawa Trough, proving such contaminants predominantly accumulate in nearshore and estuarine habitats [50,51,57,58,60,61,62,63,64,123,126,127,128,129,130].
3.4.3. Detailed occurrence profiles of 6PPD/Q outside China
To correct the misconception of insufficient overseas data, this subsection elaborates monitoring records from North America, Australia, Europe and other Asia-Pacific regions with full data coverage.
U.S. monitoring sites spanned a wide geographic range from west to east coast with extreme concentration variations. California was a core research region covering the Sacramento-San Joaquin Delta and multiple dedicated sampling stations. Sites Delta NORT-001 to SOUT-007 maintained low levels of 0.433-0.934 ng/L, while sharp concentration surges occurred in Buckleberry Bay and urban runoff. Road runoff from Los Angeles represented global ultra-high hotspots with concentrations of 4.10×10³-6.10×10³ ng/L (4.13-6.16 μg/L), and a peak value of 2.815×10³ ng/L was measured in the Los Angeles River. Road runoff samples from Seattle contained 0.800-19.0 μg/L 6PPD-Q, with receiving streams such as Miller Creek recording 80.6-200 ng/L. Midwestern and southern U.S. regions (Kansas, Oklahoma, Oregon, Washington, etc.) exhibited variable levels: rainwater held low background concentrations of 0.002-0.292 μg/L, whereas urban streams like Thornton Creek fluctuated 20.2-85.7 ng/L. Waters in Colorado, Georgia, Michigan, Minnesota, North Carolina, Texas and Virginia mostly retained baseline magnitudes of 0.002-0.158 μg/L, illustrating pollution disparities across cities of different scales.
Canadian datasets covered Ontario, Saskatchewan and British Columbia. Urban runoff and streams (Don River, Highland Creek) in Toronto recorded 0.193-0.981 μg/L 6PPD-Q; nearshore waters along Humber Bay and Toronto Harbour on Lake Ontario ranged 2.42-15.5 ng/L. Road runoff in Saskatoon, Saskatchewan reached 408.5 ng/L, and inflow to bioretention facilities in Vancouver hit 4.3×10³ ng/L. Studies conducted at 45.5°N in southern Canada revealed massive contaminant loads in snowmelt (367 ng/L) and stormwater runoff (593 ng/L) [131,133,134,135,137,139].
Severe sediment enrichment was documented at Lake Sihwa, South Korea, with sedimentary 6PPD-Q up to 330 ng/g and parent 6PPD reaching 340 ng/g, ranking among the world’s most heavily polluted sediment zones. Road runoff in Hong Kong Special Administrative Region contained 2.43 μg/L 6PPD-Q; WWTP influents held 470 ng/L, while effluents still retained 37.3 ng/L, demonstrating the refractory nature of this compound in urban water cycles. Australian sampling concentrated in Queensland and New South Wales. Brisbane River and Coobera Creek water samples contained 0.385-88.4 ng/L and 88.6 ng/L 6PPD-Q, respectively, with surface water baselines across Queensland ranging 0-24.3 ng/L. Deep-sea sediment backgrounds of Australia were extremely low (<3 ng/g), forming a sharp contrast with contaminated nearshore zones.
Although European monitoring data were relatively limited, representative records were obtained. Water samples from Leipzig, Germany recorded 110-428 ng/L, and London, UK recorded 136 ng/L. Influent and effluent concentrations of WWTPs in Malaysia and Sri Lanka were below 0.52 ng/L, reflecting low emission levels in tropical developing countries.
3.5. Aquatic Toxicity and Ecological Risk Assessment of 6PPD and 6PPD-Q Based on Mined Datasets
Using the data mining approaches described in the Materials and Methods section, we screened toxicological data of adult organisms from acute toxicity groups within the model organism toxicity dataset, and categorized the data according to taxonomic ranks (kingdom, phylum, class, order). In total, toxic test data for 26 species of 6PPD and 6PPD-Q were obtained (Figure 5, Table 4A, Table 4B).
Following the compilation of acute toxicity data in Table 4, a total of 26 aquatic model organisms covering multiple trophic levels were categorized into two independent datasets for 6PPD and 6PPD-Q, respectively. Taxonomically, the tested species span Plantae, Rotifera, Arthropoda, Mollusca, Echinodermata and Actinopterygii, representing primary producers, invertebrate consumers and vertebrate predators in typical aquatic food webs. Such a multi-taxa toxicity dataset provides a systematic toxicological basis for intra-group sensitivity comparison, inter-group toxicity discrepancy analysis, and subsequent derivation of predicted no-effect concentrations for global ecological risk assessment.
For the parent compound 6PPD, the dataset contains 14 test species in total. Invertebrates account for the largest proportion at 50.0%, including rotifers, cladocerans, benthic arthropods, gastropods, bivalves and echinoderms. Fish species from Actinopterygii make up 42.9% of the dataset, covering cyprinids, salmonids, adrianichthyids and centrarchids to represent both model laboratory organisms and ecologically relevant wild fish taxa. Only one green algal species Selenastrum capricornutum is included, occupying 7.1% of the 6PPD test panel. In comparison, the 6PPD-Q dataset comprises 12 species with no algal toxicity records available, reflecting an existing research gap in phytoplankton responses to this quinone transformation product. Invertebrates constitute 41.7% of the 6PPD-Q dataset, while fish species take up 58.3%, among which salmonids are the dominant vertebrate group. This taxonomic bias toward salmonids is consistent with widespread field observations of acute mortality events in wild salmon populations exposed to tire wear-impacted urban runoff, which have driven extensive toxicological research on 6PPD-Q in salmonid species.
Intra-group sensitivity analysis reveals distinct tolerance hierarchies within each contaminant dataset. For 6PPD, echinoderm species Arbacia lixula and Paracentrotus lividus exhibit the highest acute sensitivity, with LC₅₀ values as low as 1.0×10³ ng/L, followed by benthic invertebrates including Planorbella pilsbryi, Hyalella azteca and Megalonaias nervosa, all with LC₅₀ values below 2.0×10⁴ ng/L (Figure 6A, Figure 6E, Table 4A). Pelagic filter feeder Daphnia magna shows moderate sensitivity, whereas most fish species display relatively higher tolerance to 6PPD. Selenastrum capricornutum and Brachionus koreana possess the highest EC₅₀/LC₅₀ values among all tested taxa, indicating the lowest acute susceptibility to parent 6PPD. For 6PPD-Q, the sensitivity ranking across invertebrate groups follows a pattern similar to that of 6PPD, with echinoderms remaining the most sensitive invertebrate taxa. However, salmonid fish demonstrate exceptionally high sensitivity to 6PPD-Q, with LC₅₀ values for Oncorhynchus kisutch, Salvelinus fontinalis and Salvelinus namaycush falling within the range of tens to hundreds of nanograms per liter, far lower than those of most invertebrate species. This pronounced species-specific sensitivity highlights the uniquely high toxic potency of 6PPD-Q toward salmonid fish.
Cross-comparison between the two datasets further confirms that the quinone transformation product 6PPD-Q generally exerts stronger acute toxicity than its parent compound 6PPD across shared test species. For species tested under both exposure scenarios, including Daphnia magna, Megalonaias nervosa, Arbacia lixula, Paracentrotus lividus and Danio rerio, 6PPD-Q consistently yields lower LC₅₀/EC₅₀ values than 6PPD, indicating elevated toxic potency after atmospheric oxidation of the parent antioxidant. The toxicity discrepancy is most dramatic in salmonid species: while 6PPD exerts only moderate acute toxicity to salmonids with LC₅₀ values at the level of 10⁵-10⁶ ng/L, 6PPD-Q causes lethal effects at concentrations three to four orders of magnitude lower. This substantial toxicity enhancement verifies that photochemical transformation of tire rubber additives can generate derivatives with drastically elevated ecological hazards, and underscores the necessity of incorporating transformation products into environmental risk evaluation frameworks. Overall, the systematically sorted toxicity dataset and the clarified sensitivity hierarchies across taxa lay a solid quantitative foundation for the calculation of PNEC values and the spatial assessment of aquatic ecological risks of 6PPD and 6PPD-Q at the global scale.
Based on the taxonomic coverage and intra-/inter-group sensitivity hierarchies described above, the acute toxicity dataset of 6PPD meets the taxonomic diversity requirement of at least three phyla and eight classes as specified in the European Union REACH Regulation and ECHA Guidance on Chemical Safety Assessment. Accordingly, a species sensitivity distribution (SSD) model was constructed for 6PPD to derive its 5% hazardous concentration (HC₅) as the quantitative basis for ecological threshold estimation (Eq. S1, Eq. S2, Eq. S3, Eq. S4). In contrast, the available toxicity dataset for 6PPD-Q fails to meet the prerequisites for robust SSD construction due to the absence of primary producer taxa and insufficient taxonomic breadth. Therefore, instead of applying the SSD-based probabilistic derivation approach, the predicted no-effect concentration (PNEC) of 6PPD-Q was derived using the assessment factor method based on the minimum acute toxicity endpoint, which is consistent with conventional risk assessment protocols for data-limited emerging contaminants.
Two distribution functions, Logistics (Eq. S1) and Burr Type III (Eq. S2), were separately applied to construct the species sensitivity distribution (SSD) for aquatic toxicity data of 6PPD. Fitting outputs including characteristic parameters, corresponding parameter standard errors, reduced chi-square (Reduced Chi-Sqr), and adjusted coefficient of determination (adjusted R2) were comprehensively compared to select the optimal fitting model.
For parameter reliability, all estimated characteristic parameters of the Logistics model exhibited smaller standard errors than those obtained from the Burr Type III model. Lower standard errors indicate narrower confidence intervals for parameter estimation, demonstrating that the Logistics distribution delivers more stable and precise parameterization for the 6PPD toxicity dataset. In terms of global goodness-of-fit, the Logistics model achieved a reduced chi-square value of 0.000257, substantially lower than the value of 0.00234 calculated for the Burr Type III model. A smaller reduced chi-square reflects a smaller residual deviation between model predictions and empirical toxicity data. Meanwhile, the Logistics distribution yielded a higher adjusted R2(0.996902) relative to the Burr Type III model (0.988886), which suggests the Logistics function could explain a larger fraction of variance in the species sensitivity data.
Collectively, the Logistics model outperformed the Burr Type III model in parameter stability and overall fitting performance. Therefore, the Logistics distribution was adopted to calculate the hazardous concentration for 5% of aquatic species HC5 of 6PPD (Figure 6A remark). The derived HC5 threshold was further utilized to compute risk quotient (RQ) values for all coastal sampling locations. The spatial variation of aquatic ecological risks is visualized in the global coastal map shown in Figure 6(I). All monitoring sites presented in this map are coastal marine sampling points, and no inland freshwater sampling records were included. High ecological risk regions with elevated RQ values were mainly distributed along the coastlines of South China, peninsular and archipelagic zones of Southeast Asia, as well as the southern coastal areas of Japan and the Republic of Korea, the coastlines of North America also contribute RQ in Figure 6J.
Based on the colour-bar ranges and spatial scatter-point distribution observed in Figure 7, the global risk-quotient (RQ) patterns for the four aquatic species are described as follows. For Daphnia magna (Figure 7A), RQ values spanned 0.000-359.0; specifically, the single highest-risk point was located on the North-American west coast (approximately -123° W, 35-40° N) with an orange-brown colouration corresponding to an RQ of roughly 250-320, whereas the dense clusters across eastern North America and the Great Lakes region (-100° to -70° W, 30-50° N), central-western Europe (0°-20° E, 40-55° N) and East Asia (100°-140° E, 20-45° N) all exhibited cyan-to-light-blue tones indicating moderate RQ values of approximately 80-200, and the few sites in southeastern Australia (140°-150° E, 30-40° S) remained in the low-risk range of 50-120. Risk-related sampling points were thus predominantly clustered within the Northern-Hemisphere mid-latitude belt (20° N-50° N), while nearly all remaining regions across the globe showed negligible risk. For Hexagenia spp. (Figure 7B), the RQ range extended from 0.000 to 454.0; notably, a single bright-red sampling point on the North-American west coast (-123° W, 35-40° N) approached the upper ceiling of approximately 454, representing the most extreme risk value in this panel, while points across the Great Lakes region and eastern North America were mostly green to yellow-green (RQ ≈ 80-250), European sites ranged from green to yellow-green (RQ ≈ 100-280), the dense East-Asian cluster stayed largely in the green band (RQ ≈ 80-200), and the sparse Australian points remained below 150. This taxon shared an identical core high-risk geographic zone with Daphnia magna (Figure 7A), yet displayed generally higher RQ intensities within those mid-latitude hotspots, and no appreciable ecological risk was observed over most parts of the Southern Hemisphere. For Megalonaias nervosa (Figure 7C), the maximum RQ reached 1060, the highest risk ceiling among the four tested organisms; under this reversed colour scale (dark brown = 0, dark green = 1060), a distinct green point on the North-American west coast (-123° W, 35-40° N) indicated an elevated RQ of approximately 600-800, whereas the dense clusters in eastern North America and Europe showed light-brown to orange tones corresponding to RQ values of roughly 200-500, the extensive East-Asian aggregation ranged from light-brown to orange-yellow (RQ ≈ 200-600), and the few Australian sites stayed within 100-300. High-RQ sites remained concentrated inside the 20° N-50° N industrialised mid-latitude band, with substantially amplified risk magnitudes at North-American, European and East-Asian sampling locations, while risk coverage in the Southern Hemisphere remained very limited. For Arbacia lixula (Figure 7D), RQ values fell between 0.000 and 1585; the densest aggregations in eastern North America and the Great Lakes region (-100° to -70° W, 30-50° N) and across East Asia (100°-140° E, 20-45° N) were dominated by red-to-pink colouration indicating RQ values of approximately 300-900, the North-American west-coast cluster (-123° W, 35-45° N) showed deep-red tones with RQ estimates of 400-800, European sites remained in the red band (RQ ≈ 300-600), southeastern Australian points were orange-red (RQ ≈ 200-500), and a single isolated low-risk point near the African equatorial coast (≈ 0°, 0°) fell below 200. Elevated-risk sampling sites were mostly restricted to coastal locations along the Northern-Hemisphere mid-latitude zone, and the Southern Hemisphere, low-latitude tropical zones and high-latitude polar regions contained almost no high-risk observations. Across all four panels, ecological hotspots were consistently locked to the Northern-Hemisphere mid-latitude belt, while a clear upward trend in peak RQ magnitude was visible from Daphnia magna (359.0) < Hexagenia spp. (454.0) < Megalonaias nervosa (1060) < Arbacia lixula (1585), which was aligned with the Table 4B.
Based on the colour-bar ranges and spatial scatter-point distribution observed in Figure 8, the global risk-quotient (RQ) patterns for the four additional aquatic species are described as follows. For Paracentrotus lividus (Figure 8A), RQ values spanned 0.000-2720; specifically, a single yellow-green sampling point on the North-American west coast (approximately-123° W, 35-45° N) represented the highest risk in this panel with an estimated RQ of 2000-2500, whereas the dense clusters across eastern North America and the Great Lakes region (-100° to-70° W, 30-50° N), central-western Europe (0°-20° E, 40-55° N) and East Asia (100°-140° E, 20-45° N) all exhibited blue-to-violet tones indicating low-to-moderate RQ values of approximately 200-800, and the few sites in southeastern Australia (140°-150° E, 30-40° S) remained in the low-risk range below 500. Risk-related sampling points were thus predominantly clustered within the Northern-Hemisphere mid-latitude belt (20° N-50° N), while nearly all remaining regions across the globe showed negligible risk. For Oncorhynchus kisutch (Figure 8B), the RQ range extended from 0.000 to 3.920 × 10⁵; under this colour scale (orange = 0, transitioning through brown and black to deep blue at the maximum), all sampling points across the North-American west coast (-123° W, 35-45° N), the Great Lakes region and eastern North America (-100° to-70° W, 30-50° N), Europe (0°-20° E, 40-55° N), the dense East-Asian aggregation (100°-140° E, 20-45° N) and southeastern Australia (140°-150° E, 30-40° S) remained in the orange-to-light-brown portion of the scale, corresponding to comparatively low RQ estimates of roughly 5 × 10³-8 × 10⁴, with no points approaching the upper ceiling of 3.920 × 10⁵. This species shared an identical core high-risk geographic zone withthe other tested taxa, yet the overall RQ magnitudes remained markedly lower relative to the colour-bar maximum, and no appreciable ecological risk was observed over most parts of the Southern Hemisphere. For Oncorhynchus mykiss (Figure 8C), the maximum RQ reached 1.900 × 10⁴; notably, a single yellow sampling point on the North-American west coast (-123° W, 35-45° N) indicated the most extreme risk value in this panel with an estimated RQ of 1.2 × 10⁴-1.7 × 10⁴, whereas points across the Great Lakes region and eastern North America were mostly cyan-to-blue-green (RQ ≈ 2 × 10³-6 × 10³), European sites ranged from blue-green to cyan (RQ ≈ 2 × 10³-5 × 10³), the dense East-Asian cluster stayed largely in the blue-green band (RQ ≈ 2 × 10³-8 × 10³), and the sparse Australian points remained below 3 × 10³. High-RQ sites remained concentrated inside the 20° N-50° N industrialised mid-latitude band, with substantially amplified risk magnitudes at the North-American west-coast location, while risk coverage in the Southern Hemisphere remained very limited. For Oncorhynchus tshawytscha (Figure 8D), RQ values fell between 0.000 and 232.0; a distinct red sampling point on the North-American west coast (-123° W, 35-45° N) represented the highest risk in this panel with an estimated RQ of 150-200, whereas the dense aggregations in eastern North America and the Great Lakes region (-100° to-70° W, 30-50° N) and across East Asia (100°-140° E, 20-45° N) were dominated by blue-grey to light-blue colouration indicating RQ values of approximately 30-100, European sites remained in the light-blue band (RQ ≈ 30-70), and southeastern Australian points were light blue (RQ ≈ 20-60). Elevated-risk sampling sites were mostly restricted to the North-American west coast within the Northern-Hemisphere mid-latitude zone, and the Southern Hemisphere, low-latitude tropical zones and high-latitude polar regions contained almost no high-risk observations. Across all four panels, ecological hotspots were consistently locked to the Northern-Hemisphere mid-latitude belt, with the North-American west coast repeatedly emerging as the single highest-risk location for every species, while the peak RQ magnitudes varied widely across taxa, ranging from 232.0 in O. tshawytscha to 3.920 × 10⁵ in O. kisutch (Figure 8).
Based on the colour-bar ranges and spatial scatter-point distribution observed in Figure 9, the global risk-quotient (RQ) patterns for the four additional aquatic species are described as follows. For Salvelinus fontinalis (Figure 9A), RQ values spanned 0.000-3.230 × 10⁴; specifically, a single yellow sampling point on the North-American west coast (approximately -123° W, 35-45° N) represented the highest risk in this panel with an estimated RQ of 2.5 × 10⁴-3.0 × 10⁴, whereas the dense clusters across eastern North America and the Great Lakes region (-100° to -70° W, 30-50° N), central-western Europe (0°-20° E, 40-55° N) and East Asia (100°-140° E, 20-45° N) all exhibited cyan-to-blue-green tones indicating low-to-moderate RQ values of approximately 3 × 10³-1.0 × 10⁴, and the few sites in southeastern Australia (140°-150° E, 30-40° S) remained in the low-risk range of 2 × 10³-5 × 10³. Risk-related sampling points were thus predominantly clustered within the Northern-Hemisphere mid-latitude belt (20° N-50° N), while nearly all remaining regions across the globe showed negligible risk. For Salvelinus namaycush(Figure 9B), the RQ range extended from 0.000 to 3.730 × 10⁴; under this colour scale (deep blue = 0, transitioning through cyan and blue-grey to light brown at the maximum), all sampling points across the North-American west coast (-123° W, 35-45° N), the Great Lakes region and eastern North America (-100° to -70° W, 30-50° N), Europe (0°-20° E, 40-55° N), the dense East-Asian aggregation (100°-140° E, 20-45° N) and southeastern Australia (140°-150° E, 30-40° S) remained in the cyan-to-blue-green portion of the scale, corresponding to RQ estimates of roughly 4 × 10³-1.8 × 10⁴, with no points approaching the upper ceiling of 3.730 × 10⁴. This species shared an identical core high-risk geographic zone with the other tested taxa, yet the overall RQ magnitudes remained markedly lower relative to the colour-bar maximum, and no appreciable ecological risk was observed over most parts of the Southern Hemisphere. For Salvelinus leucomaenis (Figure 9C), the maximum RQ reached 1.900 × 10⁴; notably, a single bright-red sampling point on the North-American west coast (-123° W, 35-45° N) indicated the most extreme risk value in this panel with an estimated RQ of 1.2 × 10⁴-1.7 × 10⁴, whereas points across the Great Lakes region and eastern North America were mostly dark red (RQ ≈ 3 × 10³-8 × 10³), European sites ranged from dark red to red (RQ ≈ 3 × 10³-6 × 10³), the dense East-Asian cluster stayed largely in the dark-red band (RQ ≈ 3 × 10³-1.0 × 10⁴), and the sparse Australian points remained below 5 × 10³. High-RQ sites remained concentrated inside the 20° N-50° N industrialised mid-latitude band, with substantially amplified risk magnitudes at the North-American west-coast location, while risk coverage in the Southern Hemisphere remained very limited. For Danio rerio (Figure 9D), RQ values fell between 0.000 and 61.60; a distinct orange-red sampling point on the North-American west coast (-123° W, 35-45° N) represented the highest risk in this panel with an estimated RQ of 40-55, whereas the dense aggregations in eastern North America and the Great Lakes region (-100° to -70° W, 30-50° N) and across East Asia (100°-140° E, 20-45° N) were dominated by orange-red colouration indicating RQ values of approximately 20-50, European sites remained in the orange-red band (RQ ≈ 15-35), and southeastern Australian points were orange-red (RQ ≈ 10-25). Elevated-risk sampling sites were mostly restricted to the North-American west coast and the Northern-Hemisphere mid-latitude zone, and the Southern Hemisphere, low-latitude tropical zones and high-latitude polar regions contained almost no high-risk observations. Across all four panels (Figure 9), ecological hotspots were consistently locked to the Northern-Hemisphere mid-latitude belt, with the North-American west coast repeatedly emerging as the single highest-risk location for every species, while the peak RQ magnitudes varied widely across taxa, ranging from 61.60 in D. rerio to 3.730 × 10⁴ in S. namaycush.
4. Conclusions
We had developed and validated a full-process data mining framework integrating literature retrieval, lexical matching, attention-augmented neural network modelling and tabular data extraction to systematically compile global occurrence records and conduct ecological risk assessment of the tire rubber antioxidant 6PPD and its highly toxic quinone transformation product 6PPD-Q. From an initial corpus of 6360 papers retrieved from the Web of Science, the integrated multi-head attention and MCP contextual analysis model achieved a stable recognition accuracy of 85%-95% for pollutant entities, sampling locations and environmental media, with a table extraction success rate exceeding 90% and a valid cell proportion above 85%, thereby establishing the most comprehensive global 6PPD/Q occurrence dataset to date comprising 217 valid georeferenced sampling records across water, sediment and biotic matrices. The compiled data revealed a pronounced Enrichment in Mid-latitudes (EM) pattern, with 6PPD/Q concentrations forming a distinct high-concentration zone within 30° N-45° N that was positively correlated with population density and traffic intensity. Aquatic concentrations exhibited a unimodal latitudinal distribution peaking at 0.030-0.035 in the 30° N-40° N belt, while sedimentary concentrations peaked at 0.060-0.070 in the 35° N-45° N zone, reflecting the stronger adsorption and long-term accumulation capacity of depositional environments. Regionally, ultra-high hotspots were identified in Los Angeles road runoff (4.10 × 10³-6.10 × 10³ ng/L), Lake Sihwa sediment (6PPD-Q up to 330 ng/g), and urban rivers in Guangzhou (6PPD up to 468 ng/g), whereas remote western China, deep-sea sediments and high-latitude polar regions maintained near-background levels. In biological matrices, a universal concentration hierarchy of urine > serum > blood > breast milk was observed, with 6PPD-Q frequently exceeding parent 6PPD and elevated levels documented in vulnerable groups including pregnant women (urinary 6PPD-Q up to 8.58 × 10³ ng/L) and Parkinson’s disease patients (cerebrospinal fluid 1.19 × 10⁴ ng/L), warranting targeted investigation of neurodevelopmental and metabolic health impacts. Toxicity data compilation across 26 aquatic species demonstrated that 6PPD-Q exerts substantially stronger acute toxicity than parent 6PPD, with the most dramatic discrepancy observed in salmonid fish where 6PPD-Q causes lethality at concentrations three to four orders of magnitude lower than 6PPD. Echinoderms (Arbacia lixula, Paracentrotus lividus) were the most sensitive invertebrate taxa to both compounds, while marked chiral toxicity differences identified S-6PPD-Q (LC₅₀ = 1.66 × 10³ ng/L) as the most potent isomer, providing a precise molecular target for regulatory control. For 6PPD, the Logistics species sensitivity distribution model outperformed Burr Type III in parameter stability and goodness-of-fit (adjusted R² = 0.996902 vs. 0.988886; reduced chi-square = 0.000257 vs. 0.00234), yielding a robust HC₅ threshold for probabilistic risk assessment, whereas 6PPD-Q was evaluated via the assessment factor method (AF = 1000) due to insufficient taxonomic breadth. Global spatial risk quotient (RQ) mapping across 12 aquatic species consistently locked ecological hotspots to the Northern-Hemisphere mid-latitude belt (20° N-50° N), with the North-American west coast (≈ -123° W, 35° N-45° N) repeatedly emerging as the single highest-risk location for every tested taxon. Peak RQ magnitudes varied over five orders of magnitude across species, from 61.60 in Danio rerio to 3.920 × 10⁵ in Oncorhynchus kisutch, underscoring profound interspecific differences in vulnerability and the necessity of species-specific risk benchmarks. Nearly all sampling points in the Southern Hemisphere, low-latitude tropical zones and high-latitude polar regions exhibited negligible risk (RQ ≪ 1), confirming that anthropogenic activity intensity is the dominant driver of 6PPD/Q ecological risk at the global scale.This provides a reusable methodological framework for data-driven environmental occurrence characterization of emerging contaminants, and the compiled global dataset offers quantitative evidence to support regulatory formulation, source control and ecological risk mitigation of tire-derived quinone pollutants. Future work should expand monitoring coverage in underrepresented regions including Africa, South America and Southeast Asia, incorporate chronic and multi-generational toxicity endpoints to refine PNEC derivation, and investigate the environmental fate and combined toxicity of chiral 6PPD-Q isomers and their further transformation products under realistic co-exposure scenarios.
Conflict of Interest Statement
The authors are required to declare whether or not they hold any conflicting interests.
Declaration of Use of Generative AI
During the preparation of this manuscript, the authors used DeepSeek-1.5b for minor and occasional language polishing of the manuscript text, and used Nano Banana to generate partial images for the GA section of this work. All other images in the manuscript are entirely hand-drawn by the authors. After the above-mentioned Generative AI application, the authors have comprehensively reviewed, checked and revised all AI-generated content and the full text of the manuscript. The authors take full responsibility for the accuracy, integrity and originality of all contents, including the AI-polished text and AI-generated partial images in this manuscript.S.
Author Contributions
Yaolin Zhang: Conceptualization, Methodology, Resources, Project administration, Writing - Original draft preparation, Funding acquisition. Pengrong Huang: Data curation. Menghui Li: Visualization, Investigation, Formal analysis, Writing- Reviewing and Editing, Supervision. Xinyan Shao: Data Curation.
Acknowledgments
This overall research was supported by Jinan University Guangdong Provincial Innovation Project (Position no. S202510559074). Dr. Menghui Li was supported by the University of Chinese Academy of Sciences. In the meanwhile, the authors thank the editors and the reviewers. We thank the Clifford Community Library provide a necessary place for us to discuss and upgrade our methodology. We thank the Ziyue Jiang from SUSTech.
References
- Pan, S.; Zhang, L.; Zhang, J.; Li, X.; Hou, L.; Tu, X. Layer-adaptive structured pruning guided by latency. arXiv Available at. 2023, arXiv:2305.14403. [cs.CV]. (accessed on 23 July 2026). [Google Scholar] [CrossRef]
- Fedus, W.; Zoph, B.; Shazeer, N. Switch transformers: scaling to trillion parameter models with simple and efficient sparsity. J. Mach. Learn. Res. 2022, 23(1): Article(No. 120), 5232–5270. [Google Scholar] [CrossRef]
- Wang, A.; Singh, A.; Michael, J.; Hill, F.; Levy, O.; Bowman, S.R. GLUE: a multi-task benchmark and analysis platform for natural language understanding. In Proceedings of the 2018 EMNLP Workshop BlackboxNLP: Analyzing and Interpreting Neural Networks for NLP, Brussels, Belgium, November 2018; pp. 353–355. [Google Scholar]
- Lin, T.-Y.; Maire, M.; Belongie, S.; Hays, J.; Perona, P.; Ramanan, D.; et al. Microsoft COCO: common objects in context. In Proceedings of the 13th European Conference on Computer Vision (ECCV 2014), Zurich, Switzerland, 6-12 September 2014; pp. 740–755. [Google Scholar]
- Lu, P.; Mishra, S.; Xia, T.; Qiu, L.; Chang, K.-W.; Zhu, S.-C.; et al. Learn to explain: multimodal reasoning via thought chains for science question answering. Adv. Neural Inf. Process. Syst. 35 (NeurIPS 2022) 2022, 2507–2521. [Google Scholar] [CrossRef]
- Touvron, H.; Martin, L.; Stone, K.; Albert, P.; Almahairi, A.; Babaei, Y.; et al. Llama 2: open foundation and fine-tuned chat models. arXiv Available at. 2023, arXiv:2307.09288. [cs.CL]. (accessed on 23 July 2026). [Google Scholar] [CrossRef]
- OpenAI; Achiam, J.; Adler, S.; Agarwal, S.; Ahmad, L.; Akkaya, I.; et al. GPT-4 Technical Report. arXiv. 2023. [CrossRef]
- Lepikhin, D.; Lee, H.; Xu, Y.; Chen, D.; Firat, O.; Huang, Y.; et al. GShard: Scaling Giant Models with Conditional Computation and Automatic Sharding. arXiv. 2020. [CrossRef]
- Chua, K.; Calandra, R.; McAllister, R.T.; Levine, S. Deep Reinforcement Learning in a Handful of Trials using Probabilistic Dynamics Models. In Proceedings of the 32nd International Conference on Neural Information Processing Systems (NIPS’18), Montréal, Canada, December 2018; pp. 4759–4770. [Google Scholar]
- Huang, J.; Cheng, F.; He, L.; Lou, X.; Li, H.; You, J. Effect driven prioritization of contaminants in wastewater treatment plants across China: A data mining-based toxicity screening approach. Water Res. 2024, 264, 122223. [Google Scholar] [CrossRef]
- Lillicrap, T.P.; Hunt, J.J.; Pritzel, A.; Heess, N.; Erez, T.; Tassa, Y.; et al. Continuous Control with Deep Reinforcement Learning. In Proceedings of the 4th International Conference on Learning Representations (ICLR’16), San Juan, Puerto Rico, 2-4 May 2016. [Google Scholar]
- Raffel, C.; Shazeer, N.; Roberts, A.; Lee, K.; Narang, S.; Matena, M.; et al. Exploring the limits of transfer learning with a unified text-to-text transformer. J. Mach. Learn. Res. 2020, 21(140), 1–67. [Google Scholar]
- Zhang, Z.; Zhang, A.; Li, M.; Smola, A. Automatic Chain of Thought Prompting in Large Language Models. arXiv. Available at. 2022. (accessed on 23 July 2026). [CrossRef]
- Rao, Y.; Zhao, W.; Liu, B.; Lu, J.; Hsieh, C.J. DynamicViT: Efficient Vision Transformers with Dynamic Token Sparsification. arXiv. Available at. 2021. (accessed on 23 July 2026). [CrossRef]
- Lin, J.; Tang, J.; Tang, H.; Yang, S.; Xiao, G.; Han, S. AWQ: Activation-aware Weight Quantization for On-Device LLM Compression and Acceleration. GetMobile Mob. Comput. Commun. 2025, 28(4), 12–17. [Google Scholar] [CrossRef]
- Dai, X.; Chen, Y.; Xiao, B.; Chen, D.; Liu, M.; Yuan, L.; et al. Dynamic Head: Unifying Object Detection Heads with Attentions. arXiv. Available at. 2021. (accessed on 23 July 2026). [CrossRef]
- Abadi, M.; Barham, P.; Chen, J.; Chen, Z.; Davis, A.; Dean, J.; et al. TensorFlow: a system for large-scale machine learning. In Proceedings of the 12th USENIX Conference on Operating Systems Design and Implementation (OSDI’16), Savannah, GA, USA, 2-4 November 2016; pp. 265–283. [Google Scholar]
- Gemini Team Google, Gemini: A Family of Highly Capable Multimodal Models. Available at. 2023. (accessed on 23 July 2026). [CrossRef]
- Choi, K.H.; Na, S. GeminiPro at SemEval-2024 Task 9: BrainTeaser on Gemini. In Proceedings of the 18th International Workshop on Semantic Evaluation (SemEval-2024), Mexico City, Mexico, June 2024; pp. 1602–1606. [Google Scholar] [CrossRef]
- Guo, X.; Che, Y.; Zheng, Z.; Sun, J. Multi-timescale optimization scheduling of interconnected data centers based on model predictive control. Front. Energy 2024, 18, 28–41. [Google Scholar] [CrossRef]
- Hoffmann, J.; Borgeaud, S.; Mensch, A.; Buchatskaya, E.; Cai, T.; Rutherford, E.; et al. Training compute-optimal large language models. In Proceedings of the 36th International Conference on Neural Information Processing Systems (NeurIPS’22), New Orleans, LA, USA, 28 November-9 December 2022; pp. 30016–30030. [Google Scholar]
- Jitkrittum, W.; Narasimhan, H.K.; Rawat, A.S.; Juneja, J.; Wang, C.; Wang, Z.; et al. Universal Model Routing for Efficient LLM Inference. arXiv Available at. 2025, arXiv:2502.08773. [cs.CL, cs.LG]. (accessed on 23 July 2026). [Google Scholar] [CrossRef]
- Kamthe, S.; Deisenroth, M.P. Data-Efficient Reinforcement Learning with Probabilistic Model Predictive Control. In Proceedings of the 21st International Conference on Artificial Intelligence and Statistics (AISTATS), PMLR, 2018; 84, pp. 1710–1718. [Google Scholar]
- Liu, Z.; Hu, H.; Lin, Y.; Yao, Z.; Xie, Z.; Wei, Y.; et al. Swin Transformer V2: Scaling Up Capacity and Resolution. In Proceedings of the 2022 IEEE/CVF Conference on Computer Vision and Pattern Recognition (CVPR), New Orleans, LA, USA, June 2022; pp. 11999–12009. [Google Scholar] [CrossRef]
- Liu, H.; Li, C.; Li, Y.; Li, B.; Zhang, Y.; Shen, S.; et al. LLaVA-NeXT: Improved reasoning, OCR, and world knowledge. LLaVA Project Blog. 30 January 2024. Available online: https://llava-vl.github.io/blog/2024-01-30-llava-next/ (accessed on 23 July 2026).
- Lu, H.; Chu, B.; Fu, W.; Nan, G.; Liu, J.; Pan, M.; et al. Reallocating Attention Across Layers to Reduce Multimodal Hallucination. arXiv Available at. 2025, arXiv:2510.10285. [cs.AI]. (accessed on 23 July 2026). [Google Scholar] [CrossRef]
- Singh, A.; Fry, A.; Perelman, A.; Tart, A.; Ganesh, A.; El-Kishky, A.; et al. OpenAI GPT-5 System Card. arXiv Available at. 2025, arXiv:2601.03267. [cs.CL, cs.AI]. (accessed on 23 July 2026). [Google Scholar] [CrossRef]
- Wei, T.; Zhu, B.; Zhao, L.; Cheng, C.; Li, B.; Lü, W.; et al. Skywork-MoE: A Deep Dive into Training Techniques for Mixture-of-Experts Language Models. arXiv Available at. 2024, arXiv:2406.06563. [cs.CL, cs.AI]. (accessed on 23 July 2026). [Google Scholar] [CrossRef]
- Maringer, L.; Roiser, L.; Wallner, G.; Nitsche, D.; Buchberger, W. The role of quinoid derivatives in the UV-initiated synergistic interaction mechanism of HALS and phenolic antioxidants. Polym. Degrad. Stab. 2016, 131, 91–97. [Google Scholar] [CrossRef]
- Yan, X.; Kiki, C.; Xu, Z.; Manzi, H.P.; Rashid, A.; Chen, T.; et al. Comparative growth inhibition of 6PPD and 6PPD-Q on microalgae Selenastrum capricornutum, with insights into 6PPD-induced phototoxicity and oxidative stress. Sci. Total Environ. 2024, 957, 177627. [Google Scholar] [CrossRef]
- Maji, U.J.; Kim, K.; Yeo, I.-C.; Shim, K.-Y.; Jeong, C.-B. Toxicological effects of tire rubber-derived 6PPD-quinone, a species-specific toxicant, and dithiobisbenzanilide (DTBBA) in the marine rotifer Brachionus koreanus. Mar. Pollut. Bull. 2023, 192, 115002. [Google Scholar] [CrossRef]
- Prosser, R.S.; Salole, J.; Hang, S. Toxicity of 6PPD-quinone to four freshwater invertebrate species. Environ. Pollut. 2023, 337, 122512. [Google Scholar] [CrossRef]
- Calle, L.; Le Du-Carrée, J.; Martínez, I.; Sarih, S.; Montero, D.; Gómez, M.; et al. Toxicity of tire rubber-derived pollutants 6PPD-quinone and 4-tert-octylphenol on marine plankton. J. Hazard. Mater. 2025, 484, 136694. [Google Scholar] [CrossRef]
- Lo, B.P.; Marlatt, V.L.; Liao, X.; Reger, S.; Gallilee, C.; Ross, A.R.S.; et al. Acute toxicity of 6PPD-quinone to early life stage juvenile Chinook (Oncorhynchus tshawytscha) and Coho (Oncorhynchus kisutch) salmon. Environ. Toxicol. Chem. 2023, 42(4), 815–822. [Google Scholar] [CrossRef]
- Hiki, K.; Yamamoto, H. The tire-derived chemical 6PPD-quinone is lethally toxic to the white-spotted char Salvelinus leucomaenis pluvius but not to two other salmonid species. Environ. Sci. Technol. Lett. 2022, 9(12), 1050–1055. [Google Scholar] [CrossRef]
- Philibert, D.; Stanton, R.S.; Tang, C.; Stock, N.L.; Benfey, T.; Pirrung, M.; et al. The lethal and sublethal impacts of two tire rubber-derived chemicals on brook trout (Salvelinus fontinalis) fry and fingerlings. Chemosphere 2024, 360, 142319. [Google Scholar] [CrossRef]
- Roberts, C.; Lin, J.; Kohlman, E.; Jain, N.; Amekor, M.; Alcaraz, A.J.; et al. Acute and subchronic toxicity of 6PPD-quinone to early life stage lake trout (Salvelinus namaycush). Environ. Sci. Technol. 2025, 59(1), 1791–1797. [Google Scholar] [CrossRef]
- Di, S.; Liu, Z.; Zhao, H.; Li, Y.; Qi, P.; Wang, Z.; et al. Chiral perspective evaluations: Enantioselective hydrolysis of 6PPD and 6PPD-quinone in water and enantioselective toxicity to Gobiocypris rarus and Oncorhynchus mykiss. Environ. Int. 2022, 166, 107374. [Google Scholar] [CrossRef]
- Greer, J.B.; Dalsky, E.M.; Lane, R.F.; Hansen, J.D. Establishing an in vitro model to assess the toxicity of 6PPD-quinone and other tire wear transformation products. Environ. Sci. Technol. Lett. 2023, 10(6), 533–537. [Google Scholar] [CrossRef]
- United States Environmental Protection Agency. Ecological Effects Test Guidelines OPPTS 850.1075: Fish Acute Toxicity Test, Freshwater and Marine (EPA 712-C-96-118); United States Environmental Protection Agency. Washington, DC, USA, April 1996.
- Brinkmann, M.; Montgomery, D.; Selinger, S.; Miller, J.G.P.; Stock, E.; Alcaraz, A.J.; et al. Acute toxicity of the tire rubber-derived chemical 6PPD-quinone to four fishes of commercial, cultural, and ecological importance. Environ. Sci. Technol. Lett. 2022, 9(4), 333–338. [Google Scholar] [CrossRef]
- Liao, X.-L.; Chen, Z.-F.; Ou, S.-P.; Liu, Q.-Y.; Lin, S.-H.; Zhou, J.-M.; et al. Neurological impairment is crucial for tire rubber-derived contaminant 6PPDQ-induced acute toxicity to rainbow trout. Sci. Bull. 2024, 69(5), 621–635. [Google Scholar] [CrossRef]
- Prosser, R.S.; Gillis, P.L.; Holman, E.A.M.; Schissler, D.; Ikert, H.; Toito, J.; et al. Effect of substituted phenylamine antioxidants on three life stages of the freshwater mussel Lampsilis siliquoidea. Environ. Pollut. 2017, 229, 281–289. [Google Scholar] [CrossRef]
- Rao, C.; Chu, F.; Fang, F.; Xiang, D.; Xian, B.; Liu, X.; et al. Toxic effects and comparison of common amino antioxidants (AAOs) in the environment on zebrafish: A comprehensive analysis based on cells, embryos, and adult fish. Sci. Total Environ. 2024, 924, 171678. [Google Scholar] [CrossRef]
- Geng, N.; Hou, S.; Sun, S.; Rong, C.; Zhang, H.; Lu, X.; et al. A nationwide investigation of substituted p-phenylenediamines (PPDs) and PPD-quinones in the riverine waters of China. Environ. Sci. Technol. 2025, 59(6), 3183–3192. [Google Scholar] [CrossRef]
- Shi, C.; Wu, F.; Zhao, Z.; Ye, T.; Luo, X.; Wu, Y.; et al. Effects of environmental concentrations of 6PPD and its quinone metabolite on the growth and reproduction of freshwater cladoceran. Sci. Total Environ. 2024, 948, 175018. [Google Scholar] [CrossRef]
- Shi, R.; Zhang, Z.; Zeb, A.; Fu, X.; Shi, X.; Liu, J.; et al. Environmental occurrence, fate, human exposure, and human health risks of p-phenylenediamines and their quinones. Sci. Total Environ. 2024, 957, 177742. [Google Scholar] [CrossRef]
- Wang, J.; Li, Y.; Nie, C.; Liu, J.; Zeng, J.; Tian, M.; et al. Occurrence, fate and chiral signatures of p-phenylenediamines and their quinones in wastewater treatment plants, China. Water Res. 2025, 276, 123272. [Google Scholar] [CrossRef]
- Somepalli, K.; Andaluri, G. Spatiotemporal distribution and environmental risk assessment of 6PPDQ in the Schuylkill River. Emerg. Contam. 2025, 11(2), 100501. [Google Scholar] [CrossRef]
- Chen, X.; Sun, S.; Xu, P.; Du, L.; Sun, C.; Feng, F.; et al. Rubber additives and relevant oxidation products in groundwater in a central China region: Levels, influencing factors and exposure. Environ. Pollut. 2024, 363(Part 1), 125155. [Google Scholar] [CrossRef]
- Zhou, L.; Liu, S.; Wang, M.; Wu, N.; Xu, R.; Wei, L.; et al. Nationwide occurrence and prioritization of tire additives and their transformation products in lake sediments of China. Environ. Int. 2024, 193, 109139. [Google Scholar] [CrossRef]
- Jin, R.; Venier, M.; Chen, Q.; Yang, J.; Liu, M.; Wu, Y. Amino antioxidants: A review of their environmental behavior, human exposure, and aquatic toxicity. Chemosphere 2023, 317, 137913. [Google Scholar] [CrossRef]
- Liu, Y.; Mei, Y.; Liang, X.; Yu, Z.; Huang, Z.; Zhang, H.; et al. Small-intensity rainfall triggers greater contamination of rubber-derived chemicals in road stormwater runoff from various functional areas in megalopolis cities. Environ. Sci. Technol. 2024, 58(29), 13056–13064. [Google Scholar] [CrossRef]
- Xie, L.; Yuan, L.; Sun, J.; Yang, M.; Khan, I.; Lopez, J.; et al. Compound class-specific temporal trends (2021-2023) of tire wear compounds in suspended solids from Toronto wastewater treatment plants. ACS ES&T Water 2024, 4(12), 5708–5719. [Google Scholar] [CrossRef]
- Cao, G.; Wang, W.; Zhang, J.; Wu, P.; Qiao, H.; Li, H.; et al. Occurrence and fate of substituted p-phenylenediamine-derived quinones in Hong Kong wastewater treatment plants. Environ. Sci. Technol. 2023, 57(41), 15635–15643. [Google Scholar] [CrossRef]
- Zhu, J.; Guo, R.; Ren, F.; Jiang, S.; Jin, H. p-Phenylenediamine Derivatives in Tap Water: Implications for Human Exposure. Water 2024, 16(8), 1128. [Google Scholar] [CrossRef]
- Ren, S.; Xia, Y.; Wang, X.; Zou, Y.; Li, Z.; Man, M.; et al. Development and application of diffusive gradients in thin-films for in-situ monitoring of 6PPD-Quinone in urban waters. Water Res. 2024, 266, 122408. [Google Scholar] [CrossRef]
- Black, G.; Parsia, M.; Uychutin, M.; Lane, R.; Orlando, J.; Hladik, M. 6PPD-quinone in water from the San Francisco-San Joaquin Delta, California, 2018-2024. Environ. Monit. Assess. 2025, 197, 369. [Google Scholar] [CrossRef]
- Seiwert, B.; Nihemaiti, M.; Troussier, M.; Weyrauch, S.; Reemtsma, T. Abiotic oxidative transformation of 6-PPD and 6-PPD quinone from tires and occurrence of their products in snow from urban roads and in municipal wastewater. Water Res. 2022, 212, 118122. [Google Scholar] [CrossRef]
- Rodgers, T.; Wang, Y.; Humes, C.; Jeronimo, M.; Johannessen, C.; Spraakman, S.; et al. Bioretention cells provide a 10-fold reduction in 6PPD-quinone mass loadings to receiving waters: evidence from a field experiment and modeling. Environ. Sci. Technol. Lett. 2023, 10(7), 582–588. [Google Scholar] [CrossRef]
- Choi, M.; Kim, S.; Hyun, M. Development of a quantitative analytical method for 6PPD, a harmful tire antioxidant, in biological samples for toxicity assessment. Ecotoxicol. Environ. Saf. 2025, 296, 118171. [Google Scholar] [CrossRef]
- Zhang, H.; Huang, Z.; Liu, Y.; Hu, L.; He, L.; Liu, Y.; et al. Occurrence and risks of 23 tire additives and their transformation products in an urban water system. Environ. Int. 2023, 171, 107715. [Google Scholar] [CrossRef]
- Wan, X.; Liang, G.; Wang, D. Potential human health risk of the emerging environmental contaminant 6-PPD quinone. Sci. Total Environ. 2024, 949, 175057. [Google Scholar] [CrossRef]
- Zhang, R.; Zhao, S.; Liu, X.; Tian, L.; Mo, Y.; Yi, X.; et al. Aquatic environmental fates and risks of benzotriazoles, benzothiazoles, and p-phenylenediamines in a catchment providing water to a megacity of China. Environ. Res. 2023, 216(Part 4), 114721. [Google Scholar] [CrossRef]
- Yu, W.; Tang, S.; Wong, J.; Luo, Z.; Li, Z.; Thai, P.; et al. Degradation and detoxification of 6PPD-quinone in water by ultraviolet-activated peroxymonosulfate: Mechanisms, byproducts, and impact on sediment microbial community. Water Res. 2024, 263, 122210. [Google Scholar] [CrossRef]
- Johannessen, C.; Metcalfe, C. The occurrence of tire wear compounds and their transformation products in municipal wastewater and drinking water treatment plants. Environ. Monit. Assess. 2022, 194, 731. [Google Scholar] [CrossRef]
- Klauschies, T.; Isanta-Navarro, J. The joint effects of salt and 6PPD contamination on a freshwater herbivore. Sci. Total Environ. 2022, 829, 154675. [Google Scholar] [CrossRef]
- Zeng, L.; Li, Y.; Sun, Y.; Liu, L.; Shen, M.; Du, B. Widespread occurrence and transport of p-phenylenediamines and their quinones in sediments across urban rivers, estuaries, coasts, and deep-sea regions. Environ. Sci. Technol. 2023, 57(6), 2393–2403. [Google Scholar] [CrossRef]
- Pan, S.; Zhang, L.; Zhang, J.; Li, X.; Hou, L.; Tu, X. Layer-adaptive structured pruning guided by latency. arXiv Available at. 2023, arXiv:2305.14403. [cs.CV]. (accessed on 23 July 2026). [Google Scholar] [CrossRef]
- Grabska-Gradzińska, I.; Szelążek, M.; Bobek, S.; Nalepa, G.J. Visual patterns in an interactive app for analysis based on control charts and SHAP values, Artificial Intelligence. ECAI 2023 Int. Work. Commun. Comput. Inf. Sci. (CCIS) 2024, 1948, 48–59. [Google Scholar] [CrossRef]
- Andreicut, M. A brief introduction to transformers as language models. SSRN Electron. J. Available at. 2023. (accessed on 23 July 2026). [Google Scholar] [CrossRef]
- Xu, P.; Zhu, X.; Clifton, D.A. Multimodal learning with transformers: A survey. IEEE Trans. Pattern Anal. Mach. Intell. 2023, 45(10), 12113–12132. [Google Scholar] [CrossRef]
- LLaVA-VL Team, LLaVA-NeXT [online code repository]. Available online: https://github.com/LLaVA-VL/LLaVA-NeXT. (accessed on 23 July 2026).
- Chi, J.; Karn, U.; Zhan, H.; Smith, E.; Rando, J.; Zhang, Y.; et al. Llama Guard 3 Vision: Safeguarding Human-AI Image Understanding Conversations. arXiv Available at. 2024, arXiv:2411.10414. [cs.CV, cs.CL]. (accessed on 23 July 2026). [Google Scholar] [CrossRef]
- Carolan, K.; Fennelly, L.; Smeaton, A.F. A review of multi-modal large language and vision models. arXiv Available at. 2024, arXiv:2404.01322. [cs.CL, cs.AI]. (accessed on 23 July 2026). [Google Scholar] [CrossRef]
- Chu, X.; Su, J.; Zhang, B.; Shen, C. VisionLLaMA: A unified LLaMA backbone for vision tasks. arXiv Available at. 2024, arXiv:2403.00522. [cs.CV]. (accessed on 23 July 2026). [Google Scholar] [CrossRef]
- Liu, H.; Li, C.; Wu, Q.; Lee, Y.J. Visual instruction tuning. Available at. 2023. (accessed on 23 July 2026). [Google Scholar] [CrossRef]
- Fu, X.; Hu, Y.; Li, B.; Li, B.; Feng, Y.; Wang, H.; et al. BLINK: Multimodal large language models can see but not perceive. In Proceedings of the 18th European Conference on Computer Vision (ECCV 2024), Milan, Italy, September 2024; pp. 148–166. [Google Scholar] [CrossRef]
- Shah, S.; Tembhurne, J. Object detection using convolutional neural networks and transformer-based models: a review. J. Electr. Syst. Inf. Technol. 2023, 10(1), 54. [Google Scholar] [CrossRef]
- Li, Y.; Miao, N.; Ma, L.; Shuang, F.; Huang, X. Transformer for object detection: Review and benchmark. Eng. Appl. Artif. Intell. 2023, 126(Part C), 107021. [Google Scholar] [CrossRef]
- Shehzadi, T.; Hashmi, K.A.; Liwicki, M.; Stricker, D.; Afzal, M.Z. Object detection with transformers: A review. Sensors 2025, 25(19), 6025. [Google Scholar] [CrossRef]
- Relavandi, A.M.; Rashidi, S.; Boussaid, F.; Hoefs, S.; Akbas, E.; Bennamoun, M. Transformers in small object detection: A benchmark and survey of state-of-the-art. ACM Comput. Surv. 2025, 58(3), 64. [Google Scholar] [CrossRef]
- Jamil, S.; Piran, M.J.; Kwon, O.-J. A comprehensive survey of transformers for computer vision. Drones 2023, 7(5), 287. [Google Scholar] [CrossRef]
- Tang, C.; Abbattematteo, B.; Hu, J.; Chandra, R.; Martín-Martín, R.; Stone, P. Deep reinforcement learning for robotics: A survey of real-world successes. Annu. Rev. Control Robot. Auton. Syst. 2025, 8, 153–188. [Google Scholar] [CrossRef]
- Liu, Q. Deep reinforcement learning for motion control algorithms in robotics, Proceedings of the 2nd International Conference on Artificial Intelligence, Database and Machine Learning (AIDML 2024). Trans. Comput. Sci. Intell. Syst. Res. 2024, 5, 390–396. [Google Scholar] [CrossRef]
- Wang, Z. Research on Intelligent Decision-Making of Robots Based on Neural Network and Experience Playback. In Proceedings of the 2024 IEEE 4th International Conference on Electronic Technology, Communication and Information (ICETCI), Changchun, China, 2024; pp. 1003–1008. [Google Scholar] [CrossRef]
- Pan, Z.; Zhou, J.; Fan, Q.; Feng, Z.; Gao, X.; Su, M. Robotic Control Mechanism Based on Deep Reinforcement Learning. In Proceedings of the 2023 2nd International Symposium on Control Engineering and Robotics (ISCER), Hangzhou, China, 2023; pp. 70–74. [Google Scholar] [CrossRef]
- Sekkat, H.; Moutik, O.; Ourabah, L.; Elkari, B.; Chaibi, Y.; Tchakoucht, T.A. Review of reinforcement learning for robotic grasping: Analysis and recommendations. Stat. Optim. Inf. Comput. 2024, 12(2), 571–601. [Google Scholar] [CrossRef]
- Saleem, M.H.; Mfarrej, M.F.B.; Khan, K.A.; Alharthy, S.A. Emerging trends in wastewater treatment: Addressing microorganic pollutants and environmental impacts. Sci. Total Environ. 2024, 913, 169755. [Google Scholar] [CrossRef]
- Pandit, J.; Sharma, A.K. Advanced Techniques in Wastewater Treatment: A Comprehensive Review. Asian J. Environ. Ecol. 2024, 23(10), 1–26. [Google Scholar] [CrossRef]
- El Hammoudani, Y.; Dimane, F.; Haboubi, K.; Benaissa, C.; Benaabidate, L.; Bourjila, A.; et al. Micropollutants in wastewater treatment plants: A bibliometric - bibliographic study. Desalin. Water Treat. 2024, 317, 100190. [Google Scholar] [CrossRef]
- Yadav, P.; Singh, R.P.; Singh, G.; Verma, H.; Singh, S.K.; Dahiya, P.; et al. Contamination removal from waste water using electrochemical approaches. Adv. Chem. Pollut. Environ. Manag. Prot. 2024, Vol. 10, 261–273. [Google Scholar] [CrossRef]
- Elias, A.M.; Meda, G.; Tanzil, K. Recent Progress in Sustainable Treatment Technologies for the Removal of Emerging Contaminants from Wastewater: A Review on Occurrence, Global Status and Impact on Biota. Rev. Environ. Contam. Toxicol. 2024, 262, 16. [Google Scholar] [CrossRef]
- Corpus, R.M.B.; Bayani, M.S.; Aguilar, J.L.; Aguilar, J.C.B.; Aguilar, H.B. Emerging pollutants in waste water: Challenges and advancements in treatment technology. IOP Conf. Ser. Earth Environ. Sci. 2024, 1372, 012037. [Google Scholar] [CrossRef]
- Bi, J.; Dong, G. Wastewater Treatment: Functional Materials and Advanced Technology. Molecules 2024, 29(9), 2150. [Google Scholar] [CrossRef]
- Xu, S.; Luo, Y.; Dauwels, J.; Khong, A.; Wang, Z.; Chen, Q.; et al. LGM³A ‘24: The 2nd Workshop on Large Generative Models Meet Multimodal Applications. In Proceedings of the 2nd Workshop on Large Generative Models Meet Multimodal Applications (LGM³A ‘24), Melbourne, VIC, Australia, 2024; pp. 1–3. [Google Scholar] [CrossRef]
- Li, C. Large Multimodal Models: Notes on CVPR 2023 Tutorial. arXiv. 2023. [CrossRef]
- Akhtar, Z.B. Unveiling the evolution of generative AI (GAI): a comprehensive and investigative analysis toward LLM models (2021-2024) and beyond. J. Electr. Syst. Inf. Technol. 2024, 11, 22. [Google Scholar] [CrossRef]
- Weerakoon, W.M.T.D.N.; Jayathilaka, N.; Seneviratne, K.N. Water quality and wastewater treatment for human health and environmental safety; in Metagenomics to Bioremediation: Applications, Cutting Edge Tools, and Future Outlook (Developments in Applied Microbiology and Biotechnology); Academic Press, 2023; pp. 357–378. [Google Scholar] [CrossRef]
- Tripathy, P.; Juneja, C.; Sharma, A.; Prakash, O.; Pal, S. Tracing the pathways: the journey of emerging contaminants from wastewater into the environment; in Detection and Treatment of Emerging Contaminants in Wastewater; IWA Publishing, 2024. [Google Scholar] [CrossRef]
- Jarvis, A.; Prossner, K.; Schnitker, B.; Gallagher, K. Derivation of acute aquatic life screening values for 6PPD and 6PPD-quinone in freshwaters by USEPA Office of Water. Environ. Toxicol. Chem. 2025, 44(11), 3109–3117. [Google Scholar] [CrossRef]
- Wang, B.; Sun, W.; Ye, X.; Liu, Z.; Zhang, H. Occurrence, analytical methods, and ecotoxicological effects of 6PPD-Quinone in aquatic environments: A review. TrAC Trends Anal. Chem. 2025, 193, 118449. [Google Scholar] [CrossRef]
- Li, C.; Yang, Y.; Tian, Z.; Huang, Z.; Huang, Y.; Hong, Y. Residues of 6PPD-Q in the Aquatic Environment and Toxicity to Aquatic Organisms: A Review. Fishes 2025, 10(4), 146. [Google Scholar] [CrossRef]
- Zhang, X.; Shi, R.; Shi, X.; Du, J.; He, Y.; Liu, W. Ecotoxicity of 6PPD and 6PPD-Q in aquatic ecosystems: Mechanisms, influencing factors, and mitigation strategies. J. Hazard. Mater. 2026, 501, 140856. [Google Scholar] [CrossRef]
- United States Environmental Protection Agency (EPA). 6PPD-quinone; U.S. Environmental Protection Agency. 2025. Available online: https://www.epa.gov/chemical-research/6ppd-quinone. (accessed on 23 July 2026).
- Foldvik, A.; Kryuchkov, F.; Ulvan, E.M.; Sandodden, R.; Kvingedal, E. Acute Toxicity Testing of Pink Salmon (Oncorhynchus gorbuscha) with the Tire Rubber-Derived Chemical 6PPD-Quinone. Environ. Toxicol. Chem. 2024, 43(6), 1332–1338. [Google Scholar] [CrossRef]
- Jankowski, M.D.; Carpenter, A.F.; Harrill, J.A.; Harris, F.R.; Hill, B.; Labiosa, R.; et al. Bioactivity of the ubiquitous tire preservative 6PPD and degradant, 6PPD-quinone in fish- and mammalian-based assays. Toxicol. Sci. 2025, 204(2), 198–217. [Google Scholar] [CrossRef]
- Yi, J.; Ruan, J.; Yu, H.; Wu, B.; Zhao, J.; Wang, H.; et al. Environmental fate, toxicity, and mitigation of 6PPD and 6PPD-Quinone: Current understanding and future directions. Environ. Pollut. 2025, 375, 126352. [Google Scholar] [CrossRef]
- Liang, Y.; Zhu, F.; Li, J.; Wan, X.; Ge, Y.; Liang, G.; et al. P-phenylenediamine antioxidants and their quinone derivatives: A review of their environmental occurrence, accessibility, potential toxicity, and human exposure. Sci. Total Environ. 2024, 948, 174449. [Google Scholar] [CrossRef]
- Wang, W.; Cao, G.; Zhang, J.; Qiao, H.; Li, H.; Yang, B.; et al. UV-induced photodegradation of emerging para-phenylenediamine quinones in aqueous environment: Kinetics, products identification and toxicity assessments. J. Hazard. Mater. 2024, 465, 133427. [Google Scholar] [CrossRef]
- Wang, B.; Xu, Z.; Dong, B. Occurrence, fate, and ecological risk of antibiotics in wastewater treatment plants in China: A review. J. Hazard. Mater. 2024, 469, 133925. [Google Scholar] [CrossRef]
- Li, Z.-M.; Kannan, K. Mass Loading, Removal, and Emission of 1,3-Diphenylguanidine, Benzotriazole, Benzothiazole, N-(1,3-Dimethylbutyl)-N-phenyl-p-phenylenediamine, and Their Derivatives in a Wastewater Treatment Plant in New York State, USA. ACS ES&T Water 2024, 4(6), 2721–2730. [Google Scholar] [CrossRef]
- Wang, W.; Cao, G.; Zhang, J.; Chang, W.; Sang, Y.; Cai, Z. Fragmentation Pattern-Based Screening Strategy Combining Diagnostic Ion and Neutral Loss Uncovered Novel para-Phenylenediamine Quinone Contaminants in the Environment. Environ. Sci. Technol. 2024, 58(13), 5921–5931. [Google Scholar] [CrossRef]
- Zhang, S.; Jin, R.; Mao, T.; Liu, W. Research Progress on Detection Methods, Environmental Distribution, and Toxic Effects of p-Phenylenediamine Antioxidants. Res. Eco-Environ. Damage 2025, 1(1), 1–24. [Google Scholar] [CrossRef]
- Zhu, J.; Guo, R.; Ren, F.; Jiang, S.; Jin, H. Occurrence and partitioning of p-phenylenediamine antioxidants and their quinone derivatives in water and sediment. Sci. Total Environ. 2024, 914, 170046. [Google Scholar] [CrossRef]
- Miao, Z.; Zhao, Z.; Song, X.; Zhu, J.; Guo, R.; Jin, H. Presence of N, N’-substituted p-phenylenediamine quinones in Tap Water: Implication for human exposure. Environ. Res. 2024, 262(Part 1), 119817. [Google Scholar] [CrossRef]
- Chen, X.; Le, Y.; Wang, W.; Ding, Y.; Wang, S.; Chen, R. p-Phenylenediamines and their derived quinones: A review of their environmental fate, human exposure, and biological toxicity. J. Hazard. Mater. 2025, 488. [Google Scholar] [CrossRef]
- Gupta, S.; Ronen, Z. Biological Treatment of Nitroaromatics in Wastewater. Water 2024, 16(6), 901. [Google Scholar] [CrossRef]
- Sun, W.; Wang, B.; Ouyang, W.; Liu, Z.; Zhang, H. Tire wear particles in aquatic environments: A systematic review of sources, detection, distribution, and toxicological impacts. Ecotoxicol. Environ. Saf. 2025, 305, 119236. [Google Scholar] [CrossRef]
- Foscari, A.; Herzke, D.; Mowafi, R.; et al. Uptake of chemicals from tire wear particles into aquatic organisms - search for biomarkers of exposure in blue mussels (Mytilus edulis). Mar. Pollut. Bull. 2025, 219, 118311. [Google Scholar] [CrossRef]
- Liu, J.; Yu, M.; Shi, R.; Ge, Y.; Li, J.; Zeb, A.; et al. Comparative toxic effect of tire wear particle-derived compounds 6PPD and 6PPD-quinone to Chlorella vulgaris. Sci. Total Environ. 2024, 951, 175592. [Google Scholar] [CrossRef]
- Ghanadi, M.; Caubrière, L.; Kah, M.; Padhye, L.P. Tire-wear particles and tire-related emerging contaminants: Characteristics, occurrence, and toxicity in the environment. Curr. Opin. Environ. Sci. Health 2025, 48. [Google Scholar] [CrossRef]
- Kim, B.; Kim, S.; Kim, R.; et al. Comparative toxicity of tire wear particle leachates: Zinc as a key toxicant affecting development and motility in zebrafish larvae. J. Hazard. Mater. 2025, 499, 140296. [Google Scholar] [CrossRef]
- Zhang, S.; Tang, J.; Qiu, Z.; Huo, X.; Liu, D.; Zeng, X. Environmental and Human Health Risks of 6PPD and 6PPDQ: Assessment and Implications. Toxics 2025, 13(10), 873. [Google Scholar] [CrossRef]
- Lane, R.F.; Smalling, K.L.; Bradley, P.M.; et al. Tire-derived contaminants 6PPD and 6PPD-Q: Analysis, sample handling, and reconnaissance of United States stream exposures. Chemosphere 2024, 363, 142830. [Google Scholar] [CrossRef]
- Soucek, D.J.; Dorman, R.A.; Stevens, J.A.; Yargeau, V.; Pineda, M.; Bennett, E.R.; et al. Acute Toxicity of 4-hydroxydiphenylamine (4-HDPA) and N-(1,3-dimethylbutyl)-N’-phenyl-p-phenylenediamine-quinone (6PPDQ), transformation products of 6PPD, to early instars of the mayfly, Neocloeon triangulifer. Environ. Toxicol. Chem. 2025, 44(5), 1369–1377. [Google Scholar] [CrossRef]
- González-Vázquez, M.A.; Wong, B.B.M.; Wlodkowic, D. Organic pollutants leaching from tire waste: Ecotoxicity implications for aquatic species. Aquat. Toxicol. 2025, 289, 107613. [Google Scholar] [CrossRef]
- Li, P.; Han, Y.; Wang, M.; Yan, H. An Advanced Sensitive Detection Method for Internal and External Exposures Assessment of para-Phenylenediamines and Their Quinone Derivatives Based on Hierarchical Pore-Structured Nitro-microporous Organic Networks. J. Hazard. Mater. 2024, 480(44), 136434. [Google Scholar] [CrossRef]
- Okawa, N.; Ito, A.; Au, V.K.-M.; Tsuchiya, N.; Kameda, T. Application of high-performance liquid chromatography with electrochemical detection for the analysis of N-(1,3-dimethylbutyl)-N’-phenyl-p-phenylenediamine quinone in ambient particulates. J. Chromatogr. Open 2025, 7, 100232. [Google Scholar] [CrossRef]
- Liao, X.; Ross, A.R.S.; Brown, T.M. An environmentally sensitive method for rapid monitoring of 6PPD-quinone in aqueous samples using solid phase extraction and direct sample introduction with liquid chromatography and tandem mass spectrometry. RSC Sustain. 2025, 3(10), 4811–4817. [Google Scholar] [CrossRef]
- Xia, Y.; Sun, X.; Yang, L.; et al. Structural Molecular Network for Nontargeted Screening and Prioritization of New Pollutants in Urban Wastewater. Environ. Sci. Technol. 2025, 59(33), 17846–17856. [Google Scholar] [CrossRef]
- Somepalli, K.; Andaluri, G. Transformation pathways, detection, removal, and sustainable alternatives of 6PPD and its quinone derivative (6PPDQ): A comprehensive review. Emerg. Contam. 2025, 11(3), 100547. [Google Scholar] [CrossRef]
- Ramezany, S.; Martinez, G.; Mugnai, A.; Houle, D.; Bellenger, J.P. Feasibility of using Pleurozium schreberi as a biomonitor to study antiozonant dispersion: A case study in Southern Quebec. Sci. Total Environ. 2025; 994, 180047. [Google Scholar] [CrossRef]
- Zhao, H.N.; Peter, K.T.; Gonzalez, M.; Rideout, C.A.; Hu, X.; Tian, Z.; et al. Temporal Dynamics of PPD-Class Antioxidants and Transformation Products in a Small Roadway-Runoff-Impacted Watershed. Environ. Sci. Technol. 2025, 59(34), 18358–18371. [Google Scholar] [CrossRef]
- Yan, X.; Xiao, J.; Kiki, C.; Zhang, Y.; Manzi, H.P.; Zhao, G.; et al. Unraveling the fate of 6PPD-Q in aquatic environment: Insights into formation, dissipation, and transformation under natural conditions. Environ. Int. 2024, 191, 109004. [Google Scholar] [CrossRef]
- Jiao, M.; Luo, Y.; Zhang, F.; Wang, L.; Chang, J.; Croué, J.-P.; et al. Transformation of 6PPDQ during disinfection: Kinetics, products, and eco-toxicity assessment. Water Res. 2024, 250, 121070. [Google Scholar] [CrossRef]
- Shen, D.; Shi, Q.; Zhang, J.; Sy, N.D.; Yates, R.; Wang, W.; et al. Transformations of 6PPD and 6PPD-quinone in soil under redox-driven conditions: Kinetics, product identification, and environmental implications. Environ. Int. 2025, 200, 109532. [Google Scholar] [CrossRef]
- Yan, X.; Wang, L.; Kiki, C.; Liu, L.; Qin, D.; Xiao, J. Anaerobic transformation of 6PPD-Q in sediment: Dominated by quinone reduction and novel O-methylation pathways. Environ. Pollut. 2026, 403. [Google Scholar] [CrossRef]
- Liu, Y.-H.; Mei, Y.-X.; Wang, J.-Y.; Chen, S.-S.; Chen, J.-L.; Li, N.; et al. Precipitation contributes to alleviating pollution of rubber-derived chemicals in receiving watersheds: Combining confluent stormwater runoff from different functional areas. Water Res. 2024, 264, 122240. [Google Scholar] [CrossRef]
- Han, L.; Seiwert, B.; Lichtenwald, E.; Weyrauch, S.; Zahn, D.; Reemtsma, T. Biodegradation pathways and products of tire-related phenylenediamines and phenylenediamine quinones in solution - a laboratory study. Water Res. 2025, 286, 124235. [Google Scholar] [CrossRef]
- Chaterji, T.; Singh, T.; Khanna, N.; Bhagat, T.; Tyagi, D.; Totlani, R. Microbial Bioremediation Strategies for Sustainable Wastewater Treatment. Sustain. Process. Connect 2025, 1, 2025.0005. [Google Scholar] [CrossRef]
- He, D.C.; Zheng, M.M.; Huang, W.; Liu, W.R.; Hu, J.W.; Liu, J.Y.; et al. Research Progress on Pollution Characteristics, Degradation, and Transformation of Typical PPCPs in the Process of Wastewater Treatment. Huanjing Kexue 2024, 45(6), 3247–3259. [Google Scholar] [CrossRef]
- Mishra, T.; Tiwari, P.B.; Kanchan, S.; Kesheri, M. Advances in Microbial Bioremediation for Effective Wastewater Treatment. Water 2025, 17(22), 3196. [Google Scholar] [CrossRef]
- Li, X.; Yang, L.; Zhou, J.; Dai, B.; Gan, D.; Yang, Y.; et al. Biogenic palladium nanoparticles for wastewater treatment: Formation, applications, limitations, and future directions. J. Water Process Eng. 2024, 64, 105641. [Google Scholar] [CrossRef]
- Li, Z.; Wang, Q.; Lei, Z.; Zheng, H.; Zhang, H.; Huang, J.; et al. Biofilm formation and microbial interactions in moving bed-biofilm reactors treating wastewater containing pharmaceuticals and personal care products: A review. J. Environ. Manag. 2024, 368, 122166. [Google Scholar] [CrossRef]
- Carneiro, R.B.; Pozzi, E.; Felipe, M.C.; Vargas, S.R. Ecological Risk Assessment of Pharmaceuticals and Personal Care Products in Wastewater Treatment and Their Toxicity on Target Microorganisms. ACS ES&T Water 2025, 6(2). [Google Scholar] [CrossRef]
- Amacosta, J.; Poznyak, T.; Siles, S.; Chairez, I. Sequential Treatment by Ozonation and Biodegradation of Pulp and Paper Industry Wastewater to Eliminate Organic Contaminants. Toxics 2024, 12(2), 138. [Google Scholar] [CrossRef]
- Muhammad H.A., Micropollutant Control in Wastewater Treatment: A Review of Harnessing Nitrification and Denitrification Biotransformation of Micropollutant. ARO—The Sci. J. Koya Univ. 2024, 12(2), 130–138. [CrossRef]
- Challis, J.K.; Popick, H.; Prajapati, S.; Harder, P.; Giesy, J.P.; McPhedran, K. Occurrences of Tire Rubber-Derived Contaminants in Urban Runoff in a Cold Climate. Environ. Sci. Technol. Lett. 2021. [Google Scholar] [CrossRef]
- Xie, L.; Yuan, L.; Sun, J.; Yang, M.I.; Khan, I.; Lopez, J.J.; et al. Compound Class-Specific Temporal Trends (2021-2023) of Tire Wear Compounds in Suspended Solids from Toronto Wastewater Treatment Plants. ACS ES&T Water 2024, 4(12), 5708–5719. [Google Scholar] [CrossRef]
- Prosser, R.S.; Bartlett, A.J.; Milani, D.; Holman, E.A.M.; Ikert, H.; Schissler, D.; et al. Variation in the toxicity of sediment-associated substituted phenylamine antioxidants to an epibenthic (Hyalella azteca) and endobenthic (Tubifex tubifex) invertebrate. Chemosphere 2017, 181, 250–258. [Google Scholar] [CrossRef]
- Ministry of the Environment, Japan, Results of Aquatic Toxicity Tests of Chemicals Conducted by Ministry of the Environment in Japan (March 2019); Ministry of the Environment, Japan; Volume 31 p, p. ECOREF#:181770.
- Prosser, R.S.; Parrott, J.L.; Galicia, M.; Shires, K.; Sullivan, C.; Toito, J.; et al. Toxicity of sediment-associated substituted phenylamine antioxidants on the early life stages of Pimephales promelas and a characterization of effects on freshwater organisms. Environ. Toxicol. Chem. 2017, 36(10), 2730–2738. [Google Scholar] [CrossRef]
- Monsanto, Co. Initial Submission: Acute Toxicity of Santoflex 13 to Rainbow Trout and Bluegill with Cover Letter Dated 081492 (EPA/OTS 88-920007606). Monsanto Co., Missouri., 9 p. p. ECOREF#:189679.
- Tian, Z.; Zhao, H.; Peter, K.T.; Gonzalez, M.; Wetzel, J.; Wu, C.; et al. A ubiquitous tire rubber-derived chemical induces acute mortality in coho salmon. Science 2020, 371(6525), 185–189. [Google Scholar] [CrossRef]
- Varshney, S.; Gora, A.H.; Siriappagouder, P.; Kiron, V.; Olsvik, P.A. Toxicological effects of 6PPD and 6PPD quinone in zebrafish larvae. J. Hazard. Mater. 2022, 424 (Part C), 127623. [Google Scholar] [CrossRef]
Figure 1.
Full-process data mining framework for extracting global 6PPD and 6PPD-Q environmental monitoring data from literature. Note: (A) Overall workflow of literature sorting covering Web of Science retrieval, preliminary screening, text neural network entity recognition, keyword clustering and pollutant concentration data collation; (B) Construction rules of environmental dictionary and standardized lexical matching algorithm for automatic text feature extraction based on EPA environmental glossary; (C) Automated batch table extraction, data cleaning and standardization pipeline supporting multi-format documents (Excel, Word, PDF) to generate standardized geospatial pollutant datasets. Assessment via link: https://tinyurl.com/28njah9l.
Figure 1.
Full-process data mining framework for extracting global 6PPD and 6PPD-Q environmental monitoring data from literature. Note: (A) Overall workflow of literature sorting covering Web of Science retrieval, preliminary screening, text neural network entity recognition, keyword clustering and pollutant concentration data collation; (B) Construction rules of environmental dictionary and standardized lexical matching algorithm for automatic text feature extraction based on EPA environmental glossary; (C) Automated batch table extraction, data cleaning and standardization pipeline supporting multi-format documents (Excel, Word, PDF) to generate standardized geospatial pollutant datasets. Assessment via link: https://tinyurl.com/28njah9l.
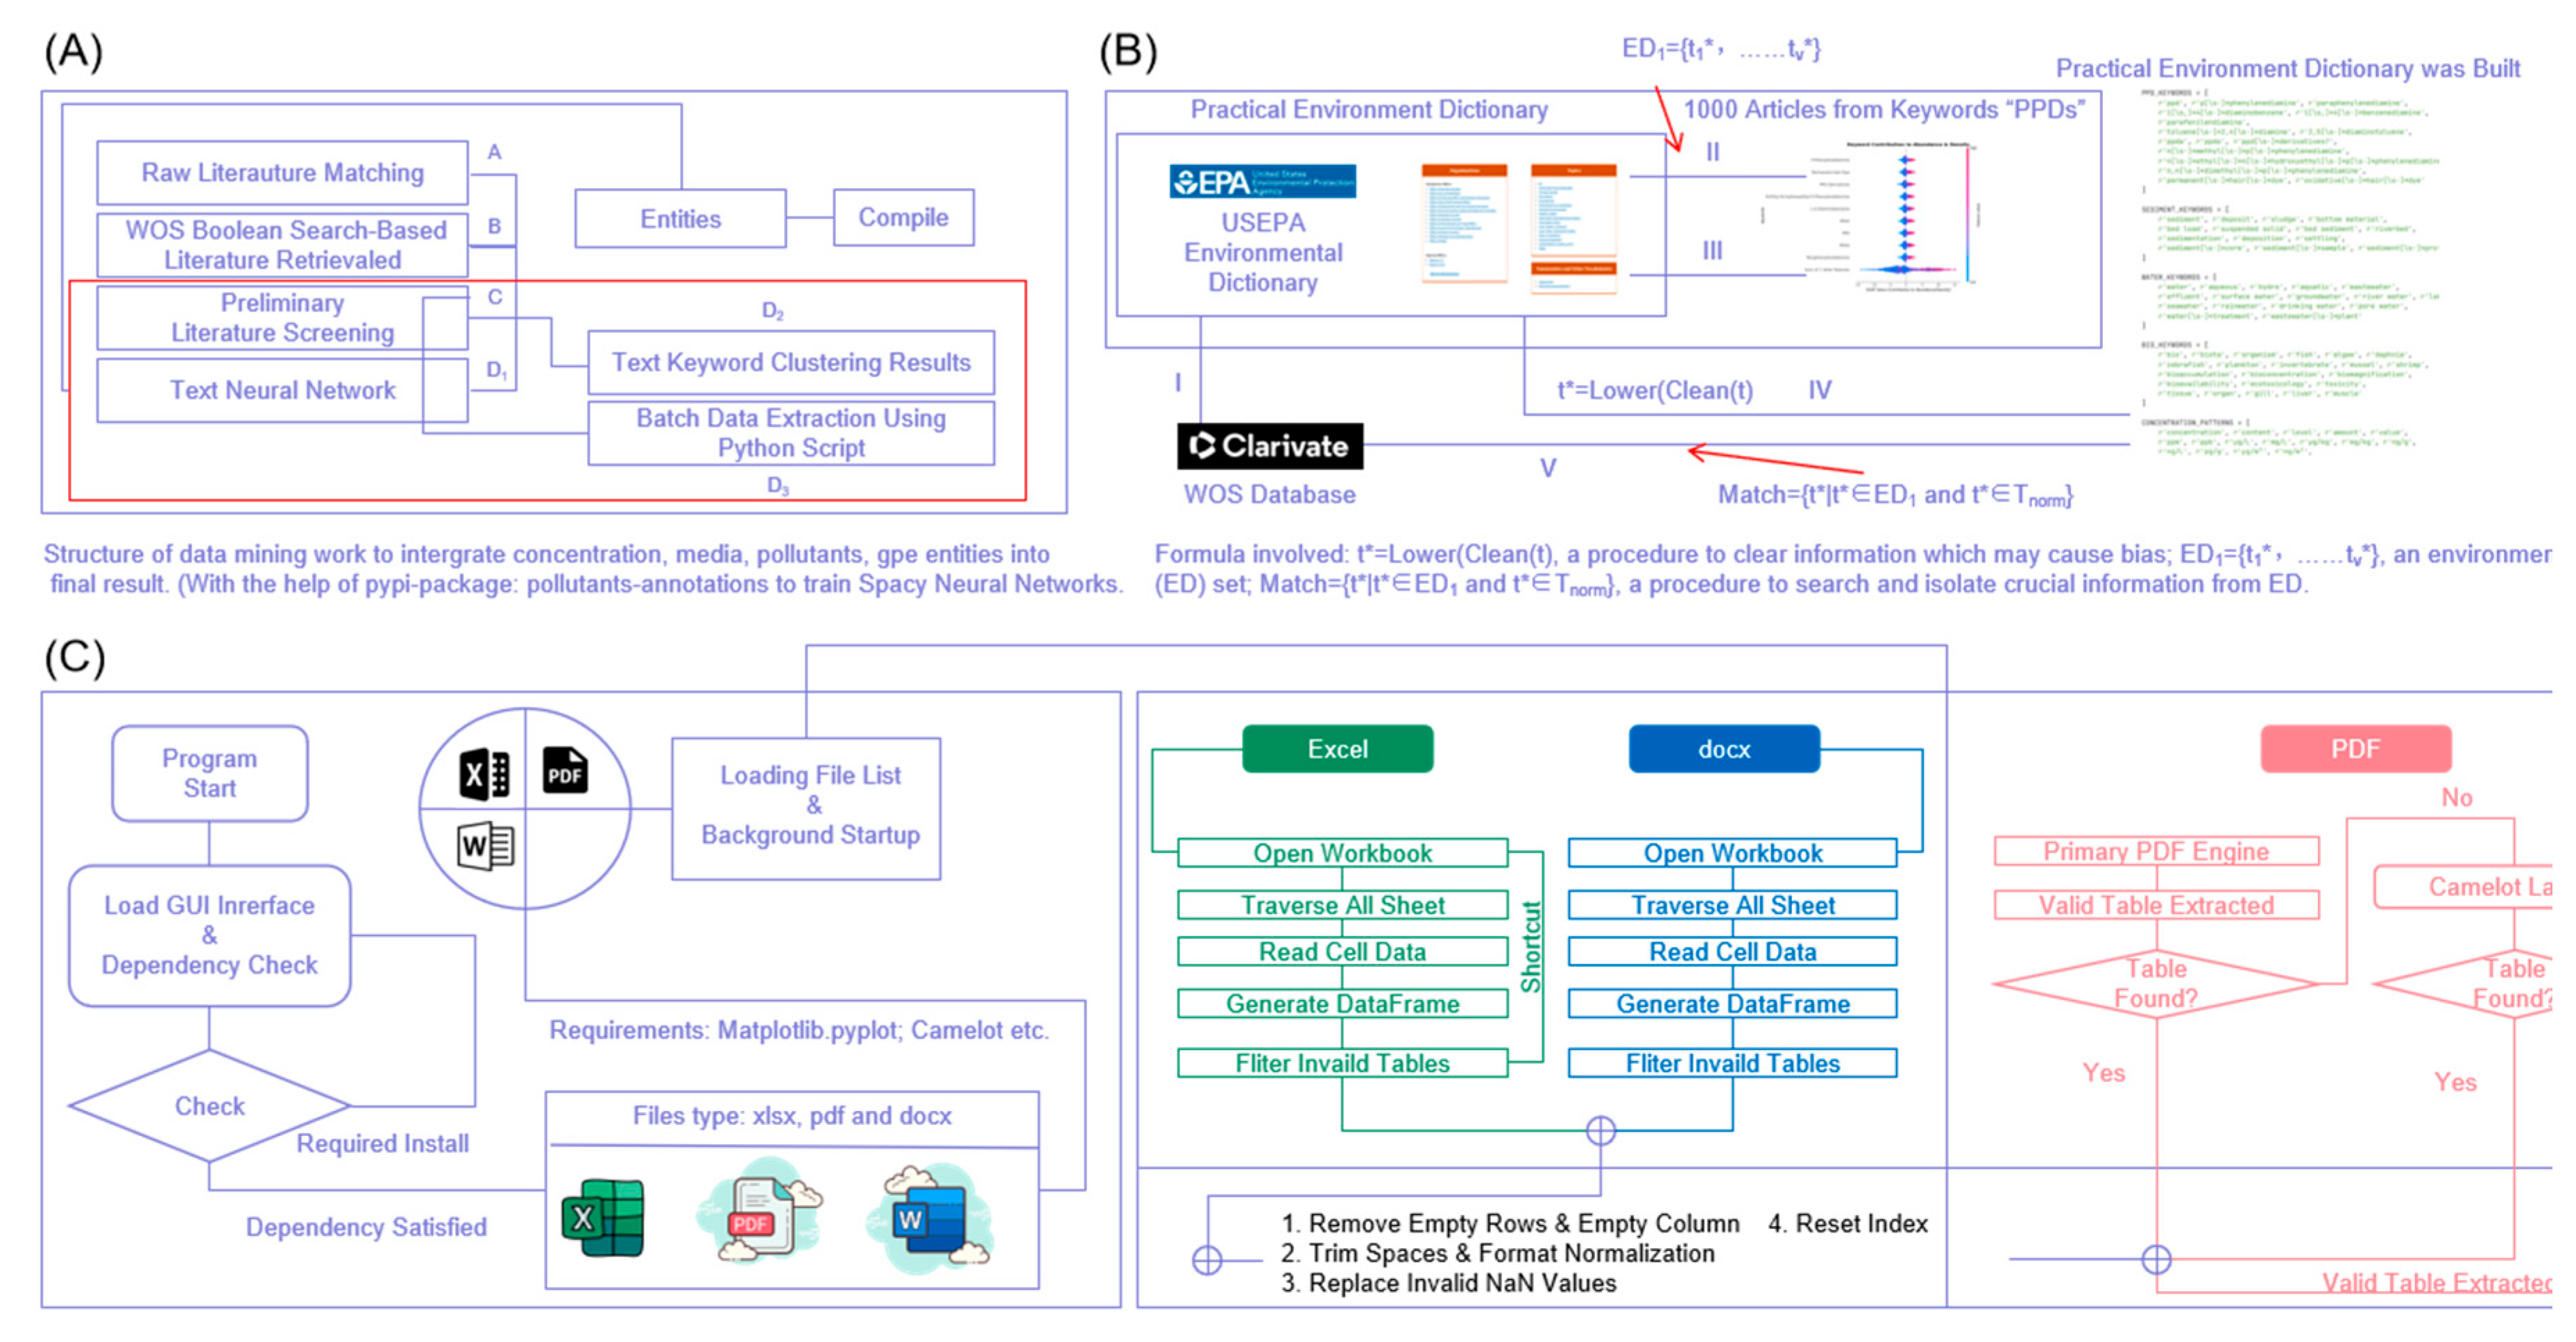
Figure 2.
Detection proportions of pollutants in three environmental media across seven literature batches. Note: (A) Grouped bar chart showing the distribution of effective proportions for water/aquatic (W/A), biota, and sediment in each literature subgroup (A-G). (B) Box plot summarizing the value range of detection proportions for the three media across all batches. W/A=water/aquatic. Assessment via link: https://tinyurl.com/2cylhn6r.
Figure 2.
Detection proportions of pollutants in three environmental media across seven literature batches. Note: (A) Grouped bar chart showing the distribution of effective proportions for water/aquatic (W/A), biota, and sediment in each literature subgroup (A-G). (B) Box plot summarizing the value range of detection proportions for the three media across all batches. W/A=water/aquatic. Assessment via link: https://tinyurl.com/2cylhn6r.
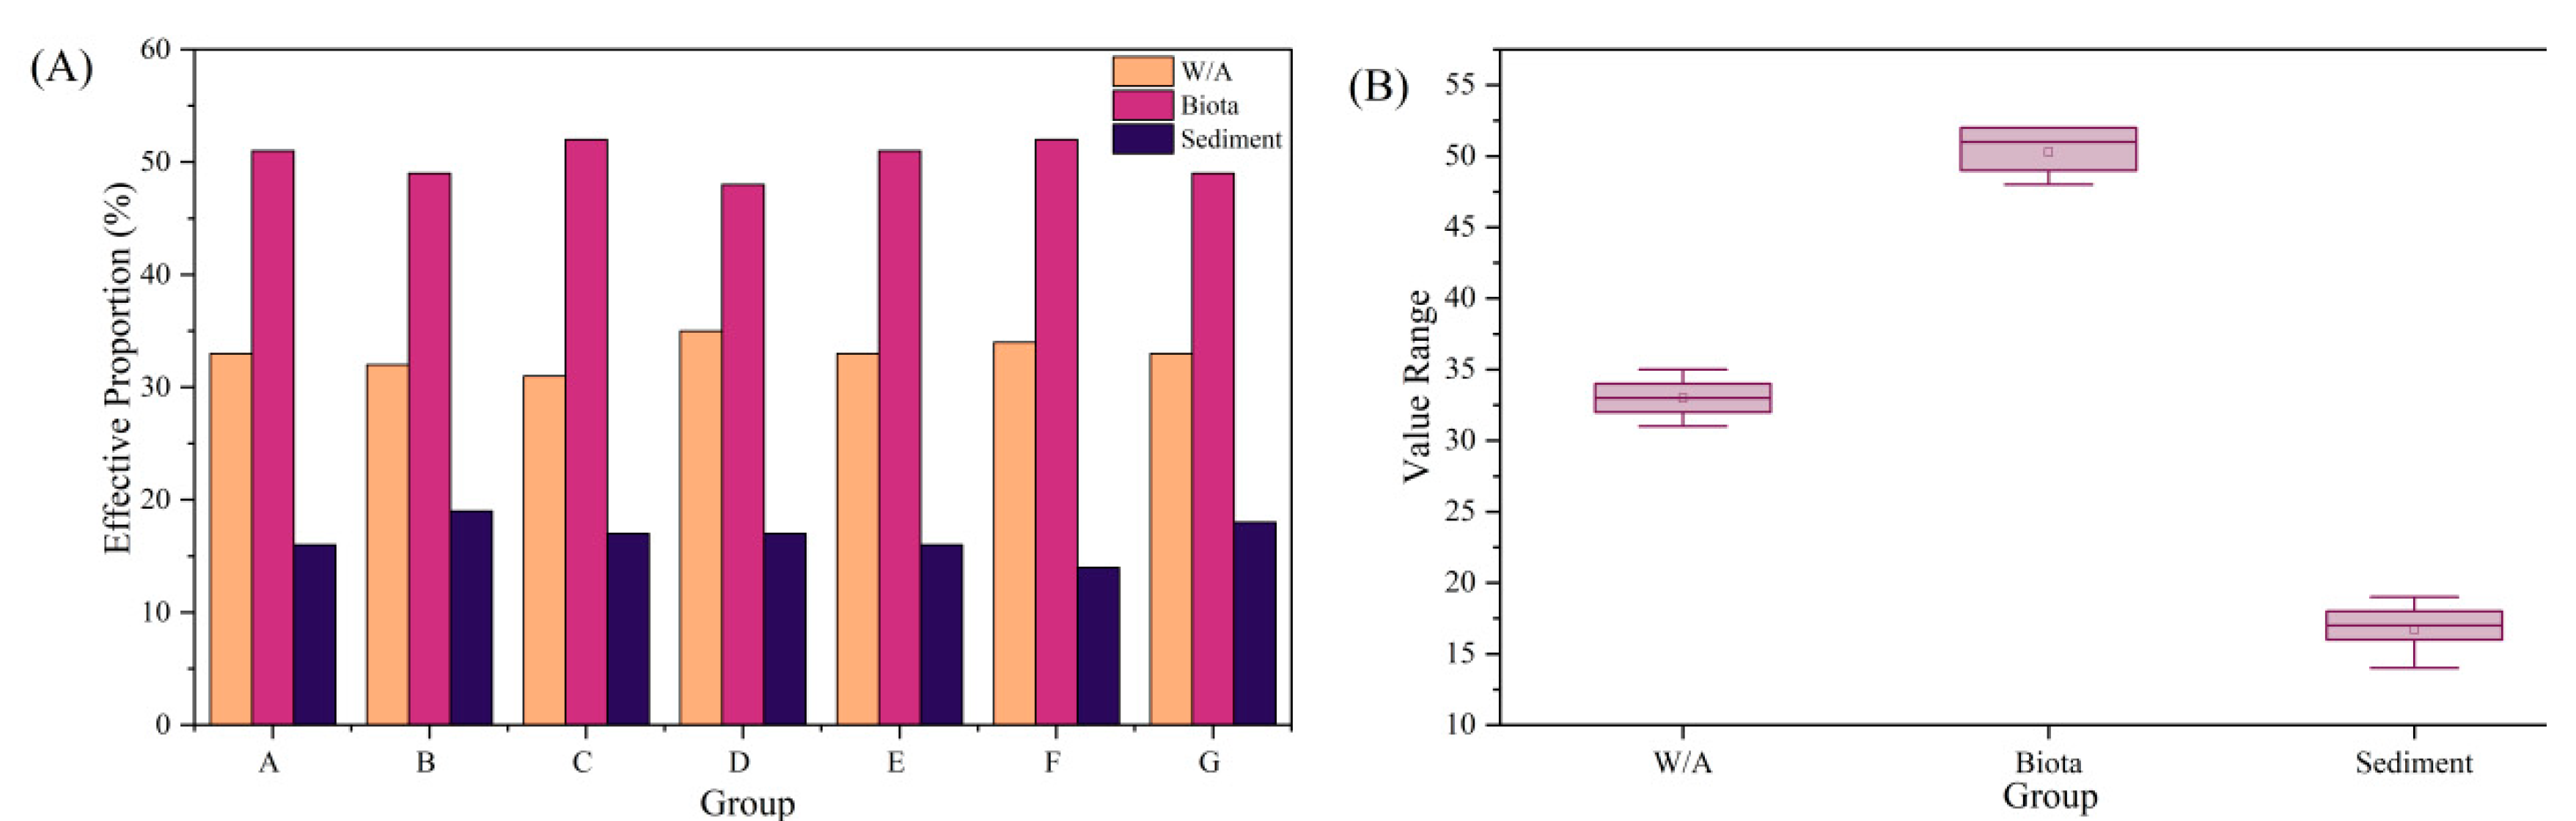
Figure 3.
Geographical distribution and concentration density characteristics of 6PPD/Q in different environmental media across typical global regions Note: (A) This panel illustrates the geographical distribution and concentration density of 6PPD/Q in global aquatic environments, including from left to right: a latitude-longitude scatter plot, a plot of concentration density versus latitude, and a histogram of 6PPD/Q concentration density distribution. The scatter plot indicates the spatial occurrence locations of pollutants in global waters; the color gradient and value scale represent the concentration density of pollutants in waters of different regions; the histogram reflects the overall distribution characteristics of 6PPD/Q concentration density in water bodies. (B) This panel presents the geographical distribution and concentration density of 6PPD/Q in the sediment phase of typical global regions, including from left to right: a latitude-longitude scatter plot, a plot of concentration density versus latitude, and a histogram of 6PPD/Q concentration density distribution. Assessment via link: https://tinyurl.com/2797ypyp.
Figure 3.
Geographical distribution and concentration density characteristics of 6PPD/Q in different environmental media across typical global regions Note: (A) This panel illustrates the geographical distribution and concentration density of 6PPD/Q in global aquatic environments, including from left to right: a latitude-longitude scatter plot, a plot of concentration density versus latitude, and a histogram of 6PPD/Q concentration density distribution. The scatter plot indicates the spatial occurrence locations of pollutants in global waters; the color gradient and value scale represent the concentration density of pollutants in waters of different regions; the histogram reflects the overall distribution characteristics of 6PPD/Q concentration density in water bodies. (B) This panel presents the geographical distribution and concentration density of 6PPD/Q in the sediment phase of typical global regions, including from left to right: a latitude-longitude scatter plot, a plot of concentration density versus latitude, and a histogram of 6PPD/Q concentration density distribution. Assessment via link: https://tinyurl.com/2797ypyp.
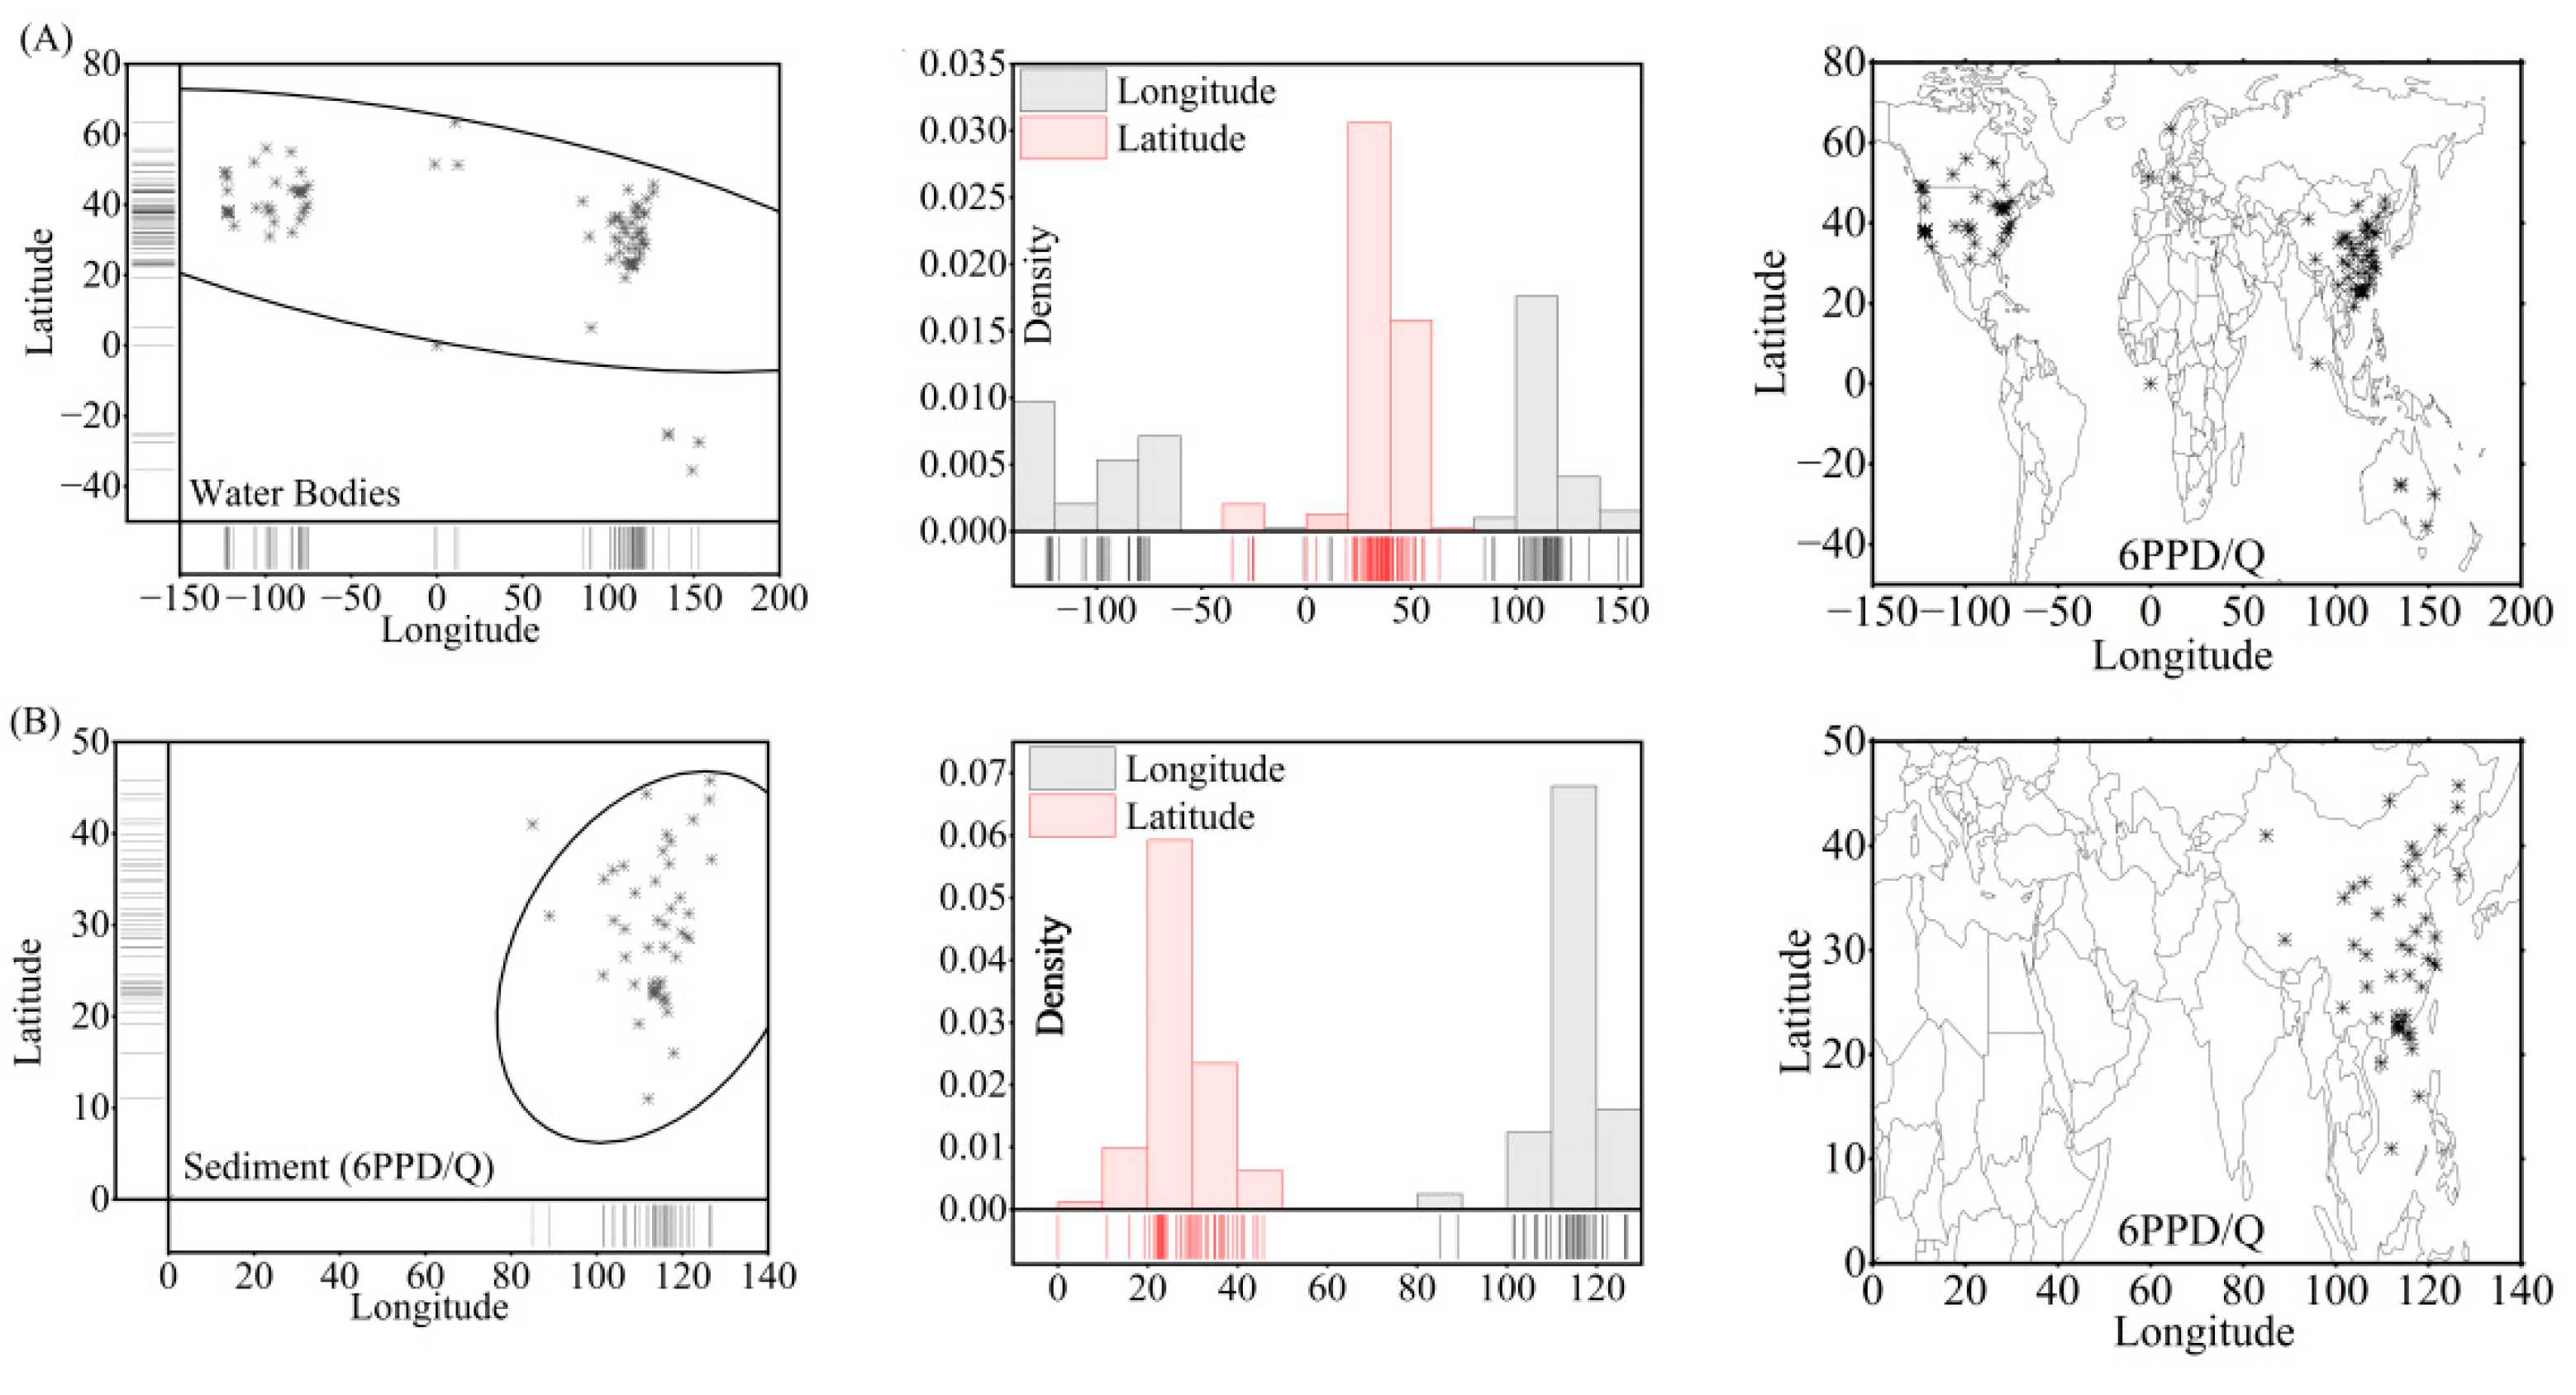
Figure 4.
Biotic occurrence characteristics, toxic profiles, and global concentration heatmaps of 6PPD and its quinone transformation products. Note: All concentration datasets were standardized to ng/L and plotted on logarithmic axes. (A) shows concentration distributions of 6PPD across diverse biological matrices. (B) illustrates accumulation levels of 6PPD-Q in human serum, urine, and cerebrospinal fluid (CSF). (C) presents in vivo occurrence of 6PPD-Q and its median lethal concentration (LC₅₀) to fish species. (D) compares acute toxic discrepancies of chiral 6PPD and 6PPD-Q toward fish, where lower LC₅₀ values correspond to stronger toxic potency. (E) Biotic occurrence features and toxicity distribution of 6PPD and 6PPD-Q. (A-D) Global heatmaps of 6PPD/Q concentrations in aquatic and sedimentary environments. Color gradient indicates pollutant concentration magnitudes: red zones denote high-concentration hotspots, while blue-green regions represent background or low-concentration levels. All concentration units across the heatmaps are unified as ng/L. (Newest and clearest version can be seen via repository: www.13579-pr.github.io) Assessment via link: https://tinyurl.com/26xjxswm .
Figure 4.
Biotic occurrence characteristics, toxic profiles, and global concentration heatmaps of 6PPD and its quinone transformation products. Note: All concentration datasets were standardized to ng/L and plotted on logarithmic axes. (A) shows concentration distributions of 6PPD across diverse biological matrices. (B) illustrates accumulation levels of 6PPD-Q in human serum, urine, and cerebrospinal fluid (CSF). (C) presents in vivo occurrence of 6PPD-Q and its median lethal concentration (LC₅₀) to fish species. (D) compares acute toxic discrepancies of chiral 6PPD and 6PPD-Q toward fish, where lower LC₅₀ values correspond to stronger toxic potency. (E) Biotic occurrence features and toxicity distribution of 6PPD and 6PPD-Q. (A-D) Global heatmaps of 6PPD/Q concentrations in aquatic and sedimentary environments. Color gradient indicates pollutant concentration magnitudes: red zones denote high-concentration hotspots, while blue-green regions represent background or low-concentration levels. All concentration units across the heatmaps are unified as ng/L. (Newest and clearest version can be seen via repository: www.13579-pr.github.io) Assessment via link: https://tinyurl.com/26xjxswm .
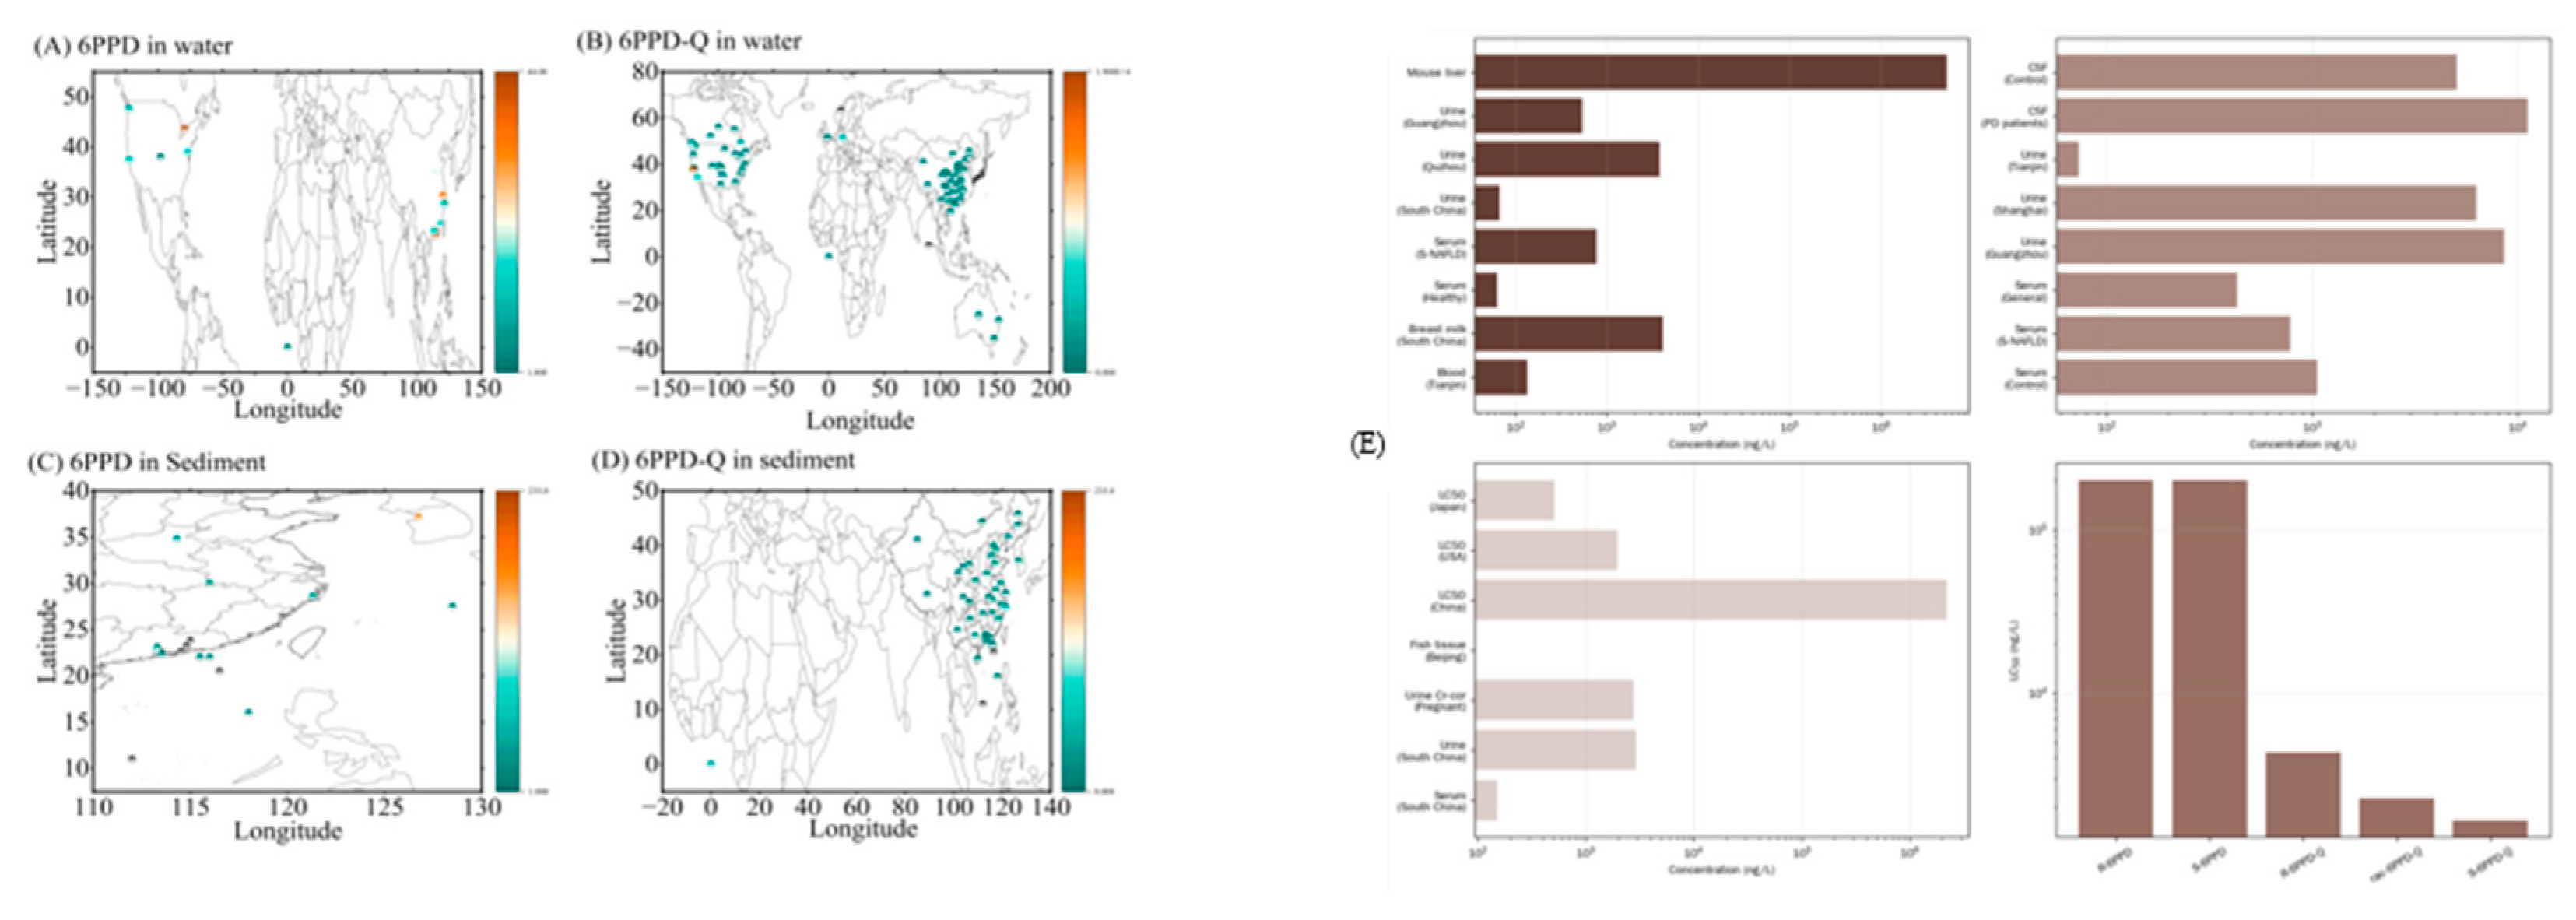
Figure 5.
Classification of model organisms with toxicological results mined from USEPA toxicology databases and published literature Note: (A) Model organisms with available toxicological data of 6PPD from retrieved literature. (B) Model organisms with available toxicological data of 6PPD-Q from retrieved literature. (C) Fundamental screening criteria for model organisms supporting pollutant toxicity data, including standard test species and acute test organisms. Assessment via link: https://tinyurl.com/2xoskg4f.
Figure 5.
Classification of model organisms with toxicological results mined from USEPA toxicology databases and published literature Note: (A) Model organisms with available toxicological data of 6PPD from retrieved literature. (B) Model organisms with available toxicological data of 6PPD-Q from retrieved literature. (C) Fundamental screening criteria for model organisms supporting pollutant toxicity data, including standard test species and acute test organisms. Assessment via link: https://tinyurl.com/2xoskg4f.
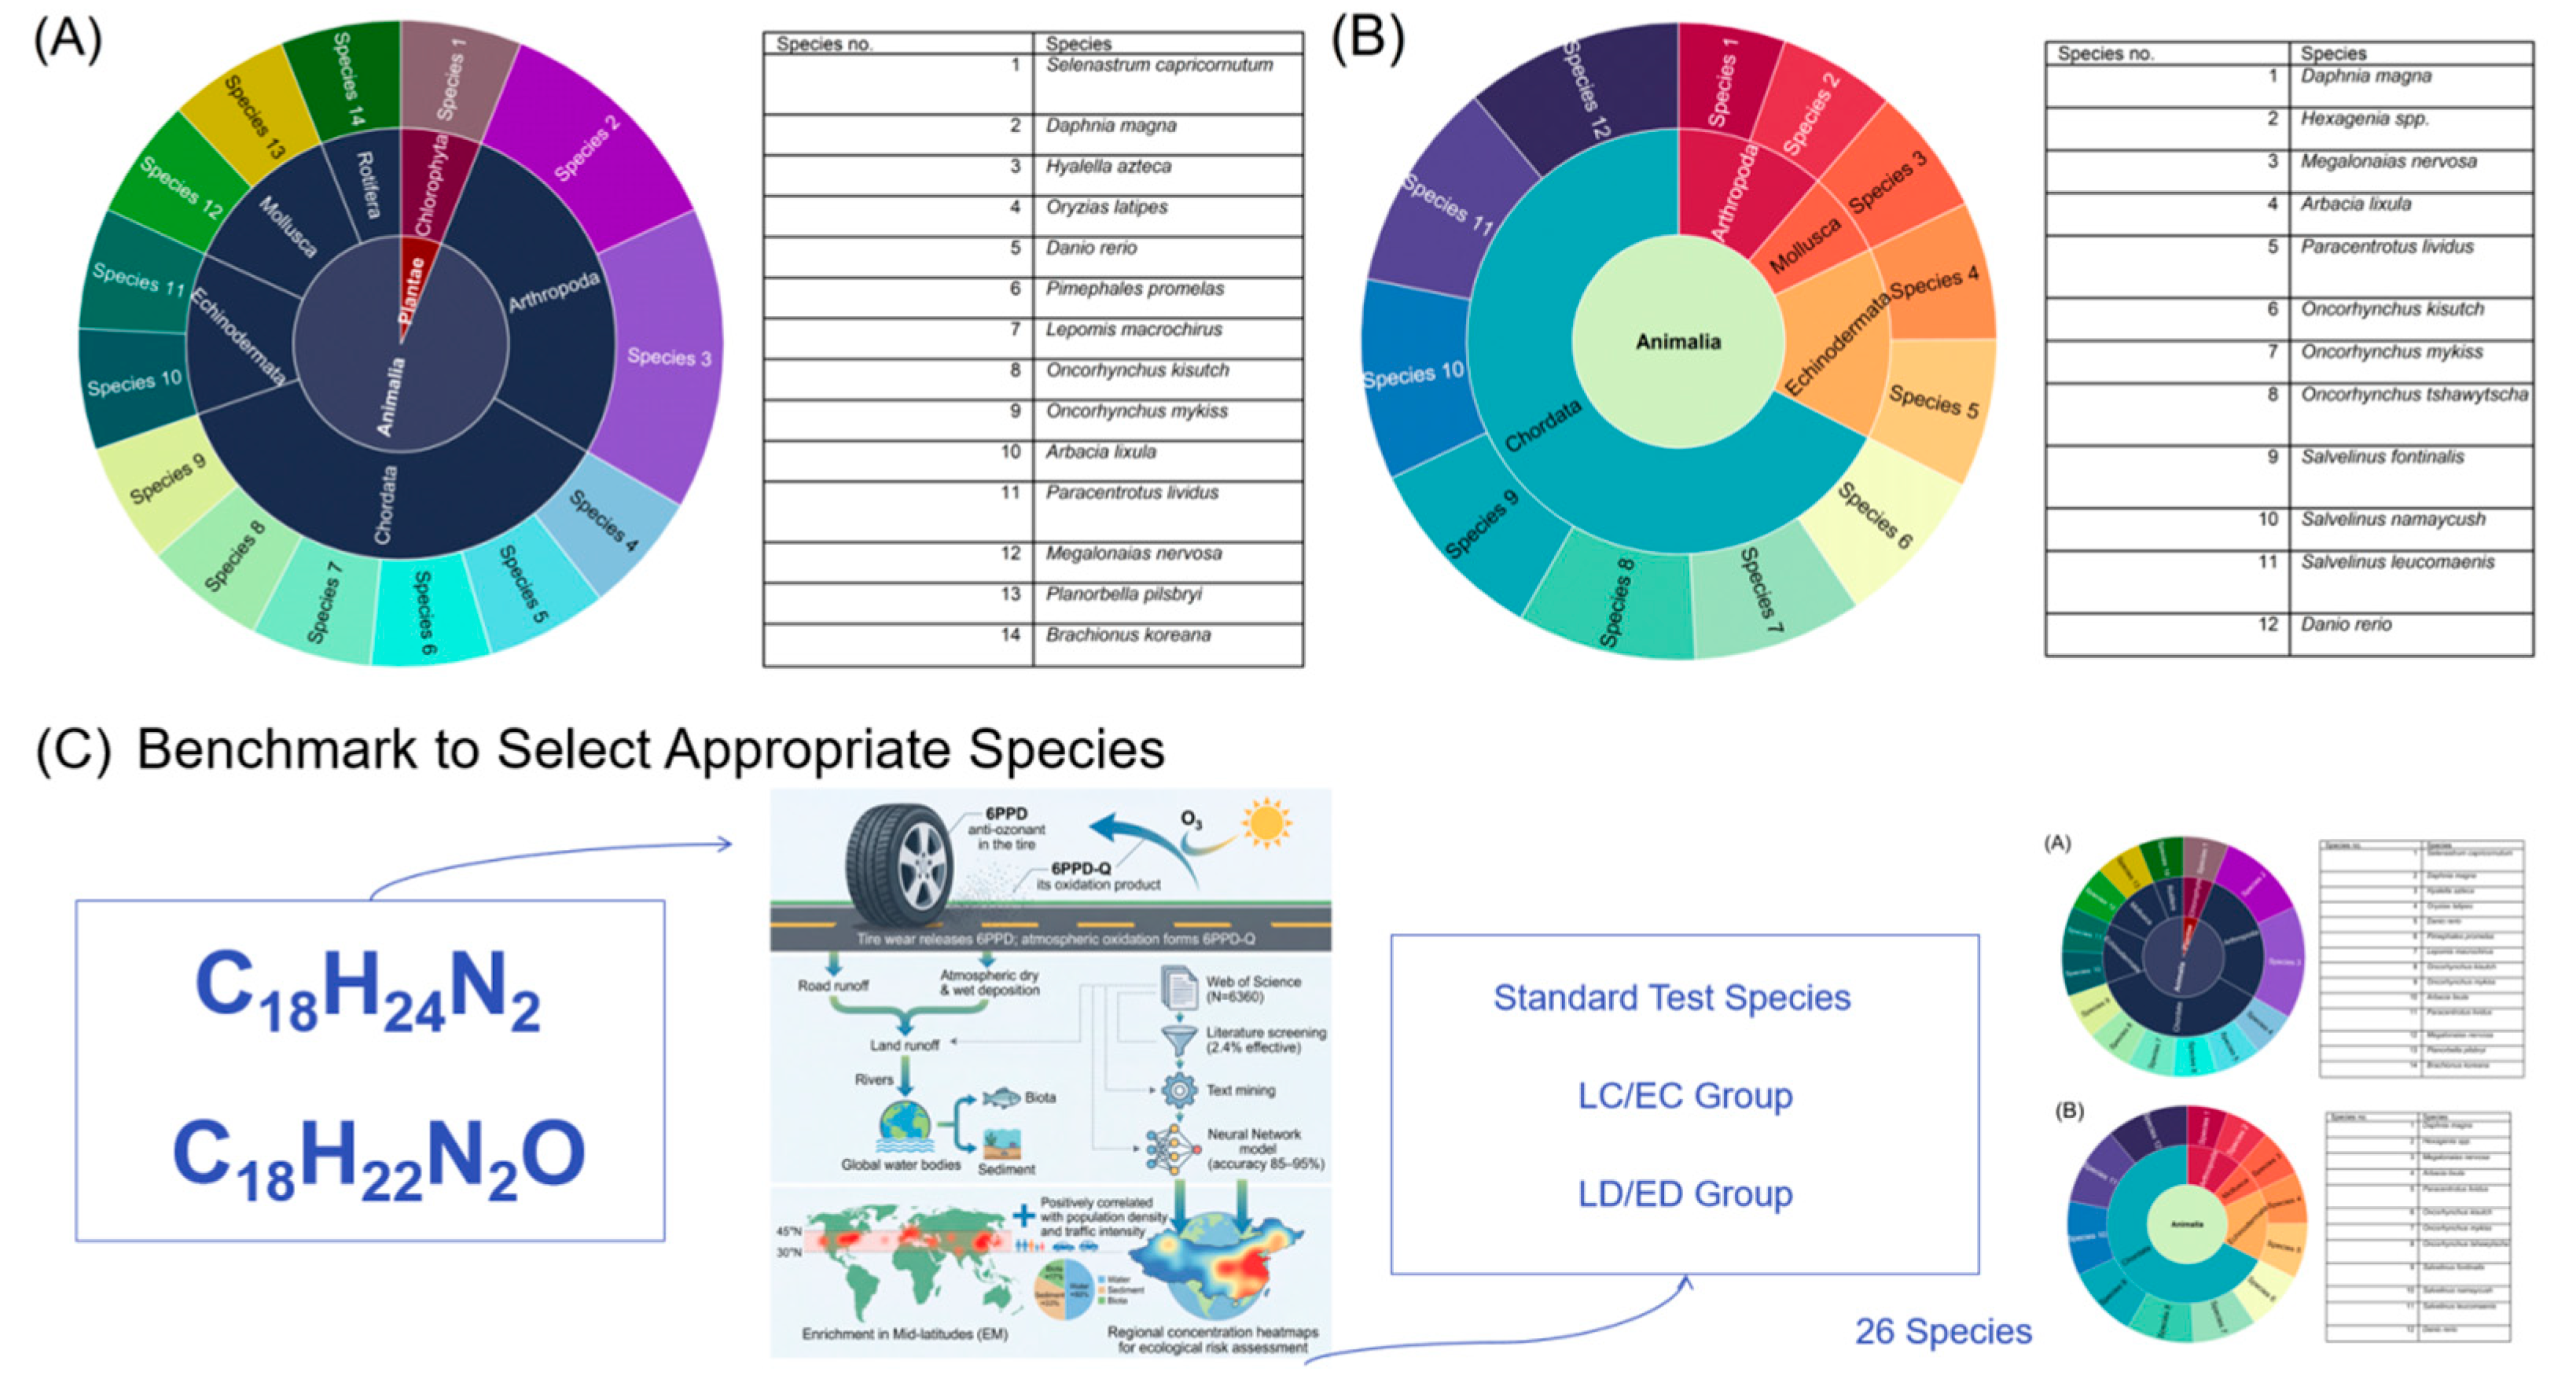
Figure 6.
Species sensitivity distribution fitting, residual diagnostic plots of Logistics and Burr Type III models, and global spatial distribution of risk quotient for 6PPD Note: (A) SSD curve fitted by Logistics distribution and the derived HC₅ value based on acute toxicity data of aquatic organisms; (B-D) Residual scatter plot, frequency histogram and quantile-quantile plot for Logistics SSD model diagnosis; (E) SSD curve fitted by Burr Type III distribution and corresponding HC₅ value; (F-H) Residual scatter plot, frequency histogram and quantile-quantile plot for Burr Type III SSD model diagnosis; (I) Global spatial distribution map of 6PPD risk quotient (RQ) in aquatic environments. Triangular markers represent sampling locations, and the color bar on the right indicates the magnitude of RQ values. Assessment via link: https://tinyurl.com/23ro9tpm.
Figure 6.
Species sensitivity distribution fitting, residual diagnostic plots of Logistics and Burr Type III models, and global spatial distribution of risk quotient for 6PPD Note: (A) SSD curve fitted by Logistics distribution and the derived HC₅ value based on acute toxicity data of aquatic organisms; (B-D) Residual scatter plot, frequency histogram and quantile-quantile plot for Logistics SSD model diagnosis; (E) SSD curve fitted by Burr Type III distribution and corresponding HC₅ value; (F-H) Residual scatter plot, frequency histogram and quantile-quantile plot for Burr Type III SSD model diagnosis; (I) Global spatial distribution map of 6PPD risk quotient (RQ) in aquatic environments. Triangular markers represent sampling locations, and the color bar on the right indicates the magnitude of RQ values. Assessment via link: https://tinyurl.com/23ro9tpm.
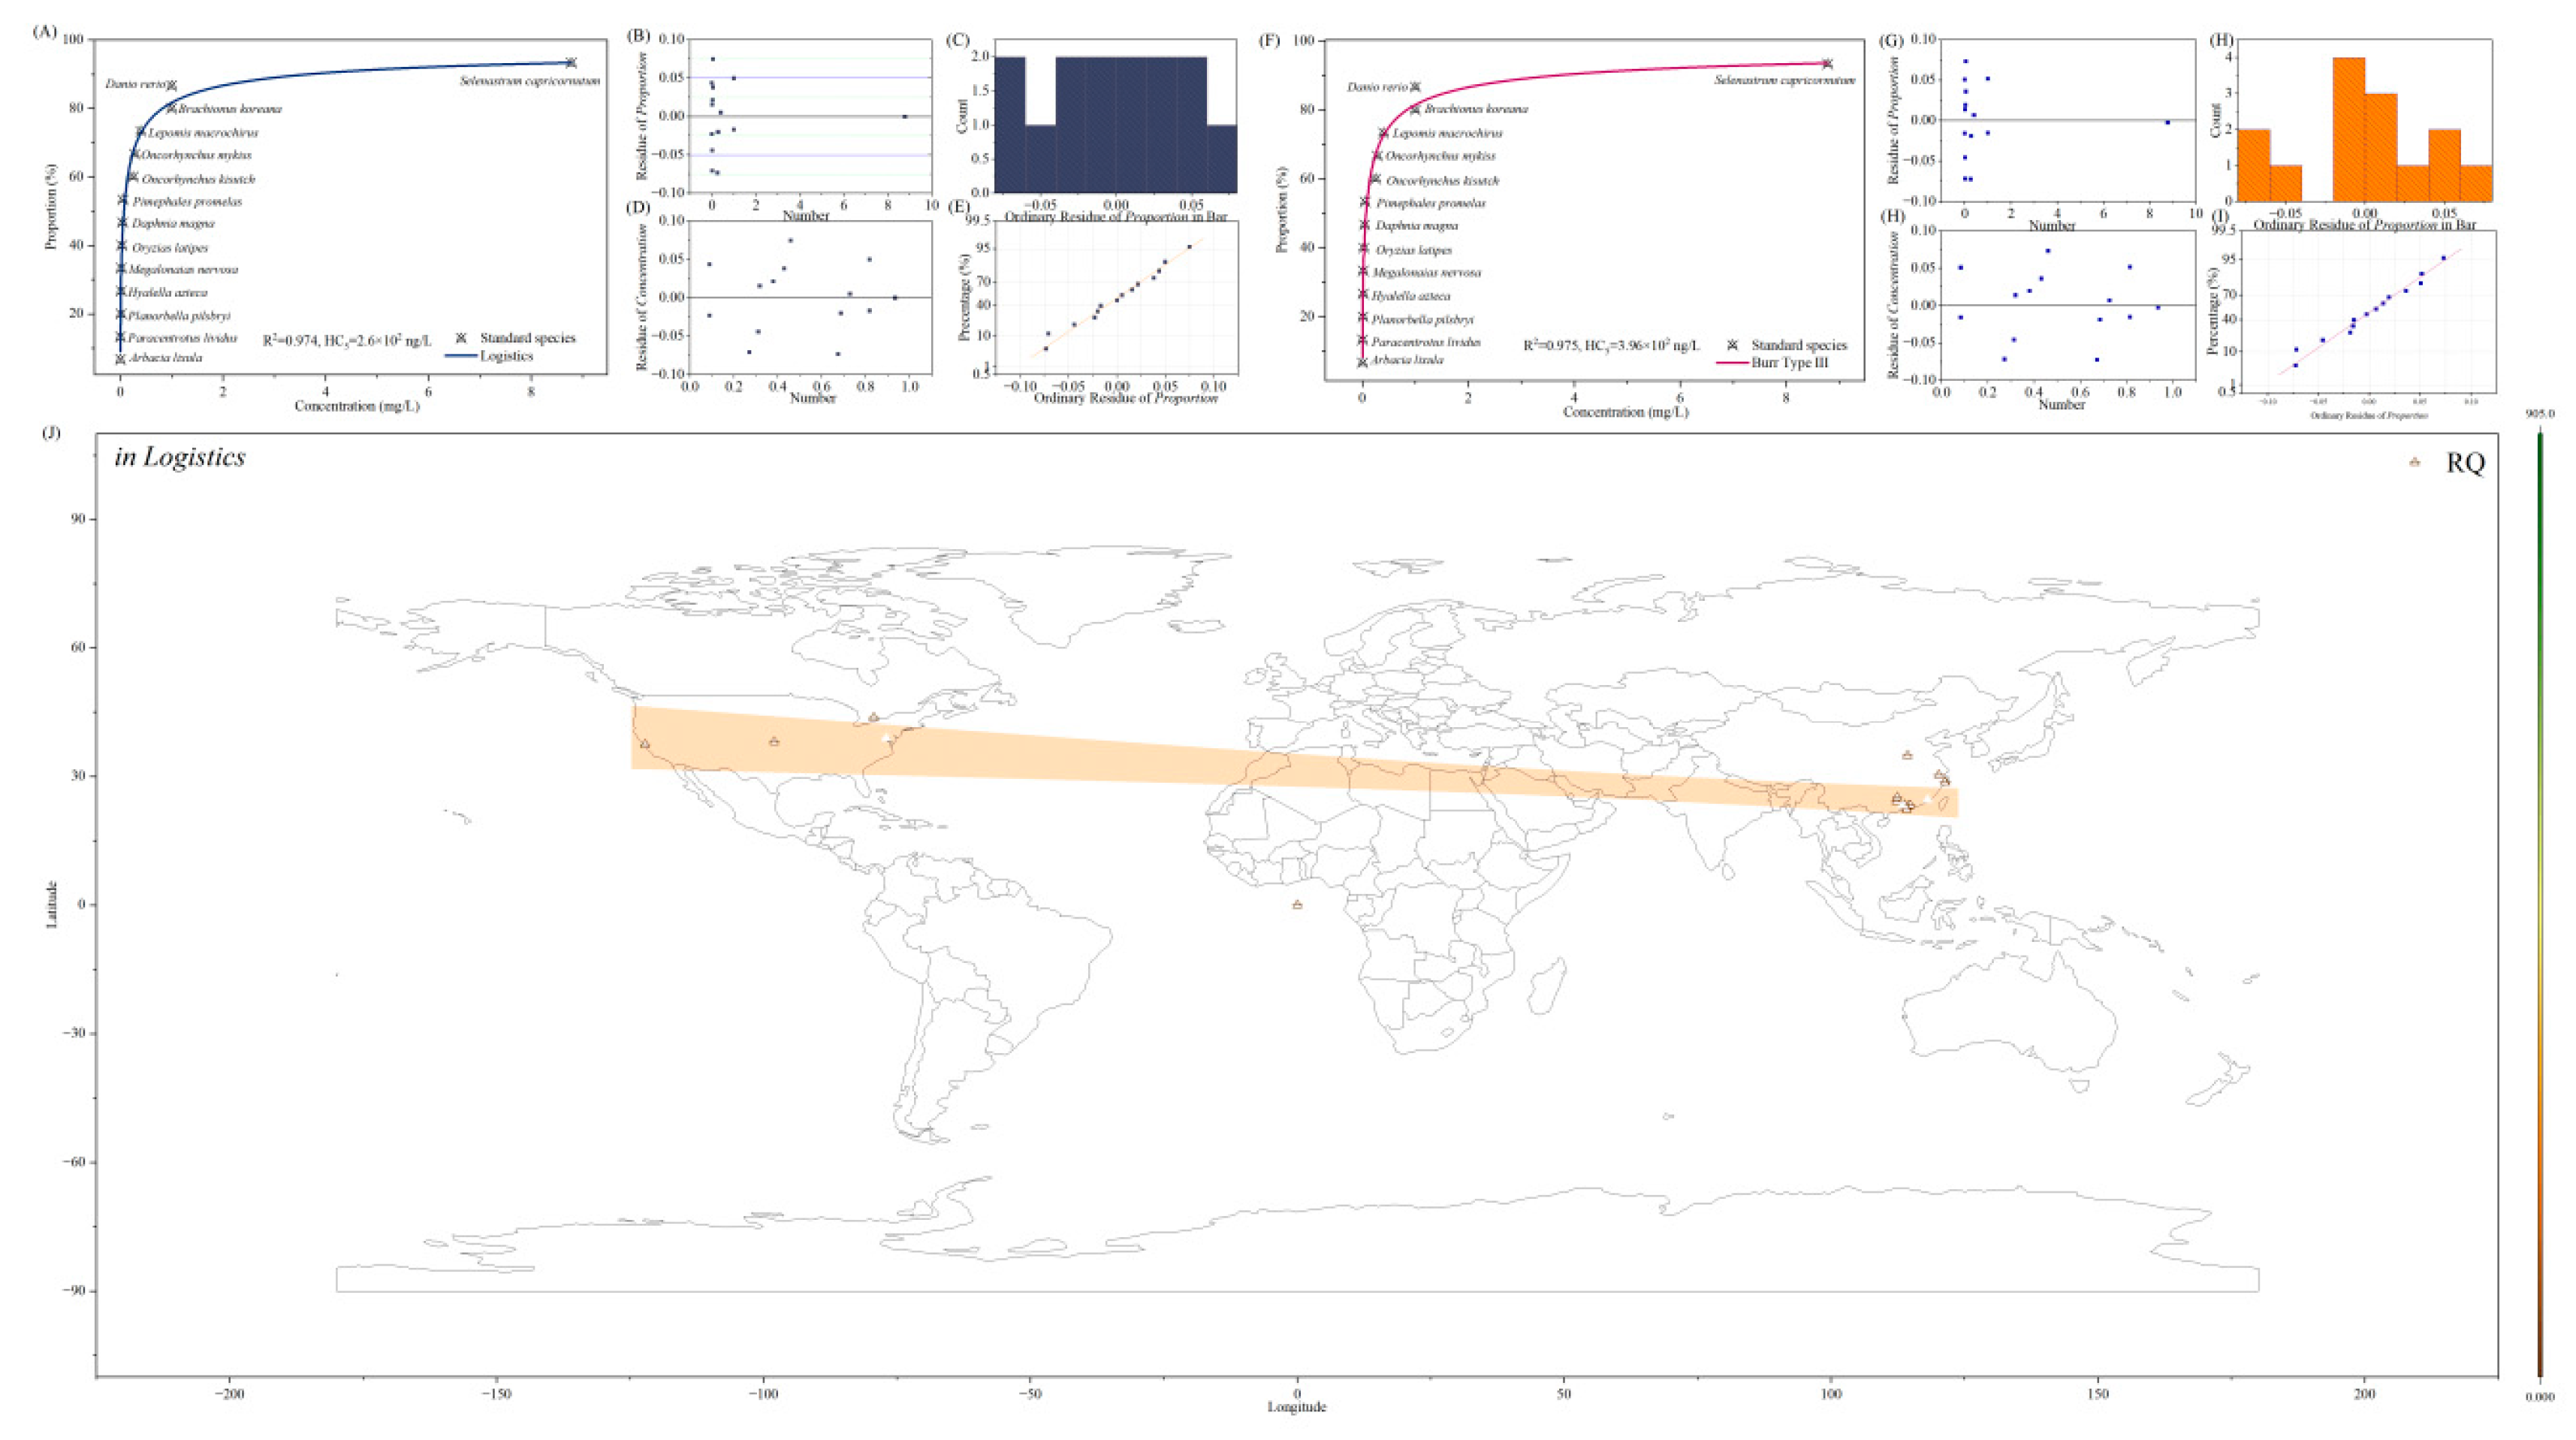
Figure 7.
RQ value map for Daphnia magna, Hexagenia spp., Megalonaias nervosa and Arbacia lixula Note: (A) RQ value map for Daphnia magna. (B) RQ value map for Hexagenia spp.. (C) RQ value map for Megalonaias nervosa. (D) RQ value map for Arbacia lixula.Assessment via link: https://tinyurl.com/24n82fpu.
Figure 7.
RQ value map for Daphnia magna, Hexagenia spp., Megalonaias nervosa and Arbacia lixula Note: (A) RQ value map for Daphnia magna. (B) RQ value map for Hexagenia spp.. (C) RQ value map for Megalonaias nervosa. (D) RQ value map for Arbacia lixula.Assessment via link: https://tinyurl.com/24n82fpu.

Figure 8.
RQ value map for Oncorhynchus kisutch, Oncorhynchus mykiss, Oncorynchus tshawytscha and Paracentrotus lividus. Note: (A) RQ value map for Paracentrotus lividus. (B) RQ value map for Oncorhynchus kisutch. (C) RQ value map for Oncorhynchus mykiss. (D) RQ value map for Oncorynchus tshawytscha. Assessment via link: https://tinyurl.com/2a43tvn7.
Figure 8.
RQ value map for Oncorhynchus kisutch, Oncorhynchus mykiss, Oncorynchus tshawytscha and Paracentrotus lividus. Note: (A) RQ value map for Paracentrotus lividus. (B) RQ value map for Oncorhynchus kisutch. (C) RQ value map for Oncorhynchus mykiss. (D) RQ value map for Oncorynchus tshawytscha. Assessment via link: https://tinyurl.com/2a43tvn7.
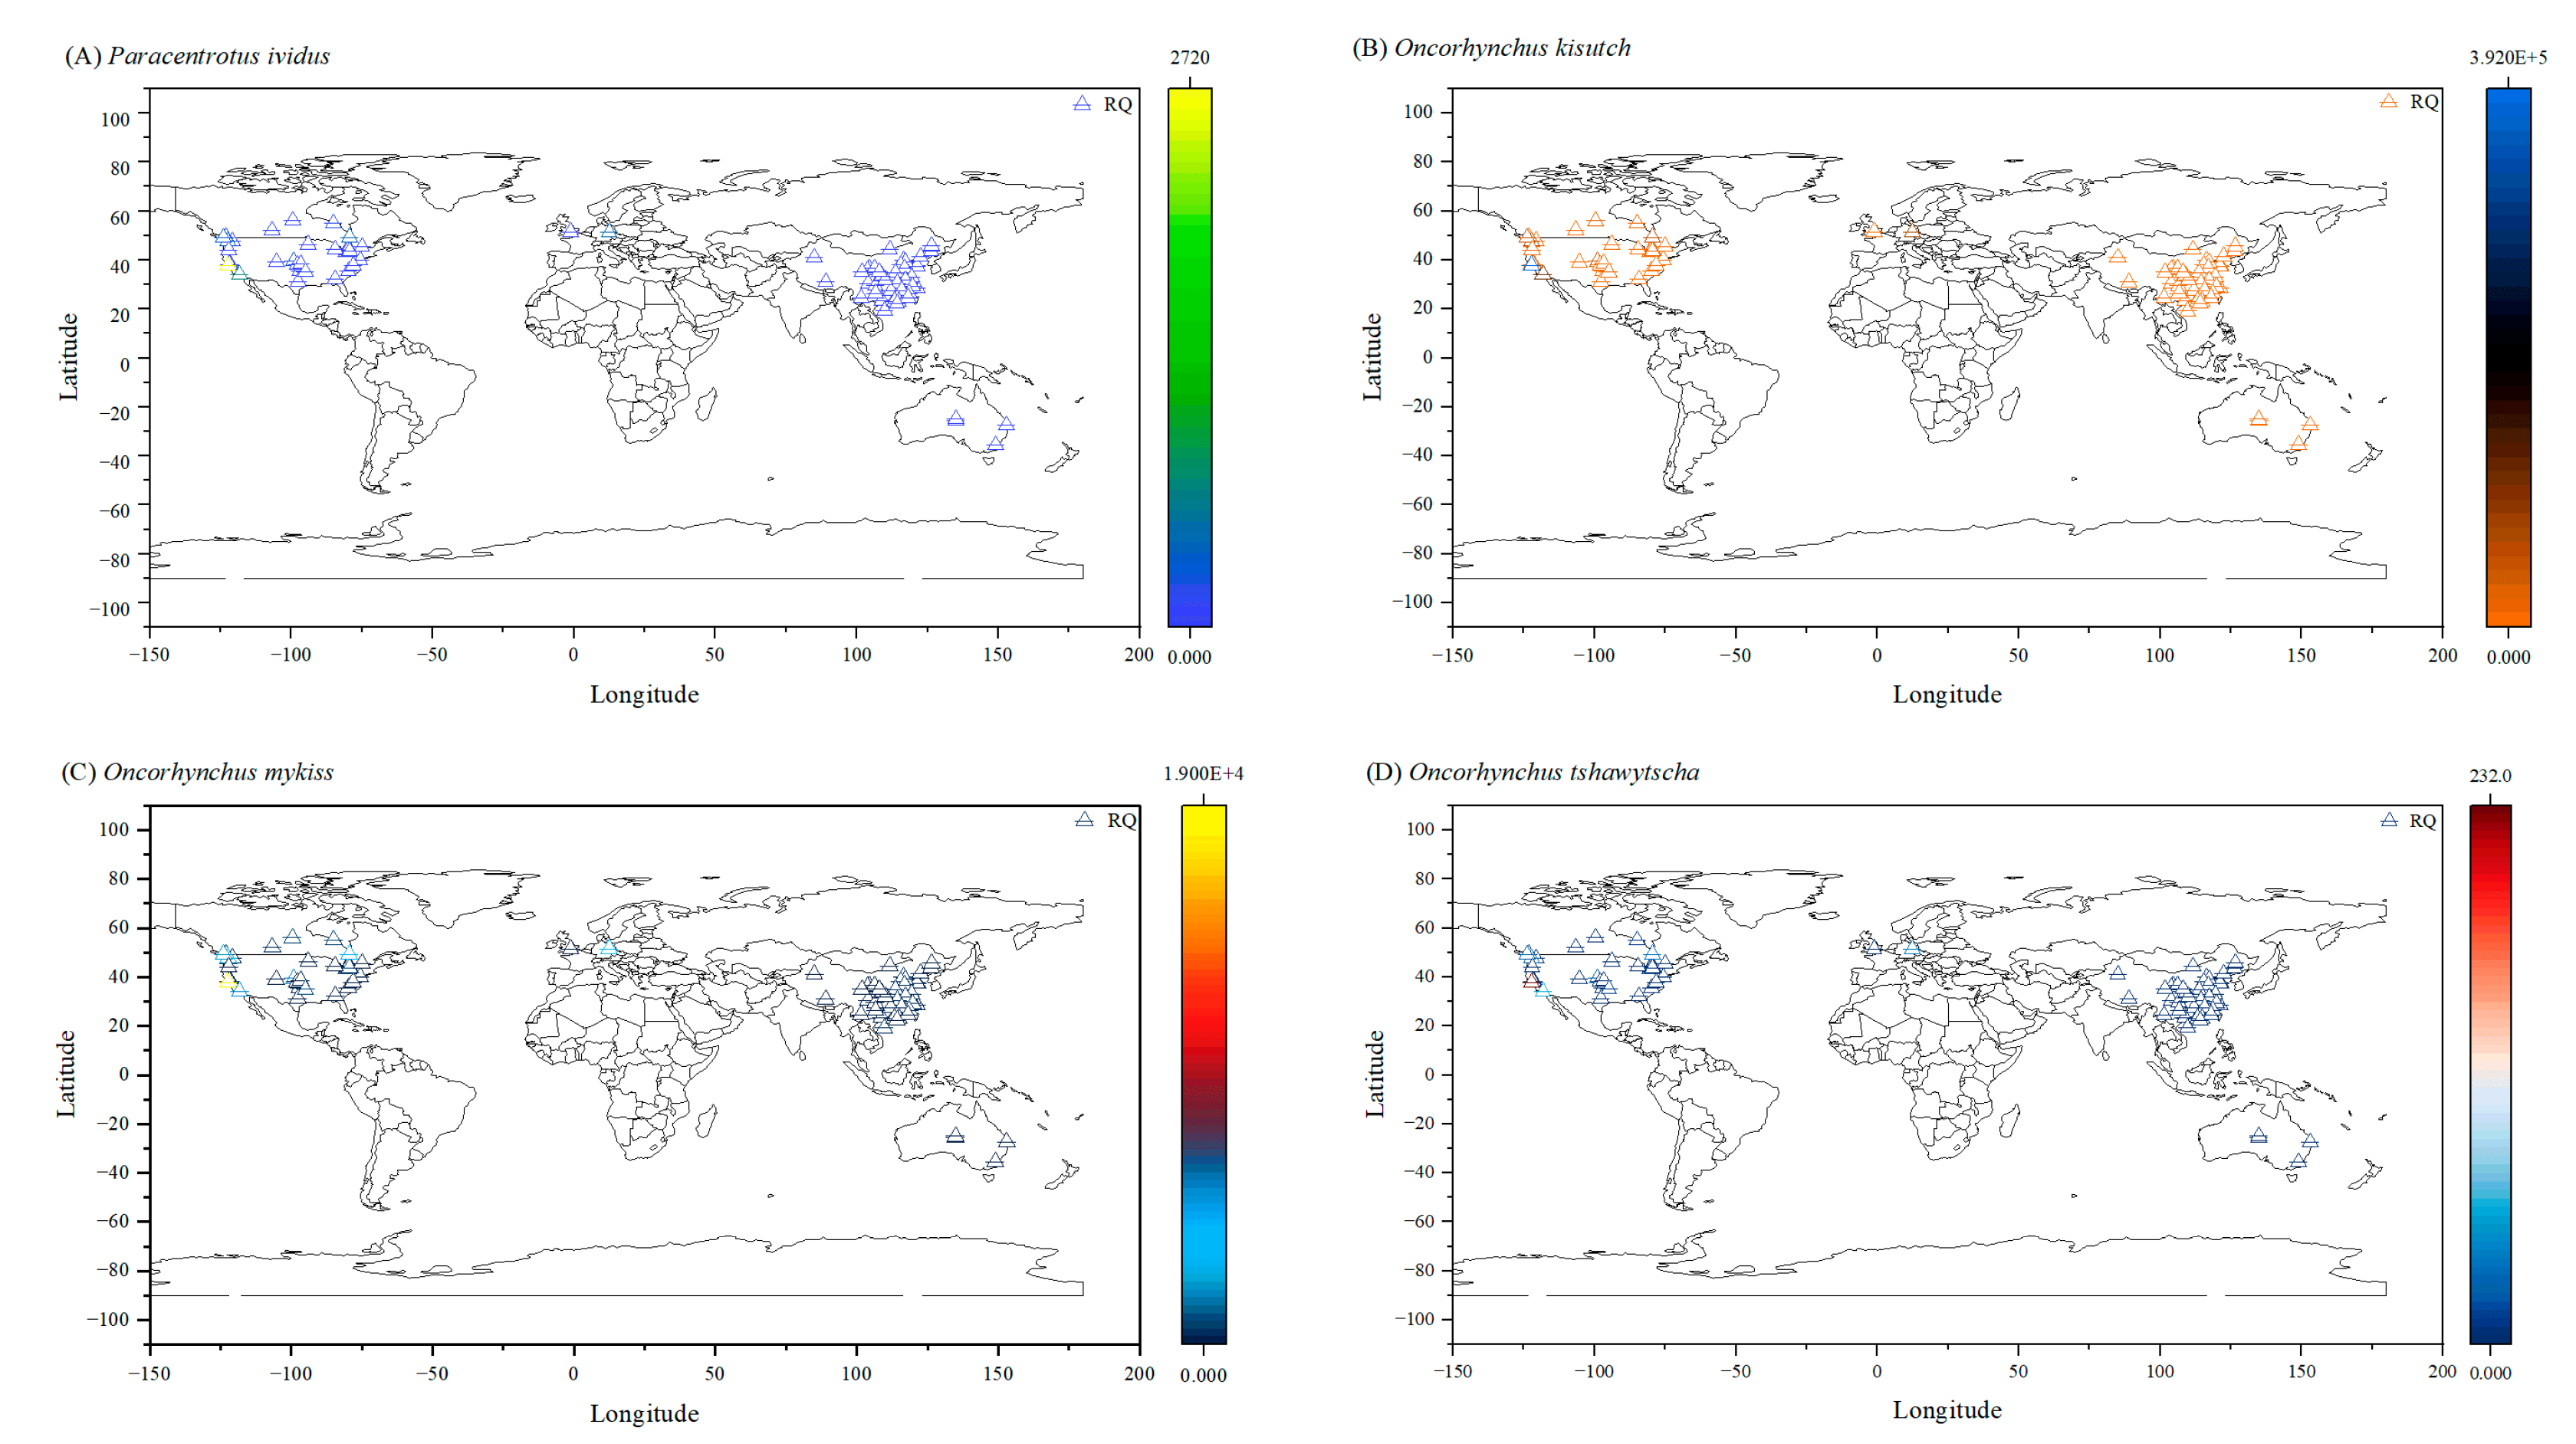
Figure 9.
RQ value map for Salvelinus fontinalis, Salvelinus namaycush, Salvelinus leucomaenis and Danio rerio Note: (A) RQ value map for Salvelinus fontinalis. (B) RQ value map for Salvelinus namaycush. (C) RQ value map for Salvelinus leucomaenis. (D) RQ value map for Danio rerio. Assessment via link: https://tinyurl.com/2xoy6vsh.
Figure 9.
RQ value map for Salvelinus fontinalis, Salvelinus namaycush, Salvelinus leucomaenis and Danio rerio Note: (A) RQ value map for Salvelinus fontinalis. (B) RQ value map for Salvelinus namaycush. (C) RQ value map for Salvelinus leucomaenis. (D) RQ value map for Danio rerio. Assessment via link: https://tinyurl.com/2xoy6vsh.
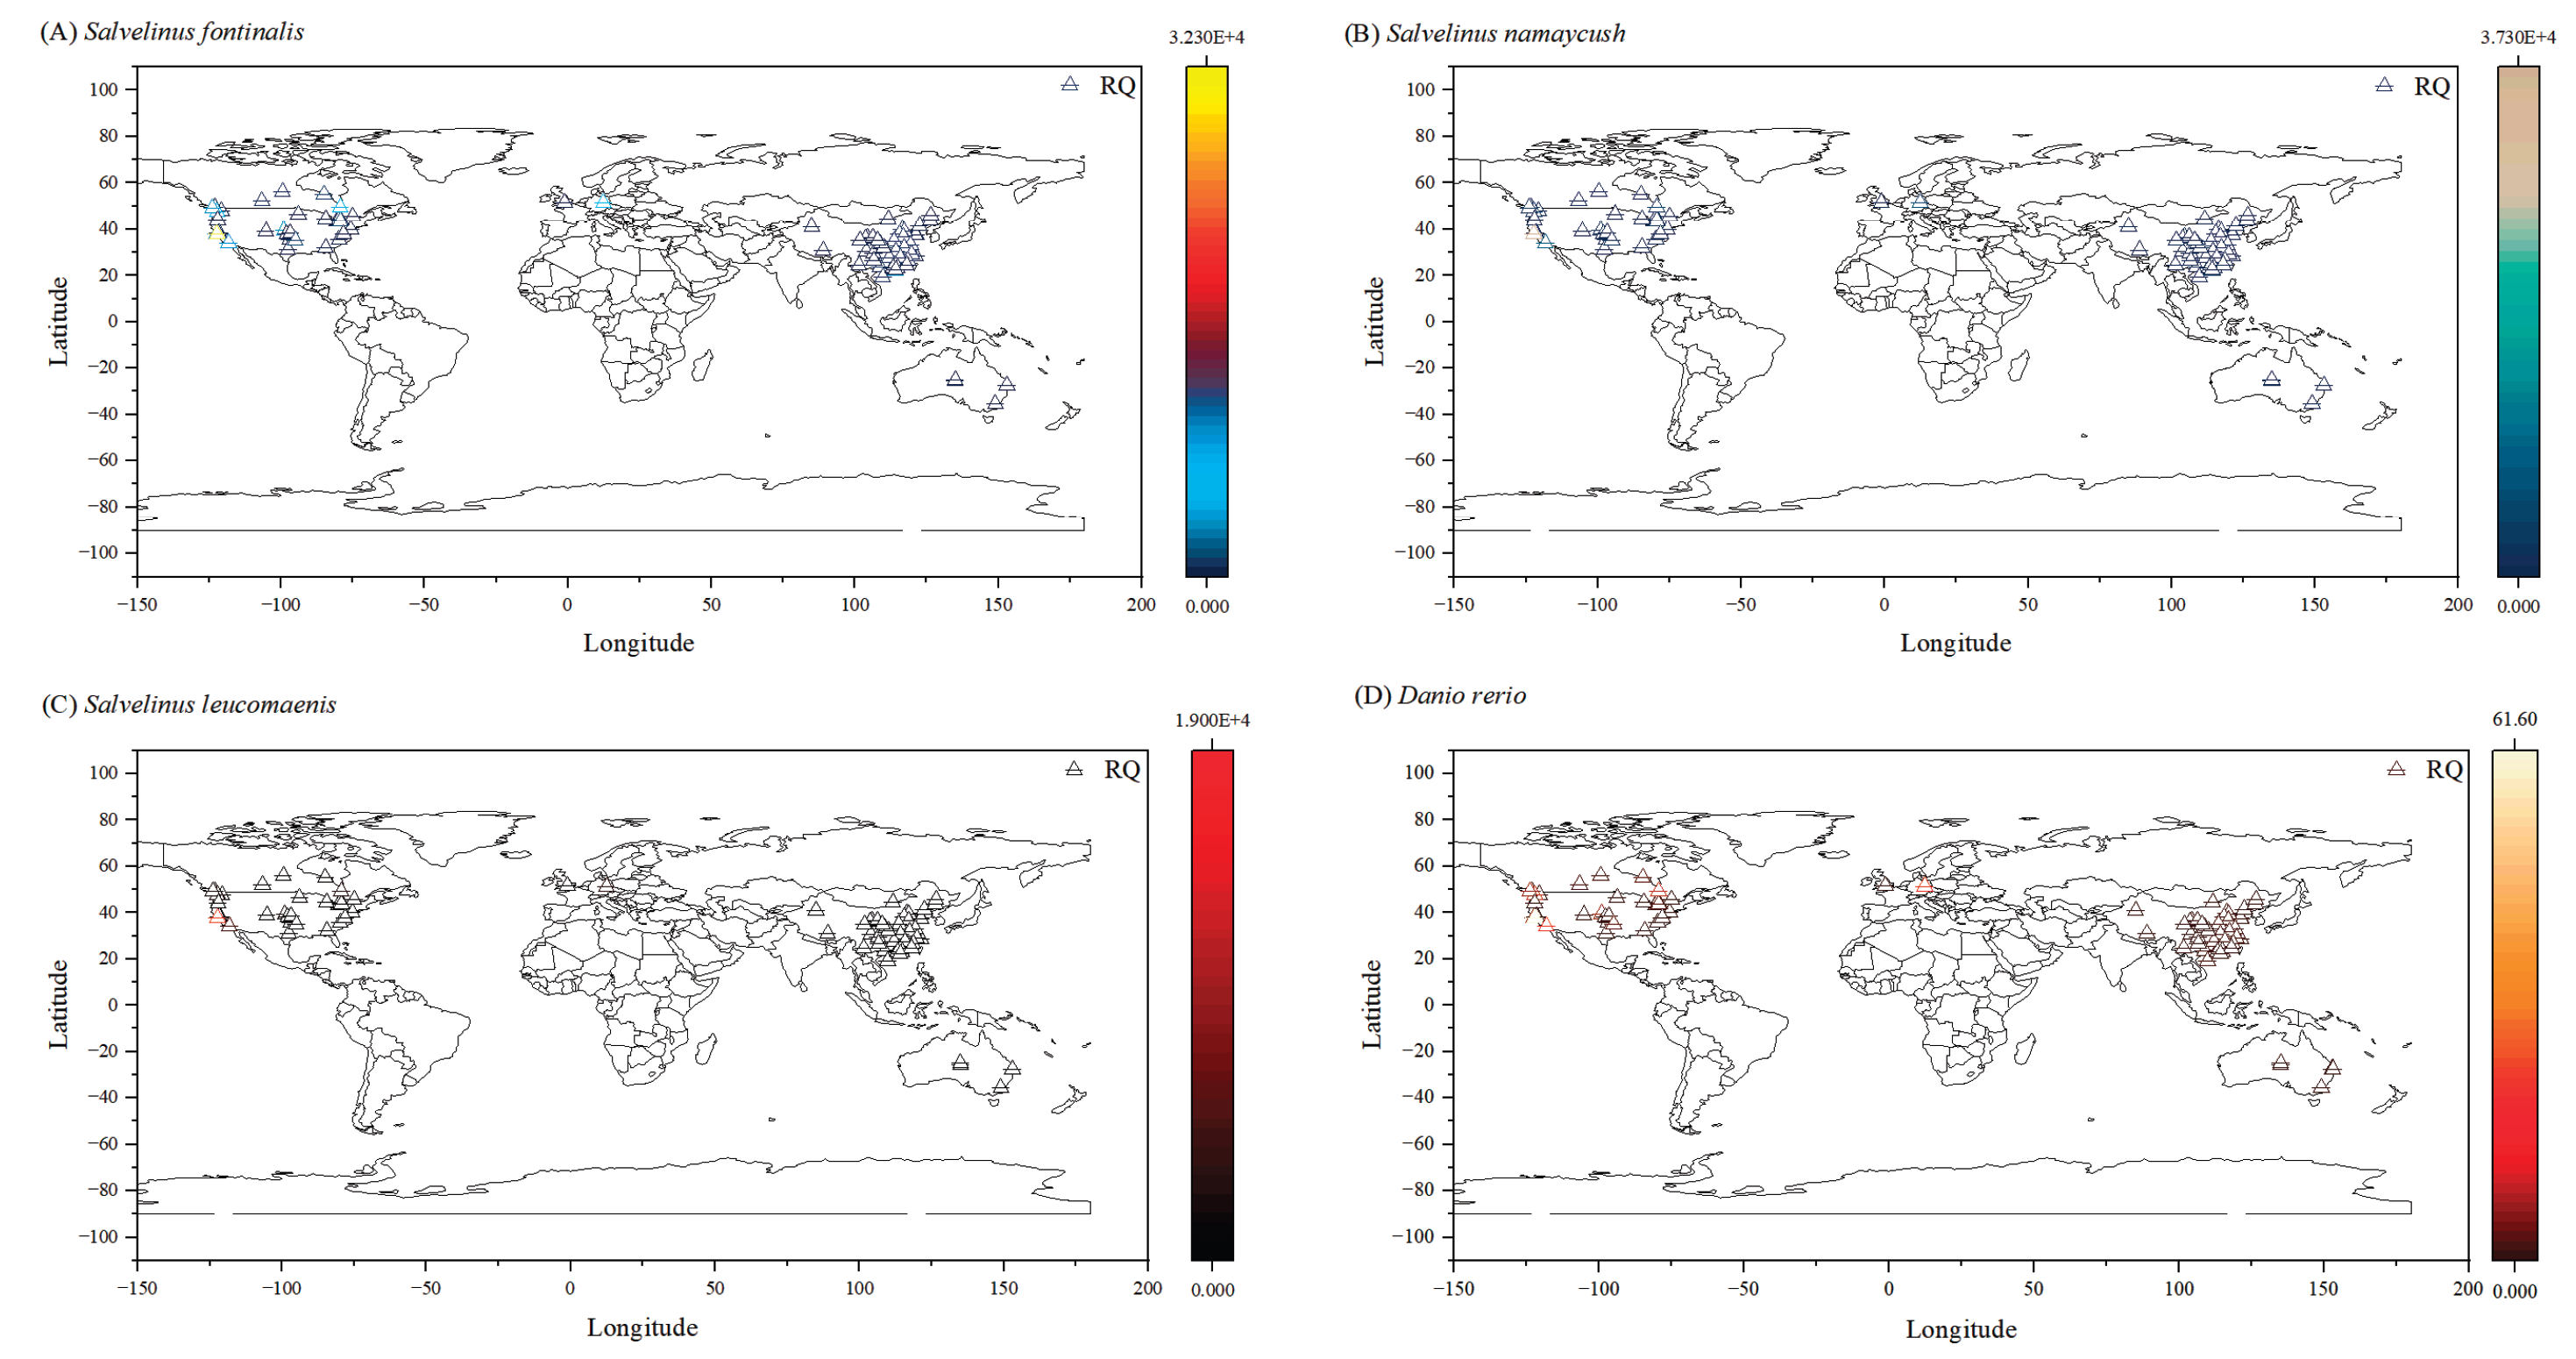

Table 1.
Definitions of symbols and formulas used in data processing.
| Formula Number | Symbol | Meaning Explanation |
|---|---|---|
| (1) | t | Original text fragment or lexical unit |
| Clean() | Cleaning function to remove punctuation and invalid characters | |
| Lower() | Conversion function to convert all characters to lowercase | |
| (2) | t* | Standardized single lexical unit |
| EDi | Set of standardized single-character dictionary entries (Environmental Dictionary) | |
| t1*, t2*, ..., tv* | Specific standardized lexical elements in the dictionary set | |
| (3) | v | Total number of vocabulary items in the dictionary |
| Match | Matching set of environment-related lexical units | |
| ∈ | Belongs to (set inclusion relationship) | |
| (4) | Tnorm | Collection of literature texts after standardization |
| C(e) | Coordinate interval of entity e in the full text | |
| e | Identified environmental entities (e.g., pollutants, locations, etc.) | |
| s(e) | Starting character index (position) of entity e | |
| (5) | t(e) | Ending character index (position) of entity e |
| S | Structured format of standard analysis samples | |
| Ski | The i-th text fragment (Sentence/Segment) | |
| (6) | Eq | Equations or numerical information corresponding to the entity (referring to extracted specific attribute values here) |
| Dclean | Cleaned dataset | |
| Draw | Raw extracted dataset | |
| Replace(..., ‘nan’, ‘’) | Replace null value marker ‘nan’ with empty string | |
| Strip() | Remove whitespace characters from both ends of the data | |
| Rename() | Rename columns or fields (usually for uniform formatting) | |
| (7) | DropNA() | Delete rows or columns containing null values (NA/Null) |
| S | Extraction success rate | |
| Nextracted | Number of successfully extracted data records | |
| (8) | Ntotal | Total number of data records to be extracted |
| I | Valid data integrity | |
| Mvalid | Number of data cells verified as valid |
Table 2.
Proportion of distribution-characteristics Note: ∑Target= The sum of the proportion of entities (6PPD, 6PPD-Q, p-phenylenediamine, quinone and tirewear), else= (1-∑Target)×100%.
Table 2.
Proportion of distribution-characteristics Note: ∑Target= The sum of the proportion of entities (6PPD, 6PPD-Q, p-phenylenediamine, quinone and tirewear), else= (1-∑Target)×100%.
| Entities | Proportion (%) |
|---|---|
| 6PPD | 11.7% |
| 6PPD-Q | 10.9% |
| P-phenylenediamine | 8.50% |
| quinone | 7.80% |
| tirewear | 6.30% |
| ∑Target | 45.2% |
| else | 54.8% |
Table 3.
Proportion of environmental medium distribution-characteristics.
| Entities | Proportion (%) |
|---|---|
| water/aquatic | 5.90 |
| sediment | 5.27 |
| biota | 4.23 |
Table 4.
Toxicity data of species under 6PPD and 6PPD-Q exposure (acute) Note: (A) Toxicity data of 14 species under 6PPD exposure (acute); (B) Toxicity data of 12 species under 6PPD-Q exposure (acute); Ref=Reference.
Table 4.
Toxicity data of species under 6PPD and 6PPD-Q exposure (acute) Note: (A) Toxicity data of 14 species under 6PPD exposure (acute); (B) Toxicity data of 12 species under 6PPD-Q exposure (acute); Ref=Reference.
| ||||||
| Kingdom | Phylum | Class | Order | Scientific Name | EC/LC50 (ng/L) | Ref |
| Plantae | Chlorophyta | Chlorophyceae | Sphaeropleales | Selenastrum capricornutum | 8.78×10⁶ | [30] |
| Animalia | Rotifera | Monogononta | Brachionida | Brachionus koreana | 1.00×10⁶ | [31] |
| Animalia | Arthropoda | Branchiopoda | Anomopoda | Daphnia magna | 0.042×10⁶ | [151] |
| Animalia | Arthropoda | Malacostraca | Amphipoda | Hyalella azteca | 0.017×10⁶ | [32] |
| Animalia | Mollusca | Gastropoda | Basommatophora | Planorbella pilsbryi | 0.012×10⁶ | [32] |
| Animalia | Mollusca | Bivalvia | Unionida | Megalonaias nervosa | 0.018×10⁶ | [32] |
| Animalia | Echinodermata | Echinoidea | Arbacioida | Arbacia lixula | 0.001×10⁶ | [33] |
| Animalia | Echinodermata | Echinoidea | Camarodonta | Paracentrotus lividus | 0.001×10⁶ | [33] |
| Animalia | Chordata | Actinopterygii | Beloniformes | Oryzias latipes | 0.029×10⁶ | [152] |
| Animalia | Chordata | Actinopterygii | Cypriniformes | Danio rerio | 1.00×10⁶ | [44] |
| Animalia | Chordata | Actinopterygii | Cypriniformes | Pimephales promelas | 0.052×10⁶ | [153] |
| Animalia | Chordata | Actinopterygii | Perciformes | Lepomis macrochirus | 0.400×10⁶ | [154] |
| Animalia | Chordata | Actinopterygii | Salmoniformes | Oncorhynchus kisutch | 0.251×10⁶ | [155] |
| Animalia | Chordata | Actinopterygii | Salmoniformes | Oncorhynchus mykiss | 0.280×10⁶ | [154] |
| ||||||
| Animalia | Arthropoda | Branchiopoda | Anomopoda | Daphnia magna | 0.053×10⁶ | [32] |
| Animalia | Arthropoda | Insecta | Ephemeroptera | Hexagenia spp. | 0.042×10⁶ | [32] |
| Animalia | Mollusca | Bivalvia | Unionida | Megalonaias nervosa | 0.018×10⁶ | [32] |
| Animalia | Echinodermata | Echinoidea | Arbacioida | Arbacia lixula | 0.012×10⁶ | [33] |
| Animalia | Echinodermata | Echinoidea | Camarodonta | Paracentrotus lividus | 0.007×10⁶ | [33] |
| Animalia | Chordata | Actinopterygii | Salmoniformes | Oncorhynchus kisutch | 48.5 | [34] |
| Animalia | Chordata | Actinopterygii | Salmoniformes | Oncorhynchus mykiss | 0.001×10⁶ | [42] |
| Animalia | Chordata | Actinopterygii | Salmoniformes | Oncorhynchus tshawytscha | 0.082×10⁶ | [39] |
| Animalia | Chordata | Actinopterygii | Salmoniformes | Salvelinus fontinalis | 5.90×10² | [41] |
| Animalia | Chordata | Actinopterygii | Salmoniformes | Salvelinus namaycush | 5.10×10² | [34] |
| Animalia | Chordata | Actinopterygii | Salmoniformes | Salvelinus leucomaenis | 0.001×10⁶ | [35] |
| Animalia | Chordata | Actinopterygii | Cypriniformes | Danio rerio | 0.309×10⁶ | [156] |
Disclaimer/Publisher’s Note: The statements, opinions and data contained in all publications are solely those of the individual author(s) and contributor(s) and not of MDPI and/or the editor(s). MDPI and/or the editor(s) disclaim responsibility for any injury to people or property resulting from any ideas, methods, instructions or products referred to in the content. |
© 2026 by the authors. Licensee MDPI, Basel, Switzerland. This article is an open access article distributed under the terms and conditions of the Creative Commons Attribution (CC BY) license (http://creativecommons.org/licenses/by/4.0/).
Copyright: This open access article is published under a Creative Commons CC BY 4.0 license, which permit the free download, distribution, and reuse, provided that the author and preprint are cited in any reuse.