
Preprint
Article

This version is not peer-reviewed.

Emerging Digital Academic Cultures in the Age of Generative AI: A Multigroup Study of Academic Integrity Concerns, Satisfaction, and Perceived Learning Benefits of ChatGPT

Submitted:

28 August 2026

Posted:

31 August 2026

You are already at the latest version

Abstract
Generative artificial intelligence is becoming embedded in academic practice as students and institutions negotiate acceptable assistance, originality, authorship, and academic integrity. We analyzed Global ChatGPT Student Survey data to examine relationships among academic-integrity concerns, satisfaction, and perceived learning benefits across national academic settings. The source dataset contained 23,218 records from 108 identifiable countries; the primary multigroup analysis included 8,650 respondents from 15 countries meeting prespecified sample-size, completeness, and model-feasibility criteria. A nine-indicator model assessed the three constructs. Configural and full metric invariance were broadly supported, allowing comparison of structural associations; full scalar invariance was not supported, so latent means were not compared. Satisfaction was positively associated with perceived learning benefits in all 15 countries, whereas associations involving academic-integrity concerns were predominantly negative. Robust omnibus tests detected heterogeneity in path magnitudes, although equality constraints produced only trivial deterioration in global fit. A seven-country robustness analysis (N = 5,871) reproduced the directional pattern and heterogeneity evidence. By evaluating measurement comparability before cross-national structural comparison, the study shows that broadly shared relational patterns can coexist with contextual variation in emerging digital academic cultures.
Keywords: 
;  ;  ;  ;  ;  ;  ;  
Subject: 
Social Sciences  -   Education

1. Introduction

Generative artificial intelligence (GenAI) is becoming part of the environment in which university students search for information, develop ideas, write, revise, and complete academic work. Student studies and reviews describe perceived support for explanation, personalized learning, brainstorming, writing, research, task completion, and efficiency, while also emphasizing accuracy, overreliance, pedagogical, and governance concerns [1,2,3,4,5,6]. These reports document changing practices and evaluations; they do not establish universal adoption or objective learning gains.
GenAI is not simply an external tool added to otherwise unchanged education. Academic culture is produced through shared and contested meanings, practices, expectations, and forms of participation [7]. As generative systems become involved in everyday study, technology, institutional purposes, values, teaching methods, and user practices increasingly interact with and shape one another [8,9]. The phrase emerging digital academic cultures is used here for the evolving and contested norms, meanings, practices, and expectations through which academic communities interpret legitimate assistance, authorship, evidence, disclosure, and participation. It is an analytical concept, not a claim that technology automatically enhances learning or that culture was directly measured [10].
These negotiations concern legitimate knowledge production. Academic communities authorize some forms of help and prohibit others; they attach credit to authorship, distinguish original contribution from plagiarism, and decide when disclosure is necessary for trust in AI-supported work. Academic integrity is therefore not only a rule-compliance issue but a values-and-practice domain whose boundaries can be contested and reworked [7,11,12]. Governance frameworks likewise emphasize education, disclosure, accountability, human responsibility, and context-sensitive guidance rather than a single undifferentiated rule for every use [13,14].
Students’ accounts of GenAI commonly combine optimism with reservation. In a Hong Kong survey, students described potential support for personalized learning, writing, brainstorming, research, and analysis while also reporting concerns about accuracy, privacy, ethics, overreliance, and uncertain institutional policies [1]. Other studies show generational differences in adoption interest, distinguish grammar-related assistance from whole-essay generation, and associate GenAI use with both perceived support and possible adverse consequences [15,16,17]. Reviews of early educational use similarly emphasize that opportunities and risks coexist [18].
The present study focuses on one bounded part of this negotiation: academic-integrity concerns. The construct comprises beliefs that ChatGPT might encourage cheating, encourage plagiarism, and threaten the ethics of study. These items address perceived integrity implications rather than a general negative attitude toward technology. A fourth survey item concerning increased social isolation was evaluated during measurement development but was not included in the primary factor because its substantive content and measurement behavior differed from the other three indicators. It was retained in the dataset and in a prespecified alternative measurement analysis; it is not described as invalid.
The boundary between legitimate support and substitution is unlikely to be settled by a single rule applied to every academic act. Brainstorming, grammar correction, translation, source discovery, coding assistance, summarization, and full-text generation may carry different implications depending on course goals, assessment design, discipline, disclosure, and institutional policy [13,14,16,19]. Academic-integrity concerns may therefore shape how students evaluate GenAI without determining those evaluations uniformly.
Satisfaction and perceived learning benefits are related but distinct evaluations. Satisfaction in this study concerns ChatGPT’s assistance, information quality, and information accuracy. Perceived learning benefits concern reported study efficiency, facilitation of completing studies, and assignment quality. Prior research links perceived impact, efficiency, usefulness, and task accomplishment to favorable evaluations of educational systems and GenAI [20,21,22]. Yet feeling that one has learned or benefited need not correspond to objectively measured learning [23]. The present learning-benefits factor records students’ perceptions, not grades, retained knowledge, transfer, or independently scored performance.
An appraisal-informed perspective provides a bounded conceptual link among the three constructs. Appraisal theory treats responses as shaped by evaluations of what an encounter means for a person’s goals and values [24]. Here, academic-integrity concerns can be viewed as ethical evaluations, satisfaction as an affective-evaluative response to assistance and information, and perceived learning benefits as judgments of academic usefulness. This framing is conceptually consistent with the model but is not a complete cultural theory, a measured temporal process, or evidence that concerns causally precede satisfaction.
This formulation is consistent with evidence that perceived efficiency, usefulness, productivity, and task accomplishment are positively associated with favorable evaluations of ChatGPT use [20,25], and with qualitative evidence that students can experience GenAI-supported writing as helpful while identifying system-, student-, and task-related challenges [21]. It treats satisfaction neither as simple approval of GenAI nor as proof of educational effectiveness.
The meaning and strength of these relationships may be contextually situated. Students encounter GenAI within different combinations of institutional guidance, academic-integrity expectations, assessment practices, digital access, prior AI experience, and survey-language environments. Such conditions may shape how students understand the same questionnaire wording or how strongly one evaluation is associated with another. These are plausible contextual influences, not variables directly tested as explanations in this study.
Cross-national evidence is useful here not because the countries provide a cultural score, but because it locates respondents within differently organized national academic environments. A relationship reproduced across countries can indicate a shared digital academic pattern; variation in strength can indicate contextual calibration. Neither result establishes one culture per country, attributes variation to national culture, or makes the included samples nationally representative.
Cross-national structural comparison requires a measurement step before substantive relationships can be compared. Measurement-invariance analysis evaluates whether the same construct is represented comparably across groups. Configural invariance assesses the factor pattern, metric invariance supports comparison of structural relationships, and scalar invariance is required before latent means can be compared [26,27,28,29]. The present design therefore evaluates measurement comparability before structural heterogeneity and does not interpret latent means when scalar invariance is unsupported.
Cross-national research on students’ GenAI perceptions remains limited, and existing multinational studies have more often emphasized descriptive comparisons, regression-based analyses, or cross-language instrument validation than multigroup latent structural relationships evaluated after establishing measurement comparability [30,31,32]. As a result, it remains unclear whether academic integrity concerns, satisfaction, and perceived learning benefits are represented similarly across national settings and whether the relationships among these constructs remain broadly consistent once measurement comparability is taken into account. This distinction matters because apparent cross-national differences can be difficult to interpret when it is unknown whether respondents across groups are relating to the underlying constructs in comparable ways. The present study therefore examines both measurement comparability and cross-national variation in the structural relationships among these three evaluations.
Using secondary data from the Global ChatGPT Student Survey [30,33], we address this gap by first evaluating whether the three constructs are measured comparably across the selected countries and then examining whether their structural relationships vary across those settings. The source file contained 23,218 records from 108 identifiable countries, whereas the primary analysis was restricted to 15 countries meeting prespecified sample-size, completeness, and model-feasibility requirements. The excluded countries are not less important; their data simply did not meet the analytical requirements for the present multigroup model. Our contribution is therefore both substantive and methodological: we examine whether a common pattern links academic integrity concerns, satisfaction, and perceived learning benefits across different national academic environments while ensuring that the structural comparisons rest on an adequate measurement basis.
The study addresses the following research questions:
RQ1. Does the measurement structure of academic integrity concerns, satisfaction, and perceived learning benefits demonstrate acceptable equivalence across the selected countries?
RQ2. Do the structural relationships among academic integrity concerns, satisfaction, and perceived learning benefits show evidence of heterogeneity across the selected countries?
RQ3. Are academic integrity concerns indirectly associated with perceived learning benefits through satisfaction across the selected countries?

2. Materials and Methods

2.1. Study Design and Data Source

This study is a secondary analysis of cross-sectional, observational data from the Global ChatGPT Student Survey. We examined the relationships among academic integrity concerns, satisfaction with ChatGPT, and perceived learning benefits across selected countries. Country of study served as the grouping variable for the cross-national analysis rather than as a direct measure of culture. Because the data were collected at a single point in time, the study does not support causal inference.
Data were obtained from Higher Education Students’ Early Perceptions of ChatGPT: Global Survey Data, Version 1, published in Mendeley Data on 13 August 2024 under a CC BY 4.0 license [33]. The accompanying dataset article provides detailed information about the Global ChatGPT Student Survey and its early multinational findings [30]. The survey was launched online on 9 October 2023, and international partners began data collection at different times depending on applicable local ethics requirements. Data collection ended on 29 February 2024.
Participants were recruited through convenience sampling, including classroom promotion and advertisements on university communication systems. To participate, students had to be currently enrolled at any level in a higher education institution, be at least 18 years old, and have the legal capacity to provide voluntary consent. The original survey was conducted in accordance with the Declaration of Helsinki and applicable local ethics procedures. The dataset article reports approvals from the University of Oran 1 (03/CED/FACMED/2023), University of Nicosia and European University Cyprus (EEBK EII 2023.01.318), Polytechnic University in Ecuador (C-22), University of Verona (2023_25), Yamanashi Gakuin University (23-010), University of Luxembourg (ERP 23-101 StuPer ChatGPT SA/cd), Imam Abdulrahman Bin Faisal University (IRB-2024-02-091 and IRB-2024-10-316), University of Chester (ASCHPR0211/23), and University of East London (ETH2324-0028). Where separate approval was not required, the original study followed the first approval granted on 24 October 2023 [30]. No separate institutional ethics determination was obtained for our secondary analysis of the publicly available data.
The English questionnaire informed students that participation was voluntary and that their responses would be used for research and reported only in aggregate form. Before beginning the questionnaire, respondents confirmed that they were currently enrolled in higher education, were at least 18 years old, had the legal capacity to consent, and understood that participation was voluntary. Proceeding with the questionnaire constituted consent to participate and to have their responses processed for research purposes. The dataset article further reports that participants could withdraw at any time without consequences and that the consent procedure was reviewed through the applicable ethics or institutional-review processes [30,33].
The questionnaire was originally developed in English. A preliminary version was validated with students from Slovenia, and the final questionnaire was refined following pilot-test feedback. It was subsequently translated into Italian, Spanish, Turkish, Japanese, Arabic, and Hebrew by native speakers who were proficient in English. Repository documentation identifies the questionnaire-language codes as EN, IT, ES, TR, JP, AR, and HE. No additional back-translation, cultural-adaptation, or cross-language equivalence procedures beyond those reported by the original study were documented.

2.2. Participants and Analytical Samples

The raw dataset contained 23,218 records representing 108 identifiable countries of study. An additional 70 records were coded as Other: and 301 had missing country information. We retained all records, including those coded Other: and those with missing country information, in the protected working dataset. One probable duplicate was excluded only from the primary full-sample descriptive summaries, resulting in 23,217 records. The flagged record had no data on the proposed indicators and therefore did not affect the construct-level or latent-variable analyses.
Within the primary descriptive sample of 23,217 records, 16,010 respondents were classified as prior ChatGPT users. For the nine-indicator measurement model, 14,523 prior users had at least one observed indicator and were therefore eligible for full-information maximum-likelihood (FIML) estimation. Of these respondents, 13,359 had data on all three constructs, and 13,201 had complete data on all nine indicators. Eligibility for each analysis was determined using only the variables required for that analysis.
The primary multigroup analysis included 8,650 FIML-eligible respondents from 15 countries: Brazil, Bulgaria, Chile, Cyprus, Ecuador, Egypt, Ghana, Italy, Latvia, Mexico, Romania, Spain, Tanzania, The Philippines, and Turkey. Country-specific analytical sample sizes are reported in Table 1. We also defined a seven-country robustness sample of 5,871 respondents from Chile, Ecuador, Egypt, Italy, Mexico, Romania, and Spain. This smaller sample was used to examine whether the main structural pattern remained consistent under stricter sample-size and completeness requirements.
In the primary 15-country analytical sample (N = 8,650), age was available for 8,619 respondents after cleaning (M = 22.8 years, SD = 6.2, median = 21, range = 18–70). Among respondents with valid gender data, 50.7% identified as female, 47.9% as male, 0.5% as other, and 1.0% preferred not to say. Among valid responses, 77.6% studied at publicly or government-funded institutions, and 85.8% were full-time students. Distributions by level and field of study are reported in Table 1, while demographic characteristics of the 23,217-record primary descriptive sample and the 5,871-record robustness sample are provided in Table S1 and Table S2.
We determined country eligibility before examining country means, country-specific correlations, or structural estimates. The study-defined thresholds required at least 300 Model B FIML-eligible respondents, at least 200 cases with complete data on all nine indicators, and a complete-nine-to-FIML ratio of at least 80%. These thresholds were intended to support stable country-specific estimation, adequate complete-case coverage, and interpretable multigroup comparisons; they are not presented as universal recommendations. All 15 countries met these requirements. For the seven-country robustness analysis, we applied stricter thresholds of at least 500 FIML-eligible respondents, at least 300 complete-nine cases, and at least 80% complete-nine coverage.
Country selection also considered data completeness, questionnaire-language composition, model feasibility, and the interpretability of the country grouping. Records coded Other: or with missing country information remained in the protected datasets but were not assigned to a country group and were therefore not included in country-specific or multigroup analyses. Questionnaire-language composition was treated as descriptive information about the samples rather than as evidence of measurement noninvariance. This approach allowed us to preserve the available data while keeping the cross-national comparisons restricted to clearly identifiable country groups that met the analytical requirements.

2.3. Measures

Academic integrity concerns were measured using three items: Q22b, “ChatGPT might encourage students to cheat”; Q22c, “ChatGPT might encourage students to plagiarize”; and Q22d, “ChatGPT might threaten the ethics of the study.”
Satisfaction was measured using three items assessing satisfaction with the assistance provided by ChatGPT (Q24e), the quality of information provided by ChatGPT (Q24f), and the accuracy of the information provided by ChatGPT (Q24g).
Perceived learning benefits were measured using three items: Q26e, “ChatGPT can increase my study efficiency”; Q26g, “ChatGPT can facilitate completing my studies”; and Q26j, “ChatGPT can improve the quality of my assignments.”
All nine primary indicators used the same five-category agreement scale: 1 = Strongly disagree, 2 = Disagree, 3 = Neutral, 4 = Agree, and 5 = Strongly agree. Higher scores indicated greater academic integrity concerns for Q22b–Q22d, greater satisfaction for Q24e–Q24g, and greater perceived learning benefits for Q26e, Q26g, and Q26j. None of the primary indicators was reverse coded. The Italian, Spanish, Turkish, Japanese, Arabic, and Hebrew questionnaire versions were not available to the authors for direct verification of language-specific item wording and response anchors.
Q22i, “ChatGPT might increase social isolation,” was examined as part of an alternative four-item concern model but was not included in the primary academic integrity concerns factor because it reflects a broader social consequence rather than academic integrity. Q22i was retained in the dataset and was not treated as an invalid item. The comparison of the three-item and four-item concern models is reported in Section 3.2.

2.4. Data Preparation

We conducted the analysis in Stata 19.5. An institution-identification field was removed before creation of the protected analytical dataset and was not used in any analysis or output. The original Q3 age variable was retained, and a separate cleaned age variable treated values outside 18-100 as missing; a separate flag identified invalid original ages. Original country values and the variable source were retained without recoding or renaming. Repository documentation identifies source as the questionnaire-language code: EN = English, IT = Italian, ES = Spanish, TR = Turkish, JP = Japanese, AR = Arabic, and HE = Hebrew.

2.5. Statistical Analysis

Item descriptives used the primary descriptive sample. Corrected item-total correlations, Cronbach alpha, standardized alpha, average interitem correlations, and alpha if an item was deleted used construct-specific complete cases. Reliability was treated as descriptive evidence rather than proof of unidimensionality or validity. The four-item ethical and social concern option and the three-item academic integrity concerns option were compared.
We estimated the confirmatory factor and structural equation models in Stata 19.5 using SEM with method(mlmv) and vce(robust). Full-information maximum likelihood used every retained record with at least one modeled indicator under a missing-at-random assumption conditional on the model; no claim of missing completely at random was made. Complete-case sample sizes were reported for comparison but were not the primary estimation samples. Across the 23,217-record descriptive denominator, item missingness was 37.64%–42.39%; this denominator includes routing or nonapplicability patterns whose exact status could not be separated from ordinary nonresponse. Within the primary 15-country FIML sample, item missingness was 0.22%–6.98%. Detailed denominators are reported in Table S5.
The nine indicators used five ordered response categories spanning the full observed 1–5 range, with absolute skewness below 1. For the primary analyses, we treated the indicators as approximately continuous and estimated the SEMs using robust maximum likelihood. Because the indicators are ordinal by design, we also conducted an ordered-categorical sensitivity analysis. The pooled ordered-probit CFA reproduced strong positive loadings on the intended factors; however, the 15-country multigroup ordinal models required for threshold-based invariance testing did not converge under the evaluated specifications. We therefore retained the robust continuous-variable SEM as the primary analytic framework and treated the ordinal analysis as supplementary sensitivity evidence.
Robust Huber-White sandwich standard errors and confidence intervals were used for parameter inference. Because likelihood-based global fit indices were unavailable after MLMV estimation with robust VCE, each model was refit with the identical method(mlmv) specification and vce(oim) solely to retrieve conventional chi-square, RMSEA and its 90% confidence interval, CFI, TLI, AIC, BIC, and unscaled likelihood-ratio comparisons. Point estimates were numerically equivalent across the robust and OIM fits. SRMR was unavailable for FIML models with missing indicators.
Two correlated three-factor CFAs were estimated before choosing the primary indicator set. Model A used Q22b, Q22c, Q22d, and Q22i for a broader ethical and social concern factor. Model B used Q22b-Q22d for the focused academic integrity concerns factor. Both models used the same satisfaction and perceived-learning-benefits indicators. Because the models contained different observed-variable sets, no chi-square difference test was used as a direct comparison, and AIC/BIC were not treated as decisive across models.
Model B used Q22b, Q24e, and Q26e as marker indicators. Model evaluation considered convergence, global fit, standardized loadings and residual variances, latent correlations, improper-solution diagnostics, Cronbach alpha, composite reliability, average variance extracted, and whether the square root of AVE exceeded the largest absolute factor correlation. No residual covariance, item parcel, or indicator removal was introduced.

2.6. Measurement-Invariance Testing

We evaluated measurement invariance sequentially in the 15-country sample [26,27,28,29]. The configural model specified the same three-factor pattern in every country while allowing loadings, item intercepts, residual variances, latent variances, and latent covariances to differ. Marker scaling was held consistent across groups. The full metric model constrained corresponding unstandardized factor loadings to be equal across countries while leaving item intercepts, residual variances, latent variances, and latent covariances free. The full scalar model retained the loading constraints and additionally constrained corresponding item intercepts to equality across countries.
Changes in model fit were evaluated using a maximum CFI decrease of .010 and a maximum RMSEA increase of .015, together with convergence, overall model fit, consistency of the factor pattern, and checks for improper solutions. A significant chi-square difference test was not used as the sole criterion for determining invariance. Partial scalar invariance was not pursued, and latent means were compared only if full scalar invariance was supported.

2.7. Structural Model and Indirect Associations

The primary 15-country structural model retained full metric loading invariance while allowing item intercepts, indicator residual variances, latent variances, and endogenous latent residual variances to vary across countries. Scalar invariance was not imposed. Academic integrity concerns were specified as exogenous. Satisfaction was regressed on academic integrity concerns, and perceived learning benefits were regressed on both academic integrity concerns and satisfaction. All three structural paths were freely estimated in every country.
The freely estimated structural model is a reparameterization of the freely covarying three-factor full metric model; its global fit was therefore expected to be numerically equivalent. This equivalence was used only as a specification check. Robust Wald tests evaluated omnibus equality of (a) academic integrity concerns with satisfaction, (b) the direct association of academic integrity concerns with perceived learning benefits, (c) satisfaction with perceived learning benefits, and (d) all three path families jointly. Four constrained comparison models set each path family or all three families equal across countries. Changes in descriptive fit were reported relative to the freely estimated model; conventional unscaled likelihood-ratio tests were reported separately.
The indirect association of academic integrity concerns with perceived learning benefits through satisfaction was calculated as the product of the concerns-to-satisfaction and satisfaction-to-learning coefficients. Country-specific standard errors and confidence intervals used the first-order delta method with the robust sandwich covariance matrix, and a nonlinear robust Wald test evaluated omnibus equality of the country-specific products. The structural ordering represents a theoretically specified decomposition of concurrent associations. Because all constructs were measured at the same occasion, alternative directional orderings may reproduce the observed covariance structure. The indirect association should therefore not be interpreted as evidence of temporal or causal mediation.

2.8. Robustness Analysis

The seven-country robustness analysis repeated the configural, full metric, freely varying structural, constrained structural, and indirect-association procedures in Chile, Ecuador, Egypt, Italy, Mexico, Romania, and Spain (FIML N = 5,871). It retained the same indicators, estimator, missing-data rule, loading constraints, free item intercepts, and structural specification. The metric gate passed before the structural sequence was interpreted.
All coefficients are interpreted as cross-sectional associations and indirect products as indirect associations, not causal mechanisms. Omnibus tests identify heterogeneity within a path family but do not identify country pairs; no pairwise comparison, country ranking, or latent-mean interpretation was made. National academic context was not treated as a direct measure of culture.

3. Results

3.1. Analytical Sample and Descriptive Findings

The raw file contained 23,218 records spanning 108 identifiable countries, plus 70 records coded Other: and 301 with missing country. Other: and missing-country records were retained in protected data but were not assigned to a national group. After one probable duplicate was excluded only from primary full-sample descriptive summaries, the descriptive sample contained 23,217 records, including 16,010 prior ChatGPT users. The duplicate restriction did not change any construct-level sample.
For the nine-item Model B, 14,523 prior users had at least one observed indicator and were FIML-eligible, 13,359 had data in all three constructs, and 13,201 were complete on all nine indicators. The primary 15-country FIML sample contained 8,650 records, and the seven-country robustness sample contained 5,871. Across the full descriptive denominator, item missingness ranged from 37.64% to 42.39%; because that denominator includes survey routing or possible nonapplicability, these percentages should not be read as ordinary item nonresponse alone. Within the 15-country analytical sample, item missingness ranged from 0.22% to 6.98%.
The three academic-integrity items had means from 3.005 (Q22d) to 3.151 (Q22b); satisfaction-item means ranged from 3.160 (Q24g) to 3.529 (Q24e); and perceived-learning-benefit item means ranged from 3.531 (Q26g) to 3.584 (Q26e). All 10 examined items, including Q22i, used the full observed numeric range from 1 to 5. No item met the prespecified highly skewed or restricted-distribution screen. Table S6 reports complete item descriptives.
Table 1 reports verified source coverage and sample flow, demographic characteristics of the 15-country analytical sample, and country-specific analytical counts. Complete demographic and denominator details appear in Table S1–S5. All inferential conclusions that follow concern the selected 15-country analytical sample or the prespecified seven-country robustness subset, not all 108 source contexts.
Table 2. Measurement-model, reliability, validity, and overall CFA results. Panel A. Alternative three-factor measurement models
Model FIML N Complete N Chi-square (df) RMSEA [90% CI] CFI TLI
Model A: four-item ethical and social concern factor 14,523 13,184 1,440.642 (32) .055 [.053, .058] .979 .970
Model B: three-item academic integrity concerns factor 14,523 13,201 866.247 (24) .049 [.046, .052] .987 .980
Panel B. Demographic characteristics of the primary 15-country analytical sample (N = 8,650)
Characteristic Category or statistic n % of valid Valid N Missing N
Age Summary M = 22.8; SD = 6.2; median = 21; range = 18–70 8,619 31
Gender Female 4,371 50.7% 8,627 23
Gender Male 4,131 47.9% 8,627 23
Gender Other 41 0.5% 8,627 23
Gender Prefer not to say 84 1.0% 8,627 23
Institution funding No 1,929 22.4% 8,593 57
Institution funding Yes 6,664 77.6% 8,593 57
Student status Full-time 7,374 85.8% 8,596 54
Student status Part-time 1,222 14.2% 8,596 54
Level of study Doctoral 261 3.0% 8,588 62
Level of study First level 7,460 86.9% 8,588 62
Level of study Second level 867 10.1% 8,588 62
Field of study Applied Sciences 3,191 37.2% 8,579 71
Field of study Arts and Humanities 1,065 12.4% 8,579 71
Field of study Natural and Life Sciences 923 10.8% 8,579 71
Field of study Social Sciences 3,400 39.6% 8,579 71
Panel C. Country-specific analytical sample sizes
Country of study Total Prior users FIML N All 3 Complete 9 Complete/FIML Questionnaire source language, n (%)
Brazil 448 363 311 262 260 83.6% EN 440 (98.2%); ES 8 (1.8%)
Bulgaria 413 356 300 261 258 86.0% EN 413 (100.0%)
Chile 775 628 580 534 532 91.7% EN 1 (0.1%); ES 774 (99.9%)
Cyprus 560 348 305 281 278 91.1% EN 508 (90.7%); TR 52 (9.3%)
Ecuador 1,908 1,556 1,520 1,471 1,461 96.1% EN 30 (1.6%); ES 1,878 (98.4%)
Egypt 884 602 572 551 543 94.9% AR 375 (42.4%); EN 509 (57.6%)
Ghana 784 367 309 270 263 85.1% EN 784 (100.0%)
Italy 1,138 764 704 642 636 90.3% EN 167 (14.7%); HE 1 (0.1%); IT 970 (85.2%)
Latvia 524 411 380 350 348 91.6% EN 523 (99.8%); IT 1 (0.2%)
Mexico 1,310 875 805 749 743 92.3% EN 155 (11.8%); ES 1,153 (88.0%); JP 2 (0.2%)
Romania 984 724 675 639 634 93.9% EN 983 (99.9%); ES 1 (0.1%)
Spain 1,421 1,153 1,015 909 894 88.1% EN 671 (47.2%); ES 747 (52.6%); IT 3 (0.2%)
Tanzania 792 543 479 449 440 91.9% EN 792 (100.0%)
The Philippines 400 352 341 333 331 97.1% EN 400 (100.0%)
Turkey 634 369 354 343 337 95.2% AR 1 (0.2%); EN 252 (39.7%); TR 381 (60.1%)
Note. Percentages for demographic categories use the relevant nonmissing responses. Country identifies national academic context and is not a direct measure of culture. FIML eligibility required at least one Model B indicator. Source codes denote documented questionnaire-language versions: AR = Arabic, EN = English, ES = Spanish, HE = Hebrew, IT = Italian, JP = Japanese, and TR = Turkish. Other: and missing-country records were retained but were not assigned to a multigroup context. All summaries are aggregate.

3.2. Measurement-Model Selection

The four-item ethical and social concern option had a complete-case N of 14,402, Cronbach alpha of .839, standardized alpha of .838, and average interitem correlation of .565. The three-item academic integrity concern option had a complete-case N of 14,426, alpha of .887, standardized alpha of .887, and average interitem correlation of .724. No corrected item-total correlation was below .30.
Within the four-item complete-case sample, the mean correlation among Q22b, Q22c, and Q22d was .724, whereas the mean correlation of Q22i with those three items was .405. In Model A, Q22i had a standardized loading of .459, standardized residual variance of .789, and communality of .211. The other concern indicators had standardized loadings from .788 to .891 and communalities from .621 to .794.
Both alternative CFAs converged in four iterations. Model A used FIML N = 14,523 and had χ² (32) = 1,440.642, RMSEA = .055, 90% CI [.053, .058], CFI = .979, and TLI = .970. Model B used the same FIML N and had χ² (24) = 866.247, RMSEA = .049, 90% CI [.046, .052], CFI = .987, and TLI = .980. Because the models used different observed-variable sets, these fit statistics were not treated as a nested model comparison.
Model B was selected based on the conceptual coherence of Q22b-Q22d as a focused academic integrity domain and the distinct substantive content and measurement behavior of Q22i. Q22i was not described as invalid and remained in the dataset.

3.3. Overall Confirmatory Factor Analysis

In the overall Model B CFA, standardized loadings were .882, .895, and .779 for academic integrity concerns; .738, .923, and .806 for satisfaction; and .755, .760, and .749 for perceived learning benefits. No negative variance, Heywood case, standardized loading above 1, or other improper solution was detected.
Cronbach alpha, composite reliability, and AVE were .887, .889, and .728 for academic integrity concerns; .857, .864, and .682 for satisfaction; and .799, .799, and .569 for perceived learning benefits. The standardized latent correlations were -.128 between academic integrity concerns and satisfaction, -.180 between academic integrity concerns and perceived learning benefits, and .580 between satisfaction and perceived learning benefits. For every factor, the square root of AVE exceeded the largest absolute factor correlation. These results provided supportive, but not definitive, convergent- and discriminant-validity evidence. The alternative-model fit and Model B measurement evidence are summarized in Table 2.
As a sensitivity analysis, we also estimated the three-factor model treating the nine indicators as ordered categorical variables. The pooled ordered-probit CFA converged for the 15-country analytical sample (N = 8,650), and all nine indicators loaded positively on their intended factors, with derived standardized loadings ranging from .780 to .958. However, the multigroup ordinal configural and equal-threshold models did not converge under the evaluated specifications. We therefore did not interpret further ordinal invariance or structural models.
Panel B. Model B standardized factor loadings
Model B factor Item Std. loading Robust SE 95% CI Std. residual variance
Academic integrity concerns Q22b .882 .004 [.873, .890] .223
Academic integrity concerns Q22c .895 .004 [.887, .903] .200
Academic integrity concerns Q22d .779 .005 [.768, .789] .394
Satisfaction Q24e .738 .006 [.726, .750] .456
Satisfaction Q24f .923 .004 [.915, .931] .148
Satisfaction Q24g .806 .005 [.796, .816] .351
Perceived learning benefits Q26e .755 .007 [.742, .768] .430
Perceived learning benefits Q26g .760 .007 [.747, .773] .423
Perceived learning benefits Q26j .749 .007 [.735, .763] .439
Panel C. Reliability and convergent-validity evidence
Factor Items Cronbach alpha Composite reliability AVE Square root AVE
Academic integrity concerns 3 .887 .889 .728 .853
Satisfaction 3 .857 .864 .682 .826
Perceived learning benefits 3 .799 .799 .569 .755
Panel D. Latent correlations
Latent correlation r Robust SE 95% CI
Academic integrity concerns with satisfaction -.128 .010 [-.148, -.107]
Academic integrity concerns with perceived learning benefits -.180 .011 [-.203, -.158]
Satisfaction with perceived learning benefits .580 .010 [.560, .599]
Note. Model A and Model B contain different observed-variable sets; no direct chi-square difference test was used. Model B was selected jointly on conceptual and measurement evidence. Standardized estimates are shown in Panels B-D. AVE = average variance extracted. SRMR was unavailable under Stata MLMV with missing indicators.

3.4. Country-Specific Measurement Assessment

Fifteen countries met the study-defined analytical thresholds: FIML-eligible N of at least 300, complete-nine N of at least 200, and a complete-nine/FIML ratio of at least 80%. The resulting multigroup FIML sample was 8,650. Country-specific FIML Ns ranged from 300 in Bulgaria to 1,520 in Ecuador (Table 1).
All 15 separate country CFAs converged in four to six iterations. Eleven countries were classified as clearly feasible. Bulgaria, Egypt, The Philippines, and Turkey were classified as feasible with noncritical warnings; no country had a serious estimation concern. The documented warnings were elevated RMSEA in Bulgaria (.095) and The Philippines (.089), weaker perceived-learning-benefits CR (.712) and AVE (.453) in Egypt, and a lower Q26g loading (.483) with weaker perceived-learning-benefits reliability and AVE in Turkey. No country-specific model produced a negative variance, Heywood case, loading above 1, loading below .40, or nonpositive-definite matrix. Country-specific standardized loadings and country-factor reliability and AVE are reported in Table S7 and Table S9, respectively.

3.5. Measurement Invariance

The simultaneous 15-country configural model converged in six iterations on FIML N = 8,650. Fit was χ² (360) = 1,146.278, RMSEA = .0615, 90% CI [.0576, .0656], CFI = .9797, and TLI = .9696. The same positive three-factor loading pattern was reproduced in every country. No standardized loading was below .40 or above 1, and no improper solution was detected. Turkey Q26g was the only loading below the preferred .50 descriptive benchmark (.483). Configural structure was therefore classified as broadly supported with noncritical warnings.
The full metric model converged in five iterations on the identical sample. Model fit was χ²(444) = 1,347.795, RMSEA = .0594, 90% CI [.0558, .0631], CFI = .9767, and TLI = .9717. Relative to the configural model, ΔCFI = −.0030, ΔRMSEA = −.0021, and ΔTLI = +.0021. The changes in CFI and RMSEA met the prespecified criteria. The conventional unscaled likelihood-ratio difference test was significant, Δχ²(84) = 201.517, p < .001; however, this test was not used as the sole basis for determining metric invariance.
All 135 country-specific standardized loadings in the metric model ranged from .619 to .954. No improper solution was detected, and all absolute latent correlations were below .85. Full metric invariance was classified as broadly supported with noncritical warnings and provided the measurement basis for structural-path comparisons.
The full scalar model converged in seven iterations on the same FIML N = 8,650. Fit was χ² (528) = 1,888.473, RMSEA = .0668, 90% CI [.0636, .0701], CFI = .9650, and TLI = .9642. Relative to the full metric model, ΔCFI was -.0118, ΔRMSEA was +.0074, and ΔTLI was -.0075. Although the RMSEA change met its criterion, the CFI decrease exceeded the prespecified maximum of .010. Full scalar invariance was therefore not supported. Partial scalar invariance was not pursued, and latent means were not compared or interpreted. Table 3 summarizes the primary measurement-invariance sequence.

3.6. Primary Multigroup Structural Findings

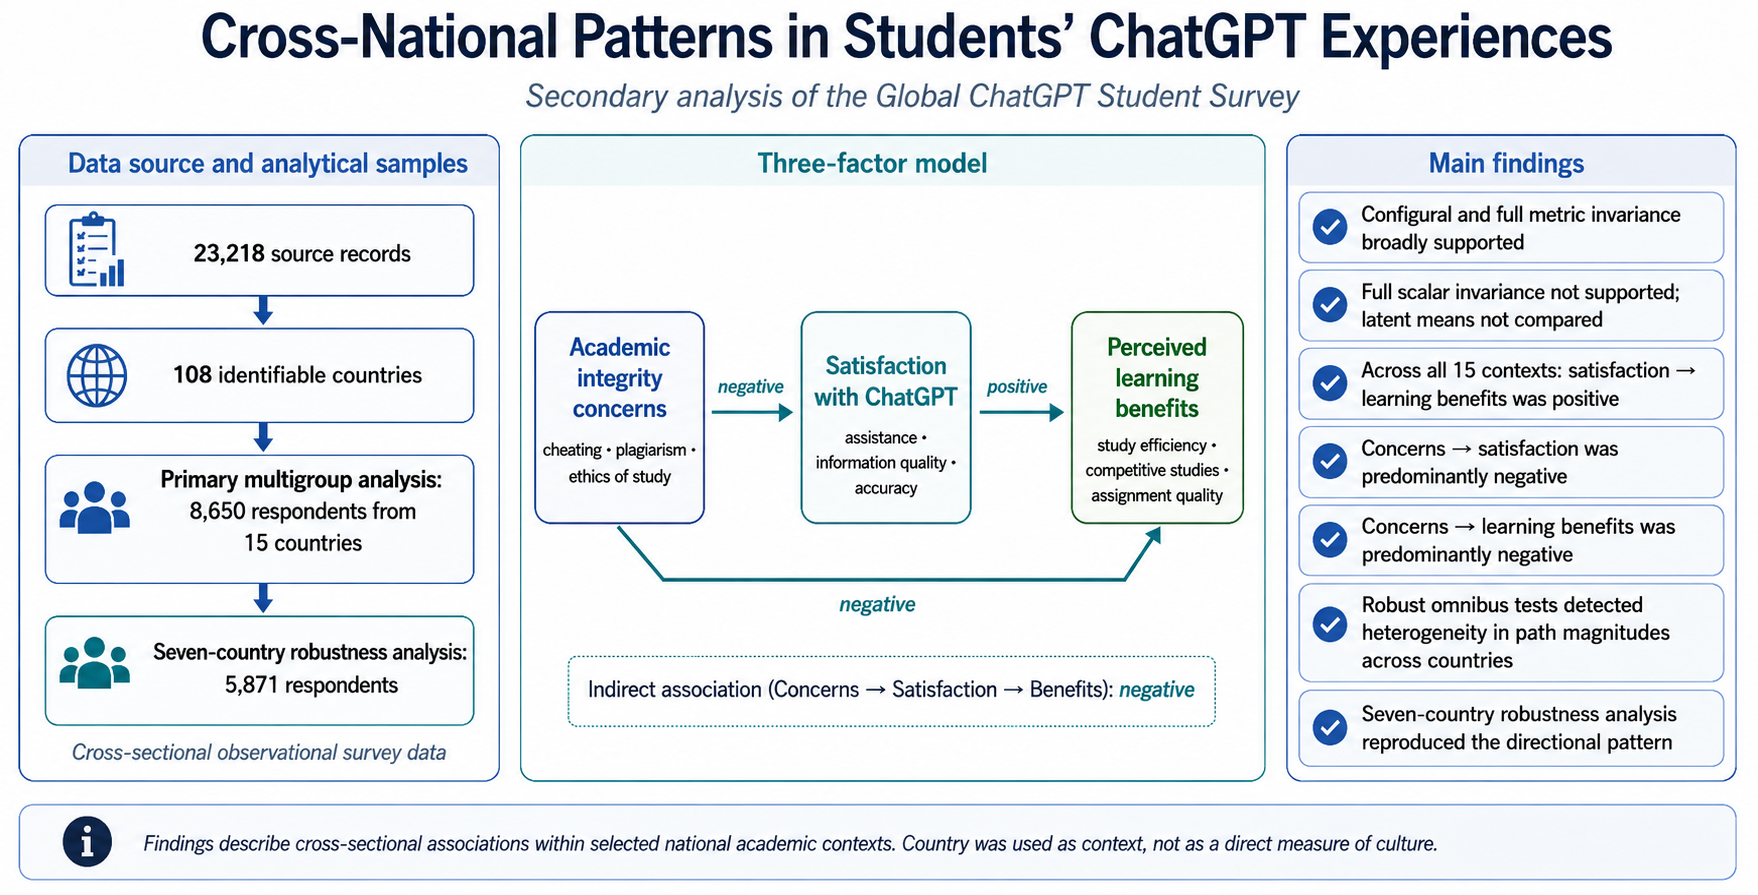
The 15-country freely estimated structural model converged in five iterations on FIML N = 8,650 and produced no improper solution. As expected for a reparameterization of the full metric three-factor model, its fit was numerically equivalent: χ² (444) = 1,347.795, RMSEA = .0594, 90% CI [.0558, .0631], CFI = .9767, and TLI = .9717. This equivalence was a specification check and was not treated as evidence that the structural associations were correct. Figure 1 summarizes the three structural paths and the range of country-specific standardized coefficients across the primary 15-country analysis.
Satisfaction was positively associated with perceived learning benefits in all 15 countries. Unstandardized coefficients ranged from .420 to .789, and standardized coefficients ranged from .399 to .692; all robust p values were below .001. The association between academic integrity concerns and satisfaction was negative in 14 countries and positive in one, with unstandardized coefficients from -.159 to .047. The direct association between academic integrity concerns and perceived learning benefits was negative in 13 countries and positive in two, with unstandardized coefficients from -.191 to .056. Five concerns-to-satisfaction estimates and six direct concerns-to-learning estimates had 95% confidence intervals that included zero; these estimates were not interpreted as evidence of no relationship.
We reported country-specific standardized coefficients and indirect associations in Table 4; unstandardized coefficients, robust standard errors, confidence intervals, and p values are reported in Table S8. Differences among separate country estimates or p values were not treated as pairwise country differences.

3.7. Structural-Path Heterogeneity

Robust omnibus Wald tests indicated significant heterogeneity across countries for the concerns-to-satisfaction path, χ²(14) = 38.937, p < .001; the direct concerns-to-learning path, χ²(14) = 39.209, p < .001; and the satisfaction-to-learning path, χ²(14) = 38.038, p < .001. The joint test of all 45 structural coefficients also indicated significant heterogeneity, χ²(42) = 113.248, p < .001.
Despite statistically detectable heterogeneity, equality constraints produced only trivial deterioration in descriptive global fit. Constraining the three path families separately changed CFI by -.0009, -.0009, and -.0010 and RMSEA by +.0002, +.0001, and +.0004, respectively. Constraining all three path families changed CFI by -.0028 and RMSEA by +.0007. The results therefore indicate a broadly consistent directional pattern together with statistically detectable variation in coefficient magnitude. The omnibus tests do not identify any specific country pair as different. Table 3 reports global fit for M0–M4; the complete constrained-model comparisons are provided in Table S10.
Table 3. Measurement-invariance and structural-invariance model comparisons.
Panel A. Measurement-invariance models.
Analysis Model N Chi-square (df) RMSEA [90% CI] CFI TLI ΔCFI ΔRMSEA
Primary 15-country Configural 8,650 1,146.278 (360) 0.0615 [0.0576, 0.0656] 0.9797 0.9696 - -
Primary 15-country Full metric/structural M0 8,650 1,347.795 (444) 0.0594 [0.0558, 0.0631] 0.9767 0.9717 -0.0030 -0.0021
Primary 15-country Full scalar 8,650 1,888.473 (528) 0.0668 [0.0636, 0.0701] 0.9650 0.9642 -0.0118 +0.0074
Panel B. Structural-equality models
Analysis Model N Chi-square (df) RMSEA [90% CI] CFI TLI ΔCFI ΔRMSEA
Primary 15-country M1: Path a equal; c-prime and b free 8,650 1,396.279 (458) 0.0596 [0.0561, 0.0632] 0.9758 0.9715 -0.0009 +0.0002
Primary 15-country M2: Path c-prime equal; a and b free 8,650 1,394.810 (458) 0.0596 [0.0560, 0.0631] 0.9759 0.9716 -0.0009 +0.0001
Primary 15-country M3: Path b equal; a and c-prime free 8,650 1,401.744 (458) 0.0598 [0.0562, 0.0634] 0.9757 0.9713 -0.0010 +0.0004
Primary 15-country M4: All three structural paths equal 8,650 1,497.876 (486) 0.0601 [0.0566, 0.0636] 0.9739 0.9710 -0.0028 +0.0007
Panel C. Seven-country robustness models
Analysis Model N Chi-square (df) RMSEA [90% CI] CFI TLI ΔCFI ΔRMSEA
Robustness 7-country Configural 5,871 673.029 (168) 0.0599 [0.0552, 0.0646] 0.9811 0.9716 - -
Robustness 7-country Full metric/structural M0 5,871 786.111 (204) 0.0583 [0.0541, 0.0627] 0.9782 0.9731 -0.0029 -0.0015
Robustness 7-country M1: Path a equal; c-prime and b free 5,871 808.745 (210) 0.0583 [0.0541, 0.0626] 0.9776 0.9731 -0.0006 -0.0000
Robustness 7-country M2: Path c-prime equal; a and b free 5,871 802.414 (210) 0.0580 [0.0538, 0.0623] 0.9778 0.9734 -0.0004 -0.0003
Robustness 7-country M3: Path b equal; a and c-prime free 5,871 807.503 (210) 0.0582 [0.0540, 0.0625] 0.9776 0.9732 -0.0006 -0.0001
Robustness 7-country M4: All three structural paths equal 5,871 847.071 (222) 0.0579 [0.0538, 0.0621] 0.9766 0.9734 -0.0016 -0.0004
Note. Global fit indices are conventional likelihood-based MLMV/OIM statistics from otherwise identical refits; robust sandwich standard errors were used for parameter inference. Primary metric changes are relative to configural, scalar changes are relative to metric, and M1–M4 changes are relative to M0. Full scalar invariance was not supported because ΔCFI = −0.0118 exceeded the prespecified −0.010 criterion. Latent means were not compared. Structural M0 is numerically equivalent to the corresponding full metric model.

3.8. Indirect Associations

The indirect association of academic integrity concerns with perceived learning benefits through satisfaction was negative in 14 countries and positive in one. Unstandardized indirect associations ranged from -.102 to .029. Ten negative indirect associations had confidence intervals excluding zero, whereas five intervals included zero. The latter were not interpreted as evidence of no indirect relationship.
The nonlinear robust Wald test supported omnibus heterogeneity in the 15 country-specific indirect products, χ² (14) = 31.711, p = .00440. This test does not identify a statistically different country pair. The products are reported as cross-sectional indirect associations, not causal mediation effects. Country-specific standardized direct and indirect associations appear in Table 4; complete unstandardized estimates are in Table S8.
Table 4. Country-specific standardized structural paths and indirect associations.
Country FIML N Concerns → Satisfaction, β Concerns → Learning, direct β Satisfaction → Learning, β Concerns → Satisfaction → Learning, indirect β
Brazil 311 -0.259*** -0.296*** 0.399*** -0.103**
Bulgaria 300 -0.204** -0.076 0.638*** -0.130**
Chile 580 -0.090 -0.115* 0.506*** -0.046
Cyprus 305 -0.208** -0.193** 0.636*** -0.132**
Ecuador 1,520 -0.026 -0.027 0.595*** -0.015
Egypt 572 -0.148** -0.143** 0.692*** -0.102*
Ghana 309 -0.081 0.051 0.641*** -0.052
Italy 704 -0.170*** -0.173*** 0.479*** -0.081***
Latvia 380 -0.208** -0.115 0.482*** -0.100**
Mexico 805 -0.114** -0.130*** 0.625*** -0.071**
Romania 675 -0.232*** -0.147** 0.560*** -0.130***
Spain 1,015 -0.116** -0.145*** 0.538*** -0.063**
Tanzania 479 -0.174** -0.164** 0.552*** -0.096**
The Philippines 341 -0.052 0.084 0.513*** -0.027
Turkey 354 0.078 -0.121 0.608*** 0.047
Note. Standardized coefficients are shown. Significance symbols use robust tests of the corresponding unstandardized coefficient: * p < 0.05, ** p < 0.01, *** p < 0.001. The indirect association is the product of the concerns-to-satisfaction and satisfaction-to-learning paths; its p value uses the robust first-order delta method. Different significance levels across countries do not establish pairwise country differences.

3.9. Seven-Country Robustness Analysis

The preferred-stability robustness subset included Chile, Ecuador, Egypt, Italy, Mexico, Romania, and Spain (FIML N = 5,871). The configural model fit was χ² (168) = 673.029, RMSEA = .0599, 90% CI [.0552, .0646], CFI = .9811, and TLI = .9716. The full metric model fit was χ² (204) = 786.111, RMSEA = .0583, 90% CI [.0541, .0627], CFI = .9782, and TLI = .9731. Relative changes were ΔCFI = -.0029, ΔRMSEA = -.0015, and ΔTLI = +.0014. No loading was below .40 or above 1, and no improper solution was detected; the prespecified metric gate passed.
In the seven-country structural model, all satisfaction-to-learning associations were positive, all concerns-to-satisfaction associations were negative, all direct concerns-to-learning associations were negative, and all indirect associations were negative. None of the 21 direct coefficients or seven indirect associations changed direction relative to the corresponding 15-country estimate. The largest absolute change was .0050 for an unstandardized direct coefficient, .0018 for a standardized direct coefficient, .0003 for an unstandardized indirect association, and .0003 for a standardized indirect association.
Robust omnibus tests continued to support heterogeneity for the concerns-to-satisfaction path, χ² (6) = 18.003, p = .0062; the direct concerns-to-learning path, χ² (6) = 13.271, p = .0389; the satisfaction-to-learning path, χ² (6) = 15.906, p = .0143; all paths jointly, χ² (18) = 45.268, p = .000379; and the indirect associations, χ² (6) = 13.850, p = .0314. As in the primary analysis, equality-constrained models produced only trivial changes in descriptive fit. The corresponding omnibus tests are reported in Table 5, and complete seven-country results appear in Table S11.

4. Discussion

4.1. Overview of the Findings

The findings provide insight into how students’ judgments of legitimate AI assistance, their satisfaction with ChatGPT, and the educational value they attribute to its use are related across different national academic settings. In higher education, academic culture is shaped through shared and contested meanings and practices [7], while digitally mediated practices develop through interactions among technologies, purposes, values, people, and institutional settings [8,9]. Across the 15 selected countries, the three-factor structure was sufficiently comparable to support analysis of the structural relationships. The overall pattern was broadly similar across countries, although the strength of the relationships varied. These findings are consistent with the idea that students’ evaluations of GenAI are situated within different academic environments, but they should not be interpreted as evidence that culture itself was directly measured.
This study examined whether academic integrity concerns, satisfaction, and perceived learning benefits formed a comparable measurement structure and a broadly shared relational pattern across 15 selected countries. The findings support three principal conclusions. First, the nine-indicator, three-factor structure was broadly reproduced across the country samples. Configural fit was acceptable, and full metric invariance was supported, permitting comparison of structural relationships. Full scalar invariance was not supported under the prespecified change-in-CFI criterion; accordingly, no latent means were interpreted or compared. Second, satisfaction was positively associated with perceived learning benefits in every country, whereas the paths from academic integrity concerns to satisfaction and perceived learning benefits were predominantly negative. Third, robust omnibus tests indicated statistically significant cross-country variation in all three path families and in the indirect association, but constraining paths to equality produced only trivial deterioration in global fit. The evidence therefore points to a broadly similar structural pattern whose magnitudes vary across countries.

4.2. Satisfaction and Perceived Learning Benefits

The most consistent finding was the positive path from satisfaction to perceived learning benefits. This association was positive in all 15 countries, statistically different from zero in every country, and substantively larger than either concern path in most nations. The direction was also reproduced in the seven-country stability subset. Students who evaluated ChatGPT’s assistance, information quality, and information accuracy more favorably also tended to report greater study efficiency, facilitation of completing studies, and improvement in assignment quality.
The finding fits student-perception research in which usefulness, task accomplishment, productivity, and perceived support are associated with evaluations of educational benefit. Jo [20], for example, reported positive relationships among perceived impact, efficiency, task accomplishment, and perceived benefits, while Chan and Hu [1] documented expectations of personalized learning, writing, and research support. Qualitative work on GenAI-assisted academic writing likewise found perceived benefits spanning writing processes, performance, and affective experience alongside important challenges [21]. The present analysis extends these observations by showing that the satisfaction–benefit association had the same positive direction across all selected countries.
The interpretation must remain bounded by the measures. Perceived learning benefits refer to students’ self-reported judgments about efficiency, completing studies, and assignment quality. It is not a measure of grades, retained knowledge, transfer, critical thinking, or objectively scored learning. Research outside GenAI demonstrates that perceived learning and actual performance can diverge [23], and critical educational-technology scholarship cautions against presuming that a technology automatically enhances learning [10]. Satisfaction may reflect a useful interaction with ChatGPT, but a satisfying response can still be inaccurate, incomplete, or poorly aligned with an instructor’s aims.

4.3. Academic Integrity Concerns and Emerging Academic Norms

Academic integrity concerns were predominantly negatively associated with satisfaction. Fourteen of the 15 country-specific coefficients were negative, although five confidence intervals included zero. Concerns were also predominantly negatively associated with perceived learning benefits: 13 coefficients were negative, two were positive, and six confidence intervals included zero. These patterns are consistent with the idea that students who view ChatGPT as encouraging cheating or plagiarism, or as threatening the ethics of study, may evaluate its assistance and educational value less favorably. They do not show that ethical concern invariably suppresses satisfaction or perceived benefit in every setting.
The negative pattern is substantively plausible because judgments about legitimate assistance can be integral to students’ experience of the technology. Chan and Hu [1] found that perceived learning and writing support coexisted with concern about plagiarism, accuracy, privacy, overreliance, and uncertain policies. Johnston et al. [16] showed that students differentiated grammar-related assistance from whole-essay generation and frequently requested clear guidance. Integrity scholarship and governance recommendations frame authorship, disclosure, accountability, and legitimate contribution as matters of academic practice rather than merely technical system features [11,12,13,14,19,34].
These concern paths describe a tension within emerging digital academic cultures. Students may recognize ChatGPT’s practical value while simultaneously negotiating whether particular uses constitute acceptable assistance, plagiarism, cheating, misattributed authorship, or a threat to the ethics of study. The few opposite-signed estimates and the confidence intervals that included zero do not warrant national exceptions or cultural explanations. Institutional policy, survey language, education-system features, and cultural values were not tested as causes.
The integrity construct is deliberately specific. It concerns cheating, plagiarism, and the ethics of study rather than generalized anxiety about technology. This focus makes the cultural issue visible at the boundary of participation: when does assistance remain part of a student’s own academic work, and when does it substitute for the contribution that an assessment is meant to elicit? The findings do not answer that normative question for institutions, but they show that students’ integrity appraisals are connected to how they evaluate ChatGPT’s assistance and educational usefulness.

4.4. Indirect Associations Through Satisfaction

The product of the concern-to-satisfaction and satisfaction-to-learning paths yielded a predominantly negative indirect association. Fourteen-country-specific indirect effects were negative, and one was positive; 10 confidence intervals excluded zero and five included zero. The seven-country stability subset reproduced the negative direction in every included country. This pattern is coherent with the two component paths: academic integrity concerns were generally associated with lower satisfaction, and satisfaction was consistently associated with higher perceived learning benefits.
The indirect association is a statistical decomposition of concurrent relationships within the fitted model. The structural ordering represents a theoretically specified decomposition of concurrent associations. Because all constructs were measured at the same occasion, alternative directional orderings may reproduce the observed covariance structure.
Conceptually, the result places satisfaction at a central point in the modeled pattern. Under a bounded appraisal lens, academic-integrity concerns represent value-relevant evaluations, satisfaction reflects an affective-evaluative judgment of assistance and information, and perceived learning benefits capture an evaluation of academic usefulness [24]. The model is appraisal-informed and conceptually consistent with that organization, but it does not measure a temporal appraisal process, coping, or a causal mechanism.

4.5. Cross-National Similarities and Differences

The robust omnibus tests rejected exact equality for each structural path family and for the joint set of paths. The indirect effects also varied significantly across the 15 countries. These results address RQ2 by showing that structural magnitudes were not identical across the selected countries. Yet the constrained models produced very small changes in global fit. Constraining the concern-to-satisfaction, concern-to-learning, or satisfaction-to-learning paths separately changed CFI by approximately −.0009 to −.0010 and RMSEA by only +.0001 to +.0004; constraining all three path families changed CFI by −.0028 and RMSEA by +.0007.
These results are not contradictory. With a large, combined sample, omnibus tests can detect modest departures from exact equality. Incremental fit changes ask a different question: how much worse the overall model reproduces the observed covariance structure after equality constraints are imposed. Here, exact equality was statistically rejected, but the practical loss in global fit was trivial under the prespecified criteria. The defensible interpretation is therefore neither “the paths are identical” nor “the countries have fundamentally different structural systems.” The broad configuration was structurally similar, while individual path magnitudes showed statistically detectable contextual variation.
The preferred stability subset, Chile, Ecuador, Egypt, Italy, Mexico, Romania, and Spain, provided an important robustness check using stricter sample-size criteria. The subset passed the full metric-invariance gate, and every structural direction matched the corresponding 15-country result: academic integrity concerns were negatively associated with satisfaction and perceived learning benefits, satisfaction was positively associated with perceived learning benefits, and the indirect associations were negative. Robust omnibus tests again detected heterogeneity in all three path families, the joint path set, and the indirect association. Equality constraints again caused only trivial deterioration in global fit.
Altogether, the primary and preferred stability analyses support a shared directional pattern with contextual calibration. Exact equality was statistically imperfect, but the practical structural similarity remained substantial. Universal assumptions may therefore miss meaningful variation in strength, while claims that every country has a fundamentally distinct digital academic culture would also overstate the evidence. No pairwise country test or country ranking was conducted.

4.6. Implications for Higher-Education Policy and Practice

The findings support treating responsible GenAI integration as both an educational-value issue and an academic-integrity issue. Universities may gain little from communicating only potential productivity benefits if students remain uncertain about legitimate assistance. Conversely, integrity communication framed only as prohibition may fail to address why students find the technology useful. Policy and integrity sources emphasize education, human responsibility, transparency, disclosure, and context-sensitive guidance [13,14,19,35]. The present results make those recommendations relevant but do not test their effects.
Practical guidance can distinguish permitted assistance from substitution, explain expectations for disclosure and attribution, identify tasks for which GenAI use is restricted, and specify responsibility for checking information quality and accuracy. Johnston et al. [16] documented strong student demand for clear policies and different levels of acceptance for grammar-related assistance and whole-essay generation. Chan and Hu [1] described policy uncertainty, and Chan [13] proposed a policy-education framework connecting governance, pedagogy, and operational practice. These sources support clear student-facing communication rather than assumptions that students share a common understanding of acceptable use. Although the present study focused on university students, adjacent evidence from K–12 STEM education indicates that awareness of ChatGPT may coexist with limited extensive practical experience, reinforcing the need for targeted professional development and clear institutional guidance across educational levels [36].
Principle-based governance can connect AI literacy with academic-integrity literacy. Guidance may distinguish brainstorming, outlining, feedback, editing, translation, coding, source discovery, summarization, and full-text generation because their implications vary by task and assessment [14,18,19]. It can also define disclosure and authorship expectations, require source and output verification, preserve opportunities for independent reasoning, and communicate that users remain accountable for submitted work. These are evidence-informed implications, not demonstrated intervention effects.
The present results do not establish that a particular policy changes concern, satisfaction, or perceived learning benefit. Institutional-policy awareness was not modeled, and contextual variation cannot be attributed to language, policy, or governance. Implementation should therefore combine shared ethical principles with local review of disciplinary expectations, assessment purposes, student access, and the clarity of communication [37]. Punitive surveillance alone would not address the educational reasons students use GenAI or the uncertainty surrounding legitimate participation.

4.7. Cross-National Interpretation of Academic Norms

The findings contribute to understanding how students evaluate GenAI within different national academic environments. Across the 15 countries, satisfaction with ChatGPT was consistently associated with greater perceived learning benefits, while academic-integrity concerns were generally associated with less favorable evaluations. This shared directional pattern suggests that students across different settings may face a common tension between the perceived usefulness of GenAI and concerns about acceptable academic use.
At the same time, the strength of these relationships varied across countries. These differences should not be interpreted as direct evidence of national cultural differences because the study did not measure cultural values, institutional norms, policy enforcement, or other mechanisms that might explain the variation. Rather, the findings indicate that similar concerns about usefulness, legitimacy, and academic integrity may be experienced with different degrees of intensity across national academic environments and cultural perspectives.
This distinction is important for understanding emerging academic norms around GenAI. Universities increasingly need to determine what forms of AI assistance are acceptable, when disclosure is required, how authorship and originality should be understood, and how students should verify AI-generated information [34]. The present findings suggest that these issues are relevant across countries, but the ways in which students evaluate them may vary. Future cross-national research should therefore measure institutional policies, academic-integrity climates, AI literacy, assessment practices, and cultural values directly to explain why these relationships differ across settings.

4.8. Limitations and Future Research

The cross-sectional observational design cannot establish temporal ordering, causal effects, or causal mediation. All constructs were measured on one occasion, and the specified ordering is a theoretical decomposition of concurrent associations; alternative directional structures may reproduce the same covariance pattern. The study is a secondary analysis of an existing public dataset, so construct coverage, sampling, field procedures, and measurement timing were inherited from the original survey. Perceived learning benefits are self-reported evaluations rather than objective outcomes. The data reflect early reactions to ChatGPT during a specific period and should not be generalized automatically to later systems.
The source file had broad reach, with 23,218 records across 108 identifiable countries, but the primary multigroup model included 8,650 respondents from 15 countries that met prespecified sample-size, completeness, and feasibility criteria. Convenience recruitment, unequal group sizes, and the exclusion of countries that did not meet these requirements limit representativeness and prevent generalization of the structural findings to all countries represented in the source data. The excluded countries are not less important; their data simply did not meet the requirements for the present multigroup analysis. Country of study was used as a comparative grouping variable rather than as a proxy for culture. Accordingly, the observed differences are interpreted as variation across national academic settings, while the cultural relevance of the study lies in examining how evaluations of acceptable AI assistance, academic integrity, satisfaction, and perceived educational value are situated within different academic environments.
Language-related limitations should also be considered. The original study reported translations of the questionnaire into Italian, Spanish, Turkish, Japanese, Arabic, and Hebrew, but no additional back-translation, cultural-adaptation, or cross-language equivalence procedures were documented. These translated versions were also unavailable for direct verification in the present study. Although metric invariance was supported across the selected countries, future research should examine language equivalence more directly using linguistically and culturally validated instruments.
A further measurement limitation concerns the treatment of the five-category indicators as approximately continuous in the primary SEM analyses. An ordered-probit sensitivity CFA reproduced strong positive loadings on the intended factors, but the multigroup ordinal models required for threshold-invariance testing did not converge. Consequently, cross-country threshold invariance could not be established directly, and the measurement-comparability conclusions should be interpreted within the robust continuous-variable modeling framework used in the primary analysis.
Institution-level variation could not be examined because the institution-identification field was excluded from the protected analytical dataset. Consequently, it was not possible to determine whether respondents within a country were concentrated in particular universities or whether institutional characteristics contributed to the observed cross-national variation. In addition, the present study involved secondary analysis of publicly available data and did not obtain a separate institutional ethics determination; ethical approval and informed-consent procedures for the original data collection are documented in the source study.
Future research should use longitudinal or experimental designs to clarify temporal relationships and include objective measures of learning, retention, transfer, and critical thinking. Multilevel studies could examine whether institutional policies, assessment practices, academic-integrity climates, AI literacy, digital access, and cultural values help explain the cross-national variation observed here. Qualitative research could further investigate how students in different academic environments understand acceptable AI assistance, originality, authorship, disclosure, and academic integrity. Future studies should also distinguish among specific GenAI uses and examine whether similar patterns emerge with systems beyond ChatGPT.

5. Conclusions

GenAI is becoming embedded within changing academic practices and the negotiation of legitimate academic work. Across the selected countries, satisfaction with ChatGPT’s assistance and information was consistently associated with greater perceived learning benefit, while academic integrity concerns were generally associated with less favorable evaluations. The broad directional pattern was shared, but the strength of the relationships remained contextually variable. These are cross-sectional associations, not evidence that culture was directly measured or that one evaluation caused another.
Responsible GenAI integration therefore requires both shared ethical principles and sensitivity to local academic norms and institutional environments. Clear definitions of acceptable assistance, disclosure, authorship, originality, verification, and accountability can help academic communities connect educational value with integrity rather than treating them as competing agendas. The emerging digital academic culture documented here is one of patterned similarity, continuing negotiation, and contextual variation.
The study therefore supports a cultural agenda for GenAI governance: retain common commitments to integrity and accountable knowledge production while allowing implementation to respond to the academic meanings, assessment practices, and institutional expectations through which those commitments are lived.

Supplementary Materials

The following supporting information can be downloaded at the website of this paper posted on Preprints.org.: Table S1, primary descriptive-sample demographics; Table S2, seven-country robustness-sample demographics; Table S3, verified source-country coverage and sample flow; Table S4, country-selection criteria and contextual cautions; Table S5, missing-data denominators; Table S6, item descriptive statistics; Table S7, country-specific standardized factor loadings; Table S8, country-specific unstandardized structural coefficients and indirect associations; Table S9, country-specific reliability and average variance extracted; Table S10, constrained structural-model comparisons; and Table S11, seven-country preferred-stability robustness results.

Author Contributions

Conceptualization, OEA and IDA; methodology, OEA and IDA; software, OEA and GS; validation, OEA; formal analysis, OEA; investigation, OEA, IDA, NO, ETO and GOS.; resources, NO and GS; data curation, OEA, NO; writing - original draft preparation, O.E.A; writing - review and editing, OEA, IDA, GS, NO, ETO and GOS; visualization, IDA, GS, NO, ETO and GOS; supervision, OEA; project administration, OEA. All authors have read and agreed to the published version of the manuscript.

Funding

This research received no external funding.

Institutional Review Board Statement

Ethical review and approval for the original survey are documented in the source publication and repository materials [30,33]. No separate institutional ethics determination was obtained for the present secondary analysis of publicly available data.

Data Availability Statement

The original data and questionnaire are openly available in Mendeley Data, Version 1, at https://doi.org/10.17632/ymg9nsn6kn.1 [33]. The protected analytical Stata dataset created for this secondary analysis has not been publicly deposited. An institution-identification field was excluded from the protected dataset and from all analyses and outputs.

Acknowledgments

The authors acknowledge the Global ChatGPT Student Survey research team for making the dataset and questionnaire publicly available for secondary research.

Conflicts of Interest

The authors declare no conflict of interest.
Declaration of Generative AI and AI-Assisted Technologies: During the preparation of this manuscript, the authors used ChatGPT for language refinement and improvement of readability. OpenAI Codex was used to assist with the development and review of Stata scripts for data management and statistical analysis. All statistical analyses were executed in Stata 19.5. The authors reviewed and verified all AI-assisted code and outputs, made all methodological, analytical, and interpretive decisions, and take full responsibility for the accuracy and content of the manuscript.

References

  1. Chan, C.K.Y.; Hu, W. Students’ voices on generative AI: Perceptions, benefits, and challenges in higher education. Int. J. Educ. Technol. High. Educ. 2023, 20, 43. [Google Scholar] [CrossRef]
  2. Kasneci, E.; Seßler, K.; Küchemann, S.; Bannert, M.; Dementieva, D.; Fischer, F.; Gasser, U.; Groh, G.; Günnemann, S.; Hüllermeier, E.; et al. ChatGPT for good? On opportunities and challenges of large language models for education. Learn. Individ. Differ. 2023, 103, 102274. [Google Scholar] [CrossRef]
  3. Tlili, A.; Shehata, B.; Adarkwah, M.A.; Bozkurt, A.; Hickey, D.T.; Huang, R.; Agyemang, B. What if the devil is my guardian angel: ChatGPT as a case study of using chatbots in education. Smart Learn. Environ. 2023, 10, 15. [Google Scholar] [CrossRef]
  4. Crompton, H.; Burke, D. Artificial intelligence in higher education: The state of the field. Int. J. Educ. Technol. High. Educ. 2023, 20, 22. [Google Scholar] [CrossRef]
  5. Zawacki-Richter, O.; Marín, V.I.; Bond, M.; Gouverneur, F. Systematic review of research on artificial intelligence applications in higher education—Where are the educators? Int. J. Educ. Technol. High. Educ. 2019, 16, 39. [Google Scholar] [CrossRef]
  6. Apata, O.E.; Kwok, O.-M.; Ajose, S.T. The impact of ChatGPT on higher education: A systematic review of global opportunities, perceptions, and challenges. J. Comput. Assist. Learn. 2026, 42, e70309. [Google Scholar] [CrossRef]
  7. Tierney, W.G. Organizational culture in higher education: Defining the essentials. J. High. Educ. 1988, 59, 2–21. [Google Scholar] [CrossRef]
  8. Orlikowski, W.J. Sociomaterial practices: Exploring technology at work. Organ. Stud. 2007, 28, 1435–1448. [Google Scholar] [CrossRef]
  9. Fawns, T. An entangled pedagogy: Looking beyond the pedagogy–technology dichotomy. Postdigital Sci. Educ. 2022, 4, 711–728. [Google Scholar] [CrossRef] [PubMed]
  10. Bayne, S. What’s the matter with “technology-enhanced learning”? Learn. Media Technol. 2015, 40, 5–20. [Google Scholar] [CrossRef]
  11. Eaton, S.E. Postplagiarism: Transdisciplinary ethics and integrity in the age of artificial intelligence and neurotechnology. Int. J. Educ. Integr. 2023, 19, 23. [Google Scholar] [CrossRef]
  12. Macfarlane, B.; Zhang, J.; Pun, A. Academic integrity: A review of the literature. Stud. High. Educ. 2014, 39, 339–358. [Google Scholar] [CrossRef]
  13. Chan, C.K.Y. A comprehensive AI policy education framework for university teaching and learning. Int. J. Educ. Technol. High. Educ. 2023, 20, 38. [Google Scholar] [CrossRef]
  14. Foltýnek, T.; Bjelobaba, S.; Glendinning, I.; Khan, Z.R.; Santos, R.; Pavletic, P.; Kravjar, J. ENAI recommendations on the ethical use of artificial intelligence in education. Int. J. Educ. Integr. 2023, 19, 12. [Google Scholar] [CrossRef]
  15. Chan, C.K.Y.; Lee, K.K.W. The AI generation gap: Are Gen Z students more interested in adopting generative AI such as ChatGPT in teaching and learning than their Gen X and millennial generation teachers? Smart Learn. Environ. 2023, 10, 60. [Google Scholar] [CrossRef]
  16. Johnston, H.; Wells, R.F.; Shanks, E.M.; Boey, T.; Parsons, B.N. Student perspectives on the use of generative artificial intelligence technologies in higher education. Int. J. Educ. Integr. 2024, 20, 2. [Google Scholar] [CrossRef]
  17. Abbas, M.; Jam, F.A.; Khan, T.I. Is it harmful or helpful? Examining the causes and consequences of generative AI usage among university students. Int. J. Educ. Technol. High. Educ. 2024, 21, 10. [Google Scholar] [CrossRef]
  18. Farrokhnia, M.; Banihashem, S.K.; Noroozi, O.; Wals, A. A SWOT analysis of ChatGPT: Implications for educational practice and research. Innov. Educ. Teach. Int. 2024, 61, 460–474. [Google Scholar] [CrossRef]
  19. Cotton, D.R.E.; Cotton, P.A.; Shipway, J.R. Chatting and cheating: Ensuring academic integrity in the era of ChatGPT. Innov. Educ. Teach. Int. 2024, 61, 228–239. [Google Scholar] [CrossRef]
  20. Jo, H. From concerns to benefits: A comprehensive study of ChatGPT usage in education. Int. J. Educ. Technol. High. Educ. 2024, 21, 35. [Google Scholar] [CrossRef]
  21. Kim, J.; Yu, S.; Detrick, R.; Li, N. Exploring students’ perspectives on generative AI-assisted academic writing. Educ. Inf. Technol. 2025, 30, 1265–1300. [Google Scholar] [CrossRef]
  22. Al-Fraihat, D.; Joy, M.; Masa’deh, R.; Sinclair, J. Evaluating e-learning systems success: An empirical study. Comput. Hum. Behav. 2020, 102, 67–86. [Google Scholar] [CrossRef]
  23. Deslauriers, L.; McCarty, L.S.; Miller, K.; Callaghan, K.; Kestin, G. Measuring actual learning versus feeling of learning in response to being actively engaged in the classroom. Proc. Natl. Acad. Sci. USA 2019, 116, 19251–19257. [Google Scholar] [CrossRef] [PubMed]
  24. Lazarus, R.S. Emotion and Adaptation; Oxford University Press: New York, NY, USA, 1991. [Google Scholar] [CrossRef]
  25. Strzelecki, A. Students’ acceptance of ChatGPT in higher education: An extended unified theory of acceptance and use of technology. Innov. High. Educ. 2024, 49, 223–245. [Google Scholar] [CrossRef]
  26. Putnick, D.L.; Bornstein, M.H. Measurement invariance conventions and reporting: The state of the art and future directions for psychological research. Dev. Rev. 2016, 41, 71–90. [Google Scholar] [CrossRef] [PubMed]
  27. Steenkamp, J.-B.E.M.; Baumgartner, H. Assessing measurement invariance in cross-national consumer research. J. Consum. Res. 1998, 25, 78–90. [Google Scholar] [CrossRef]
  28. Cheung, G.W.; Rensvold, R.B. Evaluating goodness-of-fit indexes for testing measurement invariance. Struct. Equ. Model. Multidiscip. J. 2002, 9, 233–255. [Google Scholar] [CrossRef] [PubMed]
  29. Chen, F.F. Sensitivity of goodness of fit indexes to lack of measurement invariance. Struct. Equ. Model. Multidiscip. J. 2007, 14, 464–504. [Google Scholar] [CrossRef]
  30. Ravšelj, D.; Keržič, D.; Tomaževič, N.; Umek, L.; Brezovar, N.; Iahad, N.A.; et al. Higher education students’ perceptions of ChatGPT: A global study of early reactions. PLoS ONE 2025, 20, e0315011. [Google Scholar] [CrossRef] [PubMed]
  31. Hornberger, M.; Bewersdorff, A.; Schiff, D.S.; Nerdel, C. A multinational assessment of AI literacy among university students in Germany, the UK, and the US. Comput. Hum. Behav. Artif. Hum. 2025, 4, 100132. [Google Scholar] [CrossRef]
  32. Marmolejo-Ramos, F.; Abadia, R.; Karakale, Ö.; Barrera-Causil, C.; Männikkö, N.; Daneshvar Ghorbani, B.; Strzelecki, A.; Nwizu, S.; Tavares, C.; Castillo, M.; et al. University students’ perceptions and adoptions of AI: A cross-national study. Discov. Artif. Intell. 2026, 6, 320. [Google Scholar] [CrossRef]
  33. Ravšelj, D.; Aristovnik, A.; Keržič, D.; Tomaževič, N.; Umek, L.; Brezovar, N.; et al. Higher Education Students’ Early Perceptions of ChatGPT: Global Survey Data, Version 1. In Mendeley Data; 2024. [Google Scholar] [CrossRef]
  34. Apata, O.E.; Kwok, O.-M.; Lee, Y.-H. The use of generative artificial intelligence (AI) in academic research: A review of the Consensus App. Cureus 2025, 17, e87297. [Google Scholar] [CrossRef] [PubMed]
  35. Apata, O.E.; Ajose, S.T.; Apata, B.O.; Olaitan, G.I.; Oyewole, P.O.; Ogunwale, O.M.; Oladipo, E.T.; Oyeniran, D.O.; Awoyemi, I.D.; Ajobiewe, J.O.; Ajamobe, J.O.; Appiah, I.; Fakhrou, A.A.; Feyijimi, T. Artificial intelligence in higher education: A systematic review of contributions to SDG 4 (quality education) and SDG 10 (reduced inequality). Int. J. Educ. Manag. 2026, 40, 336–353. [Google Scholar] [CrossRef]
  36. Ajose, S.T.; Apata, O.E.; Saidu, G.O.; Orobator, E.S. Exploring teachers’ awareness and perceptions of ChatGPT in K–12 STEM education. Int. J. Technol. Educ. 2026, 9, 260–278. [Google Scholar] [CrossRef]
  37. Feyijimi, T.R.; Dansu, V.; Osunbunmi, I.O.; Elesemoyo, I.O.; Olayemi, M.; Apata, O.E.; Oyeniran, D.O. Ubuntu-Ẹ̀kọ́ framework: A four-pillared critical-cultural-contextual-communal model for cultivating, educating and enhancing an AI-ready African workforce. Comput. Educ. Open 2026, 10, 100372. [Google Scholar] [CrossRef]
Figure 1. Primary 15-country multigroup structural model and the ranges of standardized path coefficients. Note. β denotes the standardized coefficient. Values shown are ranges of country-specific standardized estimates from the freely estimated 15-country model. Exact country-specific estimates are reported in Table 4. Significance is based on robust tests of the corresponding unstandardized coefficients. Differences among individual country estimates or significance levels do not establish statistically significant pairwise country differences.
Preprints 230552 g001
Table 1. Sample characteristics and country-specific analytical sample sizes. Panel A. Verified source coverage and analytical sample flow
Coverage or analytical stage N Definition
Authoritative raw records 23,218 All records in the authoritative Excel workbook
Identifiable national academic contexts 108 Distinct country-of-study values identifying a national academic context
Country recorded as Other: 70 Retained in protected data; not assigned to a national group
Country missing 301 Retained in protected data; not assigned to a national group
Primary descriptive sample 23,217 One probable duplicate excluded only from primary descriptive summaries
Prior ChatGPT users 16,010 Within the primary descriptive sample
Model B FIML-eligible sample 14,523 At least one of the nine Model B indicators observed; all were prior ChatGPT users
Data in all three Model B constructs 13,359 At least one observed indicator in every factor
Complete on all nine Model B indicators 13,201 All nine Model B indicators observed
Primary 15-country FIML sample 8,650 Measurement-invariance and primary structural models
Seven-country robustness FIML sample 5,871 Seven-country robustness subset
Table 5. Robust omnibus structural-heterogeneity tests.
Analysis Equality test Robust Wald χ² df p Conclusion
Primary 15-country Academic integrity concerns → Satisfaction 38.937 14 <.001 Omnibus heterogeneity supported
Primary 15-country Academic integrity concerns → Perceived learning benefits 39.209 14 <.001 Omnibus heterogeneity supported
Primary 15-country Satisfaction → Perceived learning benefits 38.038 14 <.001 Omnibus heterogeneity supported
Primary 15-country Joint equality of all 45 structural coefficients 113.248 42 <.001 Omnibus heterogeneity supported
Primary 15-country Indirect associations 31.711 14 .004 Omnibus heterogeneity supported
Robustness 7-country Academic integrity concerns → Satisfaction 18.003 6 .006 Omnibus heterogeneity supported
Robustness 7-country Academic integrity concerns → Perceived learning benefits 13.271 6 .039 Omnibus heterogeneity supported
Robustness 7-country Satisfaction → Perceived learning benefits 15.906 6 .014 Omnibus heterogeneity supported
Robustness 7-country Joint equality of all 21 structural coefficients 45.268 18 <.001 Omnibus heterogeneity supported
Robustness 7-country Academic integrity concerns → Satisfaction → Perceived learning benefits 13.850 6 .031 Omnibus heterogeneity supported
Note. The indirect-association tests are nonlinear robust Wald tests of equality of the country-specific concerns-to-satisfaction × satisfaction-to-learning products. The omnibus tests indicate whether at least one coefficient within a tested path family differs across countries; they do not identify which specific country pairs differ. Equality-constrained structural models produced only trivial deterioration in global fit.
Disclaimer/Publisher’s Note: The statements, opinions and data contained in all publications are solely those of the individual author(s) and contributor(s) and not of MDPI and/or the editor(s). MDPI and/or the editor(s) disclaim responsibility for any injury to people or property resulting from any ideas, methods, instructions or products referred to in the content.
Copyright: This open access article is published under a Creative Commons CC BY 4.0 license, which permit the free download, distribution, and reuse, provided that the author and preprint are cited in any reuse.