

Submitted:
29 August 2026
Posted:
31 August 2026
You are already at the latest version
Abstract
With the increasing penetration of renewable energy, cross-regional reserve sharing faces transmission congestion and high reserve procurement costs. This paper proposes a virtual reserve service framework based on spatially transferable loads in data centers. First, a data center migration capability assessment model and a cross-regional generator–data center joint reserve capacity optimization model are established to characterize the multi-constraint mechanism of virtual reserve provision. Second, a cross-regional virtual reserve consortium (CRVRC) mechanism is designed, incorporating joint quantity–price bidding and tiered pricing. Curve aggregation and tier-based allocation are used to coordinate reserve procurement between data center operators and generation operators. Finally, three representative case studies are constructed. The results show that the proposed method can integrate geographically distributed low-cost reserve resources, reduce reserve procurement costs, and support high-cost regions by coordinating data center task migration.
Keywords:
virtual reserve service
; data center
; spatially transferable load
; joint pricing mechanism
; computing-power–electricity coordination
; market clearing
1. Introduction
The large-scale integration of renewable energy has substantially increased reserve capacity requirements in power systems. Cross-regional reserve resource allocation has therefore become an important issue for maintaining secure and economic system operation. Existing studies have mainly focused on reserve demand assessment, regional reserve sharing, and multi-energy coordinated dispatch. References [1,2,3,4,5] improve reserve allocation efficiency from perspectives such as dynamic reserve configuration and regional joint optimization. However, these studies primarily focus on supply-side flexible resources and have not fully exploited the cross-regional reserve potential of demand-side adjustable loads.
Compared with conventional adjustable loads, data center loads have high power density and strong spatial-temporal transferability. By migrating computing tasks, data centers can reshape the distribution of electricity demand across regions and form cross-regional virtual reserve resources. This provides a new path for alleviating transmission congestion and improving reserve resource utilization. Data centers are therefore important demand-side flexible resources in new power systems, and their participation in reserve optimization and market clearing requires load models and coordination mechanisms that capture spatial-temporal migration characteristics.
For data center load modeling, references [6,7,8] study workload allocation optimization, cross-regional migration, and carbon-oriented regulation, respectively, demonstrating the feasibility of data centers participating in optimized grid operation.
For scheduling optimization and market mechanisms, references [9,10,11] further investigate incentive allocation, computing-power–electricity coordination, and carbon-oriented demand response mechanisms for data centers participating in grid operation. Nevertheless, existing work mainly focuses on demand response, energy consumption optimization, and carbon emission reduction. Joint modeling, joint quantity–price bidding, and market clearing for spatially transferable data center loads participating in cross-regional reserve services remain insufficiently studied. In particular, a declaration and trading framework is still needed for data centers and reserve generators to jointly form virtual reserve resources.
To address these gaps, this paper proposes a virtual reserve service design based on spatially transferable loads in data centers. The main contributions are as follows: (1) a migration capability and constraint model is constructed for data centers; and (2) a thermal generator–data center joint virtual reserve service is designed, together with a joint bidding model for multiple data centers and thermal generating units.
2. Data Center Load Modeling for Virtual Reserve Services
2.1. Migration Capability and Constraint Modeling
The spatial-temporal transferability of data center loads is the basis of virtual reserve services. According to delay sensitivity, data center loads can be divided into online and offline loads. Online loads have limited temporal elasticity and therefore limited virtual reserve potential. Offline loads have stronger temporal flexibility; among them, compute-intensive tasks have relatively low migration costs and high spatial-temporal elasticity, making them the main resources for virtual reserve services.
This paper focuses on spatially migratable compute-intensive tasks. The task migration volume is modeled as a decision variable, and the unit server processing capability is used to characterize task processing capability. Under scheduling periods , data center load migration is subject to the following constraints:
where s is the bandwidth occupied by a unit task volume; is the bandwidth limit between data centers u and v; is the set of connected data center pairs between regions i and j; is the power consumption of data centers at node i in period t; and are power consumption coefficients; is the set of data centers at node i; and are the task arrival and processing volumes of data center u in period t, respectively; is the maximum task processing volume of data center u; is the task volume migrated from data center v to data center u; and is the task volume migrated from data center u to data center v.
Based on these constraints, the cross-regional migration capability of data centers is defined. Consider regions i and j, where the data center sets are and , respectively. The migration capability between two data centers and the total interregional migration capability are:
where is the migratable load capacity from data center u in region i to data center v in region j at time t; is the power conversion coefficient of data center u; and is the total migratable load capacity from region i to region j at time t.
2.2. Cross-Regional Generator–Data Center Joint Reserve Capacity Modeling
The virtual reserve service proposed in this paper migrates data center loads from region i to region j, thereby reducing the load in region i. Meanwhile, reserve generating units in region j support the additional migrated load in region j. This process provides cross-regional virtual reserve support for region i, and the released load in region i is the virtual reserve capacity obtained by region i. The following constraints are established:
where and are the releasable load of data center u and all data centers in region i at time t, respectively; and are the additional power consumption caused by migrated tasks at data center v and all data centers in region j, respectively; is the unit task power consumption coefficient of data center v; is the set of reserve generating units in region j; is the available reserve capacity of unit g; and is the bandwidth limit between data centers u and v.
Considering these constraints, the maximum reserve capacity optimization model for cross-regional virtual reserve services is:
subject to:
where is the virtual reserve capacity obtained by region i from region j; and is the task arrival volume of data center v in period t.
3. Virtual Reserve Service Design Based on Spatially Transferable Data Center Loads
3.1. Product Design
This paper proposes a cross-regional virtual reserve consortium (CRVRC) business model that participates in the reserve market through a joint quantity–price bidding mechanism.
3.1.1. Organizational Structure of the CRVRC
The CRVRC consists of a data center operator (DCO) and a reserve generation operator in region j (GO–j). The DCO owns data center facilities in both regions i and j. Contracts within the consortium define the rights and responsibilities of each participant.
The DCO provides the transferable task volume from the data center set in region i to the data center set in region j. It receives migrated tasks in region j, provides bandwidth resources , implements data migration, guarantees service quality, shares reserve service revenue, and bears migration and operating costs.
GO–j provides generation reserve capacity to support the increased power load in region j. It helps ensure secure grid operation, shares reserve service revenue, and receives reserve capacity payments.
3.1.2. Joint Quantity–Price Bidding Mechanism
The CRVRC participates in the reserve market of region i as a unified entity. Its quantity and price bids follow the principles below.
First, for the joint quantity constraint, the declared reserve capacity of the consortium must satisfy the solution of Equation (14):
where is the optimal solution of Equation (14) subject to Equations (15)–(19).
Second, for tiered quantity–price bidding, the consortium submits a reserve capacity–price curve for period t to the dispatcher for market clearing:
where is the cumulative reserve capacity of tier k of consortium m, and is the corresponding bid price.
4. Pricing Method for Virtual Reserve Services
4.1. Comprehensive Cost Analysis of Virtual Reserve Services
The total cost of cross-regional virtual reserve services consists of data center migration cost, opportunity cost, risk cost, and reserve generation cost:
where is the migration cost, including migration action cost and energy cost; is the opportunity cost of participating in electricity ancillary services; is the risk cost caused by potential service quality degradation during migration; and is the reserve generation cost paid by the CRVRC to generation operators.
4.2. Joint Pricing Model for Data Centers and Reserve Generators
Because the reliability of virtual reserve services decreases as capacity increases, operators adopt tiered pricing strategies.
For DCO tiered pricing, the same data center u may appear in multiple transmission paths. The construction of tiers must therefore consider the cumulative occupation of each data center.
As shown in Figure 1, N is the number of transmission paths. is the remaining outbound capability of data center in tier k; is the remaining receiving capability of data center in tier k; is the bandwidth capacity limit of path ; and is an indicator function, which equals one when the condition is satisfied and zero otherwise.
For GO–j tiered pricing, each unit divides its reserve capacity into several tiers according to operating cost and capacity constraints, forming a unit-level tiered bidding curve:
where is the incremental reserve capacity of unit g in tier n; is the unit reserve cost of tier n; and , meaning that tier prices are nondecreasing.
As shown in Figure 2, is the total number of tiers, and denotes the unit, internal tier index, incremental capacity, and unit cost corresponding to tier k.
For the CRVRC tiered pricing, the capacity tiers in the DCO and GO–j quantity–price curves are not in one-to-one correspondence. A curve aggregation algorithm is therefore required to build a unified quantity–price curve for the consortium.
As shown in Figure 3, is the number of distinct breakpoints after deduplication. and are the marginal costs of the DCO and GO–j at capacity , respectively. They satisfy and , respectively. is the profit margin of the consortium in tier k; is the cumulative reserve capacity in tier k; and is the number of valid tiers satisfying the capacity constraint. The tiered bids satisfy .
If consortium m clears capacity in tier k, the revenue of that tier is:
where is the uniform market clearing price.
Assuming a perfectly competitive market, all parties bid based on cost. The tier-k revenue of the DCO and GO–j is allocated according to their cost contribution ratios:
where .
The allocation coefficients of tier k are:
The total revenue of each party in the consortium is:
5. Simulation Analysis
5.1. Simulation Model Design
To verify the economics of cross-regional virtual reserve services, a two-region virtual reserve simulation model is constructed [12,13].
Assume that M cross-regional virtual reserve consortia and N traditional reserve generating units in region i, , participate in market bidding. Only virtual reserve services from region j to region i are considered. After all participants submit tiered bidding curves, market clearing is optimized by minimizing the total cost in region i [14].
The objective function of the simulation model is:
where is the set of all CRVRCs; and are the cleared reserve capacity and bid price of tier k of consortium m, respectively; is the set of traditional reserve generating units in region i; and and are the unit reserve cost and reserve capacity of tier n of traditional reserve unit g, respectively.
The constraints are:
where is the reserve demand of region i at time t; is the cumulative reserve capacity of tier k of consortium m; is the maximum available reserve capacity of the consortium; and is the maximum available reserve capacity of tier n of traditional reserve unit g at time t.
The clearing price is:
The revenue obtained by winning consortium m in tier k is:
5.2. Simulation Scenario Settings
The scenario settings are shown in Table 1, and the ranges of key parameters are shown in Table 2. Detailed parameter settings are provided in Appendix A. The reserve demand is uniformly set to 100 MW, and is uniformly set to 0.5.
5.3. Simulation Results
5.3.1. Scenario 1: Market Clearing Results in the Baseline Scenario
As shown in Figure 4, Figure 5 and Figure 6, the clearing price is 68 CNY/MWh. Units G1–1 and G1–2 of S1 clear 40 MW and 35 MW, respectively, accounting for 75% in total. Unit G2–1 of S2 clears 25 MW, accounting for 25%. The total supplier revenue is CNY 6800, including CNY 5100 for S1 and CNY 1700 for S2. The total supplier cost, here and below referring to cost bids, is CNY 5640, including CNY 4060 for S1 (72.8%) and CNY 1580 for S2 (27.2%). This scenario serves as the baseline for comparing the effects of introducing virtual reserve services.
5.3.2. Scenario 2: Market Clearing Results with a Single CRVRC
As shown in Figure 7, when the reserve demand is 100 MW, the clearing price is 58.00 CNY/MWh. CRVRC–1 clears its full capacity of 44.20 MW, and S1 clears 55.80 MW. Thus, CRVRC–1 is cleared first, while S1 supplements the remaining demand.
As shown in Figure 8, the total service cost is CNY 4661.60. CRVRC–1 and S1 bear costs of CNY 1745.2 and CNY 2916.4, respectively. The revenue of CRVRC–1 is CNY 2563.6, while the revenue of S1 is CNY 3236.4.
5.3.3. Scenario 3: Market Clearing Results with Multiple CRVRCs
As shown in Figure 9, when the reserve demand is 100 MW, the clearing price is 43.01 CNY/MWh. CRVRC–1 clears its full capacity of 44.20 MW, CRVRC–2 clears 35.80 MW, CRVRC–3 clears 20.00 MW, and S1 does not clear. Compared with the clearing price of 58 CNY/MWh in Scenario 2, competition among multiple consortia reduces the clearing price by 14.99 CNY/MWh, corresponding to a decrease of 25.8%.
As shown in Figure 10, the costs and revenues of CRVRC–1 are CNY 1745.2 and CNY 1901.07, respectively; those of CRVRC–2 are CNY 1503.51 and CNY 1539.78, respectively; and those of CRVRC–3 are CNY 845.51 and CNY 860.21, respectively. The total system cost is CNY 4094.23, which is 12.2% lower than that in Scenario 2. However, marginal profits decline across the three consortia, and CRVRC–2 and CRVRC–3 approach zero profit. This indicates that competition among consortia significantly compresses profit margins, while the high bid of S1 causes it to be fully displaced from the market. Traditional reserves therefore face displacement risk when virtual reserve supply is sufficient.
6. Conclusions
This paper proposes a cross-regional virtual reserve service method based on spatially transferable loads in data centers. A data center migration model considering bandwidth, power, and task processing constraints is constructed to quantitatively characterize cross-regional migratable loads. Based on this model, a CRVRC market mechanism integrating data centers and reserve generators is designed. Joint quantity–price bidding and tiered pricing are used to enable unified reserve resource clearing.
The simulation results show that the proposed method can effectively reduce system reserve costs and improve market clearing efficiency in a multi-participant competitive environment while maintaining the basic revenue of participating entities.
Future work will focus on incorporating power flow and transmission congestion constraints, as well as modeling data center reserve reliability and task uncertainty, to further improve the engineering applicability and robustness of the proposed model.
Author Contributions
Conceptualization, J.Z., W.D. and P.Y.; methodology, J.L. and Z.Z.; software, J.L., Y.W. and Z.Z.; validation, J.L., H.F., Q.W., Y.W. and Z.Z.; formal analysis, J.L. and Z.Z.; investigation, J.L. and Z.Z.; resources, H.F., Q.W. and P.Y.; data curation, J.L., H.F., Q.W. and Y.W.; writing—original draft preparation, J.L. and Z.Z.; writing—review and editing, J.Z., J.L., H.F., Q.W., Y.W., W.D., Z.Z. and P.Y.; visualization, J.L., Y.W. and Z.Z.; supervision, J.Z., W.D. and P.Y.; project administration, J.Z. and P.Y.; funding acquisition, J.Z. All authors have read and agreed to the published version of the manuscript.
Funding
This research was funded by the Science and Technology Project of Guangdong Power Grid Co., Ltd. (No. GDKJXM20250212 (038100KC25020001)).
Institutional Review Board Statement
Not applicable.
Informed Consent Statement
Not applicable.
Data Availability Statement
No new data were created or analyzed in this study. Data sharing is not applicable to this article.
Acknowledgments
Not applicable.
Conflicts of Interest
The authors declare no conflicts of interest. The funders had no role in the design of the study; in the collection, analyses, or interpretation of data; in the writing of the manuscript; or in the decision to publish the results.
Abbreviations
The following abbreviations are used in this manuscript:
| CRVRC | Cross-regional virtual reserve consortium |
| DCO | Data center operator |
| GO | Generation operator |
| IDC | Internet data center |
Appendix A. Simulation Parameters

Table A1.
Parameters of Supplier S1 in Scenario 1.
| Unit | Tier | (MW) | (CNY/MWh) |
|---|---|---|---|
| G1–1 | 1 | 15 | 48 |
| G1–1 | 2 | 15 | 52 |
| G1–1 | 3 | 10 | 58 |
| G1–2 | 1 | 20 | 54 |
| G1–2 | 2 | 15 | 60 |
Table A2.
Parameters of Supplier S2 in Scenario 1.
| Unit | Tier | (MW) | (CNY/MWh) |
|---|---|---|---|
| G2–1 | 1 | 20 | 62 |
| G2–1 | 2 | 20 | 68 |
| G2–1 | 3 | 15 | 75 |
| G2–2 | 1 | 15 | 72 |
| G2–2 | 2 | 20 | 80 |
Table A3.
Parameters of Data Center DCO–1 in Scenario 2.
| Data Center | Region | (tasks/h) | (MW/task) | (tasks/h) |
|---|---|---|---|---|
| i | 200000 | 0.00050 | 50000 | |
| i | 150000 | 0.00048 | 40000 | |
| j | 180000 | 0.00040 | 60000 | |
| j | 200000 | 0.00045 | 50000 |
Table A4.
Transmission path parameters of DCO–1 in Scenario 2.
| Path | (tasks/h) | (CNY/task) | (CNY/task) | (CNY/task) |
|---|---|---|---|---|
| 80000 | 0.0015 | 0.0050 | 0.00005 | |
| 60000 | 0.0018 | 0.0050 | 0.00005 | |
| 70000 | 0.0016 | 0.0048 | 0.00005 | |
| 50000 | 0.0020 | 0.0048 | 0.00005 |
Table A5.
Parameters of GO–j–1 in Scenario 2.
| Unit | Tier | (MW) | (CNY/MWh) |
|---|---|---|---|
| 1 | 15 | 24 | |
| 2 | 15 | 28 | |
| 3 | 10 | 32 | |
| 1 | 20 | 26 | |
| 2 | 15 | 30 |
Table A6.
Parameters of Supplier S1 in Scenario 2.
| Unit | Tier | (MW) | (CNY/MWh) |
|---|---|---|---|
| G1–1 | 1 | 15 | 48 |
| G1–1 | 2 | 15 | 52 |
| G1–1 | 3 | 10 | 58 |
| G1–2 | 1 | 20 | 54 |
| G1–2 | 2 | 15 | 60 |
Table A7.
Parameters of Data Center DCO–2 in Scenario 3.
| Data Center | Region | (tasks/h) | (MW/task) | (tasks/h) |
|---|---|---|---|---|
| i | 180000 | 0.00047 | 45000 | |
| i | 160000 | 0.00050 | 50000 | |
| j | 200000 | 0.00042 | 55000 | |
| j | 190000 | 0.00048 | 60000 |
Table A8.
Transmission path parameters of DCO–2 in Scenario 3.
| Path | (tasks/h) | (CNY/task) | (CNY/task) | (CNY/task) |
|---|---|---|---|---|
| 75000 | 0.0016 | 0.0047 | 0.00005 | |
| 65000 | 0.0019 | 0.0047 | 0.00005 | |
| 70000 | 0.0017 | 0.0050 | 0.00005 | |
| 60000 | 0.0021 | 0.0050 | 0.00005 |
Table A9.
Parameters of GO–j–2 in Scenario 3.
| Unit | Tier | (MW) | (CNY/MWh) |
|---|---|---|---|
| 1 | 18 | 27 | |
| 2 | 18 | 31 | |
| 3 | 14 | 36 | |
| 1 | 22 | 29 | |
| 2 | 18 | 34 |
Table A10.
Parameters of Data Center DCO–3 in Scenario 3.
| Data Center | Region | (tasks/h) | (MW/task) | (tasks/h) |
|---|---|---|---|---|
| i | 190000 | 0.00046 | 48000 | |
| i | 170000 | 0.00049 | 42000 | |
| j | 185000 | 0.00046 | 58000 | |
| j | 195000 | 0.00044 | 52000 |
Table A11.
Transmission path parameters of DCO–3 in Scenario 3.
| Path | (tasks/h) | (CNY/task) | (CNY/task) | (CNY/task) |
|---|---|---|---|---|
| 78000 | 0.0017 | 0.0046 | 0.00005 | |
| 68000 | 0.0020 | 0.0046 | 0.00005 | |
| 72000 | 0.0018 | 0.0049 | 0.00005 | |
| 62000 | 0.0022 | 0.0049 | 0.00005 |
Table A12.
Parameters of GO–j–3 in Scenario 3.
| Unit | Tier | (MW) | (CNY/MWh) |
|---|---|---|---|
| 1 | 20 | 28 | |
| 2 | 18 | 33 | |
| 1 | 16 | 30 | |
| 2 | 16 | 35 | |
| 3 | 12 | 40 | |
| 1 | 22 | 32 | |
| 2 | 20 | 38 |
Table A13.
Parameters of traditional reserve Supplier S1 in Scenario 3.
| Unit | Tier | (MW) | (CNY/MWh) |
|---|---|---|---|
| G1–1 | 1 | 15 | 48 |
| G1–1 | 2 | 15 | 52 |
| G1–1 | 3 | 10 | 58 |
| G1–2 | 1 | 20 | 54 |
| G1–2 | 2 | 15 | 60 |
| G1–3 | 1 | 18 | 62 |
| G1–3 | 2 | 17 | 68 |
| G1–3 | 3 | 15 | 75 |
References
- Dong, Z.; Li, Y.; Li, H. Reserve capacity allocation considering uncertainties of wind power output and demand response. Power Demand Side Manag. 2017, 19, 29–34, 44, In Chinese. [Google Scholar]
- Holttinen, H.; et al. Methodologies to determine operating reserves due to increased wind power. IEEE Trans. Sustain. Energy 2012, 3, 713–723. [Google Scholar] [CrossRef]
- Li, Q.; Wang, Y.; Huang, M.; et al. Research on multi-energy joint optimal peak-shaving dispatching of large power grid considering reserve optimization. Water Resour. Power 2025, 43, 222–226, In Chinese. [Google Scholar]
- Cai, Z.; Dai, S.; Cui, H.; et al. Provincial reserve capacity retention scheme for regional power grid (I): Mechanism design. Proc. CSEE 2023, 43, 61–69, In Chinese. [Google Scholar]
- Cai, Z.; Ding, Q.; Cui, H.; et al. Provincial reserve capacity retention scheme for regional power grid (II): Optimization model. Proc. CSEE 2023, 43, 1037–1047, In Chinese. [Google Scholar]
- Zhang, W.; Zhou, H.; You, P.; et al. Research on optimal load allocation model of data center workflow considering bandwidth and electricity cost. Power Demand Side Manag. 2024, 26, 48–54, In Chinese. [Google Scholar]
- Yang, T.; et al. Carbon management of multi-datacenter based on spatio-temporal task migration. IEEE Trans. Cloud Comput. 2021, 11, 1078–1090. [Google Scholar] [CrossRef]
- Lindberg, J.; Lesieutre, B.C.; Roald, L.A. Using geographic load shifting to reduce carbon emissions. Electr. Power Syst. Res. 2022, 212, 108586. [Google Scholar] [CrossRef]
- Wu, Z.; et al. Incentivizing the spatiotemporal flexibility of data centers toward power system coordination. IEEE Trans. Netw. Sci. Eng. 2023, 10, 1766–1778. [Google Scholar] [CrossRef]
- Yang, P.; Yu, S.; Ren, F. Collaborative innovation framework of computing power and electric power. Control Theory Appl. 2024, 41, 1181–1186, In Chinese. [Google Scholar]
- Wan, T.; et al. Internet data centers participating in electricity network transition considering carbon-oriented demand response. Appl. Energy 2023, 329, 120305. [Google Scholar] [CrossRef]
- Gao, D.; Yang, S.; Tian, X.; et al. Collaborative optimal scheduling of port logistics-energy flow considering reserve services in electricity market. Port Operation 2025. In Chinese. [Google Scholar]
- Zou, P.; Cui, X.; He, X.; et al. Design and practice of ancillary service market mechanism for power reserve in Shanxi Province. Power Syst. Technol. 2024, 48, 2490–2501, In Chinese. [Google Scholar]
- Zhang, P. Optimization operation method of virtual data center clusters considering demand response. PhD thesis, North China Electric Power University, 2021. In Chinese. [Google Scholar]
Figure 1.
Flowchart of the tiered pricing mechanism for DCO services.
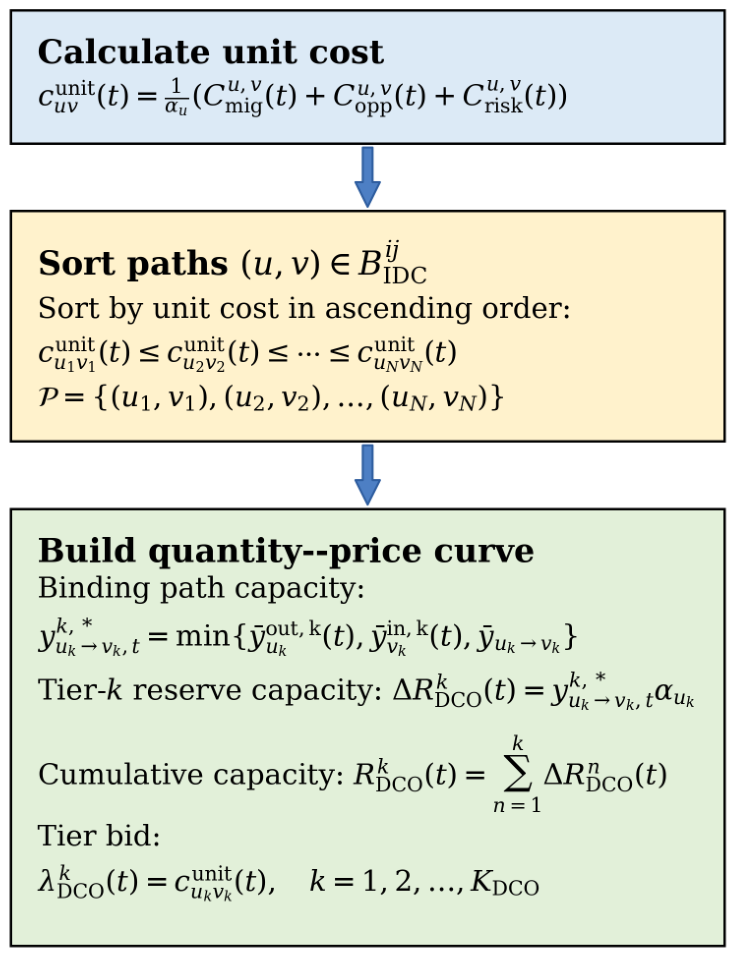
Figure 2.
Flowchart of the tiered pricing mechanism for GO–j services.
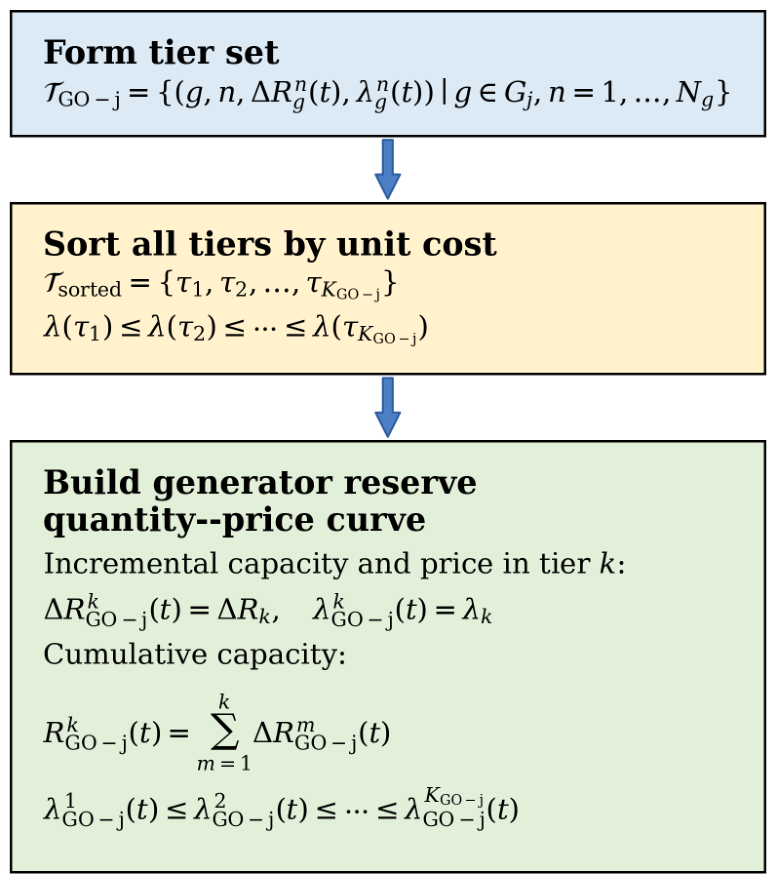
Figure 3.
Flowchart of the tiered pricing mechanism for the consortium.
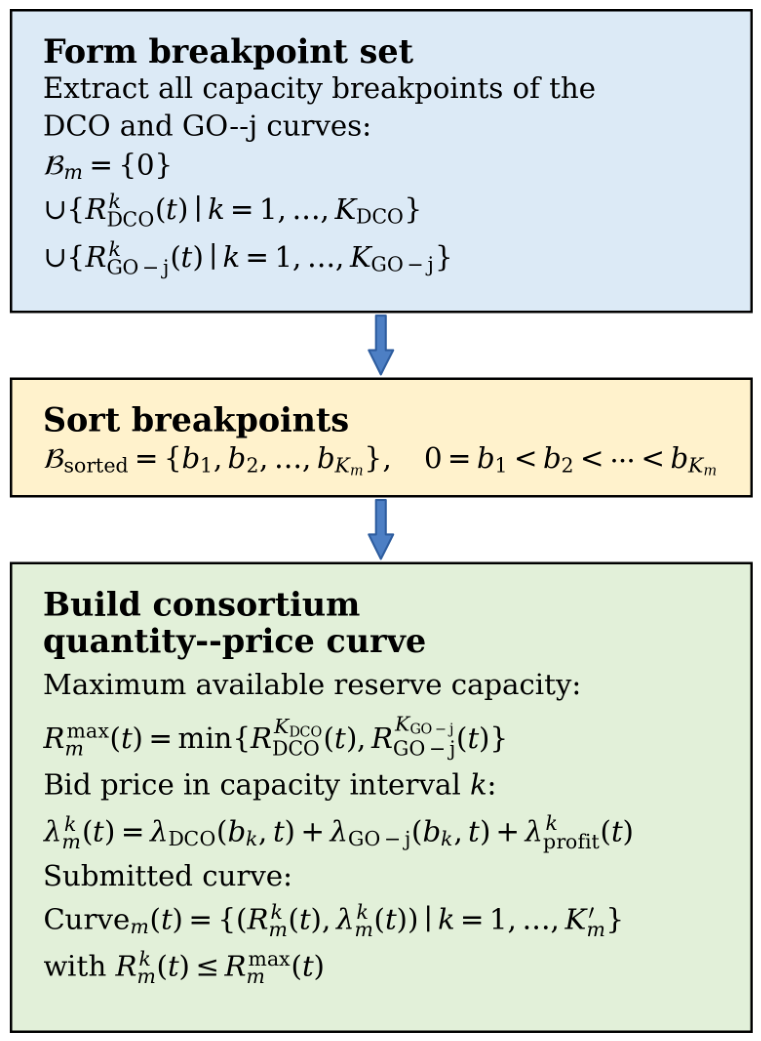
Figure 4.
Traditional reserve supply curve.
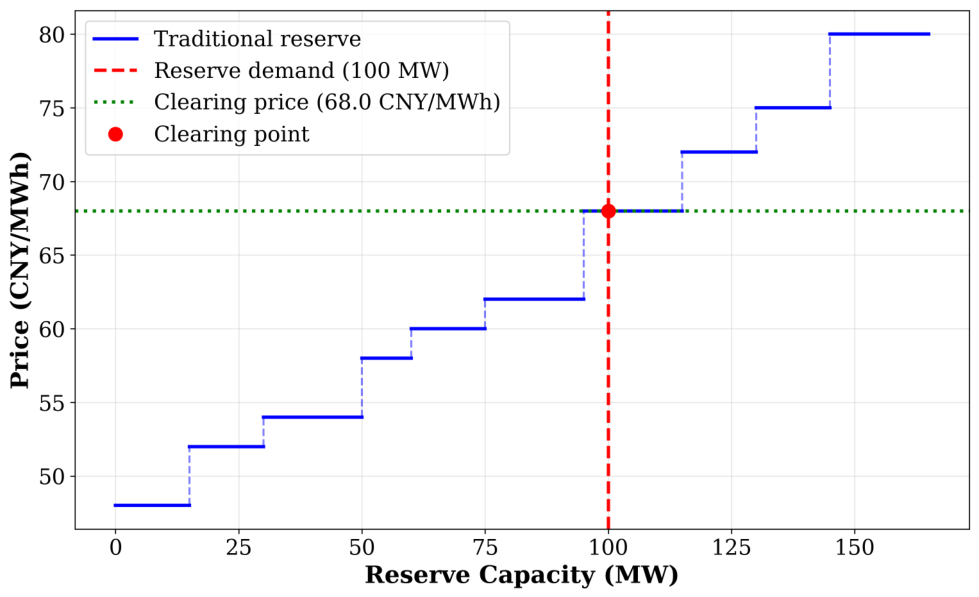
Figure 5.
Market clearing results in Scenario 1.
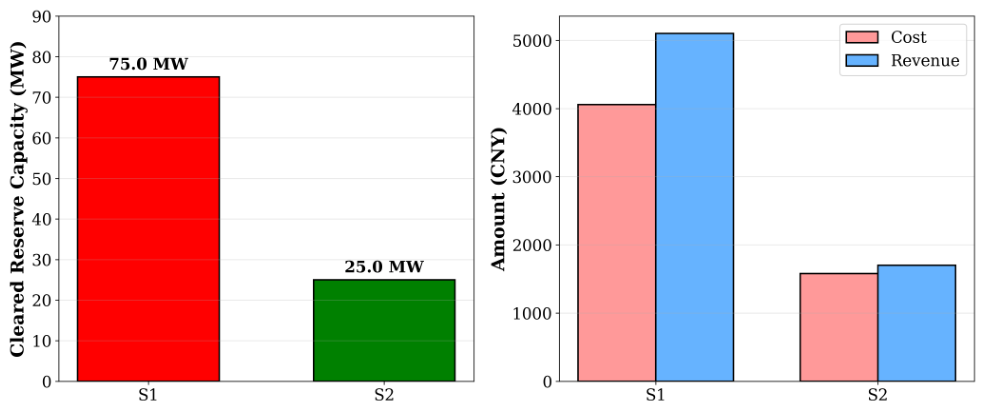
Figure 6.
Cost and revenue analysis in Scenario 1.
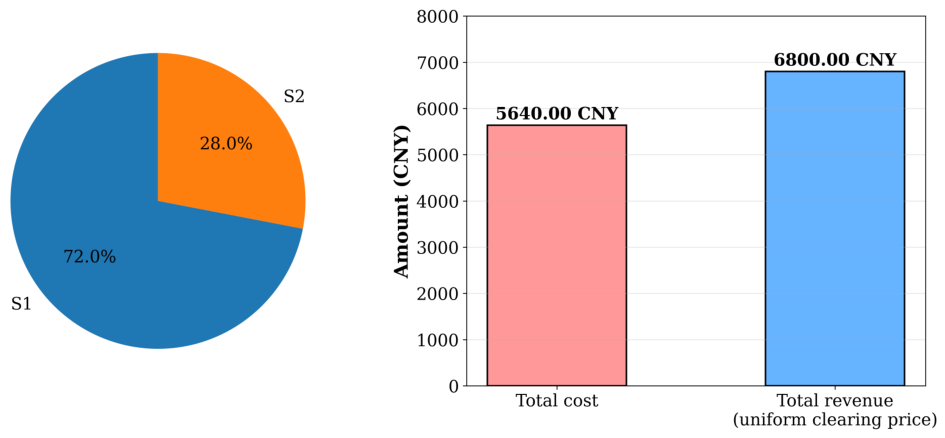
Figure 7.
Total market supply curve in Scenario 2.
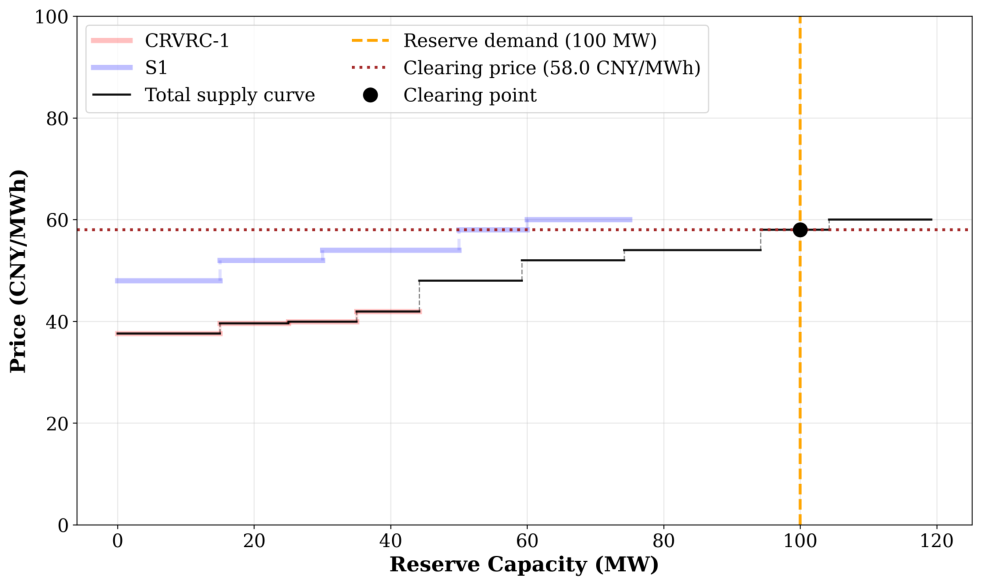
Figure 8.
Market clearing results in Scenario 2.
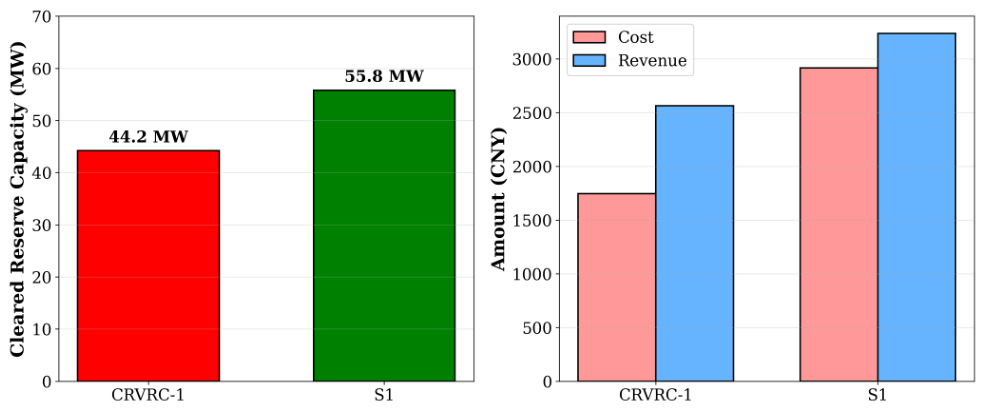
Figure 9.
Total market supply curve in Scenario 3.
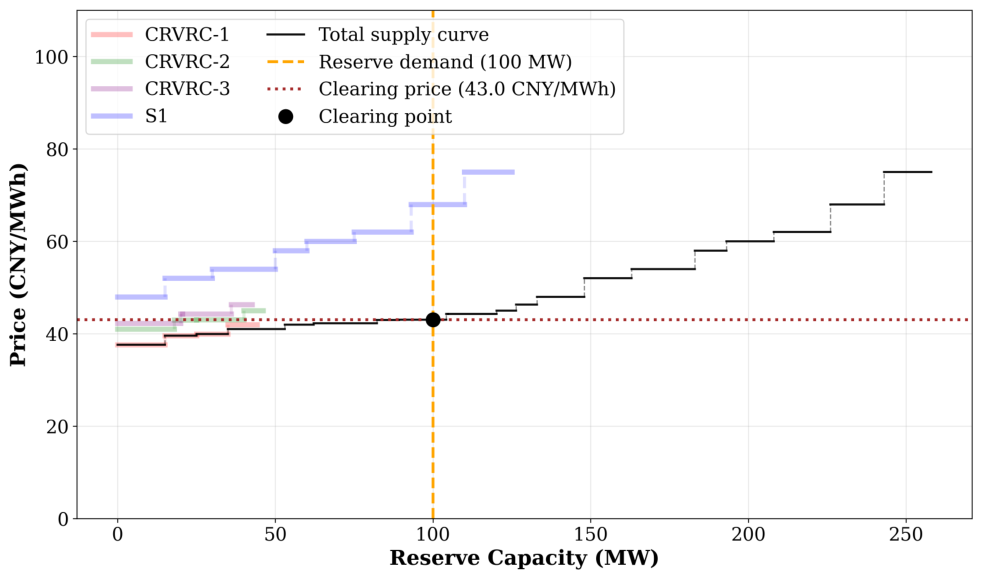
Figure 10.
Market clearing results in Scenario 3.
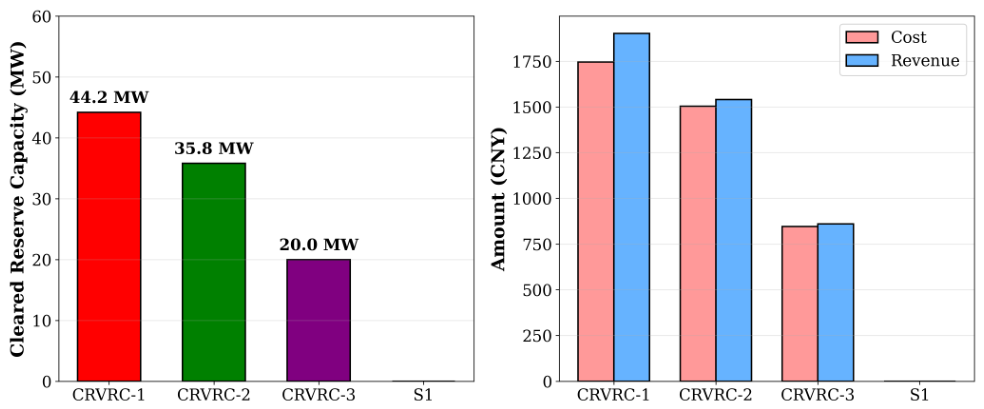
Table 1.
Scenario settings.
| Scenario | Setting |
|---|---|
| Scenario 1 (baseline) | Traditional suppliers S1 and S2 participate. |
| Scenario 2 | CRVRC–1 and traditional supplier S1 participate. |
| Scenario 3 | CRVRC–1, CRVRC–2, CRVRC–3, and traditional supplier S1 participate; CRVRC–1 is the same as in Scenario 2. |
Table 2.
Ranges of key parameters.
| Parameter | Range |
|---|---|
| of traditional supplier units (MW) | 15–22 |
| of traditional supplier units (CNY/MWh) | 24–80 |
| of data centers (tasks/h) | 60,000–200,000 |
| of data centers (MW/task) | 0.00040–0.00050 |
| of data centers (tasks/h) | 40,000–60,000 |
| of data centers (tasks/h) | 50,000–80,000 |
| of data centers (CNY/task) | 0.0015–0.0022 |
| of data centers (CNY/task) | 0.0047–0.0050 |
| of data centers (CNY/task) | 0.00005 |
Disclaimer/Publisher’s Note: The statements, opinions and data contained in all publications are solely those of the individual author(s) and contributor(s) and not of MDPI and/or the editor(s). MDPI and/or the editor(s) disclaim responsibility for any injury to people or property resulting from any ideas, methods, instructions or products referred to in the content. |
© 2026 by the authors. Licensee MDPI, Basel, Switzerland. This article is an open access article distributed under the terms and conditions of the Creative Commons Attribution (CC BY) license (http://creativecommons.org/licenses/by/4.0/).
Copyright: This open access article is published under a Creative Commons CC BY 4.0 license, which permit the free download, distribution, and reuse, provided that the author and preprint are cited in any reuse.