

Submitted:
27 August 2026
Posted:
31 August 2026
You are already at the latest version
Abstract
Intelligent seedbed preparation requires more than an optimized soil-engaging component: field condition must be diagnosed, a controllable setting must be adjusted, and the resulting soil zone must be verified. This critical review synthesizes 133 sources across soil mechanics, component design, numerical modeling, field validation, and sensing-control research for water-limited cropping systems. Evidence was compared as bounded within-study contrasts rather than pooled effects because outcome definitions, soils, operating regimes, and validation scales differ. Four recurring conflicts organize the synthesis: fracture versus draft, tilth versus evaporative exposure, residue retention versus blockage, and immediate loosening versus persistence. Reported examples include an increase in the <50-mm aggregate fraction from 76.1% to 88.0%, a study-specific fragmentation index increase from 83.0% to 94.54%, a 43–47% reduction in penetration resistance after geometry-optimized loosening, and rainfall-dependent water-use-efficiency gains of 6.0–11.7% after subsoiling. These values are retained as study-specific anchors, not universal settings. The proposed framework adds value by linking four decision stages—field diagnosis, component design, controlled operation, and post-pass verification—while explicitly separating conventional optimization, monitored operation, and closed-loop intelligent control.
Keywords:
intelligent planting machinery
; seedbed preparation
; soil-engaging components
; mechanism optimization
; strip tillage
; soil–tool interaction
; adaptive operation
; draft force
; water-limited agriculture
; discrete element method
1. Introduction
The planting operation is constrained before seed metering begins. Soil-engaging components must create a spatially defined seed and root zone with acceptable clod size, residue flow, firmness, pore continuity, and depth stability; otherwise, accurate metering cannot produce uniform establishment [1,2,3,4].
Localized and strip-based preparation concentrates this work in the future crop row rather than disturbing the full field width, making geometry, sequence, depth, width, and operating intensity explicit design variables [5,6,7,8,9,10].
This selectivity is especially consequential in water-limited systems. A compacted horizon can restrict access to stored water, yet unnecessarily wide or aggressive disturbance can increase evaporative exposure and displace protective residue. Field studies accordingly report conditional rather than uniform benefits: responses vary with strip width, rainfall class, profile constraint, residue cover, and irrigation context [10,11,12,13].
The broader conservation-agriculture literature confirms that management labels alone do not identify the mechanism responsible for a crop response [14,15,16,17]. At component scale, a disc, shank, wing, sweep, roller, or closing device changes the boundary condition encountered by the next element. A useful engineering comparison must therefore specify the working body, its arrangement, the soil state, and the three-dimensional zone produced.
The term intelligent is used here in a restricted sense. Conventional optimization selects a geometry or fixed setting for a stated condition. Monitoring adds sensors but does not necessarily change operation. Closed-loop intelligent preparation requires an observable state, an adjustable decision, a defined control objective, and verification that the target soil zone was actually formed. Automation without this decision-verification chain is not treated as intelligence.
Existing reviews usually address conservation tillage as a management system, soil-tool mechanics around individual bodies, or calibration of numerical models [18,19,20,21,22,23,24,25,26,27,28]. The unresolved engineering link is how those results should move from diagnosed field constraint to component choice, controllable operating envelope, and verified water or crop function. The framework developed here is not presented as a new review methodology; its contribution is a domain-specific causal organization of heterogeneous evidence and an explicit rule for limiting transfer across scales.
The aim of this review was to determine how component geometry, arrangement, soil state, and operating regime can be co-designed for localized seedbed preparation in water-limited cropping systems. The objectives were to compare findings within their experimental boundaries, distinguish conventional optimization from adaptive control, connect laboratory and numerical evidence with whole-machine field validation, and identify the remaining requirements for reliable closed-loop operation. Figure 1 summarizes the four-stage architecture.
2. Review Design and Evidence-Synthesis Framework
This article is a structured critical engineering review rather than a systematic review or meta-analysis. It does not claim exhaustive retrieval or reconstruct unavailable historical screening counts. PRISMA 2020 is used only to disclose reporting limits [29]. The domain-specific framework differs from conventional narrative organization by coding each inference along a causal chain—diagnosed constraint, component geometry, operating regime, soil response, validation scale, and functional outcome—so that evidence cannot be transferred silently from simulation to crop response or from one soil boundary to another.
The 133-source evidence base prioritizes peer-reviewed experiments, validated numerical analyses, and foundational mechanics reporting at least one design-relevant variable. Each source is interpreted only at the scale it supports. A calibrated DEM study can screen geometries within its contact model and soil state, whereas a field trial can establish a system response only for its reported configuration, season, traffic, residue, and water regime.
Table 1 defines the appraisal dimensions used to separate transferable mechanisms from site- or configuration-specific settings. It prevents three recurrent errors: treating an implement name as a geometry, treating a numerical optimum as a field prescription, and treating an immediate physical response as a persistent agronomic benefit.
2.1. Evidence-Appraisal Rules and Review Limits
Evidence was appraised according to the question that each method can legitimately answer. Tool-force and soil-bin experiments were treated as direct evidence for local mechanical tendencies; calibrated numerical studies as comparative design evidence; and field studies as direct evidence for seedbed, water, or crop response only when configuration and relevant soil conditions were reported. Agreement across these levels strengthened an inference, whereas disagreement was examined for differences in boundary conditions or measurement definitions.
Every quantitative result was assigned a boundary vector comprising soil texture and water state, density or strength, geometry, depth, speed, residue condition, validation scale, measurement definition, and response time. A reduction in penetration resistance was not interpreted as improved root-zone function without depth and sampling position; a yield response was not assigned to geometry when fertilizer placement, traffic, irrigation, or weather also differed.
Four limits were retained. No pooled effect size was calculated; evidence maps describe directness rather than magnitude; proposed sensing variables are design requirements rather than proof that every prototype used closed-loop control; and the resulting workflow supports prototype selection but cannot replace field calibration or multi-season validation. Search strings, coding rules, the complete 133-source ledger, equations, and the transferred full evidence tables are provided in Supplementary Tables S1–S10.
2.2. Cross-Study Normalization and Comparison Rules
Quantitative findings were retained as within-study contrasts. When compatible treatment and reference values were available, relative change was recomputed as 100(yT-yR)/yR. Percentage-point differences remained percentage-point differences, and author-defined fragmentation or stability indices retained their original names and denominators. Standardized mean differences were not calculated when replication or dispersion data were unavailable.
Cross-study comparison was permitted only when the outcome definition, direction, unit, and principal boundary vector were compatible. Draft, penetration resistance, aggregate fractions, temperature, and water-use efficiency were therefore not collapsed into a common score. Figure 4 deliberately juxtaposes rather than pools these responses, while Supplementary Table S9 preserves the tested condition, baseline, measured contrast, supported inference, and transferability boundary for every quantitative anchor.
This framework improves comparability without creating false precision. It identifies whether two studies test the same engineering question, whether a difference can be expressed on a common within-study scale, and which contextual variables prevent direct aggregation. Where those requirements were not met, the evidence was compared mechanistically and its disagreement was reported as an unresolved boundary rather than statistical heterogeneity.
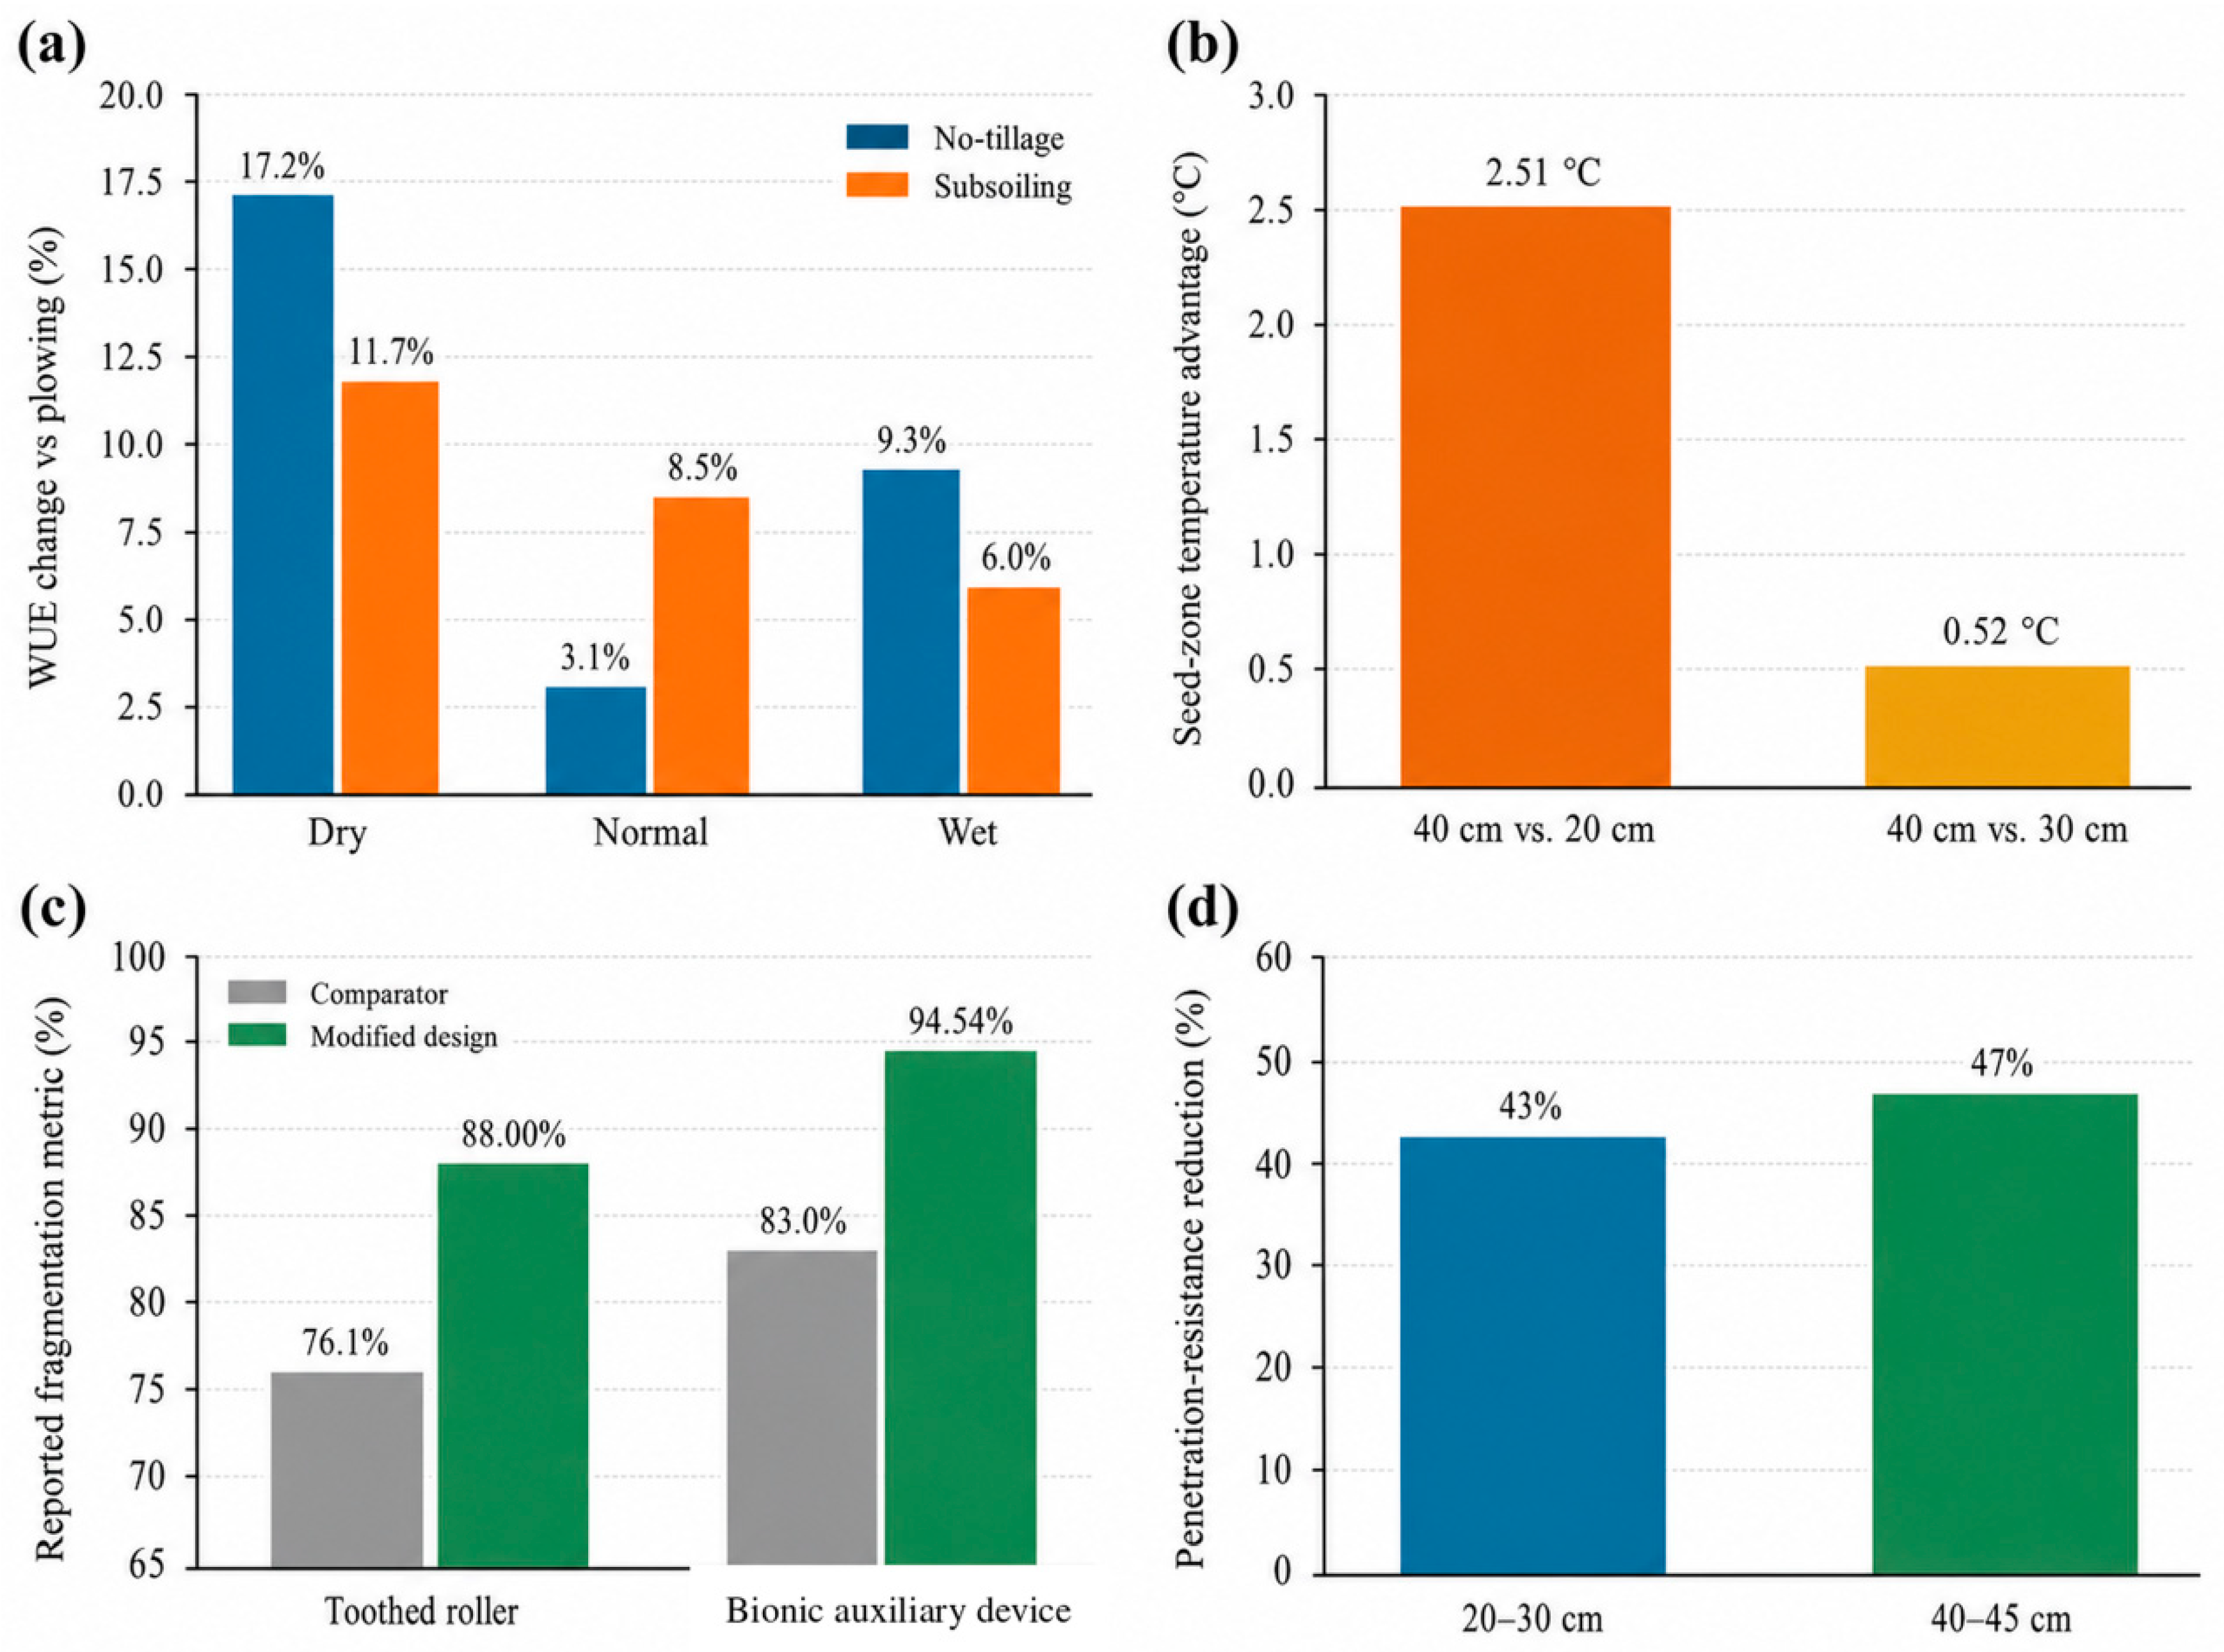
The comparison procedure was applied in three steps. First, the original outcome and denominator were retained: an aggregate fraction, a penetration-resistance profile, and a control-stability coefficient were treated as different constructs. Second, the contrast was assigned to its validation scale—component, row unit, complete machine, or crop system. Third, the boundary vector was checked for a plausible mechanism of transfer. For example, the 11.54-percentage-point increase in the study-defined fragmentation index [30] and the 11.9-percentage-point increase in the <50-mm aggregate fraction [31] are numerically similar but are not equivalent effects because the indices, tools, soil conditions, and baselines differ. The framework therefore uses them to test whether secondary bodies can improve immediate conditioning, not to rank the two designs. The same rule separates a 43–47% resistance reduction [32] from a rainfall-dependent WUE response [12]: the former verifies an immediate soil profile, whereas the latter is a multi-year system outcome. This scale-aware comparison is the principal methodological safeguard used throughout the review.
3. Functional Terminology and Boundaries of Intelligent Seedbed Preparation
Localized tillage, strip tillage, zone tillage, deep loosening, layered tillage, and conservation tillage describe different spatial or management concepts. Strip tillage forms continuous cultivated bands; localized tillage also includes discrete or site-specific interventions; deep loosening targets a restrictive horizon; and layered systems assign separate functions to upper and lower components. None of these terms alone specifies component geometry or control logic.
Seedbed preparation is defined here by function: residue management, formation of a sowable upper layer, controlled near-seed firmness, and—only when diagnosed—creation of a deeper root corridor. An optimized fixed component remains conventional. A sensed but unchanged operation is monitored. An intelligent or closed-loop system must use measured or inferred state to modify a controllable parameter and must verify the resulting soil condition.
Table 2 establishes these functional boundaries. Figure 2 illustrates three mechanically distinct sequences [30,31,32]. Their reported responses cannot be compared by machine label alone because each sequence produces a different soil flow, exposes different variables to control, and has a different validation boundary.
4. Soil–Tool Interaction as the Mechanical Basis of Intelligent Design
4.1. Soil failure, Soil Flow, and the Failure Zone
A passive soil-engaging component produces compression, shear, tensile cracking, lifting, displacement, and frictional sliding. Their balance depends on geometry, depth, speed, texture, strength, water content, and residue condition [33,34,35,36,37]. Tool width alone is therefore an inadequate descriptor: rake angle, edge shape, shank thickness, wing geometry, and soil state determine both force and the failure-zone profile.
For localized preparation, the three-dimensional failure zone is more informative than visible surface width. A narrow chisel can create a deep corridor with little surface movement, whereas a sweep creates broad shallow disturbance and a winged point extends fracture laterally at depth. The relevant response is whether the intended
seed or root volume is continuous, not whether the surface appears uniformly cultivated.
Adjacent components must be spaced so that rupture zones meet without excessive overlap. The appropriate spacing changes with depth, moisture, strength, and point geometry; it cannot be transferred as a fixed multiple of tool width. Figure 3 shows the conceptual cases. Draft power, specific draft, loosening efficiency, and overlap relationships are retained in Supplementary Table S7 because they are standard or conceptual indicators rather than analytical results used later in the main synthesis.
4.2. Geometry and Force Components
Rake and point angles, edge radius, shank curvature, thickness, wing width, and surface roughness alter horizontal and vertical force components [18,38,39,40,41,42]. Sharper edges concentrate stress and facilitate penetration; larger rake or contact area can increase lifting and lateral fracture, but also draft and heave. A geometry should therefore be judged against its intended mechanism—shallow undercutting, deep fracture, residue-compatible penetration, or seed-zone conditioning—rather than against one minimum-force criterion.
The same geometry can be favorable for one function and unsuitable for another. A narrow shank may be preferred where deep fracture and limited surface exposure are required; a sweep where broad shallow coverage is needed; and a winged point where the restrictive horizon must be opened laterally. Component selection must therefore occur at the target-zone and row-unit scales.
Wear is a time-dependent change in geometry. Abrasion increases edge radius, changes rake and point dimensions, shifts force distribution, and can cause depth loss or compaction ahead of the tool [43]. Wear-resistant coatings or harder surface layers may slow this drift, while bionic drag-reduction forms can redistribute contact [30,43], but neither approach guarantees durability across abrasive soils. Long-term control studies should report material, initial and worn profiles, accumulated area or operating hours, draft-baseline drift, replacement thresholds, and recalibration after part replacement.
For intelligent operation, the controller should not assume that nominal CAD geometry remains constant. A persistent rise in draft at unchanged depth, speed, moisture, and residue condition can be treated as a wear or blockage diagnostic, but the causes must be separated by inspection or additional sensing. Surface engineering is therefore part of control stability: it extends the interval over which the mechanical plant represented in the controller remains valid.
The literature also exposes a methodological gap between short-term surface engineering and machine control. Coating studies usually compare mass loss, hardness, or edge retention, whereas optimization studies report draft or fragmentation, and controller studies assume fixed component geometry. These datasets cannot yet demonstrate that a particular coating preserves closed-loop accuracy over a season. A suitable experiment would pair periodic edge-profile scans with depth, draft, slip, fuel use, failure-zone geometry, and controller effort at matched soil states. The comparison should include an uncoated reference and should report whether a protected edge merely lasts longer or also maintains the force-direction and fracture pattern used in the control model. Bionic forms require the same test. A shape that reduces drag when new may trap abrasive particles or become sensitive to localized wear; conversely, a modest initial force advantage may be valuable if the shape degrades predictably. Durability should therefore be evaluated as response drift and maintenance interval, not as material hardness alone.
4.3. Depth, Speed, and Soil Condition
Working depth is justified only when it reaches a diagnosed restrictive horizon and remains within the tractor-implement operating envelope. Classical and field studies show that working above the constraint leaves it untreated, whereas unnecessary depth increases engaged volume, draft, slip, and the risk of unstable operation [12,19,44,45,46,47].
Forward speed changes deformation rate, soil throw, fragmentation, power demand, and depth stability. Its effect is tool- and soil-specific, so speed should be reported with actual depth, water content, force, and residue load rather than interpreted as an independent optimum.
Water content determines whether soil fractures, flows plastically, smears, adheres, or demands excessive draft. Texture modifies this response: two soils with similar bulk density may differ markedly in cohesion, aggregation, friction, and pore continuity. Table 3 therefore treats geometry, depth, speed, spacing, sequence, and roller load as interacting variables.
4.4. Critical Depth, Fracture Direction, and the Risk of Re-Compaction
Critical depth marks a change from surface-reaching fracture to more confined failure, but its position depends on soil state and tool geometry [18,19,20,33,34,35,36,37,38,39,40]. Increasing depth beyond this transition can raise force sharply without widening the useful root corridor. Deep operation is justified only when the point or wing disrupts the diagnosed horizon and the tractor maintains depth without excessive slip.
Vertical force direction is equally important. Strong lifting may bury residue and expose moist soil; a blunt or overloaded point in wet soil can smear or create a secondary compacted boundary below the loosened zone. Draft alone cannot reveal that failure. Verification should include the upper seed layer, the target horizon, and soil immediately below working depth.
The preferred geometry is therefore not the one producing the largest disturbed area, but the one that achieves continuous fracture at the functional depth without creating an adverse surface or sub-tool boundary. This criterion is especially important for winged tools, whose lateral reach and downward stress component are strongly soil-dependent.
4.5. Residue Flow, Surface Configuration, and Strip Continuity
Residue flow, fore-aft arrangement, and strip continuity form one coupled design problem. Disc diameter, edge condition, angle, depth, spacing to the shank, and speed determine whether residue is cut, hairpinned, displaced, or accumulated. A front element placed too close can feed loose material into the shank; excessive spacing can allow residue to re-enter or the strip to collapse [1,3,6,10,15,48,49,50,51,52].
Continuity must be checked laterally and along travel. One acceptable cross-section can conceal intermittent shallow zones caused by blockage, depth loss, wheel slip, or unstable rolling. Repeated profiles, continuous depth/load records, residue-cover measurements, and seed-zone observations are therefore more informative than a single test pit.
The final roller or closing element must create sufficient seed-soil contact without sealing wet soil or eliminating useful microrelief. The acceptable surface depends on rainfall intensity, irrigation method, slope, and seeding tolerance; it is not a universal minimum-roughness target.
5. Soil-Engaging Component Families and Their Roles in Planting Machinery
5.1. Cutting Discs, Coulters, and Residue-Management Elements
Cutting discs, coulters, and residue managers define the surface path for following components. Diameter, concavity, edge profile, angle, depth, residue load, moisture, and speed control penetration and hairpinning. Paired-disc and integrated-machine studies support geometry effects on opening and strip stability [48,49,50], but do not support an inference of deep compaction relief. Residue retention remains a system constraint rather than a disc-only outcome [51,52].
5.2. Tines, Chisels, and Subsoiler Shanks
Tines, chisels, and subsoiler shanks create localized deep fracture [18,19,20,21,22,23,24,33,34,35,36,37,38,39,40]. Straight shanks tend to produce a narrow corridor; curved forms alter lifting and soil flow; chisel points concentrate penetration; and wings widen fracture at depth while increasing draft and heave risk. The correct comparison is the measured profile at the restrictive horizon, not surface furrow width.
Wing width and lateral spacing must be selected jointly. A narrow wing can leave an incomplete root corridor, whereas an oversized wing can exceed traction capacity or lift excessive soil. The optimum therefore belongs to the tested soil strength, water state, depth, speed, and complete row-unit arrangement.
5.3. Sweeps, Flat Blades, and Layered Elements
Sweeps and flat blades provide broad shallow undercutting, whereas layered arrangements combine upper conditioning with a lower chisel. Their central limitation is interaction: the upper body can overload or destabilize flow toward the lower body. Geometry-draft studies [53,54] and combined-unit studies [55,56,57] define candidate ranges, not transferable fixed settings.
5.4. Rotary Elements, Rollers, and Closing Devices
Rotary elements increase fragmentation and material transport but require additional power and can over-fragment dry soil [58,59,60,61,62]. Rollers and closing devices regulate clod size, microrelief, and near-seed firmness; their benefit reverses when load is applied to wet soil and pores are reconsolidated [31,50,63]. Table 4 summarizes these functional differences.
5.5. Integration of Soil-Engaging Components Within a Row Unit
The row unit must be evaluated as a sequence of coupled soil and residue flows. A disc changes the shank input, the shank changes fertilizer-placement stability, and both determine whether the roller fragments or compacts. Longitudinal spacing and component offsets should be tested at representative speed and residue load [57,64,65,66].
Guidance and traffic are part of this system boundary. A correctly loosened corridor can be rapidly recompacted when wheel tracks cross it; controlled traffic and permanent-row alignment can preserve the response. Reports should therefore include component sequence, lateral offsets, fore-aft distances, row geometry, and traffic position.
6. From Component Response to Seedbed Quality, Water Function, and Crop Establishment
6.1. Soil Strength, Density, and Pore Continuity
Localized response must be resolved by depth and lateral position. Compaction and soil-quality evidence [46,67,68,69,70] and long-term row/inter-row measurements [71,72] show that field means can conceal an improved crop strip, an untreated inter-row, or a secondary restrictive boundary. The target is not minimum bulk density, but a continuous root corridor with adequate pore function and near-seed contact [73,74,75,76].
6.2. Infiltration, Water Storage, and Evaporation
In water-limited systems, localized fracture may improve infiltration and root access, while inter-row residue limits evaporation and runoff. Strip width changes both functions. The controlled width study [10] reported greater warming but lower disturbed-row water content as width increased, and longer-term studies show that deep loosening is valuable mainly where water access or mechanical impedance is limiting [11,12,13,72,77,78].
Water-use efficiency remains a system outcome: it can change through yield, crop water use, stored water, or their combination. Its standard relationship and interpretation limits have therefore been moved with the other basic indicators to Supplementary Table S7.
6.3. Rooting, Establishment, and Yield Response
Crop response is a property of the soil-machine-climate-management system, not of the implement alone. A two-season maize study found slightly faster emergence but no consistent yield, stored-water, or WUE advantage [4]; width studies linked establishment to strip condition [5,10]; and long-term studies found larger benefits when deep water access or impedance was limiting [12,13,78]. A soybean field study in the eastern forest-steppe reported 0.4–1.3% higher soil moisture before spring operations and a yield increase of 0.03–0.07 t ha−1 under local loosening relative to mouldboard plowing, but the low absolute yield and regional conditions restrict direct transfer [79].
Transferable evidence therefore requires a connected response chain: geometry and operating state, force and disturbed profile, physical and hydraulic condition, roots or emergence, and yield. Table 5 retains six representative within-study anchors; the complete nine-study table and all transferability limits are provided in Supplementary Table S9.
The selected anchors demonstrate why normalization must remain within study. Percentage-point changes, relative changes, temperature differences, force values, and author-defined indices have different denominators and cannot be aggregated. Precision such as a 40.66-mm optimum belongs to its tested design space; a mechanical improvement does not establish persistence or crop benefit; and control stability does not by itself verify water function. Figure 4 preserves these distinctions graphically.
Figure 4.
Study-specific quantitative anchors for design trade-offs: (a) WUE change of no-tillage and subsoiling relative to plowing across rainfall classes [12]; (b) seed-zone temperature advantage of a 40-cm strip over 20- and 30-cm strips [10]; (c) fragmentation metrics before and after toothed-roller [31] and bionic-auxiliary-device [30] modifications; and (d) penetration-resistance reduction at two depths after geometry-optimized vineyard loosening [32]. Panel (c) juxtaposes two author-defined fragmentation metrics; panels and studies are not normalized effect sizes and should not be interpreted as a pooled estimate.
Figure 4.
Study-specific quantitative anchors for design trade-offs: (a) WUE change of no-tillage and subsoiling relative to plowing across rainfall classes [12]; (b) seed-zone temperature advantage of a 40-cm strip over 20- and 30-cm strips [10]; (c) fragmentation metrics before and after toothed-roller [31] and bionic-auxiliary-device [30] modifications; and (d) penetration-resistance reduction at two depths after geometry-optimized vineyard loosening [32]. Panel (c) juxtaposes two author-defined fragmentation metrics; panels and studies are not normalized effect sizes and should not be interpreted as a pooled estimate.
6.4. Aggregate Condition, Surface Roughness, and Planting-Zone Quality
Aggregate distribution and surface roughness are functional only within a soil-water and crop context. Large clods can impair placement, but excessive fines can seal, crust, erode, or evaporate rapidly; some roughness can store water, whereas too much destabilizes seeding and irrigation. A universally finer or smoother surface is therefore not an adequate objective.
Roller load, sweep geometry, and operation timing must be interpreted with soil water content. The same setting can fragment dry brittle soil and compact wet plastic soil. Reports that omit moisture and the aggregate-size definition provide limited guidance for component control.
6.5. Why Field Responses Differ Among Soils and Climates
Divergent field responses often reflect different limiting processes. Cool humid systems may benefit from warming; hot semi-arid systems may prioritize residue retention and reduced exposure; irrigated systems require alignment between the loosened corridor and the wetting pattern. These are distinct engineering objectives even when the same tillage label is used.
Generalization must explicitly distinguish soil groups. Coarse-textured sandy soils generally have low cohesion but can be abrasive and prone to rapid collapse or weak residue anchoring; cohesive clay soils are strongly moisture-sensitive and may smear, adhere, or block components when worked wet; saline-alkali soils can combine dry hardness, crusting, dispersion, and restricted infiltration. The reviewed evidence does not justify one geometry across these classes. Transfer requires new calibration of moisture window, depth, spacing, edge condition, draft, and post-pass hydraulic response [13,20,25,43,72].
The consistent cross-soil conclusion is procedural: diagnose the constraint and soil state, define the target zone, select a candidate geometry, and validate the profile and function locally. The complete design-feature pathway matrix has been moved to Supplementary Table S10.
Cross-soil transfer also depends on which failure mechanism dominates. In coarse soil, increasing wing width may enlarge the disturbed profile but can accelerate surface drying and expose loose particles; in cohesive soil, the same width can raise draft and heave, and near the plastic limit it may smear rather than crack. In saline-alkali profiles, a reduction in mechanical resistance may coexist with poor aggregate stability or restricted infiltration, so a visually open corridor is not sufficient evidence of improved water function. These contrasts explain why a geometry optimized against one mechanical response can fail when the controlling constraint changes. They also define different sensor priorities: wear and depth stability may dominate in abrasive sandy soil; water-state and blockage detection in clay; and combined resistance, moisture, and post-pass infiltration verification in saline-alkali soil. The available literature contains useful examples within these classes but not a balanced factorial comparison across them. Generalization should therefore be expressed as a hypothesis about mechanism and an operating envelope to be re-estimated, rather than as a universal ranking of components.
Two levels of transfer should therefore be separated. Mechanistic transfer is defensible when the dominant failure mode is the same, whereas numerical transfer of working depth, point or wing width, spacing, controller gain, or draft threshold is not. Before a conclusion is extended to a new texture class, the operating envelope should be re-estimated in at least two relevant water states and checked against achieved depth, draft, disturbed-profile continuity, residue retention, and post-pass infiltration. This requirement is especially important for intermediate textures, where clay content, aggregate stability, and water status may shift the governing response among brittle fracture, plastic flow, adhesion, and collapse.
6.6. Timing, Operation Windows, and Temporal Design
Timing changes moisture, residue condition, expected reconsolidation, and evaporative exposure. A geometry can produce brittle fracture within one operating window, plastic deformation when too wet, and excessive draft when too dry. Specifications should therefore include measurable moisture or strength limits rather than depth and speed alone.
Temporal durability should be separated into immediate mechanical response, condition at planting, in-season root-zone function, and post-harvest state. This distinction is necessary when strips are prepared months before sowing or exposed to irrigation, rainfall, wind, and traffic.
6.7. Measurements that Make Soil-Water and Crop Claims Transferable
Transferable soil-water claims require spatially explicit measurements at the crop row, strip edge, inter-row, target horizon, and soil below working depth [46,67,68,69,70,71,72]. Hydraulic measurements must be tied to position, date, rainfall or irrigation, and the actual wetting geometry; otherwise, a short-term infiltration change can be misrepresented as a seasonal water benefit.
Root density, rooting depth, emergence uniformity, and yield complete the causal chain but cannot identify the mechanism alone. Laboratory, model, and field evidence should therefore be linked through common geometry, soil-state, and outcome definitions rather than through nominal machine categories.
A minimum transferable field dataset should contain four linked blocks. The machine block records actual geometry, wear, depth, speed, draft, slip, residue load, and actuator or adjustment state. The soil block resolves the disturbed cross-section and penetration or density above, within, and below the target horizon. The water block reports initial state, rainfall or irrigation, spatial water content or storage, and infiltration where relevant. The crop block records emergence, roots, and yield with the same row positions and management boundaries. This structure is deliberately smaller than an indiscriminate list of variables: each block tests one transition in the causal chain. Missing an upstream block weakens attribution. A yield response without the achieved profile cannot validate geometry; a profile without post-pass water or root measurements cannot validate functional persistence; and stable control without soil verification cannot validate intelligent preparation.
7. Experimental, Numerical, and Sensing Methods for Design Optimization
7.1. Field and Soil-Bin Experiments
Field trials provide direct system evidence under heterogeneous soil, residue, traffic, and weather, whereas soil bins isolate geometry effects under controlled states. The former should report actual depth, draft or power, disturbed profile, residue, soil condition, and—where claimed—water and crop response; the latter should be used for screening rather than as a substitute for field persistence.
Long-term validation is essential because rainfall, irrigation, settling, traffic, and biological activity can alter the initial profile. A useful field design therefore nests component comparison within repeated spatial and temporal measurements.
7.2. Analytical Models and Finite Element Modeling
Analytical models rapidly expose relationships among geometry, force, and idealized failure zones, while FEM resolves continuum stress and strain around a tool [18,20,21,33,34,35,36,37,38,39,40,41,42]. Both depend on constitutive assumptions and boundary conditions and should define candidate ranges rather than field prescriptions.
7.3. Discrete Element Modeling
DEM is valuable where particle flow, contact, furrow geometry, and interaction among components dominate [25,26,27,28,80,81,82,83,84,85,86]. Its predictions depend on particle representation, cohesion, friction, stiffness, damping, adhesion, and boundaries; calibration to force does not automatically validate disturbed area, aggregation, residue flow, or hydraulic response.
A numerical comparison is strongest when its calibration target matches the later inference and when at least one independent force or profile measurement is used for validation. Table 7 positions each method in the design sequence, and Figure 5 shows that direct geometry-to-draft evidence is substantially stronger than direct geometry-to-water or crop evidence.
The cell-level coding behind Figure 5 is reported in Supplementary Tables S5, S5A, and S5B. The map describes evidential directness, not effect magnitude, direction, or study quality.
7.4. Calibration, Validation, Reporting, and Uncertainty
Calibration links numerical and physical evidence. Model parameters, soil state, boundary conditions, and calibration targets must be reported, and uncertainty should be examined over the range used for design selection. A force-calibrated model is predictive only for the response and domain actually validated [25,26,27,28,80,81,82,83,84,85,86].
Reproducible studies should report complete point, shank, wing, disc, or roller geometry; wear state; depth and speed; soil texture, water content, density or strength; residue and traffic; force or energy method; and the definition of disturbed area or aggregate response. Crop claims additionally require timing, irrigation, and the complete machine sequence.
Validation should progress from analytical or numerical screening, to controlled physical comparison, to the complete row unit, and finally to multi-season field function. Disagreement among scales should be used diagnostically: it often reveals an unrepresented moisture state, structural heterogeneity, residue interaction, or component interference.
Cross-scale disagreement should be reported quantitatively whenever possible. If a DEM model predicts a broader failure zone than the field profile, the comparison should examine whether calibration emphasized draft, whether real aggregates and roots changed particle flow, and whether moisture or boundary confinement differed. If an isolated shank performs well but the complete row unit does not, the likely causes include residue inflow, soil thrown by the disc, inadequate settling distance, roller reconsolidation, or loss of depth under total draft. These are not reasons to discard modeling or controlled tests. They specify the next experiment and prevent compensation errors, such as retuning a controller to overcome a mechanically incompatible sequence. Uncertainty analysis should therefore extend beyond parameter sensitivity within one model; it should trace which conclusion survives the transition from virtual body to physical component, integrated machine, and field function.
8. Mechatronic-Hydraulic Control Architecture
Variable-depth tillage provides the clearest bridge from fixed optimization to condition-responsive operation. Pre-pass diagnosis should define a permissible depth envelope, while on-the-go sensing maintains the component within soil, traction, and power constraints [87,88]. The controlled variable must remain tied to a target soil zone rather than to maximum depth.
Depth measurement and state estimation must be separated from the controller that acts on them. Real-time depth-load measurement, independently actuated shovels, attitude-corrected estimation, and machine-learning verification demonstrate feasible building blocks [89,90,91,92], but each remains conditional on calibration, mounting geometry, terrain, speed, and representative training data.
Sensor noise and hysteresis are operational constraints, not minor signal-processing details. High-frequency capacitive, spectral, draft, and position signals can drift with moisture, vibration, temperature, residue impact, and changing contact. Computational-intelligence methods can model nonlinear relations [93], but robust deployment requires synchronized sampling, physical range checks, outlier rejection, speed-aware filtering, sensor fusion, and uncertainty flags. A filtered value should trigger adjustment only when it remains outside a defined hysteresis band long enough to exclude transient impact.
Actuator dynamics create a second delay. Hydraulic deadband, compressibility, valve response, linkage compliance, and electric-actuator rate can cause the commanded depth to be reached after the tool has passed the diagnosed zone. Disturbance-aware control and multi-sensor depth estimation [94,95] should therefore be designed around an explicit latency budget: sensing, computation, command, actuator response, and soil-tool settling. Feed-forward from travel speed and terrain, rate limits, anti-windup logic, and post-command verification reduce overshoot and hunting.
Reliability in hard, stony, saline, or residue-dense fields requires protected sensor mounting, sealed connections, hydraulic pressure relief, overload release, anti-jamming or disengagement logic, manual override, and a degraded fixed-depth mode. Soil-compaction sensors measure different properties and require soil-state calibration [96,97]; row-wise terrain control further requires independent actuation and protection across the machine width [98]. Maintenance burden, diagnostic access, and safe recovery after blockage should be measured alongside control accuracy.
A defensible architecture is hierarchical. A supervisory layer sets the target from mapped or inferred constraint; the primary loop maintains depth, alignment, draft, and actuator limits; an exception layer reduces depth, disengages, or stops under overload, blockage, excessive wetness, or sensor disagreement; and a post-pass layer verifies strip continuity, residue cover, aggregate condition, and the root corridor. Stable depth alone is insufficient evidence of intelligent seedbed preparation.
Digital twins, computer vision, machine learning, autonomous traction, and AI-assisted multi-objective optimization can extend this architecture, but their engineering value depends on validation against the evolving physical machine. A digital twin should update soil and wear parameters from field data rather than replay a fixed DEM model; computer vision should quantify residue or strip geometry with uncertainty; and learned controllers should remain inside mechanical and agronomic safety envelopes [25,26,27,28,93,94,95]. These technologies are therefore research priorities, not evidence that current prototypes have achieved autonomous, transferable optimization.
Commissioning should separate sensor, actuator, and soil-response errors. Static checks establish sensor zero, range, alignment, and row-to-row consistency. Low-speed passes then identify vibration sensitivity, hydraulic deadband, and the relation between commanded and actual depth. Dynamic passes at representative speed estimate total latency and determine whether filtering suppresses impacts without concealing a real restrictive layer. Finally, excavated profiles or independent post-pass sensing test whether the commanded change altered the intended soil zone. This staged procedure matters because similar symptoms can have different causes: oscillating depth may originate in noisy elevation sensing, aggressive controller gain, valve delay, or changing tool penetration caused by wear. Retuning without diagnosis can improve the depth trace while worsening soil disturbance.
The control objective should also distinguish constraint handling from performance optimization. Overload relief, anti-jam disengagement, and wet-soil lockout protect the machine and soil and should override productivity targets. Within the safe envelope, the controller can minimize depth error, draft variability, exposure, or energy subject to a minimum verified corridor. Above that layer, an optimizer may select depth or width according to mapped constraint and water risk. This hierarchy prevents an AI or model-predictive controller from trading away an agronomic requirement merely because a mechanical metric improves. It also creates an auditable record of why the system changed a setting, which threshold was active, and whether verification confirmed the intended response.
9. Integrated Design Framework for Water-Limited Seedbed Preparation
Design begins with the limiting constraint: residue blockage, crusting, an unstable seed layer, a restrictive horizon, poor infiltration, excessive exposure, or insufficient tractor capacity. The specification should include texture, water content, strength profile, residue load, row and traffic geometry, irrigation wetting pattern, guidance accuracy, available power, and the permissible operation window.
The constraint is translated into a three-dimensional target zone and acceptance thresholds. Each required function—residue cutting, shallow tilth, deep fracture, lateral widening, clod reduction, or controlled firming—is assigned to a component, and the sequence is checked for compatible soil and residue flow.
Candidate geometries are screened analytically or numerically, tested physically, and expressed as an operating range rather than a nominal optimum. Sensing is added only where it changes a decision; post-pass measurement verifies whether the accepted strip satisfies mechanical, water, and implementation criteria.
Figure 6 summarizes the diagnosis-to-verification workflow. Table 8 translates it into explicit soil and field scenarios, including the soil-texture distinctions that limit generalization.
9.1. Establishing the Target Disturbance Geometry
The target geometry specifies depth, width, lateral and longitudinal continuity, and acceptable surface expression. It should be defined before selecting the point, wing, or shank and should align with the seed line, active root corridor, and wetting zone. Nominal tool width and available tractor power are insufficient substitutes for a measured failure profile.
Analytical or numerical screening can narrow the point, wing, and spacing range, but soil-bin or field profiles must confirm the realized zone. This cross-scale step prevents a model optimum from being treated as a field-ready design.
9.2. Multi-Criterion Optimization Under Power Constraints
Optimization must include traction, power, slip, field capacity, depth stability, residue retention, surface condition, water indicators, durability, and manufacturing complexity. A narrower body operated consistently can outperform an aggressive high-draft body that loses depth or disrupts excessive soil.
Weights and acceptance thresholds should be stated for the intended system. Hot dryland conditions may prioritize cover and low exposure; cool spring systems may prioritize warming; abrasive soils may elevate wear life; and limited-power farms may impose a strict draft ceiling.
9.3. Soil- and Scenario-Specific Configuration
In high-residue rainfed fields with a confirmed pan, a front disc, residue manager, narrow deep shank, and light closer can be appropriate when residue flow and deep continuity are verified. Without a deep constraint, the shank adds energy and exposure without a demonstrated function.
Soil texture changes the configuration. Sandy soils favor limited disturbance and wear monitoring; wet cohesive clays require a strict moisture threshold and anti-blockage capacity; saline-alkali soils require hydraulic and salinity verification in addition to mechanical loosening. In irrigated perennial rows, lateral fracture should coincide with the active root and wetted volumes [13,32,99].
Where shallow seedbed quality is the principal limitation, a disc or sweep-based sequence may be preferable to subsoiling. Under limited power, point width or wing size should be reduced and continuity achieved through verified spacing rather than assumed broad fracture.
Across scenarios, row guidance and controlled traffic are necessary to protect the prepared corridor. The machine, tractor tracks, crop row, and irrigation geometry should therefore be designed as one spatial system.
9.4. Matching the Treated Zone with Row, Traffic, and Irrigation Geometry
The deepest fracture should coincide with the intended root corridor rather than a future wheel track [41,46,47]. Row spacing, tire width, guidance error, and lateral tool reach should be reported together; otherwise, recompaction risk cannot be evaluated.
The loosened zone must also intersect the irrigation wetting pattern. Drip and sprinkler systems create different three-dimensional water distributions, and deeper fracture can either improve root access or increase percolation when application is not controlled.
A practical specification should therefore show the crop row, wheel-track zone, shallow strip, deeper disturbed corridor, and expected water-entry region. This spatial description provides a common validation target for implement designers and agronomists.
Scenario transfer should be tested through boundary perturbation rather than a single optimum trial. For each candidate configuration, at least two relevant moisture states, a realistic speed range, and the expected residue or stone load should be tested; wear should be introduced either through accumulated operation or measured edge-radius classes. The result should be an acceptance region in which depth, draft, continuity, residue flow, and surface condition remain within limits. Such a region is more useful for controller design than a response-surface maximum because it defines when adaptation is sufficient and when the machine should change tool configuration or postpone work. In resource-limited settings, this approach also supports simpler machines: if a passive geometry remains robust across the diagnosed envelope, added sensing or actuation may provide little marginal value.
10. Critical Synthesis: Mechanical Optima, Adaptive Decisions, and Field Trade-Offs
The central trade-off is sufficient functional disturbance versus unnecessary draft, exposure, residue loss, and reconsolidation. Deep loosening is defensible where a measured restrictive layer limits roots or water access [12,13,44,45,75], but its benefit can disappear after traffic or wet operation. Wider strips can improve warming in cool conditions and accelerate water loss in hot conditions. These conflicts are not resolved by maximizing disturbed area.
Numerical optimization introduces a second scale conflict. FEM and DEM can rank candidate geometries inside calibrated domains, but crop response emerges from the integrated row unit, soil profile, residue, water regime, and season. The preferred design is therefore a bounded operating region supported across methods, not a single mathematical optimum.
10.1. Interpreting Apparently Conflicting Studies
Apparently conflicting studies often address different levels: management-system comparisons, isolated component tests, immediate soil profiles, or seasonal crop outcomes. Conditional statements are the transferable result. A wing can increase lateral fracture only within a stated soil-depth-moisture-spacing domain; residue retention is beneficial only while placement and blockage remain acceptable; and immediate loosening is meaningful only if the response persists [100,101,102,103,104,105,106,107,108,109,110,111,112,113,114].
10.2. Design Metrics That Should Not Be Used in Isolation
Draft, disturbed area, bulk density, aggregate fraction, fuel use, and yield should not be used alone. Low draft may indicate ineffective depth; large disturbance may be shallow or discontinuous; a favorable mean density can hide a compacted boundary; and yield cannot identify the mechanism. Evaluation should combine functional-zone continuity, mechanical cost, soil physical and hydraulic response, and crop evidence.
10.3. Operational Durability and Deployment Risk
Deployment risk includes abrasion, stones, dense residue, sensor damage, actuator overload, blockage, narrow moisture windows, and limited maintenance capacity. Wear changes the geometry assumed by the controller; blockage and stones create transient loads that can be misclassified as compaction; and a failed actuator can leave rows at different depths. At machine level, gear wear and surface hardening alter the stress state and permissible wear of tractor transmission gears [115]; this drivetrain condition should therefore be separated from soil-tool wear when load-based diagnostics are interpreted. Reliability trials should report service intervals, edge loss, sensor faults, overload events, manual recovery, and performance in degraded mode.
Long-term control stability should be assessed against this changing mechanical plant, not against controller error alone. Edge rounding or loss of point or wing material can alter penetration and fracture width while a depth or draft signal remains apparently stable. A practical protocol should combine accumulated area or operating hours with measured edge radius or profile loss, normalized drift in draft, slip, and actuator effort, and periodic verification of the disturbed cross-section. Recalibration or component replacement should be triggered when this joint response leaves the validated operating envelope. No universal threshold can yet be proposed because wear rate and its functional effect depend on soil mineralogy, stone content, moisture, tool material and coating, and load history [43].
Serviceability and system fit are therefore part of technical optimization. Protective mounting, replaceable wear parts, pressure relief, anti-jamming mechanisms, manual override, accessible diagnostics, and compatibility with row spacing, guidance, traffic, and irrigation should be evaluated with peak performance.
10.4. Robustness Criteria for Design Decisions
A robust configuration maintains target depth, acceptable draft, stable residue flow, and continuous fracture across a defined envelope of water content, strength, residue load, speed, and wear. Sensitivity outside that envelope should trigger adjustment, degraded operation, or postponement rather than forced adherence to one prescription.
Decision thresholds should be explicit: maximum draft and slip, permissible depth error, minimum corridor continuity and residue retention, acceptable sensor disagreement, actuator response time, and post-pass soil criteria. These thresholds make multi-objective selection auditable.
10.5. Reporting and Evidential Robustness
Geometry reporting should include drawings, actual working depth, point and wing dimensions, lateral and fore-aft spacing, edge wear, soil state, and operating regime [18,19,20,21,22,23,24,30,31,32,43,48,49,50]. A nominal label such as subsoiler or strip-till unit is not reproducible engineering information.
Inference strength must match validation scale. Numerical studies rank alternatives within calibration; controlled tests establish mechanical tendencies; field experiments establish system response for their soil and season; and only repeated, multi-season studies can support persistence. This boundary is part of the result, not a generic limitation.
The synthesis also indicates how evidence quality should be reported. A quantitative result is most useful when the paper states what changed, relative to which baseline, under which soil and machine boundary, at what spatial and temporal scale, and with what uncertainty. Very precise optimized dimensions should be accompanied by the factor range, experimental resolution, prediction interval, and a sensitivity test showing whether nearby settings perform materially differently. Without that information, decimal precision can overstate engineering certainty. Conversely, a neutral crop response should not be read as evidence that the mechanical operation had no effect if the study lacked power, the limiting constraint was absent, or the achieved profile was not measured. Critical synthesis requires distinguishing absence of evidence, evidence of no practically relevant effect, and evidence that a mechanism operated but did not propagate to yield.
11. Research Priorities for Next-Generation Intelligent Seedbed-Preparation Machinery
11.1. Cross-Scale Validation, System Integration, and Emerging Technologies
The first priority is a complete response chain within the same experiment: geometry, soil state, force, disturbed profile, residue flow, planting-zone quality, water response, roots, and yield. Spatial sampling must distinguish row, strip edge, inter-row, target horizon, and below-tool soil, while temporal sampling must test persistence after rainfall, irrigation, and traffic [101,102,103,104,105,106,107,108,109,110,111,112,113,114].
The second priority is uncertainty-aware model-supported co-design. Analytical, FEM, DEM, and data-driven models should share calibration targets with physical tests, propagate soil and parameter uncertainty, and be revalidated after component integration [116,117,118,119]. Digital twins should update from field measurements and wear state rather than assume an invariant tool-soil model.
The third priority is whole-machine testing at realistic speed, residue load, terrain, and power. Front discs, shanks, fertilizer outlets, rollers, sensors, and actuators interfere mechanically and hydraulically; optima obtained for isolated components must be re-tested after integration [120,121,122,123,124,125,126].
The fourth priority is multi-season deployment research that combines mechanical performance with sensor robustness, actuator latency, surface engineering, serviceability, salinity, irrigation, traffic, and crop rotation. Conservation and system evidence [127,128,129,130,131,132,133] indicates that these factors determine whether immediate loosening becomes a durable agronomic function. Computer vision, autonomous machinery, machine learning, and AI-assisted optimization should be judged by this same causal and safety standard.
A useful next-generation trial would compare three levels under the same field boundary: a fixed geometry at a recommended setting, a sensor-monitored but manually adjusted system, and a closed-loop system using the same mechanical body. This design would isolate the marginal value of sensing and control from the value of the component itself. It should report not only mean depth or draft, but sensor faults, latency, controller activity, overload interventions, strip-profile conformity, water response, and seasonal persistence. A parallel wear treatment would show whether adaptation compensates for gradual edge change or simply masks deteriorating soil action. Such experiments are necessary before digital twins or autonomous optimization can be claimed to improve agronomic function rather than operational consistency alone.
Figure 7 shows the resulting evidence imbalance. Direct support is strongest for draft and disturbed-zone outcomes, whereas no component family has a complete direct geometry-to-water or geometry-to-crop chain. The counts identify missing causal links rather than rank machines or effect sizes.
12. Conclusions
The reviewed evidence supports a diagnosis-first design rule rather than one universal component, strip width, or depth. The field constraint and soil boundary must be defined first; the target three-dimensional zone and acceptance thresholds must follow; and component geometry, sequence, and controllable settings must then be selected within tractor-power, residue, wear, and water constraints.
Quantitative findings remain study-specific. The reported 43–47% resistance reduction [32], 83.0% to 94.54% fragmentation-index change [30], 76.1% to 88.0% <50-mm aggregate change [31], warming-water trade-off [10], and rainfall-dependent WUE response [12] cannot be pooled because their denominators, soils, operating regimes, and validation scales differ. The normalization framework makes these boundaries explicit while retaining their engineering value.
The principal unresolved gap is the verified transition from mechanical optimization to durable intelligent function. Future systems must manage sensor noise and hysteresis, actuator delay, edge wear, blockage, overload, and soil-type dependence while demonstrating that stable control produces a continuous seed/root corridor, compatible residue cover, improved water function, and crop establishment. Digital and autonomous technologies add value only when they close this measured causal chain.
Accordingly, the transferable result is the diagnosis-and-validation procedure; numerical component and control settings must be recalibrated for the relevant soil texture and wear state.
Supplementary Materials
The following supporting information can be downloaded at the website of this paper posted on Preprints.org. The following supporting information accompanies this review: Tables S1–S6, reporting, identification, coding, evidence mapping, and the complete 133-source applicability ledger; Table S7, engineering indicators and equations relocated from the main text; Table S8, critical-applicability checklist; Table S9, complete quantitative evidence anchors and transferability fields; and Table S10, full mechanistic pathway matrix.
Author Contributions
Conceptualization, Y.S. and F.M.; methodology, Y.S. and F.M.; validation, Y.S., F.M., S.T., S.K., U.K., D.C., G.S., M.B., S.J., A.S., M.X., G.O. and S.A.; investigation, Y.S., F.M., S.T., S.K., U.K., D.C., G.S., M.B., S.J., A.S., M.X., G.O. and S.A.; formal analysis, Y.S. and F.M.; data curation, Y.S. and F.M.; writing—original draft preparation, Y.S., F.M., S.T., S.K., U.K., D.C., G.S., M.B., S.J., A.S., M.X., G.O. and S.A.; writing—review and editing, Y.S. and F.M.; visualization, Y.S. and F.M.; supervision, Y.S. and F.M.; project administration, Y.S. and F.M. All authors have read and agreed to the published version of the manuscript.
Funding
This research received no external funding.
Institutional Review Board Statement
Not applicable.
Informed Consent Statement
Not applicable.
Data Availability Statement
No new experimental datasets were generated or analyzed in this review. The article is based on the published sources listed in the References. The qualitative evidence-cluster and source-to-cell coding used for Figure 5 is reported in Supplementary Tables S5 and S5A; the outcome-level counts used for Figure 7 are reported in Table S5B; and the study-level design, evidential role, directness, and transferability appraisal are reported in Table S6.
Acknowledgments
The authors acknowledge the researchers whose published work on soil mechanics, seedbed preparation, agricultural machinery, soil physical quality, and water-limited crop production forms the evidence base of this review.
Conflicts of Interest
The authors declare no conflict of interest.
References
- Morrison, J.E., Jr. Strip tillage for no-till row crop production. Appl. Eng. Agric. 2002, 18, 277–284. [Google Scholar] [CrossRef]
- Al-Kaisi, M.M.; Licht, M.A. Effect of strip tillage on corn nitrogen uptake and residual soil nitrate accumulation compared with no-tillage and chisel plow. Agron. J. 2004, 96, 1164–1171. [Google Scholar] [CrossRef]
- Licht, M.A.; Al-Kaisi, M. Strip-tillage effect on seedbed soil temperature and other soil physical properties. Soil Tillage Res. 2005, 80, 233–249. [Google Scholar] [CrossRef]
- Licht, M.A.; Al-Kaisi, M. Corn response, nitrogen uptake, and water use in strip-tillage compared with no-tillage and chisel plow. Agron. J. 2005, 97, 705–710. [Google Scholar] [CrossRef]
- Celik, A.; Altikat, S.; Way, T.R. Strip tillage width effects on sunflower seed emergence and yield. Soil Tillage Res. 2013, 131, 20–27. [Google Scholar] [CrossRef]
- Trevini, M.; Benincasa, P.; Guiducci, M. Strip tillage effect on seedbed tilth and maize production in Northern Italy as case-study for the Southern Europe environment. Eur. J. Agron. 2013, 48, 50–56. [Google Scholar] [CrossRef]
- Leskovar, D.I.; Othman, Y.A.; Dong, X. Strip tillage improves soil biological activity, fruit yield and sugar content of triploid watermelon. Soil Tillage Res. 2016, 163, 266–273. [Google Scholar] [CrossRef]
- Ren, L.; Vanden Nest, T.; Ruysschaert, G.; D’Hose, T.; Cornelis, W.M. Short-term effects of cover crops and tillage methods on soil physical properties and maize growth in a sandy loam soil. Soil Tillage Res. 2019, 192, 76–86. [Google Scholar] [CrossRef]
- Dou, S.; Wang, Z.; Tong, J.; Shang, Z.; Deng, A.; Song, Z.; Zhang, W. Strip tillage promotes crop yield in comparison with no tillage based on a meta-analysis. Soil Tillage Res. 2024, 241, 106085. [Google Scholar] [CrossRef]
- Wang, C.; Ai, S.; Chen, Q.; Li, J.; Ding, J.; Yang, F. Effect of strip tillage widths on soil moisture, soil temperature and soil structure in Northeast China. Front. Environ. Sci. 2024, 12, 1404971. [Google Scholar] [CrossRef]
- Temesgen, M.; Savenije, H.H.G.; Rockstrom, J.; Hoogmoed, W.B. Assessment of strip tillage systems for maize production in semi-arid Ethiopia: Effects on grain yield, water balance and water productivity. Phys. Chem. Earth 2012, 47–48, 156–165. [Google Scholar] [CrossRef]
- Wang, S.; Wang, H.; Hafeez, M.B.; Zhang, Q.; Yu, Q.; Wang, R.; Wang, X.; Li, J. No-tillage and subsoiling increased maize yields and soil water storage under varied rainfall distribution: A 9-year site-specific study in a semi-arid environment. Field Crops Res. 2020, 255, 107867. [Google Scholar] [CrossRef]
- Wang, Q.; Lu, C.; Li, H.; He, J.; Sarker, K.K.; Rasaily, R.G.; Liang, Z.; Qiao, X.; Li, H.; McHugh, A.D. The effects of no-tillage with subsoiling on soil properties and maize yield: 12-year experiment on alkaline soils of Northeast China. Soil Tillage Res. 2014, 137, 43–49. [Google Scholar] [CrossRef]
- Pittelkow, C.M.; Liang, X.; Linquist, B.A.; van Groenigen, K.J.; Lee, J.; Lundy, M.E.; van Kessel, C.; Corre, M.D.; Six, J. Productivity limits and potentials of the principles of conservation agriculture. Nature 2015, 517, 365–368. [Google Scholar] [CrossRef] [PubMed]
- Soane, B.D.; Ball, B.C.; Arvidsson, J.; Basch, G.; Moreno, F.; Roger-Estrade, J. No-till in northern, western and south-western Europe: A review of problems and opportunities for crop production and the environment. Soil Tillage Res. 2012, 118, 66–87. [Google Scholar] [CrossRef]
- Giller, K.E.; Andersson, J.A.; Corbeels, M.; Kirkegaard, J.; Mortensen, D.; Erenstein, O.; Vanlauwe, B. Beyond conservation agriculture. Front. Plant Sci. 2015, 6, 870. [Google Scholar] [CrossRef] [PubMed]
- Derpsch, R.; Friedrich, T.; Kassam, A.; Li, H. Current status of adoption of no-till farming in the world and some of its main benefits. Int. J. Agric. Biol. Eng. 2010, 3, 1–25. [Google Scholar]
- Godwin, R.J. A review of the effect of implement geometry on soil failure and implement forces. Soil Tillage Res. 2007, 97, 331–340. [Google Scholar] [CrossRef]
- Spoor, G.; Godwin, R.J. An experimental investigation into the deep loosening of soil by rigid tines. J. Agric. Eng. Res. 1978, 23, 243–258. [Google Scholar] [CrossRef]
- Mouazen, A.M.; Ramon, H. A numerical-statistical hybrid modelling scheme for evaluation of draught requirements of a subsoiler cutting a sandy loam soil, as affected by moisture content, bulk density and depth. Soil Tillage Res. 2002, 63, 155–165. [Google Scholar] [CrossRef]
- Abo-Elnor, M.; Hamilton, R.; Boyle, J.T. Simulation of soil-blade interaction for sandy soil using advanced 3D finite element analysis. Soil Tillage Res. 2003, 72, 61–73. [Google Scholar] [CrossRef]
- He, C.; Chen, Y.; Zhang, Y.; Li, Y.; Wang, J. A mathematical model for predicting the draft force of shank-type tillage tines with chamfers. Soil Tillage Res. 2023, 227, 105624. [Google Scholar] [CrossRef]
- Li, B.; Xia, R.; Liu, F.Y.; Chen, J.; Han, W.T.; Han, B. Determination of the draft force for different subsoiler points using discrete element method. Int. J. Agric. Biol. Eng. 2016, 9, 81–87. [Google Scholar]
- Wang, X.; Zhang, H.; Jiang, J. Effect of mounting angle on bending subsoiling tool-soil interactions using DEM simulations. Agriculture 2022, 12, 1830. [Google Scholar] [CrossRef]
- Ucgul, M.; Fielke, J.M.; Saunders, C. Three-dimensional discrete element modelling of tillage: Determination of a suitable contact model and parameters for a cohesionless soil. Biosyst. Eng. 2014, 121, 105–117. [Google Scholar] [CrossRef]
- Ucgul, M.; Fielke, J.M.; Saunders, C. Three-dimensional discrete element modelling of tillage: Validation of a hysteretic spring contact model for a sweep tool operating in a cohesionless soil. Soil Tillage Res. 2014, 144, 220–227. [Google Scholar] [CrossRef]
- Aikins, K.A.; Ucgul, M.; Barr, J.B.; Awuah, E.; Antille, D.L.; Jensen, T.A.; Desbiolles, J.M.A. Review of discrete element method simulations of soil tillage and furrow opening. Agriculture 2023, 13, 541. [Google Scholar] [CrossRef]
- Maraveas, C.; Tsigkas, N.; Bartzanas, T. Agricultural processes simulation using discrete element method: A review. Comput. Electron. Agric. 2025, 232, 110733. [Google Scholar] [CrossRef]
- Page, M.J.; McKenzie, J.E.; Bossuyt, P.M.; Boutron, I.; Hoffmann, T.C.; Mulrow, C.D.; Shamseer, L.; Tetzlaff, J.M.; Akl, E.A.; Brennan, S.E.; Chou, R.; Glanville, J.; Grimshaw, J.M.; Hróbjartsson, A.; Lalu, M.M.; Li, T.; Loder, E.W.; Mayo-Wilson, E.; McDonald, S.; McGuinness, L.A.; Stewart, L.A.; Thomas, J.; Tricco, A.C.; Welch, V.A.; Whiting, P.; Moher, D. The PRISMA 2020 statement: an updated guideline for reporting systematic reviews. BMJ 2021, 372, n71. [Google Scholar] [CrossRef] [PubMed]
- Zhang, K.; Zhang, Y.-Y.; Zhao, X.; Zhao, Y.; Feng, X.; Wang, Q.; Wang, J. Design and test of a bionic auxiliary soil-crushing device for strip-tillage machines. Agriculture 2025, 15, 944. [Google Scholar] [CrossRef]
- Syromiatnykov, Y.; Mamatov, F.; Kurbanov, S.; Shomirzaev, M.; Kasimov, A.; Khasanov, I.; Choriyeva, D.; Khalilov, M.; Ochilov, S.; Badalov, S.; Buriev, M.; Abduganiyeva, S.; Alikulova, S. Soil fragmentation, surface roughness and draft force in chisel tillage with a toothed roller: Experimental and analytical study. Agriculture 2026, 16, 1260. [Google Scholar] [CrossRef]
- Syromyatnykov, Y.; Mamatov, F.; Sholoiko, A.; Galych, I.; Irgashev, D.; Ravshanov, K.; Ravshanova, N.; Rajabov, Y.; Mukumova, F.; Suyunov, A.; Aliev, B. Geometry-Optimized Strip Tillage for Improving Soil Physical Quality and Hydraulic Function in Semi-Arid Vineyards. Agriculture 2026, 16, 751. [Google Scholar] [CrossRef]
- McKyes, E. Soil Cutting and Tillage; Elsevier: Amsterdam, The Netherlands, 1985. [Google Scholar]
- Gill, W.R.; Vanden Berg, G.E. Soil Dynamics in Tillage and Traction; Agricultural Research Service, USDA: Washington, DC, USA, 1968. [Google Scholar]
- Godwin, R.J.; Spoor, G. Soil failure with narrow tines. J. Agric. Eng. Res. 1977, 22, 213–228. [Google Scholar] [CrossRef]
- Hettiaratchi, D.R.P.; Reece, A.R. The calculation of passive soil resistance. Geotechnique 1974, 24, 289–310. [Google Scholar] [CrossRef]
- Swick, W.C.; Perumpral, J.V. A model for predicting soil-tool interaction. J. Terramech. 1988, 25, 43–56. [Google Scholar] [CrossRef]
- Arvidsson, J. Energy use efficiency in different tillage systems for winter wheat on a clay and silt loam in Sweden. Eur. J. Agron. 2010, 33, 1–8. [Google Scholar] [CrossRef]
- Arvidsson, J. Specific draught, soil fragmentation and straw incorporation for different tillage tools. Soil Tillage Res. 2010, 110, 154–160. [Google Scholar] [CrossRef]
- Salar, M.R.; Khan, F. Soil loosening characteristics of a dual bent blade in a dry sandy loam soil. Soil Tillage Res. 2013, 130, 32–39. [Google Scholar]
- Raper, R.L. Agricultural traffic impacts on soil. J. Terramech. 2005, 42, 259–280. [Google Scholar] [CrossRef]
- Ibrahmi, A.; Bentaher, H.; Maalej, A. Soil-blade orientation effect on tillage forces determined by 3D finite element models. Span. J. Agric. Res. 2014, 12, 941–951. [Google Scholar] [CrossRef]
- Malvajerdi, A.S. Wear and coating of tillage tools: A review. Heliyon 2023, 9, e16669. [Google Scholar] [CrossRef] [PubMed]
- Wang, S.B.; Guo, L.L.; Zhou, P.C.; Wang, X.J.; Shen, Y.; Han, H.F.; Ning, T.Y.; Han, K. Effect of subsoiling depth on soil physical properties and summer maize yield. Plant Soil Environ. 2019, 65, 131–137. [Google Scholar] [CrossRef]
- Guo, R.; Zhang, N.; Wang, L.; Lin, T.; Zheng, Z.; Cui, J.; Tian, L. Subsoiling depth affects the morphological and physiological traits of roots in film-mulched and drip-irrigated cotton. Soil Tillage Res. 2023, 231, 105826. [Google Scholar] [CrossRef]
- Hamza, M.A.; Anderson, W.K. Soil compaction in cropping systems: A review of the nature, causes and possible solutions. Soil Tillage Res. 2005, 82, 121–145. [Google Scholar]
- Keller, T.; Defossez, P.; Weisskopf, P.; Arvidsson, J.; Richard, G. SoilFlex: A model for prediction of soil stresses and soil compaction due to agricultural field traffic including a synthesis of analytical approaches. Soil Tillage Res. 2007, 93, 391–411. [Google Scholar] [CrossRef]
- Ergashev, I.; Abdullaev, B.; Pardaev, X.; Joniqulov, J.; Murodqobilov, B. Results of investigations of paired disc coulter of the no-till seeder. AIP Conf. Proc. 2024, 3167, 060010. [Google Scholar] [CrossRef]
- Ergashev, I.T.; Abdullaev, B.V.; Pardaev, K.K. Determining the parameters of a double disk opener. IOP Conf. Ser. Earth Environ. Sci. 2022, 1076, 012038. [Google Scholar] [CrossRef]
- Wang, Q.; Wang, B.; Sun, M.; Sun, X.; Zhou, W.; Tang, H.; Wang, J. Design and testing of an automatic strip-till machine for conservation tillage of corn. Agronomy 2023, 13, 2357. [Google Scholar] [CrossRef]
- Kassam, A.; Friedrich, T.; Shaxson, F.; Pretty, J. The spread of conservation agriculture: Justification, sustainability and uptake. Int. J. Agric. Sustain. 2009, 7, 292–320. [Google Scholar] [CrossRef]
- Blanco-Canqui, H.; Ruis, S.J. No-tillage and soil physical environment. Geoderma 2018, 326, 164–200. [Google Scholar] [CrossRef]
- Syromyatnykov, Y.N.; Mozgovsky, A.F.; Kalimullin, M.N.; Tikhonov, E.A.; Dzjasheev, A.M.; Orekhovskaya, A.A.; Taraban, M.V. Substantiation of flat blade parameters for soil loosening. IOP Conf. Ser. Earth Environ. Sci. 2022, 981, 042043. [Google Scholar] [CrossRef]
- Belykh, A.V.; Ivanov, A.A.; Lopareva, S.G.; Luchinovich, A.A.; Loparev, D.V. Substantiation of cultivator points form of the lowest draught for stratifier tillage machine. IOP Conf. Ser. Earth Environ. Sci. 2022, 981, 042031. [Google Scholar] [CrossRef]
- Mirzaev, B.; Mamatov, F.; Tursunov, O. A justification of broach-plow parameters of ridge-stepped ploughing. E3S Web Conf. 2019, 97, 05035. [Google Scholar] [CrossRef]
- Mirzaev, B.; Mamatov, F.; Avazov, I.; Mardonov, S. Technologies and technical means for anti-erosion differentiated soil treatment systems. E3S Web Conf. 2019, 97, 05036. [Google Scholar] [CrossRef]
- Mamatov, F.M.; Karshiev, F.U.; Ravshanova, N.B.; Toshtemirov, S.Z.; Kodirov, U.; Rashidov, N.S.; Shodmonov, G.D.; Saidov, N.I.; Begimkulova, M.F.; Ismatov, A. Engineering optimisation of combined soil preparation for ridge-based peanut production and residue biodegradation. Technologies 2026, 14, 203. [Google Scholar] [CrossRef]
- Pashchenko, V.F.; Syromyatnykov, Y.N. The transporting ability of the rotor of the soil-cultivating loosening and separating vehicle. Tract. Agric. Mach. 2019, 86, 67–74. [Google Scholar] [CrossRef]
- Troyanovskaya, I.; Voinash, S.; Orekhovskaya, A.; Sokolova, V.; Maksimovich, K.; Lopareva, S. Productivity of tillage loosening and separating machines in an aggregate with tractors of various capacities. J. Terramech. 2021, 98, 1–6. [Google Scholar] [CrossRef]
- Kuts, A.; Tikhonov, E.; Sokolova, V. Transporting ability calculation of the rotor of soil-cultivating loosening and separating vehicle. Acta Technol. Agric. 2022, 25, 73–78. [Google Scholar] [CrossRef]
- Orekhovskaya, A.A.; Dzjasheev, A.M.; Kalimullin, M.N.; Tikhonov, E.A.; Luchinovich, A.A. Cultivator points of the rotary tillage loosening and separating machine of the stratifier. J. Phys. Conf. Ser. 2021, 2094, 042024. [Google Scholar] [CrossRef]
- Khramov, N.; Voinash, S.; Partko, S.; Zagidullin, R. Work quality indicators of a tillage unit with a flexible working body in organic farming systems. E3S Web Conf. 2023, 463, 01001. [Google Scholar] [CrossRef]
- Syromiatnykov, Y.; Mamatov, F.; Fayzullaev, X.; Karshiev, F.; Chuyanov, D.; Eshdavlatov, E.; Ismailov, I.; Temirov, I.; Eshdavlatov, A.; Gulomov, L.; Abduganiyeva, S.; Jalilov, S. Optimization of leveler–compactor parameters in combined strip tillage for soil preparation under plastic film for melon crops. Agronomy 2026, 16, 809. [Google Scholar] [CrossRef]
- Aldoshin, N.V.; Mamatov, F.M.; Kuznetsov, Y.A.; Kravchenko, I.N.; Kupreenko, A.I.; Ismailov, I.I.; Kalashnikova, L.V. Loosening and leveling device for preparing soil for melon crops. INMATEH Agric. Eng. 2021, 64, 261–270. [Google Scholar] [CrossRef]
- Aldoshin, N.; Mamatov, F.; Ismailov, I.; Ergashov, G. Development of combined tillage tool for melon cultivation. In Proceedings of the 19th International Scientific Conference Engineering for Rural Development, Jelgava, Latvia, 20–22 May 2020. [Google Scholar] [CrossRef]
- Ergashev, I.T.; Islamov, Y.I.; Pardayev, X.Q.; Tashtemirov, B.R.; Ismatov, A.I.; Abdullaev, B.V. Results of research on a combined straw-grinding aggregate for sowing repeated crops. IOP Conf. Ser. Earth Environ. Sci. 2021, 868, 012087. [Google Scholar] [CrossRef]
- Batey, T. Soil compaction and soil management - A review. Soil Use Manag. 2009, 25, 335–345. [Google Scholar] [CrossRef]
- Dexter, A.R. Soil physical quality. Part I. Theory, effects of soil texture, density, and organic matter, and effects on root growth. Geoderma 2004, 120, 201–214. [Google Scholar]
- Carter, M.R. Relative measures of soil bulk density to characterize compaction in tillage studies on fine sandy loams. Can. J. Soil Sci. 1990, 70, 425–433. [Google Scholar] [CrossRef]
- Reynolds, W.D.; Bowman, B.T.; Drury, C.F.; Tan, C.S.; Lu, X. Indicators of good soil physical quality: Density and storage parameters. Geoderma 2002, 110, 131–146. [Google Scholar] [CrossRef]
- Jaskulska, I.; Romaneckas, K.; Jaskulski, D.; Gałęzewski, L.; Breza-Boruta, B.; Dębska, B.; Lemanowicz, J. Soil Properties after Eight Years of the Use of Strip-Till One-Pass Technology. Agronomy 2020, 10, 1596. [Google Scholar] [CrossRef]
- Jabro, J.D.; Iversen, W.M.; Stevens, W.B.; Evans, R.G.; Allen, B.L.; Sainju, U.M. Physical and hydraulic properties of a sandy loam soil under irrigated no-till, strip-till, and conventional till systems. Soil Tillage Res. 2016, 163, 245–253. [Google Scholar]
- Lipiec, J.; Hatano, R. Quantification of compaction effects on soil physical properties and crop growth. Geoderma 2003, 116, 107–136. [Google Scholar] [CrossRef]
- Bengough, A.G.; McKenzie, B.M.; Hallett, P.D.; Valentine, T.A. Root elongation, water stress, and mechanical impedance: A review of limiting stresses and beneficial root tip traits. J. Exp. Bot. 2011, 62, 59–68. [Google Scholar] [CrossRef] [PubMed]
- Ishaq, M.; Ibrahim, M.; Hassan, A.; Saeed, M.; Lal, R. Subsoil compaction effects on crops in Punjab, Pakistan: I. Soil physical properties and crop yield. Soil Tillage Res. 2001, 59, 57–65. [Google Scholar]
- Colombi, T.; Keller, T. Developing strategies to recover crop productivity after soil compaction - A plant eco-physiological perspective. Soil Tillage Res. 2019, 191, 156–161. [Google Scholar] [CrossRef]
- Bescansa, P.; Imaz, M.J.; Virto, I.; Enrique, A.; Hoogmoed, W.B. Soil water retention as affected by tillage and residue management in semiarid Spain. Soil Tillage Res. 2006, 87, 19–27. [Google Scholar] [CrossRef]
- Calonego, J.C.; Raphael, J.P.A.; Rigon, J.P.G.; Neto, L.O.; Rosolem, C.A. Soil compaction management and soybean yields with cover crops under no-till and occasional chiselling. Eur. J. Agron. 2017, 85, 31–37. [Google Scholar] [CrossRef]
- Pashchenko, V.F.; Hramov, N.S.; Voinash, S.A. The Influence of Local Loosening of the Soil on Soybean Productivity. Tract. Agric. Mach. 2019, 86, 79–86. [Google Scholar] [CrossRef]
- Mak, J.; Chen, Y.; Sadek, M.A. Determining parameters of a discrete element model for soil-tool interaction. Soil Tillage Res. 2012, 118, 117–122. [Google Scholar] [CrossRef]
- Coetzee, C.J. Review: Calibration of the discrete element method. Powder Technol. 2017, 310, 104–142. [Google Scholar] [CrossRef]
- Ucgul, M.; Fielke, J.M.; Saunders, C. Three-dimensional discrete element modelling of tillage: Accounting for soil cohesion and adhesion. Biosyst. Eng. 2015, 129, 298–306. [Google Scholar] [CrossRef]
- Ucgul, M.; Saunders, C.; Fielke, J.M. Discrete element modelling of tillage forces and soil movement of a one-third scale mouldboard plough. Biosyst. Eng. 2017, 155, 44–54. [Google Scholar] [CrossRef]
- Ucgul, M.; Saunders, C.; Fielke, J.M. Simulation of tillage forces and furrow profile during soil-mouldboard plough interaction using the discrete element method. Biosyst. Eng. 2020, 190, 168–182. [Google Scholar] [CrossRef]
- Zhao, H.; Liu, C.; Cao, Y.; Zhu, X.; Yu, T.; Xue, Y. Applications of discrete element method in the research of soil-plant-machine interactions. Agriculture 2021, 11, 425. [Google Scholar] [CrossRef]
- Walunj, A.; Chen, Y.; Tian, Y.; Zeng, Z. Modeling soil-plant-machine dynamics using discrete element method: A review. Agronomy 2023, 13, 1260. [Google Scholar] [CrossRef]
- Šarauskis, E.; Sokas, S.; Rukaitė, J. Variable Depth Tillage: Importance, Applicability, and Impact—An Overview. AgriEngineering 2024, 6, 1870–1885. [Google Scholar] [CrossRef]
- Deng, Y.; Zhang, W.; Qi, B.; Wang, Y.; Ding, Y.; Zhang, H. Research Progress and Prospects of Intelligent Measurement and Control Technology for Tillage Depth in Subsoiling Operations. Sensors 2025, 25, 3821. [Google Scholar] [CrossRef] [PubMed]
- Kim, Y.-S.; Kim, T.-J.; Kim, Y.-J.; Lee, S.-D.; Park, S.-U.; Kim, W.-S. Development of a Real-Time Tillage Depth Measurement System for Agricultural Tractors: Application to the Effect Analysis of Tillage Depth on Draft Force during Plow Tillage. Sensors 2020, 20, 912. [Google Scholar] [CrossRef] [PubMed]
- Lou, S.; He, J.; Lu, C.; Liu, P.; Li, H.; Zhang, Z. A Tillage Depth Monitoring and Control System for the Independent Adjustment of Each Subsoiling Shovel. Actuators 2021, 10, 250. [Google Scholar] [CrossRef]
- Zhu, Y.; Cui, B.; Yu, Z.; Gao, Y.; Wei, X. Tillage Depth Detection and Control Based on Attitude Estimation and Online Calibration of Model Parameters. Agriculture 2024, 14, 2130. [Google Scholar] [CrossRef]
- Pang, J.; Zhang, X.; Lin, X.; Liu, J.; Du, X.; Han, J. Tillage-Depth Verification Based on Machine Learning Algorithms. Agriculture 2023, 13, 130. [Google Scholar] [CrossRef]
- Badgujar, C.; Das, S.; Figueroa, D.M.; Flippo, D. Application of Computational Intelligence Methods in Agricultural Soil–Machine Interaction: A Review. Agriculture 2023, 13, 357. [Google Scholar] [CrossRef]
- Wang, A.; Ji, X.; Zhu, Y.; Wang, Q.; Wei, X.; Zhang, S. Tillage Depth Regulation System via Depth Measurement Feedback and Composite Sliding Mode Control: A Field Comparison Validation Study. Meas. Control 2024, 57, 685–702. [Google Scholar] [CrossRef]
- Wang, S.; Yi, S.; Zhao, B.; Li, Y.; Li, S.; Tao, G.; Mao, X.; Sun, W. Sowing Depth Monitoring System for High-Speed Precision Planters Based on Multi-Sensor Data Fusion. Sensors 2024, 24, 6331. [Google Scholar] [CrossRef] [PubMed]
- Hemmat, A.; Adamchuk, V.I. Sensor Systems for Measuring Soil Compaction: Review and Analysis. Comput. Electron. Agric. 2008, 63, 89–103. [Google Scholar] [CrossRef]
- Adamchuk, V.I.; Hemmat, A.; Mouazen, A.M. Soil Compaction Sensor Systems—Current Developments. In Proceedings of the 2008 ASABE Annual International Meeting, Providence, RI, USA, 29 June–2 July 2008; Paper No. 083994. [Google Scholar] [CrossRef]
- Li, Y.; Qi, B.; Bao, E.; Tang, Z.; Lian, Y.; Sun, M. Design and Analysis of Sowing Depth Detection and Control Device for Multi-Row Wheat Seeders Adapted to Different Terrain Variations. Agriculture 2025, 15, 290. [Google Scholar] [CrossRef]
- Ergashev, I.T.; Islomov, Y.I.; Tashtemirov, B.R.; Pardaev, K.K.; Namazov, F.A. Combined tool for improving arid pastures. E3S Web Conf. 2023, 462, 01017. [Google Scholar] [CrossRef]
- Munkholm, L.J.; Heck, R.J.; Deen, B. Long-term rotation and tillage effects on soil structure and crop yield. Soil Tillage Res. 2013, 127, 85–91. [Google Scholar] [CrossRef]
- Twomlow, S.J.; Parkinson, R.J.; Reid, I. The influence of tillage on semi-arid soil-water regimes in Zimbabwe. Geoderma 2000, 95, 33–51. [Google Scholar] [CrossRef]
- Aboudrare, A.; Debaeke, P.; Bouaziz, A.; Chekli, H. Effects of soil tillage and fallow management on soil water storage and sunflower production in a semi-arid Mediterranean climate. Agric. Water Manag. 2006, 83, 183–196. [Google Scholar] [CrossRef]
- Jiao, Y.; Yi, Y.; Feng, L.; Sun, Z.; Yang, N.; Yu, J.; Zheng, M.; Zhang, L.; Zheng, J. Effects of subsoiling on maize yield and water-use efficiency in a semiarid area. Open Life Sci. 2017, 12, 386–392. [Google Scholar] [CrossRef]
- Lampurlanes, J.; Angas, P.; Cantero-Martinez, C. Root growth, soil water content and yield of barley under different tillage systems on two soils in semi-arid conditions. Field Crops Res. 2001, 69, 27–40. [Google Scholar] [CrossRef]
- Dexter, A.R. Soil physical quality. Part II. Friability, tillage, tilth and hard-setting. Geoderma 2004, 120, 215–225. [Google Scholar] [CrossRef]
- Alvarez, R.; Steinbach, H.S. A review of the effects of tillage systems on some soil physical properties, water content, nitrate availability and crop yield in the Argentine Pampas. Soil Tillage Res. 2009, 104, 1–15. [Google Scholar] [CrossRef]
- Strudley, M.W.; Green, T.R.; Ascough, J.C., II. Tillage effects on soil hydraulic properties in space and time: State of the science. Soil Tillage Res. 2008, 99, 4–48. [Google Scholar] [CrossRef]
- Six, J.; Elliott, E.T.; Paustian, K. Soil macroaggregate turnover and microaggregate formation: A mechanism for C sequestration under no-tillage agriculture. Soil Biol. Biochem. 2000, 32, 2099–2103. [Google Scholar] [CrossRef]
- Six, J.; Ogle, S.M.; Breidt, F.J.; Conant, R.T.; Mosier, A.R.; Paustian, K. The potential to mitigate global warming with no-tillage management is only realized when practiced in the long term. Glob. Chang. Biol. 2004, 10, 155–160. [Google Scholar] [CrossRef]
- Franzluebbers, A.J. Water infiltration and soil structure related to organic matter and its stratification with depth. Soil Tillage Res. 2002, 66, 197–205. [Google Scholar] [CrossRef]
- Kladivko, E.J. Tillage systems and soil ecology. Soil Tillage Res. 2001, 61, 61–76. [Google Scholar] [CrossRef]
- Fuentes, J.P.; Flury, M.; Huggins, D.R.; Bezdicek, D.F. Soil water and nitrogen dynamics in dryland cropping systems of Washington State, USA. Soil Tillage Res. 2009, 104, 319–329. [Google Scholar]
- Osunbitan, J.A.; Oyedele, D.J.; Adekalu, K.O. Tillage effects on bulk density, hydraulic conductivity and strength of a loamy sand soil in southwestern Nigeria. Soil Tillage Res. 2005, 82, 57–64. [Google Scholar] [CrossRef]
- Vakali, C.; Zaller, J.G.; Kopke, U. Reduced tillage effects on soil properties and growth of cereals and associated weeds under organic farming. Soil Tillage Res. 2011, 111, 133–141. [Google Scholar] [CrossRef]
- Veselovsky, A.; Troyanovskaya, I.; Voinash, S.; Malikov, V.; Zagidullin, R.; Sabitov, L. Features of Wear of Gears of Agricultural Machinery. Acta Technol. Agric. 2023, 26, 207–214. [Google Scholar] [CrossRef]
- Tamas, K.; Jori, I.J.; Mouazen, A.M. Modelling soil-sweep interaction with discrete element method. Soil Tillage Res. 2013, 134, 223–231. [Google Scholar] [CrossRef]
- Cundall, P.A.; Strack, O.D.L. A discrete numerical model for granular assemblies. Geotechnique 1979, 29, 47–65. [Google Scholar] [CrossRef]
- Wang, Y.; Zhang, D.; Yang, L.; Cui, T. Modeling of soil-claw interaction using the discrete element method. Soil Tillage Res. 2016, 158, 177–185. [Google Scholar] [CrossRef]
- Wang, Y.; Zhang, D.; Yang, L.; Cui, T. Modeling the interaction of soil and a vibrating subsoiler using the discrete element method. Comput. Electron. Agric. 2020, 168, 105071. [Google Scholar] [CrossRef]
- Pashchenko, V.F.; Syromyatnykov, Y.N.; Khramov, N.S.; Voinash, S.A. The influence of local loosening of the soil on soybean productivity. Tract. Agric. Mach. 2019, 86, 79–86. [Google Scholar] [CrossRef]
- Syromyatnykov, Y.N. Substantiation of the parameters of a soil tillage machine ripper. Eng. Technol. Syst. 2021, 31, 257–273. [Google Scholar] [CrossRef]
- Klyosov, D.; Vodolazskaya, N.; Syromyatnikov, P.; Sementsov, V. Field tests of the experimental installation for soil processing. J. Terramech. 2022, 100, 81–86. [Google Scholar] [CrossRef]
- Troyanovskaya, I.; Zagidullin, R.; Tikhonov, E.; Voinash, S. Soil density in traditional mouldboard tillage. Acta Technol. Agric. 2023, 26, 159–165. [Google Scholar] [CrossRef]
- Khalilov, N.; Gulyarenko, A.; Malikov, V.; Orekhovskaya, A. Dynamics of Agrophysical Parameters and Corn Yield Under Minimum Tillage in Samarkand Region. Acta Technol. Agric. 2025, 28, 80–87. [Google Scholar] [CrossRef]
- Mirzaev, B.S.; Ergashov, G.H.; Mamatov, F.M.; Ravshanova, N.B.; Toshtemirov, S.J.; Begimkulova, M.F. Justification of the parameters of the lister body. IOP Conf. Ser. Earth Environ. Sci. 2022, 1076, 012022. [Google Scholar] [CrossRef]
- Mamatov, F.M.; Karimov, R.R.; Gapparov, S.; Musurmonov, I.E. Study of the parameters of the field of the cone-shaped working body straw chopper. IOP Conf. Ser. Earth Environ. Sci. 2022, 1076, 012026. [Google Scholar] [CrossRef]
- Hobbs, P.R.; Sayre, K.; Gupta, R. The role of conservation agriculture in sustainable agriculture. Philos. Trans. R. Soc. B 2008, 363, 543–555. [Google Scholar] [CrossRef] [PubMed]
- Morris, N.L.; Miller, P.C.H.; Orson, J.H.; Froud-Williams, R.J. The adoption of non-inversion tillage systems in the United Kingdom and the agronomic impact on soil, crops and environment - A review. Soil Tillage Res. 2010, 108, 1–15. [Google Scholar] [CrossRef]
- Drury, C.F.; Tan, C.S.; Welacky, T.W.; Oloya, T.O.; Hamill, A.S.; Weaver, S.E. Red clover and tillage influence on corn production and soil temperature, moisture, and mineral nitrogen. Soil Tillage Res. 2003, 72, 57–66. [Google Scholar]
- Dwyer, L.M.; Ma, B.L.; Stewart, D.W.; Hayhoe, H.N.; Balchin, D.; Culley, J.L.B.; McGovern, M. Root mass distribution under conventional and conservation tillage. Can. J. Soil Sci. 1996, 76, 23–28. [Google Scholar] [CrossRef]
- Gemtos, T.A.; Lellis, T.; Petoukhov, A.I.; Tagarakis, A. Evaluation of strip tillage for cotton production in Greece. Soil Tillage Res. 2008, 99, 179–187. [Google Scholar]
- Mullins, G.L.; Alley, S.E.; Reeves, D.W. Tropical maize response to nitrogen and starter fertilizer under strip and conventional tillage systems in southern Alabama. Soil Tillage Res. 1998, 45, 1–15. [Google Scholar] [CrossRef]
- Semenenko, I.; Orekhovskaya, A.; Troyanovskaya, I.; Bedenko, I.; Sakhapov, R. Influence of cultivation technology on the yield of winter wheat. E3S Web Conf. 2023, 443, 02001. [Google Scholar] [CrossRef]
Figure 1.
Simplified causal architecture linking field diagnosis, component design, controlled operation, and verified seedbed function. The feedback path denotes post-pass verification; the conditioning boundary prevents transfer of a setting without its soil, residue, traffic, power, and wear context.
Figure 1.
Simplified causal architecture linking field diagnosis, component design, controlled operation, and verified seedbed function. The feedback path denotes post-pass verification; the conditioning boundary prevents transfer of a setting without its soil, residue, traffic, power, and wear context.
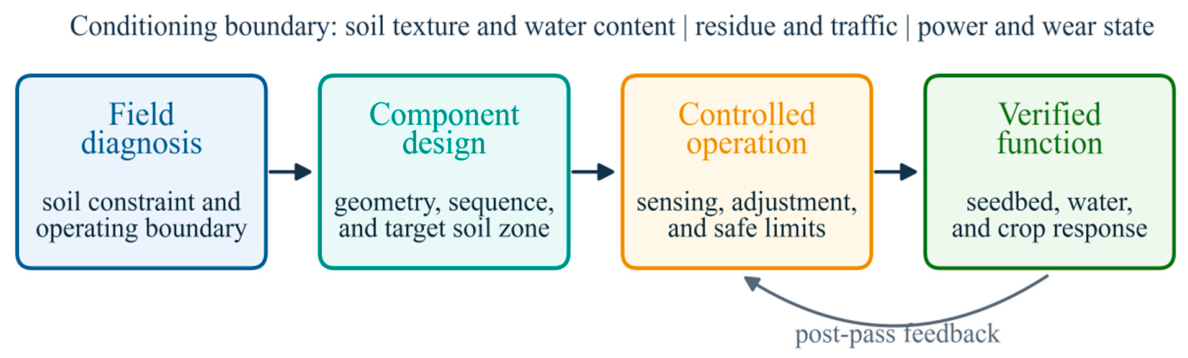
Figure 2.
Physical embodiments of seedbed-preparation component sequences and their field action: (a,b) bionic auxiliary soil-crushing device and resulting strip [30]; (c,d) geometry-optimized vineyard component and field operation [32]; (e,f) chisel plow with passive toothed roller and field operation [31]. Images are reproduced from open-access articles [30,31,32] distributed under the Creative Commons Attribution license (CC BY 4.0).
Figure 2.
Physical embodiments of seedbed-preparation component sequences and their field action: (a,b) bionic auxiliary soil-crushing device and resulting strip [30]; (c,d) geometry-optimized vineyard component and field operation [32]; (e,f) chisel plow with passive toothed roller and field operation [31]. Images are reproduced from open-access articles [30,31,32] distributed under the Creative Commons Attribution license (CC BY 4.0).
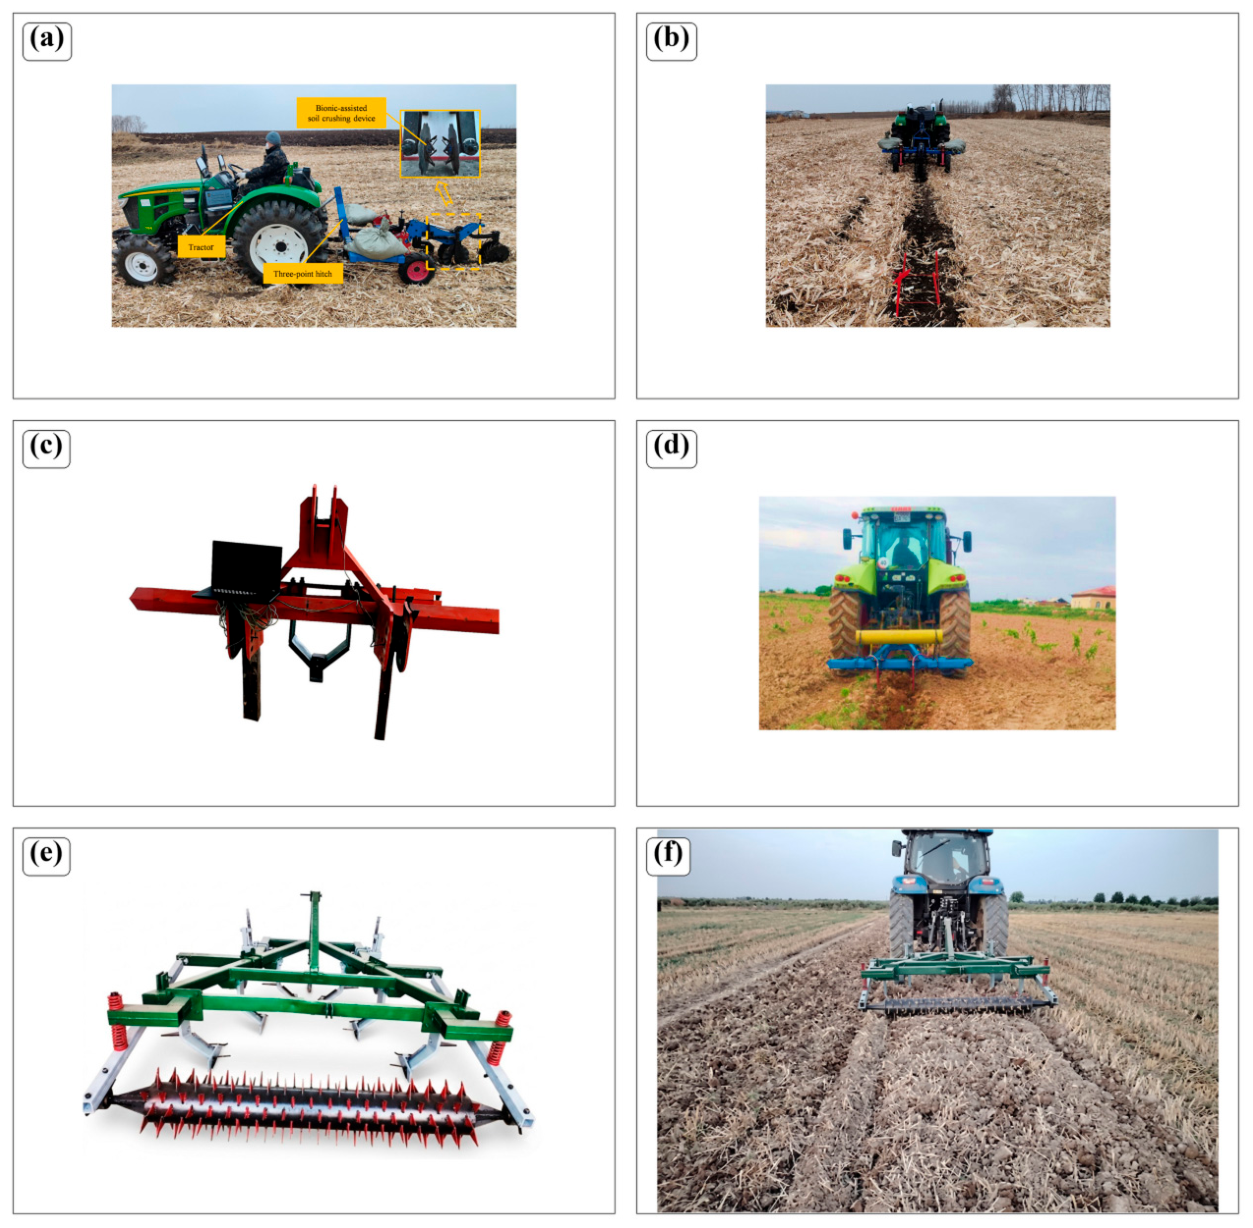
Figure 3.
Effect of lateral component spacing on continuity of the prepared root-zone corridor.
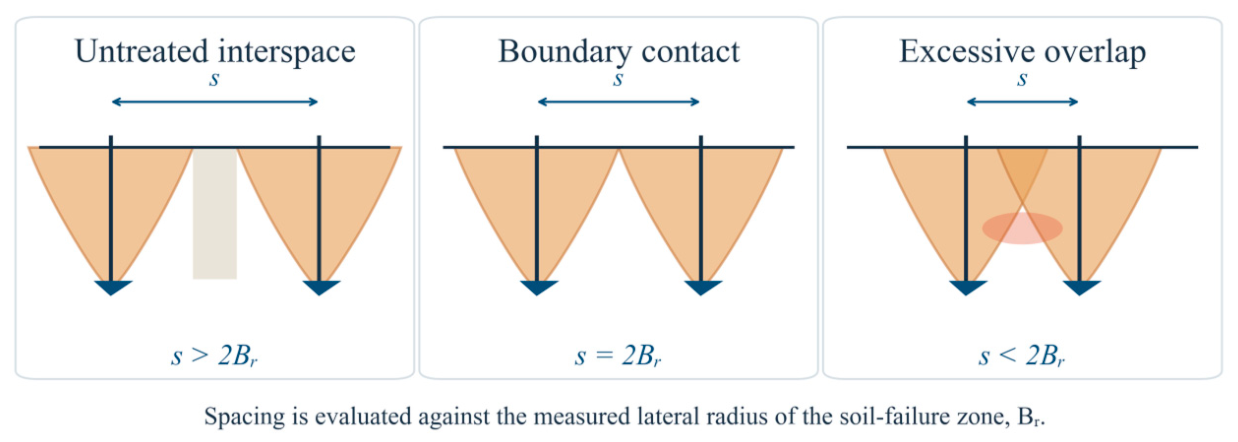
Figure 5.
Qualitative evidence map linking soil-engaging component families with machine, seedbed, water, and crop outcomes. D, direct evidence for the stated outcome; P, partial or condition-dependent evidence; L, limited or contextual evidence. The synthesis indicates evidence directness, not effect size or direction.
Figure 5.
Qualitative evidence map linking soil-engaging component families with machine, seedbed, water, and crop outcomes. D, direct evidence for the stated outcome; P, partial or condition-dependent evidence; L, limited or contextual evidence. The synthesis indicates evidence directness, not effect size or direction.
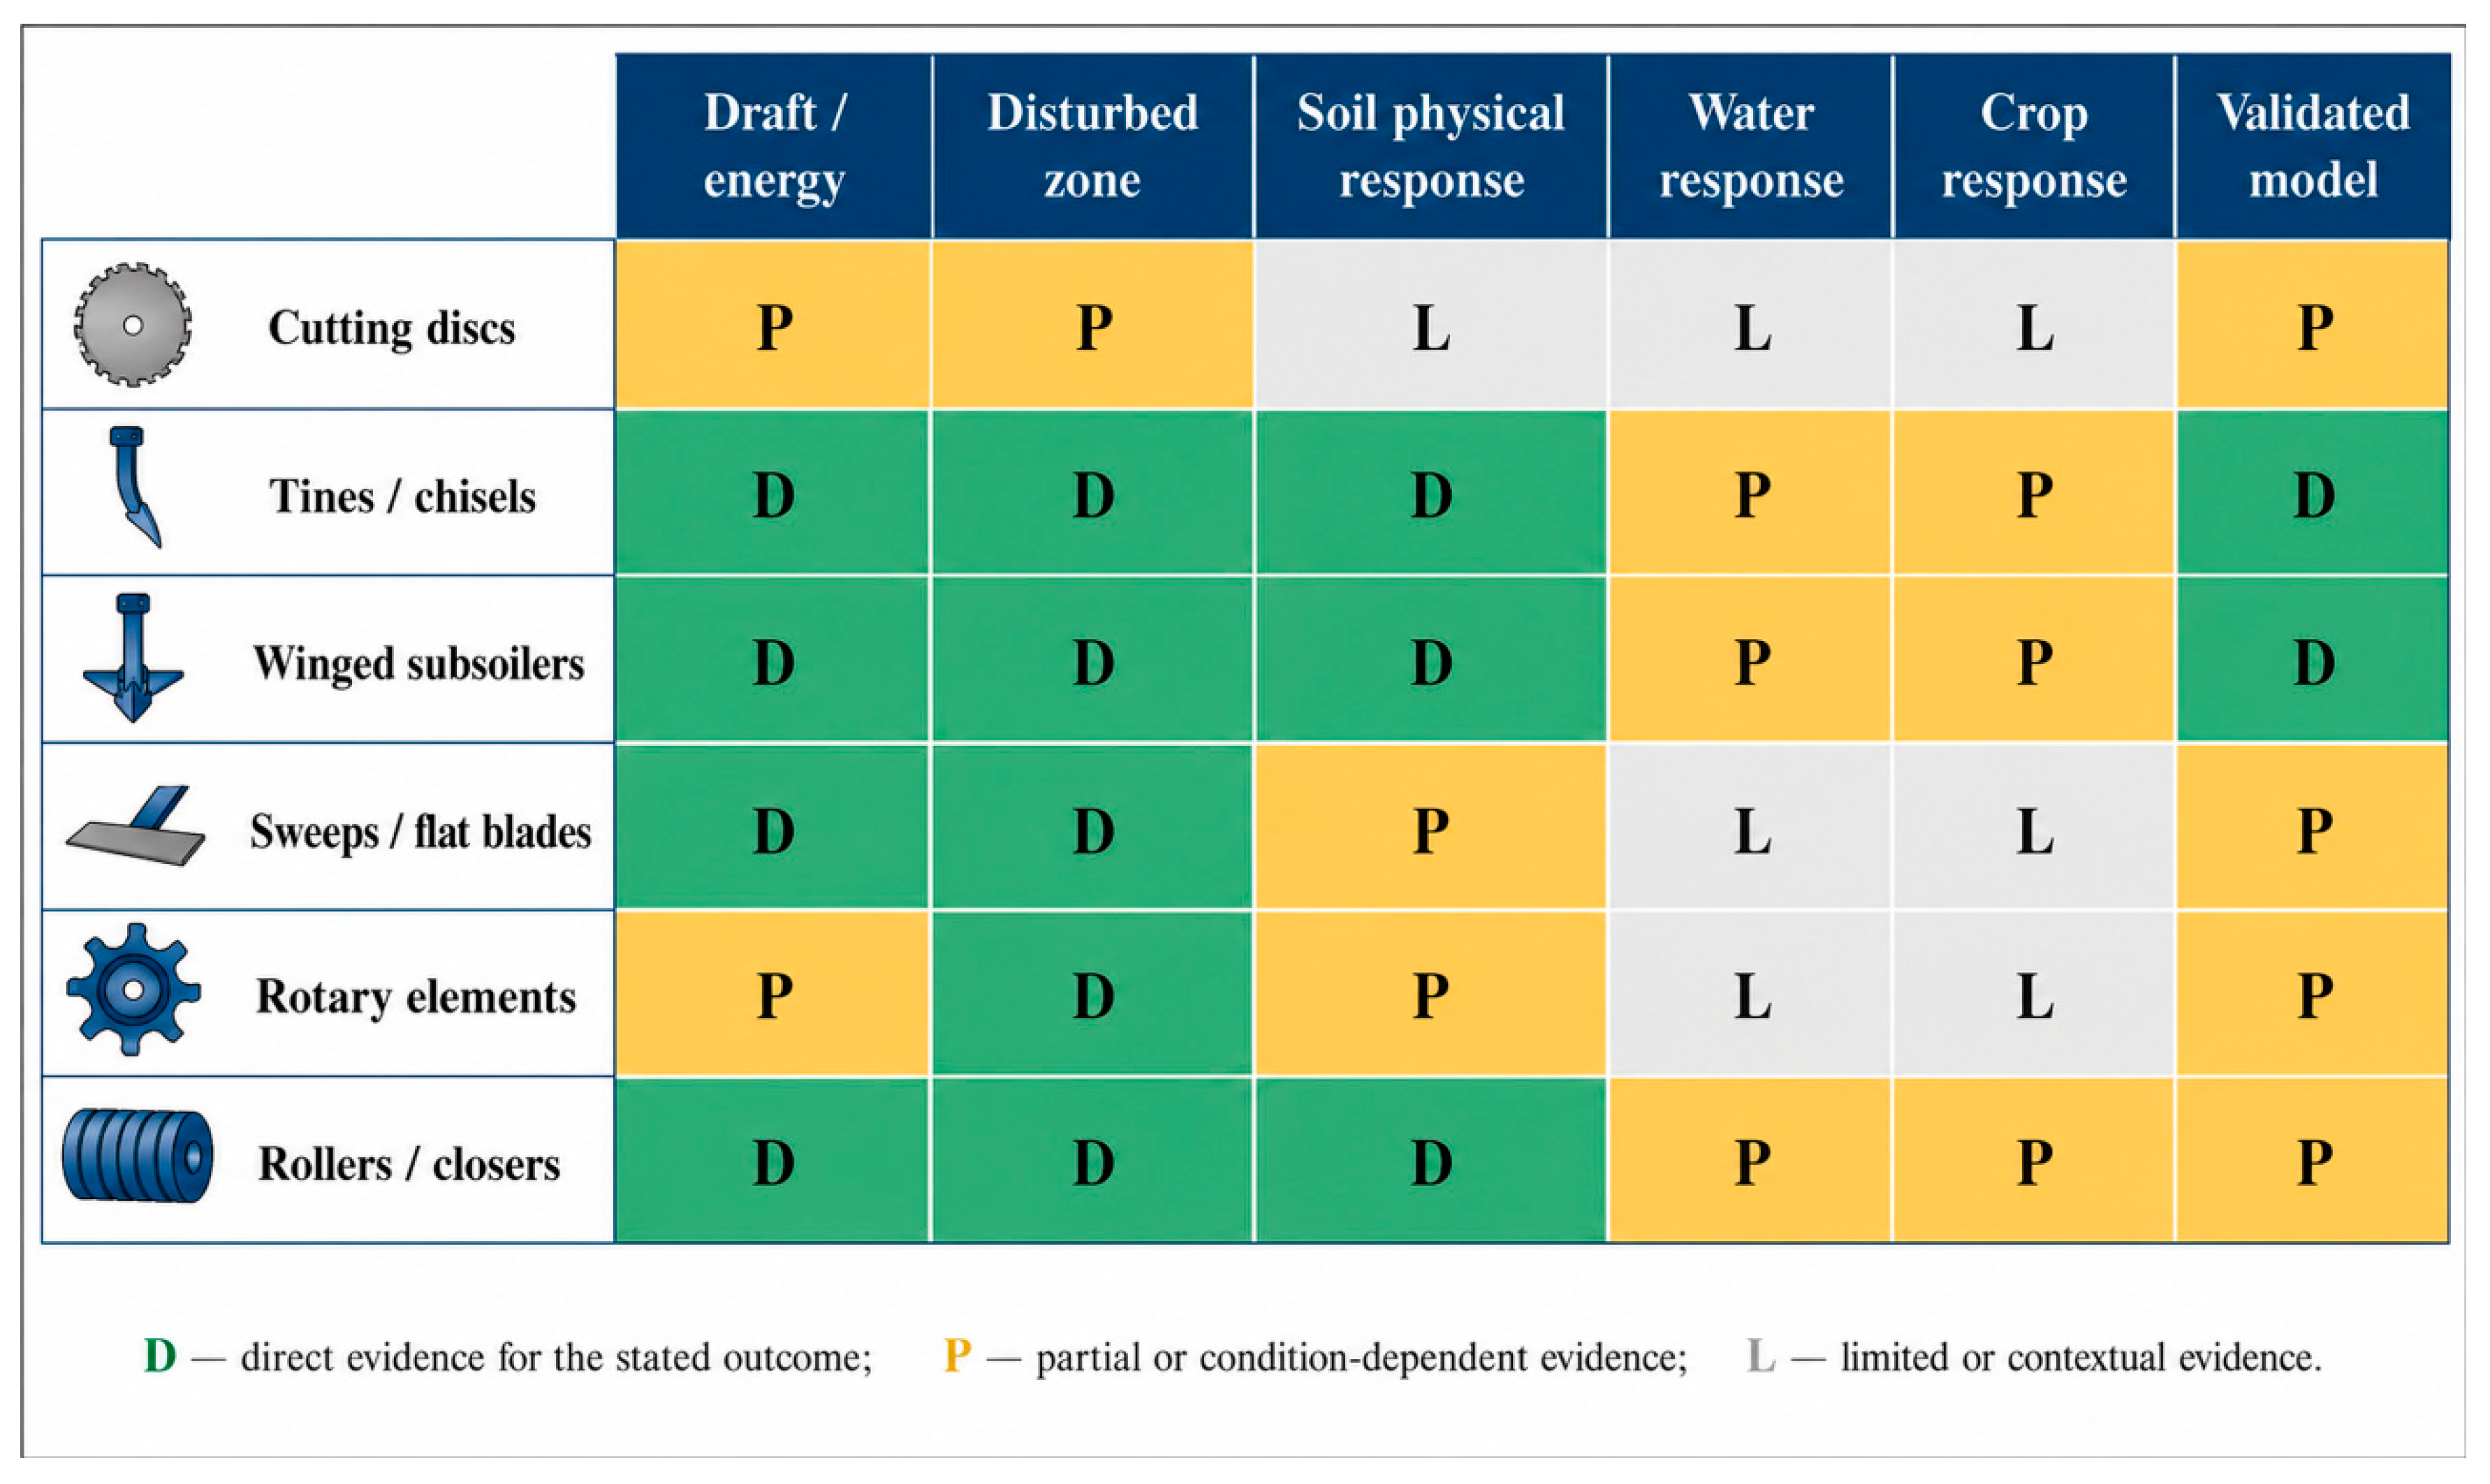
Figure 6.
Diagnosis-to-verification workflow for intelligent seedbed-preparation component selection and adjustment.
Figure 6.
Diagnosis-to-verification workflow for intelligent seedbed-preparation component selection and adjustment.
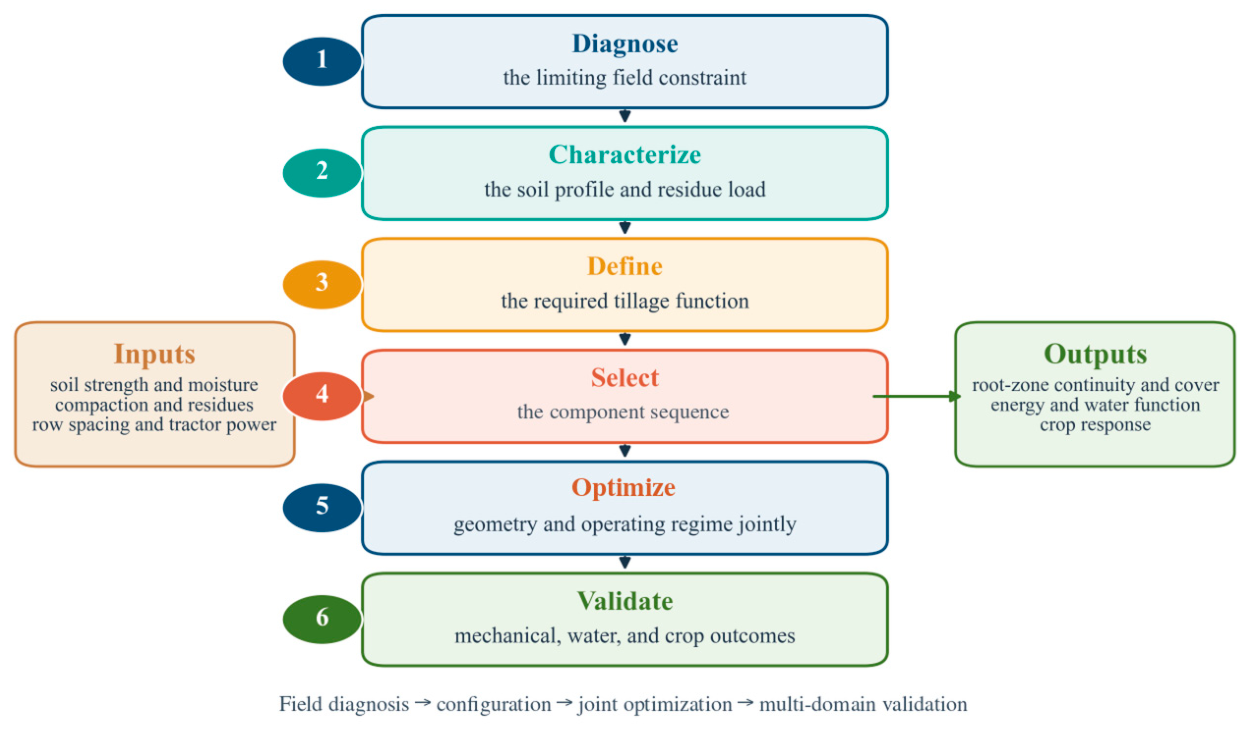
Figure 7.
Evidence directness by outcome category across six soil-engaging component families. Counts aggregate the D/P/L cell classifications; zero-count segments are omitted. The figure describes coverage rather than effect direction, effect size, or study quality; calculations are reported in Supplementary Table S5B.
Figure 7.
Evidence directness by outcome category across six soil-engaging component families. Counts aggregate the D/P/L cell classifications; zero-count segments are omitted. The figure describes coverage rather than effect direction, effect size, or study quality; calculations are reported in Supplementary Table S5B.
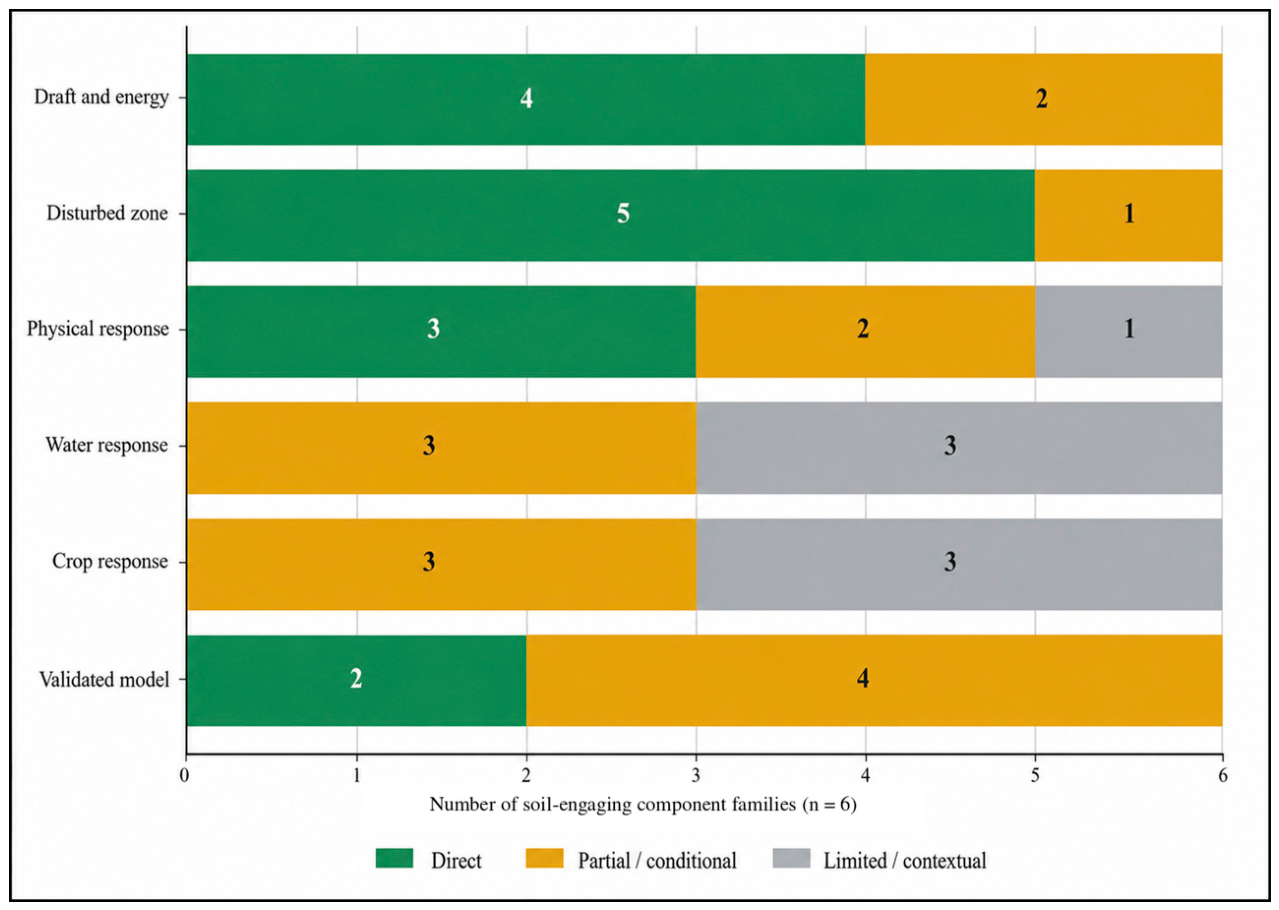

Table 1.
Evidence-synthesis framework for soil-engaging components in intelligent seedbed preparation.
Table 1.
Evidence-synthesis framework for soil-engaging components in intelligent seedbed preparation.
| Evidence dimension | Design question | Direct evidence | Evidence limitation |
|---|---|---|---|
| Tool geometry | How does the shape of the component alter soil response? | Measured point, shank, wing, disc, blade, or roller dimensions with force or soil-profile outcomes | Geometry not reported or only nominal implement name given |
| Operating regime | How do depth, speed, and spacing modify performance? | Defined depth, speed, spacing, load, and soil condition | One-factor trials with incomplete operating conditions |
| Soil state | Under which soil conditions is a result transferable? | Texture, moisture, density, penetration resistance, or compaction depth reported | Soil description limited to location or broad soil class |
| Mechanical response | Does the configuration work as a machine? | Draft, power, disturbed profile, soil flow, residue flow, or depth stability measured | Visual assessment alone |
| Physical and hydraulic response | Does the operation improve the intended root-zone function? | Bulk density, resistance, porosity, infiltration, or water storage assessed | Only immediate surface appearance reported |
| Agronomic response | Does the change translate into crop performance? | Root, emergence, WUE, or yield data reported over a defined season or years | Yield presented without soil or machine context |
| Validation level | How robust is the conclusion? | Field validation, calibrated soil-bin work, or cross-method agreement | Uncalibrated numerical modeling or single-site observation |
Table 2.
Functional boundaries among localized, strip-based, and intelligent seedbed-preparation systems.
Table 2.
Functional boundaries among localized, strip-based, and intelligent seedbed-preparation systems.
| System | Primary objective | Spatial pattern of disturbance | Typical soil-engaging components | Key design criterion |
|---|---|---|---|---|
| Localized tillage | Loosen a restricted root-zone area | Discrete zones or narrow bands | Tines, chisels, discs, narrow subsoilers | Targeted soil disruption with limited field disturbance |
| Strip tillage | Prepare crop strips while retaining inter-row cover | Continuous treated strips aligned with rows | Discs, residue managers, shanks, rollers | Seed-zone condition plus inter-row residue retention |
| Zone tillage | Improve soil volume explored by roots | Band around or below crop rows | Sweeps, subsoilers, fertilizer tines | Root-zone continuity and access to water and nutrients |
| Deep localized loosening | Fracture a compacted subsurface layer | Narrow deep corridors | Chisels, subsoiler shanks, winged points | Deep fracture without unnecessary surface heave |
| Layered tillage | Treat upper and lower horizons differently | Multiple depths in one pass | Sweeps combined with deep tines or chisels | Compatible soil flows across horizons |
| Conservation tillage | Reduce disturbance and retain cover | Variable: strips, bands, or reduced full width | Low-disturbance shanks, discs, rollers | Residue protection, erosion reduction, energy economy |
Table 3.
Design, operating, and controllable variables for localized seedbed preparation.
| Variable | Primary mechanical effect | Potential benefit | Failure mode if poorly selected |
|---|---|---|---|
| Working depth | Changes engaged soil volume and draft | Reaches restrictive layer and deep root pathway | Too shallow: no subsoil effect; too deep: energy loss and unstable operation |
| Rake or mounting angle | Changes force direction, lifting, and soil flow | Controls fracture and strip shape | Insufficient fracture or excessive draft and heave |
| Point and wing width | Changes contact area and lateral disturbance | Creates required loosened width | Untreated interspaces or unnecessary energy demand |
| Shank curvature and thickness | Changes stress concentration and soil-tool interface | Improves penetration and residue flow | Compaction ahead of tool, wear, or blockage |
| Lateral spacing | Controls interaction of failure zones | Continuous root-zone corridor | Untreated corridors or excessive overlap |
| Longitudinal arrangement | Controls interference among discs, tines, and rollers | Stable soil and residue flow | Blockage, ridging, irregular strip shape |
| Forward speed | Changes dynamic loading and power | Field capacity and controlled fragmentation | Soil throw, poor depth control, high power demand |
| Roller load | Changes clod breakdown and consolidation | Uniform seedbed and contact near seed zone | Surface compaction or high rolling resistance |
Table 4.
Functional roles of primary and secondary components in intelligent seedbed-preparation machinery [31,63].
| Component | Primary action | Engineering advantage | Main limitation | Best-fit use |
|---|---|---|---|---|
| Cutting disc/coulter | Cuts residue and opens narrow surface zone | Improves residue flow before shank | Limited deep fracture | High-residue strip preparation |
| Straight tine | Penetrates and fractures soil locally | Simple and narrow disturbance | May leave untreated interspaces | Localized deep loosening |
| Curved/parabolic shank | Lifts and fractures soil progressively | Potentially smoother soil flow | Geometry-sensitive draft | Deep strip tillage |
| Chisel point | Concentrates penetration at depth | Effective restrictive-layer disruption | Limited upper-layer conditioning | Subsoiling and deep loosening |
| Winged point | Extends lateral deep fracture | Wider root-zone treatment | Higher draft and heave risk | Compacted subsurface horizons |
| Sweep/flat blade | Shallow cutting and horizontal loosening | Wide coverage and layered treatment | High draft at large widths | Upper-layer treatment |
| Rotary element | Dynamic fragmentation and transport | Strong clod reduction | High power requirement | Specialized cloddy or mixed soils |
| Roller/closing element | Clod breakdown, leveling, and firming | Improves seedbed uniformity | Potential surface compaction | Final strip conditioning |
Table 5.
Selected within-study quantitative anchors; the complete comparison and transferability fields are reported in Supplementary Table S9.
Table 5.
Selected within-study quantitative anchors; the complete comparison and transferability fields are reported in Supplementary Table S9.
| Study / system | Tested boundary | Within-study response | Supported inference | Limit |
|---|---|---|---|---|
| Strip-width comparison [10] | 20, 30, and 40 cm strips | 40 cm was 2.51 °C warmer than 20 cm; row water content declined with width | Width couples warming and water loss | One soil-residue-climate context |
| Nine-year semi-arid tillage [12] | Dry, normal, and wet years | Subsoiling WUE benefit: 11.7%, 8.5%, and 6.0% | Benefit depended on rainfall class | System comparison; geometry not isolated |
| Optimized vineyard body [32] | 25–30 cm; 4–5 km h⁻¹ | 82–85% <50-mm aggregates; 5.6–6.3 kN draft; resistance −43% to −47% | Defined geometry formed a measurable corridor | One perennial-row soil and immediate response |
| Toothed roller [31] | 0.45–0.46 m; 13–15 teeth | <50-mm fraction: 76.1% to 88.0%; roughness: 6.8 to 3.7 cm | Secondary geometry improved conditioning | Water state and reconsolidation require validation |
| Bionic auxiliary body [30] | 40.66-mm blade; 50-mm depth | Study-specific fragmentation index: 83.0% to 94.54% | Incremental fragmentation within tested range | Author-defined metric; no cross-study pooling |
| Closed-loop strip unit [50] | 6–12 km h⁻¹; 6–12 cm depth | Clearing, crushing, depth, and width stability >90% | Control stabilized geometric targets | Water and crop functions were not established |
Table 7.
Complementary methods for component optimization, calibration, and adaptive operation.
| Method | Primary output | Main strength | Main limitation | Best use in design sequence |
|---|---|---|---|---|
| Field experiment | Draft, soil condition, water response, yield | Direct practical relevance | High cost and environmental variability | Final validation and multi-season assessment |
| Soil-bin experiment | Forces, soil profile, controlled failure | Controlled soil condition | Simplified soil environment | Comparing tool geometries and operating modes |
| Analytical model | Force estimates and idealized failure zone | Fast and transparent | Simplifies real soil structure | Initial screening of dimensions and spacing |
| Finite element modeling | Stress and strain fields | Continuum-mechanics interpretation | Limited representation of large particle flow | Blade orientation and stress analysis |
| Discrete element modeling | Particle flow, contact force, soil movement | Detailed comparative soil-tool interaction | Calibration sensitive and computationally demanding | Geometry and multi-element optimization |
| Response-surface or multi-criteria analysis | Interaction and optimum ranges | Quantifies factor interactions | Requires robust experimental design | Refinement after prototype or field dataset exists |
Table 8.
Soil- and scenario-specific decision matrix for component selection, adjustment, and validation.
Table 8.
Soil- and scenario-specific decision matrix for component selection, adjustment, and validation.
| Field diagnosis | Required function | Suitable configuration | Parameters to optimize | Validation indicators |
|---|---|---|---|---|
| High residue; no deep pan | Cut residue; prepare shallow seed strip | Coulter/residue manager + shallow tine + light roller | Disc depth/angle; strip width; roller load | Hairpinning; cover; strip continuity; emergence |
| Coarse sandy or abrasive soil | Stable targeted fracture with limited exposure | Narrow low-disturbance point; replaceable protected edge | Depth; speed; spacing; wear threshold | Draft drift; collapse; aggregate loss; retained cover |
| Cohesive clay near wet limit | Avoid smearing while treating diagnosed layer | Slender shank or postponed operation; low-load closer | Moisture limit; rake; depth; actuator rate | Adhesion; smearing; sub-tool resistance; blockage |
| Saline-alkali or crusted profile | Restore entry and root continuity without dispersive overworking | Shallow crust treatment + diagnosed localized loosening | Water state; depth; disturbed width; irrigation timing | Infiltration; crust recurrence; salinity profile; stability |
| Plow pan below crop row | Fracture restrictive horizon | Narrow chisel; wing only within traction limit | Point/wing geometry; depth; lateral spacing | Profile continuity; draft; below-tool resistance |
| Irrigated semi-arid row | Align root corridor with wetting zone and retain inter-row cover | Localized deep strip below crop row | Strip width; shank depth; residue setting | Wetting overlap; root-zone water; cover; traffic |
Disclaimer/Publisher’s Note: The statements, opinions and data contained in all publications are solely those of the individual author(s) and contributor(s) and not of MDPI and/or the editor(s). MDPI and/or the editor(s) disclaim responsibility for any injury to people or property resulting from any ideas, methods, instructions or products referred to in the content. |
© 2026 by the authors. Licensee MDPI, Basel, Switzerland. This article is an open access article distributed under the terms and conditions of the Creative Commons Attribution (CC BY) license (http://creativecommons.org/licenses/by/4.0/).
Copyright: This open access article is published under a Creative Commons CC BY 4.0 license, which permit the free download, distribution, and reuse, provided that the author and preprint are cited in any reuse.