
Submitted:
29 August 2026
Posted:
31 August 2026
You are already at the latest version
Abstract
Background: An Anticipated Transient Without Scram (ATWS) represents one of the most severe conditions in nuclear reactor operations, escalating any concurrent malfunction into a Beyond Design Basis Accident (BDBA). When coupled with dual Large-Break Loss of Coolant Accidents (LBLOCA), station blackout, and initial fuel failure, the thermal-hydraulic stability and containment integrity of the reactor are severely compromised. Materials and Methods: In this study, the transient behavior and safety response of a Russian Gen-III+ VVER-1200 reactor were simulated using the IAEA-recommended Personal Computer Transient Analyzer (PCTran). An unmitigated accident scenario featuring simultaneous 1000cm2 breaks in both the hot and cold legs, failure of the SCRAM mechanism, a total loss of AC power, and 5% fuel failure at power was evaluated over a 300-second simulation window. Model performance was benchmarked and validated against Final Safety Analysis Report (FSAR) core flow data. Results: The simulation demonstrates that the Departure from Nucleate Boiling Ratio (DNBR) dropped below 1.0 within 30 seconds, triggering an immediate boiling crisis due to sustained core power. Complete steam voiding across the reactor core occurred in 80 seconds. Consequently, reactor building pressure exceeded the 5-bar design threshold in only 90 seconds and reached 14.93 bar at 300 seconds, while containment temperatures peaked at 193.7 °C. Although peak fuel and cladding temperatures remained within design limits to prevent immediate core meltdown, the rapid containment over-pressurization severely restricts available operator response windows, posing a critical containment failure hazard. Conclusion: Simultaneous ATWS, dual-leg LBLOCA with fuel failure, and station blackout in a VVER-1200 induce a critical boiling crisis within 30 seconds and full core voiding in 80 seconds due to unmitigated core power. Although passive systems prevent immediate fuel and cladding meltdown, containment pressure breaches the 5-bar design threshold in just 90 seconds, highlighting that containment over-pressurization rather than core degradation is the most immediate threat requiring enhanced passive mitigation.
Keywords:
VVER-1200
; PCTran
; beyond design basis accident (BDBA)
; ATWS
; LBLOCA
; station blackout
; containment integrity
I. Introduction
An Anticipated Transient Without Scram (ATWS) represents one of the most severe conditions, occurring when an expected transient fails to trigger the emergency reactor shutdown mechanism [1]. The SCRAM mechanism serves as a primary protective barrier, preventing catastrophic reactor damage caused by uncontrolled power escalation Consequently, any operational accident coinciding with an ATWS escalates into a Beyond Design Basis Accident (BDBA). Because of this, investigators widely examine ATWS events to pinpoint critical enhancements needed in reactor protection mechanisms [1,2,3]. When concurrent with dual Large-Break Loss of Coolant Accidents (LBLOCA) across both the hot and cold legs, containment pressure can surge substantially [4], elevating the risk of structural containment failure beyond its 5-bar design threshold [5]. Furthermore, the simultaneous occurrence of a station blackout (loss of AC power) alongside extensive fuel failure during power operation severely compounds the complexity of analyzing the Hence, research must target these extreme scenarios to establish effective strategies for mitigating and preventing BDBAs.
II. Material and Methods
The Personal Computer Transient Analyzer (PCTran) serves as a PC-based modeling code capable of simulating severe transients and complex accident conditions to assess nuclear power plant behavior under various preconfigured malfunctions [5,6]. The International Atomic Energy Agency (IAEA) officially endorses this computational tool for nuclear power plant analysis [7]. By running simulations faster than real-time progression, PCTran aids in evaluating nuclear emergency dynamics and formulating corresponding protective strategies [6,8]. To support the formulation of robust emergency response and evacuation measures, PCTran generates two primary categories of output: in-plant transient state parameters and off-site radiological dose dispersion computed via the Gaussian Puff model [8]. As a result, it functions as a potent computational asset for evaluating severe accident trajectories and developing targeted mitigation frameworks.
Transient Analysis in PCTran VVER 1200
PCTran serves as a widely adopted simulation platform for assessing the transient dynamics of nuclear power plants. A substantial body of literature relies on the PCTran code to examine plant responses across diverse transient states and accident sequences. The following literature review synthesizes key findings and insights from these published studies, several of which directly informed the methodologies and objectives of the present investigation.
An exercise handbook for the PCTran simulator was issued by the International Atomic Energy Agency (IAEA), detailing technical guidelines for training modules on diverse transient and accident regimes using the PCTran VVER-1200 model [7]. The publication covers baseline operating parameters for pressurized water reactors alongside foundational procedures for executing simulations across various operational states and equipment malfunction scenarios.
Li-chi et al. (2004) outlined the analytical capabilities and operational scope of the PCTran code across various accident regimes, emphasizing its capacity to simulate nuclear plant responses faster than real-time progression [9]. Their study chronicled the evolution and deployment of PCTran since its inception in 1985, demonstrating its utility in severe accident management and predictive scenario analysis. Additionally, the authors evaluated several built-in physical modeling modules within the simulator, covering critical transient phenomena such as metal–water reactions, corium–concrete interactions and containment degradation mechanisms.
Ibrahim et al. (2013) conducted transient analyses on a pressurized water reactor (PWR) using the PCTran simulator to model a comprehensive series of transient and accident conditions [10]. Their findings demonstrated that a Loss of Coolant Accident (LOCA) induced rapid depressurization of the primary coolant, prompting automatic reactor shutdown. Furthermore, during a simulated turbine trip, the system exhibited a sharp power decline at a rate of 14.3 MW/s, while a fuel handling accident scenario resulted in critical, unacceptable levels of radiological release.
Khan and Islam (2019) evaluated the thermal-hydraulic behavior of a VVER-1200 reactor under inadvertent control rod withdrawal conditions utilizing the PCTran VVER-1200 simulation platform [11]. By examining transient dynamics across various positive reactivity insertions, they established the operational threshold to prevent core structural damage, determining that the reactor core could safely withstand a maximum positive reactivity insertion limit of 8.8% without component failure.
Saha et al. (2019) investigated the consequences of steam generator tube rupture (SGTR) events in VVER-1200 reactors through transient simulations in PCTran VVER-1200 [12]. Under a complete 100% tube rupture scenario, the plant maintained operational stability without initiating an automatic reactor trip, demonstrating that the robust passive and inherent safety design of VVER-1200 technology effectively accommodates such events.
Nath et al. (2020) utilized PCTran to analyze a primary circuit hot-leg LOCA featuring a 507 cm2 break coupled with a station blackout (SBO) in a VVER-1200 unit [13]. The authors modeled scenarios with and without emergency core cooling system (ECCS) availability, finding that the emergency water storage tank (EWST) supplied adequate core inventory to mitigate consequences even during a concurrent LOCA and SBO event.
Bagheri and Zohuri (2022) examined severe accident progressions in VVER-1200 systems using the PCTran VVER-1200 code [14]. Their assessment confirmed the overall resilience of the plant across multiple safety envelopes, identifying catastrophic vulnerability only under the compound failure of concurrent coolant loss, lower reactor plenum fracture and complete ECCS unavailability.
Qi et al. (2022) addressed the scarcity of open-source nuclear power plant data by generating simulated datasets with the PCTran-PWR3LP code [15]. After benchmarking the simulator against empirical data from the Fukushima accident, they evaluated key operational transients, including load rejection and large-break LOCAs, ultimately verifying PCTran as an accurate and dependable platform for nuclear accident modeling.
Accident Scenario Modelling in PCTran VVER 1200
The Personal Computer Transient Analyzer (PCTran) is an IAEA-endorsed computational tool designed to model nuclear reactor behavior across complex transient and accident states, delivering predictive data faster than real-time progression. In this work, we evaluated the transient response of VVER-1200 safety systems using the PCTran VVER-1200 module, benchmarking the results against the Final Safety Analysis Report (FSAR) of a reference VVER-1200 plant.
To investigate an extreme Beyond Design Basis Accident (BDBA), we modeled an unmitigated transient scenario combining a dual-leg Large Break Loss of Coolant Accident (LBLOCA) with a 1000cm2 rupture in both the hot and cold legs alongside a failure to SCRAM, a total station blackout, and 5% initial fuel failure. Under these constraints, all active systems were rendered inoperative, leaving the reactor solely reliant on its passive safety mechanisms. The accident sequence was configured using PCTran’s built-in malfunction settings and executed for the standard single-run duration of 300 seconds following break initiation. The simulator’s resulting transient plots and output logs were then gathered to analyze the subsequent thermal-hydraulic dynamics, focusing on the rapid pressure and temperature escalation within the containment structure. Figure 1 shows the GUI of PCTran VVER 1200 simulator.
Power development in a nuclear reactor is proportional to the number of nuclear fission reactions per unit time. Typical chain reaction of fission based nuclear power reactor is given in equation (1);
Here X1 and X2 are products of nuclear fission reaction. Z1 and A1 are the atomic number and mass number of X1 respectively. Z2 and A2 are the atomic number and mass number of X2 respectively. The extra neutron produced from every fission reaction sustains chain reaction. The change in neutron population and neutron flux in a finite reactor can be determined by effective neutron multiplication factor (keff ). keff is given by equation (2);
keff for a thermal reactor depends on six factors. The six-factor formula is shown in equation (3);
keff=ε.p.f.η.LF.LT
Here ε is the fast fission factor, p is the resonance escape probability, f is the thermal utilization factor, η is the neutron reproduction factor, LF is the fast neutron non-leakage factor and LT is the thermal neutron non-leakage factor. A reactor is in steady-state condition when keff = 1. The reactor is supercritical if keff is greater than 1. The reactor is sub-critical if keff is less than 1. However, it is considered to be more convenient using reactivity of a reactor (ρ) rather than effective neutron multiplication factor (keff ). The reactivity (ρ) of a reactor is expressed by equation (4);
A reactor is considered to be critical if ρ equals to 0. The reactor is considered to be sub-critical when ρ is less than 0 and supercritical when ρ is greater than 0. Though reactivity is a unit less quantity, different units are used to express reactivity such as % Δk/k, pcm etc.
III. Result
Russian Gen-III+ VVER 1200 technology is a pressurized water type reactor technology with inherent passive safety features and core catcher for core melting in case of beyond design basis accident. Inherent properties of VVER 1200 technology are provided in Table no 1. Nine parameters were investigated for the accident scenario analysis. These parameters are given in Table no 2. Table no 3 shows transient report of the accident scenario for the initial 300 seconds.

Table 1.
Inherent features of VVER 1200 reactor technology.
| No | Feature | Quantity |
|---|---|---|
| 1 | Nominal Thermal Power (MW) | 3200 |
| 2 | Reactor Coolant Inventory (m3) | 290 |
| 3 | Pressurizer Coolant Inventory (m3) | 55 |
| 4 | Reactor Core Outlet Pressure (MPa) | 16.2 |
| 5 | Reactor Coolant Inlet Temperature (°C) | 298.2 |
| 6 | Reactor Coolant Outlet Temperature (°C) | 328.9 |
| 7 | Coolant Flow Rate inside Reactor (m3/hr) | 86000 |
| 8 | Average Primary Circuit Coolant Temperature (°C) | 313 |
| 9 | Maximum Fuel Temperature (°C) | 1800 |
| 10 | Maximum Cladding Temperature (°C) | 610.8 |
| 11 | Number of Fuel Assembly (FA) | 163 |
| 12 | Number of Fuel Rods in Each Fuel Assembly | 312 |
Table 2.
Parameters considered for accident scenario analysis.
| No. | Parameter | Unit |
|---|---|---|
| 1. | RCS Average Temperature | °C |
| 2. | Void of RCS | % |
| 3. | Flow Rate of Emergency Core Cooling System (ECCS) | kg/s |
| 4. | Pressure Reactor Building | bar |
| 5. | Temperature Reactor Building | °C |
| 6. | Departure from Nucleate Boiling Ratio (DNBR) | - |
| 7. | Core Thermal Power | % |
| 8. | Peak Fuel Temperature | °C |
| 9. | Peak Cladding Temperature | °C |
Table 3.
Transient report considering LBLOCA with ATWS, Loss of AC Power and Fuel failure.
| No. | Event | Time (sec) |
| 1. | LOCA at hot-leg (break size 1000 cm2) | 0.5 |
| 2. | Anticipated Transient Without SCRAM (ATWS) | 0.5 |
| 3. | Loss of AC Power (Station Blackout) | 0.5 |
| 4. | Fuel Failure at Power (5%) | 0.5 |
| 5. | PZR Backup Heater Capacity Change (100%) | 1.5 |
| 6. | Reactor coolant pump A and B trip | 2.0 |
| 7. | All Main Feedwater (MFW) Pumps trip | 2.0 |
| 8. | Turbine trip | 2.5 |
| 9. | 60% Load Rejection | 3.0 |
| 10. | Containment Spray start at high Reactor Building (RB) Press 1.30 psia | 4.0 |
| 11. | Low Steam Generator Level 2.1 m | 56.0 |
| 12. | Diesel Generator A Starts with 60.0 Sec Delay | 61.0 |
| 13. | Turbine-Driven Auxiliary Feedwater (TDAFW) Pump #1 start | 61.5 |
| 14. | Turbine-Driven Auxiliary Feedwater (TDAFW) Pump #2 start | 61.5 |
| 15. | Fan Coolers Starts 10.0 bar | 193.0 |
Simulation results for different parameters were analyzed and presented in graphs from Figure 2 to Figure 10. Figure 2 represents a comparison between flow rates of reactor coolant for loop A (WRCA) and loop B (WRCB). Both of the loops showed drastic collapse of coolant flow rates within 150 seconds from the LBLOCA accident which indicates LBLOCA itself. Figure 3 presents changes in reactor building pressure with respect to time. From Figure 3, it may be observed that the reactor building pressure kept increasing up to 14.93 bar within the 300 seconds simulation time. The containment pressure crosses 5bar, the design pressure, in only 90 seconds after the accident. Figure 4 shows change in reactor building temperature with respect to time for the accident scenario. From Figure 4, it may be observed that the reactor building temperature rises up to 193.7 °C in only 300 seconds, Thus, the containment will undergo serious thermal stress due to the temperature gradient.
From Figure 5, it may be observed that during the first few minutes from the accident, the core power level fluctuated due to the change in moderator volume, core temperature, activation and deactivation of different safety systems, etc. However, it starts decreasing at moderately linear rate from 81% to 71% between 150 seconds to 300 seconds.
From Figure 6, it may be realized that average temperature of the reactor coolant system changed abruptly for the first few seconds, like the reactor thermal power. It started increasing rapidly from 319.32 °C to 329.40 °C between 5 and 15 seconds. After reaching peak temperature of 329.40 °C, core average temperature started decreasing and reached 310.43 °C after 60 seconds. After that, temperature increased slowly till 185 seconds to 319.20 °C and then decreased gradually till 300 seconds to minimum temperature 314.46 °C.
From Figure 7, it is observed that the core makeup water supply from ECCS became 27 kg/s at 5 seconds, after which it remained static. Further increase in ECCS supply was not possible because of the rapid formation of void inside the reactor core, as shown in Figure 8, and the persistent high temperature of the fuel elements. Sudden supply of cold water from ECCS may result in core meltdown, as observed in the case of Three Mile Island accident.
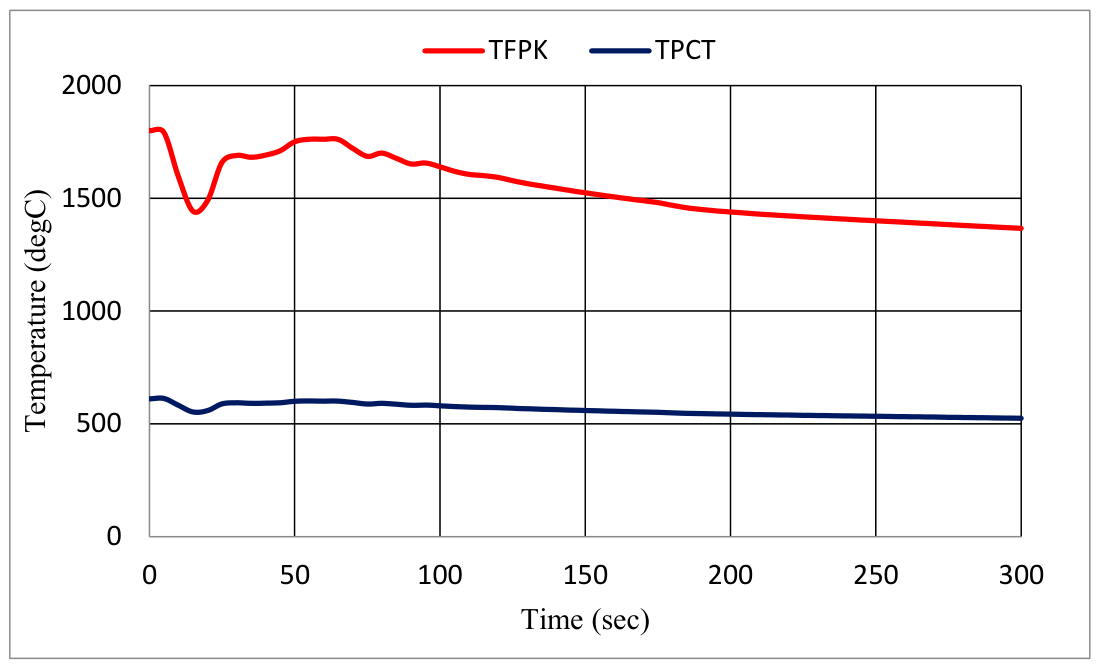
From Figure 9, it is identified that the DNBR became less than 1.0 in just 30 seconds, indicating a boiling crisis. However, the fuel (TFPK) and cladding (TPCT) temperature remained below their design limits, as shown in Figure 10. Thus, despite the boiling crisis, the core could be prevented from meltdown.
Figure 10.
Comparison between change in fuel peak and cladding peak temperatures
4.3. Validation of PCTran VVER 1200 Analysis
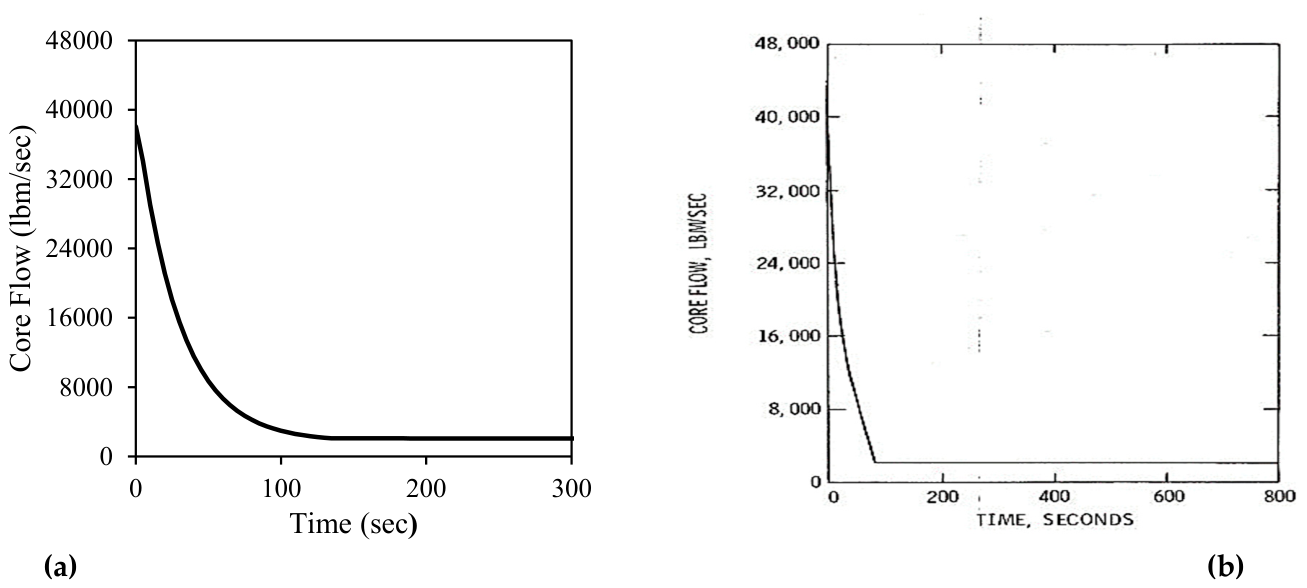
To validate the PCTran VVER-1200 simulation, the modeled reactor core flow dynamics were benchmarked against reference data from the Final Safety Analysis Report (FSAR) of a commercial pressurized water reactor (San Diego Gas and Electric Company, 1976) [16]. As illustrated in Figure 11, the simulation outputs demonstrate strong consistency with the FSAR baseline trends. The slight discrepancies observed can be attributed to the advanced passive safety mechanisms integrated into the VVER-1200 design.
IV. Conclusion
In the accident scenario where SCRAM could not be initiated, the Departure from Nucleate Boiling Ratio (DNBR) dropped below 1.0 within just 30 seconds, precipitating an early boiling crisis driven by sustained high core thermal power. Complete steam voiding across the active core occurred in merely 80 seconds, substantially degrading the integrity of the core structure. Simultaneously, containment pressure exceeded the 5-bar design threshold in only 90 seconds and continued to escalate rapidly. This compressed timeline drastically restricts operator intervention windows, making containment breach mitigation exceptionally challenging during such beyond-design-basis transients.
References
- Sotsu, Masutake; Hazama, Taira. Uncertainty Evaluation of Anticipated Transient without Scram Plant Response in the Monju Reactor Considering Reactivity Coefficients within the Design Range. J. Energy Power Eng. 2019, 13, 393–403. [Google Scholar] [CrossRef] [PubMed]
- Mehta, Manish; et al. Thermal Hydraulic Evaluation of Anticipated Transients Without Scram (ATWS) Scenario for VVER-1000. In Proceedings of the 25th National and 3rd International ISHMT-ASTFE Heat and Mass Transfer Conference Begel House Inc, 2019. [Google Scholar]
- Soares, Alexandre de Souza; Alvim, Antonio CM. Analysis of the anticipated transient without scram (ATWS) initiated by emergency power mode through the full scope simulator. Kerntechnik 2022, 87.2, 187–195. [Google Scholar] [CrossRef]
- Hossain, M.; Khan, A. H.; Sarkar, M. A. R. A numerical approach for designing the primary containment building of a pressurized water reactor. Trans. Am. Nucl. Soc. 2018, 118, 809–810. [Google Scholar]
- Khan, A. H.; Al Imran, M. I.; Fyza, N.; Sarkar, M. A. R. A numerical study on the transient response of VVER-1200 plant parameters during a large-break loss of coolant accident. Indian J. Sci. Technol. 2019, 12, 27. [Google Scholar] [CrossRef]
- Cheng, Y. H.; Shih, C.; Chiang, S. C.; Weng, T. L. Atmospheric puff model developments in PCTRAN. 15th International Conference on Nuclear Engineering, 2007. [Google Scholar]
- International Atomic Energy Agency. PCTRAN Generic Pressurized Water Reactor Simulator Exercise Handbook. 2019. [Google Scholar] [PubMed]
- Shih, C.; Chiu, M. H.; Cheng, Y. H.; Chiang, S. C.; Weng, T. L. The application of PCTRAN in nuclear power plant emergency planning. 15th Pacific Basin Nuclear Conference, Sydney, Australia, 2006. [Google Scholar]
- Li-Chi, C. P.; Link, J. M. No. INIS-XA-N--080; PCTRAN-3: The third generation of personal computer-based plant analyzer for severe accident management. 2004.
- Ibrahim, S. J.; Ewim, D. R.; Edeoja, O. A. Simulation of safety and transient analysis of a pressurized water reactor using the personal computer transient analyzer. Leonardo Electron. J. Pract. Technol. 2013, 22, 93–105. [Google Scholar]
- Khan, A. H.; Islam, M. S. A Pctran-Based Investigation On The Effect of Inadvertent Control Rod Withdrawal On The Thermal Hydraulic Parameters Of A Vver-1200 Nuclear Power Reactor. Acta Mech. Malays. 2019, 2(2), 32–38. [Google Scholar] [CrossRef]
- Saha, A.; Fyza, N.; Hossain, A.; Sarkar, M. R. Simulation of tube rupture in steam generator and transient analysis of VVER-1200 using PCTRAN. Energy Procedia 2019, 160, 162–169. [Google Scholar] [CrossRef]
- Nath, P. D.; Rahman, K. M.; Al Bari, M. A. Investigation on Thermal Hydraulic Parameters of a Nuclear Reactor (VVER-1200) due to Loss of Coolant Accident with Station Blackout and Failure of Emergency Core Cooling System. Int. Conf. Mech. Ind. Energy Eng. Khulna, Bangladesh, 2020; p. 19. [Google Scholar]
- Bagheri, A. A.; Zohuri, B. Study on Severe Accidents of the New Generation WWER-1200 Reactor. J. Mater. Sci. Manuf. Res. 2022, 3, 1–7. [Google Scholar] [CrossRef] [PubMed]
- Qi, B.; Xiao, X.; Liang, J.; Po, L. C. C.; Zhang, L.; Tong, J. An open time-series simulated dataset covering various accidents for nuclear power plants. Sci. Data 2022, 9(1), 766. [Google Scholar] [CrossRef] [PubMed]
- San Diego Gas and Electric Company. Final Safety Analysis Report (FSAR) of San Onofre Nuclear Generating Sation Units 2 and 3. 1976; volume 15. [Google Scholar]
Figure 1.
Graphical User Interface (GUI) of PCTran Simulator.
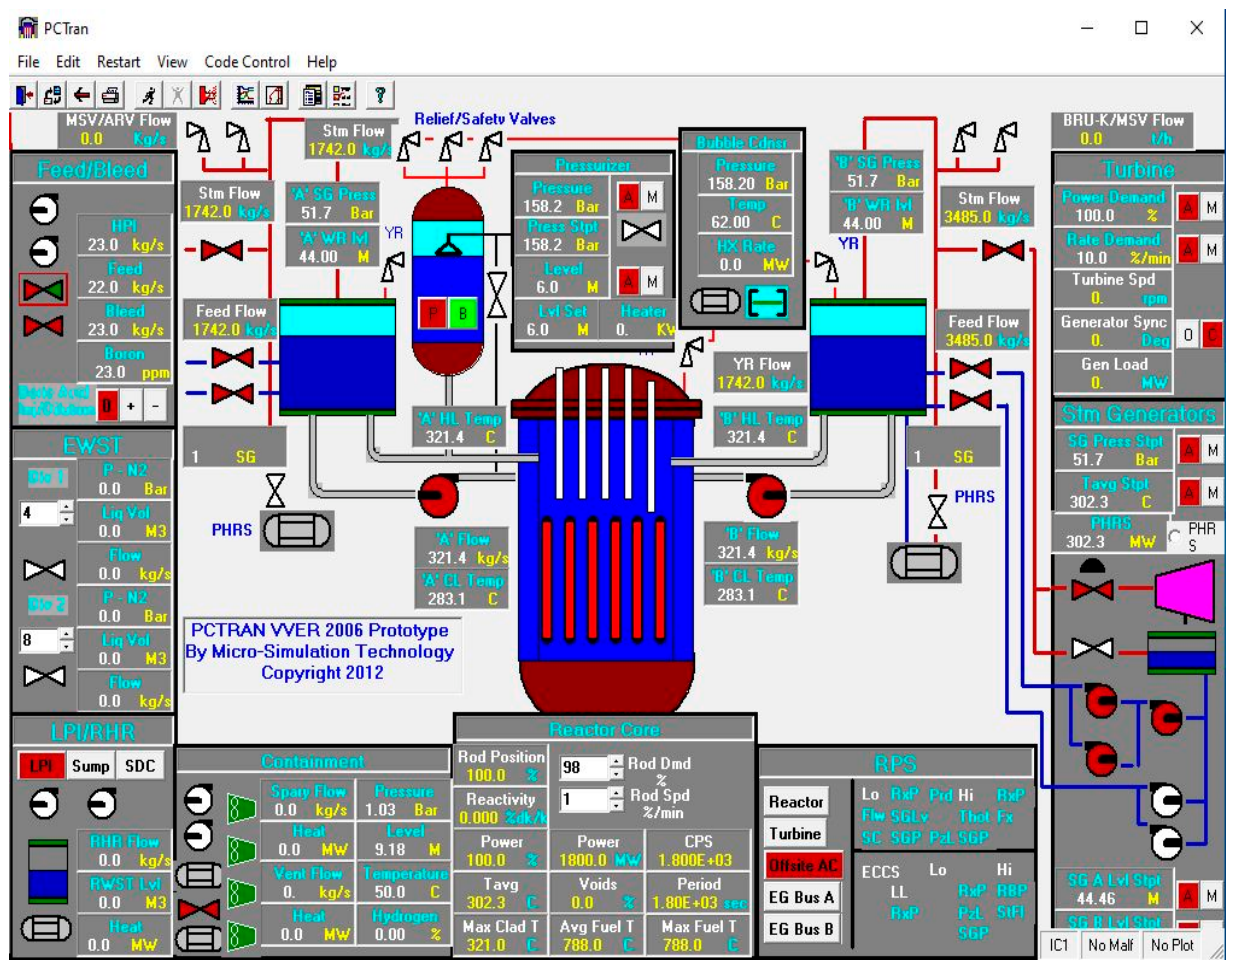
Figure 2.
Comparison between flow rates of reactor coolant loop A and B.
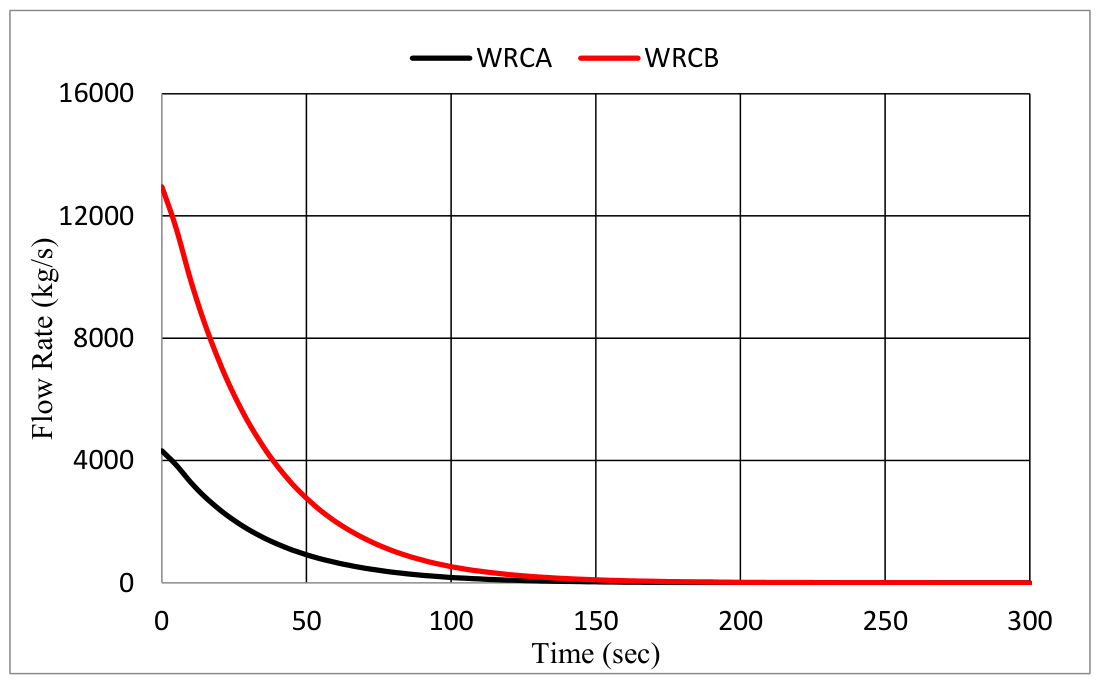
Figure 3.
Change in reactor building pressure with respect to time.
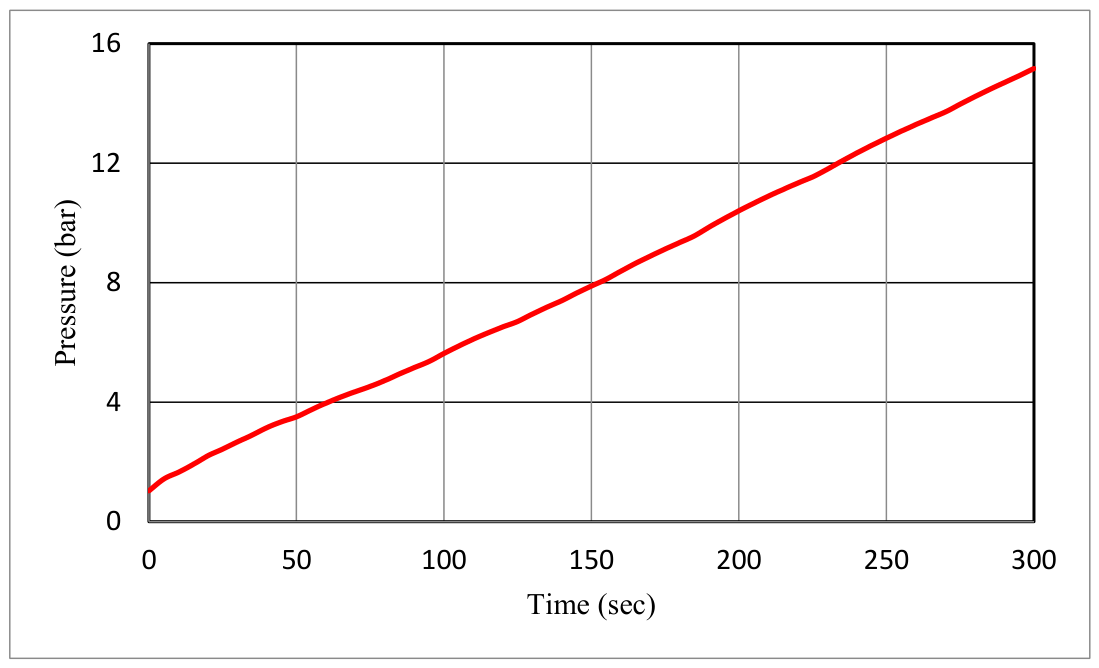
Figure 4.
Change in reactor building temperature with respect to time.
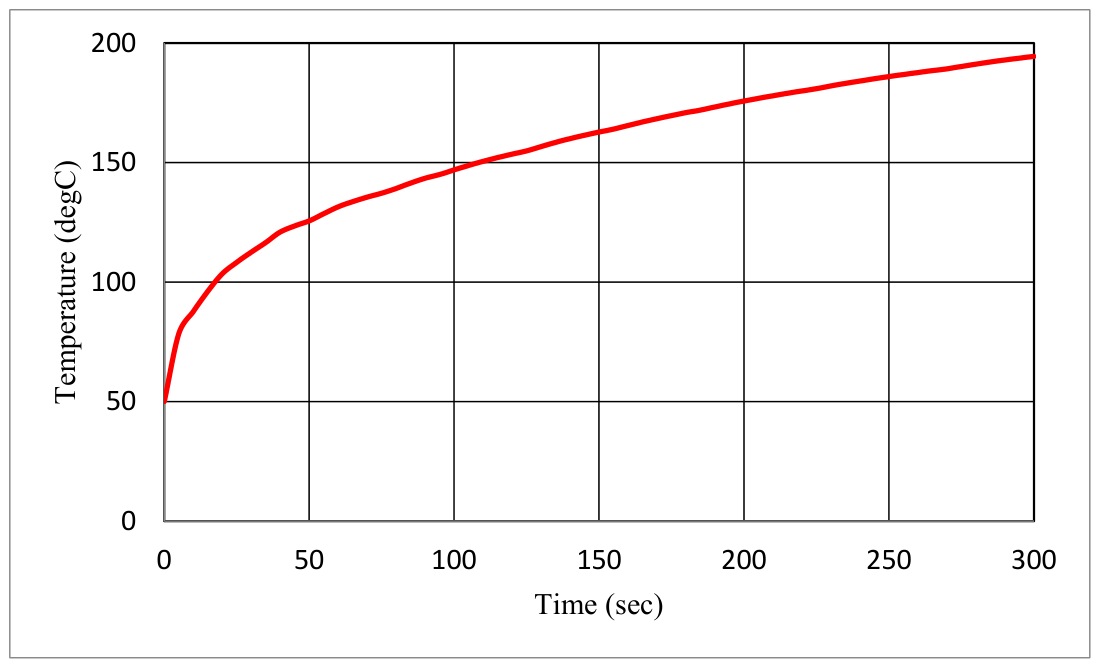
Figure 5.
Change in reactor core thermal power with respect to time.
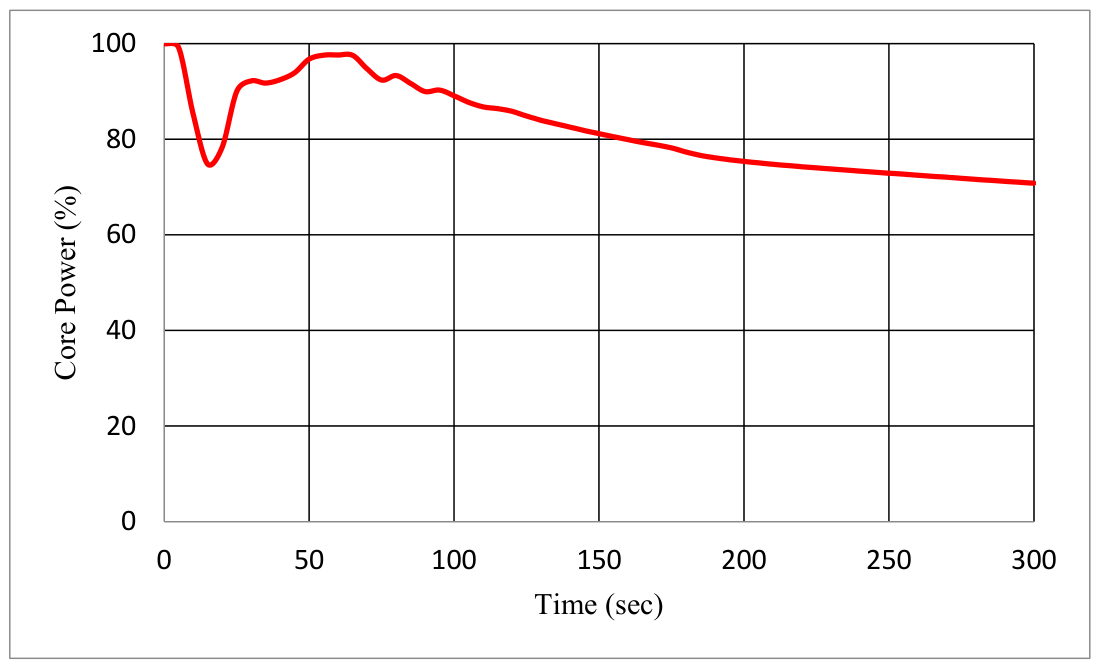
Figure 6.
Change in reactor core average temperature with respect to time.
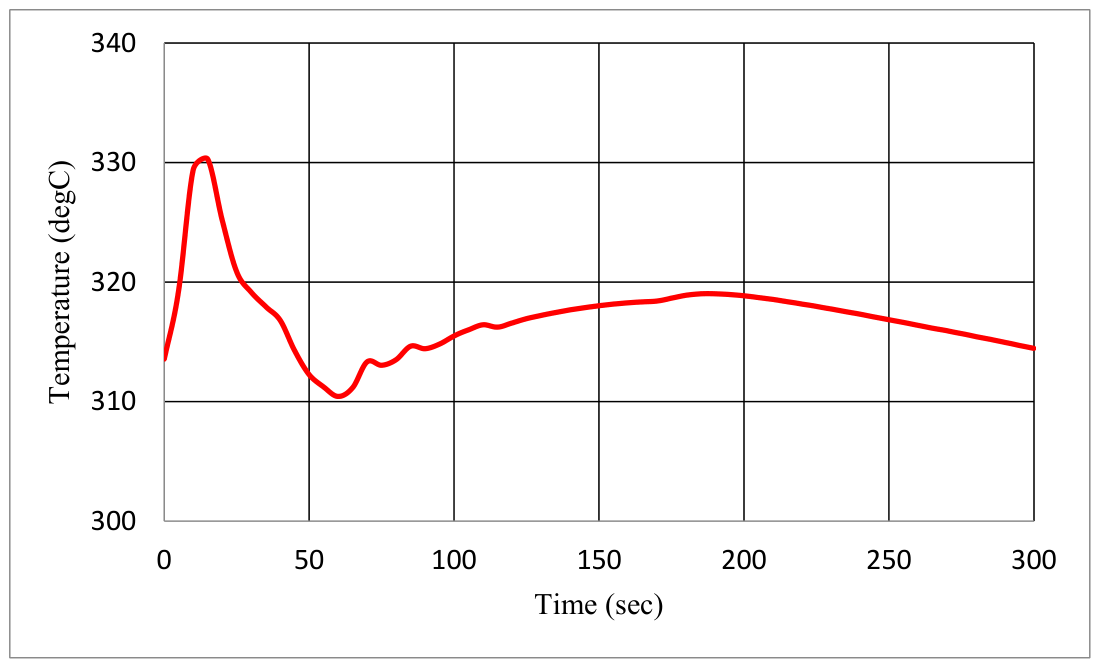
Figure 7.
Change in flow rate of ECCS with respect to time.
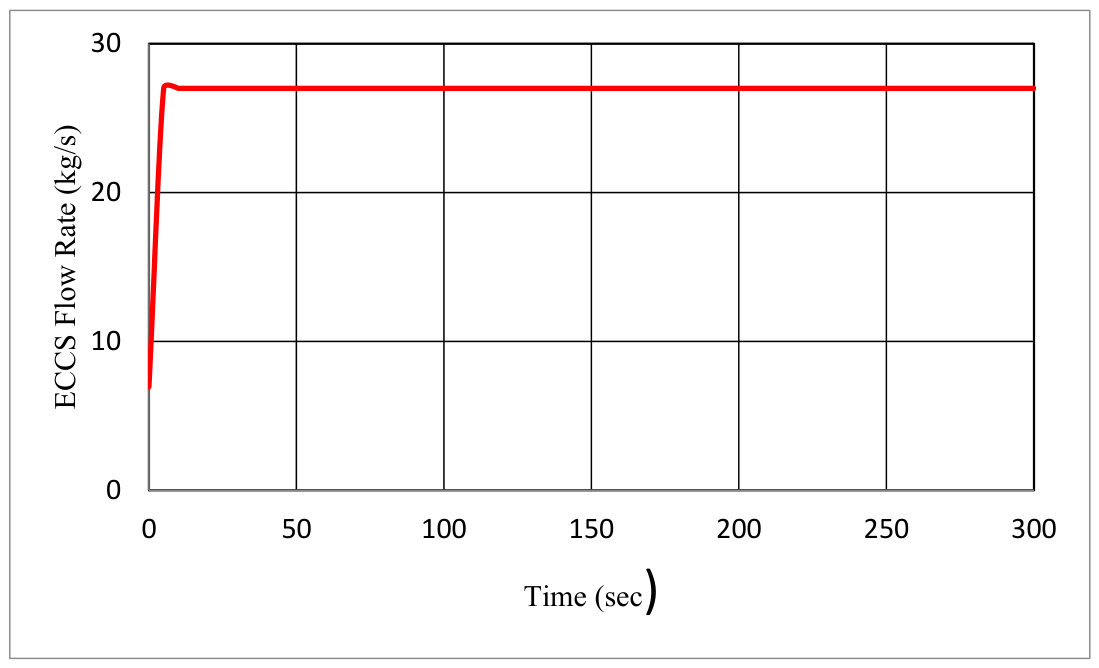
Figure 8.
Change in percentage of core void with respect to time.
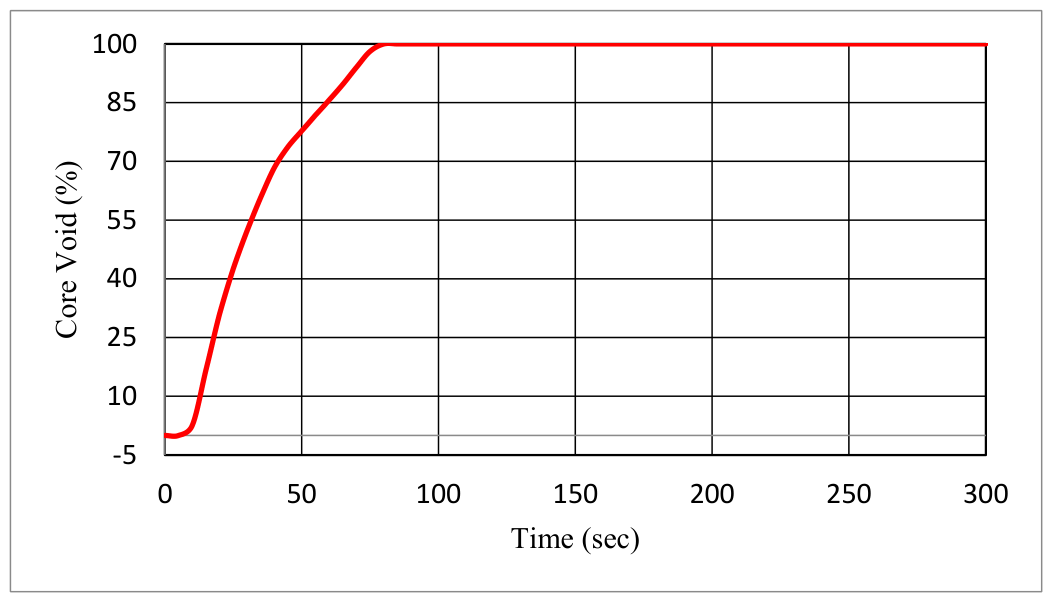
Figure 9.
Change in DNBR with respect to time.
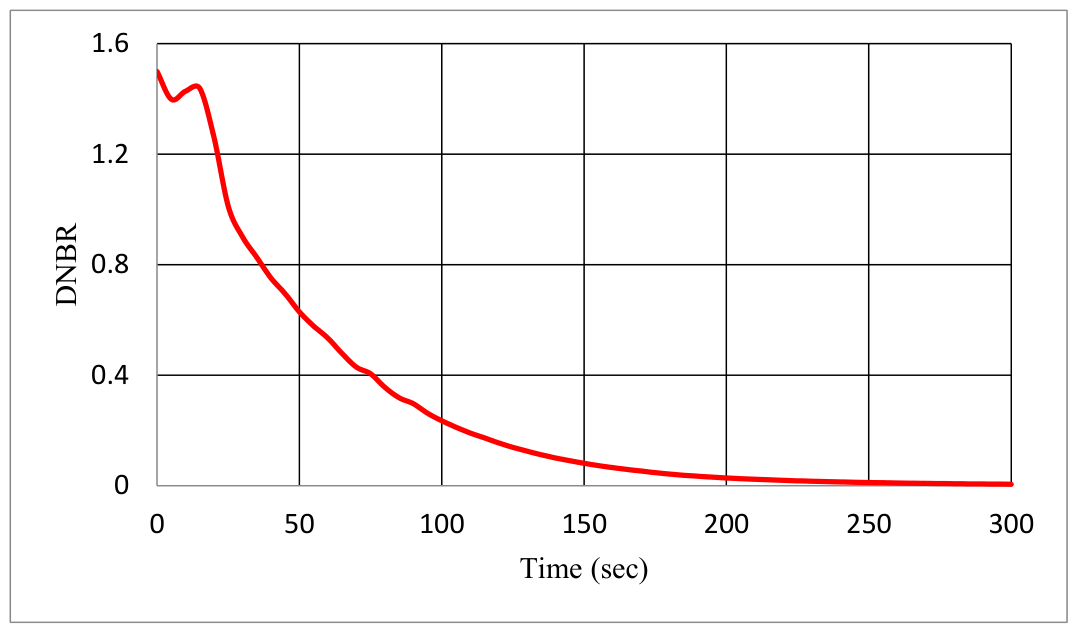
Figure 11.
(a) Core Flow vs Time (Sec) graph from PCTran for station blackout; (b) Core Flow vs Time graph from FSAR of PWR based reference NPP [16].
Figure 11.
(a) Core Flow vs Time (Sec) graph from PCTran for station blackout; (b) Core Flow vs Time graph from FSAR of PWR based reference NPP [16].
Disclaimer/Publisher’s Note: The statements, opinions and data contained in all publications are solely those of the individual author(s) and contributor(s) and not of MDPI and/or the editor(s). MDPI and/or the editor(s) disclaim responsibility for any injury to people or property resulting from any ideas, methods, instructions or products referred to in the content. |
© 2026 by the authors. Licensee MDPI, Basel, Switzerland. This article is an open access article distributed under the terms and conditions of the Creative Commons Attribution (CC BY) license.
Copyright: This open access article is published under a Creative Commons CC BY 4.0 license, which permit the free download, distribution, and reuse, provided that the author and preprint are cited in any reuse.