
Submitted:
28 August 2026
Posted:
31 August 2026
You are already at the latest version
Abstract
Background/Objectives: Metabolic syndrome (MetS) is a common cardiometabolic condition characterized by clustering of metabolic risk factors. Early identification in routine clinical practice remains challenging. This study aimed to explore the performance of artificial intelligence (AI)–based models for the prediction of MetS using routinely available clinical and laboratory parameters, with a particular focus on serum uric acid. Methods: This retrospective study was conducted using a publicly available dataset including 640 individuals (320 MetS-positive and 320 MetS-negative). MetS was defined according to modified National Cholesterol Education Program Adult Treatment Panel III criteria. Machine learning models were developed using combinations of age, sex, body mass index, uric acid, and albumin. Logistic regression, support vector machines, decision trees, k-nearest neighbors, and random forest algorithms were evaluated. Model performance was assessed using accuracy, area under the receiver operating characteristic curve (AUC), precision, recall, and F1-score. Internal validation was performed using 5-fold cross-validation. Results: Individuals with MetS had significantly higher uric acid levels compared to those without MetS (6.02 ± 1.57 vs. 2.84 ± 0.35 mg/dL, p < 0.001), while albumin levels were similar. The evaluated models demonstrated high classification performance within the study dataset, with accuracy values up to 0.99 and AUC values up to 0.99. Models using a limited number of variables, particularly body mass index, age, and uric acid, showed consistent performance. Models based on uric acid and albumin achieved accuracy values around 0.98, while single-variable models using uric acid alone achieved accuracy of 0.97. Conclusions: AI-based models using a limited set of routinely available clinical and laboratory parameters demonstrated the potential to classify MetS. Serum uric acid consistently emerged as one of the most discriminative variables, supporting its potential role as a clinically informative and accessible biomarker in MetS classification.
Keywords:
metabolic syndrome
; machine learning
; artificial intelligence
; uric acid
; biomarkers
1. Introduction
Metabolic syndrome (MetS) is a cluster of interrelated cardiometabolic abnormalities, including hypertension, dyslipidemia, impaired glucose metabolism, and central obesity, which collectively increase the risk of cardiovascular disease and type 2 diabetes mellitus [1,2]. The coexistence of these risk factors reflects a complex pathophysiological interplay involving insulin resistance, chronic low-grade inflammation, and metabolic dysregulation [3]. With the global rise in sedentary lifestyles and obesity, MetS has emerged as a major public health concern, affecting populations worldwide and contributing substantially to morbidity, mortality, and healthcare burden [4,5].
In recent years, increasing attention has been directed toward identifying reliable and easily accessible biomarkers that can facilitate early detection and risk stratification of MetS. Among these, serum uric acid has been extensively studied as a potential metabolic and inflammatory marker. Accumulating evidence suggests that elevated uric acid levels are significantly associated with the presence and development of MetS, showing a dose–response relationship with metabolic risk [6,7]. Several observational and longitudinal studies have further demonstrated that higher uric acid levels are independently associated with both prevalent and incident MetS across different populations [8,9,10,11]. These findings support the role of uric acid as a potential biomarker reflecting metabolic dysfunction and cardiometabolic risk.
Serum albumin, traditionally regarded as a marker of nutritional status, has also been increasingly recognized for its association with metabolic and inflammatory processes. Previous studies have reported significant associations between albumin levels and the risk of MetS, suggesting that albumin may reflect underlying metabolic and inflammatory states [12,13]. The complex relationship between albumin and MetS appears to involve oxidative stress, inflammation, and metabolic regulation, further highlighting its potential utility in risk assessment.
Parallel to advances in biomarker research, artificial intelligence (AI) and machine learning (ML) techniques have gained increasing importance in medical research and clinical practice. These approaches enable the integration of multiple clinical and laboratory variables to develop predictive models with promising performance and potential applicability in clinical decision support systems. In the context of MetS, ML-based models have shown promising results in improving prediction performance and identifying high-risk individuals using routinely available clinical data [14,15,16,17,18].
Despite these advancements, there remains a need for simplified, interpretable, and clinically applicable prediction models based on easily obtainable laboratory parameters. Therefore, the aim of this study was to explore the performance of AI–based models for the classification of MetS using routinely available clinical and laboratory parameters. Particular emphasis was placed on evaluating the discriminative contribution of serum uric acid, both as a single biomarker and in combination with other variables, within a balanced analytical dataset derived from a real-world database. This study was designed as an exploratory analysis to assess whether simple and widely accessible parameters could provide meaningful information for MetS classification.
2. Materials and Methods
2.1. Study Design and Setting
This study was conducted using data obtained from a publicly available dataset published on the Istinye University Dataset Sharing Platform (https://dataset.istinye.edu.tr/dataset?did=87, accessed on 16 August 2026). The dataset was originally developed to evaluate the association between metabolic parameters and MetS.
In the present study, a balanced cohort was constructed to explore the performance of ML–based models for predicting MetS. A total of 640 individuals were included, consisting of 320 MetS-positive and 320 MetS-negative cases.
2.2. Study Population
The study population was derived from a previously established and publicly available dataset from Istinye University. The dataset includes individuals aged ≥18 years who were recorded between 2020 and 2025. Only patients with complete baseline data at their initial presentation were included in the present analysis. To avoid duplication bias, only the earliest eligible record per individual was retained.
2.3. Inclusion and Exclusion Criteria
Eligible participants were required to have same-day measurements of serum uric acid and albumin, along with complete data for key clinical and laboratory variables, including fasting plasma glucose, triglycerides, HDL cholesterol, LDL cholesterol, blood pressure, height, and weight.
Following data filtering, all available MetS-positive individuals (n = 320) were included in the analysis. To construct a balanced analytical dataset, an equal number of MetS-negative individuals (n = 320) were randomly selected from a larger pool of eligible non-MetS cases (n = 4,276). This random sampling approach was applied to reduce class imbalance and ensure stable model training and evaluation. However, it should be noted that different random selections of MetS-negative individuals may introduce variability in model performance, and the results should therefore be interpreted with this consideration.
2.4. External Validation
External validation was not performed in this study. The developed ML models were evaluated using internal validation only. Future studies incorporating multi-center data and independent external datasets are planned to assess the generalizability and robustness of these models.
2.5. Definition of Metabolic Syndrome
MetS was defined according to the criteria of the National Cholesterol Education Program Adult Treatment Panel III. Due to the absence of consistent waist circumference data, MetS was operationally defined as the presence of at least three abnormalities among the following components: elevated triglycerides, reduced HDL cholesterol, elevated blood pressure, and impaired fasting glucose. A binary outcome variable (MetS-positive / MetS-negative) was generated based on this definition.
Because several variables used as model inputs (e.g., BMI, triglycerides, and fasting glucose) overlap with the diagnostic criteria of MetS, the prediction task in this study may partially reflect classification of an already defined condition rather than independent prospective risk prediction. Therefore, model performance should be interpreted within this context.
2.6. Outcome Definition
The primary outcome of the study was the presence of MetS as defined above.
2.7. Feature Construction and Preprocessing
Model inputs included demographic and laboratory variables available at baseline, specifically age, sex, body mass index (BMI), serum uric acid, and albumin. Continuous variables were used in their original scale without transformation. No imputation was performed, and only complete cases were analyzed. Different combinations of input features were evaluated to assess their contribution to model performance.
2.8. Machine Learning Analysis and Validation
ML models were developed to predict MetS using combinations of input features. The evaluated algorithms included logistic regression, support vector machines, decision trees, k-nearest neighbors, and random forest models.
Model performance was assessed using accuracy, area under the receiver operating characteristic curve (AUC), precision, recall, and F1-score.
To assess internal model robustness, a 5-fold cross-validation approach was applied. The dataset was randomly partitioned into five subsets, with four subsets used for training and one subset used for testing in each iteration. Performance metrics were averaged across folds.
All analyses were conducted without the use of an external validation dataset; therefore, the reported results should be interpreted as internal validation estimates.
The dataset used in this study was obtained from the Istinye University database (dataset.istinye.edu.tr), which was developed on the Wistats v3.0 institutional platform (WisdomEra Corp., Istanbul, Turkey). This platform enables integrated statistical analysis and ML applications on subscribed datasets within a unified environment, allowing analytical workflows to be executed without external data transfer. Accordingly, the developed models can be independently reproduced and re-evaluated using the same dataset through the platform, ensuring transparency, reproducibility, and consistency of the analytical process.
Given the high predictive performance observed in this study, the potential risk of overfitting was carefully considered. To mitigate this risk, a 5-fold cross-validation strategy was applied, ensuring that model performance was evaluated across multiple independent data splits. In addition, model complexity was controlled by evaluating both simple (e.g., logistic regression) and more complex algorithms, and by testing models with limited feature sets. The consistent performance observed across different algorithms and feature combinations suggests that the predictive signal was not driven solely by model overfitting. However, as the models were developed and validated within the same dataset, the possibility of residual overfitting cannot be fully excluded. Therefore, the reported performance metrics should be interpreted as internal validation estimates, and external validation in independent cohorts is required to confirm generalizability.
Additionally, no hyperparameter optimization beyond standard configurations was performed, which may influence model performance. This approach was considered appropriate given the exploratory design of the study, which aimed to evaluate multiple input–model combinations rather than to optimize the performance of a single model. Accordingly, the findings should be interpreted as indicative of general performance patterns rather than maximized model performance.
A balanced analytical dataset was constructed by selecting equal numbers of MetS-positive and MetS-negative individuals (n = 320 per group). This approach was adopted to improve model training stability and to reduce bias related to class imbalance.
This artificial balancing does not reflect real-world disease prevalence and may have led to optimistic estimates of model performance.
2.9. Statistical Analysis
All statistical analyses and ML training were performed using Wistats v3.0 (WisdomEra Corp., Istanbul, Turkey), a Python-based analytical platform integrating widely validated and commonly used statistical and ML libraries, including SciPy, scikit-learn, and statsmodels, ensuring methodological robustness and reproducibility of the analytical outputs. Continuous variables were assessed for normality using the Shapiro–Wilk test and are presented as mean ± standard deviation. Categorical variables are expressed as frequencies and percentages.
Comparisons between MetS-positive and MetS-negative groups were performed using the independent samples t-test or Mann–Whitney U test, as appropriate. Categorical variables were compared using the Chi-square test or Fisher’s exact test.
In addition to statistical significance testing, standardized effect sizes (Cohen’s d) were calculated for continuous variables to quantify the magnitude of differences between groups. This approach allows evaluation of the clinical relevance and discriminative strength of each variable beyond p-values alone.
All statistical tests were two-sided, and a p value < 0.05 was considered statistically significant.
3. Results
3.1. Baseline Characteristics of the Study Population
A total of 640 individuals were included in the analysis (Table 1). The mean age of the cohort was 40.54 ± 10.25 years, and 67.5% were female. The mean serum uric acid level was 4.43 ± 1.95 mg/dL, and the mean albumin level was 46.39 ± 2.74 g/L. The average BMI was 27.32 ± 6.49 kg/m2.
The mean systolic and diastolic blood pressures were 122.31 ± 20.11 mmHg and 77.15 ± 11.68 mmHg, respectively. The mean HDL cholesterol level was 53.66 ± 13.68 mg/dL, LDL cholesterol was 124.41 ± 37.55 mg/dL, triglycerides were 128.66 ± 97.07 mg/dL, and fasting plasma glucose was 96.69 ± 10.35 mg/dL.
In terms of BMI categories, 37.7% of individuals were classified as normal weight, 29.8% as overweight, 28.1% as obese, and 4.4% as underweight.
3.2. Comparison Between Individuals With and Without MetS
Patients with MetS were significantly older compared to those without MetS (45.23 ± 9.93 vs. 35.85 ± 8.22 years, p < 0.001). A marked difference in sex distribution was observed, with a higher proportion of males in the MetS-positive group (61.3% vs. 3.8%, p < 0.001) (Table 2) (Figure 1A).
Uric acid levels were substantially higher in the MetS-positive group (6.02 ± 1.57 vs. 2.84 ± 0.35 mg/dL, p < 0.001), whereas albumin levels were similar between groups (p = 0.817). Blood pressure values were also significantly higher in the MetS-positive group (systolic: 135.22 ± 18.74 vs. 109.40 ± 11.14 mmHg; diastolic: 83.53 ± 11.01 vs. 70.76 ± 8.38 mmHg; both p < 0.001).
In addition, MetS-positive patients had significantly higher BMI (31.11 ± 6.16 vs. 23.53 ± 4.19 kg/m2, p < 0.001), LDL cholesterol (139.61 ± 34.64 vs. 109.20 ± 34.07 mg/dL, p < 0.001), triglycerides (181.62 ± 106.61 vs. 75.70 ± 43.38 mg/dL, p < 0.001), and fasting plasma glucose levels (102.83 ± 8.41 vs. 90.54 ± 8.25 mg/dL, p < 0.001). HDL cholesterol levels were significantly lower in the MetS-positive group (49.13 ± 11.94 vs. 58.19 ± 13.82 mg/dL, p < 0.001).
BMI category distribution differed significantly between groups, with obesity being more frequent in the MetS-positive group (48.4% vs. 7.8%, p < 0.001) (Figure 1B). A concise summary of the key clinical patterns and their implications for downstream predictive modeling is presented in Figure 1C.
Overall, these findings demonstrate a clear and consistent clinical and metabolic separation between MetS-positive and MetS-negative individuals. As shown in Figure 2A, several key metabolic parameters exhibited marked relative differences when normalized to the MetS-negative group, indicating a distinct shift in metabolic profile associated with MetS. In particular, uric acid levels showed one of the most pronounced increases, alongside substantial elevations in BMI and triglycerides, reflecting the clustering of metabolic abnormalities.
This separation is further supported by the direct comparison of mean values (Figure 2B), where variables such as uric acid and BMI demonstrate minimal overlap between groups, suggesting strong discriminatory potential at the individual level.
Importantly, standardized effect size analysis using Cohen’s d (Figure 2C) confirmed that multiple variables contributed substantially to group differentiation. In particular, uric acid exhibited the largest effect size, followed by systolic blood pressure, glucose, BMI, diastolic blood pressure, and triglycerides, all demonstrating large effect sizes and strong discriminative capacity.
In contrast, HDL showed a moderate inverse effect, reflecting its lower levels in MetS-positive individuals, while albumin demonstrated a negligible effect size, suggesting minimal contribution to group separation.
Taken together, these results highlight that the observed differences are not only statistically significant but also clinically meaningful, reinforcing the relevance of selected metabolic variables—particularly uric acid—as key contributors to MetS classification within this dataset.
3.3. Machine Learning Model Performance
Multiple ML models were developed using different combinations of clinical and biochemical variables. In total, 155 distinct model configurations were evaluated, and the complete list of models is provided in Supplementary Table 1. The top-performing models demonstrated high classification performance within the study dataset for MetS (Table 3).
The best-performing models achieved an accuracy of 0.99 and an AUC of 0.99 (Figure 3A). These models were primarily based on combinations of BMI, age, uric acid, and albumin, and were implemented using logistic regression.
Importantly, model performance remained high even when fewer variables were used, suggesting stability of simplified models (Figure 3B). In particular, models based only on uric acid and albumin achieved an accuracy of 0.98 and AUC values up to 0.99 across multiple algorithms, including logistic regression, support vector machines, decision trees, and random forests.
Single-variable models using only uric acid also demonstrated strong predictive performance, achieving an accuracy of 0.97 and an AUC of 0.97.
Across the top-performing models, precision values reached up to 1.00, recall ranged between 0.96 and 0.98, and F1-scores ranged from 0.97 to 0.99, indicating consistently high and stable classification performance across different algorithms (Figure 3C).
4. Discussion
In this study, we explored the performance of ML–based models for the classification of MetS, with a particular focus on the role of serum uric acid within combinations of routinely available clinical and laboratory parameters. The findings demonstrate that ML models achieved high classification performance within the study dataset, particularly when key variables such as BMI, age, and serum uric acid were included. Notably, uric acid consistently emerged as one of the most discriminative variables across both statistical comparisons and model-based analyses. Importantly, this study was designed as an exploratory analysis rather than a definitive predictive modeling study. The primary objective was to assess whether simple and widely available clinical parameters could provide meaningful discriminatory information for MetS classification. Therefore, the results should be interpreted as hypothesis-generating rather than confirmatory.
Consistent with previous literature, serum uric acid emerged as one of the strongest discriminative variables. Individuals with MetS had substantially higher uric acid levels compared to those without MetS, supporting prior evidence demonstrating a dose–response relationship between uric acid and metabolic risk [6,7,8]. Longitudinal studies have further shown that elevated uric acid levels are independently associated with incident MetS [9,10,11], suggesting that uric acid may reflect underlying metabolic and inflammatory pathways.
In contrast, albumin levels did not differ significantly between groups in our study. This finding differs from some previous reports indicating associations between albumin and MetS [12,13]. However, the role of albumin in metabolic regulation appears to be complex and context-dependent. Recent studies suggest that composite inflammatory indices incorporating albumin, such as the C-reactive protein–to–albumin ratio, may better capture systemic inflammation and metabolic risk [19,20,21]. Our findings indicate that while albumin alone may have limited discriminatory power, its inclusion in multivariable models may still contribute to overall model performance.
Another important observation is that simpler models, particularly logistic regression, performed comparably to more complex ML algorithms. This is consistent with previous studies indicating that when strong predictors are available, increased model complexity does not necessarily result in substantial performance gains [22]. From a clinical perspective, this supports the use of interpretable and parsimonious models for potential decision support applications.
However, several important methodological limitations must be considered. First, the study utilized a balanced dataset constructed through random sampling. Although this approach improves model training stability, it does not reflect real-world disease prevalence and may lead to optimistic performance estimates. Second, several predictors used in the models overlap with the diagnostic criteria of MetS (e.g., BMI, triglycerides, and fasting glucose). As a result, the predictive task may partially represent reconstruction of the diagnostic definition rather than independent risk prediction. This issue has been highlighted in prior ML studies and represents an inherent limitation when modeling composite clinical syndromes. Third, the models were developed and evaluated using the same dataset, and only internal validation was performed. Although cross-validation was applied to mitigate overfitting, the absence of external validation substantially limits the generalizability of the findings. Fourth, the retrospective design and reliance on a single dataset introduce potential sources of bias, including selection bias and unmeasured confounding. Additionally, the exclusion of waist circumference from the MetS definition due to missing data may have influenced classification outcomes. The clinical utility of these models in real-world decision-making remains uncertain and requires further investigation.
Taken together, these findings suggest that simple clinical and biochemical variables—particularly serum uric acid—carry significant discriminatory information for MetS classification within this dataset. However, these results should be interpreted cautiously and require validation in independent, prospective, and multi-center cohorts before clinical implementation can be considered. These findings should not be interpreted as evidence of causal or prospective predictive capability.
5. Conclusions
In conclusion, this exploratory study demonstrates that ML–based models using a limited number of routinely available clinical and laboratory parameters can effectively classify MetS within the study dataset. Among these variables, serum uric acid emerged as a strong discriminative biomarker, while albumin contributed modestly in combination with other features.
Supplementary Materials
Supplementary Table S1. In total, 155 distinct model configurations were evaluated, and the complete list of models is provided in Supplementary Table S1.
Author Contributions
Conceptualization, N.A.; methodology, N.A.; formal analysis, N.A.; investigation, N.A.; resources, N.A.; data curation, N.A.; writing—original draft preparation, N.A.; writing—review and editing, N.A.; visualization, N.A.; supervision, N.A.; project administration, N.A. All authors have read and agreed to the published version of the manuscript.
Funding
This research received no external funding.
Institutional Review Board Statement
This study was conducted using a publicly available dataset from the Istinye University Dataset Sharing Platform (https://dataset.istinye.edu.tr/dataset?did=87, accessed on 16 August 2026). The ethics approval information was provided by the dataset contributors in the repository. According to the dataset description, the original data collection was approved by the Istinye University Human Research Ethics Committee (Approval date: September 3, 2025; Protocol No: 2025-264). As the present study involved only secondary analysis of fully anonymized, publicly available data, no additional ethical approval or informed consent was required.
Informed Consent Statement
Patient consent was waived because the study was designed as a retrospective analysis of anonymized medical records, involved no direct patient contact or intervention, and posed no foreseeable risk to participants. The Institutional Review Board approved the waiver of informed consent in accordance with national regulations and the Declaration of Helsinki.
Data Availability Statement
Anonymized study data are available via the Dataset Sharing Platform of Istinye University: https://dataset.istinye.edu.tr/dataset?did=91. Access is granted for research use under the platform’s licensing and data-sharing policies.
Acknowledgments
The authors would like to thank the Artificial Intelligence Research and Application Center of Istinye University (https://yzaum.istinye.edu.tr/, accessed on 16 August 2026) for providing technical support during manuscript preparation, including assistance with data validation processes and pre-submission similarity evaluation. The authors also acknowledge the Ditako Data Analytics Team (https://ditako.com, accessed on 16 August 2026) for their valuable contributions to the statistical analyses and methodological support provided for this study.
Conflicts of Interest
The authors declare no conflicts of interest.
Abbreviations
The following abbreviations are used in this manuscript:
| Abbreviation | Definition |
| MetS | Metabolic syndrome |
| NCEP-ATP III | National Cholesterol Education Program Adult Treatment Panel III |
| BMI | Body mass index |
| LDL | Low-density lipoprotein |
| HDL | High-density lipoprotein |
References
- Alberti, K.G.M.M.; Eckel, R.H.; Grundy, S.M.; Zimmet, P.Z.; Cleeman, J.I.; Donato, K.A.; Fruchart, J.; James, W.P.T.; Loria, C.M.; Smith, S.C., Jr.; et al. Harmonizing the metabolic syndrome: A joint interim statement of the International Diabetes Federation Task Force on Epidemiology and Prevention; National Heart, Lung, and Blood Institute. In Circulation; American Heart Association; World Heart Federation; International Atherosclerosis Society; and International Association for the Study of Obesity, 2009; Volume 120, pp. 1640–1645. [Google Scholar]
- Eckel, R.H.; Grundy, S.M.; Zimmet, P.Z. The metabolic syndrome. Lancet 2005, 365, 1415–1428. [Google Scholar] [CrossRef] [PubMed]
- Fahed, G.; Aoun, L.; Zerdan, M.B.; Allam, S.; Zerdan, M.B.; Bouferraa, Y.; Assi, H.I. Metabolic syndrome: Updates on pathophysiology and management in 2021. Int. J. Mol. Sci. 2022, 23, 786. [Google Scholar] [CrossRef] [PubMed]
- Saklayen, M.G. The global epidemic of the metabolic syndrome. Curr. Hypertens. Rep. 2018, 20, 12. [Google Scholar] [CrossRef] [PubMed]
- Neeland, I.J.; Lim, S.; Tchernof, A.; Gastaldelli, A.; Rangaswami, J.; Ndumele, C.E.; Powell-Wiley, T.M.; Després, J. Metabolic syndrome. Nat. Rev. Dis. Primers 2024, 10, 63. [Google Scholar]
- Yuan, H.; Yu, C.; Li, X.; Sun, L.; Zhu, X.; Zhao, C.; Zhang, Z.; Yang, Z. Serum uric acid levels and risk of metabolic syndrome: A dose-response meta-analysis of prospective studies. J. Clin. Endocrinol. Metab. 2015, 100, 4198–4207. [Google Scholar] [CrossRef] [PubMed]
- Raya-Cano, E.; Vaquero-Abellán, M.; Molina-Luque, R.; Pedro-Jiménez, D.D.; Molina-Recio, G.; Romero-Saldaña, M. Association between metabolic syndrome and uric acid: A systematic review and meta-analysis. Sci. Rep. 2022, 12, 22502. [Google Scholar] [CrossRef] [PubMed]
- Ali, N.; Miah, R.; Hasan, M.; Barman, Z.; Mou, A.D.; Hafsa, J.M.; Trisha, A.D.; Hasan, A.; Islam, F. Association between serum uric acid and metabolic syndrome: A cross-sectional study in Bangladeshi adults. Sci. Rep. 2020, 10, 7841. [Google Scholar] [CrossRef] [PubMed]
- Diniz, M.D.F.H.S.; Beleigoli, A.M.R.; Galvão, A.I.R.; Telles, R.W.; Schmidt, M.I.; Duncan, B.B.; Benseñor, I.M.; Ribeiro, A.L.P.; Vidigal, P.G.; Barreto, S.M. Serum uric acid is a predictive biomarker of incident metabolic syndrome at the Brazilian Longitudinal Study of Adult Health (ELSA-Brasil). Diabetes Res. Clin. Pract. 2022, 191, 110046. [Google Scholar] [CrossRef] [PubMed]
- Magalhães, E.L.G.D.; Juvanhol, L.L.; Silva, D.C.G.D.; Ferreira, F.G.; Roberto, D.M.T.; Hinnig, P.D.F.; Longo, G.Z. Uric acid: A new marker for metabolic syndrome? Results of a population-based study with adults. Nutr. Metab. Cardiovasc. Dis. 2021, 31, 2077–2080. [Google Scholar] [CrossRef] [PubMed]
- Lee, J.; Kim, H.C.; Cho, H.M.; Oh, S.M.; Choi, D.P.; Suh, I. Association between serum uric acid level and metabolic syndrome. J. Prev. Med. Public Health 2012, 45, 181–187. [Google Scholar] [CrossRef] [PubMed]
- Jin, S.; Hong, Y.J.; Jee, J.H.; Bae, J.C.; Hur, K.Y.; Lee, M.; Kim, J.H. Change in serum albumin concentration is inversely and independently associated with risk of incident metabolic syndrome. Metabolism 2016, 65, 1629–1635. [Google Scholar] [CrossRef] [PubMed]
- Cho, H.M.; Kim, H.C.; Lee, J.; Oh, S.M.; Choi, D.P.; Suh, I. The association between serum albumin levels and metabolic syndrome in a rural population of Korea. J. Prev. Med. Public Health 2012, 45, 98–104. [Google Scholar] [CrossRef] [PubMed]
- Shin, D. Prediction of metabolic syndrome using machine learning approaches based on genetic and nutritional factors: A 14-year prospective-based cohort study. BMC Med. Genom. 2024, 17, 198. [Google Scholar] [CrossRef] [PubMed]
- Li, Z.; Wu, W.; Kang, H. Machine learning-driven metabolic syndrome prediction: An international cohort validation study. Healthcare 2024, 12, 2527. [Google Scholar] [CrossRef] [PubMed]
- Mohseni-Takalloo, S.; Mozaffari-Khosravi, H.; Mohseni, H.; Mirzaei, M.; Hosseinzadeh, M. Metabolic syndrome prediction using non-invasive and dietary parameters based on a support vector machine. Nutr. Metab. Cardiovasc. Dis. 2024, 34, 126–135. [Google Scholar] [CrossRef] [PubMed]
- Yu, C.; Lin, Y.; Lin, C.; Wang, S.; Lin, S.; Lin, S.H.; Wu, J.L.; Chang, S. Predicting metabolic syndrome with machine learning models using a decision tree algorithm: Retrospective cohort study. JMIR Med. Inform. 2020, 8, e17110. [Google Scholar] [CrossRef] [PubMed]
- Kim, J.; Mun, S.; Lee, S.; Jeong, K.; Baek, Y. Prediction of metabolic and pre-metabolic syndromes using machine learning models with anthropometric, lifestyle, and biochemical factors from a middle-aged population in Korea. BMC Public Health 2022, 22, 13131. [Google Scholar] [CrossRef] [PubMed]
- Lim, T.; Lee, Y. C-reactive protein to albumin ratio and risk of incident metabolic syndrome in community-dwelling adults: Longitudinal findings over a 12-year follow-up period. Endocrine 2024, 86, 156–162. [Google Scholar] [CrossRef] [PubMed]
- Guo, H.; Wang, Y.; Miao, Y.; Lin, Q. Red cell distribution width/albumin ratio as a marker for metabolic syndrome: Findings from a cross-sectional study. BMC Endocr. Disord. 2024, 24, 176. [Google Scholar] [CrossRef] [PubMed]
- Ji, W.; Li, H.; Qi, Y.; Zhou, W.; Chang, Y.; Xu, D.; Wei, Y. Association between neutrophil-percentage-to-albumin ratio (NPAR) and metabolic syndrome risk: Insights from a large US population-based study. Sci. Rep. 2024, 14, 77802. [Google Scholar] [CrossRef] [PubMed]
- Zhang, H.; Chen, D.; Shao, J.; Zou, P.; Cui, N.; Tang, L.; Wang, X.; Wang, D.; Wu, J.; Ye, Z. Machine learning-based prediction for 4-year risk of metabolic syndrome in adults: A retrospective cohort study. Risk Manag. Healthc. Policy 2021, 14, 4361–4368. [Google Scholar] [CrossRef] [PubMed]
Figure 1.
Clinical characteristics and summary of key findings according to metabolic syndrome (MetS) status. (A) Sex distribution in MetS-negative and MetS-positive groups, demonstrating a marked shift in sex composition between groups. (B) Distribution of body mass index (BMI) categories, highlighting the substantially higher prevalence of overweight and obesity in the MetS-positive group. (C) Compact summary of key model-related findings, including best model performance metrics (accuracy and AUC), performance of simplified models based on uric acid, and internal validation strategy.
Figure 1.
Clinical characteristics and summary of key findings according to metabolic syndrome (MetS) status. (A) Sex distribution in MetS-negative and MetS-positive groups, demonstrating a marked shift in sex composition between groups. (B) Distribution of body mass index (BMI) categories, highlighting the substantially higher prevalence of overweight and obesity in the MetS-positive group. (C) Compact summary of key model-related findings, including best model performance metrics (accuracy and AUC), performance of simplified models based on uric acid, and internal validation strategy.
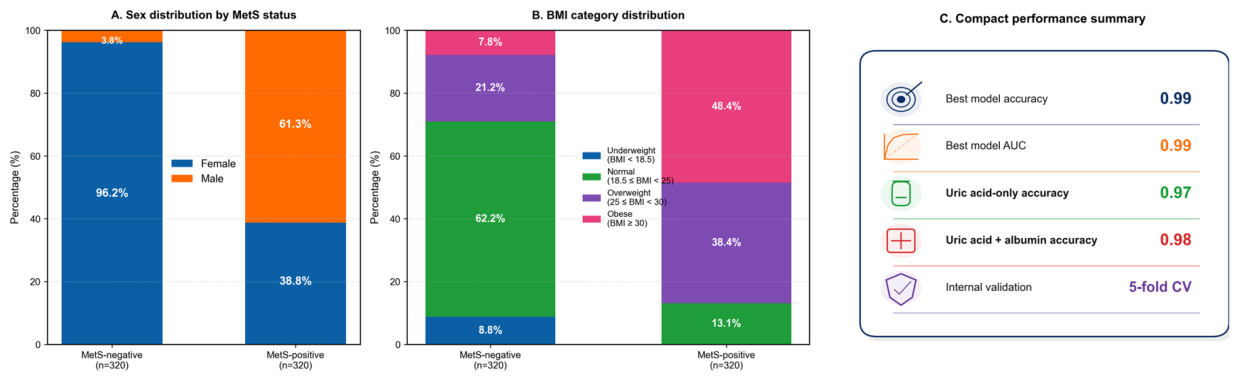
Figure 2.
Clinical and biochemical separation between individuals with and without metabolic syndrome. (A) Relative differences in selected metabolic variables normalized to the MetS-negative group (reference = 1.0), illustrating proportional increases or decreases in key biomarkers. (B) Comparison of mean ± standard deviation values for selected variables, demonstrating clear separation between groups, particularly for uric acid and BMI. (C) Standardized mean differences (Cohen’s d) for all variables, ranked by effect size, indicating the relative contribution of each parameter to group discrimination.
Figure 2.
Clinical and biochemical separation between individuals with and without metabolic syndrome. (A) Relative differences in selected metabolic variables normalized to the MetS-negative group (reference = 1.0), illustrating proportional increases or decreases in key biomarkers. (B) Comparison of mean ± standard deviation values for selected variables, demonstrating clear separation between groups, particularly for uric acid and BMI. (C) Standardized mean differences (Cohen’s d) for all variables, ranked by effect size, indicating the relative contribution of each parameter to group discrimination.
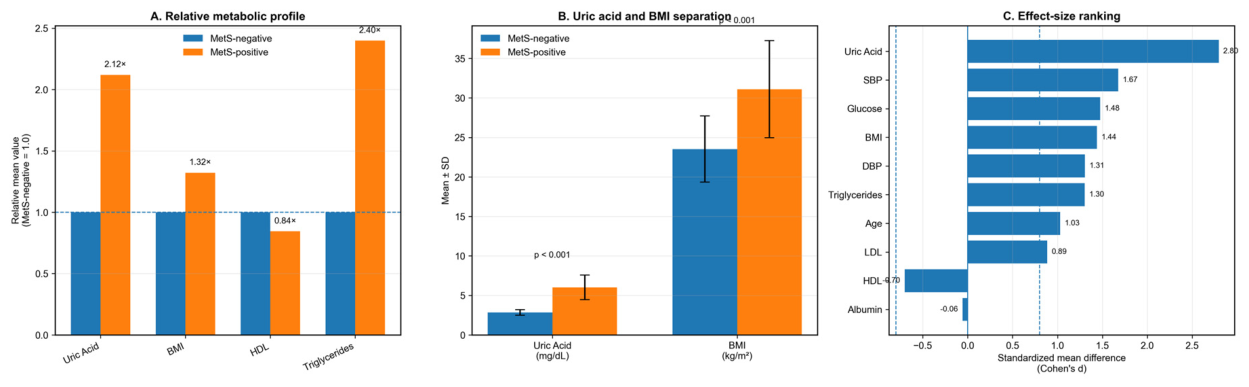
Figure 3.
Machine learning model performance for metabolic syndrome prediction. (A) Accuracy of models ranked from lowest to highest, demonstrating consistently high performance across model configurations. (B) Relationship between the number of input variables and model performance, indicating that simplified models retain high predictive performance. (C) Comparative performance metrics (accuracy, AUC, precision, recall, and F1-score) across different machine learning algorithms, showing minimal performance variation between model types.
Figure 3.
Machine learning model performance for metabolic syndrome prediction. (A) Accuracy of models ranked from lowest to highest, demonstrating consistently high performance across model configurations. (B) Relationship between the number of input variables and model performance, indicating that simplified models retain high predictive performance. (C) Comparative performance metrics (accuracy, AUC, precision, recall, and F1-score) across different machine learning algorithms, showing minimal performance variation between model types.
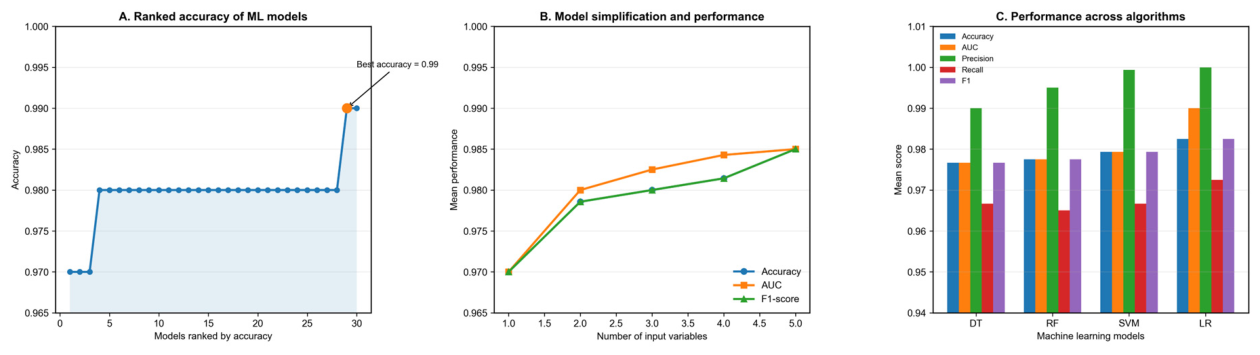

Table 1.
Baseline Demographic and Clinical Characteristics of the Study Cohort.
| Variables | Mean ± SD, N (%) |
|---|---|
| Number of cases | 640 (100%) |
| Age | 40.54 ± 10.25 |
| Sex | |
| female | 432 (67.5%) |
| male | 208 (32.5%) |
| Uric Acid (mg/dL) | 4.43 ± 1.95 |
| Albumin (g/L) | 46.39 ± 2.74 |
| Systolic Blood Pressure (mmHg) | 122.31 ± 20.11 |
| Diastolic Blood Pressure (mmHg) | 77.15 ± 11.68 |
| HDL Cholesterol (mg/dL) | 53.66 ± 13.68 |
| LDL Cholesterol (mg/dL) | 124.41 ± 37.55 |
| Triglycerides (mg/dL) | 128.66 ± 97.07 |
| Fasting plasma glucose (mg/dL) | 96.69 ± 10.35 |
| BMI | 27.32 ± 6.49 |
| BMI Group | |
| normal | 241 (37.7%) |
| obese | 180 (28.1%) |
| overweight | 191 (29.8%) |
| underweight | 28 (4.4%) |
BMI, body mass index; HDL, high-density lipoprotein; LDL, low-density lipoprotein; SD, standard deviation. Continuous variables are presented as mean ± standard deviation, and categorical variables are presented as number (percentage). Percentages may not total 100% due to rounding.
Table 2.
Comparative Outcomes Between Cases With and Without Metabolic Syndrome.
| MetS-Negative Mean ± SD, N (%) |
MetS-Positive Mean ± SD, N (%) |
p-value | |
|---|---|---|---|
| Number of cases | 320 (50%) | 320 (50%) | |
| Age | 35.85 ± 8.22 | 45.23 ± 9.93 | <0.001 |
| Sex | <0.001 | ||
| female | 308 (96.2%) | 124 (38.8%) | |
| male | 12 (3.8%) | 196 (61.3%) | |
| Uric Acid (mg/dL) | 2.84 ± 0.35 | 6.02 ± 1.57 | <0.001 |
| Albumin (g/L) | 46.47 ± 2.40 | 46.31 ± 3.05 | 0.817 |
| Systolic Blood Pressure (mmHg) | 109.40 ± 11.14 | 135.22 ± 18.74 | <0.001 |
| Diastolic Blood Pressure (mmHg) | 70.76 ± 8.38 | 83.53 ± 11.01 | <0.001 |
| HDL Cholesterol (mg/dL) | 58.19 ± 13.82 | 49.13 ± 11.94 | <0.001 |
| LDL Cholesterol (mg/dL) | 109.20 ± 34.07 | 139.61 ± 34.64 | <0.001 |
| Triglycerides (mg/dL) | 75.70 ± 43.38 | 181.62 ± 106.61 | <0.001 |
| Fasting plasma glucose (mg/dL) | 90.54 ± 8.25 | 102.83 ± 8.41 | <0.001 |
| Body Mass Index | 23.53 ± 4.19 | 31.11 ± 6.16 | <0.001 |
| BMI Group | <0.001 | ||
| normal | 199 (62.2%) | 42 (13.1%) | |
| obese | 25 (7.8%) | 155 (48.4%) | |
| overweight | 68 (21.2%) | 123 (38.4%) | |
| underweight | 28 (8.8%) | 0 (0.0%) |
BMI, body mass index; HDL, high-density lipoprotein; LDL, low-density lipoprotein; MetS, metabolic syndrome; SD, standard deviation. Continuous variables are presented as mean ± standard deviation, and categorical variables are presented as number (percentage). P-values represent comparisons between participants with and without metabolic syndrome. A p-value <0.05 was considered statistically significant.
Table 3.
Top 30 Machine Learning Models Predicting Metabolic Syndrome.
| No | input | Model | Accuracy | AUC | Precision | Recall | F1-score |
|---|---|---|---|---|---|---|---|
| 1 | BMI, Age, Uric Acid, Albumin | LR | 0.99 | 0.99 | 1.0 | 0.98 | 0.99 |
| 2 | BMI, Age, Uric Acid, Sex, Albumin | LR | 0.99 | 0.99 | 1.0 | 0.98 | 0.99 |
| 3 | BMI, Uric Acid | SVM | 0.98 | 0.98 | 1.0 | 0.96 | 0.98 |
| 4 | Age, Uric Acid | SVM | 0.98 | 0.98 | 1.0 | 0.96 | 0.98 |
| 5 | Uric Acid, Albumin | LR | 0.98 | 0.99 | 1.0 | 0.97 | 0.98 |
| 6 | Uric Acid, Albumin | SVM | 0.98 | 0.98 | 1.0 | 0.97 | 0.98 |
| 7 | Uric Acid, Albumin | DT | 0.98 | 0.98 | 0.99 | 0.97 | 0.98 |
| 8 | Uric Acid, Albumin | RF | 0.98 | 0.98 | 1.0 | 0.97 | 0.98 |
| 9 | BMI, Age, Uric Acid | SVM | 0.98 | 0.98 | 1.0 | 0.97 | 0.98 |
| 10 | BMI, Uric Acid, Sex | SVM | 0.98 | 0.98 | 1.0 | 0.96 | 0.98 |
| 11 | BMI, Uric Acid, Albumin | LR | 0.98 | 0.99 | 1.0 | 0.97 | 0.98 |
| 12 | BMI, Uric Acid, Albumin | SVM | 0.98 | 0.98 | 1.0 | 0.97 | 0.98 |
| 13 | Age, Uric Acid, Sex | SVM | 0.98 | 0.98 | 1.0 | 0.96 | 0.98 |
| 14 | Age, Uric Acid, Albumin | LR | 0.98 | 0.99 | 1.0 | 0.97 | 0.98 |
| 15 | Age, Uric Acid, Albumin | SVM | 0.98 | 0.98 | 1.0 | 0.97 | 0.98 |
| 16 | Age, Uric Acid, Albumin | RF | 0.98 | 0.98 | 1.0 | 0.96 | 0.98 |
| 17 | Uric Acid, Sex, Albumin | LR | 0.98 | 0.99 | 1.0 | 0.97 | 0.98 |
| 18 | Uric Acid, Sex, Albumin | SVM | 0.98 | 0.98 | 1.0 | 0.97 | 0.98 |
| 19 | Uric Acid, Sex, Albumin | DT | 0.98 | 0.98 | 0.99 | 0.97 | 0.98 |
| 20 | Uric Acid, Sex, Albumin | RF | 0.98 | 0.98 | 1.0 | 0.97 | 0.98 |
| 21 | BMI, Age, Uric Acid, Sex | SVM | 0.98 | 0.98 | 1.0 | 0.97 | 0.98 |
| 22 | BMI, Age, Uric Acid, Albumin | SVM | 0.98 | 0.98 | 1.0 | 0.97 | 0.98 |
| 23 | BMI, Uric Acid, Sex, Albumin | LR | 0.98 | 0.99 | 1.0 | 0.97 | 0.98 |
| 24 | BMI, Uric Acid, Sex, Albumin | SVM | 0.98 | 0.98 | 1.0 | 0.97 | 0.98 |
| 25 | Age, Uric Acid, Sex, Albumin | LR | 0.98 | 0.99 | 1.0 | 0.97 | 0.98 |
| 26 | Age, Uric Acid, Sex, Albumin | SVM | 0.98 | 0.98 | 1.0 | 0.97 | 0.98 |
| 27 | BMI, Age, Uric Acid, Sex, Albumin | SVM | 0.98 | 0.98 | 1.0 | 0.97 | 0.98 |
| 28 | Uric Acid | SVM | 0.97 | 0.97 | 0.99 | 0.96 | 0.97 |
| 29 | Uric Acid | DT | 0.97 | 0.97 | 0.99 | 0.96 | 0.97 |
| 30 | BMI, Uric Acid | RF | 0.97 | 0.97 | 0.98 | 0.96 | 0.97 |
AUC, area under the receiver operating characteristic curve; BMI, body mass index; DT, decision tree; LR, logistic regression; RF, random forest; SVM, support vector machine. The table presents the 30 highest-performing machine learning models for the classification of metabolic syndrome, ranked according to accuracy. Model performance was evaluated using accuracy, area under the receiver operating characteristic curve, precision, recall, and F1-score. Input indicates the combination of clinical and laboratory variables included as predictors in each model.
Disclaimer/Publisher’s Note: The statements, opinions and data contained in all publications are solely those of the individual author(s) and contributor(s) and not of MDPI and/or the editor(s). MDPI and/or the editor(s) disclaim responsibility for any injury to people or property resulting from any ideas, methods, instructions or products referred to in the content. |
© 2026 by the authors. Licensee MDPI, Basel, Switzerland. This article is an open access article distributed under the terms and conditions of the Creative Commons Attribution (CC BY) license (http://creativecommons.org/licenses/by/4.0/).
Copyright: This open access article is published under a Creative Commons CC BY 4.0 license, which permit the free download, distribution, and reuse, provided that the author and preprint are cited in any reuse.