
Submitted:
27 August 2026
Posted:
28 August 2026
You are already at the latest version
Abstract
Urban inundation forecasting in high-density cities is complicated by sparse incident labels, nonstationary rainfall, and changing sensing systems. Using Taipei as a case study, we develop a building-scale GeoAI decision-support prototype that integrates 30,421 LOD1 building-centroid nodes, 41,636 graph edges, built-environment attributes, and eight extreme-rainfall events from 2015 to 2026. We evaluate a static inundation-susceptibility baseline, 60- and 120-min event-level forecasts, tree-ensemble models, a Temporal GNN, and ConvLSTM, and separately test temporal and spatial transfer under compound distribution shift. The analysis adopts a positive-unlabeled (PU) learning perspective and distinguishes event-level, pooled, temporal-transfer, spatial-transfer, and scale-sensitivity evaluation regimes. Across seven events with verifiable outputs, macro-averaged AUCs were 0.694 at 60 min and 0.677 at 120 min. XGBoost achieved the highest AUC (0.682) in a benchmark with non-equivalent spatial support, whereas forward temporal validation fell to 0.490. Physics-based synthetic augmentation increased the mean AUC for four historical gauge-era events from 0.4965 to 0.6768, although one event deteriorated. These results define the conditions under which building-scale GeoAI remains informative and where it fails, providing a more defensible basis for urban-resilience decision support, climate adaptation, and infrastructure continuity.
Keywords:
GeoAI
; urban inundation
; short-horizon prediction
; sparse labels
; distribution shift
; urban resilience
; physics-based augmentation
; building-scale prediction
1. Introduction
Climate change is increasing the risk of short-duration, high-intensity rainfall in urban areas. In dense cities, high population exposure, extensive impervious cover, concentrated critical infrastructure, and finite drainage capacity can convert intense rainfall into transport disruption, service interruption, and localized inundation [1,2]. Urban flooding is therefore both a hydrological hazard and a challenge for sustainable development and urban resilience. Effective response depends on risk information that is timely and spatially resolved, but also sufficiently reliable when data distributions change. Li et al. [30] show that urban flood-risk assessment has evolved from historical incident statistics and multi-criteria indicator systems toward remote sensing/geographic information system (RS/GIS) approaches, scenario simulation, and machine learning; across these approaches, data completeness, spatial scale, and sample reliability remain persistent constraints.
Physically based hydraulic models remain essential for interpretable inundation simulation and scenario planning, but high-resolution citywide applications typically require substantial data, parameterization, and computational resources [3,30]. Data-driven surrogate models and machine-learning methods offer a complementary route for rapid flood mapping and short-horizon prediction [4,5,6,7]. Tong et al. [33], for example, combined satellite-image semantic segmentation with XGBoost to identify urban waterlogging risk factors in Haikou, Xiamen, Shanghai, and Qingdao, illustrating the value of structured geographic predictors and tree ensembles. Their task, labels, and sampling design differ materially from event-level lead-time prediction, however, so the reported performance estimates are not directly comparable with those in this study. Digital-twin research emphasizes dynamic data fusion, state updating, and decision support [8,9,10,11,12], yet disaster data rarely satisfy the required stability assumptions: incident labels are sparse and reporting-biased, rainfall sensing systems evolve, model families may operate on different spatial supports, and future events can depart from the training distribution.
Analytical scale also shapes how flood resilience is interpreted. In a review of 118 studies, Mabrouk et al. [31] found that 80.5% examined urban form at the macro scale, whereas only 10.2% focused on the micro scale; differences in scale, indicators, and case context can produce divergent resilience assessments. In high-density Taipei, administrative districts or coarse regular grids can obscure local variation in building configuration, elevation, street-block structure, and drainage conditions. We therefore use LOD1 building assets as the primary analytical unit to retain local heterogeneity and to examine flood risk at a scale that more closely reflects asset-level exposure.
Three unresolved issues are particularly consequential for deployment. First, strong discrimination in retrospective or mixed-event cross-validation does not guarantee extrapolation to later events. Fang et al. [34] demonstrated this distinction with a mixed urban-flood dataset spanning six Chinese cities, where cross-city generalization was assessed explicitly through graph models, transfer learning, and external-city validation rather than inferred from internal validation scores. Second, the performance of graph neural networks and spatiotemporal recurrent models depends on label density, graph construction, spatial support, training-data diversity, and benchmark comparability [13,14,15,27,28,29,34]. Third, resilience-oriented warning systems cannot assume that radar rainfall, gauge interpolation, and other sensing sources retain stable error structures over time. Changes in sensing technology, event era, and storm type can jointly induce distribution shift. If these failure modes are not tested explicitly, strong historical scores may overstate operational reliability.
To address these issues, we develop a building-scale GeoAI decision-support prototype for Taipei using eight extreme-rainfall and typhoon-related events. The dataset contains 30,421 LOD1 building-centroid nodes, 41,636 graph edges, terrain and built-environment attributes, dynamic rainfall, and event labels. The model set includes tree ensembles, a Temporal GNN, and ConvLSTM. In addition to event-level lead-time prediction, we evaluate temporal and spatial transfer and conduct a compound-domain-transfer experiment that combines gauge interpolation with physics-based synthetic augmentation. The design separates retrospective discrimination from genuine transferability and therefore treats the system as a digital-twin-oriented prototype rather than as an operational digital twin that has already been validated in deployment.
The analysis is organized around three research questions. RQ1 asks whether dynamic rainfall information improves short-horizon discrimination relative to a static inundation-susceptibility baseline and whether any gain persists under forward temporal extrapolation. RQ2 examines the performance differences observed between tree ensembles and spatiotemporal deep models under the existing benchmark, while identifying the design factors that prevent those differences from being attributed to architecture alone. RQ3 evaluates whether physics-based synthetic augmentation can reduce cross-domain performance loss when sensing systems, event eras, and storm types change.
Accordingly, the analysis is organized around reliability boundaries rather than peak validation scores. Event-level performance varies substantially, and forward temporal AUC approaches random discrimination, indicating that transfer across event eras is a primary limitation. Event macro-averaging, pooled node/time evaluation, temporal transfer, spatial transfer, and scale sensitivity are therefore reported as distinct evidence streams rather than collapsed into a single performance claim. The practical question is not only how well the model performs within a familiar data regime, but also whether it can reveal its own failure conditions, quantify uncertainty, and preserve service continuity when the data-generating process changes.
2. Related Work
2.1. Urban Inundation Susceptibility and Short-Horizon Prediction
Urban flood-risk research has moved from predominantly static assessment toward increasingly dynamic prediction. Li et al. [30] group existing approaches into historical disaster statistics, multi-criteria indicators, RS/GIS coupling, scenario simulation, and machine learning. Machine learning is comparatively fast, flexible, and scalable, but its reliability still depends on the completeness and credibility of the underlying samples. Inundation-susceptibility models typically combine terrain, land cover, drainage, and exposure features to identify flood-prone locations [3,6,7,30], while convolutional and recurrent architectures support rapid inundation mapping and multi-step prediction [4,5,15]. Recent CNN–ConvLSTM work further demonstrates the potential of spatiotemporal surrogate models for real-time urban flood forecasting [28].
Tong et al. [33] provide a useful methodological point of comparison. Across four coastal cities, they used U-Net to extract water bodies, roads, and green spaces from satellite imagery and then applied XGBoost to identify inundation locations and risk factors. Their five-fold mean AUC was 0.88, with elevation emerging as the dominant factor in all four cities. These results support the use of tree ensembles for structured geographic predictors and are consistent with our inclusion of elevation, built-environment, and land-use variables. The underlying prediction problem is nevertheless different: Tong et al. paired social-media inundation points with an equal number of randomly generated non-inundated points, producing a comparatively balanced static risk-identification task, whereas the present analysis uses extremely sparse administrative incident labels in an event-level lead-time setting. The corresponding AUC values should therefore not be compared directly.
This difference in label construction makes evaluation design central to interpretation. Urban disaster labels are often event-specific, sparse, and severely imbalanced, so random sampling or pooled node-level evaluation can overstate performance on genuinely unseen events. With rare positive cases, ROC AUC may also conceal weak positive-class recognition, whereas the precision–recall curve can be more informative [16]. Probability calibration is equally relevant when predicted risks are intended to support decisions [17]. Because the retained aggregate outputs do not allow sample-level probabilities to be reconstructed, PR-AUC, calibration metrics, and test-fold optimized-threshold F1 are not treated as primary outcomes; their absence is instead documented as a limitation requiring reanalysis.
2.2. Digital Twins, GeoAI, and Urban Resilience
A digital twin is commonly understood as a continuously updated virtual representation that supports monitoring, simulation, diagnosis, and decision making [8,9]. Dani et al. [32] proposed a four-layer smart-city architecture in Sustainability comprising basic information, 3D city assets, a digital-twin layer with real-time data integration, and an augmented layer for presentation and interaction. Their maturity framework places real-time sensor integration at Level 3, bidirectional data integration and interaction at Level 4, and autonomous operation at Level 5. They also describe a sensing–understanding–acting chain that links sensing, analysis, and visualization to monitoring, simulation, and decision support. By this definition, a full digital twin requires more than retrospective analysis: it also requires persistent data links, state synchronization, and operational interfaces. Because those capabilities are not demonstrated here, we use the more precise terms “digital-twin-oriented GeoAI prototype” and “building-scale decision-support framework.”
2.3. Graph and Spatiotemporal Learning under Sparse Labels
Graph neural networks offer a natural representation for irregular urban spaces and drainage networks. When graph topology, learning objectives, and physical constraints are appropriately designed, hydraulics-informed GNNs and spatiotemporal graph-recurrent models can perform effectively in flood prediction [13,14]. Multi-scale hydraulic GNNs further suggest that explicit representation of propagation scales, boundary conditions, and physical constraints can improve transfer to unseen grids and terrain [27]. Recent probabilistic flood-mapping work likewise emphasizes realistic benchmark data and external validation [29]. Fang et al. [34] extended this line of work using a mixed dataset from Beijing, Shanghai, Shenzhen, Wuhan, Hangzhou, and Shijiazhuang, combining GCNs, spiking neural networks, and particle-swarm optimization with cross-city data, transfer learning, and external observations. Together, these studies show that cross-domain graph-model performance is inseparable from data diversity, graph construction, and validation design.
This dependency is important when interpreting model comparisons. Fang et al. [34] used consistent input features, data splits, and hardware conditions in their principal benchmark and reported Precision, Recall, F1, PR-AUC, and ROC-AUC, providing a comparatively well-matched cross-architecture evaluation. Our benchmark differs substantially in spatial support: the tree models use 30,421 building nodes, the Temporal GNN uses a 2,536-node hotspot subgraph, and ConvLSTM uses a 250 m regular grid. The resulting performance differences are therefore descriptive of the implemented configurations rather than evidence that one model class is generally superior. Similarly, the low Temporal GNN AUC cannot by itself diagnose oversmoothing; layer-wise representation analysis and graph ablations are required.
2.4. Weak Labels, PU Learning, and Distribution Shift
Administrative incident reports do not provide a complete census of all inundated locations. A node that was “not reported” is not equivalent to a node that was verified as “not inundated.” The resulting data structure is more consistent with positive-unlabeled (PU) learning, in which observed positives coexist with a large unlabeled set rather than with error-free positive and negative classes [19,20]. Treating every unreported node as a true negative could therefore distort both observed prevalence and model evaluation when reporting intensity varies across space or events.
Changes in rainfall sensing systems create a second source of distribution shift. Radar quantitative precipitation estimates (QPEs) can improve hydrological-model calibration and flood forecasting, but radar products and gauge interpolation differ in spatial support, error structure, and availability [21]. When a change in sensing source coincides with changes in event era, storm type, and label quality, any performance difference should be interpreted as compound domain transfer rather than as the isolated effect of “missing radar.”
Within Sustainability, recent studies have addressed urban flood-risk assessment, multi-scale urban form and flood resilience, digital-twin decision platforms, XGBoost-based geographic risk identification, and cross-city graph models with transfer learning [30,31,32,33,34]. What remains uncommon is a single validation framework that combines building-asset scale, sparse and incompletely labeled incident data, event-level short-horizon prediction, genuine temporal and spatial extrapolation, and distribution shifts induced by changing sensing systems. The present study addresses this gap by focusing on the range of conditions under which GeoAI remains informative, the conditions under which it fails, and the implications of those limits for digital-twin-oriented urban-resilience decisions.
Figure 1 summarizes the resulting research framework. The workflow begins with problem identification and links theory and needs assessment to model development, transfer and generalization testing, and capability-boundary identification in application scenarios. Label uncertainty, distribution shift, and model interpretability are treated as connected components of the same validation process rather than as secondary checks applied after a single headline performance score has been obtained.
3. Materials and Methods
3.1. Study Area and Analytical Unit
Taipei is a high-density basin city where short-duration convective rainfall interacts with low-lying alluvial terrain, highly urbanized surfaces, and a complex drainage network. Mabrouk et al. [31] distinguish macro-scale, regional/neighborhood meso-scale, and block/building micro-scale dimensions of urban form in relation to flood resilience, noting that building configuration, density, street elements, and site layout can influence local resilience. We therefore use LOD1 building centroids as the primary analytical unit so that risk representation is closer to asset-scale exposure and local morphological variation. The dataset contains 30,421 building-centroid nodes and 41,636 graph edges. Finer spatial support can preserve local heterogeneity, but it does not imply stronger temporal generalization; scale sensitivity and event-level lead-time prediction are therefore evaluated separately.
3.2. Data Sources and Temporal Alignment
The integrated dataset includes rain-gauge precipitation, radar QPE, terrain, sewer infrastructure, buildings, population, land use, and inundation labels. Table 1 distinguishes dynamic inputs aligned to event periods from contemporary proxy layers. Population data are from 2024 and land-use data from 2025, both of which postdate several historical events. These variables are therefore used only as contemporary proxies for spatial vulnerability and are not interpreted as historical conditions at the time of each event. The possible bias introduced by this temporal mismatch is addressed explicitly in the limitations.
3.3. Event Set and Inundation-Label Construction
The analysis covers eight extreme-rainfall and typhoon-related events from 2015 to 2026. Historical records indicate that five events include field incident reports or directly observed labels, whereas three rely in part on weak labels generated by official hydraulic simulations. Because a complete event-by-event mapping between rainfall events and label sources is unavailable, we do not conduct a confirmatory comparison between an “observed ground-truth” group and a “simulated weak-label” group. Moreover, “not reported” in municipal systems such as the 1999 citizen hotline cannot be treated as physical evidence of no inundation. The label structure is therefore handled as a positive-unlabeled learning problem: source heterogeneity is treated as a measurement limitation, and unreported nodes are not assumed to be verified negatives.
E2016_Megi in Table 2 requires separate interpretation. The 530 inundated nodes identified for this event (prevalence 1.742%) consist mainly of weak labels derived from official hydraulic simulation rather than direct field reports. This systematic difference in label construction may partly explain the unusually high event-level performance at the 60-min lead time (AUC = 0.963). The estimate should therefore be interpreted in light of the greater spatial continuity and label-smoothing properties of simulated data rather than as directly comparable evidence from the observed-event subset.
3.4. LOD1 Nodes and Urban/Sewer Graph Construction
Each building-centroid node is described by 13 static natural and built-environment features. The urban graph G = (V, E) combines spatial-proximity relations with sewer-network connectivity, with |V| = 30,421 and |E| = 41,636. A complete sensitivity analysis has not yet been conducted for the spatial-proximity radius or k-nearest-neighbor rule, edge direction and weighting, treatment of multiple edges and isolated components, or the selection procedure for the 2,536-node GNN hotspot subgraph. The low Temporal GNN AUC should therefore not be attributed directly to oversmoothing; graph specification and subgraph selection remain plausible alternative explanations.
3.5. Lead-Time Prediction Task and Horizons
The static baseline estimates event-level inundation susceptibility from static attributes, whereas the dynamic task predicts whether building node i will become inundated within the interval (t, t + Δ]. Prediction horizons are Δ ∈ {30, 60, 120} min. Inputs include the static features together with 1-, 3-, and 6-h accumulated rainfall, total accumulated rainfall, and recent maximum rainfall intensity. Event-level AUC records are most complete for the 60- and 120-min horizons, so the primary comparison focuses on macro-averaged performance at these lead times. The 120-min horizon is treated as an evaluation point, not as a fixed hydrological threshold.
3.6. Models and Benchmark Comparison
We evaluate logistic regression, random forest, XGBoost, Temporal GNN, and ConvLSTM. This set spans two methodological strands represented in recent Sustainability studies: structured geographic risk modeling with XGBoost [33] and spatiotemporal graph/sequence modeling for urban flood data [34]. In our implementation, random forest and XGBoost operate primarily at the building-node scale, the Temporal GNN uses a 2,536-node hotspot subgraph, and ConvLSTM uses a 250 m regular grid. Because the spatial support and sample composition are not equivalent, Table 5 should be read as a benchmark of implemented configurations rather than as a controlled comparison of model classes.
Several mechanisms could account for the low Temporal GNN AUC, including sparse labels, hotspot-subgraph selection, graph-structure mismatch, loss-function choice, limited tuning, and oversmoothing. A single discrimination score cannot identify which mechanism dominates. Further diagnosis requires matched spatial support together with graph ablations and representation-level analysis [18,27,29]. The cross-city results of Fang et al. [34] reinforce the same point: graph-model generalization depends on training-data diversity, topology construction, benchmark comparability, and external-validation design rather than on architecture labels alone.
3.7. Compound Distribution Shift and Physics-Based Augmentation Experiment
For the compound distribution-shift experiment, we train on recent QPE-era events and test on gauge-era events from 2015–2019. The augmentation strategy combines gauge/Kriging information with synthetic inundation scenarios generated by offline hydraulic simulation. Training and test data differ simultaneously in sensing source, event era, storm type, label quality, and versions of static covariates. The experiment is therefore interpreted as compound domain transfer, not as a causal test that isolates the effect of missing QPE. The available outputs support event-level performance comparison but do not identify a single sensing factor as the source of any gain.
3.8. Evaluation Metrics and Statistical Inference
We report AUC under separate evaluation regimes to avoid conflating distinct spatiotemporal scales. Event-level macro-averaged AUC in Table 3 captures variation across rainfall events, whereas the pooled spatiotemporal AUC is treated as exploratory because it ignores within-event dependence and can be optimistically biased. Forward temporal AUC and buffered spatial-transfer AUC are used to approximate two operationally relevant forms of extrapolation: transfer to later eras and transfer to new geographic partitions. Because these metrics answer different questions and rely on different statistical assumptions, they are not treated as directly interchangeable.
Observations within each event are strongly dependent in space and time, so conventional node-level DeLong tests and bootstrap procedures can understate uncertainty and produce overly narrow confidence intervals. We therefore do not use node-level p-values as confirmatory evidence. Inference instead emphasizes event-level AUC distributions, effect direction, spatiotemporal transfer, and blocked cross-validation designed to reflect realistic extrapolation difficulty. Sample-level predicted probabilities are not available in the retained aggregate outputs, which precludes PR-AUC and probability-calibration analyses. A Wilcoxon signed-rank test across seven paired event-level AUC values is reported as supplementary directional evidence (one-sided p = 0.047), not as a stand-alone confirmatory result.
3.9. Uncertainty and Reproducibility
We group uncertainty into five conceptual categories: data/labels, model configuration, spatial representation, temporal alignment, and rainfall forcing. These sources may be correlated, so they are treated as a taxonomy rather than combined through an unsupported additive variance decomposition. If complete sample-level predictions and repeated-experiment outputs become available, hierarchical models, nested bootstrap procedures, or formal uncertainty-propagation methods could be used to estimate the contribution and interaction of individual sources.
The current reproducibility record includes the data sources in Table 1, event-level results, and model definitions. Complete software versions, random seeds, hyperparameter-search spaces, and a persistently archived code repository are not yet available. We therefore do not present code openness as an existing study output; these items should be added when the experiments are reproduced and the associated materials are formally released.
4. Results
4.1. Event Heterogeneity and Label Audit
Positive-class prevalence across the eight events ranges from approximately 0.049% to 1.742%, indicating severe class imbalance and marked event-to-event heterogeneity. Under these conditions, event-level evaluation is more interpretable than a pooled node-level metric because large events and repeated negative observations can dominate the pooled result. Because the labels combine reported/observed cases with weak labels, performance is presented event by event rather than through a confirmatory comparison stratified by label source.
Incident-report time is used as the event-time annotation when available; otherwise, peak-rainfall time serves as a proxy for inundation onset(Figure 2). Because the dynamic predictors include antecedent rainfall accumulations, this approximation may affect the information boundary between predictor and label time. We therefore interpret the dynamic outputs as retrospective event-conditioned predictions rather than as real-time nowcasts that have undergone a fully leakage-free operational validation.
4.2. Static Inundation Susceptibility and Dynamic Short-Horizon Prediction
The static random-forest inundation-susceptibility baseline yields an AUC of 0.597. At a 60-min lead time, the event-level macro-averaged AUC is 0.694, numerically 0.097 higher. Because the static and dynamic analyses do not use fully matched event sets, labels, and prediction units, this difference is descriptive and is not interpreted as a paired effect. The 120-min macro-averaged AUC is 0.677, only 0.017 below the 60-min value. With only a limited set of lead times and no independent estimate of catchment concentration time, these results do not establish either exponential performance decay or a fixed physical predictability threshold; they show only a modest decline as lead time increases.
For E2024_Gaemi, the retained archive does not contain a verifiable sample-level predicted-probability file, so the event-level AUC is recorded as NA in Table 4 rather than treated as a model failure. The seven remaining computable events span the 2015–2026 analysis period and are sufficient for the descriptive comparisons reported here; the missing event-specific AUC does not alter the main interpretation of the results.
Figure 3 illustrates the predicted spatial risk surfaces along with the observed and simulated flood incident labels across the eight evaluated events (panels a–h). The color gradient represents the normalized cumulative rainfall risk, while the blue circles indicate building nodes with affirmative flood labels. Across high-severity events such as E2016_Megi (panel b) and E2026_Mekkhala (panel h), predicted risk distributions align closely with spatial clusters of flooded nodes, particularly along low-lying topographic depressions and main drainage paths. Conversely, in events with low positive-label counts (e.g., E2022_Nesat in panel e and E2024_Kongrey in panel g), the model assigns elevated susceptibility to susceptible topographies despite localized or absent label validation. This visual comparison highlights how event-to-event variability in label density and spatial extent influences local risk discrimination.
4.3. Model-Architecture Comparison: AUC Ranking Depends on Spatial Support
Table 5 summarizes the model benchmark. Under the implemented, non-equivalent spatial supports, XGBoost has the highest AUC (0.682), followed by random forest (0.597), ConvLSTM (0.440), and Temporal GNN (0.438). These values describe discrimination within the respective configurations; they do not constitute a strictly matched architecture comparison and therefore do not support the general claim that tree-based models outperform deep learning.
The low Temporal GNN AUC is compatible with several explanations, including sparse labels, hotspot-subgraph selection, graph-structure mismatch, loss-function choice, insufficient tuning, and oversmoothing. Without layer-wise representation diagnostics and targeted graph ablations, the dominant mechanism cannot be identified. Oversmoothing is therefore retained as a testable hypothesis rather than presented as an established cause.
4.4. Temporal and Spatial Transfer Reveal the Main Predictive Boundaries
Temporal and spatial transfer tests reveal a substantially narrower validity range than retrospective evaluation. Models trained on events from 2015–2019 and forward-validated on 2022–2024 events achieve an AUC of 0.490, close to random discrimination and well below the values obtained under random resampling. The learned relationships therefore do not generalize reliably to later event eras characterized by nonstationary rainfall and changes in sensing systems. On the present evidence, the model does not yet justify a claim of operational warning performance. To avoid post hoc adjustment of the baseline, the 2026 event is used only for local physical-context analysis.
Spatial transfer shows a similar limitation. Without a buffer, West-to-East and East-to-West AUC values are 0.980 and 0.609, respectively. The unusually high West-to-East estimate is likely optimistic because the two partitions share local terrain and drainage structure along their boundary and the western area contains more low-lying nodes. After non-overlapping buffered blocks are introduced to reduce spatial dependence, AUC falls to 0.523 and 0.574. The contrast underscores the importance of blocked validation for environmental data with strong spatiotemporal autocorrelation and of independent external validation before cross-area deployment.
4.5. Compound Distribution Shift and Physics-Based Augmentation
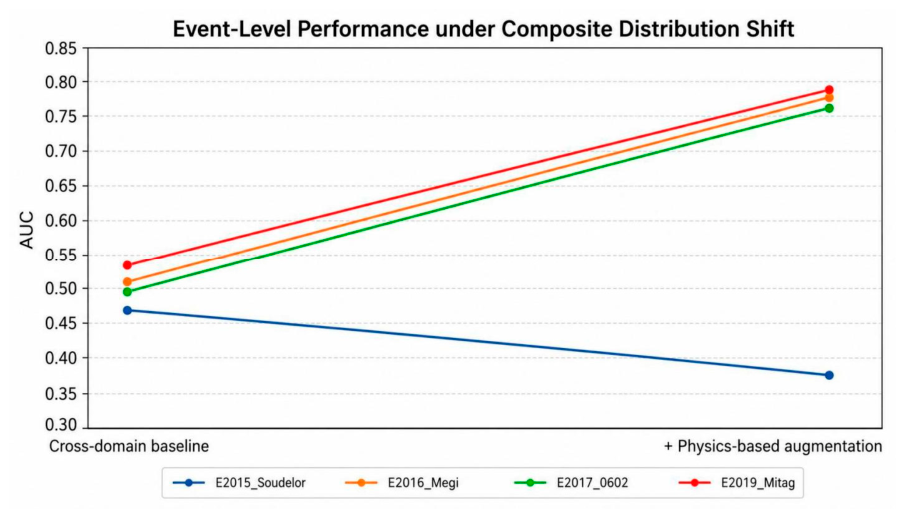
Across the four 2015–2019 gauge-era events, a model trained on QPE-era events yields a mean AUC of 0.4965 (Table 6). With physics-based synthetic augmentation, the mean rises to 0.67675, a gain of 0.18025. The improvement is not uniform: three events improve, whereas E2015_Soudelor declines from 0.468 to 0.363. Physics-based augmentation can therefore be beneficial under compound distribution shift, but the available results do not support treating it as a universally reliable recovery strategy.
Figure 4.
Event-level AUC before and after physics-based augmentation for four historical events under compound distribution shift.
Figure 4.
Event-level AUC before and after physics-based augmentation for four historical events under compound distribution shift.
4.6. Sensitivity Results and Metric Separation
Under the 60-min baseline, perturbing elevation/manhole depth by ±0.5 m and rainfall by ±20% changes AUC by less than 0.01, indicating limited sensitivity to perturbations of these magnitudes. This local robustness does not substitute for genuine temporal-transfer validation. In the scale comparison, LOD1 yields an AUC of 0.976, compared with 0.842, 0.859, and 0.820 for 50, 100, and 250 m grids, respectively. Because this scale experiment produces substantially higher AUC values than the principal event-level prediction task, it is treated as an independent spatial-resolution analysis rather than as evidence about the main lead-time model.
4.7. Local Physical Context of the 25 June 2026 Event
For the 25 June 2026 event, several inundation locations in Neihu coincide spatially with historical low-lying corridors, sewer-pipe slopes, and drainage constraints. The maps (Figure 5 and Figure 6) provide contextual evidence on terrain and infrastructure, but they do not establish causal model mechanisms. Central Weather Administration records identify Typhoon Mekkhala (MEKKHALA, No. 07) on that date, and Taipei City Government reported that rainfall associated with the typhoon’s outer circulation reached a maximum hourly intensity of 100.5 mm at the Dahu Creek station in Neihu, exceeding the Taipei storm-sewer design protection standard of 78.8 mm/h. The event is therefore used to illustrate the joint context of short-duration intense rainfall, local terrain, and drainage capacity rather than as direct validation of the model’s internal mechanism [23,24].
5. Discussion
5.1. Core Finding: Predictive Performance Is Strongly Context-Dependent
The central empirical result is the divergence between retrospective discrimination and genuine transfer performance. The 60-min event-level macro-averaged AUC is 0.694, indicating useful discrimination for some held-out events, whereas the forward temporal AUC is only 0.490. Relationships that appear informative within the historical event set therefore do not extend reliably to later eras. For disaster decision support, this gap is more consequential than a single internal-validation score because it defines where the model is likely to remain useful and where its predictions become unreliable.
The pooled node/time AUC of 0.811 illustrates the same point from a different angle: it coexists with event-level AUC values ranging from below 0.5 to above 0.9. A large number of correlated node-time observations does not provide the same information as an equivalent number of independent storm events. Much of the uncertainty lies between events rather than within a pooled sample. Event-level inference is therefore more appropriate for this dataset than treating highly correlated node observations as independent evidence.
5.2. What the Model Comparison Can and Cannot Establish
Table 5 does not support a general claim that random forests or tree ensembles outperform deep learning. XGBoost performs best under the current settings, but the architectures use different spatial representations. Tong et al. [33] likewise reported strong XGBoost discrimination for static inundation-risk identification in four coastal cities (five-fold mean AUC = 0.88), supporting the practical value of tree ensembles for structured geographic predictors such as elevation, roads, water bodies, and green spaces. Their design, however, used randomly generated non-inundated points to balance the positive class, unlike the event-level lead-time task and extreme label sparsity examined here. The two AUC estimates therefore describe different data-generating and validation regimes and should not be compared as if they were produced by the same experiment.
The Temporal GNN result requires the same contextual caution. Deep message-passing networks are theoretically susceptible to oversmoothing [18], but a low AUC is not, by itself, a diagnosis. Fang et al. [34] combined GCNs, temporal spiking models, and transfer learning on a mixed six-city dataset and evaluated the approach with external-city data, providing a useful contrast with the weak Temporal GNN performance obtained here under a single-city, extremely sparse-label, and spatially unmatched setting. Neither result implies that GNNs are intrinsically suitable or unsuitable for flood prediction. Instead, the combined evidence points to the importance of data diversity, label quality, graph topology, hyperparameter search, and validation design [27,29]. A fairer future benchmark should harmonize data splits and metrics and include directed hydraulically weighted graphs, no-edge and MLP controls, GraphSAGE/GAT variants, and representation-smoothing diagnostics.
5.3. Distribution Shift, Redundancy, and Resilience-Oriented Decision Support
The compound-domain-transfer experiment makes the model’s vulnerability under non-ideal data conditions explicit. Physics-based augmentation increases mean AUC across four historical events, but performance deteriorates for Soudelor while sensing era, label quality, and storm characteristics also change. The improvement is therefore heterogeneous and cannot be assigned to a single mechanism. A stronger follow-up design would compare gauge interpolation, physics-based augmentation, and their combination within the same outer folds, with synthetic scenarios generated only inside the training folds to reduce information leakage.
For resilience-oriented urban infrastructure, the ability to detect and manage failure conditions may be more important than maximizing performance within one familiar data domain. A practical decision-support system should identify sensing-system changes and distribution shift, quantify the associated uncertainty, and switch to validated fallback inputs when the model moves beyond its supported operating range. On the available evidence, this is a more defensible characterization of the system than describing it as an operational digital twin.
5.4. Implications for Urban Sustainability and Climate Adaptation
At building scale, risk estimates can inform the prioritization of drainage inspection, facility maintenance, emergency routes, and protection of critical facilities. Li et al. [30] note that flood-risk assessment is valuable not only for risk zoning but also for gaining decision time for early warning, emergency-resource allocation, and risk management. Mabrouk et al. [31] define flood resilience in terms of the capacity to anticipate, withstand, recover from, and adapt to flood impacts while maintaining function, with redundancy, adaptability, flexibility, and foresight as central attributes. From this perspective, the value of building-scale GeoAI depends less on a single AUC than on its ability to provide reliable, actionable information under data drift, sensing changes, and extreme events.
These findings link GeoAI performance to infrastructure continuity, uncertainty governance, and multi-scale flood resilience [30,31]. The failure observed in forward temporal validation indicates that adaptive urban analytics require continuous validation, explicit data-governance rules, and pre-specified triggers for model updating. A model that performs well under historical resampling but degrades under temporal shift can reduce decision quality if that degradation is not detected. A more robust path toward a digital-twin deployment would combine multi-event retrospective evaluation with temporal and spatial extrapolation tests and complete label auditing, distribution-shift monitoring, runtime diagnostics, and sensing-redundancy assessment before the system is connected to municipal warning or control interfaces.
5.5. Limitations and Priorities for Future Research
First, the number of independent events is limited and event heterogeneity is substantial. Node-level resampling can therefore overstate statistical precision, so extremely small node-level p-values or very narrow confidence intervals are not used as primary evidence.
Second, a complete event-by-event mapping between the five events with reported labels and the three events containing weak labels has not been established, and unreported nodes are not verified true negatives. This limits any stratified analysis of label error or label-source effects.
Third, peak-rainfall time is used as a proxy for inundation onset in some events, and the sample-level feature–label timeline has not been systematically audited. The dynamic results should therefore be interpreted as retrospective event-conditioned predictions rather than as validated real-time nowcasts.
Fourth, the 2024 population and 2025 land-use layers postdate several historical events and can only serve as contemporary proxies for spatial vulnerability. This temporal mismatch may affect estimates for earlier events.
Fifth, the model families use different spatial supports, so the current benchmark is not a strictly controlled architecture experiment. The ranking describes the implemented configurations and should not be generalized into a universal hierarchy of model classes.
Sixth, sample-level predicted probabilities and independent threshold-selection records are incomplete. Consequently, F1 at an optimized threshold, PR-AUC, calibration, recall at a fixed false-alarm rate, Brier score, and decision-curve analysis are not reported as primary outcomes.
Seventh, the physics-based augmentation workflow lacks complete documentation of hydraulic-model versioning, scenario generation, sample weighting, and within-fold generation. Because the experiment also combines differences in era, label source, and event type, the result supports an interpretation of compound domain transfer but not a causal claim about any single sensing-degradation mechanism.
Eighth, the system has not yet undergone real-time data streaming, online updating, bidirectional synchronization, municipal-interface integration, or operational-reliability testing. It is therefore best described as a digital-twin-oriented GeoAI prototype. Under the maturity framework of Dani et al. [32], the current system has not reached Level 3 real-time sensor-data integration or Level 4 bidirectional interaction and control. Further development should establish continuous data connectivity and add cross-city external validation and updateable domain adaptation, building on the transfer-learning design of Fang et al. [34], to test robustness across new cities, sensing systems, and climate contexts.
6. Conclusions
This study evaluated a building-scale GeoAI prototype for short-horizon urban inundation prediction using eight extreme-rainfall and typhoon-related events in Taipei.
At the event level, the 60-min macro-averaged AUC is 0.694, compared with 0.597 for the static baseline. The numerical difference is 0.097, but the two tasks are not confirmed to use fully identical samples, labels, and analytical units, so no strong paired inference is made. At 120 min, the macro-averaged AUC is 0.677, only 0.017 below the 60-min value; the available lead-time evidence is insufficient to define a fixed physical predictability limit.
Model rankings are also contingent on experimental design. XGBoost has the highest AUC in the benchmark, whereas Temporal GNN and ConvLSTM are lower, but the models operate on different spatial supports. The ranking therefore motivates better-matched benchmarks and graph-structure diagnostics rather than a general conclusion that tree-based methods outperform deep learning.
The clearest barrier to deployment is transfer across time and space. Forward temporal validation yields an AUC of 0.490, strict spatial transfer is weak, and physics-based augmentation improves the mean AUC of four historical gauge-era events from 0.4965 to 0.67675 while degrading one event. The main contribution is therefore not a claim of universally strong predictive performance, but an empirical delineation of the operating conditions under which building-scale GeoAI remains informative and the conditions under which it fails. This capability-boundary perspective supports a more defensible digital-twin-oriented decision-support strategy for urban resilience and climate adaptation.
Author Contributions
[To be completed by the authors according to the CRediT taxonomy before submission.].
Funding
[To be confirmed by the authors before submission.]
Institutional Review Board Statement
Not applicable.
Informed Consent Statement
Not applicable.
Data Availability Statement
Public data sources and temporal references are listed in Table 1. Administrative incident records from the 1999 hotline are subject to the licensing and privacy conditions of the original data source and are not redistributed publicly. Subject to those conditions, shareable derived analytical data and code may be requested from the corresponding author upon reasonable request.
Acknowledgments
The authors thank the public agencies and data-providing organizations listed in Table 1 for supporting the data integration used in this study.
Conflicts of Interest
The authors declare no conflicts of interest.
References
- IPCC. Climate Change 2023: Synthesis Report; Intergovernmental Panel on Climate Change: Geneva, Switzerland, 2023. [Google Scholar]
- UNISDR. Making Development Sustainable: The Future of Disaster Risk Management; United Nations Office for Disaster Risk Reduction: Geneva, Switzerland, 2015. [Google Scholar]
- Teng, J.; Jakeman, A.J.; Vaze, J.; Croke, B.F.W.; Dutta, D.; Kim, S. Flood inundation modelling: A review of methods, recent advances and uncertainty analysis. Environ. Model. Softw. 2017, 90, 201–216. [Google Scholar] [CrossRef]
- Kabir, S.; Patidar, S.; Xia, X.; Liang, Q.; Neal, J.; Pender, G. A deep convolutional neural network model for rapid prediction of fluvial flood inundation. J. Hydrol. 2020, 590, 125481. [Google Scholar] [CrossRef]
- Lin, Q.; Leandro, J.; Gerber, S.; Disse, M. Multistep flood inundation forecasts with resilient backpropagation neural networks: Kulmbach case study. Water 2020, 12, 3568. [Google Scholar] [CrossRef]
- Mosavi, A.; Ozturk, P.; Chau, K.-W. Flood prediction using machine learning models: Literature review. Water 2018, 10, 1536. [Google Scholar] [CrossRef]
- Tehrany, M.S.; Pradhan, B.; Jebur, M.N. Flood susceptibility analysis and its verification using a novel ensemble support vector machine and frequency ratio method. Stoch. Environ. Res. Risk Assess. 2015, 29, 1149–1165. [Google Scholar] [CrossRef]
- Shahat, E.; Hyun, C.T.; Yeom, C. City digital twin potentials: A review and research agenda. Sustainability 2021, 13, 3386. [Google Scholar] [CrossRef]
- Batty, M. Digital twins. Environ. Plan. B Urban Anal. City Sci. 2018, 45, 817–820. [Google Scholar] [CrossRef]
- Hlal, M.; Baraka Munyaka, J.-C.; Chenal, J.; Azmi, R.; Diop, E.B.; Bounabi, M.; Ebnou Abdem, S.A.; Almouctar, M.A.S.; Adraoui, M. Digital Twin Technology for Urban Flood Risk Management: A Systematic Review of Remote Sensing Applications and Early Warning Systems. Remote Sens. 2025, 17, 3104. [Google Scholar] [CrossRef]
- Ge, C.; Qin, S. Urban flooding digital twin system framework. Syst. Sci. Control Eng. 2025, 13, 2460432. [Google Scholar] [CrossRef]
- Roudbari, N.S.; Punekar, S.R.; Patterson, Z.; Eicker, U.; Poullis, C. From data to action in flood forecasting leveraging graph neural networks and digital twin visualization. Sci. Rep. 2024, 14, 18571. [Google Scholar] [CrossRef] [PubMed]
- Bentivoglio, R.; Isufi, E.; Jonkman, S.N.; Taormina, R. Rapid spatio-temporal flood modelling via hydraulics-based graph neural networks. Hydrol. Earth Syst. Sci. 2023, 27, 4227–4246. [Google Scholar] [CrossRef]
- Kazadi, A.; Doss-Gollin, J.; Sebastian, A.; Silva, A. FloodGNN-GRU: A spatio-temporal graph neural network for flood prediction. Environ. Data Sci. 2024, 3, e21. [Google Scholar] [CrossRef]
- Shi, X.; Chen, Z.; Wang, H.; Yeung, D.-Y.; Wong, W.-K.; Woo, W.-C. Convolutional LSTM network: A machine learning approach for precipitation nowcasting. Adv. Neural Inf. Process. Syst. 2015, 28, 802–810. [Google Scholar]
- Saito, T.; Rehmsmeier, M. The Precision-Recall Plot Is More Informative than the ROC Plot When Evaluating Binary Classifiers on Imbalanced Datasets. PLoS ONE 2015, 10, e0118432. [Google Scholar] [CrossRef] [PubMed]
- Guo, C.; Pleiss, G.; Sun, Y.; Weinberger, K.Q. On Calibration of Modern Neural Networks. In Proceedings of the 34th International Conference on Machine Learning; PMLR 70, 2017; pp. 1321–1330. [Google Scholar]
- Oono, K.; Suzuki, T. Graph Neural Networks Exponentially Lose Expressive Power for Node Classification. In Proceedings of the International Conference on Learning Representations (ICLR), 2020. [Google Scholar]
- Elkan, C.; Noto, K. Learning classifiers from only positive and unlabeled data. In Proceedings of the 14th ACM SIGKDD International Conference on Knowledge Discovery and Data Mining, 2008; pp. 213–220. [Google Scholar] [CrossRef]
- Bekker, J.; Davis, J. Learning from positive and unlabeled data: A survey. Mach. Learn. 2020, 109, 719–760. [Google Scholar] [CrossRef]
- Wijayarathne, D.; Coulibaly, P.; Boodoo, S.; Sills, D. Use of radar quantitative precipitation estimates (QPEs) for improved hydrological model calibration and flood forecasting. J. Hydrometeorol. 2021, 22, 2023–2038. [Google Scholar] [CrossRef]
- Roberts, D.R.; Bahn, V.; Ciuti, S.; Boyce, M.S.; Elith, J.; Guillera-Arroita, G.; Hauenstein, S.; Lahoz-Monfort, J.J.; Schröder, B.; Thuiller, W.; et al. Cross-validation strategies for data with temporal, spatial, hierarchical, or phylogenetic structure. Ecography 2017, 40, 913–929. [Google Scholar] [CrossRef]
- Taipei City Government; Public Works Department. Explanation by the Taipei City Hydraulic Engineering Office on the 25 June Heavy Rainfall Intensity Exceeding the Protection Standard. accessed. 25 June 2026. (accessed on 17 August 2026). Official municipal source;(In Chinese)
- Central Weather Administration. Typhoon News: MEKKHALA (202607). accessed. 25 June 2026. (accessed on 17 August 2026). Official meteorological source.
- DeLong, E.R.; DeLong, D.M.; Clarke-Pearson, D.L. Comparing the areas under two or more correlated receiver operating characteristic curves: A nonparametric approach. Biometrics 1988, 44, 837–845. [Google Scholar] [CrossRef] [PubMed]
- Lundberg, S.M.; Lee, S.-I. A unified approach to interpreting model predictions. Adv. Neural Inf. Process. Syst. 2017, 30, 4768–4777. [Google Scholar]
- Bentivoglio, R.; Isufi, E.; Jonkman, S.N.; Taormina, R. Multi-scale hydraulic graph neural networks for flood modelling. Nat. Hazards Earth Syst. Sci. 2025, 25, 335–351. [Google Scholar] [CrossRef]
- Lou, W.; Gao, X.; Lee, J.H.W.; Liu, J.; Dong, L.; Gao, K. A highly generalizable data-driven model for spatiotemporal urban flood dynamics real-time forecasting based on coupled CNN and ConvLSTM. Hydrol. Earth Syst. Sci. 2026, 30, 1625–1646. [Google Scholar] [CrossRef]
- Bentivoglio, R.; Jonkman, S.N.; Isufi, E.; Taormina, R. Probabilistic flood hazard mapping for dike-breach floods via graph neural networks. Nat. Hazards Earth Syst. Sci. 2026, 26, 2089–2109. [Google Scholar] [CrossRef]
- Li, C.; Sun, N.; Lu, Y.; Guo, B.; Wang, Y.; Sun, X.; Yao, Y. Review on Urban Flood Risk Assessment. Sustainability 2023, 15, 765. [Google Scholar] [CrossRef]
- Mabrouk, M.; Han, H.; Mahran, M.G.N.; Abdrabo, K.I.; Yousry, A. Revisiting Urban Resilience: A Systematic Review of Multiple-Scale Urban Form Indicators in Flood Resilience Assessment. Sustainability 2024, 16, 5076. [Google Scholar] [CrossRef]
- Dani, A.A.H.; Supangkat, S.H.; Lubis, F.F.; Nugraha, I.G.B.B.; Kinanda, R.; Rizkia, I. Development of a Smart City Platform Based on Digital Twin Technology for Monitoring and Supporting Decision-Making. Sustainability 2023, 15, 14002. [Google Scholar] [CrossRef]
- Tong, J.; Gao, F.; Liu, H.; Huang, J.; Liu, G.; Zhang, H.; Duan, Q. A Study on Identification of Urban Waterlogging Risk Factors Based on Satellite Image Semantic Segmentation and XGBoost. Sustainability 2023, 15, 6434. [Google Scholar] [CrossRef]
- Fang, X.; Li, J.; Wang, M.; Chen, A.; Shao, S.; Liu, Q. A Universal Urban Flood Risk Model Based on Particle-Swarm-Optimization-Enhanced Spiking Graph Convolutional Networks. Sustainability 2025, 17, 9973. [Google Scholar] [CrossRef]
Figure 1.
Overall research framework and technical workflow.
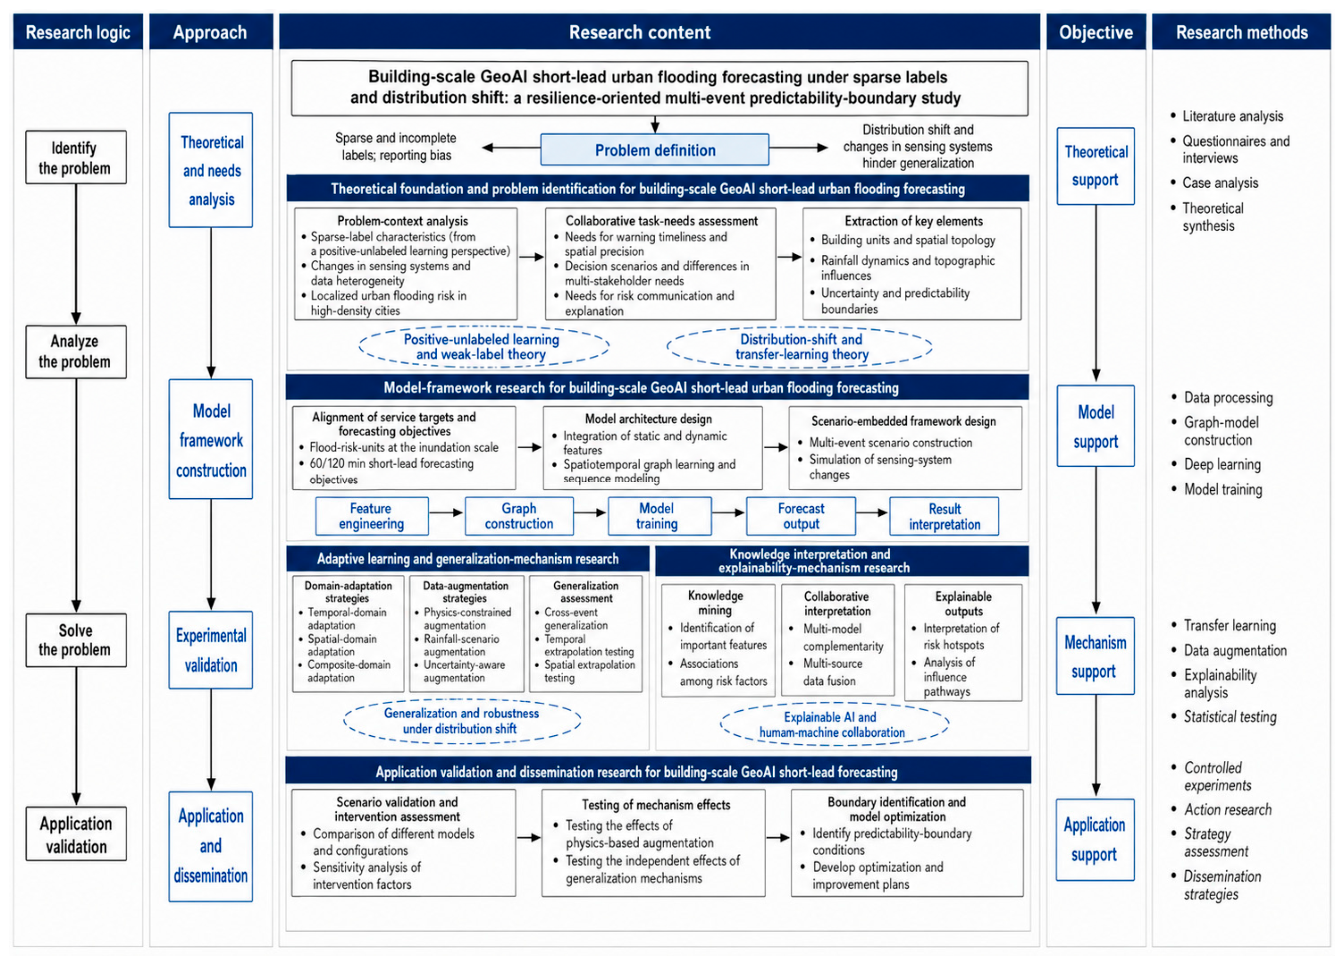
Figure 2.
Mean hourly rainfall time series for the eight study events.
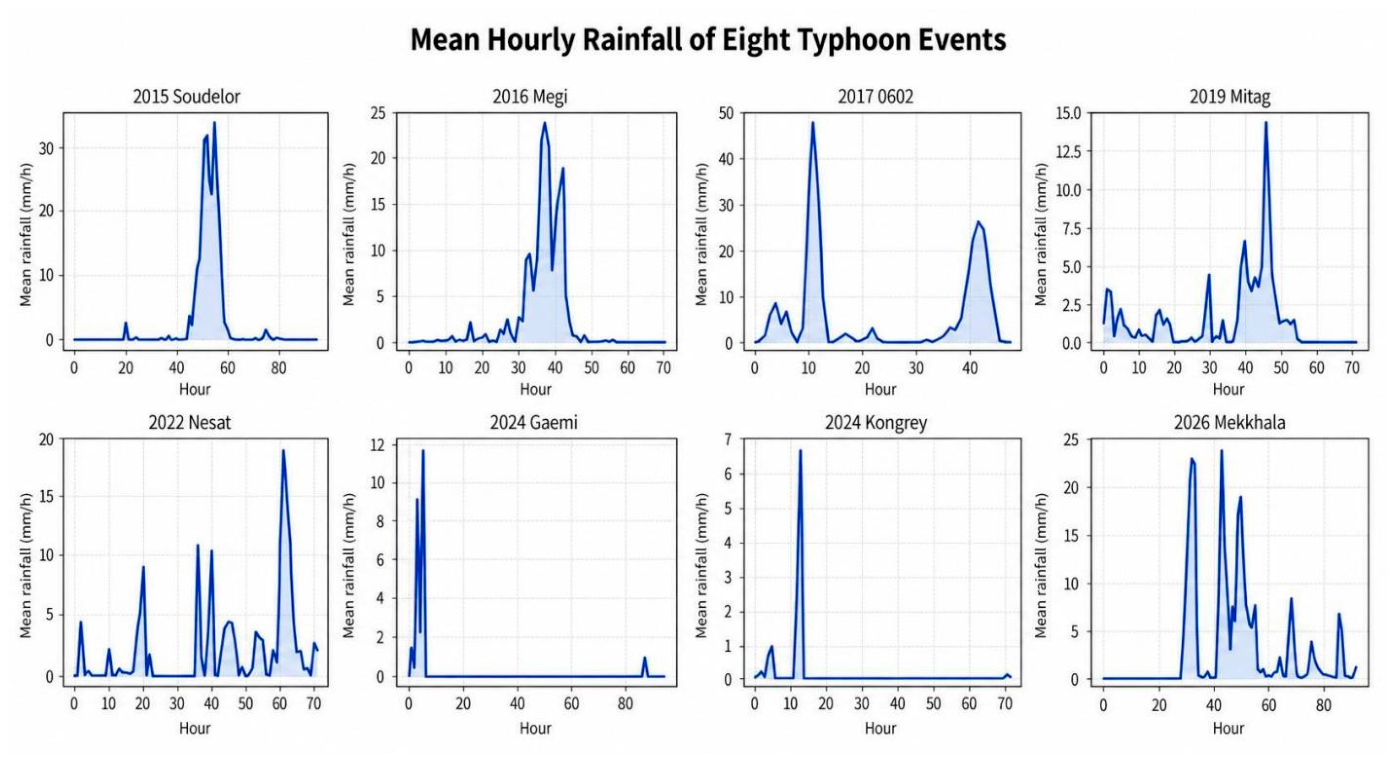
Figure 3.
Building-scale risk surfaces and inundation labels for the eight events (2 × 4 panels); the 2026 panel corresponds to the heavy-rainfall event associated with the outer circulation of Typhoon Mekkhala.
Figure 3.
Building-scale risk surfaces and inundation labels for the eight events (2 × 4 panels); the 2026 panel corresponds to the heavy-rainfall event associated with the outer circulation of Typhoon Mekkhala.
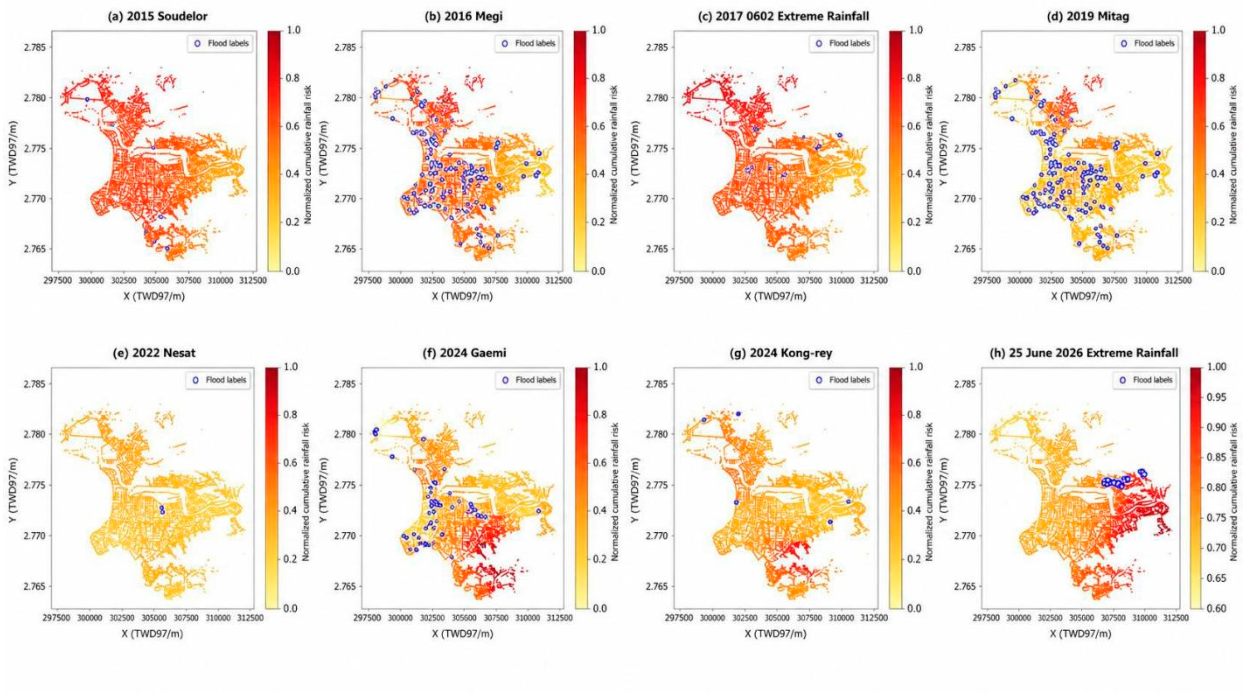
Figure 5.
Inundation hotspots in Neihu on 25 June 2026 overlaid on historical topography.
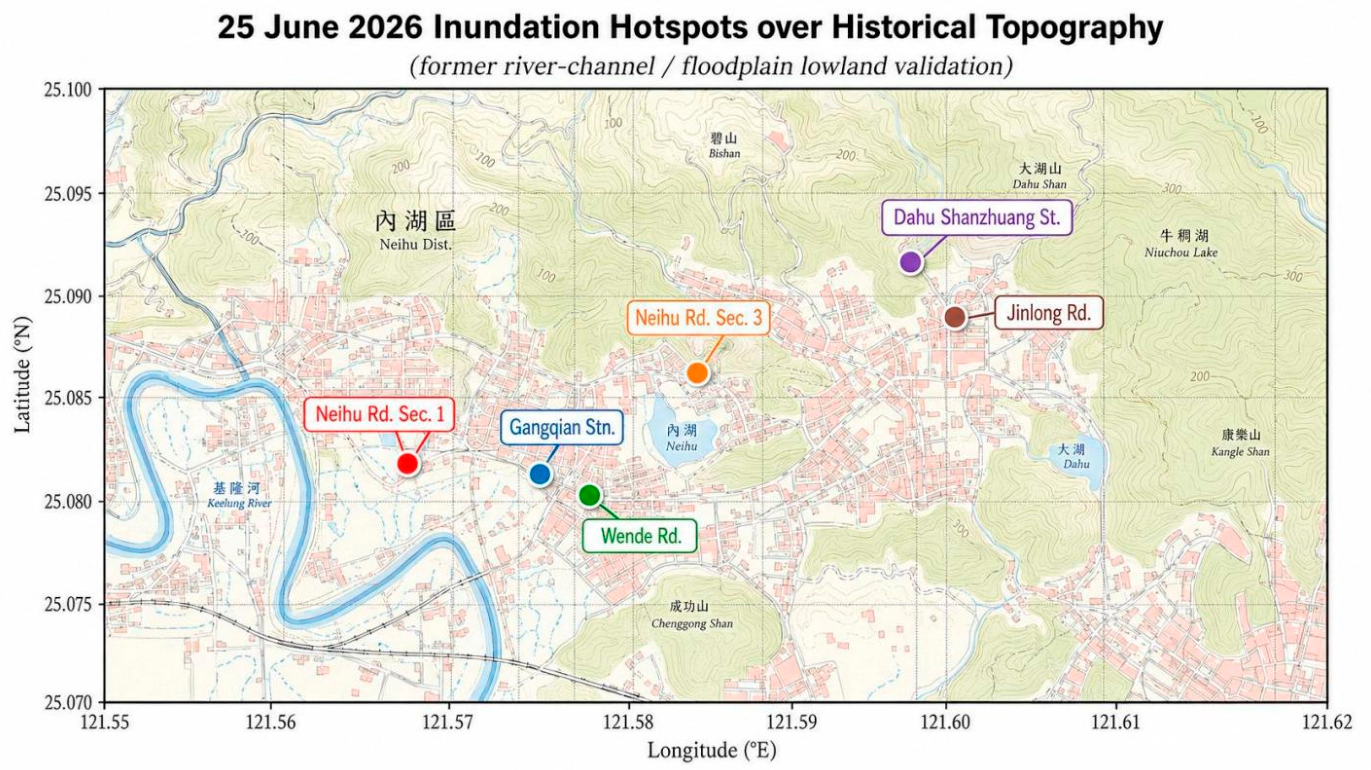
Figure 6.
Inundation hotspots in Neihu on 25 June 2026 and sewer-pipe slopes.
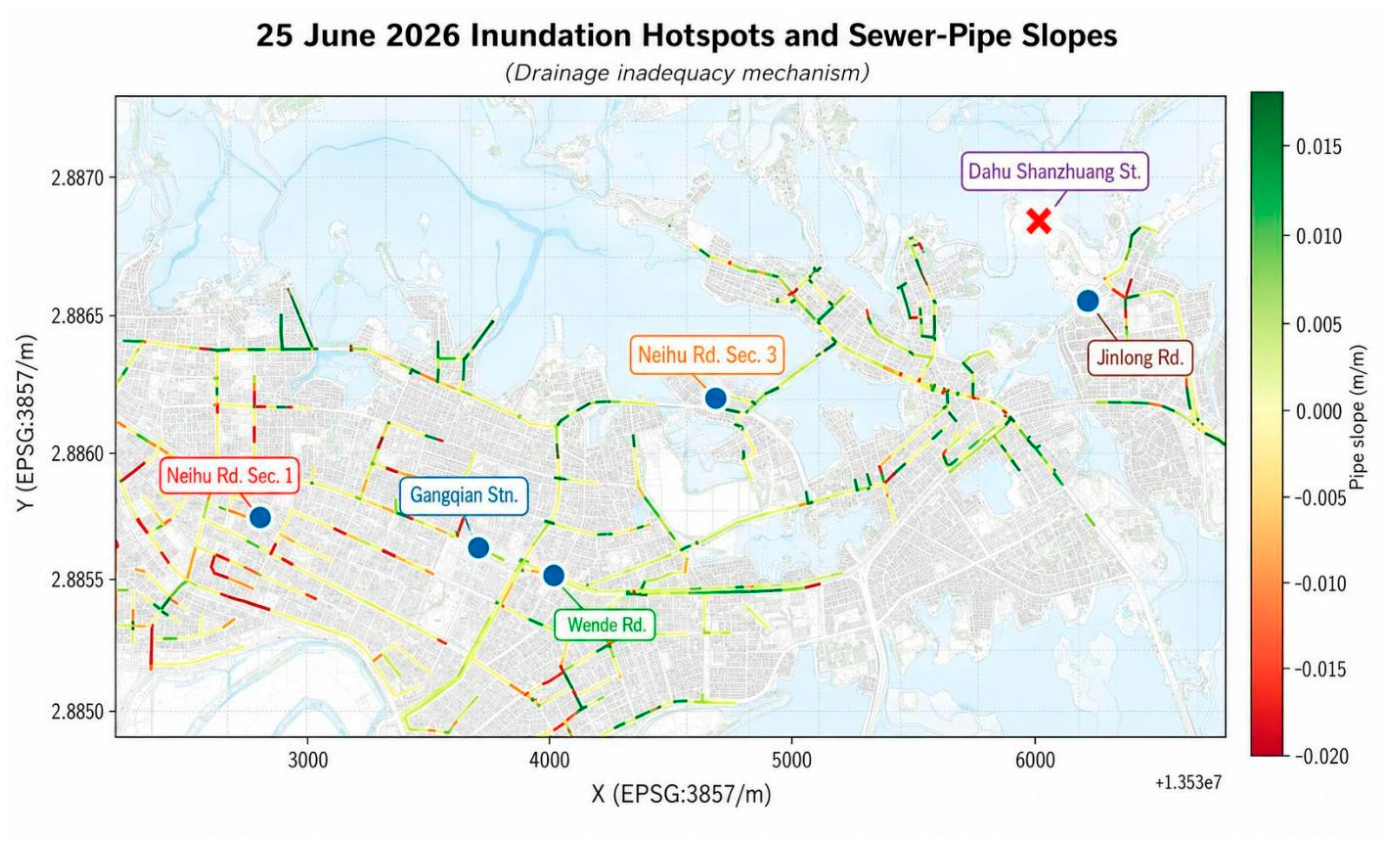

Table 1.
Data sources, temporal references, and analytical uses. Population data from 2024 and land-use data from 2025 are used only as contemporary proxy covariates.
Table 1.
Data sources, temporal references, and analytical uses. Population data from 2024 and land-use data from 2025 are used only as contemporary proxy covariates.
| Data type | Source | Resolution | Temporal reference | Purpose/derived variables |
|---|---|---|---|---|
| Rain-gauge precipitation | CWB/CWA stations; QPESUMS Plus | Hourly/event-level | 2015–2026 | 1-, 3-, and 6-h accumulation; extremes; API |
| Radar QPE | CWA O-A0059-001 | Approx. 10 min; approx. 1.25 km | 2022+ | Node sampling/dynamic forcing |
| Terrain | HistoryGIS LiDAR DTM | 1 m / 5 m | Static | Elevation, slope, flow direction, TWI |
| Sewer system | data.taipei | Vector | Static | 19,443 manholes; 17,408 pipe segments; 88 pumping stations |
| Buildings | HistoryGIS LOD1 | Building scale | 2015–2026 | 324,486 footprints; count, coverage, height |
| Population | Ministry of the Interior | Village level | 2024 | Contemporary population-density proxy |
| Land use | Taipei City detailed plans | Polygon | 2025 | Impervious surface, water, green cover, zoning |
| Inundation labels | 1999 hotline; official simulations | Point/grid | Event-level | 5 events with reported/observed labels + 3 events containing weak labels; no label-type subgroup inference |
Table 2.
Descriptive statistics for the eight events. The 2026 event is described, based on Central Weather Administration and Taipei City Government sources, as a heavy-rainfall event associated with the outer circulation of Typhoon Mekkhala.
Table 2.
Descriptive statistics for the eight events. The 2026 event is described, based on Central Weather Administration and Taipei City Government sources, as a heavy-rainfall event associated with the outer circulation of Typhoon Mekkhala.
| Event ID | Duration (h) | Inundated nodes | Prevalence (%) | Maximum rainfall in dataset (mm/h) |
|---|---|---|---|---|
| E2015_Soudelor | 96 | 32 | 0.105 | 56.6 |
| E2016_Megi | 72 | 530 | 1.742 | 43.0 |
| E2017_0602 | 48 | 50 | 0.164 | 98.8 |
| E2019_Mitag | 72 | 530 | 1.742 | 56.4 |
| E2022_Nesat | 72 | 15 | 0.049 | 58.5 |
| E2024_Gaemi | 96 | 172 | 0.565 | 40.0 |
| E2024_Kongrey | 72 | 20 | 0.066 | 32.5 |
| E2026_Mekkhala | 92 | 353 | 1.160 | 55.0 |
Table 3.
Evaluation regimes and interpretation. AUC values from different tasks are not directly comparable unless the samples and aggregation procedures are confirmed to be equivalent.
Table 3.
Evaluation regimes and interpretation. AUC values from different tasks are not directly comparable unless the samples and aggregation procedures are confirmed to be equivalent.
| Metric | Unit of analysis | Data scope | Reported value | Interpretation |
|---|---|---|---|---|
| Static event-level AUC | Event/building nodes | Static susceptibility | 0.597 | Static baseline; descriptive comparison only, no strong paired inference |
| 60-min event macro-averaged AUC | AUC computed within each event, then averaged | 7 computable event folds | 0.694 | Primary short-horizon descriptive result |
| 120-min event macro-averaged AUC | AUC computed within each event, then averaged | 7 computable event folds | 0.677 | Longer-horizon descriptive result |
| Pooled micro AUC | Pooled node/time predictions | Pooled leave-one-out predictions | 0.811 | Exploratory only; not interchangeable with macro AUC |
| Forward temporal AUC | Later events | Training: 2015–2019; testing: 2022–2024 | 0.490 | Primary temporal-transfer result |
| Buffered spatial-transfer AUC | Independent spatial blocks | West-to-East / East-to-West | 0.523 / 0.574 | Primary spatial-transfer result |
| LOD1 scale-sensitivity AUC | Independent scale experiment | LOD1 vs. 50/100/250 m baseline | 0.976 | Independent task; not the main lead-time AUC |
Table 4.
Event-wise leave-one-event-out AUC by lead time. E2024_Gaemi has no verifiable AUC in the retained outputs and is therefore reported as NA; both macro-averages are calculated across seven computable event folds.
Table 4.
Event-wise leave-one-event-out AUC by lead time. E2024_Gaemi has no verifiable AUC in the retained outputs and is therefore reported as NA; both macro-averages are calculated across seven computable event folds.
| Lead time | Test event | AUC |
|---|---|---|
| 60 min | E2015_Soudelor | 0.631 |
| 60 min | E2016_Megi | 0.963 |
| 60 min | E2017_0602 | 0.732 |
| 60 min | E2019_Mitag | 0.627 |
| 60 min | E2022_Nesat | 0.473 |
| 60 min | E2024_Gaemi | NA |
| 60 min | E2024_Kongrey | 0.493 |
| 60 min | E2026_Mekkhala | 0.937 |
| 120 min | E2015_Soudelor | 0.550 |
| 120 min | E2016_Megi | 0.905 |
| 120 min | E2017_0602 | 0.704 |
| 120 min | E2019_Mitag | 0.731 |
| 120 min | E2022_Nesat | 0.370 |
| 120 min | E2024_Gaemi | NA |
| 120 min | E2024_Kongrey | 0.501 |
| 120 min | E2026_Mekkhala | 0.978 |
Table 5.
Model benchmark under non-equivalent spatial support. The resulting AUC ranking should not be attributed directly to model class.
Table 5.
Model benchmark under non-equivalent spatial support. The resulting AUC ranking should not be attributed directly to model class.
| Model | AUC | Spatial support/limitation |
|---|---|---|
| Logistic regression | 0.544 | Building scale; original baseline |
| Random forest | 0.597 | 30,421 building nodes |
| XGBoost | 0.682 | Building-scale ensemble |
| Temporal GNN | 0.438 | 2,536-node hotspot subgraph |
| ConvLSTM | 0.440 | 250 m grid |
Table 6.
Event-level AUC in the compound domain-transfer experiment. The mean gain is 0.18025, although performance declines for one event.
Table 6.
Event-level AUC in the compound domain-transfer experiment. The mean gain is 0.18025, although performance declines for one event.
| Test event | QPE-era training AUC | Physics-based augmentation AUC | Difference |
|---|---|---|---|
| E2015_Soudelor | 0.468 | 0.363 | -0.105 |
| E2016_Megi | 0.519 | 0.785 | +0.266 |
| E2017_0602 | 0.482 | 0.773 | +0.291 |
| E2019_Mitag | 0.517 | 0.786 | +0.269 |
| Mean | 0.4965 | 0.67675 | +0.18025 |
Disclaimer/Publisher’s Note: The statements, opinions and data contained in all publications are solely those of the individual author(s) and contributor(s) and not of MDPI and/or the editor(s). MDPI and/or the editor(s) disclaim responsibility for any injury to people or property resulting from any ideas, methods, instructions or products referred to in the content. |
© 2026 by the authors. Licensee MDPI, Basel, Switzerland. This article is an open access article distributed under the terms and conditions of the Creative Commons Attribution (CC BY) license (http://creativecommons.org/licenses/by/4.0/).
Copyright: This open access article is published under a Creative Commons CC BY 4.0 license, which permit the free download, distribution, and reuse, provided that the author and preprint are cited in any reuse.