
Submitted:
26 August 2026
Posted:
28 August 2026
You are already at the latest version
Abstract
This study evaluated deficit irrigation (DI; 55% of crop evapotranspiration (ETc) from BBCH 76 to four days after harvest, followed by rewatering) compared with full irriga-tion (FI; 100% ETc) in ‘Regina’ trees. DI reduced soil water, tree water status, light-saturated photosynthesis (ASAT) and stomatal conductance (gs). However, temporal changes in ASAT were weakly related with leaf water potential (ΨL) and closely related to gs and mesophyll conductance (gm). DI modified non-structural carbon partitioning in leaves, increasing sorbitol concentration by 27% and decreasing sucrose by 57% without affecting total soluble sugars. At the same time, lignin fluorescence decreased under DI whereas leaf mass per area (LMA) and stomatal density remained unaffected. After harvest and rewatering, ΨL increased in both treatments, but leaf gas exchange activity dropped accompanied by increases in lignin fluorescence and LMA. Despite an 8% de-crease in fruit size, fruit yield was maintained, improving water productivity by 67%. Our results indicate that sweet cherry responses to DI are not solely determined by water status, but also involve carbon partitioning, leaf structural traits and source-sink dy-namics, allowing yield to be maintained at the expense of fruit size.
Keywords:
water potential
; photosynthesis
; leaf soluble sugars
; leaf structure
; yield
; water productivity
1. Introduction
Cherries (Prunus avium L.) are highly demanded by consumers for their organoleptic and nutritional characteristics [1,2]. Although world production of fresh cherries has increased 42% in the last decade [3], many cultivated areas are facing increasing water scarcity for irrigation associated with global climate change [4,5]. To mitigate the impact of limited water availability on fruit production, several strategies have been proposed, encompassing from crop breeding to agronomical practices such as regulated deficit irrigation and the use of biostimulants and growth regulators [6,7,8,9].
From a physiological point of view, plants have evolved several mechanisms that allow them to adjust growth and leaf functioning under water-limited conditions. Leaf water potential (ΨL) is one of the most widely used indicators of plant water status since it integrates soil water availability, atmospheric demand and plant hydraulic functioning (e.g., [10]). As water deficit develops, reductions in ΨL has been largely related to stomatal closure and lower photosynthesis rates due to less CO2 diffusion into carboxylation sites [11,12]. However, reductions in ΨL do not always reflect in a proportional decrease in gas exchange, suggesting that factors other than plant water status may contribute to regulation of leaf physiological activity under water deficit conditions.
In this regard, considerable evidence shows that carbon source-sink relationships may also modulate photosynthetic activity and stomata regulation through changes in assimilate export, carbohydrate partitioning and osmotic adjustment (e.g., [13]). Indeed, responses to water deficit may vary according to sink demand as previously reported fruit-bearing sweet cherry branches by Jorquera-Fontena et al. [14]. In parallel, prolonged water deficit may induce changes in leaf structural traits, including changes in CO2 diffusion and photosynthetic performance [15,16,17].
Sweet cherry has been reported to be sensitive to preharvest water deficit [18]; however, its effect on productive and vegetative performance is primarily determined by the severity of water limitation and scion/rootstock combination’s ability to tolerate the lack of water. In this line, Blanco et al. [19] found that sustained deficit irrigation during preharvest (at 85% of crop evapotranspiration) had no effect on yield and some physiological traits of ‘Prime Giant’ sweet cherry but stem water potential and shoot growth significantly fell. In similar way, Küçükyumuk [20] reported that a fruit yield in ‘0900 Ziraat’ sweet cherry was unaffected by sustained deficit irrigation at 50% of field capacity applied from 30 days after bloom to leaf fall in the first year of study, but reduced trunk cross-sectional area and stomatal conductance. Furthermore, Toro et al. [21] showed contrasting transpiration responses among different scion/rootstock combinations and highlighted the significance of sucrose and sorbitol mediating the drought responses in young cherry trees. Collectively, these studies indicate that sweet cherry responses to water deficit are dependent on both irrigation intensity and genotype and suggest that physiological acclimation seems to involve both water-status and carbon-related processes.
While existing studies have documented the effect of deficit irrigation on sweet cherry water relations, gas exchange and productivity [19,22,23], considerably less attention has been given to the relationships among tree water status, carbon partitioning and leaf structural adjustments during preharvest period. Moreover, little information is available on how these responses evolve following fruit harvest and irrigation recovery, despite major changes in sink demand that occur during this stage.
The aim of this study was to assess how preharvest irrigation deficit affects the coordination between tree water status, gas exchange, carbon partitioning, leaf structural traits and productivity in field-grown sweet cherry cv. ‘Regina’ grafted onto ‘Gisela® 6’. In addition, postharvest physiological responses following irrigation recovery were assessed to gain insight into the role of changing fruit sink demand on leaf physiology.
2. Materials and Methods
2.1. Experimental Site and Plant Material
The experiment was carried out during the 2023/24 season in a commercial orchard located in Lumaco, La Araucanía Region, Chile (38°06’28.5” S, 72°51’45.0” W). The site is characterized by warm and dry climatic conditions from November to March. The soil is classified as an Inceptisol (Lumaco series, Fluventic Dystrudepts) [24]. It is a deep, gently sloping, moderately slow permeability, and well drained with a sandy clay loam texture (46% sand, 26% silt, and 28% clay) [25]. The Lumaco soil (0-20 cm depth) contains 4% organic matter, a slightly acidic pH (pHW 6.29), and a field capacity and wilting point of 0.25 m3 m−3 and 0.15 m3 m−3, respectively.
The plant material used consisted of 7-year-old cherry trees cv. ‘Regina’ grafted onto ‘Gisela® 6’, established at a spacing of 4 × 1 m in two north–south oriented rows and using a tall spindle axis training system. Pest control was carried out following the technical recommendations of the export fruit industry. The preharvest fertilization requirements were supplied via fertigation before applying the deficit irrigation treatment (see below).
2.2. Treatments
A total of 36 trees distributed among two orchard rows (18 trees per row) were selected and assigned to two irrigation treatments. Trees were chosen based on similar trunk cross-sectional area to ensure homogeneous vigor and minimize within-orchard variability. The irrigation treatments were a full irrigated control (FI), receiving 100% of crop evapotranspiration (ETc), and a deficit irrigated treatment (DI), receiving 55% of ETc, as described by Blanco et al. [19] and Jorquera-Fontena et al. [14]. To reach these conditions, trees were irrigated at two-days interval using two irrigation lines per row with drippers spaced at 70 cm, with a flow rate of 4.7 L h-1 for FI and 2.5 L h-1 for DI. The DI was applied from the second rapid fruit growth stage (BBCH 76; November 20, 2023) until four days after harvest (January 8, 2024), from when trees were water-recovered at 100% ETc. Irrigation treatments were separated by two buffer trees.
The ETc was determined according to FAO 56 [26], and the reference evapotranspiration obtained from the nearest agroclimatic station (Gaby Ranquilco) located 4 km from the experimental site (https://agrometeorologia.cl). Recorded mean temperatures, reference evapotranspiration (ETo) and rainfall are shown in Figure 1. As observed, four precipitation events were recorded accumulating 17.7 mm, during the study (Figure 1).
2.3. Measurements
2.3.1. Soil Water Content
Volumetric water content was recorded throughout the season using soil moisture/temperature sensors (Hobo model RXW-T11-922, Massachusetts, USA) installed at 30 cm depth and spaced at 50 cm from four representative trees of each treatment [27].
2.3.2. Leaf Sampling
Full expanded, healthy and sun-exposed leaves were randomly selected on 2-year-old productive branches located in the mid-portion of the trees. Sampling followed a fixed sequence to ensure consistency among measured variables. The exception was stem water potential (ΨS), which was assessed on separate leaves collected from the same canopy position and measured at seven-day intervals throughout the experimental period according to an independent sampling schedule. Measurements of the remaining variables were conducted before harvest at 1, 9, 24, and 37 days after the beginning of treatments (DABT), and again seven days after harvest (51 DABT). Prior to the final assessment, trees were rewatered at 100% of the irrigation treatment for three days.
For all measurements excepting ΨS, one leaf was sampled from 18 randomly selected trees within irrigation treatments on every sampling date. The ΨS was evaluated on all experimental trees along the study. Gas exchange was measured first, followed immediately by leaf water potential (ΨL) determination on the same leaf. This sequence was consistently applied across all sampling dates excepting at 37 and 51 DABT, where chlorophyll index was additionally measured between gas exchange and ΨL determinations. On these dates, after ΨL measurement, two 2 cm2 sections were collected from each measured leaf: one for leaf mass per unit area determination and the other for simultaneous assessment of lignin fluorescence and stomatal density. In addition, at 37 DABT, four extra 2 cm2 leaf sections were collected from the same leaf for soluble sugar analysis.
2.3.3. Gas Exchange Variables
Gas exchange variables were measured with a Portable Photosynthesis System LI-6800 equipped with a fluorometer (LI-COR, Inc., NE, USA). The leaf chamber conditions were established at 1500 µmol m-2 s-1 PAR saturation light, at 400 µmol mol-1 of CO2 concentration, at 21 °C of air temperature with 60% relative air humidity, and with an air flow of 700 µmol s-1. Measurements were carried out after the leaves reached the steady state, between 10:00 h and 16:00 h of the day. The mesophyll conductance (gm) was estimated according to Harley et al. [28] as:
where J is the electron transport rate, Г* is the non-photorespiratory CO2 compensation point, and RL is the day respiration. J was derived from the electron transport rate (ETR) calculated from chlorophyll fluorescence measurements using the instrument’s default equations, the Г* was taken from Bernacchi et al. [29] and RL was derived from measurements of dark respiration (Rd) such as [30]. Briefly, Rd was determined by additional gas exchange measurement where six leaves from each treatment were used. For determinations, conditions in the leaf chamber were similar to those mentioned above but using a PPFD set at 0 μmol m−2 s−1 PAR. Leaves were exposed to dark in the chamber conditions for 5 min before measuring.
2.3.4. ΨL and ΨS Determination
The ΨL and ΨS were determined using a Scholander pressure chamber PMS 600 (PMS Instruments, Corvallis, OR). For ΨL, the same leaves previously used for gas exchange measurements were detached, wrapped in a wet paper towel to minimize dehydration, and immediately measured in the pressure chamber [31,32]. For ΨS leaves were enclosed with an opaque plastic bag for 1 h before measurement, as suggested by Choné et al. [33].
2.3.5. Leaf Mass per Unit Area (LMA)
The LMA was determined in a 2 cm2 piece of leaf, avoiding the central vein. Subsamples were then stored in a cooler to be transported to the laboratory to obtain its dry mass by drying for 48 h at 60 °C in an oven. The LMA was calculated as the ratio of leaf dry mass (g) to leaf area (m2).
2.3.6. Lignin Fluorescence and Stomatal Density
Subsamples were stored in the FAA fixative solution (formaldehyde, alcohol, acetic acid) in the field. In the laboratory, leaf sections were stained with safranin O and analyzed by confocal laser scanning microscopy (CLSM; Olympus FV1000, Arquimed, Japan) at an emission/excitation λ of 543/590 nm according to Sant’Anna et al. [34] to visualize the stomata and lignin distribution. To quantify lignin fluorescence and stomata density the obtained images were processed by using image processing software (FV10-ASW software v0.200c; Arquimed).
2.3.7. Soluble Sugars
Leaf subsamples were immediately frozen in liquid N2 and stored at −20 °C in the laboratory. Frozen leaves were ground to a fine powder under liquid N2. Soluble sugars were extracted from 0.1 g of fresh leaf tissue with 1.5 mL of chromatographic-grade water. Samples were vortexed for 30 s, shaken for 30 min at room temperature, centrifuged at 10,000 rpm for 10 min, and filtered through a 0.22 µm membrane [35]. Supernatant was subsequently analyzed using an HPLC system (MODEL LC 2050C, JAPAN) with a RID-20A refractive index detector, following Usenik et al. [35] protocol. Briefly, a Hi-Plex Pb 300 x 7.7 mm column was used for separation, operated at 65 °C, with HPLC grade water. The injection volume was 20 μL, the flow rate was 0.6 mL/min, and the run time was 30 minutes. Quantification of the identified compounds, including sucrose, fructose, glucose, and sorbitol, was based on peak area expressed in mg g-1 on fresh weight basis (FW).
2.3.8. Yield, Fruit Quality and Water Productivity
Six representative trees per treatment were harvested at 44 DABT and yield was expressed as kg tree-1. Subsequently, a 1 kg sample was randomly selected from each replicate and stored in a cooler for further analysis. In the laboratory, samples were stored for 12 h at 4 °C and then fruit diameter was determined using a digital caliper (±0.01 mm). A total of 54 fruits per treatment were analyzed. Water productivity was calculated as the ratio between fruit yield (kg ha-1) and total water supply (Irrigated plus precipitation; m3 ha-1) accumulated from the beginning of the irrigation season (November 1, 2023) to the harvest.
2.4. Experimental Design and Data Analysis
Irrigation treatments were randomly assigned to 36 trees distributed across two parallel orchard rows, with nine trees per irrigation treatment in each row. Trees subjected to contrasting irrigation regimes were separated by two buffer trees. For statistical analyses, each tree was treated as an experimental unit following a completely randomized design. The data analysis was done by using the JAMOVI 2.3.16 statistical program. First, data were subjected to the analysis of normality and equality of variances using the Shapiro-Wilk and Levene tests, respectively. To compare treatments in each measurement date, a Welch’s t-test was performed when the variable had normality, but unequal variances. If the opposite occurred, a Mann-Whitney U test was performed. For variables having normality and homogeneity of variances, Student’s t-test was performed (p ≤ 0.05). Subsequently, the variables were analyzed in the time course using an analysis of variance (ANOVA) and Tukey’s multiple comparison test (p ≤ 0.05). For non-parametric variables, a Kruskal-Wallis ANOVA was used with a Dwass-Steel-Critchlow-Fligner two-by-two comparison test.
3. Results
3.1. Soil Water Content and Stem Water Potential
Throughout the experiment, the irrigation supply corresponded to 1326 and 707 m3 ha−1 for FI and DI, respectively. The sensors successfully recorded temporal variation in soil water content between treatments (Figure 2).
Soil water content under DI remained lower than under FI throughout the experiment, while remaining above the permanent wilting point. The largest differences occurred between 35 and 50 DABT, when DI and FI averaged approximately 0.17-0.18 and 0.21-0.23 m3 m-3, respectively.
The ΨS progressively decreased in both treatments during the experiment, although values under DI were consistently lower than under FI (Figure 3). Significant differences were detected from 8 DABT onwards. The decrease in ΨS was more pronounced under DI reaching a minimum about of -1.7 MPa at 38-44 DABT, whereas FI trees stabilized near to -1.3 MPa during the same period. Following rewatering (51 DABT), ΨS was recovered with respect to immediately previous measurement, reaching similar values between treatments. Despite irrigation in FI treatment was supplied as demanded along the experiment, ΨS also increased at 51 DABT (Figure 3).
3.2. Leaf Water Potential and Gas Exchange Parameters
Deficit irrigation treatment induced a marked reduction in ΨL, averaging 32% lower values than FI throughout the experiment (-1.24 and -0.94 MPa for DI and FI, respectively) before rewatering. The ΨL significantly differed between treatments at each sampling date and exhibited a significant temporal response within treatment (Figure 4A).
The largest treatments differences occurred between 24 and 37 DABT, when ΨL in DI declined to values below -1.5 MPa, reaching a minimum close to -1.8 MPa at 38 DABT. Following rewatering, ΨL increased by about 31% in DI and 18% in FI relative to immediately previous sampling date. However, values remained below those measured at 1 DABT, being 34% and 14% lower in DI and FI (Figure 4A).
The DI consistently reduced ASAT compared to FI, resulting in values that were 25% lower on average throughout deficit irrigated period (Figure 4B). Under DI, ASAT decreased during the first 24 DABT, and then again from 37 DABT until 51 DABT. Conversely, FI trees exhibited a progressive increase in ASAT, reaching values close to 50% higher at 37 DABT than at beginning of the experiment. Following postharvest rewatering, ASAT in FI returned to rates comparable to those found at treatment imposition, while in DI it remained about 30% lower than the initial value (Figure 4B).
Changes in ASAT were accompanied by coordinated responses of the other gas exchange variables (Figure 4). Prior to rewatering DI reduced gs, Ci, and gm by 37%, 12%, and 13%, respectively, compared to FI, while increasing WUEi by approximately 18%. After rewatering, gs fell by about 25% and 42% in DI and FI, respectively, relative to the previous sampling date (Figure 4C). Likewise, gm decreased by about 42% and 34% in DI and FI, respectively, whereas Ci remained relatively stable in DI but decreased by 10% in FI (Figure 4D and F). The WUEi increased by 20% in FI and remained unchanged in DI (Figure 4E).
The ΨL explained a small fraction of the ASAT and gs variability (Figure 5A and B). In contrast, ASAT was strongly correlated to gs (Figure 5C), while Ci was positively correlated to gs (Figure 5D). The gm also contributed to ASAT variation, showing a moderate relationship between them, although gm was poorly related to Ci (Figure 5E and F).
3.3. Structural and Anatomical Parameters
Complementary measurements of lignin, stomatal density, LMA and SPAD were conducted at 37 DABT and after postharvest rewatering (51 DABT) to provide additional insight into the responses associated with changes in leaf water status and gas exchange (Table 1).
Lignin as expressed in relative fluorescence units was 8% lower in DI than in FI at 37 DABT, although this difference disappeared after rewatering due to a 19% increase under DI. The LMA increased from 37 DABT to 51 DABT in both treatments and was 8% higher in DI than FI after rewatering. In contrast, stomatal density and chlorophyll index were unaffected by irrigation treatment at either sampling date.
3.4. Leaf Soluble Sugars
Leaf soluble sugars were determined at 37 DABT, coinciding with the period of maximum treatment differences in ΨL and gas exchange variables (Table 2).
Sorbitol and fructose were the predominant soluble sugars, accounting for approximately 41% and 35% of the total pool, respectively. The DI increased sorbitol content by 27% and reduced sucrose content by 57%. In contrast, glucose, fructose and total soluble sugar did not differ between irrigation treatments. Consequently, despite significant changes in individual sugar fractions, total soluble sugar concentration remained unchanged under DI.
3.5. Tree Yield, Fruit Size and Water Productivity
The DI treatment did not significantly affect fruit yield but reduced fruit diameter by about 8% compared with FI trees (Table 3).
Despite reductions in fruit size, DI received 619 m3 ha-1 less irrigation than FI throughout the experiment. Consequently, water productivity increased substantially under DI, reaching values 67% higher than those observed in FI trees (Table 3).
4. Discussion
Irrigation treatments were effective in producing significant differences in tree water status as reflected in ΨS (Figure 3). The ΨS has been useful for discriminating different irrigation doses in fruit crops [36,37,38,39] and is well correlated to soil water content (e.g., [40]). Although FI trees received 100% ETc, ΨS progressively declined in preharvest from approximately -0.6 MPa at the beginning of the experiment to values close to -1.3 MPa, concomitantly with soil water content remaining mostly below field capacity (Figure 2). The ΨS values were lower than those reported for well-irrigated ‘Prime Giant’ cherry trees by Blanco et al. [19] whose control trees, irrigated at 110% ETc to safeguard non-limiting soil water conditions, maintained ΨS ranging between -0.5 to -0.75 MPa approximately in preharvest. Thus, our findings suggest that replenishment of 100% ETc may not have fully compensated for tree water demand under environmental and soil conditions of the present study, possibly reflecting uncertainties in Kc under local orchard conditions.
The ΨL varied in a similar way than ΨS, (Figure 3 and 4A). Temporal changes in ΨL explained a small proportion of the variability in ASAT and gs (R2= 0.08 and 0.05, respectively), whereas ASAT was strongly correlated to gs and gm (R2= 0.87 and 0.55, respectively), suggesting that reductions in carbon assimilation under deficit irrigation were primarily led by diffusional limitations than by effect of leaf water status. Nevertheless, the transient increase in Ci observed at 24 DABT in DI treatment suggests that non-diffusional limitations may also have contributed during specific period of fruit growth phase.
Following harvest and rewatering, ΨL increased in both treatments, although values remained lower in DI than FI trees (Figure 4A). The increases in ΨL in FI relative to the previous sampling date may be attributed to the cessation of fruit water consumption after harvest.
Despite the increase in leaf water status, ASAT, gs and gm declined in both treatments, contrasting with preharvest period, during which these variables fluctuated within a relatively narrow range in DI and even increased in FI despite progressive decrease in ΨL. Taken together, these results suggest that sink demand seemed to play an important role in regulating cherry water status and leaf gas exchange as observed by Plavcová et al. [41] in apple trees. During fruit growth strong fruit sink activity may have stimulated carbon assimilation through sustained export of assimilates from source leaves, thereby promoting stomatal opening and photosynthetic activity [13,42,43]. In contrast, the abrupt reduction in sink demand following harvest coincided with decreases in ASAT, gs and gm despite improved ΨL. Similar postharvest reductions in gas exchange activity have previously been reported in ‘Sylvia’ and ‘Kordia’ sweet cherry by Quentin et al. [44], further supporting a contribution of source-sink relationships to the physiological regulation.
Leaf soluble sugars were determined at 37 DABT, matching with the period of maximum treatment differences in ΨL and gas exchange variables. The DI treatment did not affect total soluble sugars but significantly altered carbon partitioning. Thus, sorbitol content increased by 27%, while sucrose decreased by 57%. In Prunus species, sorbitol is one of the main translocated carbohydrates and plays a substantial role in leaf osmotic adjustment under water deficit [18,44,45], improving osmoprotection and enhancing expression of drought-responsive genes [46,47]. Therefore, the observed shift in carbon partitioning may have contributed to maintaining stomata open and thus, leaf physiological activity relatively high under water-limited conditions. The absence of treatment effect on total soluble sugars in correspondence with significant differences in ASAT indicates that water deficit did not promote downregulation of carbon assimilation by sugar feedback at 37 DABT.
Lignin fluorescence was significantly reduced in DI treatment at 37 DABT, which was in line with reductions in both ΨL and gm. This suggests that water-induced modifications in leaf cell wall traits potentially contributed to internal CO2 diffusion limitations. Notably, LMA remained unaffected at the same time, indicating that the response involved specific cell wall components rather than major changes in overall leaf structure. Additional analysis must be conducted to verify this assumption. Although lignin content has been commonly reported to increase under water deficit, decreases have also been observed in leaves of water-stressed maize [48]. Our results also showed that lignin fluorescence increased from 37 to 51 DABT in both irrigation conditions, although the increase was greater in DI trees (+19%) than FI trees (+8%), resulting in similar postharvest values between treatments. This response occurred in parallel to changes in LMA (16% and 12%, in DI and FI, respectively), suggesting continued leaf structural development (e.g., [49]), regardless of water regime. Notably, increases in lignin fluorescence and LMA agreed with reductions in ASAT, gs, and gm despite recovery of ΨL, indicating a shift from sustaining physiological activity during fruit growth towards greater investment in structural leaf components after harvest. Therefore, postharvest responses likely reflected not only recovery from water deficit but also leaf maturation and a change in source-sink balance following fruit removal.
Neither stomatal density nor chlorophyll index were affected by irrigation treatment, indicating that the observed changes in gas exchange variables were not associated with changes in stomatal abundance, chlorophyll degradation or accelerated leaf senescence. Stomatal density has been reported as less responsive to short-time changes in soil water availability and set mainly during leaf expansion [50,51].
Despite that physiological activity was reduced in DI leaves, fruit yield was not significantly affected, suggesting that overall carbon supply by photosynthesis was enough to sustain fruit production under deficit irrigation conditions. Similar responses have been reported in sweet cherry and other fruit crops exposed to mild to moderate water deficit, where reproductive growth is maintained at the expense of vegetative growth [19,52,53,54]. Under these conditions, fruits act as the dominant carbon sink when assimilate availability becomes limiting (e.g., [55]). In contrast, DI produced smaller cherries, although the reduction in fruit size was not large enough to affect yield, as indicated. Because deficit irrigation was imposed when fruit growth is mainly driven by cell expansion (BBCH 76), the reduction in fruit diameter likely reflected limitations in fruit expansion rather than carbon limitation, as reported for tomato fruit by Medyouni et al. [56]. Fruit size is a key quality trait determining crop value in sweet cherry, thus, reduction in fruit diameter under DI may have economic implications for growers despite the absence of significant effect on yield.
Maintaining fruit yield while reducing irrigation increased water productivity in DI trees by 67%. This indicates that the decrease in water supply was proportionally greater than the reduction in physiological activity, allowing fruit production to be sustained with considerably less water. However, the potential gain in water productivity should be weighed against possible reductions in fruit size, given its importance in crop value.
5. Conclusions
The physiological response of ‘Regina’ trees to deficit irrigation followed by postharvest rewatering was studied. Deficit irrigation reduced tree water status, gas exchange and fruit size, but did not affect fruit yield. Carbon assimilation responses were more closely associated with stomatal and mesophyll conductance than with leaf water potential, indicating that physiological regulation under water deficit was not driven exclusively by tree water status. Changes in leaf carbon partitioning and structural traits suggest that source-sink relationships contribute to this response. Although deficit irrigation substantially increased water productivity, the reduction in cherry size highlights a potential trade-off between water savings and crop value in sweet cherry orchards.
Author Contributions
Conceptualization, E.J.-F.; methodology, E.J.-F.; formal analysis, R.C.-P.; data curation, R.C.-P.; writing—original draft preparation, R.C.-P. and E.J.-F.; writing—review and editing, E.J.-F., V.H.-M., J.G.-V., G.C., R.T.-N., R.C.-R., C.P. and J.B.; visualization, E.J.-F.; supervision, E.J.-F.; project administration, E.J.-F.; funding acquisition, E.J.-F. All authors have read and agreed to the published version of the manuscript.
Funding
This study was supported by ANID-FONDECYT No. 11220732 from the Agencia Nacional de Investigación y Desarrollo de Chile (ANID, Chile).
Data Availability Statement
The raw data supporting the conclusions of this article will be made available by the authors on request.
Acknowledgments
The authors thank Fundo San Patricio, Lumaco, Chile for providing the plant material, Project 2024 FEQUIP-JG-02 (Universidad Católica de Temuco), and the Proyecto Anillo ATE220038 for facilitating measurement support.
Conflicts of Interest
The authors declare no conflicts of interest. The funders had no role in the design of the study; in the collection, analyses, or interpretation of data; in the writing of the manuscript; or in the decision to publish the results.
References
- Faienza, M.F.; Corbo, F.; Carocci, A.; Catalano, A.; Clodoveo, M.L.; Grano, M.; Wang, D.Q.-H.; D’Amato, G.; Muraglia, M.; Franchini, C.; et al. Novel Insights in Health-Promoting Properties of Sweet Cherries. J. Funct. Foods 2020, 69, 103945. [CrossRef]
- Nunes, A.R.; Gonçalves, A.C.; Falcão, A.; Alves, G.; Silva, L.R. Prunus avium L. (Sweet Cherry) By-Products: A Source of Phenolic Compounds with Antioxidant and Anti-Hyperglycemic Properties—A Review. Appl. Sci. 2021, 11, 8516. [CrossRef]
- Food and Agriculture Organization of the United Nations. FAOSTAT Database. Available online: https://www.fao.org/faostat/en/#data/QC/visualize (accessed on 20 June 2024).
- IPCC. Climate Change 2014: Synthesis Report. Contribution of Working Groups I, II and III to the Fifth Assessment Report of the Intergovernmental Panel on Climate Change; Pachauri, R.K.; Meyer, L.A., Eds.; IPCC: Geneva, Switzerland, 2014.
- Garreaud, R.D.; Boisier, J.P.; Rondanelli, R.; Montecinos, A.; Sepúlveda, H.H.; Veloso-Aguila, D. The Central Chile Mega Drought (2010–2018): A Climate Dynamics Perspective. Int. J. Climatol. 2020, 40, 421–439. [CrossRef]
- Ahluwalia, O.; Singh, P.C.; Bhatia, R. A Review on Drought Stress in Plants: Implications, Mitigation and the Role of Plant Growth Promoting Rhizobacteria. Resour. Environ. Sustain. 2021, 5, 100032. [CrossRef]
- Aguilera, P.; Ortiz, N.; Becerra, N.; Turrini, A.; Gaínza-Cortés, F.; Silva-Flores, P.; Aguilar-Paredes, A.; Romero, J.K.; Jorquera-Fontena, E.; Mora, M.L.L.; et al. Application of Arbuscular Mycorrhizal Fungi in Vineyards: Water and Biotic Stress Under a Climate Change Scenario: New Challenge for Chilean Grapevine Crop. Front. Microbiol. 2022, 13, 826571. [CrossRef]
- Fadiji, A.E.; Santoyo, G.; Yadav, A.N.; Babalola, O.O. Efforts towards Overcoming Drought Stress in Crops: Revisiting the Mechanisms Employed by Plant Growth-Promoting Bacteria. Front. Microbiol. 2022, 13, 962427. [CrossRef]
- Solh, M.; van Ginkel, M. Drought Preparedness and Drought Mitigation in the Developing World’s Drylands. Weather Clim. Extrem. 2014, 3, 62–66. [CrossRef]
- Martínez-Vilalta, J.; Poyatos, R.; Aguadé, D.; Retana, J.; Mencuccini, M. A New Look at Water Transport Regulation in Plants. New Phytol. 2014, 204, 105–115. [CrossRef]
- Wang, S.; Hoch, G.; Grun, G.; Kahmen, A. Water Loss after Stomatal Closure: Quantifying Leaf Minimum Conductance and Minimal Water Use in Nine Temperate European Tree Species during a Severe Drought. Tree Physiol. 2024, 44, tpae027. [CrossRef]
- Medrano, H.; Escalona, J.M.; Bota, J.; Gulías, J.; Flexas, J. Regulation of Photosynthesis of C3 Plants in Response to Progressive Drought: Stomatal Conductance as a Reference Parameter. Ann. Bot. 2002, 89, 895–905. [CrossRef]
- Nebauer, S.G.; Renau-Morata, B.; Guardiola, J.L.; Molina, R.-V. Photosynthesis Down-Regulation Precedes Carbohydrate Accumulation under Sink Limitation in Citrus. Tree Physiol. 2011, 31, 169–177. [CrossRef]
- Jorquera-Fontena, E.; Tighe-Neira, R.; Bota, J.; Inostroza-Blancheteau, C.; Pastenes, C. Response of Sink Manipulation in ‘Lapins’ Sweet Cherry (Prunus avium L.) Branches to Late-Deficit Irrigation. Sci. Hortic. 2022, 304, 111323. [CrossRef]
- Hallik, L.; Niinemets, Ü.; Kull, O. Photosynthetic Acclimation to Light in Woody and Herbaceous Species: A Comparison of Leaf Structure, Pigment Content and Chlorophyll Fluorescence Characteristics Measured in the Field. Plant Biol. 2012, 14, 88–99. [CrossRef]
- de la Riva, E.G.; Olmo, M.; Poorter, H.; Ubera, J.L.; Villar, R. Leaf Mass per Area (LMA) and Its Relationship with Leaf Structure and Anatomy in 34 Mediterranean Woody Species along a Water Availability Gradient. PLoS ONE 2016, 11, e0148788. [CrossRef]
- Kardiman, R.; Ræbild, A. Relationship between Stomatal Density, Size and Speed of Opening in Sumatran Rainforest Species. Tree Physiol. 2018, 38, 696–705. [CrossRef]
- Centritto, M. Photosynthetic Limitations and Carbon Partitioning in Cherry in Response to Water Deficit and Elevated [CO2]. Agric. Ecosyst. Environ. 2005, 106, 233–242. [CrossRef]
- Blanco, V.; Torres-Sánchez, R.; Blaya-Ros, P.J.; Pérez-Pastor, A.; Domingo, R. Vegetative and Reproductive Response of ‘Prime Giant’ Sweet Cherry Trees to Regulated Deficit Irrigation. Sci. Hortic. 2019, 249, 478–489. [CrossRef]
- Küçükyumuk, C. Responses of Sweet Cherry Trees to Regulated Deficit Irrigation Applied before and after Harvesting. J. Agric. Sci. 2024, 162, 91–104. [CrossRef]
- Toro, G.; Pastenes, C.; Salvatierra, A.; Pimientel, P. Trade-off between Hydraulic Sensitivity, Root Hydraulic Conductivity and Water Use Efficiency in Grafted Prunus under Water Deficit. Agric. Water Manag. 2023, 282, 108284. [CrossRef]
- Houghton, E.; Bevandick, K.; Neilsen, D.; Hannam, K.; Nelson, L.M. Effects of Postharvest Deficit Irrigation on Sweet Cherry (Prunus avium) in Five Okanagan Valley, Canada, Orchards: II. Phenology, Cold Hardiness, Fruit Yield, and Quality. Can. J. Plant Sci. 2023, 103, 184–200. [CrossRef]
- Carrasco-Benavides, M.; Espinoza Meza, S.; Olguín-Cáceres, J.; Muñoz-Concha, D.; von Bennewitz, E.; Ávila-Sánchez, C.; Ortega-Farías, S. Effects of Regulated Post-harvest Irrigation Strategies on Yield, Fruit Quality and Water Productivity in a Drip-irrigated Cherry Orchard. N. Z. J. Crop Hortic. Sci. 2020, 48, 97–116. [CrossRef]
- Soil Survey Staff. Keys to Soil Taxonomy, 8th ed.; U.S. Department of Agriculture, Natural Resources Conservation Service: Washington, DC, USA, 1998.
- CIREN. Descripciones de Suelos, Materiales y Símbolos. Estudio Agrológico IX Región; Publicación CIREN N° 122; CIREN: Santiago, Chile, 2002.
- Allen, R.G.; Pereira, L.S.; Raes, D.; Smith, M. Crop Evapotranspiration - Guidelines for Computing Crop Water Requirements - FAO Irrigation and Drainage Paper 56; Food and Agriculture Organization of the United Nations: Rome, Italy, 1998.
- Intrigliolo, D.S.; Castel, J.R. Performance of Various Water Stress Indicators for Prediction of Fruit Size Response to Deficit Irrigation in Plum. Agric. Water Manag. 2006, 83, 173–180. [CrossRef]
- Harley, P.C.; Loreto, F.; Di Marco, G.; Sharkey, T.D. Theoretical Considerations When Estimating the Mesophyll Conductance to CO2 Flux by Analysis of the Response of Photosynthesis to CO2. Plant Physiol. 1992, 98, 1429–1436. [CrossRef]
- Bernacchi, C.J.; Portis, A.R.; Nakano, H.; von Caemmerer, S.; Long, S.P. Temperature Response of Mesophyll Conductance. Implications for the Determination of Rubisco Enzyme Kinetics and for Limitations to Photosynthesis in Vivo. Plant Physiol. 2002, 130, 1992–1998. [CrossRef]
- Niinemets, Ü.; Cescatti, A.; Rodeghiero, M.; Tosens, T. Leaf Internal Diffusion Conductance Limits Photosynthesis More Strongly in Older Leaves of Mediterranean Evergreen Broad-leaved Species. Plant Cell Environ. 2005, 28, 1552–1566. [CrossRef]
- Holtzman, N.M.; Anderegg, L.D.L.; Kraatz, S.; Mavrovic, A.; Sonnentag, O.; Pappas, C.; Cosh, M.H.; Langlois, A.; Lakhankar, T.; Tesser, D.; et al. L-Band Vegetation Optical Depth as an Indicator of Plant Water Potential in a Temperate Deciduous Forest Stand. Biogeosciences 2021, 18, 739–753. [CrossRef]
- Rodriguez-Dominguez, C.M.; Forner, A.; Martorell, S.; Choat, B.; Lopez, R.; Peters, J.M.R.; Pfautsch, S.; Mayr, S.; Carins-Murphy, M.R.; McAdam, S.A.M.; et al. Leaf Water Potential Measurements Using the Pressure Chamber: Synthetic Testing of Assumptions towards Best Practices for Precision and Accuracy. Plant Cell Environ. 2022, 45, 2037–2061. [CrossRef]
- Choné, X.; van Leeuwen, C.; Dubourdieu, D.; Gaudillère, J.P. Stem Water Potential Is a Sensitive Indicator of Grapevine Water Status. Ann. Bot. 2001, 87, 477–483. [CrossRef]
- Sant’Anna, C.; Costa, L.T.; Abud, Y.; Biancatto, L.; Miguens, F.C.; de Souza, W. Sugarcane Cell Wall Structure and Lignin Distribution Investigated by Confocal and Electron Microscopy. Microsc. Res. Tech. 2013, 76, 829–834. [CrossRef]
- Usenik, V.; Stampar, F.; Mikulic-Petkovsek, M.; Kastelec, D. The Effect of Fruit Size and Fruit Colour on Chemical Composition in ‘Kordia’ Sweet Cherry (Prunus avium L.). J. Food Compos. Anal. 2015, 38, 121–130. [CrossRef]
- Atkinson, C.J.; Policarpo, M.; Webster, A.D.; Kingswell, G. Drought Tolerance of Clonal Malus Determined from Measurements of Stomatal Conductance and Leaf Water Potential. Tree Physiol. 2000, 20, 557–563. [CrossRef]
- Rahmati, M.; Davarynejad, G.H.; Génard, M.; Bannayan, M.; Azizi, M.; Vercambre, G. Peach Water Relations, Gas Exchange, Growth and Shoot Mortality under Water Deficit in Semi-Arid Weather Conditions. PLoS ONE 2015, 10, e0120246. [CrossRef]
- Fernandes, R.D.M.; Cuevas, M.V.; Diaz-Espejo, A.; Hernandez-Santana, V. Effects of Water Stress on Fruit Growth and Water Relations between Fruits and Leaves in a Hedgerow Olive Orchard. Agric. Water Manag. 2018, 210, 32–40. [CrossRef]
- Salvi, A.M.; Smith, D.D.; Adams, M.A.; McCulloh, K.A.; Givnish, T.J. Mesophyll Photosynthetic Sensitivity to Leaf Water Potential in Eucalyptus: A New Dimension of Plant Adaptation to Native Moisture Supply. New Phytol. 2021, 230, 1844–1855. [CrossRef]
- Lanari, V.; Palliotti, A.; Sabbatini, P.; Howell, G.S.; Silvestroni, O. Optimizing Deficit Irrigation Strategies to Manage Vine Performance and Fruit Composition of Field-Grown ‘Sangiovese’ (Vitis vinifera L.) Grapevines. Sci. Hortic. 2014, 179, 239–247. [CrossRef]
- Plavcová, L.; Jupa, R.; Mészáros, M.; Scháňková, K.; Kovalíková, Z.; Náměstek, J. Stem Water Potential, Stomatal Conductance and Yield in Irrigated Apple Trees. Plant Soil Environ. 2023, 69, 303–313. [CrossRef]
- Paul, M.J.; Foyer, C.H. Sink Regulation of Photosynthesis. J. Exp. Bot. 2001, 52, 1383–1400. [CrossRef]
- Urban, L.; Léchaudel, M.; Lu, P. Effect of Fruit Load and Girdling on Leaf Photosynthesis in Mangifera indica L. J. Exp. Bot. 2004, 55, 2075–2085. [CrossRef]
- Quentin, A.G.; Close, D.C.; Hennen, L.M.H.P.; Pinkard, E.A. Down-Regulation of Photosynthesis Following Girdling, but Contrasting Effects on Fruit Set and Retention, in Two Sweet Cherry Cultivars. Plant Physiol. Biochem. 2013, 73, 359–367. [CrossRef]
- Moing, A.; Langlois, N.; Svanella, L.; Zanetto, A.; Gaudillère, J.-P. Variability in Sorbitol: Sucrose Ratio in Mature Leaves of Different Prunus Species. J. Am. Soc. Hortic. Sci. 1997, 122, 83–90. [CrossRef]
- Jiménez, S.; Dridi, J.; Gutiérrez, D.; Moret, D.; Irigoyen, J.J.; Moreno, M.A.; Gogorcena, Y. Physiological, Biochemical and Molecular Responses in Four Prunus Rootstocks Submitted to Drought Stress. Tree Physiol. 2013, 33, 1061–1075. [CrossRef]
- Kottapalli, J.; David-Schwartz, R.; Khamaisi, B.; Brandsma, D.; Lugassi, N.; Egbaria, A.; Kelly, G.; Granot, D. Sucrose-Induced Stomatal Closure Is Conserved across Evolution. PLoS ONE 2018, 13, e0205359. [CrossRef]
- Vincent, D.; Lapierre, C.; Pollet, B.; Cornic, G.; Negroni, L.; Zivy, M. Water Deficits Affect Caffeate O-Methyltransferase, Lignification, and Related Enzymes in Maize Leaves. A Proteomic Investigation. Plant Physiol. 2005, 137, 949–960. [CrossRef]
- Jiao, Y.; Niklas, K.J.; Wang, L.; Yu, K.; Li, Y.; Shi, P. Influence of Leaf Age on the Scaling Relationships of Lamina Mass vs. Area. Front. Plant Sci. 2022, 13, 860206. [CrossRef]
- Pearce, D.W.; Millard, S.; Bray, D.F.; Rood, S.B. Stomatal Characteristics of Riparian Poplar Species in a Semi-Arid Environment. Tree Physiol. 2006, 26, 211–218. [CrossRef]
- Gonçalves, B.; Correia, C.M.; Silva, A.P.; Bacelar, E.A.; Santos, A.; Moutinho-Pereira, J.M. Leaf Structure and Function of Sweet Cherry Tree (Prunus avium L.) Cultivars with Open and Dense Canopies. Sci. Hortic. 2008, 116, 381–387. [CrossRef]
- Pérez-Pastor, A.; Ruiz-Sánchez, M.C.; Domingo, R. Effects of Timing and Intensity of Deficit Irrigation on Vegetative and Fruit Growth of Apricot Trees. Agric. Water Manag. 2014, 134, 110–118. [CrossRef]
- Hajlaoui, H.; Maatallah, S.; Guizani, M.; Boughattas, N.E.H.; Guesmi, A.; Ennajeh, M.; Dabbou, S.; Lopez-Lauri, F. Effect of Regulated Deficit Irrigation on Agronomic Parameters of Three Plum Cultivars (Prunus salicina L.) under Semi-Arid Climate Conditions. Plants 2022, 11, 1545. [CrossRef]
- Caruso, G.; Palai, G.; Gucci, R.; D’Onofrio, C. The Effect of Regulated Deficit Irrigation on Growth, Yield, and Berry Quality of Grapevines (Cv. Sangiovese) Grafted on Rootstocks with Different Resistance to Water Deficit. Irrig. Sci. 2023, 41, 453–467. [CrossRef]
- Marcelis, L.F.M. Sink Strength as a Determinant of Dry Matter Partitioning in the Whole Plant. J. Exp. Bot. 1996, 47, 1281–1291. [CrossRef]
- Medyouni, I.; Zouaoui, R.; Rubio, E.; Serino, S.; Ben Ahmed, H.; Bertin, N. Effects of Water Deficit on Leaves and Fruit Quality during the Development Period in Tomato Plant. Food Sci. Nutr. 2021, 9, 1949–1960. [CrossRef]
Figure 1.
Daily maximum and minimum air temperatures, accumulated rainfall, and reference evapotranspiration (ETo) during the trial. DABT, days after the beginning of treatments.
Figure 1.
Daily maximum and minimum air temperatures, accumulated rainfall, and reference evapotranspiration (ETo) during the trial. DABT, days after the beginning of treatments.
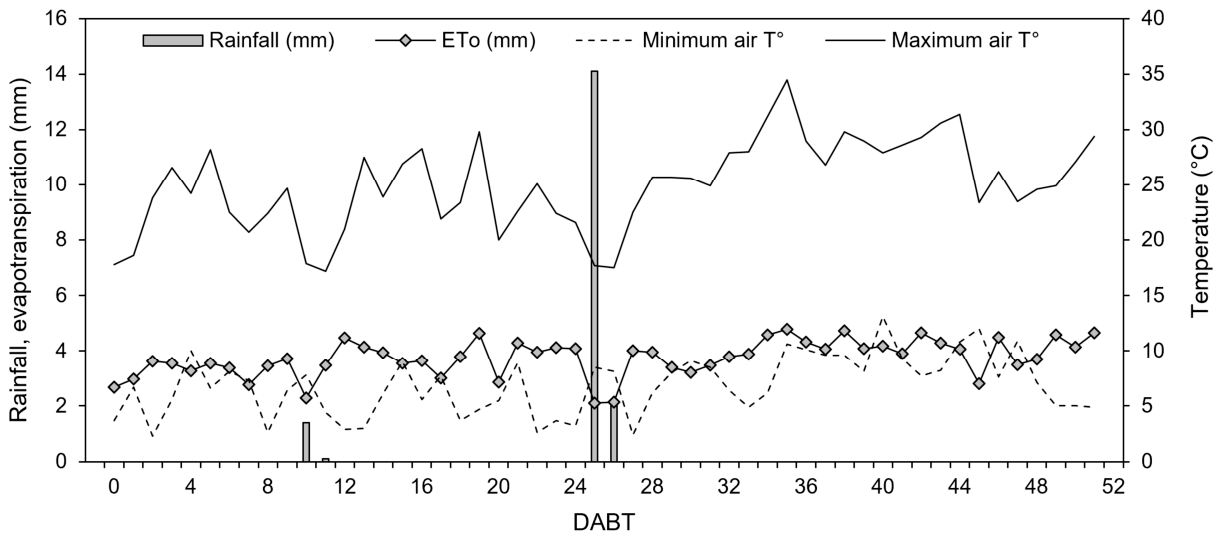
Figure 2.
Volumetric soil water content in fully irrigated (FI) and deficit irrigated (DI) sweet cherry trees cv. ‘Regina’. Field capacity (FC) and wilting point (WP) are indicated in dashed lines.
Figure 2.
Volumetric soil water content in fully irrigated (FI) and deficit irrigated (DI) sweet cherry trees cv. ‘Regina’. Field capacity (FC) and wilting point (WP) are indicated in dashed lines.
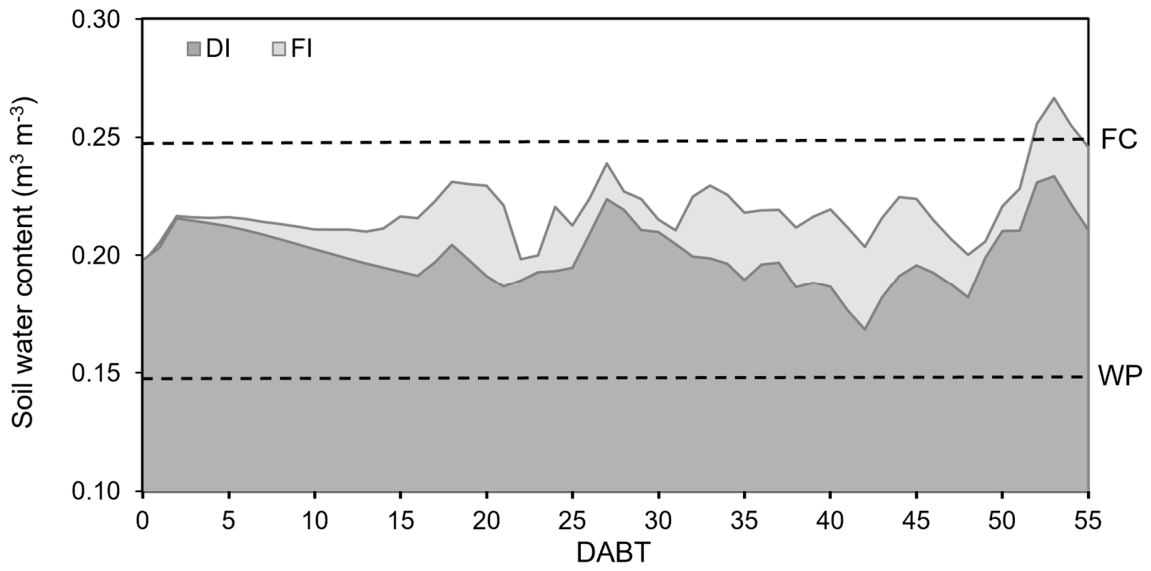
Figure 3.
Time course of stem water potential in sweet cherry trees cv. ‘Regina’ subjected to full irrigation (FI) and deficit irrigation (DI). The final measurement at 51 DABT was performed after three days of rewatering. Means (n=18) and ± standard errors are shown. The symbol * denotes significant differences between irrigation treatments at a given sampling date (Student’s t-test, p ≤ 0.05). Different uppercase and lowercase letters indicate significant differences in the time course within FI and DI, respectively (one-way ANOVA, p ≤ 0.05). The arrow indicates the harvest date.
Figure 3.
Time course of stem water potential in sweet cherry trees cv. ‘Regina’ subjected to full irrigation (FI) and deficit irrigation (DI). The final measurement at 51 DABT was performed after three days of rewatering. Means (n=18) and ± standard errors are shown. The symbol * denotes significant differences between irrigation treatments at a given sampling date (Student’s t-test, p ≤ 0.05). Different uppercase and lowercase letters indicate significant differences in the time course within FI and DI, respectively (one-way ANOVA, p ≤ 0.05). The arrow indicates the harvest date.
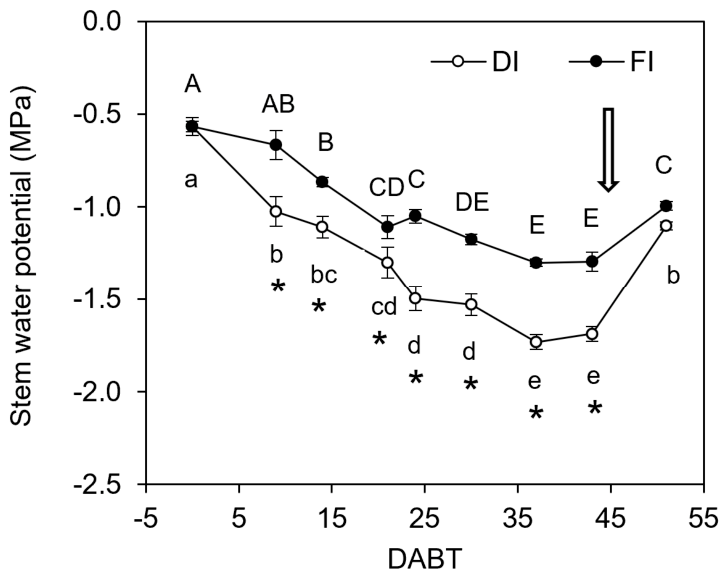
Figure 4.
Time course of leaf water potential (A), light-saturated photosynthesis (ASAT; B), stomatal conductance (gs; C), internal CO2 concentration (Ci; D), intrinsic water use efficiency (WUEi; E), and mesophyll conductance (gm; F) in sweet cherry cv. ‘Regina’ trees subjected to full irrigation (FI, filled circles) and deficit irrigation (DI, open circles). Means (n=9) and ± standard errors are shown. The symbol * indicates difference between treatments at a given sampling date (Welch’s t-test, p ≤ 0.05). Different uppercase and lowercase letters indicate significant differences in the time course within FI and DI, respectively (Dwass-Steel-Critchlow-Fligner test, p ≤ 0.05). The arrow indicates the harvest date.
Figure 4.
Time course of leaf water potential (A), light-saturated photosynthesis (ASAT; B), stomatal conductance (gs; C), internal CO2 concentration (Ci; D), intrinsic water use efficiency (WUEi; E), and mesophyll conductance (gm; F) in sweet cherry cv. ‘Regina’ trees subjected to full irrigation (FI, filled circles) and deficit irrigation (DI, open circles). Means (n=9) and ± standard errors are shown. The symbol * indicates difference between treatments at a given sampling date (Welch’s t-test, p ≤ 0.05). Different uppercase and lowercase letters indicate significant differences in the time course within FI and DI, respectively (Dwass-Steel-Critchlow-Fligner test, p ≤ 0.05). The arrow indicates the harvest date.
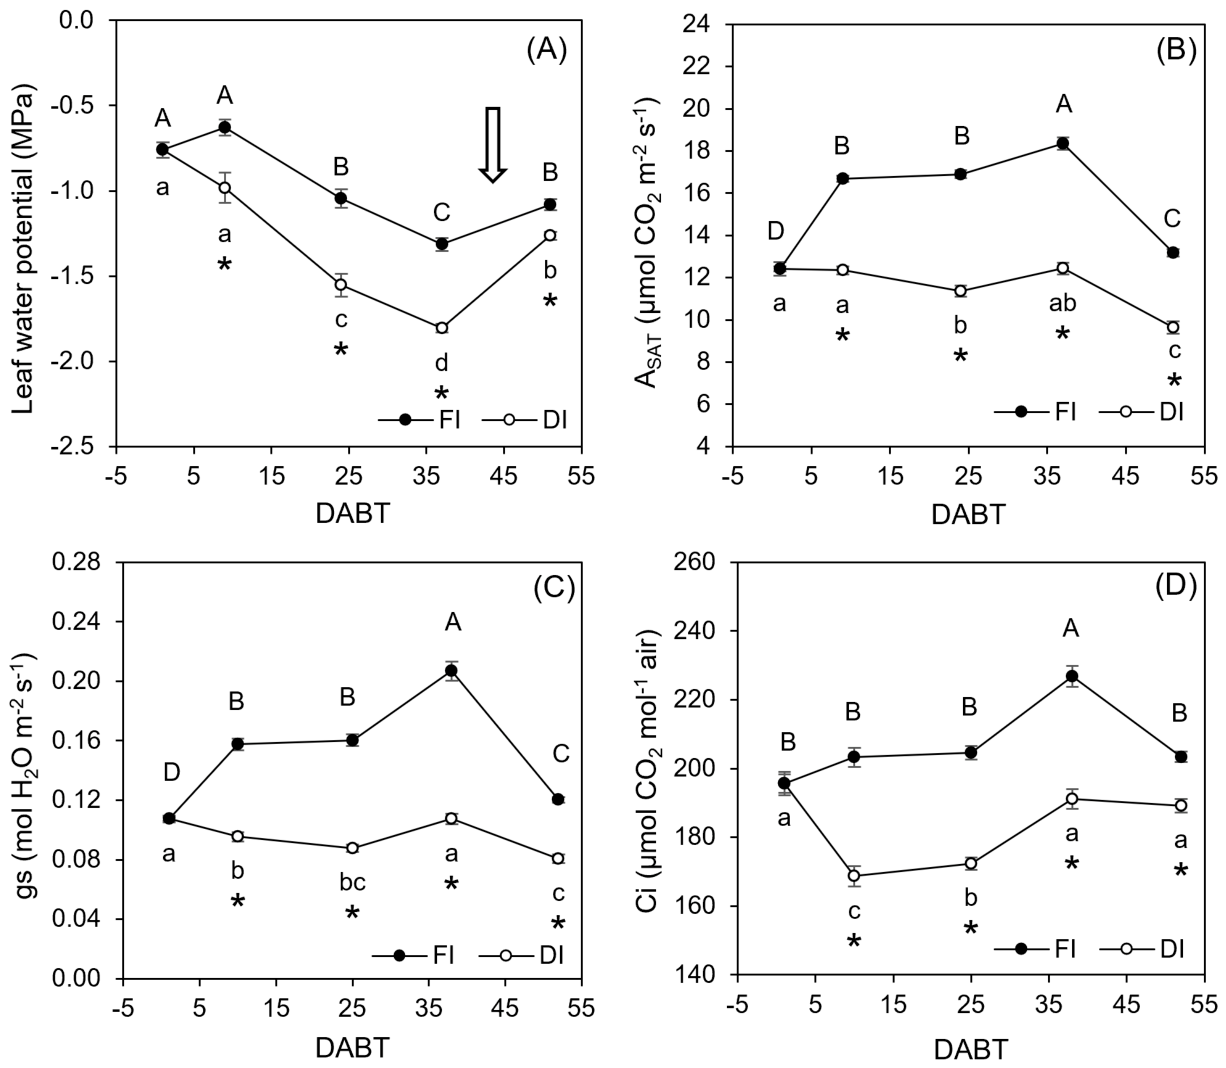
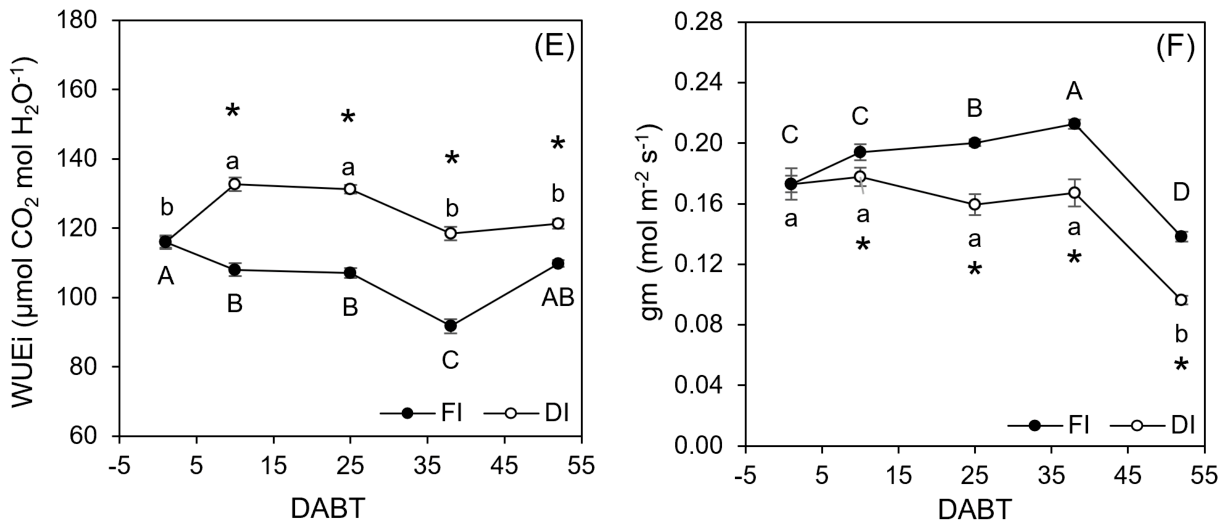
Figure 5.
Regression analysis between leaf water potential (ΨL) and light-saturated photosynthesis (ASAT; A), ΨL and stomatal conductance (gs; B), gs and ASAT (C), gs and intercellular CO2 concentration (Ci; D), mesophyll conductance (gm) and ASAT (E), and gm and Ci (F) in leaves of sweet cherry cv. ‘Regina’ trees (n=81) subjected to full irrigation (FI, filled circles) and deficit irrigation (DI, open circles). Regression equations and coefficients of determination R2 are shown.
Figure 5.
Regression analysis between leaf water potential (ΨL) and light-saturated photosynthesis (ASAT; A), ΨL and stomatal conductance (gs; B), gs and ASAT (C), gs and intercellular CO2 concentration (Ci; D), mesophyll conductance (gm) and ASAT (E), and gm and Ci (F) in leaves of sweet cherry cv. ‘Regina’ trees (n=81) subjected to full irrigation (FI, filled circles) and deficit irrigation (DI, open circles). Regression equations and coefficients of determination R2 are shown.
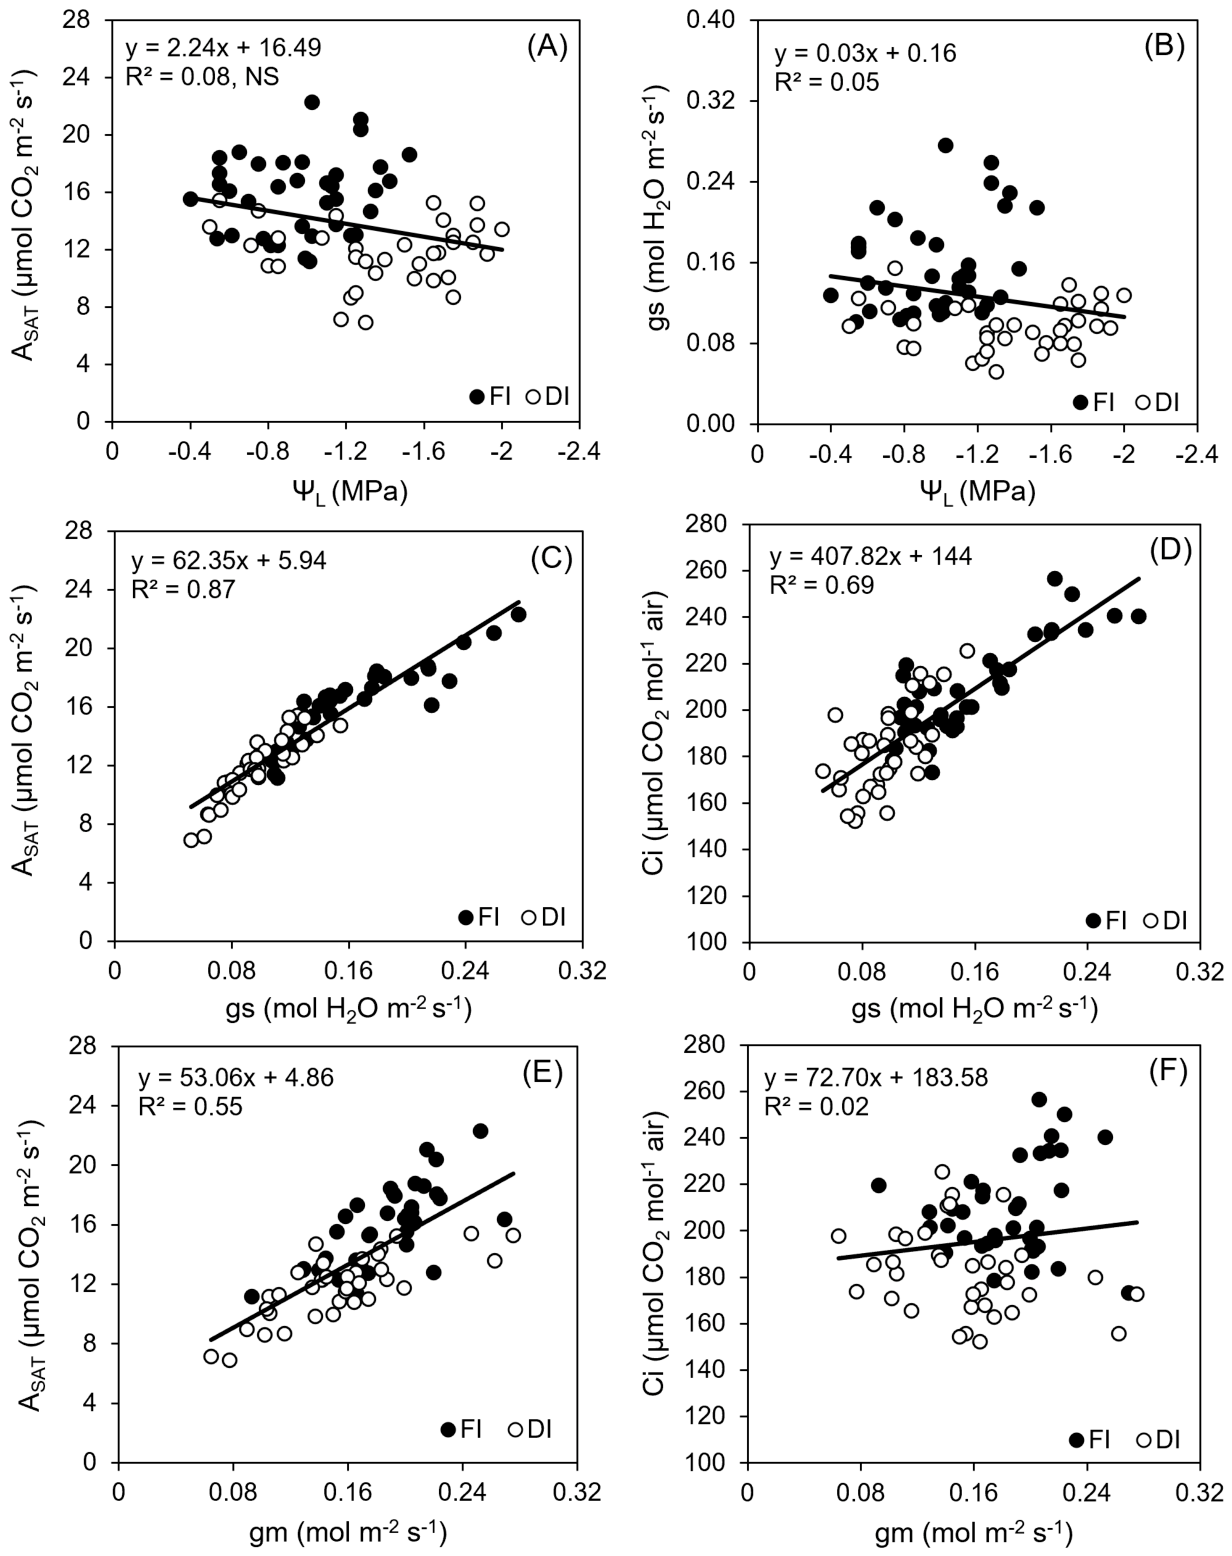

Table 1.
Representative lignin visualization, relative lignin fluorescence units, stomatal density, leaf mass per area unit and chlorophyll index (SPAD unit) in leaves from sweet cherry cv. ‘Regina’ trees subjected to full irrigation (FI) and deficit irrigation (DI) at 37 and 51 days after the beginning of treatment (DABT). Means (n=9) and ± standard errors are shown. The symbol * indicates significant differences between FI and DI within the same sampling date (p ≤ 0.05). Different uppercase letters indicate significant differences between sampling dates within the same irrigation treatment (p ≤ 0.05).
Table 1.
Representative lignin visualization, relative lignin fluorescence units, stomatal density, leaf mass per area unit and chlorophyll index (SPAD unit) in leaves from sweet cherry cv. ‘Regina’ trees subjected to full irrigation (FI) and deficit irrigation (DI) at 37 and 51 days after the beginning of treatment (DABT). Means (n=9) and ± standard errors are shown. The symbol * indicates significant differences between FI and DI within the same sampling date (p ≤ 0.05). Different uppercase letters indicate significant differences between sampling dates within the same irrigation treatment (p ≤ 0.05).
| DABT | Treatment | Representative visualization |
Lignin fluorescence (relative units) |
Stomatal density (no. mm-2) |
Leaf mass per area (g m-2) |
Chlorophyll index (SPAD) |
|---|---|---|---|---|---|---|
| 37 | FI | 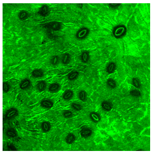 |
2330.20 ± 114.17 * |
335.25 ± 18.43 |
71.74 ± 3.95 B |
38.23 ± 0.80 |
| DI | 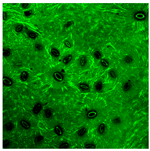 |
2141.30 ± 83.22 B |
325.38 ± 11.66 |
74.67 ± 2.16 |
37.89 ± 0.90 |
|
| 51+ | FI | 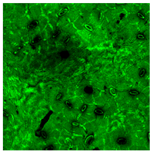 |
2512.01 ± 86.64 |
283.75 ± 28.05 |
80.07 ± 1.87 A |
38.55 ± 0.63 |
| DI | 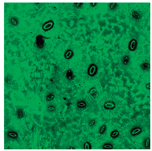 |
2539.09 ± 78.15 A |
308.5 ± 15.57 |
86.32 ± 2.07 * |
39.03 ± 0.99 |
+ Indicates postharvest rewatering.
Table 2.
Leaf soluble sugars in ‘Regina’ sweet cherry trees under full irrigation (FI) and deficit irrigation (DI) at 37 DABT. Means (n=9), standard errors, and significant differences (Student’s t-test, p ≤ 0.05) are shown.
Table 2.
Leaf soluble sugars in ‘Regina’ sweet cherry trees under full irrigation (FI) and deficit irrigation (DI) at 37 DABT. Means (n=9), standard errors, and significant differences (Student’s t-test, p ≤ 0.05) are shown.
| Variable | Treatment | Significance | |
| FI | DI | p-value | |
| Sucrose (mg g-1 FW) | 0.75 ± 0.15 | 0.32 ± 0.13 | 0.005 |
| Glucose (mg g-1 FW) | 9.77 ± 0.48 | 8.69 ± 0.59 | 0.176 |
| Fructose (mg g-1 FW) | 15.65 ± 0.90 | 15.6 ± 1.28 | 0.974 |
| Sorbitol (mg g-1 FW) | 18.40 ± 1.50 | 23.3 ± 1.67 | 0.002 |
| Total sugars (mg g-1 FW) | 44.59 ± 2.35 | 47.92 ± 3.05 | 0.400 |
Table 3.
Productive responses of sweet cherry cv. ‘Regina’/Gisela® 6 under full irrigation (FI) and deficit irrigation (DI). Means (n=6), standard errors, and significant differences (Student’s t-test, p < 0.05) are shown.
Table 3.
Productive responses of sweet cherry cv. ‘Regina’/Gisela® 6 under full irrigation (FI) and deficit irrigation (DI). Means (n=6), standard errors, and significant differences (Student’s t-test, p < 0.05) are shown.
| Variable | Treatment | Significance | |
| FI | DI | p-value | |
| Yield (kg tree-1) | 7.75 ± 0.88 | 6.90 ± 0.43 | 0.407 |
| Fruit diameter (mm) | 26.20 ± 0.23 | 24.13 ± 0.30 | 0.028 |
| Water productivity (kg m-3) | 14.61 ± 1.66 | 24.41 ± 1.51 | <0.001 |
Disclaimer/Publisher’s Note: The statements, opinions and data contained in all publications are solely those of the individual author(s) and contributor(s) and not of MDPI and/or the editor(s). MDPI and/or the editor(s) disclaim responsibility for any injury to people or property resulting from any ideas, methods, instructions or products referred to in the content. |
© 2026 by the authors. Licensee MDPI, Basel, Switzerland. This article is an open access article distributed under the terms and conditions of the Creative Commons Attribution (CC BY) license (http://creativecommons.org/licenses/by/4.0/).
Copyright: This open access article is published under a Creative Commons CC BY 4.0 license, which permit the free download, distribution, and reuse, provided that the author and preprint are cited in any reuse.