

Submitted:
27 August 2026
Posted:
27 August 2026
You are already at the latest version
Abstract
The partial collapse of the South Road Axis in 2018 generated widespread concern about the safety of similar critical bridges and viaducts built during the same historical period in Brasilia. Since many of these structures were designed with analogous structural systems, a thorough post-incident investigation was conducted to understand the failure mechanisms involved. This type of failure remains insufficiently examined in the available technical literature. The present work offers a detailed forensic investigation of the collapse of the South Road Axis viaduct, clarifying the key structural elements and governing mechanics that triggered the sudden failure. This study combined the collection of historical documentation, in situ debris investigation, geometrical and mechanical characterization, manual and numerical calculations, and the determination of structural performance. It is revealed that the viaduct had hidden vulnerabilities (such as a lack of structural redundancy and insufficient reinforcing steel) and was operating under unforeseen high cyclic shear demands, with inadequate maintenance intervals. Lastly, the repairs and strengthening techniques employed in the viaduct's recovery are also presented.
Keywords:
prestressed concrete
; bridges
; sudden failure
; retrofit
; maintenance
1. Introduction
1.1. Brasilia Historical Context
Brasilia was the first planned Federal District of Brazil. It was envisioned by the Urban Planner Lucio Costa, inspired by the architectural design of Oscar Niemeyer and the landscape design of Roberto Burle Marx. Brasilia’s origins date back to the 18th century as a possible route to connect the center of the country and to protect the administrative power from the vulnerable coastline. The city, however, was only planned in the middle of the 1950s by the administration of President Juscelino Kubitschek, who established an ambitious national modernization initiative to move the former capital, in Rio de Janeiro, to the center of the country.
The master plan of the city, in fact, began to materialize only in 1956, and the construction of the new capital, astonishingly, took 41 months and was officially concluded in 1960. The city master plan divided it into two major axes (the Monumental and the Road Axis) that conveniently crossed at the center. This design, combined with a smart multi-lane system with roundabouts and cloverleaf ramps, effectively increased mobility but required the city to have hundreds of these structures. In addition, the robust design and monumental character of the city plan required massive amounts of concrete, steel, and a formidable workforce. During this period, large numbers of workers from across the country were mobilized for the construction of Brasilia, granting the city its unique social diversity. Further, the first public engineering company of the New Capital (NOVACAP) was created as management aid at this time.
Today, Brasilia stands out for its iconic urban plan, characterized by concrete curved monuments that combine brutalist architectural identity with modernist philosophy. It is depicted by functionality, rationality, zoning, open spaces, and a futuristic vision of progress. These singular features earned the UNESCO World Heritage status in 1987 as a distinctive expression of modernist urban principles.
1.2. Brasilia Rapid Growth and Trafficking Demands
Originally, Brasilia was planned to house half a million people, and families were intentional to own 1 vehicle each, which gives a fair number of total vehicles around 125 thousand for the whole city. However, due to its political significance and quality of life, Brasilia has become the third-largest city in the country, with a population of 3.5 million and about 5 million in the metropolitan area. This immense increase (beyond the originally planned level) imposed heavy demands on infrastructure, housing, and transportation systems.
The urban characteristics of the city (large spaces, zoning, and wide roads) required the ownership of personal vehicles, making it a natural demand among city residents. In fact, data from the Department of Roads and Highways DER/DF [1] reports an average of 120,000 vehicles per day crossing the capital via the main arterial roads (Monumental Axis and Road Axis). This demand for trafficking vehicles is now greater than the city’s original total vehicle population, as anticipated in 1960.
1.3. Significance of South Road Axis Partial Collapse
The sudden partial collapse of the South Road Axis (at the Galeria dos Estados, in Figure 1) revealed structural vulnerabilities that could have been common to similar critical structures built during the same period of Brasilia’s construction. This alarmed the authorities and the population, and even more after the temporary obstruction of one of the main arterial roads in the Federal District.
As an immediate response, the local Government approved funds to shore up the other sections of the viaduct, following an emergency protocol involving structural stabilization, traffic interruption, and detour. Parallel to this, a trilateral partnership between the Department of Road Highways (DER), the Public Engineering Company NOVACAP, and the Structural Department of the University of Brasilia (UnB) was assembled. Their goal was to investigate the collapse and to develop a retrofitting plan for the fallen asset and other special viaducts and bridges. This mobilized over $32 million in investments for assessing, monitoring, and strengthening special infrastructure, including the retrofitting of 96 cloverleaf passages, strengthening of 40 strategic viaducts, and the construction of 4 extra bridge highways, according to the Brasilia Local Agency (2019) [2].
There are a few documented reports of similar collapses, such as the failure of the Wilkins Air Force Depot in Ohio in 1955 [3,4,5]; however, those involving special heritage structures made with prestressed concrete are even scarcer. For this reason, this paper underlines the failure mechanism that remains insufficiently examined in technical literature.
2. Methodology
The authors’ methodology consisted of an in-depth forensic investigation, followed by manual and numerical calculations of the viaduct.
The forensic investigation comprised a large collection of data from the existing structure: available construction documentation, in situ debris investigation, sample core extractions, geometrical and mechanical characterization. It is important to mention that many original documents from many monuments in Brasilia could not be retrieved from public archives (due to their age and inappropriate storage protocols at the time of construction). This collection allowed a clear representation of the existing structure. During this step, intrinsic issues related to the construction of the South Road Axis Viaduct become evident. Details of these problems are thoroughly highlighted in this manuscript.
In addition, design verifications for the Ultimate Limit State were checked in accordance with modern Brazilian Codes [6,7,8] and compared with finite-element numerical modeling using ABAQUS software [9]. This enabled the complete diagnostics of the asset, based on RC failure mechanics. Lastly, a description of the retrofitting and repair techniques employed in the viaduct’s recovery is presented.
Disclosure: The first and fourth authors of this study participated in the trilateral partnership that conducted investigations of the viaduct. The first author was a member of the University of Brasilia engineering department, while the fourth author is a regular employee of the NOVACAP structural engineering department.
3. Forensics Investigation
The forensics investigation comprised a thorough collection of data from the existing structure: available documentation of the construction (including technical drawings and project information), in situ debris investigation (including the demolition of specific segments of the viaduct and concrete members), invasive testing (core extractions from concrete members, and reinforcing steels amputations), geometrical (in site measurements) and mechanical characterization (rupture reports from collected samples conducted at the University of Brasilia). Since many original documents from the viaduct were missing or unavailable in public archives, in-situ exploration was deemed necessary. For this reason, geometric characterization, as well as the demolition of specific structural components, was imperative for understanding the asset’s structural geometry and engineering characteristics.
3.1. Viaduct Engineering Anatomy
The construction of the viaduct in Galeira dos Estados took about 3 months, between 1959 and 1960, due to the political pressure for the City’s grand opening [10]. The shape of the main structure was envisioned by Oscar Niemeyer and designed by the engineer Bruno Contarini, and a view of the main structural components of the viaduct is indicated in Figure 2:
The asset structure comprises 7 large column walls with a unique delta-wing shape with 7.4 m cantilevered extensions, reaching approximately 28 m in full width. The column wall thickness varies from 96 cm (at its extension edge) to 200 cm (at its center) – a common design feature observed in many monuments across the capital. The reinforcing steel of this element was comprised of smooth bars and is indicated in Figure 3 (left side, in magenta color). Cross-section drawings are indicated in Figure 4.
The column walls meet 8 simply supported prestressed hollow concrete core slabs, which form a 7-lane vehicle deck, resulting in a total viaduct length of 194 meters. Two abutments at the viaduct free ends connected the asset to the Road Axis. The deck is slightly tilted (about 1.6% inclination) along the main road, following a small street curvature, which also helps with water drainage since the city experiences heavy seasonal rains. This marginally changes the geometry, per column-wall, indicated in Figure 3.
The hollow core slab is 104 cm deep, and its span is about 22 meters between column supports. The edges of the slabs are solid concrete, supported by bearing pads over the column corbels (see Figure 2 and Figure 4a). At the center of the deck, there is one prestressed transverse beam (see Figure 2 and Figure 8a) connecting the 80 cm-diameter hollow cores to reduce dead weight. These cores are spaced 95 cm on center, creating 15 cm prestressing ribs within the deck to increase shear and flexural strength. Besides the longitudinal prestressing cables, the hollow slabs had longitudinal reinforcement in the transverse and longitudinal directions (10 mm-diameter smooth bars, spaced 20 cm on centers).
Another important detail of the assembly is the inverted T-beam extensions of the column-wall. It is, in fact, two rectangular elements attached to one another where the failure occurred (see Figure 4a). The lower section (red rectangle 158 x 50 cm) is a prestressed concrete cross-beam comprised of 16 strands (18 wires, 5mm diameter each), while the upper section (blue rectangle 84 x 54 cm) is a key-closure plain concrete encasement. This key insertion of plain concrete was poured after the placement of the concrete slabs to seal off the prestressing cables from moisture, which is supposed to isolate and protect the anchorage systems of these members. Therefore, this unreinforced element was not fully attached to the main cross-beam, nor could it attain flexural and shear resistance due to the lack of reinforcing steel. This element should thus be ignored in design calculations.
Furthermore, the prestressed cross-beam was designed with a small amount of conventional longitudinal reinforcing steel (smooth bars, 10 mm diameter at stirrup corners), noted amounts of single stirrups (smooth bars, 16 mm diameter, 8 cm on centers) and 16 prestressing strands (post-tensioning cables, possible with BBRV anchorage for buttonhead wedges system, or similar). There were no stirrups below the prestressed cross beam, only small amounts of longitudinal skin reinforcement distributed through its depth (as per Figure 4b). Also, there were 8 face bars (bent and inclined, as per Figure 3), 25mm diameter bars that followed the shape of the column wall. These bars improved the dowel action at the element’s extension.
Regarding the amount of steel in the critical section, steel areas were verified for both longitudinal (passive and active) and transverse reinforcements. The critical section had a passive reinforcing steel ratio of less than 0.16% and a prestressing steel ratio of 0.18%. These values are fairly analogous to the minimum 0.15% required by the modern Brazilian code, usually adopted to prevent cracks caused by concrete shrinkage. On the other hand, the transversal reinforcement ratio was 0.32%, considering a minimum transversal reinforcement of 0.16% for linear elements with concrete strengths below 30 MPa. These values tend to differ for volumetric elements (such as corbels and foundation blocks) compared to linear elements.
The post-tensioning system employed in the viaduct consisted of galvanized metal ducts through which grout was pumped to protect the steel wires embedded within the strands. This technique is still employed today, as it is a safe method for preventing stress corrosion of wires (which is critical in prestressed concrete structures) and for bonding the wires to the surrounding concrete.
The original design drawings of the viaduct structure were missing from public and administrative archives; however, NOVACAP had geometrical representations of the viaduct developed in 2013. These as-built drawings, along with information collected during the dismantlement of some sections, helped the forensic team develop the images for this manuscript.
3.2. Materials Characterization
After the incident, samples were extracted from target sections (concrete cores were retrieved from the column walls) and tested at the University of Brasilia’s laboratory for mechanical characterization. Steel reinforcing from post-tensioning wires were amputated and assessed at the same lab. Some concrete sections were tested with the phenolphthalein indicator to evaluate carbonation depth. Lab results indicated that the concrete nominal strength was surprisingly high 43.8 Mpa (from pillar 7) and 27.9 Mpa (from pillar 6) and the steel wires strength was about 1500 MPa. Carbonation tests indicated that carbon dioxide reached depths beyond the concrete nominal cover in some elements, suggesting that some reinforcing steel may have been subjected to corrosion. This was confirmed during tension tests of steel rebars, where some bars suffered severe loss of nominal area due to corrosion (some samples lost up to 50% of their original transversal area) [10]. However, the overall quality of the concrete material was considered adequate for a possible repairment or retrofitting of the asset.
At the time of construction, normal concrete compressive strength ranged from 15 to 20 MPa, and regular steel alloys were typically CA-32 (fyk = 320 MPa), while prestressing steel wires had normal relaxation.
3.3. Failure Chronology and Debris Investigation
According to site investigations and camera recordings from monitoring devices along the South Road axis, the collapse occurred around midday, when a large section of the deck suddenly collapsed (see Figure 5). There were no warning signs, such as large deflections or settlements, revealing that failure was brittle with partial collapse.
Local assessment of debris and site scene revealed that the failure mechanism started by the shear failure of column-wall P7 (indicated by the smooth “clear” section - see Figure 6 and Figure 7b) at the beginning of the extension of the element (where there is a transition of the delta-shape format to the column cantilever extension).
Once the column-wall P7 extension collapsed, the right support of the concrete hollow began to move downward due to the loss of equilibrium. This movement pulled the other edge of the deck, which had been connected at the top of the column-wall P6 (by the plain concrete key closure and the deck prestressing anchorage). The movement of this massive section generated immense kinetic energy, which was partially absorbed by the cross-beam of the column-wall P6 (which presented the same chronic deficiency of the pillar P7). This created a large, unbalanced lateral force that exhausted the remaining capacity of the cross beam at pillar P6, fracturing it by pullout and shear, spalling the concrete and damaging adjacent members (as seen in the destroyed surface in Figure 7a). The last component of the concrete hollow deck was its prestressed transverse beam, which was unable to support all the remaining loads from the system. This last element also failed under shear, creating a smooth surface evident on site, as shown in Figure 8a (highlighted by the center arrow). Additionally, a large longitudinal crack was common across the road lane in all deck sections adjacent to the partially collapsed deck, indicating that endemic problems were not exclusive to this region. This crack is shown in Figure 8b.
Figure 8.
Investigation of the debris (a) Section of the deck that collapsed, highlighting the transverse beam that failed under shear; (b) Large longitudinal asphalt crack over the deck next to the falling section (between column wall P5 and P6).
Figure 8.
Investigation of the debris (a) Section of the deck that collapsed, highlighting the transverse beam that failed under shear; (b) Large longitudinal asphalt crack over the deck next to the falling section (between column wall P5 and P6).
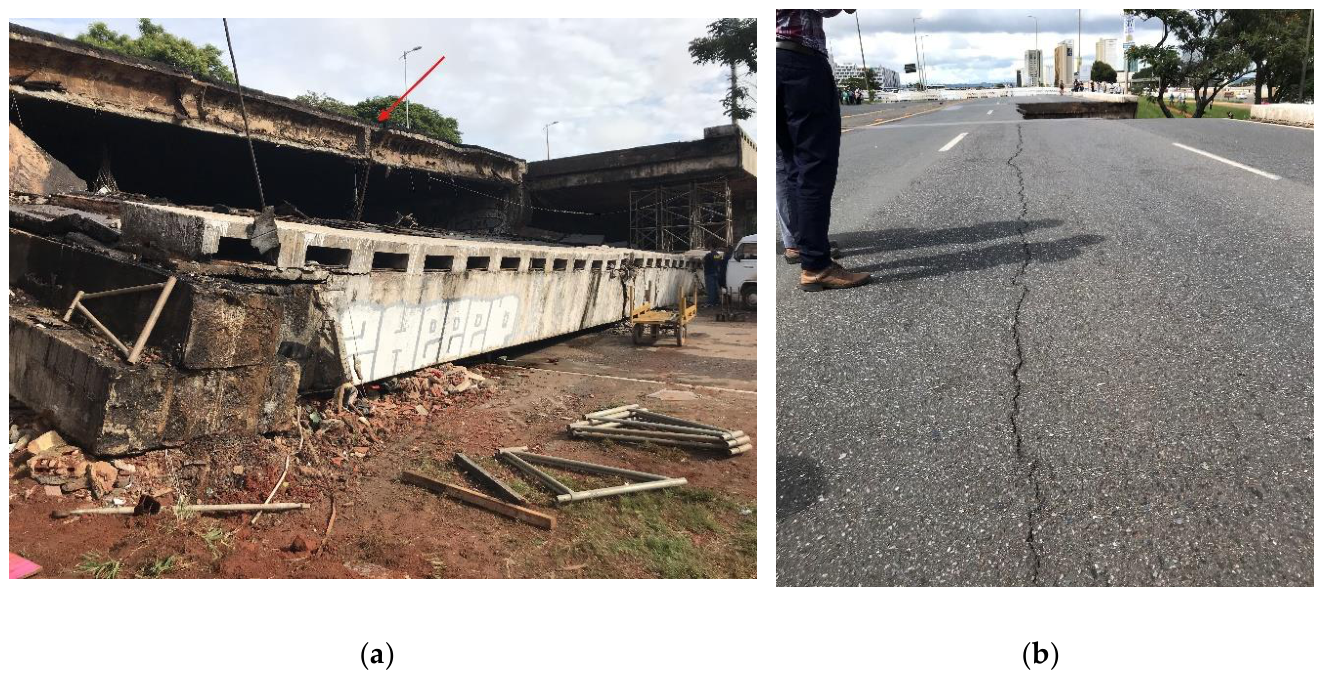
Additionally, engineering teams were unable to assess the rubble across the viaduct because a restaurant used to be underneath the viaduct, where infill partition walls obstructed the view of the pillars. Once these elements were removed or demolished, engineers were able to detect several problems, including severe cracking and chronic water infiltration, in all column walls. This evidence is indicated in Figure 9.
Engineers were also able to evaluate the quality of the materials employed during the construction of the viaduct. They have detected a lack of cementitious mortar (grout) in several strands of prestressing cables. Alongside, the concrete was composed of rounded river gravel aggregates rather than conventional limestone coarse aggregate. These evidences are seen in Figure 10.
In addition, degradation at the base of the column-wall was identified by extensive corrosion of the column rebars, along with concrete spalling and cracking of the nominal cover, as seen in Figure 11a. This region is usually targeted by undomiciled persons with unsanitary street behavior, exposing concrete to aggressive chemical agents. Lastly, at the base of the column wall, inclined bars from the extension faces were peeled off during the downfall of the extension, in an attempt to prevent partial collapse through dowel action. This is indicated in Figure 11b.
3.4. Standards Recommendation in 1960
The first published code on the design of prestressed structures in Brazil was NBR 7197 (Design of Structures made with Prestressed Concrete) [11], published in 1989. Before this period, engineers followed the guidance of NB1 (Design of Concrete Structures) [12] and NB2 (Design and Construction of Bridges) [13]. However, NB1 first publication was in 1940 (and then updated in 1953 and 1960), while NB2 first publication was in 1941 (and updated in 1961). For the determination of actions on bridges, designers followed the recommendations in NB6 (Vehicle loads on Highway Bridges) [14], which was first published in 1960.
Chronologically, given the construction period of the South Road Axis viaduct (between 1959 and 1960), engineers had to follow other design guidelines set out in international codes. In other words, Brazilian national codes were either absent or lacked sufficient information on the behavior of large prestressed concrete bridges.
Among the available standards at the time, engineering faculties employed some pioneering and traditional literature, which were mainly based on [15]:
- ACI 318-51 (Building code requirements for reinforced concrete, 1951);
- AASHO/49 (Standard specification for highway bridges, 1949);
- GB/48 (British Standard Code of practice for structural use of normal reinforced concrete in buildings, 1948);
- DIN 1072 (“Straßen- und Wegbrücken – Lastannahmen” – Loads on road and pedestrian bridges, 1950);
- DIN-1045 (“Beton - und Stahlbetonbau – Bemessung und Ausführung” – Design and Construction of Concrete and Reinforced Concrete Structures, 1952);
- DIN 4227 (“Spannbeton – Richtlinien für Bemessung und Ausführung” – Design of Prestressed Concrete Structures, 1953).
Many of these codes served as fundamental instructions for the development of recognized European codes, like the CEB/fib series after the 70s.
Regarding the available Brazilian specifications at the time (NB1 and NB2), shear design was based on principal stresses and checked for the required transverse reinforcement. Most of the previous international codes checked shear design by limiting shear stresses in concrete elements (for example, 0.4 – 0.6 MPa for beams without transverse reinforcement, and 1.4 – 2.0 MPa for beams with transverse reinforcement).
In the case of NB1 and NB2, maximum shear stresses were limited for elements without transversal reinforcements, and for elements with transversal reinforcements. The Brazilian code recommended checking this requirement for combined shear and torsion moments for the Ultimate Limit State (ULS). When minimum amounts of shear reinforcement were employed, minimum spacing requirements (such as d/20) could be adopted. Also, it was common practice to use part of the bottom beam longitudinal reinforcement bent up and anchored at the member’s end as top reinforcement. This bent bar was considered in shear design by assuming it contributed to carrying part of the shear stresses from the stirrups.
For prestressed elements, Brazilian engineers determined the required stirrup spacing based on the amount of tension the stirrups would absorb, given the presence of prestresses (if prestresses were not considered, the stress would be entirely absorbed by the stirrups). The level of stress was determined from the principal stresses in mechanics [16]. At the time, it was believed that shear failure would be less critical in design, since flexural failure would govern the ULS. In addition, shear design had not yet evolved to the Generalized Truss Analogy from Mörsch’s method, in a time when laboratory experiments were scarce. Therefore, important phenomena and parameters that usually impact the shear behavior of concrete elements (such as the size effect, progressive collapse, fatigue, and cyclic deterioration) were not fully explored or documented at this time.
Conversely, the design of longitudinal reinforcements, whether for non-prestressing or prestressing steel, employed either the Rupture Method (equivalent to ULS) or the Allowable Stress Method (ASD). The older version of NB1 allowed tension reinforcement to be made of bars or wires (but no minimum non-prestressing steel is specified to avoid progressive collapse). And the minimum amount of tension reinforcement varied solely from 0.15% to 0.2% based on the class of steel strength. Hence, engineers had insufficient technical guidance during the construction of the South Road viaduct considering today’s requirements for quality control and management.
Furthermore, the demands employed by the former NB6 anticipated a moving load type called “TB36” (vehicle weight of 360 KN), divided among 3-wheel axes (6 m x 3 m). Moving loads would be increased by approximately 1.25 to account for the vertical impact. Additional traffic loads would be applied in the primary (5 KN/m2) and secondary (3 KN/m2) lanes. Nowadays, traffic demands have increased considerably compared to previous requirements from NB6: maximum vehicle loads are determined by the TB450 (450 KN vehicle weight), lane traffic loads about 5 KN/m2, additional weight of asphalt for repairments (2KN/m2), and two extra coefficients to increase vertical load impacts (number of lane coefficient – CNF – and additional coefficient of impact – CIA) [6]. Accordingly, estimates of new load demands can increase up to 22.5% compared to older requirements.
3.5. Demands and Theoretical Strengths
To determine the section’s resistances, the authors used the recommendations of the Brazilian standard (NBR 6118:2025) [8], whose formulations are similar to those of the Eurocode 2 [17] for flexural design. In terms of shear design, although there are some conceptual similarities, the NBR model is broader, allowing the designer to freely select the Model (I or II) and the inclination of the compressive strut. The shear models in the Brazilian code essentially deviate in the consideration of shear absorbed by the concrete mechanism, which the designer arbitrarily selects. Eurocode 2 tends to be slightly more conservative than NBR 6118.
Since the critical section is under reinforced through its depth (only the cross-beam has stirrups and longitudinal reinforcements altogether), the definition of effective depth might be debatable. Also, size effects play an important role in reducing the shear strength of RC elements without transversal reinforcements [18]. These might invalidate the truss analogy formulation used for determining shear strength for the whole section, thus, only the cross-beam section should be considered in the capacity analysis. For this reason, employing numerical simulation is strongly recommended for this assessment.
The authors have estimated unfactored bending moments (M) and shear forces (V) at the critical section, considering dead loads from the section’s elements and the live load from the standard weight vehicle (TB36 tf). The most unfavorable position of the vehicle was on the edge of the cross beam, where traffic loads per lane matched this arrangement. Alleviating prestressing forces were also estimated based on the information collected. A summary of these loads is indicated in Table 1:
As shown in Table 1, the total bending moment demand over the critical section is 10.37 MNm, while the total shear demand is 2.89 MN (this value is indicated in Figure 17, red dashed line). For the critical section shown in Figure 4b, the resisting bending moment (considering sections equilibrium) is 12.35 MNm, corresponding to a capacity demand of 84%. The flexural strength of the section was determined using nominal strengths (no reduction factors applied to the material strength), for a total of 16 cables. Had there been 13 cables (assuming 3 cables had been lost due to stress-corrosion – a 19% steel reduction), the nominal flexural strength would be 10.29 MNm, representing over 100% of the capacity. On the contrary, if contemporary vehicle loads had been assumed (for example, the use of T450 in the calculation), flexural demands could have increased to 12.09 MNm, not exceeding but reaching almost the available capacity of the member. This exercise suggests that if very few cables had had problems, or if load demands had been higher than previously estimated, the flexural capacity of the column-wall extension could have been critically jeopardized.
In terms of shear strength, the determination of the section shear capacity can be complicated, since stirrups did not involve the whole critical section depth. As indicated in Figure 4b, transverse reinforcements are present only in the prestressing cross-beam, which has an effective depth of 37cm. If the entire cross-section is considered, the effective depth is 193 cm, which is much larger than the first one. This, however, should be carefully thought out, since the lack of transversal reinforcements could violate the hypothesis of the generalized truss, or jeopardize the strut anchorage and the tie action within the section. Perhaps a more sophisticated method of calculation could be employed, such as the strut-and-tie method for assessing strength. Either way, the authors determined the shear strength for both effective depths, using models I and II with varying strut inclination. The results are presented in Table 2 and Table 3.
Where Vsd is the shear demand (unfactored), VRd2 is the strength of the concrete compressive strut, Vc is the concrete (and mechanisms) shear strength, Vsw is the shear strength of stirrups, VRd3 = Vc + Vsw is the total section shear strength.
As can be seen, the shear capacity of the critical section, with an effective depth of 37 cm, is insufficient to meet the load demand, as the capacity index (VSd/VRd3) exceeds 100%. This happened for all models of shear and strut inclination, exceeding on average 210% of the theoretical shear capacity. Yet, when the section’s effective depth is 193 cm (even though truss formulation might be invalid), the shear capacity is adequate, independent of the Model, strut inclination, and alleviating effects of prestressing forces. Average shear capacity, in this scenario, is about 33.6%. Possibly, the effective shear strength of the viaduct falls somewhere in between, or even closer to cross-beam (deff=37cm) strength – as presented in section 3.6.3 in Figure 17. If the shear demand is determined based on the resisting moment strength MRd, the shear demand to reach full theoretical beam strength is 3333.3 kN (this value is also indicated in Figure 17, purple dashed line). This is better addressed in later parts of this work.
Regarding section stresses – a required step in the determination of the performance of prestressed concrete elements – the critical section was evaluated under three load combinations commonly employed by the Brazilian code. Service load combinations included the quasi-permanent combination (CQPerm), the frequent combination (CFreq), and the rare combination (CRare). Their quantification accounted for the influence of prestressing forces, assuming 30% of total losses based on the prestressing system and material characterization. Stresses were determined for the real section, which contained 16 cables, and for a section considering 13 cables (for comparison). Results are indicated in Table 4:
Table 4 indicates that the critical section was operating under tension for service load combinations, suggesting that the prestressing system was partial. According to the Brazilian standard NBR 6118, the concrete stress limit was determined for tension (3.94 MPa) and compression (-26.31 MPa) under service conditions. In conclusion, even though stresses were below the concrete tension limit considering 16 cables, the column-wall extension was prone to developing tension cracks at the critical section. Had the effective number of cables been reduced (for 13, for example), concrete tension limits would have been exceeded, and cracks could have developed.
Finally, the authors have also quantified the dowel strength of the passive reinforcing steel, based on the Rasmussen BH model [19]. This Model was experimentally validated and quantifies the individual shear strengths of rebars and bolts. The dowel action, considering all the passive longitudinal steel in the critical section, was estimated to be 954.7 KN by this model, carrying less than 35% of the estimated shear demand. In other words, had a shear hinge been developed within the critical section after the initiation of a plane of failure, the dowel action would have been insufficient in preventing partial collapse. Evidence of this hypothesis is indicated in Figure 11 by the peeling off of the inclined column bars.
3.6. Numerical Evaluation
3.6.1. Boundary Conditions and Materials
Due to the limitations of manual calculations for the complex structure shape, specifically in determining the effective depth and stresses in the column extension, numerical simulations were performed. For this purpose, an ABAQUS/CAE model was developed to assess structural response and failure mechanisms.
For simplicity, half of the column wall was modeled (across its symmetry axis) using 3D solid elements for concrete (column core and cross-beam extension) and wire (truss) elements for reinforcing bars (both for passive steel and prestressing strands). Units employed were N and mm. A view of the Model and its reinforcements is indicated in Figure 12a and Figure 12b, respectively.
The column wall was supported by an analytical base (rigid element) tied to a reaction node to simulate a fixed support condition. In addition, the boundary condition at the end-surface prevented sidesway (in simulating the other column half) by imposing a zero horizontal displacement – a standard procedure to improve numerical simulation efficiency. 3D concrete finite elements were modeled using 8-node linear elements with reduced integration and hourglass control, while steel bars and wires were modeled using 2-node linear 3D trusses. Steel was perfectly embedded in concrete – an interacting property commonly employed in ABAQUS, which prevents bond-slip of rebars. Since the sections were large (over 12 meters in length), the finite element mesh employed was 25 x 25 cm, as shown in Figure 13a.
Self-weight loads were automatically calculated by the software based on section geometries and material densities. At the same time, prestressing forces were induced by predefined fields, and service loads were imposed as surface pressures over the cross-beam. Figure 13b shows the level of stress in the critical section under operational loads, which are fairly similar to those manually calculated and displayed in Table 4.
Concrete material was modeled according to the ABAQUS built-in concrete damage plasticity model (CDP), which considers two primary failure mechanisms (tensile cracking and compressive crushing). This Model allows users to quantify concrete damage using a damage index determined from concrete stress-strain curves. The compressive concrete curve was based on the Mander et al. [20] Model, which disregarded the effect of uniaxial confinement provided by transversal reinforcements. The concrete compressive strength from pillar P7 (from core samples) was adopted (43.8 Mpa). On the other hand, the tensile concrete curve was based on the Cornelissen-Hordijk-Reinhardt tension-softening curve [21]. These selected concrete models usually converge efficiently with the ABAQUS CDP model. Generally, for steel mechanical representation, reinforcements followed a bilinear stress-strain curve with strain hardening for both passive and active steel. This model accurately characterizes the mechanical behavior of steel under monotonic loading. Figure 14 indicates the curves of stress-strain for steel and for concrete (under compression and tension) employed as inputs within ABAQUS interface.
3.6.2. Post-Processing
The processing of boundary conditions consisted of two phases. The first phase induced the prestressing forces in the column-wall simultaneously to service loads (under normal-day operation). Once convergence was reached, the second phase was initiated by increasing the surface pressure until failure. Two models were processed: one in which 100% of the prestressing forces were induced by the predefined field, and another without prestressing forces induced by the predefined field. In other words, one Model simulated the effects of prestresses and the other did not. Since both models exhibited similar mechanical failure modes, contrasting only in ultimate strength and ductility capacities, only the results of the Model without prestressing forces are offered. The capacity curves of these models are indicated at the end of this section.
The first observation made when assessing the stress gradient across the column-wall element is that the stress path was transmitted through a tied-arch mechanism rather than a beam effect, as shown in Figure 15a. In this situation, strain distributions might be highly nonlinear, and the section may not remain plane – meaning that classical linear elastic bending theory could be invalid. In the same Figure, it is possible to observe that the stresses at the top chord of the cross-beam exceeded the design tensile strength of the concrete. Another point observed was the installation of permanent plastic strain within the critical section (starting at the top cross-beam chord and propagating towards the bottom chord) once the tensile strength thresholds were overcome (seen in Figure 15b).
Since the concrete at the critical section cracked, large quantities of unbalanced stresses were transferred to the steel through the embedded property. This activates ductile response in the section by inducing strain in the steel rebars. If sufficient intrinsic ductility capacity is available, large-section cracking and deformation are expected. This ductility capacity is mostly related to the amount and quality of reinforcing within the critical section. Accordingly, the model could reach the yielding limit, even strain-hardening, for both the prestressing strand and the passive steel, as shown in Figure 16a. This occurred simultaneously with large cracking within the critical section, as indicated in Figure 16b. After that, a plastic hinge was installed at the top chord of the cross-beam, which was almost entirely propagated through the depth of the column wall extension.
The preceding figures suggest that the modeling technique employed could fairly capture the failure modes observed, summarized as: the failure initiated during bending, with crack propagation throughout the entire depth of the column wall extension. This is followed by the yielding of the flexural reinforcement and installation of a plastic hinge in the cross beam. Once this mechanism was installed, large cracking and deformation would have been expected.
3.6.3. Numerical Strength
The ductility capacity and strength of the column-wall extension were measured in terms of the vertical deformation of the cross-beam tip-end, and the corresponding shear load, obtained from the numerical model outputs. Shear loads were calculated from the column-wall reaction force, and the results are indicated in Figure 17 for both models with and without prestressing forces. Also, it is possible to compare the results with the estimated shear demand (manually calculated) and the shear demand to reach the full theoretical flexural capacity of the section (beam theoretical flexural strength). This estimation is based on the overall structure dead load and traffic vehicle loads (discussed in Section 3.4), excluding the column self-weight beyond the critical section.
Figure 17 suggests that the numerical model was able to withstand the prescribed load demand recommended by the former Brazilian code, for both models with and without prestressing. In both cases, yielding is initiated after the beam end deflection exceeds 25 mm, with the Model without prestressing exhibiting lesser strength during post-elastic regime. In addition, prestressing forces induced an upward beam deflection (negative, since the positive reference is downward), which is eventually counteracted by the increasing surface pressure over the cross-beam. The prestressing model showed higher capacity and similar ductility, as both strengths increased due to steel strain-hardening property.
This assessment indicates that the structural design might have been adequate for the load demand during the construction period, and even for modern demands. However, since the viaduct collapsed suddenly (brittle failure), this implies that the structure may have lost part of its ductility capacity over time, as evidence observed in Section 3.2. When the dashed lines meet the solid capacity curve lines, failure could have happened at small deformation demand (under 25 mm), indicating little available ductility. This theorizes that material degradation coupled with a loss of ductility (due to reduction in steel areas and stress-corrosion) might have triggered the collapse mechanism rather than an excess of load or poor engineering judgment.
3.6.4. Through Comments on Modeling
It is important to note that the numerical model had ideal assumptions that could portray higher strength and ductility than the actual prestress column-wall extension could have exhibited. The assumption that there is a perfect bond between steel and concrete may not be true, as the asset was built with smooth reinforcing steel. The use of these rebars tends to alter the mechanical behavior of concrete sections due to bond-slip, intensifying inelastic response. Older structures built with smooth bars tend to develop higher chord rotations at member ends, reduced energy dissipation, and concentrate damage (usually single large cracks) in plastic hinges rather than well-distributed, densely-spaced thin cracks [22]. This can alter the strength, deformation capacity, and failure mechanisms of RC elements, particularly for specimens subjected to cyclic loads [23]. Since site investigations portrayed a large individual crack (as per Figure 9a) rather than well-distributed crack, this evidence supports the previous comments.
Another possible increase in apparent ductility might be related to the rocking mechanism associated with unbounded reinforcements: the opening of large cracks due to bond slip and concrete softening at the member-end reaction can increase deformation capacity [24]. This can be seen by the large crack developed in the critical section, and the concentrated compressive stress in the bottom chord (see Figure 15 a). This phenomenon prevents the formation of a complete flexural behavior of the element made with smooth bars compared to members with deformed bars [25]. In other words, RC members with these characteristics might fail before developing full flexural strength.
In addition, the model adopted in manual calculations was based on beam flexural theory, which might deviate from the actual structural behavior of the viaduct, characterized by large-volume sections. This, in addition to differences in actual prestress loss, could lead to variations in the structural response during capacity estimation. Nonetheless, the meticulous numerical representation of the asset remains secondary in this manuscript, since validation is not possible. The main idea behind its numerical calculation was to determine the level of understanding of the structure’s response based on the original design.
Lastly, the type of technology available at the time (such as the use of smooth reinforcing, low concrete compressive strength, small amounts of longitudinal and transversal reinforcements, normal relaxation strands, and increased cyclic demands) could have impacted the long-term response. These points are discussed in detail in the next section.
4. Failure Diagnostics
4.1. Structural Concrete Shear and Flexural (Failure) Theory
The ultimate shear-carrying capacity of slender, prismatic reinforced concrete (RC) members is fundamentally governed by an interactive combination of concrete and steel shear-transfer mechanisms. This multi-component system comprises the intrinsic shear strength of the uncracked cementitious matrix, aggregate interlock along crack planes, the dowel action of longitudinal reinforcement, and the tensile resistance of transverse reinforcements. The allocation of the total shear demand among these discrete mechanisms is highly dependent on the evolving strain field and localized structural kinematics. For instance, during the propagation of diagonal tension cracks (a result of combined flexural and shear stresses), crack width opening induces interface sliding and separation, thereby degrading the frictional efficiency of the aggregate interlock action. Conversely, the introduction of prestressing forces establishes a compressive state that confines these shearing interfaces, significantly amplifying their effective shear-transfer resistance. Under conditions of net axial tension or cyclic loading, the contact zones undergo severe mechanical friction, reducing the interface’s internal frictional resistance due to wear.
In conventionally reinforced concrete members, escalating shear deformations prompt a critical redistribution of internal forces. As the aggregate interlock mechanism undergoes kinematic degradation, the unsustained shear demand is transferred to the remaining active components: the dowel action of the longitudinal reinforcement, the intrinsic shear capacity of the concrete compressive zone, and the tensile resistance of the stirrups. Under monotonic increasing loads, the ultimate limit state is typically reached when the transverse reinforcements yield, triggering a cascade failure wherein the remaining shear-transfer mechanisms are exhausted quasi-simultaneously. Quantitatively, the magnitudes of the dowel, stirrup, and concrete shear components are explicitly coupled to the geometric reinforcement ratios and the constitutive material strengths of both phases. Crucially, longitudinal reinforcement provides an essential layer of structural redundancy beyond its pre-peak shear contribution. Following localized concrete macro-fracturing, the dowel action transitions into a critical suspension mechanism, mitigating sudden progressive collapse by physically anchoring the detached structural segments (a structural redundancy principle).
Under cyclic loading, the efficiency of individual shear-resisting components is severely compromised by the evolution of continuum damage. This degradation is characterized by widespread micro-cracking within the concrete matrix and plastic strain accumulation for the steel, which collectively diminish individual material resistances.
Additionally, in stirrup-deficient elements subjected to high shear demands, the structural response differs drastically from that of standard RC elements. Here, the failure morphology is explicitly coupled to the elastic stability of the dowel action. Once the longitudinal reinforcement transitions into the post-yield regime, the structural system lacks alternative internal load paths, thereby transferring the entire strain demand to the concrete. This provokes a high concentration of stress, reflected in a brittle mechanism that fails suddenly. Furthermore, elements lacking transverse steel are highly vulnerable to size effects; as structural dimensions increase, localized stress concentrations intensify, leading to a marked reduction in apparent shear strength. Conversely, the introduction of transverse reinforcement provides a critical crack-bridging mechanism that neutralizes this size-dependent degradation [18].
For flexural failures, on the other hand, when RC systems have sufficient ductility capacity, ultimate limit states tend to be reached with considerable warning, typically represented by large deformations coupled with widespread cracking. The flexural capacity of prismatic RC members presumes equal strain deformations of concrete and steel (or perfect bond), as this last element commences to deform once concrete cracks. This way, the force equilibrium of the section is determined considering that both elements reach their design strength simultaneously. When the bond between steel and concrete depreciates (due to excessive cracking or cyclic loading), there is an inequality of force participation in achieving section equilibrium, so concrete (compressive block) needs to develop higher forces to maintain balance. Depending on the strain stage of concrete and the position of the section neutral line, this is not possible, culminating in crushing failure of the concrete, which can occur even before steel reaches the post-yielding state [26].
Lastly, for prestressed concrete prismatic elements, steel actively increases both flexural and shear resistance of members by inducing a deliberate state of compression. However, the prestressing steel becomes severely sensitive to corrosion under constant pre-elongation (stress-corrosion). For stress values exceeding 50% of the steel’s strength, stress-corrosion drastically degrades the ductility of the element (embrittlement), and failure is typically brittle, often associated with little or no loss of metal (possibly without structural warning). For post-tensioning bound tendons, the most critical factors are the type and quality of the grout and the grouting operations. In structures where poor practice reveals voids in the encapsulation of wires within strands, the bundling of wires resulted in sudden fracture after stress-corrosion. Projects where there is a good quality of isolation, adequate materials and techniques, they have been observed to be trouble-free [27]. On the other hand, if stress-corrosion activates failure of prestressing strands in large concrete structures, severe failure can materialize due to large unbalanced forces, even under service loads.
4.2. The Failure of the Viaduct Explained
Forensic analysis indicates that the partial collapse originated from the tension-assisted corrosion of the prestressing strands within the support cross-beams at the pier caps. The structural morphology of the key-closure encasement over the cross-beam served to cover this localized deterioration, obstructing direct visual diagnostic pathways to this fracture-critical component. The evidence of poor wire isolation within the metal tubes suggests poor grout injection during construction (as shown in Figure 10). Also, environmental degradation was accelerated by chronic moisture infiltration through road deck cracks, unforeseen cyclic loading, and inadequate maintenance throughout the bridge lifecycle. These variables degraded the prestressing wires, which were essential components of the load-balancing systems, since the extension cross-beam was operating as a cantilever. This hypothesis is supported by evidence from manual determination of strengths and demands and by numerical modeling. Structural analysis indicated that the viaduct design had sufficient strength and ductility, despite the low steel reinforcement ratios. Thus, most likely, the materials lost ductility over time, which made it possible to install a critical plastic hinge within the prestressing cross-beam.
After the triggering of the flexural mechanism, the system was incapable of developing alternative loading paths due to limited passive reinforcement (lack of structural redundancy). Had the structural redundancy been active, supplementary passive steel would have provided post-peak load paths via dowel action, successfully preventing catastrophic collapse after matrix fracture. This fact was observed on site during the debris investigation (Figure 11b) and was confirmed by manual calculations of the dowel action strength in section 3.5. Once the plastic hinge was installed, the section failed under sudden shear, being incapable of carrying the unbalanced loads of the system.
These intrinsic detailing flaws constitute latent design vulnerabilities that went undetected by municipal asset managers – a liability hidden by the absence of historical design documentation, advanced structural aging, and the outdated code for the period of construction.
Post-failure forensic investigation enabled precise mapping of the rupture plane and detailed configuration of the steel within the column-wall cross-beam extension, as depicted in Figure 3. In summary, the viaduct failure was the mechanical realization of long-term systematic vulnerabilities, which can be synthesized into the conjunction of six core problems:
- Attenuation of Prestressing Forces via Steel Stress-Corrosion: The structural capacity of the critical section was seriously depreciated by the mechanical degradation of the high-strength strands via tension-assisted corrosion. Moisture infiltration through road surface fissures, combined with substantially porous or un-grouted ducts, initiated localized steel pitting culminating in ductility loss. This directly reduced the prestressing forces balancing the cantilever column-wall extension, provoking an immediate deficit in flexural and shear resistance, and ductility capability;
- Deficient Structural Redundancy and Scale-Dependent Shear Resistance: The lack of structural redundancy prevented the section from developing alternative paths of load balancing, specifically due to little passive longitudinal steel within the upper tension chord of the cross-beam and in the column-wall. This omission eliminated the redundant dowel action needed to prevent progressive collapse. Furthermore, the lack of transverse reinforcement hoops within the critical cross-section overall depth of the column-wall prevented localized crack confinement, mobilizing size-effects that undoubtedly compromised the element shear resistance;
- Geometric and Archive-Induced Epistemic Obscurity: Critical engineering diagnostic pathways were seriously obstructed by architectural and infrastructural configurations. The integration of structural infills, drainage conduits from adjacent commercial facilities, and non-removable cast-in-place concrete joints physically sealed the core post-tensioning elements away from non-destructive visual evaluation. This lack of physical accessibility, exacerbated by the total loss of original engineering drawings and historical archives, precluded proper forensic monitoring of active crack propagation and internal leaching;
- Sub-Optimal Constitutive Material Performance: The older materials exhibited low performance, significantly deviating from contemporary structural standards. The use of smooth, non-deformed passive reinforcing bars severely penalized bond-slip performance. In contrast, the use of rounded alluvial river gravel—rather than angular crushed aggregates like granite or limestone—compromised the element internal frictional matrix. Under modern, unforeseen heavy vehicle load spectra, this aggregate selection could have severely limited aggregate interlock efficiency and overall shear capacity.
- Unpredicted Historical Amplification of Cyclic Fatigue: The viaduct underwent extensive cyclic loading that extrapolated far beyond the design life envelopes expected during the construction period in Brasilia. This exceeded the legacy analytical frameworks and structural code requirements of the viaduct’s construction era. Estimates of modern design loads could have been 122.5% higher than original demands, impairing the structure’s integrity and load-carrying capacity over time. Since no retrofitting or strengthening records were conducted in the viaduct before 2018, this asset could have been operating under higher load demands than originally anticipated; thus, becoming prone to cyclic fatigue;
- Long-term rheological phenomena: While time-dependent variables (steel stress relaxation and the viscoelastic creep of the concrete matrix) were omitted from the primary forensic assessment, their evolutionary contributions undoubtedly influenced the material performance over the asset’s lifespan. However, their role in time-dependent material decays within the global failure envelope remains secondary, since accurate estimations of their effects are challenging to account. However, their impact on structural capacity was possibly far less critical than the compounding effects of cyclic deterioration and the intrinsic shear detailing deficiencies.
5. Viaduct Strengthening and Retrofitting
Following the emergency stabilization of the viaduct (with shoring and continuous monitoring), long-term structural recovery techniques, such as structural strengthening and repairs, were implemented. They focused on replacing failed components and enhancing the remaining structure to provide adequate performance. The overall detailing can be seen in Figure 18 as follows.
For the column-wall delta-wing cantilever extensions, the prestressed cross-beam was removed and reconstructed to meet current code requirements. The new cross-beams featured sufficient prestressing and non-prestressing steel, as well as modern bearing pads, to support the road deck. Where the partial collapse occurred, the full deck segment was demolished, and a new deck (with similar engineering characteristics, made of prestressed beams and concrete slab) was designed under the elastic regime and built. This new design considered modern load demands, previously mentioned in this manuscript.
The solution employed consisted in demolishing the extensions of the column walls, and replacing it by a new column wall section that would encapsulate the former concrete wall. This section enhancement was made by concrete jacketing with prestressing ties to increase its load-bearing capacity greatly. The column overall width increased from 200 cm to 320 cm, and contemplated large quantities of passive reinforcing steel, compared to the original design. The corroded column rebars were treated and protected with the new layer of confined reinforcing concrete. Also, beneath the new extension walls, massive foundation blocks (500x180x300cm) over 15 piles were implemented. Likewise, to create an adequate bond surface between the old and new concrete, reinforcing ties were uniformly distributed around the old column perimeters and attached to it using chemical adhesives.
To prevent the chronic water infiltration that caused the original corrosion, the gap between slabs above the column walls at the cross-beam interface was sealed with pre-molded concrete pieces, as structural joints, which would permit access for maintenance. This was a key repair requirement that enabled direct visual inspection of the bearing pads and support elements at a reasonable cost, a feature missing in the original 1960 design. The final goal of these combined techniques was to ensure a residual service life of at least 100 years for the recovered structure. The final view of the asset post-recovery is indicated in Figure 19. Further in-depth information on the retrofitting implementation, details and process can be found in [10].
6. Lessons from the Rubble
The political challenge of building Brasília within a compressed four-year timeline significantly accelerated infrastructure development, radically testing the engineering community during a period marked by scarce regulatory and material resources. Consequently, the pioneering deployment of post-tensioned bridge systems, coupled with highly volatile long-term traffic forecasting, introduced hidden vulnerabilities across analogous structures in the city—as this work thoroughly demonstrated through the forensic autopsy of the Road Axis Viaduct collapse.
This investigation isolated six interconnected vectors governing the macro-failure of the viaduct: material degradation compounded over time (chronic water infiltration, poor construction execution and materials rheological decline); deficient structural redundancy (not required by outdated codes); architectural and structural configurations that precluded routine maintenance and early damage detection; sub-optimal material properties and poor execution protocols (alluvial concrete aggregates, smooth reinforcing bars, and extensive un-grouted post-tensioning voids); and unpredicted, high-amplitude cyclic load spectra that vastly outperformed possible projections.
Similar to the shear failure of the Wilkins Air Force Depot in Ohio (in 1955), assigning a singular causative agent proves analytically insufficient to explain the ultimate limit state of the Road Axis Viaduct in Brasilia in 2018. While catastrophic, this partial collapse provides a reliable diagnostic representation of how aging, non-conforming engineering heritage assets perform under modern structural demands, establishing a vital reference point for infrastructure engineering design and management.
Author Contributions
Conceptualization, Y.BC.; methodology, Y.BC. and C.F.; software, Y.BC. and J.M.; formal analysis, Y.BC, J.M. and H.V.; investigation, Y.BC. and C.F; resources, C.F.; data acquisition, C.F; writing—original draft preparation, Y.BC; writing—review and editing, Y.BC., J.M and H.V.; supervision, J.M; project administration, H.V. and J.M.; funding acquisition, H.V. All authors have read and agreed to the published version of the manuscript.
Funding
This work was financially supported by: UID/04708/2025 and https://doi.org/10.54499/UID/04708/2025, of the CONSTRUCT - Instituto de I&D em Estruturas e Construções - funded by Fundação para a Ciência e a Tecnologia I.P./ MECI, through the national funds. This work was also financially supported by national funds through the FCT/MCTES (PIDDAC), under the project 2022.05721.PTDC with DOI 10.54499/2022.05721.PTDC (https://doi.org/10.54499/2022.05721.PTDC).
Data Availability Statement
The public report from NOVACAP about the partial collapse (Relatório Técnico - Grupo De Trabalho Conforme Decreto N. 38.841 De 06.02.2018) is available upon request at the Building Department. The structural report from the University of Brasilia (Relatório Técnico – Dept. Enc/Unb 001. Brasília, 26.02.2018) is also available upon request at the Civil Engineering Department.
Acknowledgments
The authors would like to thank the Nova Companhia Urbanizadora da Nova Capital (NOVACAP) for interviews conducted, for the site explorations during the incident, and for any public document shared that were essential for the theoretical basis of this paper.
Conflicts of Interest
The authors declare no conflicts of interest. The funders had no role in the design of the study; in the collection, analyses, or interpretation of data; in the writing of the manuscript; or in the decision to publish the results.
Abbreviations
The following abbreviations are used in this manuscript:
| RC | Reinforced Concrete |
| ULS | Ultimate Limit State |
| ASD | Allowable Stress Design |
| NBR | Norma Brasileira (Brazilian Standard) |
References
- DER/DF. Volume Diário de Tráfego - Trechos Rodoviários. 2021. Available online: https://www.dados.df.gov.br/dataset/volume-diario-de-trafego-trechos-rodoviarios.
- Brasilia, A.d. GDF investe 160 milhões para reformar 40 viadutos e construir quatro novos. 2019. Available online: https://www.agenciabrasilia.df.gov.br/w/gdf-investe-r-160-milhoes-para-reformar-40-viadutos-e-construir-quatro.
- Anderson, B.G. Rigid frame failures. in Journal Proceedings, 1957. [Google Scholar]
- Elstner, R.C.; Hognestad, E. Laboratory investigation of rigid frame failure. in Journal Proceedings, 1957. [Google Scholar]
- Stamenkovic, H. Inflection points as statical supports are responsible for structural failure of AMC warehouse in Shelby, Ohio, 1955. Mater. Struct. 1977, 10, 375–384. [Google Scholar] [CrossRef]
- ABNT, NBR 7188; Carga móvel rodoviária e de pedestres em pontes, viadutos, passarelas e outras estruturas, in Rio de Janeiro. Associação Brasileira de Normas Técnicas, 2013.
- ABNT, NBR 7187; Projeto de pontes, viadutos e passarelas de concreto. Associação Brasileira de Normas Técnicas: Rio de Janeiro, 2021; p. 11.
- ABNT, NBR 6118; Projeto de estruturas de concreto-Procedimento. Associação Brasileira de Normas Técnicas: Rio de Janeiro, 2025.
- Dassault Systèmes Simulia, I., Abaqus/CAE, Version 2023. Dassault Systèmes Simulia, Inc, 2023.
- Galimi, S.; Pantoja, J.; Buzar, M.; Machado, P.R.S. Retrofit em obras tombadas de infraestrutura urbana: o caso do Viaduto sobre a Galeria dos Estados 2020, 140–156. [CrossRef]
- ABNT, NBR 7197; Projeto de estruturas de concreto protendido, Procedimento. Associação Brasileira de Normas Técnicas: Rio de Janeiro, 1987.
- ABNT, N.B. Cálculo e Execução de Obras de Concreto Armado; Associação Brasileira de Normas Técnicas: Rio de Janeiro, 1 1960. [Google Scholar]
- ABNT, N.B. Cálculo e Execução de Pontes de Concreto Armado; Associação Brasileira de Normas Técnicas: Rio de Janeiro, 2 1961. [Google Scholar]
- ABNT, NB-6/1960; Cargas Móveis em Pontes Rodoviárias. Associação Brasileira de Normas Técnicas: Rio de Janeiro, 1960.
- Langendonck, T.V. Cálculo de Concreto Armado - Vol I; Associação Brasileira de Cimento Portland: Rio de Janeiro, 1959. [Google Scholar]
- Langendonck, T.V. Cálculo de Concreto Armado - Vol II; Associação Brasileira de Cimento Portland: Rio de Janeiro, 1959. [Google Scholar]
- CEN, EN 1992-1-1:2023; Eurocode 2 - Design of concrete structures - Part 1-1: Genral rules and rules for buildings, bridges and civil engineering structures. European Committee for Standardization: Brussels, Belgium, 2023; p. 408.
- Wight, J.K.; MacGregor, J.G. Reinforced Concrete Mechanics & Design. 2012. [Google Scholar] [CrossRef]
- Rasmussen, B.H. The carrying capacity of tranceversely loaded bolts and dowels embedded in concrete. Bygings Statiske Meddelser 1963, 34(2). [Google Scholar]
- Mander, J.B.; Priestley, M.J.N.; Park, R. Theoretical Stress-Strain Model for Confined Concrete. J. Struct. Eng. 1988, 114, 1804–1826. [Google Scholar] [CrossRef]
- Cornelissen, H.A.; Hordijk, D.A.; Reinhardt, H.W. Experimental determination of crack softening characteristics of normalweight and lightweight concrete. Heron 1986, 31(2), 45–56. [Google Scholar]
- Verderame, G.M.; Fabbrocino, G.; Manfredi, G. Seismic response of r.c. columns with smooth reinforcement. Part I: Monotonic tests. Eng. Struct. 2008, 30, 2277–2288. [Google Scholar] [CrossRef]
- Opabola, E.A.; Elwood, K.J.; Oliver, S. Deformation capacity of reinforced concrete columns with smooth reinforcement. Bull. Earthq. Eng. 2018, 17, 2509–2532. [Google Scholar] [CrossRef]
- Paderno, A.; Pelucco, S.; Metelli, G.; Preti, M. Analytical and numerical modelling of existing RC frames with smooth rebars. Eng. Struct. 2021, 249. [Google Scholar] [CrossRef]
- Khanmohammadi, M.; Arabpanahan, M. Analyzing Seismic Response of Concrete Columns Reinforced by Plain Bars using Behavioral Mechanics. J. Earthq. Eng. 2017, 23, 1318–1345. [Google Scholar] [CrossRef]
- Paulay, T.; Park, R.; Preistley, M. Reinforced concrete beam-column joints under seismic actions. in Journal Proceedings, 1978. [Google Scholar]
- Schupack, M.; Suarez, M.G. Some Recent Corrosion Embrittlement Failures of Prestressing Systems in the United States. PCI J. 1982, 27, 38–55. [Google Scholar] [CrossRef]
Figure 1.
Section of the Viaduct at Galeria dos Estados after the partial collapse.
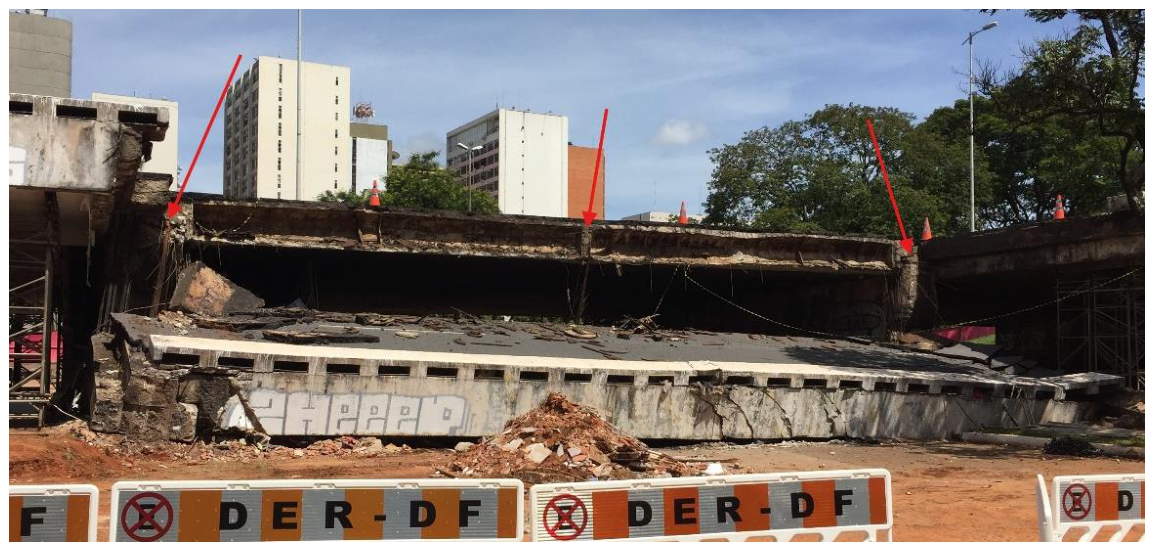
Figure 2.
3D view of the viaduct structural components.
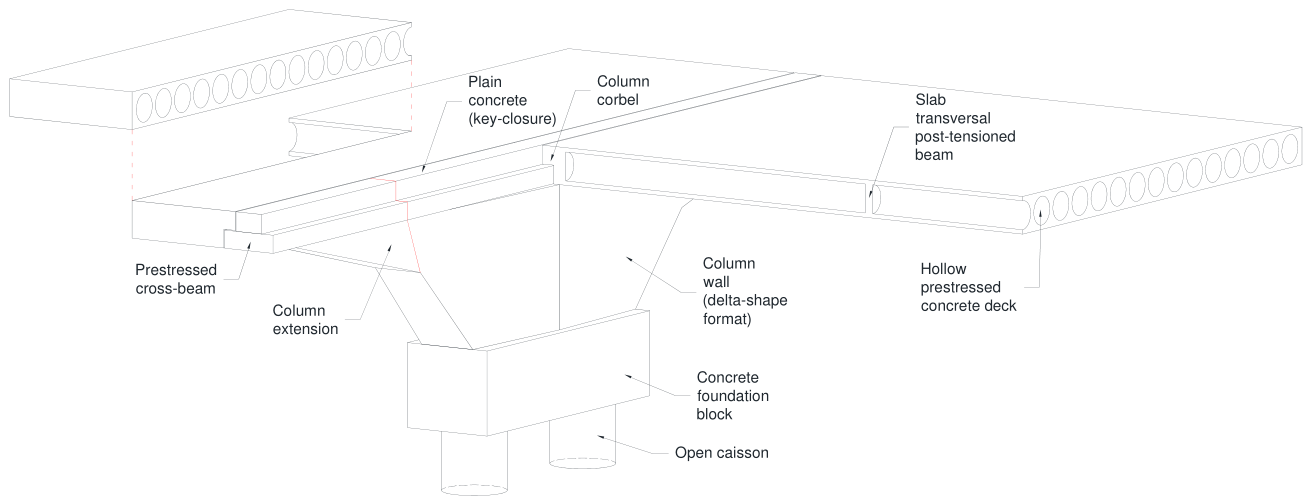
Figure 3.
Plan view of the column wall (at left with details retrieved from site investigation; at right indicating the hollow prestressed concrete deck), units in cm.
Figure 3.
Plan view of the column wall (at left with details retrieved from site investigation; at right indicating the hollow prestressed concrete deck), units in cm.
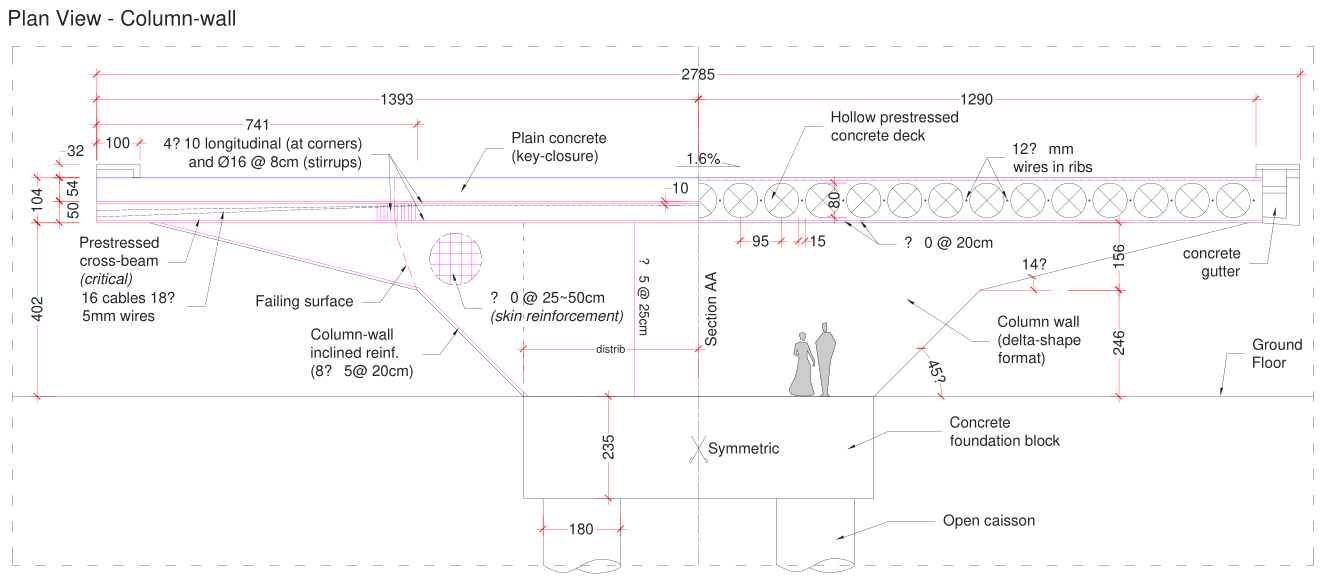
Figure 4.
Detailing retrieved from site investigations, units in cm (a) Section AA of the column wall, which supports the hollow deck; (b) Critical section for computing capacity of the element.
Figure 4.
Detailing retrieved from site investigations, units in cm (a) Section AA of the column wall, which supports the hollow deck; (b) Critical section for computing capacity of the element.
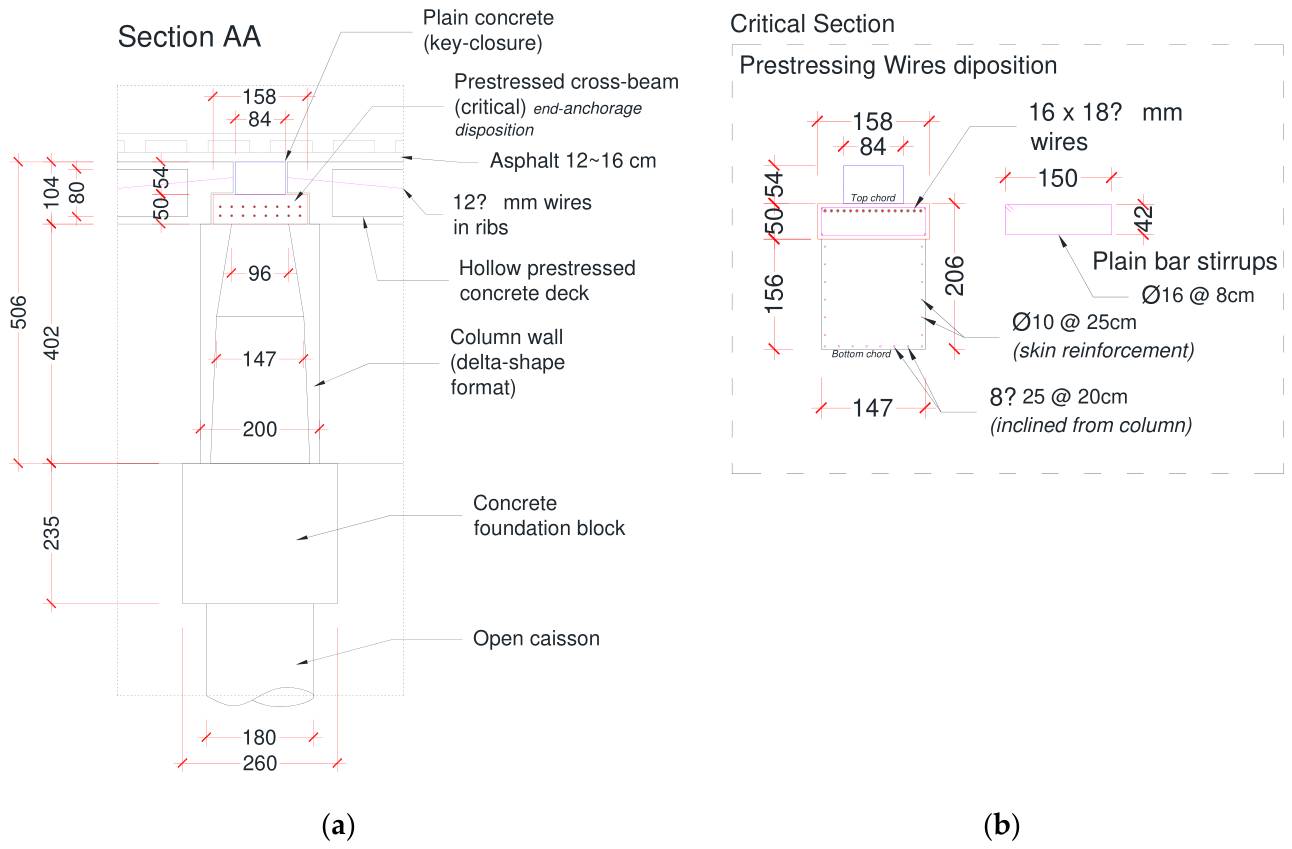
Figure 5.
(a) View of the deck section that collapsed; (b) Indication of the plan of failure of the column wall P7 at the beginning of the cantilever extension.
Figure 5.
(a) View of the deck section that collapsed; (b) Indication of the plan of failure of the column wall P7 at the beginning of the cantilever extension.
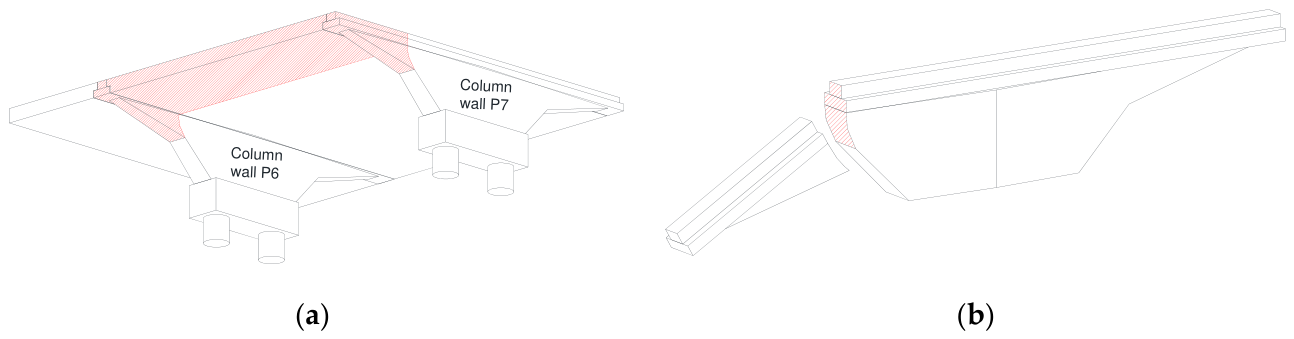
Figure 6.
Investigation of the debris (a) Closer view of the column-wall P7, indicating the smooth section, strands cut, and water infiltration; (b) Fallen column extension after collapse, indicating the small diameter smooth bars and the stirrups only at the top of the prestress cross-beam.
Figure 6.
Investigation of the debris (a) Closer view of the column-wall P7, indicating the smooth section, strands cut, and water infiltration; (b) Fallen column extension after collapse, indicating the small diameter smooth bars and the stirrups only at the top of the prestress cross-beam.
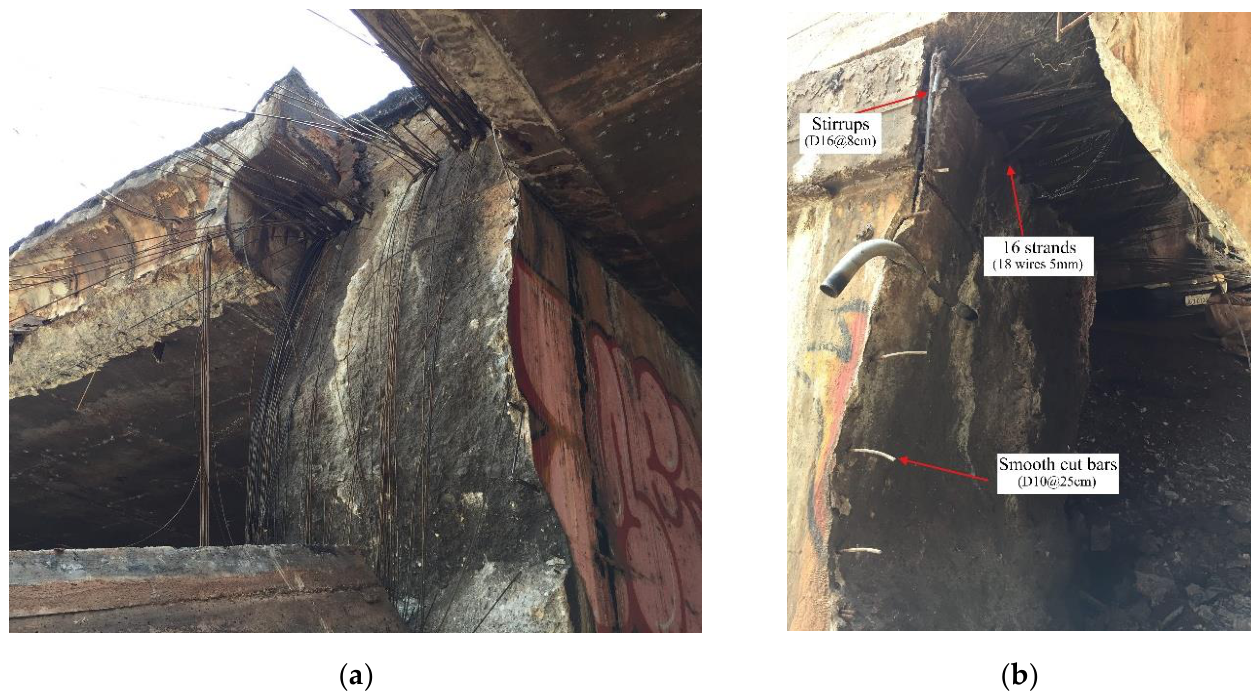
Figure 7.
Investigation of the debris (a) Column-wall P6 fracture; (b) Column-wall P7 fracture.
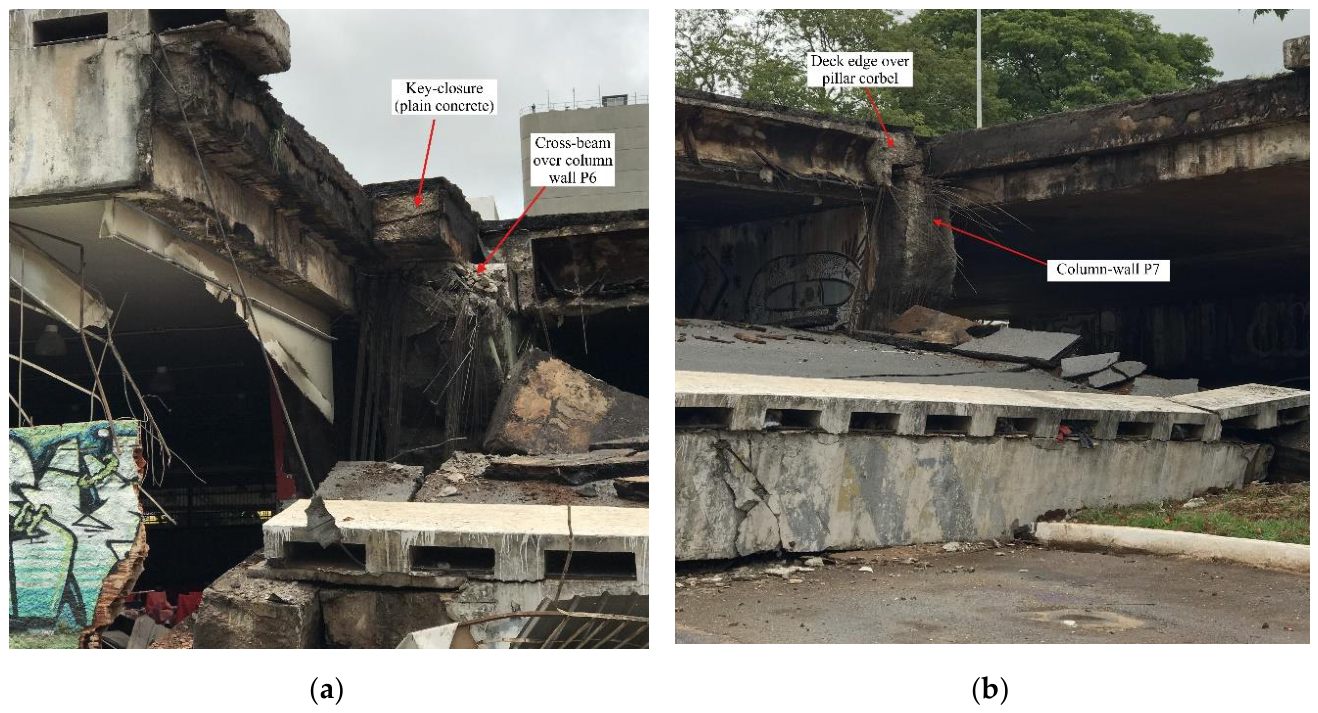
Figure 9.
Investigation of the debris (a) Column wall P7 (on the other edge that did not collapse), indicating the propagation of the inclined crack and water infiltration (which was common to all columns); (b) Underneath view of the prismatic key-closure element over the fallen column wall extension P6, where signs of chronic water infiltration were detected.
Figure 9.
Investigation of the debris (a) Column wall P7 (on the other edge that did not collapse), indicating the propagation of the inclined crack and water infiltration (which was common to all columns); (b) Underneath view of the prismatic key-closure element over the fallen column wall extension P6, where signs of chronic water infiltration were detected.
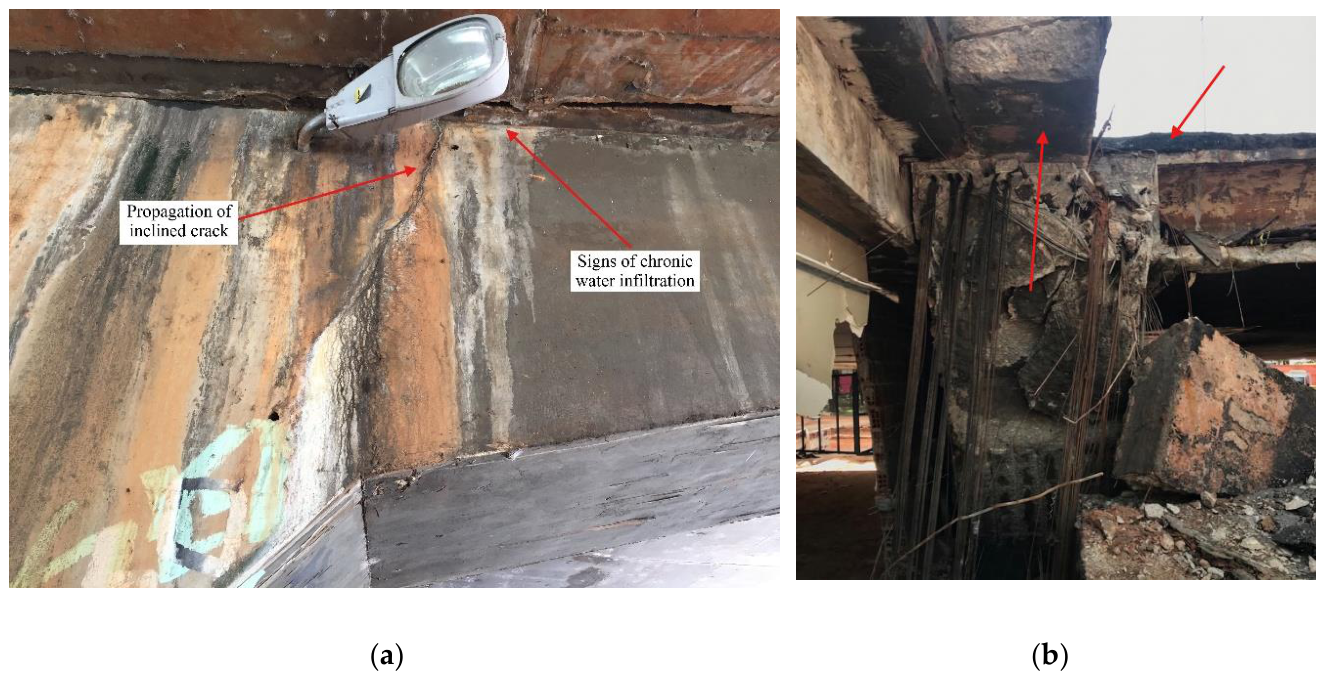
Figure 10.
Investigation of the debris (a) Concrete made with rounded river gravel aggregate and a lack of grout in strands; (b) Lack of grout mortar within the prestressing strands, and stress-corroded steel wires.
Figure 10.
Investigation of the debris (a) Concrete made with rounded river gravel aggregate and a lack of grout in strands; (b) Lack of grout mortar within the prestressing strands, and stress-corroded steel wires.
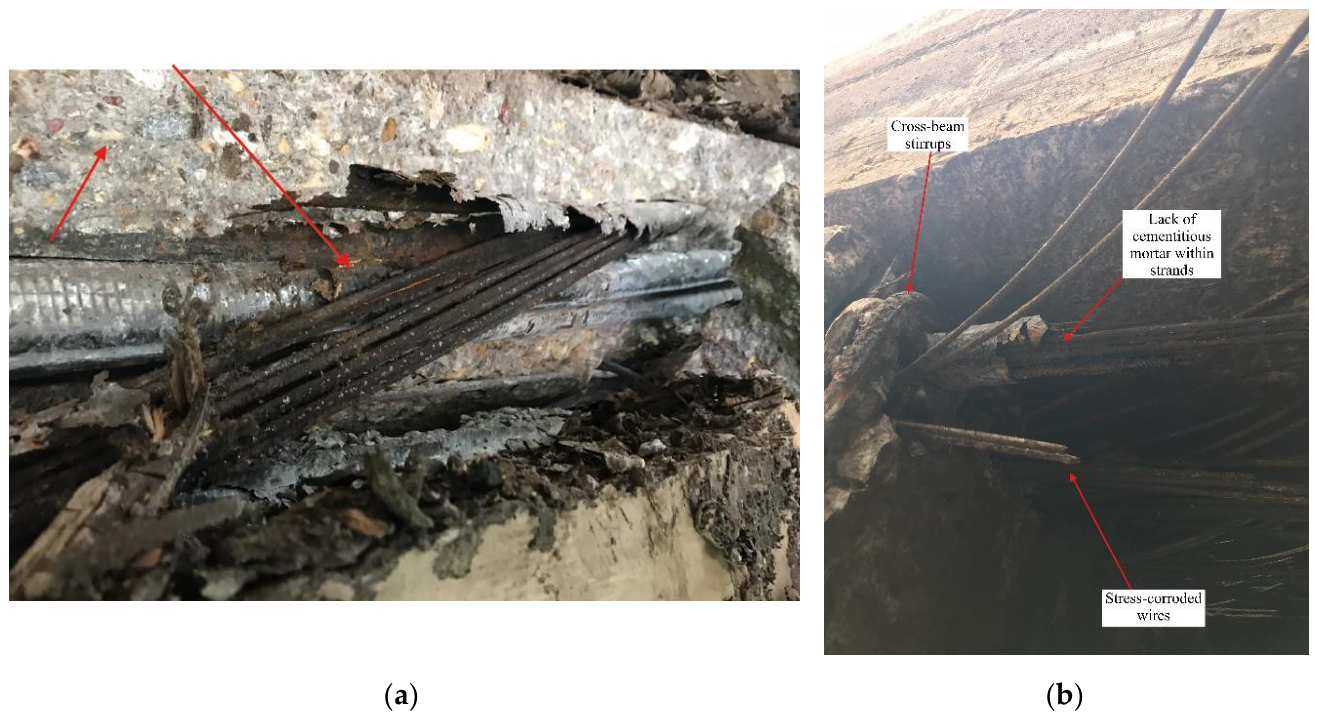
Figure 11.
Investigation of the debris (a) Severe corrosion evidence at column rebars near the ground floor; (b) Fallen section, indicating cut rebars and inclined column bars that have been peeled off.
Figure 11.
Investigation of the debris (a) Severe corrosion evidence at column rebars near the ground floor; (b) Fallen section, indicating cut rebars and inclined column bars that have been peeled off.
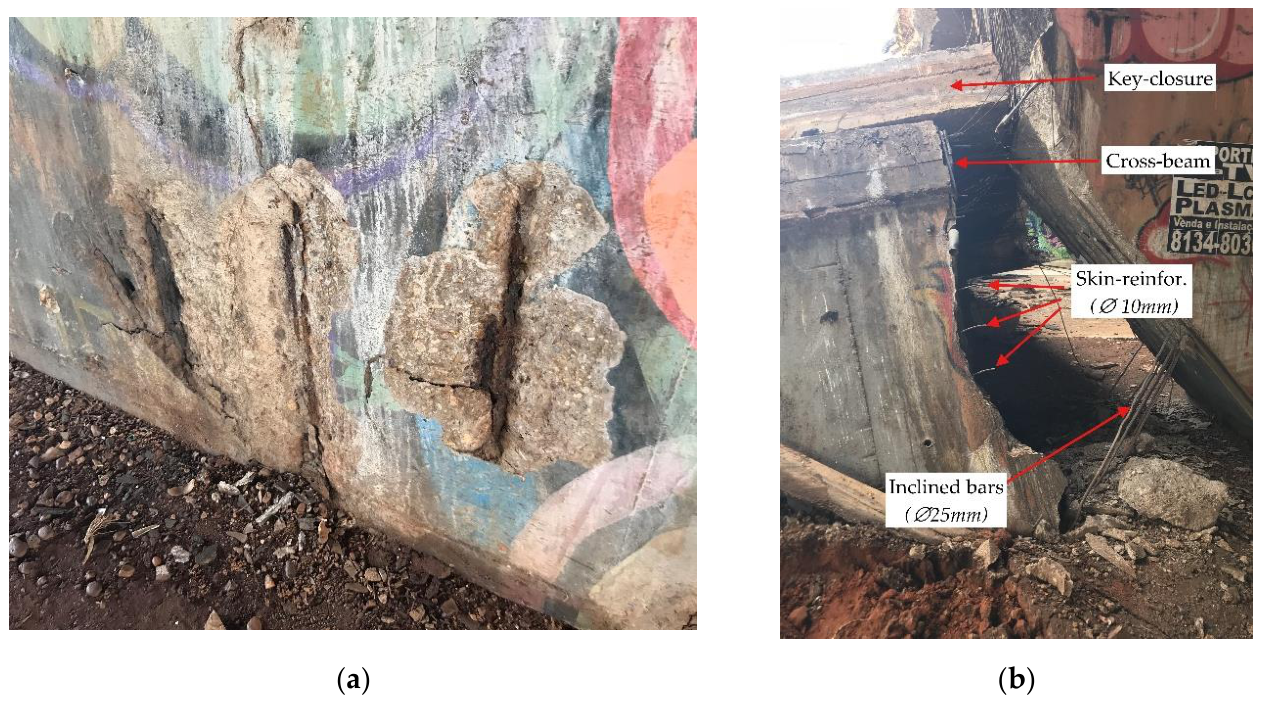
Figure 12.
ABAQUS model of half of a column-wall (a) Geometry and boundary conditions; (b) Steel cage arrangement.
Figure 12.
ABAQUS model of half of a column-wall (a) Geometry and boundary conditions; (b) Steel cage arrangement.
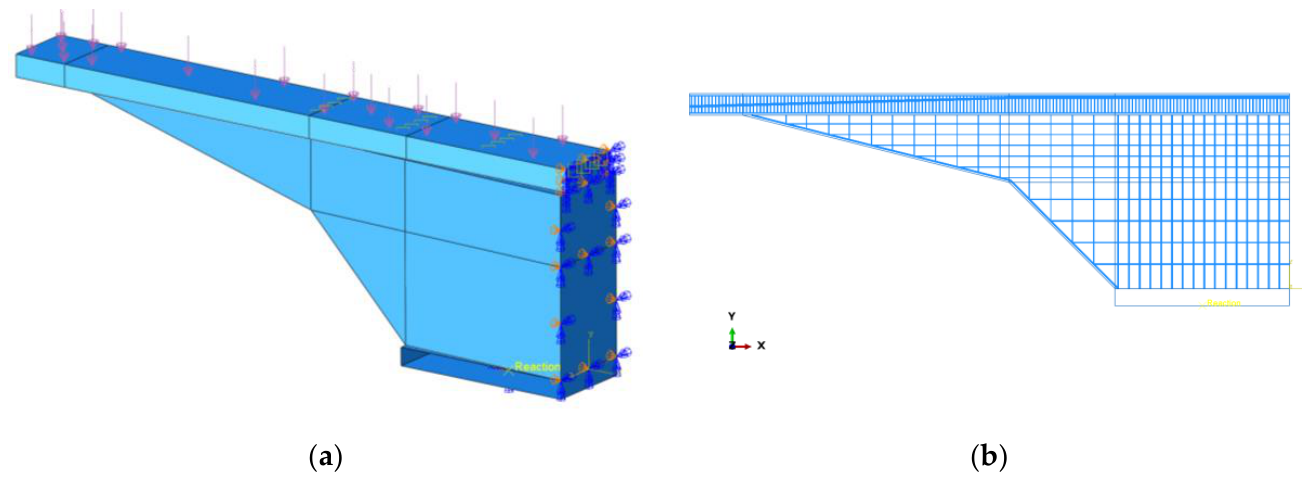
Figure 13.
(a) Finite element mesh arrangement; (b) Level of stress for estimated service demands, indicating that top chord was operating under tension.
Figure 13.
(a) Finite element mesh arrangement; (b) Level of stress for estimated service demands, indicating that top chord was operating under tension.
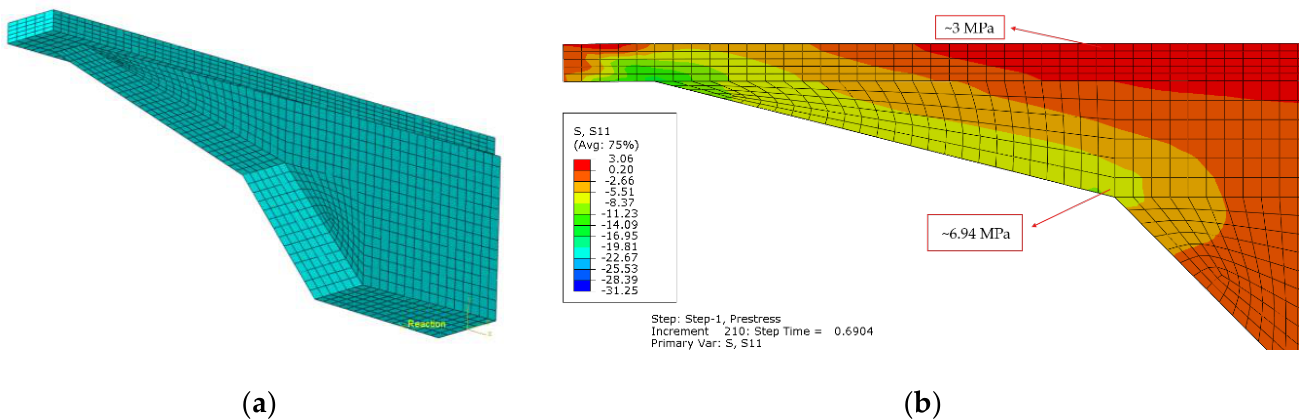
Figure 14.
Stress-strain curves adopted in simulations (a) Concrete compressive and tensile stress-strain curves (fctm is the tensile strength of concrete); (b) Post-tensioning and passive reinforcing steel curves.
Figure 14.
Stress-strain curves adopted in simulations (a) Concrete compressive and tensile stress-strain curves (fctm is the tensile strength of concrete); (b) Post-tensioning and passive reinforcing steel curves.
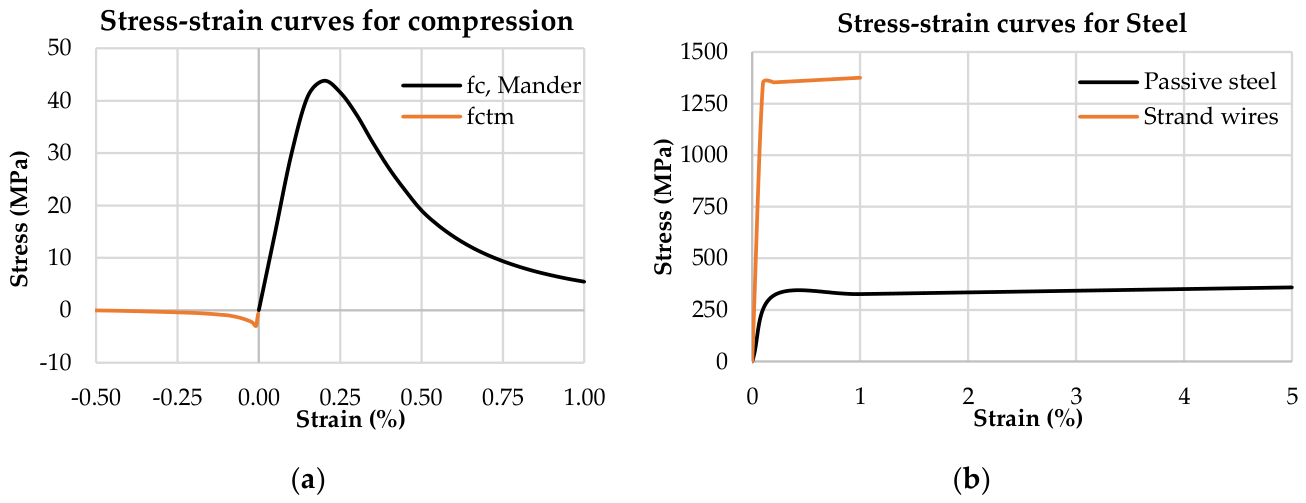
Figure 15.
Model without prestressing forces in post-processing (undeformed shape) (a) Stress-distribution across column-wall depth; (b) Permanent plastic strain distribution in critical section.
Figure 15.
Model without prestressing forces in post-processing (undeformed shape) (a) Stress-distribution across column-wall depth; (b) Permanent plastic strain distribution in critical section.
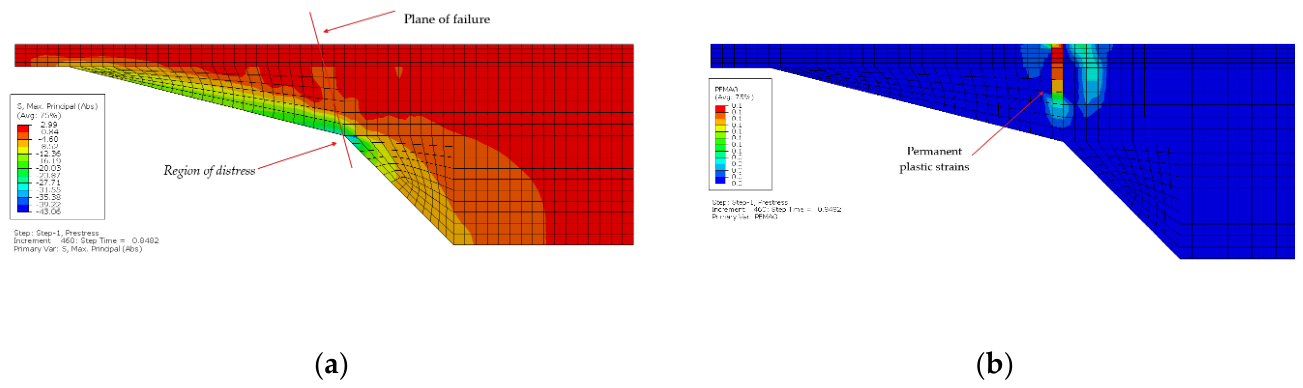
Figure 16.
Model without prestressing forces in post-processing (undeformed shape) (a) Stresses in reinforcing steel; (b) Concrete damage plasticity (CDP) model with crack propagation.
Figure 16.
Model without prestressing forces in post-processing (undeformed shape) (a) Stresses in reinforcing steel; (b) Concrete damage plasticity (CDP) model with crack propagation.
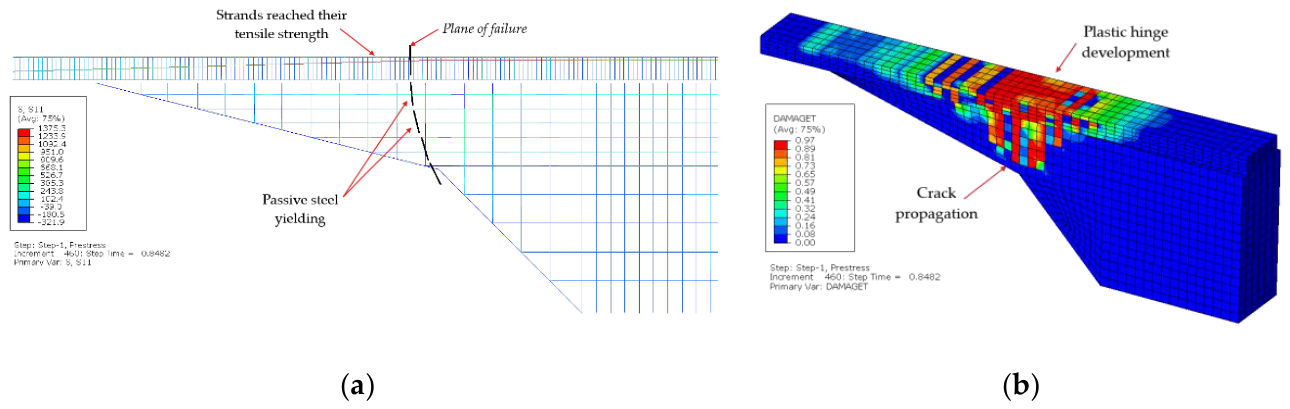
Figure 17.
Capacity curves of numerical models with and without prestressing forces.
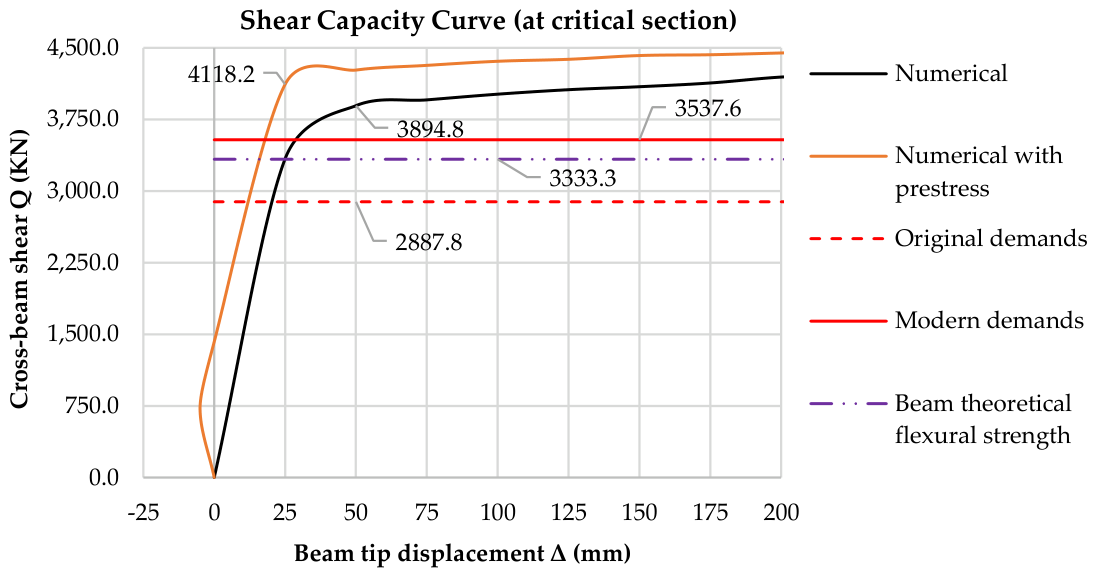
Figure 18.
Engineering solution employed for the retrofit of the asset.
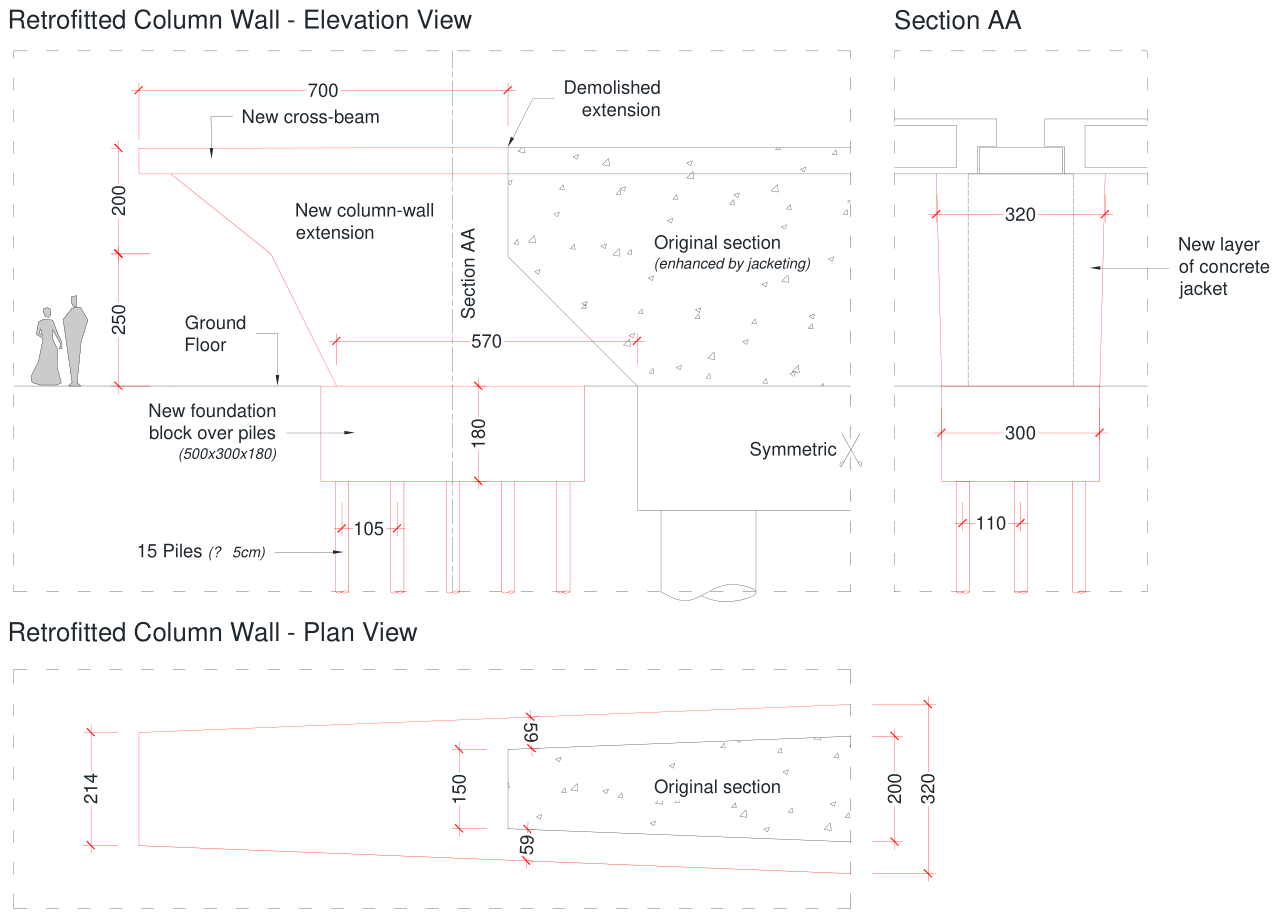
Figure 19.
Viaduct after retrofitting (a) View of the new jacked column-wall; (b) Removal of restaurant, and integration with the new park built.
Figure 19.
Viaduct after retrofitting (a) View of the new jacked column-wall; (b) Removal of restaurant, and integration with the new park built.
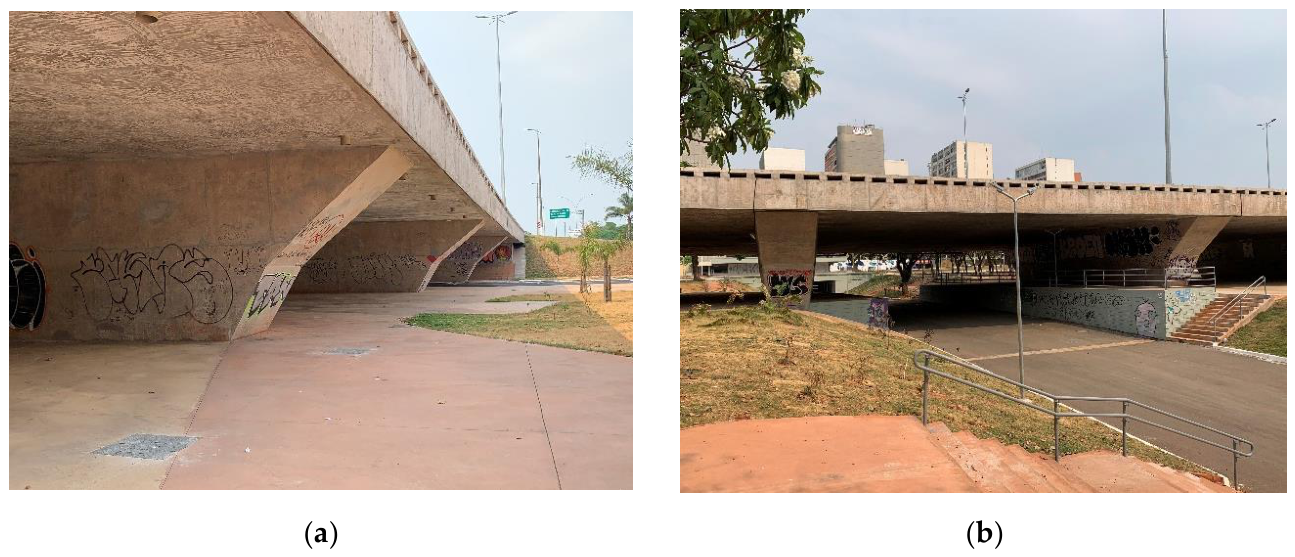

Table 1.
Shares and nature of internal loads over the viaduct critical section.
| Nature of loading | M (MNm) | % | V (MN) | % |
|---|---|---|---|---|
| Dead | 6.20 | 59.8% | 1.85 | 64.2% |
| Vehicles (TB36) | 4.17 | 40.2% | 1.03 | 35.8% |
| Total | 10.37 | 100.0% | 2.89 | 100.0% |
| Prestressing | -5.12 | 82.7%1 | -0.69 | 37.3%1 |
1 Percentage considering the balancing of the dead load only.
Table 2.
Shear strength of the critical section, considering the effective depth as 37 cm.
| deff = 37 cm | Model I | Model II (θ=45º) | Model II (θ=30º) | |||
|---|---|---|---|---|---|---|
| Prestress | without | with | without | with | without | with |
| VSd (KN) | 2887.80 | 2265.63 | 2887.80 | 2265.63 | 2887.80 | 2265.63 |
| VRd2 (KN) | 5707.36 | 5707.36 | 5707.36 | 5707.36 | 4942.72 | 4942.72 |
| VSd/VRd2 (%) | 50.6% | 39.7% | 50.6% | 39.7% | 58.4% | 45.8% |
| Vc (KN) | 654.26 | 1065.81 | 365.07 | 725.94 | 313.50 | 665.34 |
| Vsw (KN) | 535.63 | 535.63 | 535.63 | 535.63 | 927.74 | 927.74 |
| VRd3 (KN) | 1189.89 | 1601.44 | 900.70 | 1261.57 | 1241.24 | 1593.08 |
| VSd/VRd3 (%) | 242.7% | 141.5% | 320.6% | 179.6% | 232.7% | 142.2% |
Table 3.
Shear strength of the critical section, considering the effective depth as 193 cm.
| deff = 193 cm | Model I | Model II (θ=45º) | Model II (θ=30º) | |||
|---|---|---|---|---|---|---|
| Prestress | without | with | without | with | without | with |
| VSd (KN) | 2887.80 | 2265.63 | 2887.80 | 2265.63 | 2887.80 | 2265.63 |
| VRd2 (KN) | 29770.84 | 29770.84 | 29770.84 | 29770.84 | 25782.3 | 25782.3 |
| VSd/VRd2 (%) | 9.7% | 7.6% | 9.7% | 7.6% | 11.2% | 8.8% |
| Vc (KN) | 3412.74 | 5559.51 | 3480.71 | 5801.46 | 3492.83 | 5844.60 |
| Vsw (KN) | 2793.96 | 2793.96 | 2793.96 | 2793.96 | 4839.27 | 4839.27 |
| VRd3 (KN) | 6206.70 | 8353.47 | 6274.67 | 8595.42 | 8332.10 | 10683.87 |
| VSd/VRd3 (%) | 46.5% | 27.1% | 46.0% | 26.4% | 34.7% | 21.2% |
Table 4.
Determination of stresses (manually calculated) for the critical section.
| Stress in critical section (Mpa)* | |||
|---|---|---|---|
| Location / Load Comb | CQperm | CFreq | Crare |
| Top chord (16 cables) | 1.32 | 1.69 | 2.81 |
| Bottom chord (16 cables) | -5.09 | -5.47 | -6.59 |
| Top chord (13 cables) | 2.55 | 2.93 | 4.05 |
| Bottom chord (13 cables) | -5.62 | -6.00 | -7.12 |
*Negative values are in compression; Positive values are in tension.
Disclaimer/Publisher’s Note: The statements, opinions and data contained in all publications are solely those of the individual author(s) and contributor(s) and not of MDPI and/or the editor(s). MDPI and/or the editor(s) disclaim responsibility for any injury to people or property resulting from any ideas, methods, instructions or products referred to in the content. |
© 2026 by the authors. Licensee MDPI, Basel, Switzerland. This article is an open access article distributed under the terms and conditions of the Creative Commons Attribution (CC BY) license (http://creativecommons.org/licenses/by/4.0/).
Copyright: This open access article is published under a Creative Commons CC BY 4.0 license, which permit the free download, distribution, and reuse, provided that the author and preprint are cited in any reuse.