
Submitted:
27 August 2026
Posted:
27 August 2026
You are already at the latest version
Abstract
The rhizosphere microbiome plays a crucial role in the development, health, and therapeutic properties of Panax ginseng. Therefore, we evaluated the spatial trends in bacterial communities using a comprehensive meta-analysis of 359 sequenced rhizosphere samples from seven NCBI Sequence Read Archive BioProjects. The SILVA reference database was used to compare the Chinese and Korean sequencing datasets, focusing on quality filtering, denoising, amplicon sequence variants, and taxonomy assignment. The bacterial community structure was characterized, and differentially abundant taxa were identified using the Kruskal-Wallis test with false discovery rate correction. Co-occurrence network analysis illustrated region-specific microbial relationships and community organization, whereas functional profiles were projected to assess potential metabolic differences. Despite regional and technical variations, 37 bacterial species consistently emerged as conserved core microbiome members. Regional analyses revealed distinct bacterial drivers, such as Ligilactobacillus, Romboutsia, Nitrospira, and Bradyrhizobium in the Korean samples and Sphingoaurantiacus and Holophaga in the Chinese samples. Functional predictions showed that plant-associated defense mechanisms, nutrient mobilization, and carbon cycling varied geographically. Network studies demonstrated that community structures differed across regions. Overall, these findings indicate that although a conserved core community exists, regional differences significantly influence the composition, functional potential, and ecological relationships of the P. ginseng rhizosphere.
Keywords:
rhizosphere
; Panax ginseng
; microbiome
; 16s rDNA
; metagenomes
; bio projects
1. Introduction
The rhizosphere, a thin layer of soil surrounding plant roots, is influenced by root exudates and is one of the most biologically vibrant interfaces on Earth. The rhizosphere is a dynamic hub for interactions between plants and soil microorganisms, serving vital functions in plant nutrition, stress resilience, and productivity [1]. Panax ginseng, a medicinal herb of the Araliaceae family, is widely recognized for its therapeutic potential. The major bioactive components of ginseng, termed ginsenosides, are credited with broad pharmacological effects, including anti-inflammatory, anticancer, antimicrobial, antiviral, immunomodulatory, antidiabetic, and antioxidant properties [2,3]. In perennial medicinal plants, such as P. ginseng Meyer, which require years of field cultivation to reach therapeutic maturity, the rhizosphere microbiome is often recognized as the plant’s second genome, serving more than just a collection of passive inhabitants [4,5]. These complex microbial communities play a crucial role in plant growth and ginsenoside synthesis by facilitating nutrient cycling, regulating phytohormone signaling, enhancing plant immunity, and suppressing the growth of pathogenic microbes. The composition and function of rhizosphere microbes are influenced by both plant genotypes and environmental factors [6,7]. However, geographical variation remains a significant factor affecting the assembly and diversity of microbial communities in various cultivated areas. Moreover, variations in the hypervariable regions of 16S rRNA can introduce methodological biases, complicating comparisons across studies and ecological insights [8,9,10].
Advances in next-generation sequencing have revolutionized microbiome research by enabling the study of both culturable and non-culturable microbes. Coupled with the increasing accessibility of public sequencing datasets, these technologies enable researchers to explore microbiome composition, assembly processes, and ecological patterns across various geographical and environmental contexts [11,12]. The use of 16S rRNA gene amplicon sequencing has become fundamental in microbiome research, as it enables rapid, cost-effective, and culture-independent simultaneous identification and quantification of bacterial communities across many samples. Next-generation sequencing (NGS) serves as a molecular fingerprint for taxonomic identification, and the high efficiency of NGS platforms has facilitated high-throughput data generation, making large-sample studies more feasible and affordable [13,14]. Most studies utilize it to create taxonomic profiles from individual experiments, primarily focusing on the microorganisms present and their relative abundances. However, the integrated reanalysis of microbiome datasets from multiple independent studies facilitates researchers to obtain more robust, generalizable, and biologically relevant insights than from individual studies alone. Combining datasets from different groups, locations, and experiments enhances the statistical power and allows for the identification of universal microbial patterns. However, this integration presents challenges, as datasets often differ in sampling techniques, sequencing methods, and study designs, leading to batch effects, heterogeneity, compositionality, and zero-inflation issues that require careful management through appropriate data harmonization, transformation, and batch-correction strategies [15,16,17]. Integrated reanalysis of microbiome data extends beyond simply identifying the microbes to comprehending their functions, interactions with each other and the host, and their influence on ecosystem processes. The integration of various data types and analytical methods offers a holistic perspective on microbial community composition, metabolic activities, and ecological relationships [18,19]. This approach integrates nonparametric differential abundance testing, eco-functional mapping based on microbial traits, and co-occurrence network analysis to describe taxonomic shifts, anticipated ecological roles, and community interaction patterns [20,21].
In this study, 359 sequenced samples of ginseng rhizosphere soil were retrieved from the NCBI Sequence Read Archive (SRA) across seven BioProject accessions to assess the effect of geographical provenance on the ginseng rhizosphere microbiome composition. We assessed and compared the ecological profiles depicted by the V3–V4 Chinese group and V4 Korean cohort sequencing datasets. By identifying key taxa linked to specific regions, integrating them into eco-functional interaction networks, and analyzing their network architecture, we demonstrated the impact of geographic origin on microbial ecosystems in the ginseng rhizosphere. These findings highlight the potential of integrating bioinformatics across various studies to reveal ecological patterns in plant–soil systems.
2. Results
2.1. Micro-Regional Homeostasis of Rhizosphere Alpha Complexity Baselines
To determine whether geographic variations in agricultural practices and local soil characteristics affect the ecological complexity of the P. ginseng rhizosphere microbiome, alpha diversity patterns were examined across different cultivation regions (Figure 1). In the Chinese V3–V4 sequencing dataset (Figure 1A), the rhizosphere communities maintained relatively consistent diversity levels, with median Shannon diversity indices typically ranging from approximately 5.8–6.5 in Baishan, Ji’an, Jilin, and Linjiang. The Harbin cohort exhibited greater variability, as evident from a wider interquartile range and a lower median diversity (H′ ≈ 4.9), whereas the Tonghua samples had the lowest median diversity (H′ ≈ 4.3). Despite the geographic distance, diversity values at most Chinese cultivation sites were similar, indicating a relatively stable community structure.
A similar trend was observed in the Korean V4 sequencing track (Figure 1B). Samples from 11 different cultivation regions throughout the Korean Peninsula exhibited relatively consistent rhizosphere microbial diversity. Median Shannon diversity values generally ranged from 4.5 to 5.5 across Anseong, Cheorwon, Gimpo, Hoengseong, Hongcheon, Hwacheon, Icheon, Incheon, Paju, Pocheon, and Pyeongchang, with only the Wonju group exhibiting slightly lower diversity values. The robust alignment of diversity estimates from various locations suggests that P. ginseng maintained a fairly stable and preserved rhizosphere microbiome, with the overall community structure showing marked resilience to differences in regional cultivation conditions.
2.2. National and Micro-Regional Beta Diversity Dispersal Patterns
The ordination of community profiles revealed distinctly different ecological assembly patterns between the two national profiling streams (Figure 2). In the processing stream focusing on the V3–V4 hypervariable region, which depicted the Chinese rhizosphere cohorts (Figure 2A), micro-regional geographic origin had a significant and polarized impact on the overall taxonomic assembly (F = 7.68, R2 = 24%, p < 0.001), dividing the profiles into distinct, isolated ecological areas. Samples from the Jilin area were completely separated along the positive axis of PCoA Coordinate 1, whereas there was a strong multi-study consensus among the Tonghua, Harbin, Ji’an, Baishan, and Linjiang groups, which clustered together in the upper-left quadrant.
Remarkably, the pronounced geographic fragmentation observed in Chinese fields was completely eclipsed by a well-maintained structural baseline within the V4 hypervariable region dataset, which aligned with the Korean cultivation pathways across multiple cities (Figure 2B). The PERMANOVA analysis of the V4 Korean matrix revealed that geographic location accounted for 7.9% of the overall compositional variance (R2 = 0.079, F = 1.51, p < 0.001). Rather than being divided into distinct areas based on local coordinates, the confidence ellipses for Korean regions, such as Anseong, Hoengsong, Gimpo, Hwacheon, and Paju, exhibited spatial overlap, indicating a remarkably consistent nationwide homeostatic community structure across the Korean Peninsula.
2.3. Taxonomic Architecture of the Conserved Core Rhizosphere Microbiome
Intensive analysis of international datasets revealed a unique core microbiome comprising 37 bacterial taxa that occurred consistently in the P. ginseng rhizosphere worldwide, unaffected by national borders or technical batch variations (Table 1). Rather than being randomly and arbitrarily distributed across a wide array of soil microflora, these 37 core taxa exhibited a well-organized, conservative taxonomic structure, primarily within the phyla Acidobacteriota, Proteobacteria, Actinobacteriota, and Gemmatimonadota (Table 1).
A comparative evaluation of the two independent processing streams revealed remarkable evolutionary consistency across studies. The actinobacterial genus Gaiella effectively transcended technical, experimental, and geopolitical boundaries, establishing itself as a stable core member in both the longer V3–V4 Chinese profiling dataset (1.828% mean abundance) and the shorter V4 Korean pipeline (1.160% mean abundance). However, the rest of the architecture is characterized by distinct regional patterns. In the V4 Korean sequencing track, the root-associated structure was significantly supported by unclassified genera from the phylum Acidobacteriota, with peak mean global relative abundances of 4.985% and 3.24%, respectively, along with a strong baseline for Gemmatimonadota (3.089%). Plant-associated mutualists established a significant dominant presence in the Korean matrix, led by Sphingomonas (1.895%), Pseudolabrys (1.909%), and Acidibacter (1.247%).
2.4. Regional Niche Differentiation Is Driven by Distinct Taxonomic Modulators
Differential abundance testing highlighted that the geographical origin significantly affects the auxiliary composition of the rhizosphere, revealing distinct taxonomic determinants in each national context (Figure 3). In the Chinese V3–V4 hypervariable profile (Figure 3A), environmental and non-enteric soil specialists significantly influenced regional niche differentiation. The obligate anaerobe Holophaga, carbohydrate-degrading specialist Arachidicoccus, and gram negative aerobic Agriterribacter exhibited the most substantial statistical variation across geographic coordinates (-log10(p-value) ~ 25) [22,23,24]. These were accompanied by additional important taxa such as SH-PL14, Micropepsis, Chujaibacter, Taibaiella, and Fimbriimonas. Other significant environmental factors with considerable regional variations included organic material degrading Sphingopyxis, Sphingorhabdus, and Chitinophaga (-log10(p-value) ~ 22) [25,26,27] (Figure 3A).
Conversely, the Korean V4 hypervariable track (Figure 3B) revealed a distinctly different taxonomic group primarily comprising fermentative, spore-forming, or highly adaptable root-associated soil organisms. Ligilactobacillus showed the greatest statistical variability among geographical regions (-log10(p-value) > 20), accompanied by significant regional abundance changes in Escherichia-Shigella, Turicibacter, Romboutsia, and Bacteroides (-log10(p-value) > 15). Importantly, the major functional nitrogen-cycling species displayed notable geographical differences; the chemolithoautotrophic nitrite-oxidizing genus Nitrospira and the nitrogen-fixing root nodule symbiont Bradyrhizobium exhibited highly significant regional variability in abundance (-log10(p-value) ~ 10) [28,29] (Figure 3B).
2.5. Eco-Functional Predictive Mapping Reveals Spatial Tuning of Rhizosphere Capabilities
Predictive functional mapping revealed that geographical origin not only alters individual taxonomic classifications but also significantly affects distinct metabolic and physiological adaptations within the operational environment of the rhizosphere (Figure 4). In the Chinese V3–V4 dataset (Figure 4A), environmental sensing (diurnal synchronous signals) emerged as a key functional node, which was strongly supported by the prevalent regional differences between Sphingoaurantiacus and Sphingopyxis (-log10(p-value) > 26). Simultaneously, nutrient mobilization pathways exhibited considerable geographic diversity influenced by marked changes in Holophaga, indicating localized changes in the aromatic carbon turnover capacity of the rhizosphere across Chinese provinces (Figure 4A).
In the Korean V4 hypervariable dataset (Figure 4B), the functional landscape distinctly shifted towards metabolic interactions near the root. The carbon cycling (root exudate fermentation) network exhibited significant regional variations, driven by Ligilactobacillus, Romboutsia, and Bacteroides (-log10(p-value) > 16), indicating that the utilization of plant-origin low-molecular-weight exudates differed considerably across Korean domestic farms. Significantly, the plant defense priming (induced systemic resistance / ISR) module displayed a strong sensitivity to geographical origin, influenced by marked regional variations in Escherichia-Shigella (-log10(p-value) > 17) (Figure 4B).
2.6. Co-Occurrence Network Topology Reveals Deep vs. Modular Structural Properties
Rhizosphere co-occurrence networks were used to identify distinct microbial connection patterns between the V3–V4 and V4 profiling tracks (Figure 5). The V3–V4 hypervariable track (Figure 5A) revealed a highly interconnected and complex structure, with several taxa forming interconnected clusters and multiple highly connected bacterial nodes. Specialists in core soil and rhizosphere—such as Sphingomonas, Pedosphaera, Labrys, Hypericibacter, Gaiella, and Edaphobacter—appeared as key topological hubs with a high degree of connectivity (> 50). Branches connected to the periphery included recognized genera related to plants and the environment, such as Rhizobium, Pseudomonas, Bradyrhizobium, and Flavobacterium. The overwhelming majority of associations noted in this track were positive (blue edges), indicating a collaborative, highly stable microbial co-occurrence network in regional ginseng rhizosphere soils. A subtle portion (< 2%) of negative correlations (red edges) were found near particular hubs (e.g., Nitrospira, Ralstonia), indicating slight niche separation.
In contrast, the V4 network (Figure 5B) was segmented into several distinct modules and featured a significantly reduced number of nodes and edges. A fermentative cluster associated with hosts/plants (Ligilactobacillus, Bacteroides, Escherichia-Shigella, Streptococcus, and Bifidobacterium), an anaerobic metabolic cluster from soil (Clostridium, Desulfobacca, Anaerolinea, Pelosinus, and Syntrophorhabdus), and an environmental cluster from the rhizosphere (Bradyrhizobium, Pir4, Pirellula, Pedomicrobium, and SH-PL14). Additionally, distinct negative correlations were identified between particular taxa—especially between Bradyrhizobium and Clostridium, along with Mycobacterium and Uncl. Pyrinomonadaceae—emphasizing localized ecological rivalry and niche differentiation within particular root-associated micro-habitats.
3. Discussion
The consistent stability shown by the Shannon diversity indices in different domestic and global microregions provides valuable insights into the assembly processes of the P. ginseng holobionts (Figure 1). In ambient soil ecosystems, opportunistic environmental elements, such as seasonal temperature variations, varying nitrogen-phosphorus-potassium (NPK) ratios, and localized soil pH gradients, typically lead to significant changes in bacterial diversity and species uniformity [30,31,32]. However, the limited and overlapping vertical ranges observed across the 11 distinct Korean regions and most Chinese fields indicate a robust host-mediated buffering capacity that effectively mitigates external soil variability.
This ecological balance suggests that P. ginseng exerts strong selective pressure on its adjacent rhizosphere environment, shaping the composition and functional capacity of the associated microbial populations [6]. The host plant functions as an ecological filter by continuously releasing targeted carbon-dense root exudates composed of organic acids, phenolic signals, and unique secondary metabolites [33,34]. This focused exudation effectively restricts the growth of dominant opportunistic soil strains, preserving ideal baseline diversity [35]. Significant decreases in median diversity and wider distribution ranges observed in particular cohorts, such as Harbin and Tonghua, indicate the limits at which severe localized soil stress or long-term continuous cropping methods can surpass a plant’s ability to adapt. Through its effect on rhizosphere microbial assembly, Panax ginseng plays a role in preserving distinct alpha diversity patterns and fostering the growth of functionally significant microbial communities throughout production areas [36].
By integrating the spatial configuration of the Bray-Curtis PCoA matrices (Figure 2) with the taxonomic classification of the 37 core bacteria (Table 2), the ecological principles that influence P. ginseng holobionts were revealed. Our comprehensive data revealed that the rhizosphere microbiome of P. ginseng consists of a stable core microbial community, with variations in accessory taxa that are specific to different regions, indicating the influence of both host selection and environmental factors [6]. The overlap of confidence ellipses among Korean cultivation sites in the V4 matrix (Figure 2B), coupled with the relatively small percentage of variation due to geographic factors (R² = 7.44%), suggests that rhizosphere microbial communities across Korea are fairly consistent, reflecting common host-related selection processes. In contrast, the Chinese provinces exhibited more pronounced regional differences (Figure 2A).
The dominance of specific bacterial lineages among the 37 core taxa provides crucial insights into the unique ecology of the root zones (Table 1). The consistent presence of Acidobacteriota and Gemmatimonadota in global ginseng datasets suggests that these groups are stable constituents of the ginseng rhizosphere microbiome, potentially contributing to ecological functions under cultivation conditions [37]. The selective enhancement of these oligotrophic, acid-tolerant phyla suggests a stable baseline equilibrium within the rhizosphere holobiont [38,39,40,41]. These organisms have unique adaptations that enable them to thrive and function in low-nutrient and low-pH environments, strengthening the root-soil connection throughout the host’s multiyear growth cycle [42].
From a biological perspective, the persistent presence of certain widely conserved genera, such as Sphingomonas and Pseudolabrys, in the global core has significant agronomic and defensive implications (Table 1). Sphingomonas species are versatile root-colonizing bacteria that can enhance root development, pathogen resistance, production of phytohormones such as gibberellins, auxins, and indole acetic acid, and nitrogen cycling [33,43]. They may also contribute to the degradation and removal of inorganic pollutants from agricultural soils and increase plant resistance to drought, salinity, and heavy metal stress [44,45,46]. Concurrently, Pseudolabrys is recognized as a rhizobacteria that promotes plant growth, aids in plant development, break down hydrocarbon, and plays a significant role in the nitrogen cycle [47,48]. It also reported favorable lipid associations, which are adaptable signaling molecules that control numerous physiological processes in plants such as energy storage, stress response, protection against dehydration and pathogens, and the production of cellular membranes [49,50,51]. Additionally, the recurrent presence of Gaiella as a core taxon indicates its stable and widespread distribution across the studied groups [52,53,54] (Table 1). Members of Gaiella are fundamentally involved in soil nitrogen cycling, particularly nitrate reduction and the decomposition of complex organic materials, and serve as vital functional collaborators despite vast geographic and national divides [55,56]. Mycobacterium, Bryobacter, and Haliangium enhance plant health through various rhizosphere functions. These taxa are associated with nutrient and carbon cycling, organic matter decomposition, nitrogen transformation, pollutant degradation, and maintenance of a beneficial rhizosphere microenvironment, thereby potentially supporting plant growth and overall rhizosphere health [57,58,59,60,61].
The identification of distinct microbial associations and anticipated functional pathways in the V3–V4 and V4 datasets emphasizes the potential impact of local environmental conditions on the composition and functional capabilities of the P. ginseng rhizosphere microbiome [5,6] (Figure 3 and Figure 4). The pronounced regional associations of Holophaga Arachidicoccus, and Agriterribacter in the Chinese V3–V4 profiles could indicate variations in local rhizosphere environmental factors, including soil pH, moisture, organic matter, and substrate availability, all of which are known to affect P. ginseng rhizosphere microbial communities [62]. Holophaga species are well-researched specialists that can metabolize complex aromatic compounds in nutrient-deficient terrestrial ecosystems [63]. The geographic differences suggest that variations in local soil and rhizosphere environments could result in unique microbial functional profiles at different sampling locations, potentially affecting the decomposition of complex organic matter [64].
The alternative evolutionary group represented in the Korean V4 track, characterized by the presence of Ligilactobacillus, Turicibacter, and Romboutsia (Figure 3B), introduced a vibrant metabolic dimension to this regional distinction. These genera are highly effective in fermentation, rapidly metabolizing carbohydrates and producing organic acids [65,66]. These notable geographical differences suggest that local root exudation patterns vary by region, probably because of diverse micronutrient deficiencies, soil structure challenges, or regional climatic conditions, thereby selectively attracting specific metabolic groups to mitigate localized environmental stresses on Korean farms [35].
The ecological potential within the P. ginseng rhizosphere may vary owing to regional differences in bacterial functional interactions (Figure 4). The consistent association between Bradyrhizobium and Nitrospira with nitrogen-related functions across both profiling tracks suggests a relatively conserved nutrient cycling potential, and differences in organic acid fermentation and environmental sensing may be attributed to regional variations in root-derived substrates and local environmental conditions [67,68]. The diverse ecological functions of rhizosphere bacteria are further highlighted by their association with the degradation of aromatic compounds and processes related to plant defense [36,69]. Overall, these results imply that although some functional connections remain consistent across marker locations, geographic differences influence the functional composition of the P. ginseng rhizosphere microbiome.
The bacterial population in the V3–V4 region had a more complex and intertwined relationship pattern compared to that in the V4 region, as evidenced by the dissimilar network architectures. The P. ginseng rhizosphere may have greater potential for coordinated microbial interactions and niche overlap because of the dense V3–V4 network, which contains several closely connected species [70]. In contrast, a more dispersed V4 network indicated a stronger division into distinct microbial modules, potentially reflecting differences in ecological niches or resource usage. Despite the variations in network topology, certain bacterial groups maintained relatively stable roles within the rhizosphere community, as shown by the consistent presence of taxa, such as Bacteroides, Ligilactobacillus, Romboutsia, and Nitrospira across the networks. Potential co-occurrence and exclusionary interactions among the rhizosphere species were further confirmed by the presence of both positive and negative associations. However, because co-occurrence networks derived from abundance data cannot independently demonstrate causation or direct biological interactions, these correlation-based associations should be interpreted as statistical relationships rather than direct evidence of microbial interactions [71,72]. Overall, network analysis revealed differences in the connectivity and structure of the P. ginseng rhizosphere microbiome across marker regions.
3.1. Limitation of the Study
Although this study provides a comprehensive synthesis of the P. ginseng rhizosphere microbiome across different growth regions, methodological and biological limitations should be considered when interpreting the results. The geographic distribution of the dataset was uneven, as it included one BioProject from Korea with 206 SRA samples and six BioProjects from China with 153 SRA samples. Microbial community comparisons may have been affected by differences in sequencing regions (V3–V4 versus V4), experimental methods, and study-specific batch effects could have influenced microbial community comparisons. Additionally, limited environmental metadata complicates the evaluation of factors related to soil and agricultural practices. Therefore, these regional trends should be interpreted with caution and further validated through standardized sampling across diverse geographic populations.
4. Materials and Methods
4.1. Collection of Publicly Available Original Metagenomic Data
A comprehensive data-mining strategy was adopted to systematically map the bacterial microbiome of the P. ginseng rhizosphere, utilizing the NCBI BioProject database with the search term “(panax ginseng rhizosphere)” which initially yielded 21 potential matches. The selected studies were filtered based on the following rigorous inclusion criteria: (i) datasets must consist of bacterial 16S rDNA amplicon sequencing exclusively from the Illumina platform (MiSeq, HiSeq, or NovaSeq); (ii) each experimental group must include at least five biological replicates for each experimental group; (iii) sample matrices must accurately reflect root-associated P. ginseng rhizosphere soil; and (iv) metadata must contain a confirmed geographical origin. These criteria narrowed the selection to seven eligible BioProjects, including six studies from China and one from South Korea (Table 2). Using the SRA Toolkit, raw sequence data from these seven projects were retrieved and consolidated into a single meta-cohort, which included 359 unique SRA sample profiles of bacterial 16S rDNA sequences for further bioinformatic analysis.
To address significant batch effects, technological disparities, and variations in the experimental design of the multicohort microbiome integration, the combined sequencing dataset was organized into a three-track preprocessing framework. To enhance technical consistency across studies and ensure alignment between single-end and paired-end sequencing methods, all datasets were processed using a standardized forward-read-only method. In this framework, Track 1 consisted solely of samples from the BioProject PRJNA707387, focusing on the 16S rRNA V4 hypervariable region and generating single-end reads on the Illumina MiSeq platform. Track 2 included V3–V4 amplicon datasets from BioProjects PRJNA795020, PRJNA681095, and PRJNA927237, which were generated using traditional sequencing platforms with continuous quality score distributions. Conversely, Track 3 included the V3–V4 datasets from BioProjects PRJNA704771, PRJNA701796, and PRJNA11191688, which were produced using more recent high-throughput sequencing technologies characterized by discretized (binned) quality-score profiles. This stratification facilitated platform-specific quality control along with error modeling and trimming methods, thus minimizing the technical variation associated with instruments before data integration [17]. Apart from preprocessing, significant statistical issues related to amplicon sequencing data, especially compositionality and the prevalence of zero counts, were addressed using subsequent analytical methods. Specifically, centered log-ratio (CLR) transformation was utilized to mitigate compositional constraints, and robust differential abundance techniques were applied to manage zero inflation and improve the reliability of cross-study analyses [73].
4.2. Sequence Quality Trimming, DADA2 Processing, and Amplicon Sequence Variants (ASV) Inference
All analyses were performed in R (version 4.6.0) using the DADA2 package (version 1.40.0) to extract high-resolution ASVs from raw sequencing data. To manage the differences in the targeted 16S rRNA hypervariable regions and the error profiles specific to different sequencing platforms, the seven BioProjects were categorized into three distinct analytical tracks for separate processing. Taxonomic classifications were assigned to the resulting ASVs using the SILVA reference database (version 138.2).
Quality assessment was initially performed on the forward reads to establish consistent trimming standards across all datasets. The FilterAndTrim function in DADA2 was used for quality filtering and trimming, applying a consistent truncation length of 200 bp to eliminate low-quality terminal regions while maintaining consistent read lengths for subsequent analyses. A strict upper limit on the expected error (maxEE = 2) was applied to filter reads with high cumulative sequencing errors. During pre-processing, reads containing ambiguous nucleotides (maxN = 0) and those matching standard PhiX control sequences were discarded.
Following quality control, the sequencing error models were independently assessed for each analytical track using the LearnErrors algorithm to address track-specific error traits. These error profiles were then integrated into a data-denoising process to derive high-resolution ASVs, allowing for the differentiation of true biological sequence variants from sequencing errors with single-nucleotide accuracy. To ensure methodological consistency across studies with different library configurations, a forward-read-only processing strategy was utilized, and paired-read merging was omitted. Finally, chimeric sequences were identified and eliminated de novo using a consensus-based method in the removeBimeraDenovo function.
4.3. Taxonomic Assignment and Phyloseq Integration
Taxonomically classified ASVs were organized using the RDP Naive Bayesian classifier integrated into DADA2 [74] and cross-referenced using the SILVA database (v138.2) [75], ensuring a minimum bootstrap confidence of 80% for assignments. Taxonomic annotations were merged with sample metadata and ASV abundance tables to create cohesive phyloSeq objects (phyloSeq _v3v4_clean.rds and phyloSeq _v4_clean.rds). These objects provide a cohesive data framework for subsequent analyses, including community diversity evaluation, abundance variation testing, ecological function prediction, and microbial co-occurrence network identification.
4.4. Alpha Diversity Profiling and Homeostatic Assessments
Alpha diversity was calculated to characterize the ecological complexity and within-sample diversity of the rhizosphere microbiomes of P. ginseng. Analyses were performed at the ASV level using the estimate_richness function in the phyloseq R package. The Shannon diversity index (H′) was used as the primary diversity metric, as it accounts for both taxonomic richness and abundance evenness.
4.5. Beta Diversity Modeling and Functional Core Integration
Patterns of beta diversity in the rhizosphere microbiomes of P. ginseng were analyzed using Bray–Curtis dissimilarity and depicted using principal coordinates analysis (PCoA). To normalize variations in sequencing depth, ASV abundances were converted into relative abundances before constructing the distance matrix. The geographic variation in community composition was statistically evaluated using PERMANOVA (adonis2, 999 permutations), with geographic location as the grouping variable. This analysis yielded estimates of statistical significance (p-value), effect size (R²), and pseudo-F values, which illustrated the degree of community differentiation across the cultivation regions.
4.6. Cross-Study Core Microbiome Identification and Taxonomic Consolidation
The core microbiome was analyzed using independently processed phyloSeq datasets to identify taxa consistently associated with P. ginseng rhizosphere across various geographic regions and sequencing platforms. Separate analyses were performed for each sequencing track to minimize bias in the classification related to the primers and platforms. Before identifying the core microbiome, ASV counts were aggregated at the genus level using tax _glom and converted to relative abundances to adjust for variations in sequencing depth across samples and BioProjects.
Core taxa were identified using the microbiome package based on the prevalence–abundance model. A genus was classified as part of the core microbiome if it appeared in ≥80% of samples (prevalence ≥ 0.80) and had a minimum relative abundance of 0.1% (abundance ≥ 0.001) [76,77,78]. These criteria ensured the identification of resilient and ecologically stable constituents of the P. ginseng rhizosphere microbiome.
4.7. Differential Taxonomic Abundance Profiling
To identify the bacterial genera influencing geographic differences in the P. ginseng rhizosphere microbiome, differential abundance analyses were performed using a non-parametric statistical method in R. The abundance of ASVs was aggregated at the genus level, and taxa with low prevalence were excluded to minimize the background noise and potential technical errors. Genera were included in the analysis only if they showed a minimum of five reads in at least 10% of the samples. Variations in genus abundance across different geographic areas were evaluated using the Kruskal–Wallis test, and the resulting p-values were adjusted for multiple comparisons using the Benjamini–Hochberg false discovery rate (FDR) approach. Genera with noteworthy FDR-adjusted values were considered potential microbial contributors to regional niche differentiation.
4.8. Functional Niche Capability Predictions
An eco-functional predictive mapping framework was established to translate geographical taxonomic differences into ecological and functional insights. Bacterial genera exhibiting statistically significant regional variations were assigned to fundamental ecological operational modules according to their confirmed physiological and metabolic characteristics in terrestrial ecosystems. The functional networks were characterized by carbon cycling (fermentation of root exudates), nutrient mobilization (assimilation of nitrogen/aromatics), environmental sensing (signals of diurnal synchrony), and plant defense priming (induced systemic resistance/ISR). The five bacterial genera with the greatest divergence within each functional operational module were dynamically isolated according to their relative abundances using Kruskal-Wallis p-values.
4.9. Microbial Co-Occurrence Network Analysis
Microbial co-occurrence networks were established using the tidygraph and ggraph packages in R. Pairwise Spearman rank correlations were computed among the filtered genera, and significant relationships were maintained using thresholds of |r| > 0.55 and p < 0.01. Self-loops and isolated nodes were excluded from the final network. The Fruchterman–Reingold force-directed layout was used to visualize the network topology, where the edge weights corresponded to the strength of the absolute correlation. Node size was adjusted based on degree centrality, whereas edge color indicated the direction of association, allowing for the visualization of both positive and negative co-occurrence trends in the P. ginseng rhizosphere microbiome.
5. Conclusions
This study conducted an extensive bioinformatics-driven meta-analysis of 359 rhizosphere samples from seven different BioProjects to investigate the impact of geographic origin on the P. ginseng microbiome. The findings showed that geographic origin plays a crucial role in determining the composition of rhizosphere communities, affecting their taxonomic structure, functional capabilities, and microbial interaction networks beyond the scope of individual studies.
A comparative examination of the two sequencing tracks revealed distinct ecological patterns. The Chinese V3–V4 dataset highlighted closely connected and collaborative microbial communities across various geographical cultivation areas, whereas the Korean V4 dataset showed more localized and modular interaction networks within a relatively stable host-associated environment. Significantly, geographic variations in key nutrient-cycling genera, such as Nitrospira and Bradyrhizobium, along with plant-associated groups such as Escherichia-Shigella and Achromobacter, indicate that regional variations in the rhizosphere microbiome could affect nutrient availability, plant growth, and phytochemical levels in P. ginseng [79]. Collectively, these findings establish a basis for future microbiome-based strategies in medicinal crop production, including targeted microbial management, synthetic community development, and localized precision agriculture techniques.
Author Contributions
M.M.I.: conceptualization, design, analysis, data collection, and writing of the manuscript draft; Y.H.: provided valuable input and constructive criticism of the manuscript drafts. Y.C. conceptualized, reviewed, and edited the final manuscript; K.S.K. conceptualized, acquired funds, and reviewed and edited the manuscript. All authors have read and approved the final manuscript.
Funding
The authors acknowledge the financial support received for this study and its publication. This research was supported by the Bio and Medical Technology Development Program of the National Research Foundation (NRF), funded by the Korean Government (MSIT) (No. RS-2025-02263193), by the Technology Innovation Program (RS-2025-13642970, Development of an AI-based Platform for Predicting and Evaluating Drug Safety and Efficacy) funded By the Ministry of Trade, Industry & Resources (MOTIR, Korea). This work also supported by Korea Institute of Science and Technology (26Z9061).
Data Availability Statement
All data obtained in this study are included in the article. Please contact the corresponding author for further information. All reproducible R scripts and data processing workflows generated during this study are publicly accessible in the Figshare repository (https://doi.org/10.6084/m9.figshare.33339468).
Acknowledgments
Not Applicable.
Conflicts of Interest
The authors declare no conflicts of interest.
Abbreviations
The following abbreviations are used in this manuscript:
| ASV: | Amplicon Sequence Variant |
| CLR: | Centered Log-Ratio |
| FDR: | False Discovery Rate |
| ISR: | Induced Systemic Resistance |
| NGS: | Next-Generation Sequencing |
| NPK: | Nitrogen-Phosphorus-Potassium |
| PERMANOVA | Permutational Multivariate Analysis of Variance |
| PCoA: | Principal Coordinates Analysis |
| RDP | Ribosomal Database Project |
| SRA | Sequence Read Archive |
| V3–V4 / V4 | Hypervariable regions of 16S rRNA gene sequencing |
References
- Mohapatra, S.; Johar, V.; Upadhyay, H.; Kumar, A.; Premdeep; Nayak, P.; Paul, M.; Babu, S.; Pradhan, R.; Mishra, P.; et al. Root-microbiome signaling networks under climate stress: Mechanistic insights and rhizosphere engineering opportunities. Rhizosphere 2026, 37, 101271. [Google Scholar] [CrossRef]
- Ratan, Z.A.; Haidere, M.F.; Hong, Y.H.; Park, S.H.; Lee, J.-O.; Lee, J.; Cho, J.Y. Pharmacological potential of ginseng and its major component ginsenosides. J. Ginseng Res. 2021, 45, 199–210. [Google Scholar] [CrossRef] [PubMed]
- Islam, M.M.; Park, I.-H.; Kang, K.S. Therapeutic potential of ginseng and its bioactive compounds in inflammatory bowel disease: current evidence and future directions. 2026, Volume 17 - 2026. [Google Scholar] [CrossRef]
- Li, J.; Wang, C.; Liang, W.; Liu, S. Rhizosphere Microbiome: The Emerging Barrier in Plant-Pathogen Interactions. 2021, Volume 12 - 2021. [Google Scholar] [CrossRef] [PubMed]
- He, C.; Wang, R.; Ding, W.; Li, Y. Effects of cultivation soils and ages on microbiome in the rhizosphere soil of Panax ginseng. Appl. Soil Ecol. 2022, 174, 104397. [Google Scholar] [CrossRef]
- Goodwin, P.H. The Rhizosphere Microbiome of Ginseng. Microorganisms 2022, 10. [Google Scholar] [CrossRef] [PubMed]
- Fang, J.; Wang, Y.-B.; Sui, J.-H.; Liu, C.-S.; Liu, R.; Xu, Z.-F.; Han, X.-Y.; Zhang, T.; Zhang, Q.-H.; Chen, C.-B. Response of ginseng rhizosphere microbial communities and soil nutrients to phosphorus addition. Ind. Crops Prod. 2025, 226, 120687. [Google Scholar] [CrossRef]
- Zhang, X.; Liu, S.; Wang, J.; Huang, Y.; Freedman, Z.; Fu, S.; Liu, K.; Wang, H.; Li, X.; Yao, M.; et al. Local community assembly mechanisms shape soil bacterial β diversity patterns along a latitudinal gradient. Nat. Commun. 2020, 11, 5428. [Google Scholar] [CrossRef] [PubMed]
- Yang, B.; Wang, Y.; Qian, P.-Y. Sensitivity and correlation of hypervariable regions in 16S rRNA genes in phylogenetic analysis. BMC Bioinform. 2016, 17, 135. [Google Scholar] [CrossRef] [PubMed]
- Kameoka, S.; Motooka, D.; Watanabe, S.; Kubo, R.; Jung, N.; Midorikawa, Y.; Shinozaki, N.O.; Sawai, Y.; Takeda, A.K.; Nakamura, S. Benchmark of 16S rRNA gene amplicon sequencing using Japanese gut microbiome data from the V1-V2 and V3-V4 primer sets. BMC Genom. 2021, 22, 527. [Google Scholar] [CrossRef] [PubMed]
- Chun, S.J. Microbiome dataset of eukaryotic and fungal communities in the bulk soil and root of wild Brassica napus in South Korea. Data Brief. 2022, 43, 108457. [Google Scholar] [CrossRef] [PubMed]
- Knief, C. Analysis of plant microbe interactions in the era of next generation sequencing technologies. Front. Plant Sci. 2014, 5, 216. [Google Scholar] [CrossRef] [PubMed]
- Gupta, S.; Mortensen, M.S.; Schjørring, S.; Trivedi, U.; Vestergaard, G.; Stokholm, J.; Bisgaard, H.; Krogfelt, K.A.; Sørensen, S.J. Amplicon sequencing provides more accurate microbiome information in healthy children compared to culturing. Commun. Biol. 2019, 2, 291. [Google Scholar] [CrossRef] [PubMed]
- Baruzzo, G.; Patuzzi, I.; Di Camillo, B. Beware to ignore the rare: how imputing zero-values can improve the quality of 16S rRNA gene studies results. BMC Bioinform. 2022, 22, 618. [Google Scholar] [CrossRef] [PubMed]
- Yuan, B.; Wang, S. Microbiome data integration via shared dictionary learning. Nat. Commun. 2025, 16, 8147. [Google Scholar] [CrossRef] [PubMed]
- Muller, E.; Algavi, Y.M.; Borenstein, E. The gut microbiome-metabolome dataset collection: a curated resource for integrative meta-analysis. npj Biofilms Microbiomes 2022, 8, 79. [Google Scholar] [CrossRef] [PubMed]
- Zhou, R.; Ng, S.K.; Sung, J.J.Y.; Goh, W.W.B.; Wong, S.H. Data pre-processing for analyzing microbiome data – A mini review. Comput. Struct. Biotechnol. J. 2023, 21, 4804–4815. [Google Scholar] [CrossRef] [PubMed]
- Xiao, L.; Zhang, F.; Zhao, F. Large-scale microbiome data integration enables robust biomarker identification. Nat. Comput. Sci. 2022, 2, 307–316. [Google Scholar] [CrossRef] [PubMed]
- Lin, H.; Eggesbø, M.; Peddada, S.D. Linear and nonlinear correlation estimators unveil undescribed taxa interactions in microbiome data. Nat. Commun. 2022, 13, 4946. [Google Scholar] [CrossRef] [PubMed]
- Segata, N.; Izard, J.; Waldron, L.; Gevers, D.; Miropolsky, L.; Garrett, W.S.; Huttenhower, C. Metagenomic biomarker discovery and explanation. Genome Biol. 2011, 12, R60. [Google Scholar] [CrossRef] [PubMed]
- Kajihara, K.T.; Hynson, N.A. Networks as tools for defining emergent properties of microbiomes and their stability. Microbiome 2024, 12, 184. [Google Scholar] [CrossRef] [PubMed]
- Siddiqi, M.Z.; Shafi, S.M.; Im, W.-T. Complete genome sequencing of Arachidicoccus ginsenosidimutans sp. nov., and its application for production of minor ginsenosides by finding a novel ginsenoside-transforming β-glucosidase. RSC Adv. 2017, 7, 46745–46759. [Google Scholar]
- Kielak, A.M.; Barreto, C.C.; Kowalchuk, G.A.; van Veen, J.A.; Kuramae, E.E. The Ecology of Acidobacteria: Moving beyond Genes and Genomes. Front. Microbiol. 2016, 7, 744. [Google Scholar] [CrossRef] [PubMed]
- Song, M.; Mao, Z.-B.; Liu, Y.; Wang, G.-L.; Li, F.; Zhang, L. Agriterribacter soli sp. nov., isolated from herbicide-contaminated soil. 2022, 72. [Google Scholar] [CrossRef] [PubMed]
- Liu, C.; Xu, Q.; Zhao, Z.; Zhang, H.; Liu, X.; Yin, C.; Liu, Y.; Yan, H. Genomic Analysis of Sphingopyxis sp. USTB-05 for Biodegrading Cyanobacterial Hepatotoxins. Toxins 2022, 14. [Google Scholar] [CrossRef] [PubMed]
- Hou, Y.; Li, B.; Feng, G.; Zhang, C.; He, J.; Li, H.; Zhu, J. Responses of bacterial communities and organic matter degradation in surface sediment to Macrobrachium nipponense bioturbation. Sci. Total Environ. 2021, 759, 143534. [Google Scholar] [CrossRef] [PubMed]
- Jeong, H.I.; Jin, H.M.; Jeon, C.O. Complete genome sequence of Sphingorhabdus sp. M41, a versatile hydrocarbon degrader, isolated from crude oil-contaminated costal sediment. J. Biotechnol. 2016, 227, 41–42. [Google Scholar] [CrossRef] [PubMed]
- Leung, P.M.; Daebeler, A.; Chiri, E.; Hanchapola, I.; Gillett, D.L.; Schittenhelm, R.B.; Daims, H.; Greening, C. A nitrite-oxidising bacterium constitutively consumes atmospheric hydrogen. ISME J. 2022, 16, 2213–2219. [Google Scholar] [CrossRef] [PubMed]
- Bouznif, B.; Boukherissa, A.; Jaszczyszyn, Y.; Mars, M.; Timchenko, T.; Shykoff, J.A.; Alunni, B. Complete and circularized genome sequences of five nitrogen-fixing Bradyrhizobium sp. strains isolated from root nodules of peanut. Arachis Hypogaea, Cultiv. Tunis. 2024, 13, e01078-01023. [Google Scholar] [CrossRef] [PubMed]
- Wang, M.; Pu, W.; Wang, S.; Zeng, X.; Sui, X.; Wang, X. pH-Related Changes in Soil Bacterial Communities in the Sanjiang Plain, Northeast China. Microorganisms 2023, 11. [Google Scholar] [CrossRef] [PubMed]
- Chen, L.; Shi, Y.; Wang, S.; Sun, M.; Wang, M.; Ren, X.; Gao, Z.; Zhou, Y.; Zhang, J.; Zhuang, W.; et al. Temperature and phosphorus: the main environmental factors affecting the seasonal variation of soil bacterial diversity in Nansi Lake Wetland. 2023, Volume 14 - 2023. [Google Scholar] [CrossRef] [PubMed]
- Yu, X.; Liu, J.; Zhang, R.; Liu, E.; Fang, Z.; Yun, L. Characteristics of microbial communities at different soil depths in areas subjected to cattle manure application: a 1- and 10-year comparative study. Environ. Sci. Eur. 2025, 37, 152. [Google Scholar] [CrossRef]
- Li, K.; Wan, M.; Han, M.; Yang, L. The response of Panax ginseng root microbial communities and metabolites to nitrogen addition. BMC Plant Biol. 2025, 25, 969. [Google Scholar] [CrossRef] [PubMed]
- Bertin, C.; Yang, X.; Weston, L.A. The role of root exudates and allelochemicals in the rhizosphere. Plant Soil 2003, 256, 67–83. [Google Scholar] [CrossRef]
- Sun, J.; Yang, J.; Zhao, S.; Yu, Q.; Weng, L.; Xiao, C. Root exudates influence rhizosphere fungi and thereby synergistically regulate Panax ginseng yield and quality. Front. Microbiol. 2023, 14, 1194224. [Google Scholar] [CrossRef] [PubMed]
- Hyun, T.K. Composition, Diversity, and Functional Roles of the Rhizosphere Microbiome in Panax ginseng. Plant Pathol. J. 2025, 41, 425–436. [Google Scholar] [CrossRef] [PubMed]
- Gorpenchenko, T.Y.; Sidorenko, M.L.; Kim, A.V.; Vologzhanina, Y.V.; Rusakova, D.A.; Timofeeva, Y.O.; Perepelkina, P.A.; Kazarin, V.M.; Zhuravlev, Y.N. Changes in the Composition and Properties of Cultured Bacterial Strains of Ginseng Rhizosphere According to Soil Characteristics in the Forest and Plots. 2024, 14, 3019. [Google Scholar] [CrossRef]
- Mucsi, M.; Borsodi, A.K.; Megyes, M.; Szili-Kovács, T. Response of the metabolic activity and taxonomic composition of bacterial communities to mosaically varying soil salinity and alkalinity. Sci. Rep. 2024, 14, 7460. [Google Scholar] [CrossRef] [PubMed]
- Mujakić, I.; Cabello-Yeves, P.J.; Villena-Alemany, C.; Piwosz, K.; Rodriguez-Valera, F.; Picazo, A.; Camacho, A.; Koblížek, M. Multi-environment ecogenomics analysis of the cosmopolitan phylum Gemmatimonadota. 2023, 11, e01112-01123. [Google Scholar] [CrossRef] [PubMed]
- Kim, C.; Choo, G.C.; Cho, H.S.; Lim, J.T. Soil properties of cultivation sites for mountain-cultivated ginseng at local level. J. Ginseng Res. 2015, 39, 76–80. [Google Scholar] [CrossRef] [PubMed]
- Yun, Y.B.; Park, M.; Lee, Y.; Um, Y. Investigation of Growth and Ginsenoside Content of Wild-Simulated Ginseng Cultivated in Different Vegetation Environments for Establishing a Plant Growth Model. Plants 2025, 14. [Google Scholar] [CrossRef] [PubMed]
- Gonçalves, O.S.; Fernandes, A.S.; de Sousa, T.G.G.; Santana, M.F.; Barreto, C.C. From cultivation challenges of Acidobacteriota to biotechnological promises – unveiling what is needed to fully harness their potential. World J. Microbiol. Biotechnol. 2025, 41, 208. [Google Scholar] [CrossRef] [PubMed]
- Yang, S.; Zhang, X.; Cao, Z.; Zhao, K.; Wang, S.; Chen, M.; Hu, X. Growth-promoting Sphingomonas paucimobilis ZJSH1 associated with Dendrobium officinale through phytohormone production and nitrogen fixation. Microb. Biotechnol. 2014, 7, 611–620. [Google Scholar] [CrossRef] [PubMed]
- Wang, F.; Wei, Y.; Yan, T.; Wang, C.; Chao, Y.; Jia, M.; An, L.; Sheng, H. Sphingomonas sp. Hbc-6 alters physiological metabolism and recruits beneficial rhizosphere bacteria to improve plant growth and drought tolerance. Front. Plant Sci. 2022, 13, 1002772. [Google Scholar] [CrossRef] [PubMed]
- Santos, S.S.; Rask, K.A.; Vestergård, M.; Johansen, J.L.; Priemé, A.; Frøslev, T.G.; González, A.M.M.; He, H.; Ekelund, F. Specialized microbiomes facilitate natural rhizosphere microbiome interactions counteracting high salinity stress in plants. Environ. Exp. Bot. 2021, 186, 104430. [Google Scholar] [CrossRef]
- Asaf, S.; Numan, M.; Khan, A.L.; Al-Harrasi, A. Sphingomonas: from diversity and genomics to functional role in environmental remediation and plant growth. Crit. Rev. Biotechnol. 2020, 40, 138–152. [Google Scholar] [CrossRef] [PubMed]
- Yu, F.M.; Jayawardena, R.S.; Thongklang, N.; Lv, M.L.; Zhu, X.T.; Zhao, Q. Morel Production Associated with Soil Nitrogen-Fixing and Nitrifying Microorganisms. J. Fungi 2022, 8. [Google Scholar] [CrossRef] [PubMed]
- Miao, Y.; Johnson, N.W.; Gedalanga, P.B.; Adamson, D.; Newell, C.; Mahendra, S. Response and recovery of microbial communities subjected to oxidative and biological treatments of 1,4-dioxane and co-contaminants. Water Res. 2019, 149, 74–85. [Google Scholar] [CrossRef] [PubMed]
- Ren, L.; Li, Y.; Tian, X.; Guo, Y.; Xian, Y.; Pang, M.; Zhang, Z. Shaping of the core microbiome by ginsenosides in American ginseng across diverse habitats. Sci. Rep. 2025, 15, 35702. [Google Scholar] [CrossRef] [PubMed]
- Oubohssaine, M.; Hnini, M.; Rabeh, K. Exploring lipid signaling in plant physiology: From cellular membranes to environmental adaptation. J. Plant Physiol. 2024, 300, 154295. [Google Scholar] [CrossRef] [PubMed]
- Kuźniak, E.; Gajewska, E. Lipids and Lipid-Mediated Signaling in Plant–Pathogen Interactions. 2024, 25, 7255. [Google Scholar] [CrossRef] [PubMed]
- Amon, C.E.R.; Fossou, R.K.; Ebou, A.E.T.; Koua, D.K.; Kouadjo, C.G.; Brou, Y.C.; Voko Bi, D.R.R.; Cowan, D.A.; Zézé, A. The core bacteriobiome of Côte d’Ivoire soils across three vegetation zones. 2023, Volume 14 - 2023. [Google Scholar] [CrossRef] [PubMed]
- Karapareddy, S.; Anche, V.C.; Tamatamu, S.R.; Janga, M.R.; Lawrence, K.; Nyochembeng, L.M.; Todd, A.; Walker, L.T.; Sripathi, V.R. Profiling of rhizosphere-associated microbial communities in North Alabama soils infested with varied levels of reniform nematodes. Front. Plant Sci. 2025, 16, 1521579. [Google Scholar] [CrossRef] [PubMed]
- Pershina, E.V.; Ivanova, E.A.; Korvigo, I.O.; Chirak, E.L.; Sergaliev, N.H.; Abakumov, E.V.; Provorov, N.A.; Andronov, E.E. Investigation of the core microbiome in main soil types from the East European plain. Sci. Total Environ. 2018, 631-632, 1421–1430. [Google Scholar] [CrossRef] [PubMed]
- Yu, S.; Wu, Q.; Ma, Y.; Bano, S.; Zhang, X. Keystone bacterial taxa drive denitrification and N(2)O emission via adaptive genomic and metabolic strategies in contrasting agricultural soils. Environ. Microbiome 2026, 21. [Google Scholar] [CrossRef] [PubMed]
- Wei, L.; Wang, Y.; Li, N.; Zhao, N.; Xu, S. Bacteria-Like Gaiella Accelerate Soil Carbon Loss by Decomposing Organic Matter of Grazing Soils in Alpine Meadows on the Qinghai-Tibet Plateau. Microb. Ecol. 2024, 87, 104. [Google Scholar] [CrossRef] [PubMed]
- Li, S.; Li, X.; Ye, Y.; Chen, M.; Chen, H.; Yang, D.; Li, M.; Jiang, F.; Zhang, X.; Zhang, C. The rhizosphere microbiome and its influence on the accumulation of metabolites in Bletilla striata (Thunb.) Reichb. f. BMC Plant Biol. 2024, 24, 409. [Google Scholar] [CrossRef] [PubMed]
- Pokharel, S.S.; Ali, Z.; Wang, C.; Jiang, X.; Chen, F. Leguminous Cover Crops Promote Microbial Community Diversity in the Rhizosphere Soil of Tea Plants: Insights from 16S rRNA Microbiome Analysis. 2025, 15, 2217. [Google Scholar] [CrossRef]
- Yu-Shun, L.; Shan-Shan, L.; Ji-Yue, S.; Jian-Bo, C.; Xiao-Hui, H.; Yan-Yang, X. Di(2-ethylhexyl) phthalate reduces the ginsenoside content in Panax ginseng root exudates by disrupting rhizosphere microbe-mediated soil nitrogen cycling. Appl. Soil Ecol. 2025, 216, 106560. [Google Scholar] [CrossRef]
- Dedysh, S.N.; Kulichevskaya, I.S.; Huber, K.J.; Overmann, J. Defining the taxonomic status of described subdivision 3 Acidobacteria: proposal of Bryobacteraceae fam. nov. Int. J. Syst. Evol. Microbiol. 2017, 67, 498–501. [Google Scholar] [CrossRef] [PubMed]
- Huai-di, P.; Bing-bing, S.; Qi, L.; Yu-bin, L.; Shu-jie, L.; Li-guang, W.; Min-min, Z.; You-tai, S. Response of rhizosphere bacterial community structure to nitrogen application rate during ginseng fruit (Solanum muricatum Aiton) growth stages. J. Plant Nutr. Fertil. 2023, 29, 1125–1134. [Google Scholar] [CrossRef]
- Das, D.; Riamei, M.; Paul, P.; Singh, N.; Ingti, B.; Sarkar, R.D.; Rose, R.; Sharma, P.L.; Paul, S. Understanding the role of soil microorganisms in alleviating hydric and edaphic stress towards sustainable agriculture. Discov. Soil 2025, 2, 47. [Google Scholar] [CrossRef]
- McGivern, B.B.; Tfaily, M.M.; Borton, M.A.; Kosina, S.M.; Daly, R.A.; Nicora, C.D.; Purvine, S.O.; Wong, A.R.; Lipton, M.S.; Hoyt, D.W.; et al. Decrypting bacterial polyphenol metabolism in an anoxic wetland soil. Nat. Commun. 2021, 12, 2466. [Google Scholar] [CrossRef] [PubMed]
- Zhang, T.; Xu, Z.; Wang, Y.; Gao, Q. Effects of soil properties and microbial community composition on ginsenosides accumulation in farmland ginseng. Front. Bioeng. Biotechnol. 2024, 12, 1462342. [Google Scholar] [CrossRef] [PubMed]
- Revellat, E.; Dupont-Morissette, J.; T, V.V.; Pilon, G.; Marette, A.; Bazinet, L. Coupled Impact of Anthocyanin and Mineral Concentrations in Cranberry Juice on Gut Microbiota and Function Modulation: A First Demonstration. Molecules 2025, 30. [Google Scholar] [CrossRef] [PubMed]
- Yang, Y.; Hong, Q.; Zhang, X.; Liu, Z. Protective effect of a combination of multiple strains of Lactobacillus acidophilus on collagen-induced arthritis. Food Funct. 2025, 16, 943–965. [Google Scholar]
- Zhong, C.; Hu, G.; Hu, C.; Xu, C.; Zhang, Z.; Ning, K. Comparative genomics analysis reveals genetic characteristics and nitrogen fixation profile of Bradyrhizobium. iScience 2024, 27, 108948. [Google Scholar] [CrossRef] [PubMed]
- Mueller, A.J.; Daebeler, A.; Herbold, C.W.; Kirkegaard, R.H.; Daims, H. Cultivation and genomic characterization of novel and ubiquitous marine nitrite-oxidizing bacteria from the Nitrospirales. ISME J. 2023, 17, 2123–2133. [Google Scholar] [CrossRef] [PubMed]
- Rajguru, B.; Shri, M.; Bhatt, B.; Bhatt, V.D. Comparative metagenomic analysis of rhizospheric soil of Mangifera indica (mango) and Carica papaya (papaya). Discov. Plants 2025, 2, 71. [Google Scholar] [CrossRef]
- Berry, D.; Widder, S. Deciphering microbial interactions and detecting keystone species with co-occurrence networks. 2014, Volume 5 - 2014. [Google Scholar] [CrossRef] [PubMed]
- Röttjers, L.; Faust, K. From hairballs to hypotheses-biological insights from microbial networks. FEMS Microbiol. Rev. 2018, 42, 761–780. [Google Scholar] [CrossRef] [PubMed]
- Gao, C.; Xu, L.; Montoya, L.; Madera, M.; Hollingsworth, J.; Chen, L.; Purdom, E.; Singan, V.; Vogel, J.; Hutmacher, R.B.; et al. Co-occurrence networks reveal more complexity than community composition in resistance and resilience of microbial communities. Nat. Commun. 2022, 13, 3867. [Google Scholar] [CrossRef] [PubMed]
- Zhang, Y.; Schluter, J.; Zhang, L.; Cao, X.; Jenq, R.R.; Feng, H.; Haines, J.; Zhang, L. Review and revamp of compositional data transformation: A new framework combining proportion conversion and contrast transformation. Comput. Struct. Biotechnol. J. 2024, 23, 4088–4107. [Google Scholar] [CrossRef] [PubMed]
- Callahan, B.J.; McMurdie, P.J.; Rosen, M.J.; Han, A.W.; Johnson, A.J.; Holmes, S.P. DADA2: High-resolution sample inference from Illumina amplicon data. Nat. Methods 2016, 13, 581–583. [Google Scholar] [CrossRef] [PubMed]
- Chuvochina, M.; Gerken, J.; Frentrup, M.; Sandikci, Y.; Goldmann, R.; Freese, H.M.; Göker, M.; Sikorski, J.; Yarza, P.; Quast, C.; et al. SILVA in 2026: a global core biodata resource for rRNA within the DSMZ digital diversity. Nucleic Acids Research 2026, 54, D334–D341. [Google Scholar]
- Shen, Z.; Thomashow, L.S.; Ou, Y.; Tao, C.; Wang, J.; Xiong, W.; Liu, H.; Li, R.; Shen, Q.; Kowalchuk, G.A. Shared Core Microbiome and Functionality of Key Taxa Suppressive to Banana Fusarium Wilt. <italic>Research (Washington, D.C.) 2022, 2022, 9818073. [CrossRef] [PubMed]
- Braglia, C.; Cutajar, S.; Magagnoli, S.; Asciano, D.; Burgio, G.; Di Gioia, D.; Baffoni, L.; Alberoni, D. The Ground Beetle Poecilus (Carabidae) Gut Microbiome and Its Functionality. Microb. Ecol. 2025, 88, 83. [Google Scholar] [CrossRef] [PubMed]
- Fagnano, F.M.; Ventorino, V.; Pasolli, E.; Romano, I.; Ambrosino, P.; Pepe, O. From microbiome to biostimulants: unlocking the potential of tomato root endophytes. BMC Plant Biol. 2025, 25, 427. [Google Scholar] [CrossRef] [PubMed]
- Liu, S.; Wu, D.; Ma, W.; Wang, T.; Yan, B.; Ge, Y.; Xiong, F.; Wang, H.; Kang, C. Metabolomics and Microbiomics Reveal the Cultivation-Dependent Divergence in Ginsenoside Biosynthesis and Rhizosphere Ecology of Panax ginseng. Metabolites 2026, 16. [Google Scholar] [CrossRef] [PubMed]
Figure 1.
Regional patterns of within-sample bacterial alpha diversity. Shannon diversity indices were measured for (A) V3–V4 profiles from Chinese regional groups and (B) V4 profiles from South Korean regional groups. Boxplots display medians, interquartile ranges, and overall ranges, with individual data points signifying SRA samples. Regional variations were evaluated using the Kruskal–Wallis test (p < 0.001).
Figure 1.
Regional patterns of within-sample bacterial alpha diversity. Shannon diversity indices were measured for (A) V3–V4 profiles from Chinese regional groups and (B) V4 profiles from South Korean regional groups. Boxplots display medians, interquartile ranges, and overall ranges, with individual data points signifying SRA samples. Regional variations were evaluated using the Kruskal–Wallis test (p < 0.001).
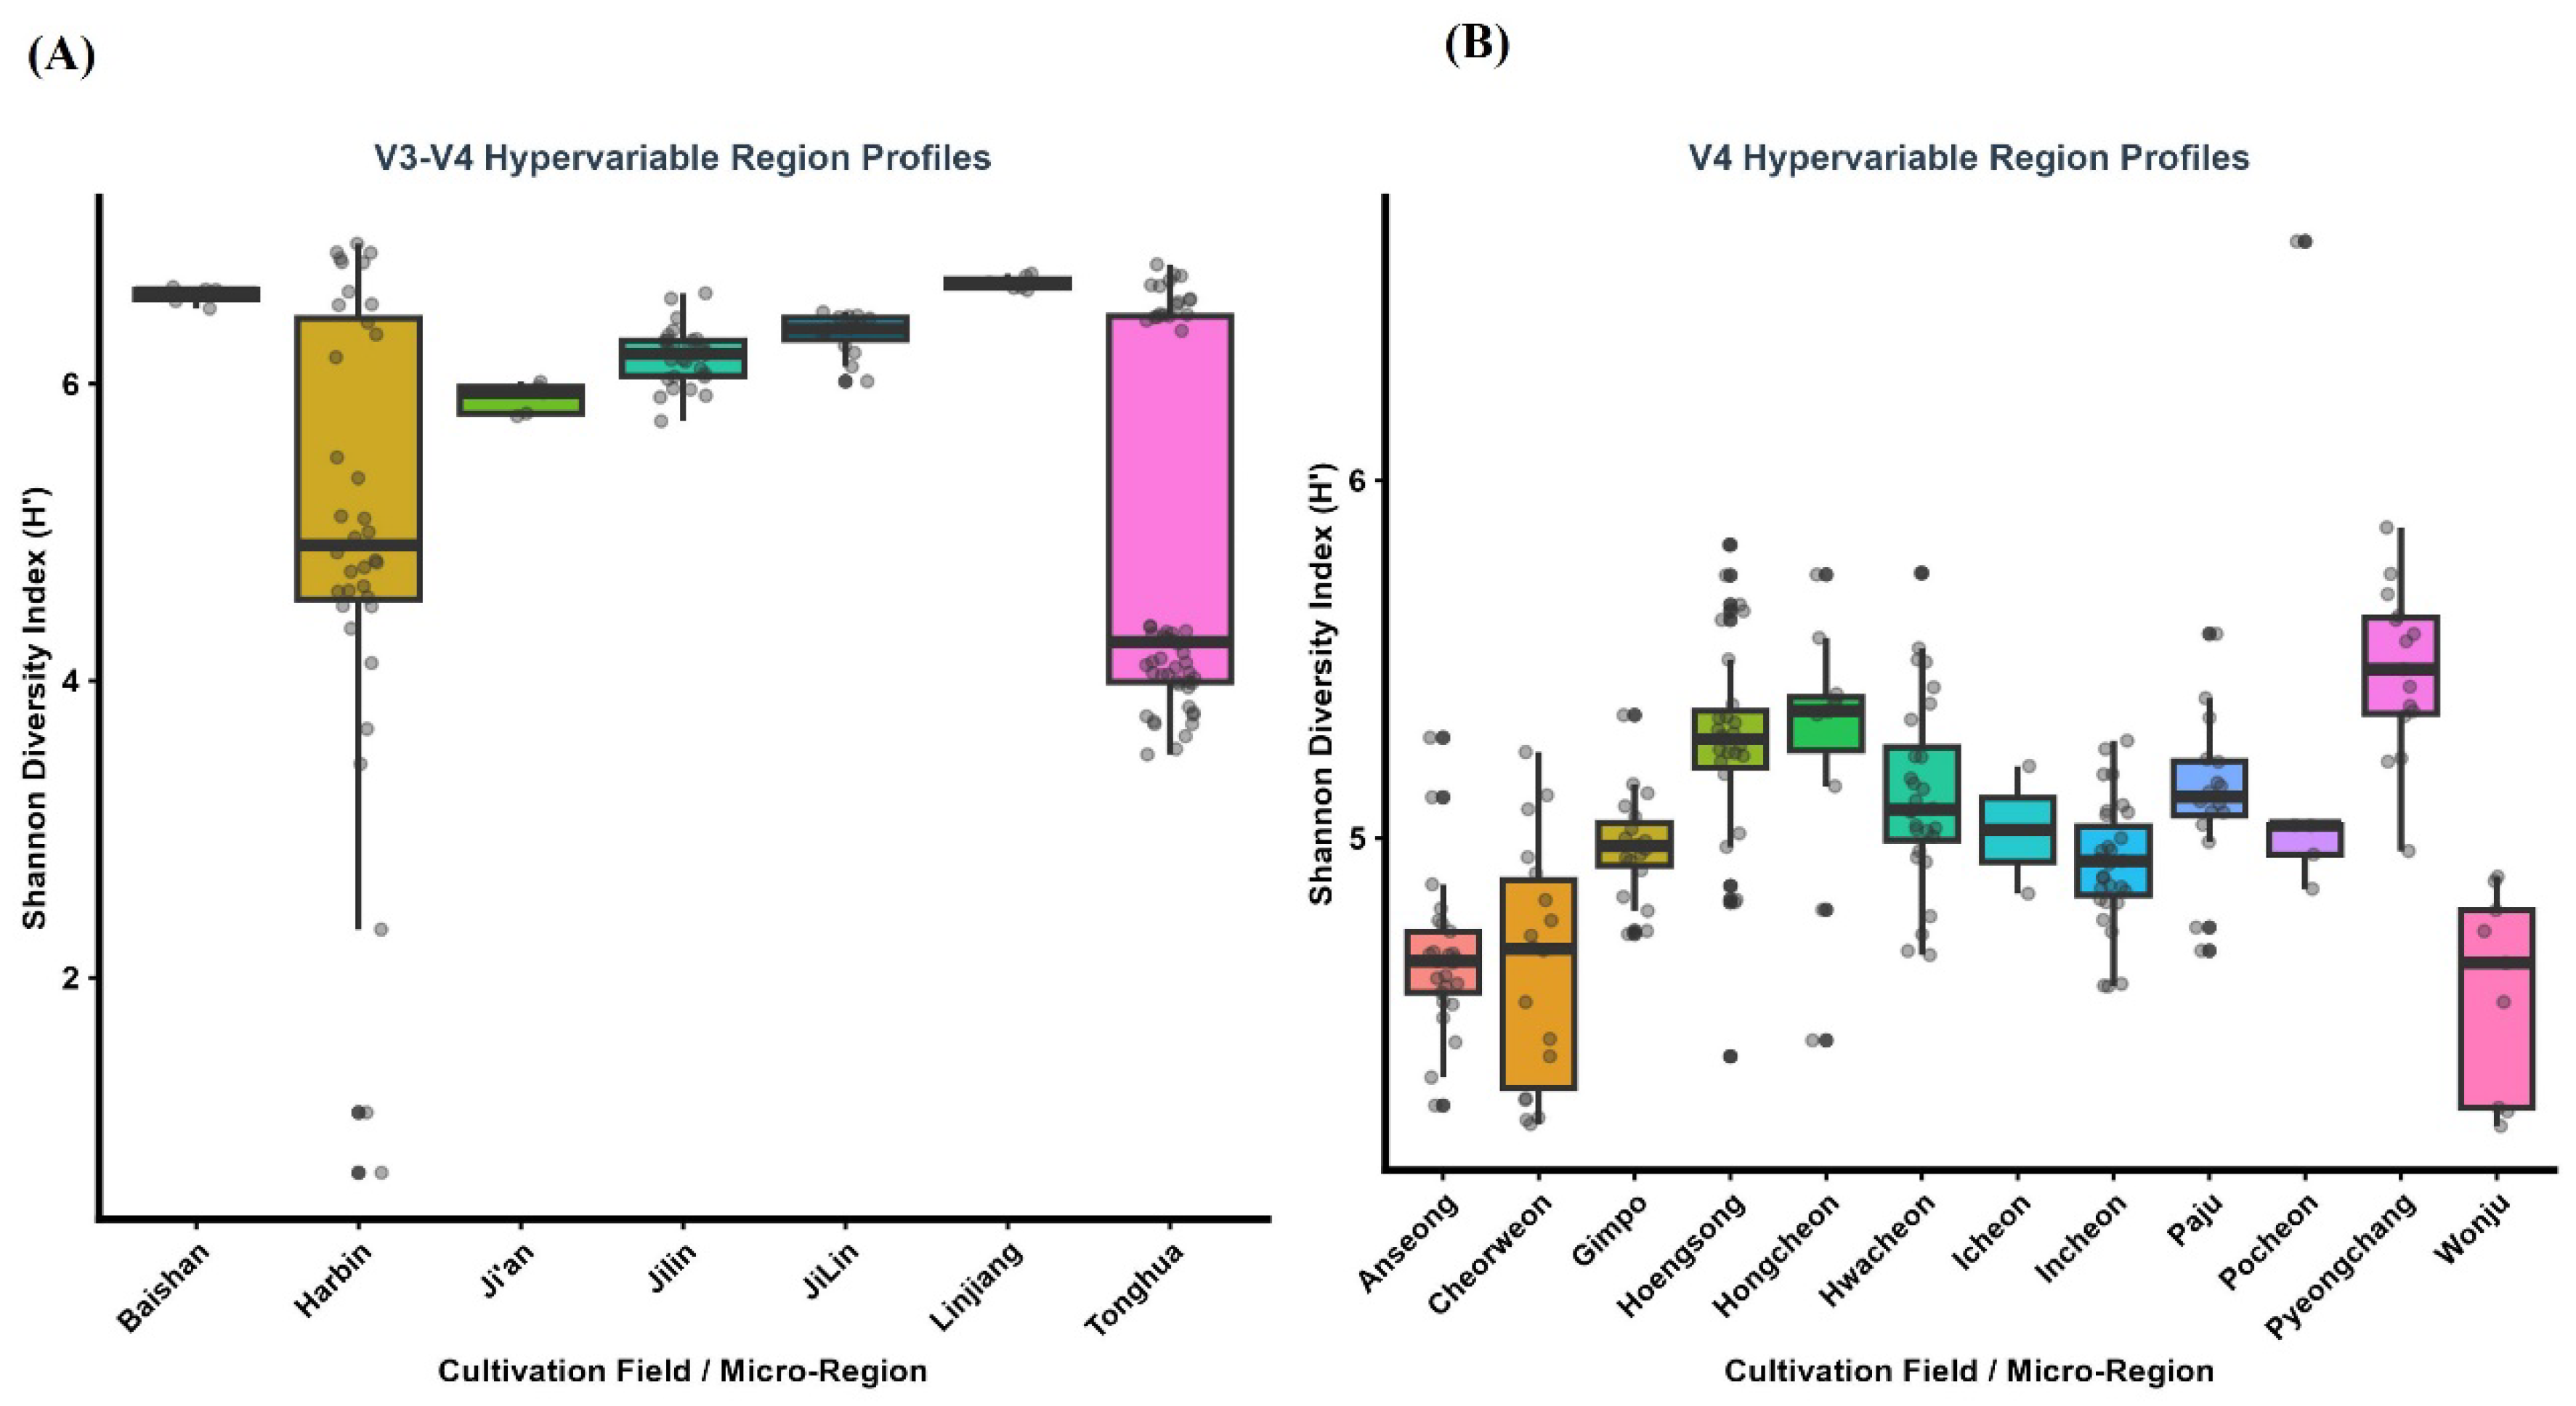
Figure 2.
Ordination of beta diversity and community clustering among regional cohorts. Principal coordinate analysis (PCoA) utilizing Bray-Curtis dissimilarity matrices for (A) the combined V3–V4 hypervariable region track (Tracks 2 & 3) and (B) the V4 hypervariable region track (Track 1). Ellipses denote 95% confidence intervals encircling micro-regional centroids. Statistical differentiation among regional cultivation areas was assessed through permutational multivariate analysis of variance (PERMANOVA; 999 permutations), incorporating pseudo-F statistics, effect sizes (R2), and significance levels (p-value) noted within each panel.
Figure 2.
Ordination of beta diversity and community clustering among regional cohorts. Principal coordinate analysis (PCoA) utilizing Bray-Curtis dissimilarity matrices for (A) the combined V3–V4 hypervariable region track (Tracks 2 & 3) and (B) the V4 hypervariable region track (Track 1). Ellipses denote 95% confidence intervals encircling micro-regional centroids. Statistical differentiation among regional cultivation areas was assessed through permutational multivariate analysis of variance (PERMANOVA; 999 permutations), incorporating pseudo-F statistics, effect sizes (R2), and significance levels (p-value) noted within each panel.
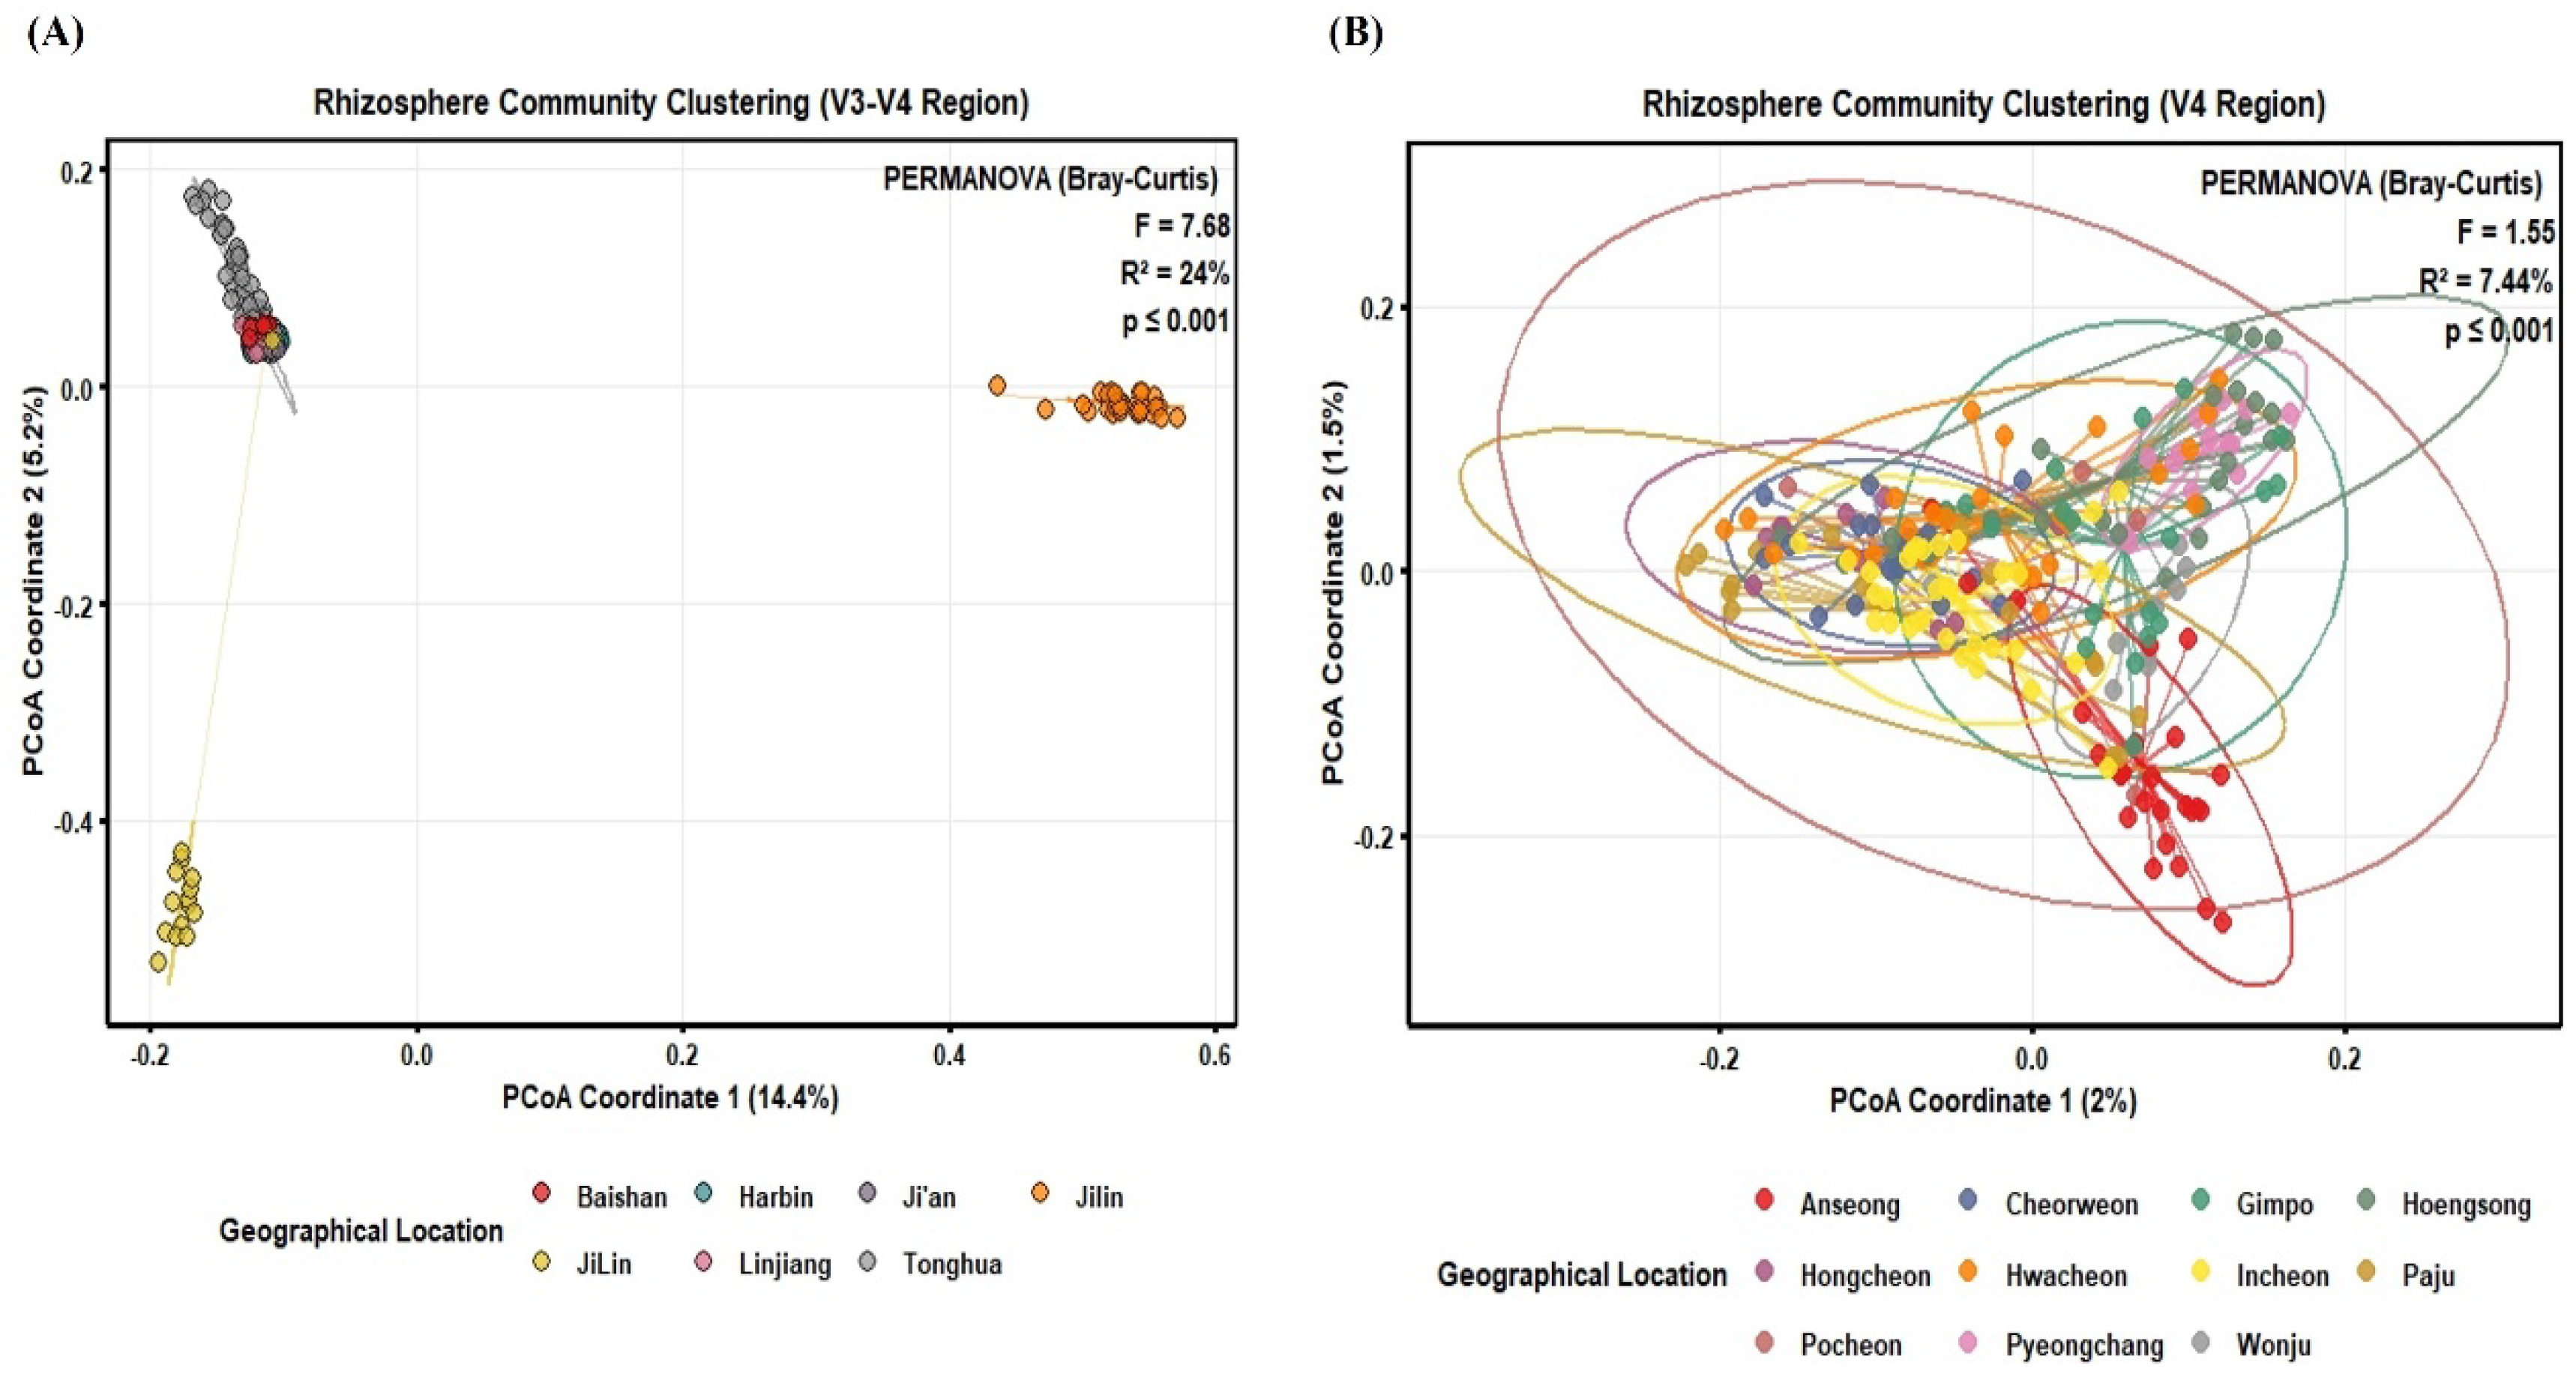
Figure 3.
Major enriched bacterial genera related to regional niche variation in the Panax ginseng rhizosphere. Differentially abundant genera among geographic regions were detected using the non-parametric Kruskal–Wallis test (p < 0.05). The top 20 genera were arranged based on −log₁₀(p-value) for (A) the integrated V3–V4 dataset (Tracks 2 and 3) and (B) the V4 dataset (Track 1).
Figure 3.
Major enriched bacterial genera related to regional niche variation in the Panax ginseng rhizosphere. Differentially abundant genera among geographic regions were detected using the non-parametric Kruskal–Wallis test (p < 0.05). The top 20 genera were arranged based on −log₁₀(p-value) for (A) the integrated V3–V4 dataset (Tracks 2 and 3) and (B) the V4 dataset (Track 1).
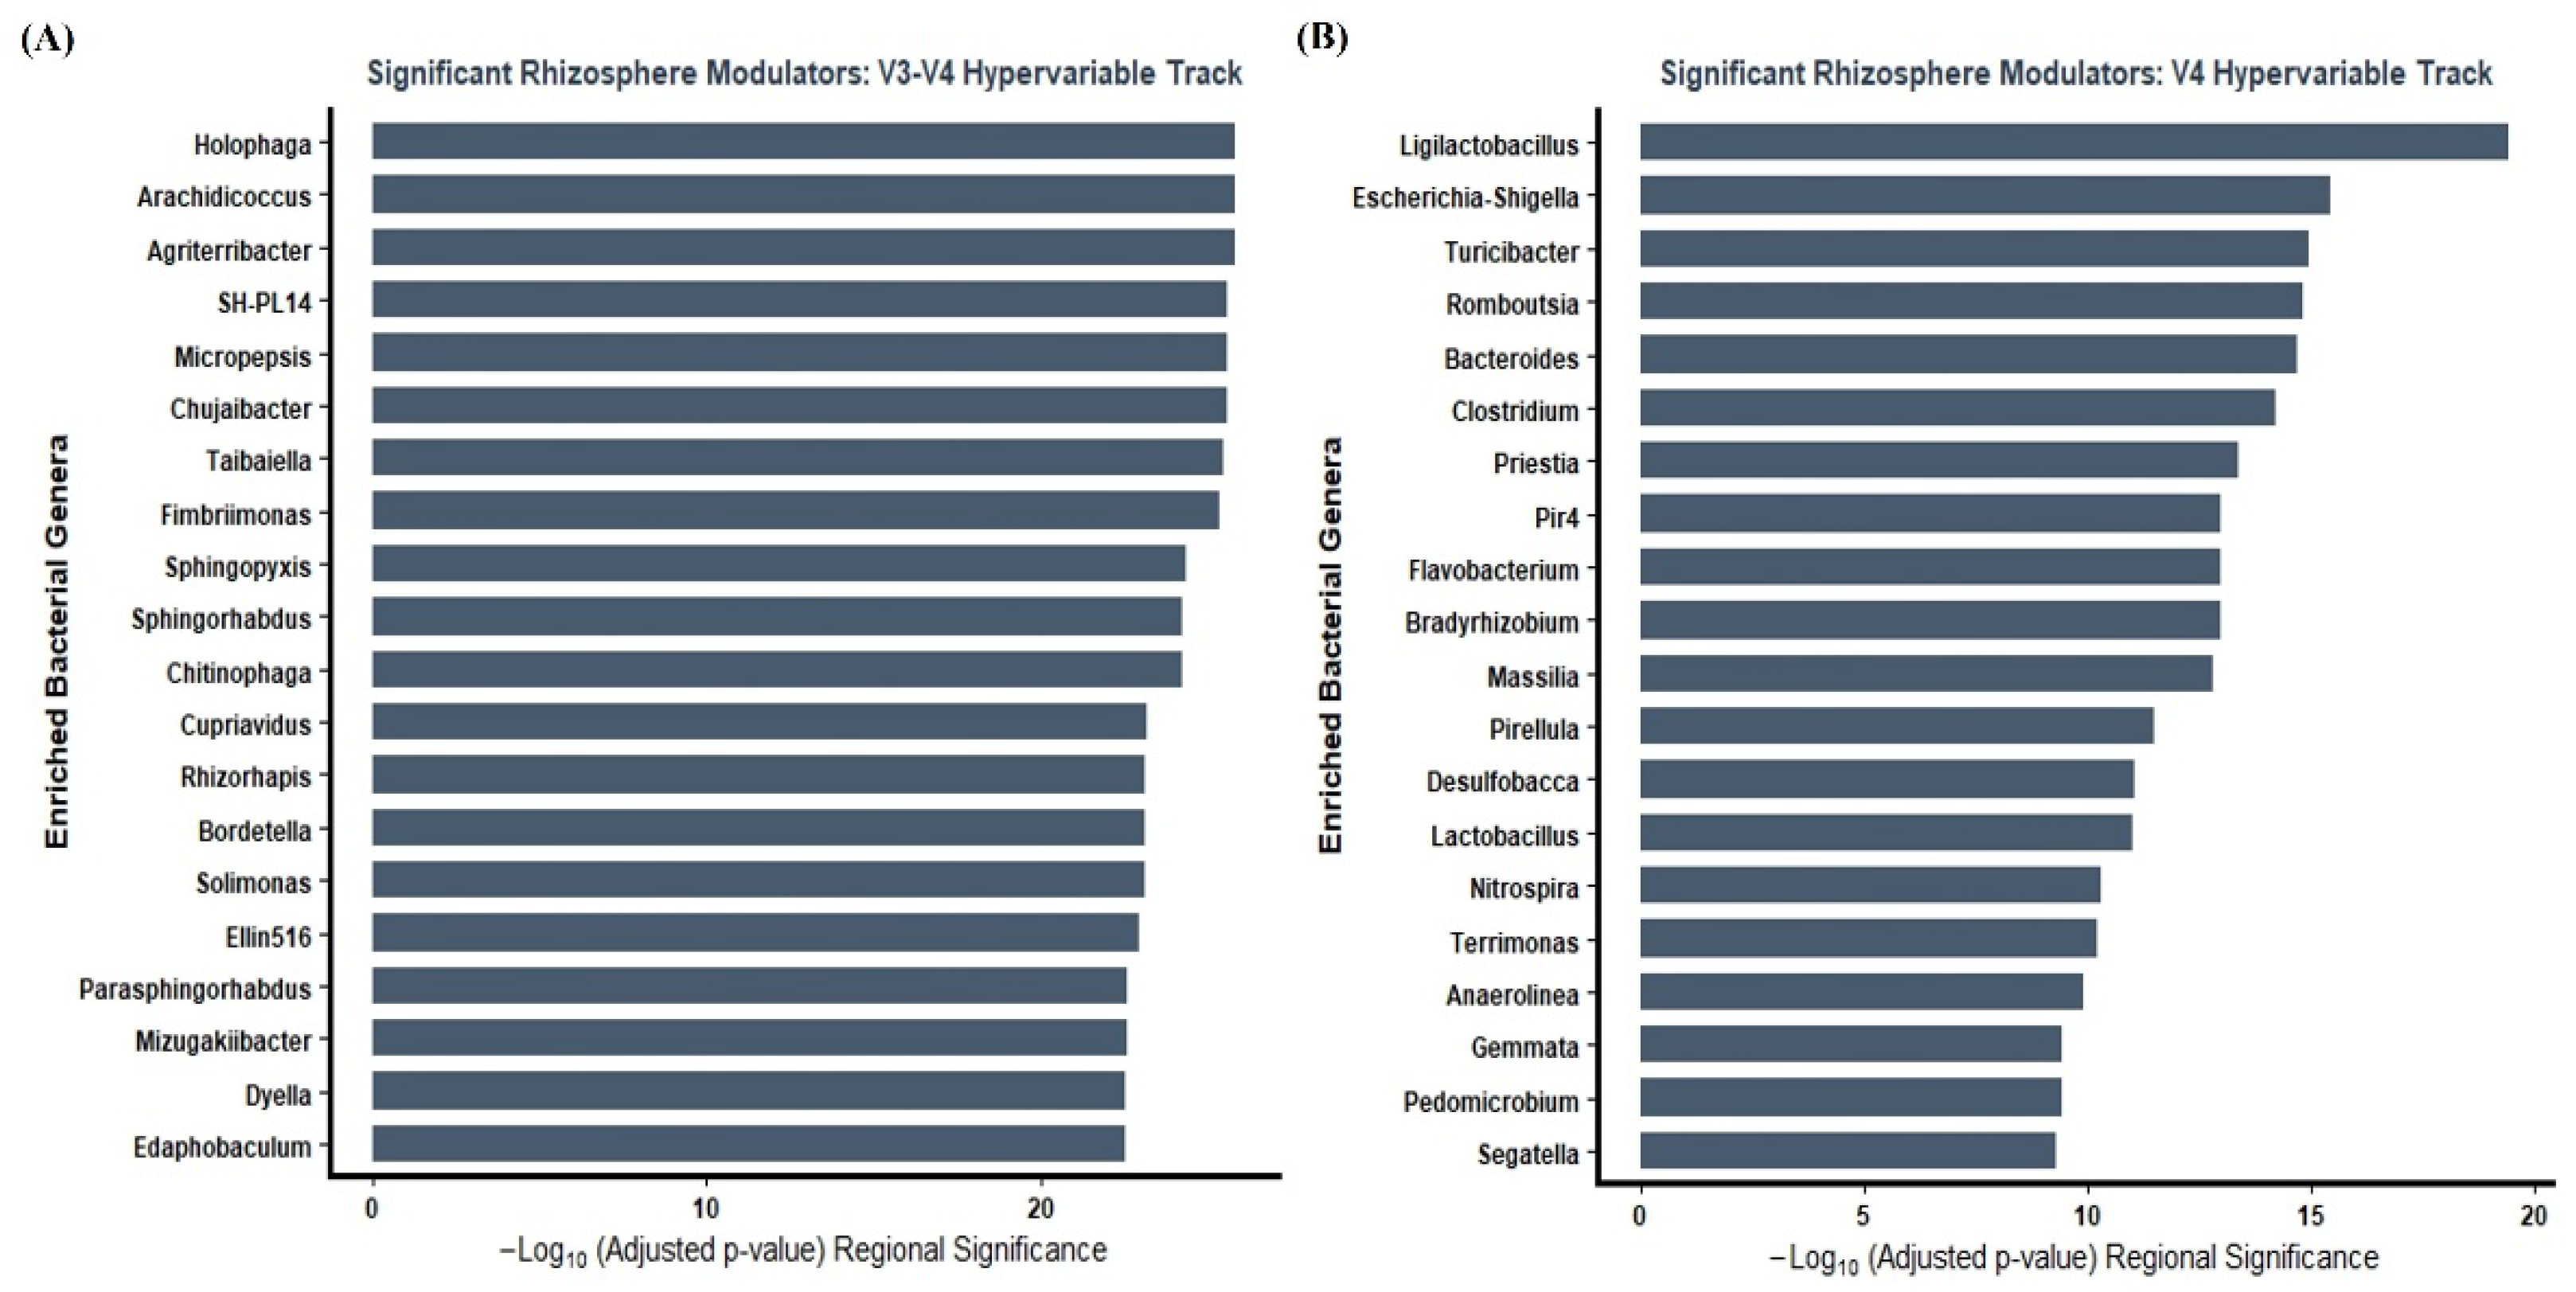
Figure 4.
Predicted functional niche shifts across regional Panax ginseng rhizosphere samples. Four main eco-functional categories were identified from the differentially abundant bacterial genera (p < 0.05, Kruskal–Wallis test): carbon cycling (root exudate fermentation), environmental sensing (diurnal synchrony signaling), nutrient mobilization (assimilation of nitrogen and aromatic compounds), and plant defense priming (induced systemic resistance; ISR). The statistical significance of bacterial taxa linked to these functional categories in (A) the combined V3–V4 dataset and (B) the V4 dataset is shown by bars that show −log₁₀(p-value).
Figure 4.
Predicted functional niche shifts across regional Panax ginseng rhizosphere samples. Four main eco-functional categories were identified from the differentially abundant bacterial genera (p < 0.05, Kruskal–Wallis test): carbon cycling (root exudate fermentation), environmental sensing (diurnal synchrony signaling), nutrient mobilization (assimilation of nitrogen and aromatic compounds), and plant defense priming (induced systemic resistance; ISR). The statistical significance of bacterial taxa linked to these functional categories in (A) the combined V3–V4 dataset and (B) the V4 dataset is shown by bars that show −log₁₀(p-value).
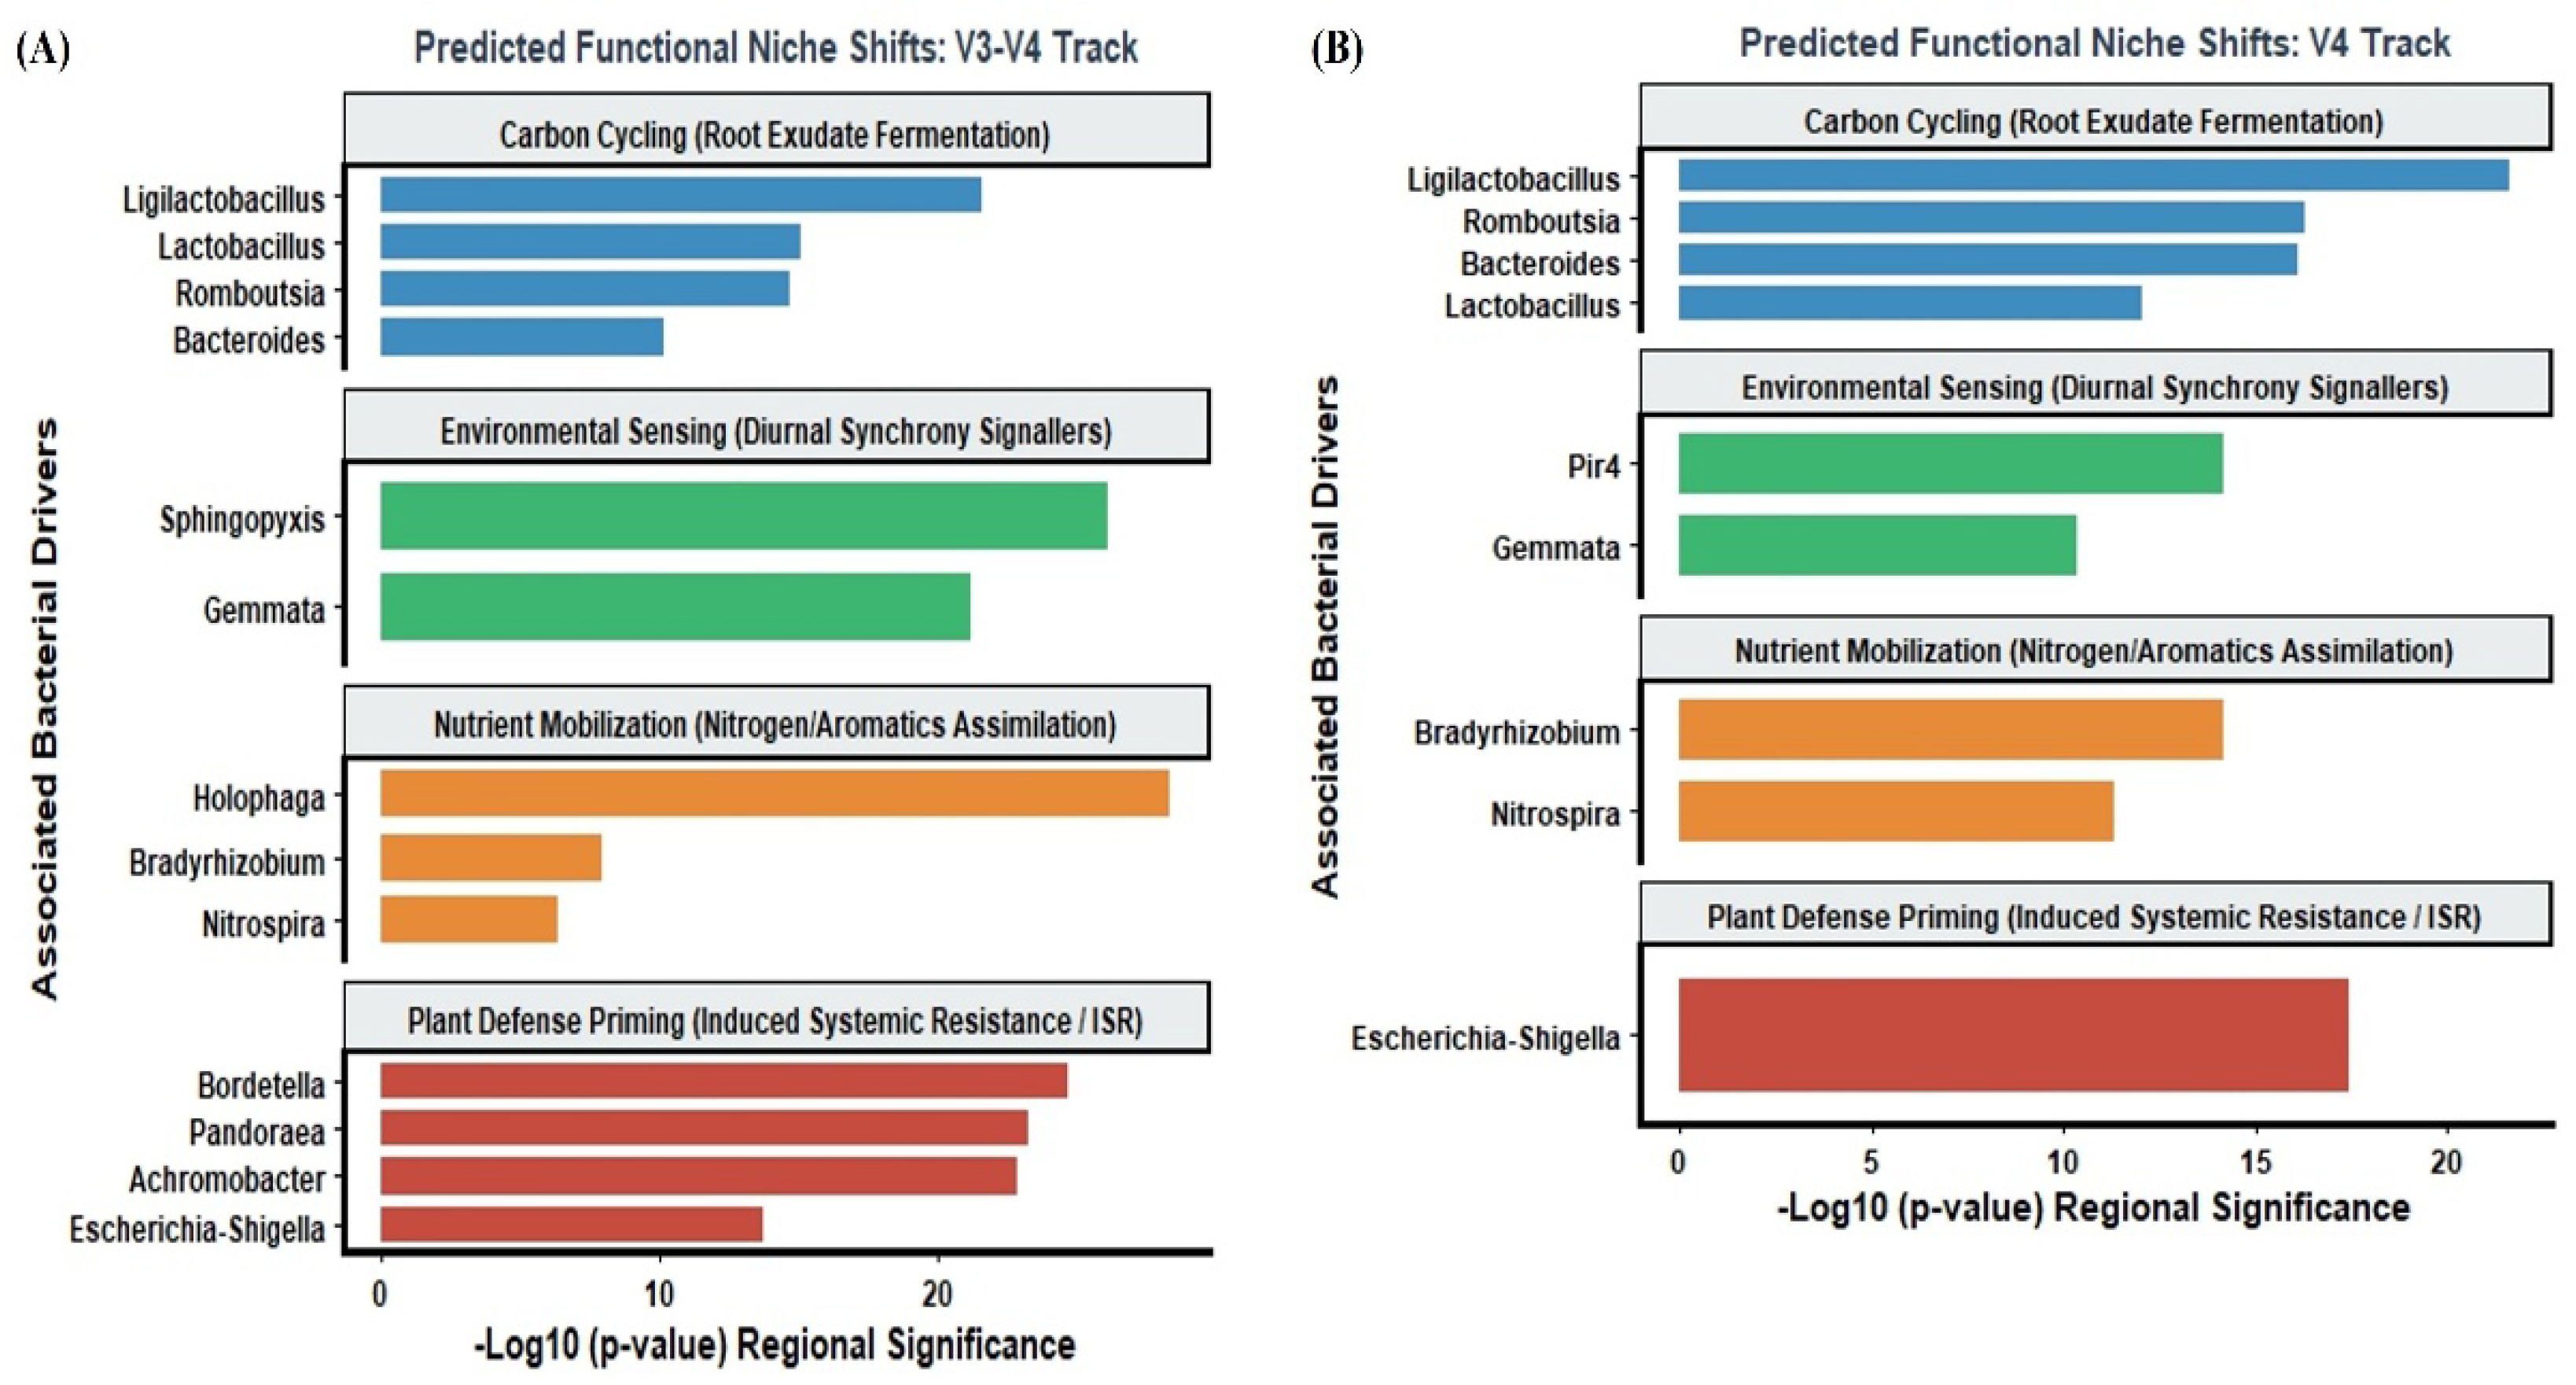
Figure 5.
Networks of bacterial co-occurrence in the rhizosphere based on 16S rRNA marker regions. Co-occurrence networks are presented for (A) the V3–V4 and (B) V4 profiling datasets. The nodes signify bacterial taxa, with the size of the nodes reflecting degree centrality. Edges signify notable associations with |r| > 0.55, and the width of the edges reflects the strength of the absolute association (AbsWeight). Blue edges signify positive connections, whereas red edges indicate negative connections.
Figure 5.
Networks of bacterial co-occurrence in the rhizosphere based on 16S rRNA marker regions. Co-occurrence networks are presented for (A) the V3–V4 and (B) V4 profiling datasets. The nodes signify bacterial taxa, with the size of the nodes reflecting degree centrality. Edges signify notable associations with |r| > 0.55, and the width of the edges reflects the strength of the absolute association (AbsWeight). Blue edges signify positive connections, whereas red edges indicate negative connections.
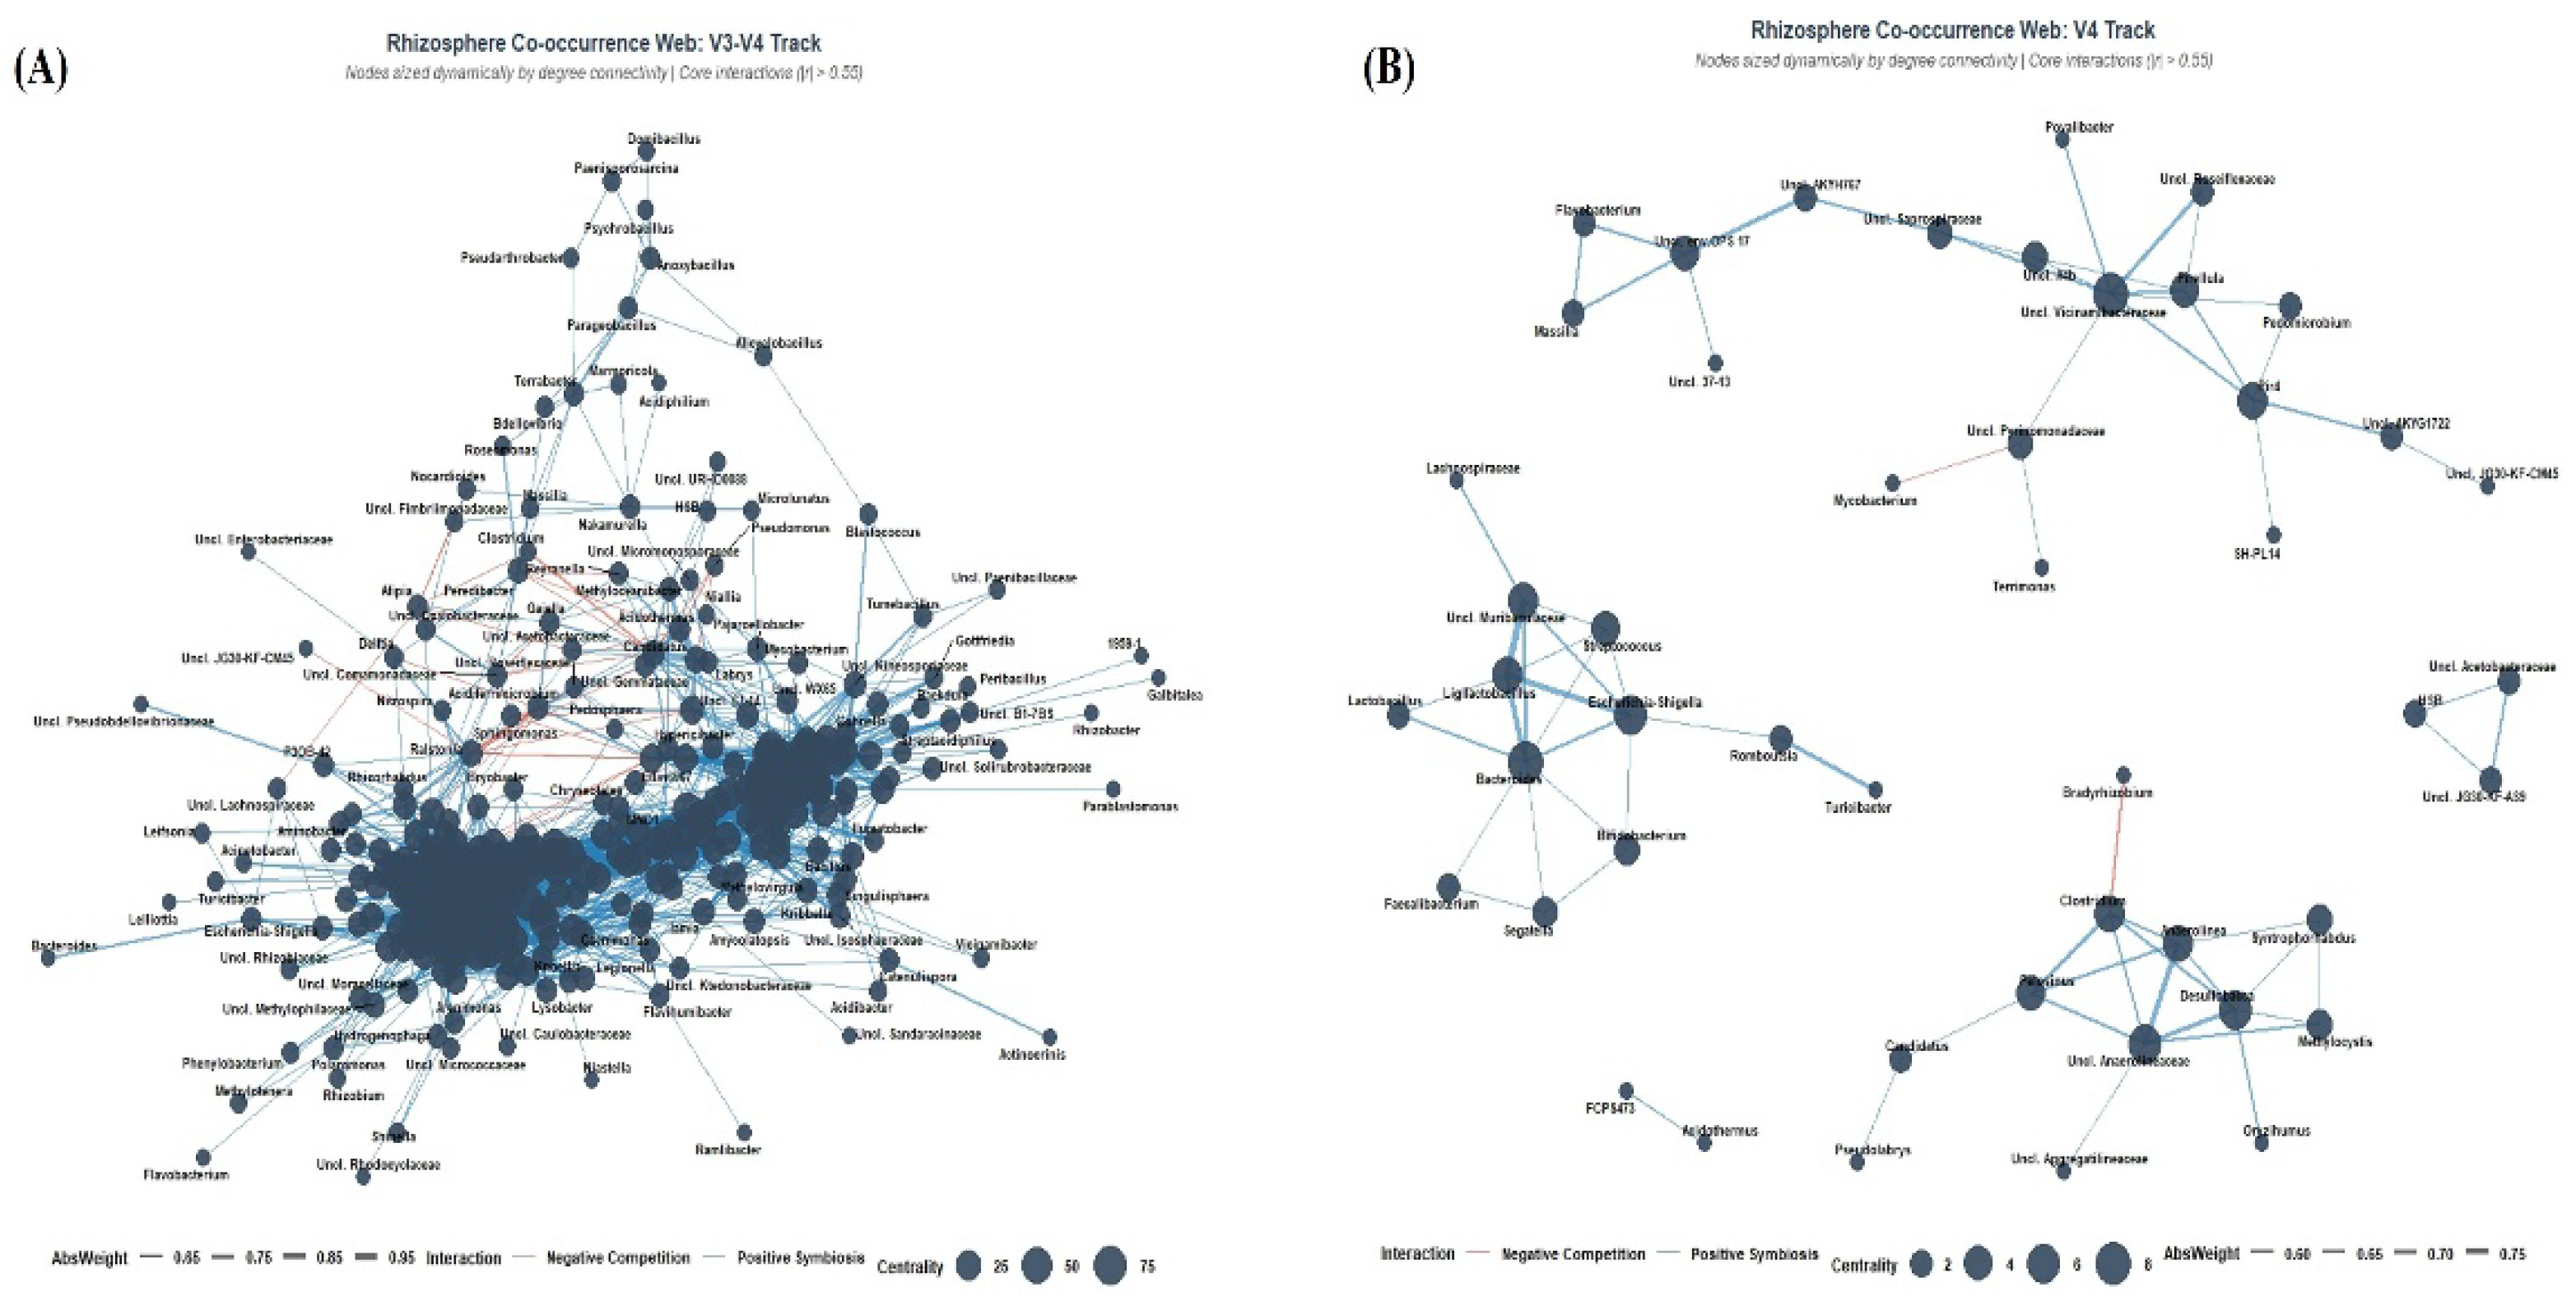

Table 1.
Core bacterial microbiome comprising 37 taxa in the Panax ginseng rhizosphere samples.
| Kingdom | Phylum | Class | Order | Family | Genus | Mean Relative Abundance (%) |
| Bacteria | Pseudomonadota | Alphaproteobacteria | Hyphomicrobiales | Xanthobacteraceae | Unclassified Xanthobacteraceae | 2.385 |
| Bacteria | Gemmatimonadota | Gemmatimonadia | Gemmatimonadales | Gemmatimonadaceae | Unclassified Gemmatimonadaceae | 2.043 |
| Bacteria | Acidobacteriota | Vicinamibacteria | Vicinamibacterales | Incertae Sedis | Unclassified Bacteria | 1.955 |
| Bacteria | Actinomycetota | Thermoleophilia | Gaiellales | Gaiellaceae | Gaiella | 1.828 |
| Bacteria | Actinomycetota | Acidimicrobiia | Acidimicrobiales | Acidimicrobiaceae | Acidiferrimicrobium | 1.027 |
| Bacteria | Actinomycetota | Actinobacteria | Mycobacteriales | Mycobacteriaceae | Mycobacterium | 0.919 |
| Bacteria | Chloroflexota | TK10 | Incertae Sedis | Incertae Sedis | Unclassified Bacteria | 0.471 |
| Bacteria | Acidobacteriota | Acidobacteriae | Terriglobales | Incertae Sedis | Unclassified Bacteria | 4.985 |
| Bacteria | Acidobacteriota | Vicinamibacteria | Vicinamibacterales | Incertae Sedis | Unclassified Bacteria | 3.24 |
| Bacteria | Gemmatimonadota | Gemmatimonadia | Gemmatimonadales | Gemmatimonadaceae | Unclassified Gemmatimonadaceae | 3.089 |
| Bacteria | Pseudomonadota | Alphaproteobacteria | Hyphomicrobiales | Xanthobacteraceae | Pseudolabrys | 1.909 |
| Bacteria | Pseudomonadota | Alphaproteobacteria | Sphingomonadales | Sphingomonadaceae | Sphingomonas | 1.895 |
| Bacteria | Pseudomonadota | Gammaproteobacteria | Burkholderiales | SC-I-84 | Unclassified SC-I-84 | 1.707 |
| Bacteria | Actinomycetota | Thermoleophilia | Gaiellales | Incertae Sedis | Unclassified Bacteria | 1.523 |
| Bacteria | Acidobacteriota | Acidobacteriae | Bryobacterales | Bryobacteraceae | Bryobacter | 1.456 |
| Bacteria | Chloroflexota | KD4-96 | Incertae Sedis | Incertae Sedis | Unclassified Bacteria | 1.422 |
| Bacteria | Pseudomonadota | Gammaproteobacteria | Gammaproteobacteria Incertae Sedis | Unknown Family | Acidibacter | 1.247 |
| Bacteria | Acidobacteriota | Holophagae | Subgroup 7 | Incertae Sedis | Unclassified Bacteria | 1.197 |
| Bacteria | Actinomycetota | Thermoleophilia | Gaiellales | Gaiellaceae | Gaiella | 1.16 |
| Bacteria | Bacillota | Clostridia | Clostridiales | Clostridiaceae | Clostridium | 1.086 |
| Bacteria | Chloroflexota | Ktedonobacteria | C0119 | Incertae Sedis | Unclassified Bacteria | 1.065 |
| Bacteria | Gemmatimonadota | Gemmatimonadia | Gemmatimonadales | Gemmatimonadaceae | Gemmatimonas | 0.953 |
| Bacteria | Verrucomicrobiota | Verrucomicrobiia | Pedosphaerales | Pedosphaeraceae | Unclassified Pedosphaeraceae | 0.897 |
| Bacteria | Verrucomicrobiota | Verrucomicrobiia | Chthoniobacterales | Chthoniobacteraceae | Candidatus | 0.858 |
| Bacteria | Actinomycetota | Actinobacteria | Mycobacteriales | Mycobacteriaceae | Mycobacterium | 0.708 |
| Bacteria | Actinomycetota | Thermoleophilia | Solirubrobacterales | 67-14 | Unclassified 67-14 | 0.68 |
| Bacteria | Nitrospirota | Nitrospiria | Nitrospirales | Nitrospiraceae | Nitrospira | 0.675 |
| Bacteria | Planctomycetota | Planctomycetes | Gemmatales | Gemmataceae | Unclassified Gemmataceae | 0.617 |
| Bacteria | Planctomycetota | Phycisphaerae | Tepidisphaerales | WD2101 soil group | Unclassified WD2101 soil group | 0.613 |
| Bacteria | Planctomycetota | Planctomycetes | Pirellulales | Pirellulaceae | Unclassified Pirellulaceae | 0.57 |
| Bacteria | Methylomirabilota | Methylomirabilia | Rokubacteriales | Incertae Sedis | Unclassified Bacteria | 0.563 |
| Bacteria | Chloroflexota | TK10 | Incertae Sedis | Incertae Sedis | Unclassified Bacteria | 0.485 |
| Bacteria | NA | NA | NA | NA | Unclassified Bacteria | 0.466 |
| Bacteria | Planctomycetota | Planctomycetes | Gemmatales | Gemmataceae | Gemmata | 0.462 |
| Bacteria | Myxococcota | Polyangiia | Haliangiales | Haliangiaceae | Unclassified Haliangiaceae | 0.438 |
| Bacteria | Pseudomonadota | Alphaproteobacteria | Reyranellales | Reyranellaceae | Reyranella | 0.425 |
| Bacteria | Planctomycetota | Planctomycetes | Planctomycetales | Incertae Sedis | Unclassified Bacteria | 0.422 |
Table 2.
An overview of the seven BioProjects and sequencing datasets that were included in the Panax ginseng rhizosphere microbiome integrated reanalysis.
Table 2.
An overview of the seven BioProjects and sequencing datasets that were included in the Panax ginseng rhizosphere microbiome integrated reanalysis.
| No | Bioprojcet | Species | Region | Layout | Platform | Country |
| 1 | PRJNA795020 | Panax ginseng | V3-V4 | Paired | Illumina miseq | China |
| 2 | PRJNA704771 | Panax ginseng | V3-V4 | Paired | Illumina novaseq600 | China |
| 3 | PRJNA707387 | Panax ginseng | V4 | Single | Illumina miseq | Korea |
| 4 | PRJNA701796 | Panax ginseng | V3-V4 | Paired | Illumina hiseq x ten | China |
| 5 | PRJNA681095 | Panax ginseng | V3-V4 | Single | Illumina miseq | China |
| 6 | PRJNA927237 | Panax ginseng | V3-V4 | Paired | Illumina hiseq2000 | China |
| 7 | PRJNA1191688 | Panax ginseng | V3-V4 | Paired | Illumina novaseq600 | China |
Disclaimer/Publisher’s Note: The statements, opinions and data contained in all publications are solely those of the individual author(s) and contributor(s) and not of MDPI and/or the editor(s). MDPI and/or the editor(s) disclaim responsibility for any injury to people or property resulting from any ideas, methods, instructions or products referred to in the content. |
© 2026 by the authors. Licensee MDPI, Basel, Switzerland. This article is an open access article distributed under the terms and conditions of the Creative Commons Attribution (CC BY) license (http://creativecommons.org/licenses/by/4.0/).
Copyright: This open access article is published under a Creative Commons CC BY 4.0 license, which permit the free download, distribution, and reuse, provided that the author and preprint are cited in any reuse.