

Submitted:
20 August 2026
Posted:
27 August 2026
You are already at the latest version
Abstract
Glutathione S-transferase theta 2 (GSTT2) is highly expressed in esophageal tissues from African American (AA) compared with European American (EA) individuals, but its localization, regulation, and relevance to esophageal adenocarcinoma progression remain unclear. Here, we combined FISH, immunofluorescence, patient-derived culture models, cell-cycle synchronization, biochemical perturbation, and transcriptomics to define GSTT2 expression in normal and neoplastic esophageal contexts. In developing and adult esophagus, GSTT2 mRNA and protein were broadly distributed across squamous epithelium and lamina propria, co-localizing with p63-positive basal/progenitor cells and extending into differentiated compartments, with no major ancestry-associated differences in spatial patterning. In Barrett’s esophagus, GSTT2 protein was retained in metaplastic columnar epithelium and slightly elevated in dysplastic versus adjacent non-dysplastic regions. GSTT2 mRNA was highest in normal squamous esophagus, reduced during Barrett’s-to-adenocarcinoma progression, but increased in treatment-resistant esophageal adenocarcinoma (EAC). In resistant EAC, GSTT2 co-expression shifted from homeostatic antioxidant programs to proliferation and mitotic pathways, including G2-M checkpoint, E2F targets, and Reactome cell cycle, with leading-edge regulators CDK1 and CDC20. Sequence analysis identified putative APC/C and FBXW7 recognition motifs. In synchronized cells, GSTT2 abundance declined during S-G2/M and increased during mitotic exit/early G1 in cytosolic and membrane fractions. Forskolin, a dual inhibitor of FBXW7 and CDC20, stabilized GSTT2 and rescued CDC20- or FBXW7-associated loss, implicating APC/C-CDC20 and FBXW7 pathways in GSTT2 turnover. Distinctly, however, in EAC cells, CDC20 was found to be a cooperative partner stabilizing GSTT2. These findings identify GSTT2 as a spatially widespread, ancestry-associated, cell-cycle-regulated protein with potential oncogenic roles in EAC resistance.
Keywords:
esophagus
; cell proliferation
; DNA damage response
; GSTT2
; FBXW7
; APC-CDC20
1. Introduction
Esophageal diseases, including Barrett’s esophagus and esophageal adenocarcinoma (EAC), represent major clinical challenges due to their increasing incidence, frequent late-stage diagnosis, and poor therapeutic response in advanced disease [1,2]. EAC typically develops through a metaplasia to dysplasia to adenocarcinoma sequence, often arising in the setting of chronic gastroesophageal reflux and Barrett’s esophagus [3]. Although genomic alterations such as TP53 mutation, chromosomal instability, and dysregulated cell-cycle control are well-established features of EAC progression [4,5,6], the molecular factors that shape early esophageal epithelial biology and influence cancer susceptibility or therapy resistance remain incompletely understood. In addition, ancestry-associated molecular differences in the normal esophagus may contribute to variation in epithelial homeostasis, stress response, and disease biology, yet these differences remain understudied.
Chronic gastroesophageal reflux exposes esophageal tissue to acid and bile salts, which together generate high levels of reactive oxygen species (ROS) and oxidative DNA damage in epithelial cells [7,8,9]. This oxidative stress is a major driver of inflammation, impaired wound repair, and the progression from GERD to Barrett’s esophagus and ultimately esophageal adenocarcinoma. Our prior work identified GSTT2 (glutathione-S-transferase theta-2) as a protective detoxification enzyme abundant in the normal esophagus of African Americans (AA), who develop significantly less Barrett’s esophagus and esophageal adenocarcinoma when compared to European Americans (EA) [10]. GSTT2 conjugates glutathione to electrophilic and oxidative byproducts, reducing ROS burden and preventing downstream DNA damage [11]. Thus, in the normal esophagus, GSTT2 may function as a protective factor by limiting oxidative DNA damage. Prior transcriptomic analyses from our group demonstrated that GSTT2 mRNA and protein is expressed at higher levels in normal esophageal tissues from AA compared with EA individuals, suggesting that GSTT2 may represent an ancestry-associated component of esophageal epithelial biology. However, those studies were performed using whole-tissue biopsies, leaving unresolved whether GSTT2 expression is restricted to specific epithelial compartments, associated with basal progenitor populations, or present in non-epithelial stromal compartments.
Understanding the spatial localization of GSTT2 within the human esophagus is important because the squamous epithelium is organized into functionally distinct cellular compartments. TP63-positive basal cells support epithelial renewal and repair, while suprabasal and luminal cells undergo differentiation and barrier maturation [12,13]. Molecular differences within these compartments may influence epithelial injury responses, regenerative capacity, and susceptibility to transformation. Furthermore, the esophageal lamina propria contains stromal and immune-associated cell populations that can contribute to epithelial homeostasis and disease progression [13,14,15]. Thus, resolving GSTT2 expression at the cellular and tissue level and factors that maintain GSTT2 protein stability are necessary to define its potential biological function in both normal esophagus, pre-malignant, and malignant lesions.
Beyond its canonical role in detoxification, emerging evidence suggests that redox-regulatory proteins may intersect with core cell-cycle and cancer-associated pathways [16,17]. EAC is characterized by frequent TP53 mutation and dysregulated cell-cycle progression, which can influence oxidative stress tolerance and therapeutic resistance [4,18,19]. The gain-of-function (GOF) mutant p53 has been reported to activate oxidative transcriptional programs in cancer contexts [20,21]. These interactions may allow tumor cells to tolerate elevated oxidative stress and survive cytotoxic therapy. Therefore, GSTT2 may function differently in normal esophageal epithelium compared with EAC, potentially shifting from a protective homeostatic enzyme to a contributor of tumor cell adaptation.
Protein abundance is also controlled post-translationally by ubiquitin-mediated degradation. Cell-cycle-regulated E3 ubiquitin ligases, including the anaphase-promoting complex/cyclosome (APC/C) and FBXW7-containing SCF complexes, coordinate the timely degradation of proteins required for orderly cell-cycle transitions [22,23]. APC/C, through its co-activators CDC20 and Fizzy-related 1/CDH1, regulates mitotic progression and exit, whereas FBXW7 targets multiple phosphorylated substrates involved in growth and proliferation and further involved in DNA damage repair [24]. Dysregulation of these pathways is common in cancer and can alter the stability of proteins that influence cell survival, genome integrity, and therapy response. We noted the presence of putative APC/C- and FBXW7-recognition motifs in GSTT2 raises the possibility that GSTT2 protein levels may be cell-cycle regulated and that this regulation may be altered during malignant progression.
In this study we integrate FISH, immunofluorescence, patient-derived culture, cell-cycle synchronization, mutant-p53 expression, ubiquitin-pathway perturbation, and transcriptomic analysis across the BE–dysplasia–EAC and treatment-resistant EAC spectrum to define the spatial, cellular, and regulatory features of GSTT2 in the human esophagus. We first mapped GSTT2 mRNA and protein localization in developing, adult and Barrett’s esophagus human esophageal tissues. Using cell-cycle synchronization, mutant p53 expression systems, and ubiquitin pathway perturbation, we investigated mechanisms regulating GSTT2 abundance. Finally, we analyzed GSTT2 expression across Barrett’s esophagus, dysplasia, EAC, and treatment-resistant EAC datasets to determine whether GSTT2 expression is associated with cancer progression, DNA damage response, cell-cycle programs, and therapeutic resistance. Together, these studies provide a framework for understanding GSTT2 as a spatially widespread, ancestry-associated, and cell-cycle-regulated protein with context-dependent roles in normal esophageal biology and EAC pathogenesis.
2. Materials and Methods
Cell lines and reagents. Human embryonic kidney (HEK-293), cervical carcinoma (HeLa) and EAC cell lines (Flo1, Eso51) were purchased from the American Type Culture Collection (ATCC) and SigmaMillipore (Burlington, MA). Cells were either grown in RPMI1640 or DMEM supplemented with 10% fetal bovine serum and antibiotics, as we previously reported [25]. Cells were routinely tested for any unwanted pathogen infection and genotyped for authenticity at the University of Michigan Advanced Genomics Core (AGC).
Antibodies included GSTT2 (sc-514667), Hsc70 (sc-7298) and EGFR (sc-03) were from Santa Cruz Biotechnology (Santa Cruz, CA). Cyclin B1 (D5C10, Cat. 12231), GAPDH (14C10, Cat. 2118), a-Tubulin (Cat. 2144), and HA (C29F4, Cat. 3724) (antibodies were purchased from Cell Signaling (Danvers, MA) and anti-DDK (OTI4C5; Origene Technologies, Rockville, MD). FuGENE HD (Promega Cat# E2311) and Lipofectamine 2000 (Cat# 11668019) were from ThermoFisher Scientific (Waltham, MA). We used CDH1 (Cat. M-005499-01-0005) SMARTpool from Dharmacon (Lafayette, CO) and FBXW7 pre-designed siRNA set (Cat. HY-RS04818) from MedChemExpress (Monmouth, NJ). The human specific CDC20 siRNA (sc-42008) were purchased from Santa Cruz Biotechnology.
The p53 (dominant negative R175H mutant)-pcw107-V5 was a gift from David Sabatini & Kris Wood (Addgene plasmid # 64638 ; http://n2t.net/addgene:64638 ; RRID: Addgene 64638) [26] and the pLenti6/V5-p53_R273H was a gift from Bernard Futscher (Addgene 22934 ; http://n2t.net/addgene:22934 ; RRID:Addgene_22934) [27].
Protein isolation, analysis and Immunoblotting. Proteins were isolated according to the protocol as described [28]. Briefly, the lysis buffer was prepared by adding 50 mM HEPES/KOH, 150 mM NaCl, 1 mM EDTA, 2.5 mM EGTA, 1 mM N-ethylmaleimide, 1 mM NaF, 100 μM sodium orthovanadate, 10% glycerol, 10 mM β-glycerophosphate, 0.1% NP-40, and protease inhibitor cocktail. To prevent degradation of proteins, the entire procedure of extraction was carried out on ice and the protein content was estimated using Bradford reagent. Gel electrophoresis was performed in 4–12% precast bis-tris gel (Invitrogen) and blotted on PVDF membrane and subjected to immunoblotting.
Synchronization and cell Fractionation. HeLa cell synchronization was performed using double thymidine block and release as we recently reported. Briefly, cells were maintained in 2 mM of thymidine for 18 hours followed by a release in fresh media for 9 hours. The cell cycle was then blocked again using the same concentration of thymidine for the next 15 hours. Finally, the G1 synchronized cells were released again and collected every two hours. Cell lysates were also prepared and subjected to immunoblotting at each time point up to 14 hours.
For cell fractionation, we have used subcellular protein fractionation kit (Cat. 78840, Thermo Scientific, Waltham, MA), according to manufacturer’s protocol.
Sample collection. Histologically normal, Barrett’s esophagus (BE), and tumor esophageal tissues were collected from consenting men and women who underwent upper endoscopy or surgical resection between 2017 and 2020 at the time of a scheduled inflammatory bowel disease screening, BE surveillance, or tumor surgical resection at the University of Michigan Health System (Michigan Medicine). Samples for this study was conducted in accordance with the Declaration of Helsinki, and approved by the Institutional Review Board (or Ethics Committee) of University of Michigan under approved protocols: HUM00041845, HUM00103771, and HUM00176985.
Patient race was self-identified; following Ferrer-Torres et al. [29], white non-Hispanic individuals are referred to as European American (EA) and Black individuals as African American (AA). Fresh samples were collected in cold HYENAC medium and either processed immediately or cryopreserved and stored at −80 °C until use.
Tissue preparation, Immunofluorescent, and Imaging. Patient biopsies and tissues were fixed in 4% paraformaldehyde (Sigma-Aldrich) overnight, washed with PBS, and dehydrated through a graded alcohol series: 30 min each in 25%, 50%, and 75% methanol in PBS/0.05% Tween-20, followed by 100% methanol, 100% ethanol, and 70% ethanol. Tissue was processed into paraffin using an automated tissue processor (Leica ASP300). Paraffin blocks were sectioned at 7 µm and immunohistochemical staining was performed as previously described (Spence et al., 2011; Ferrer-Torres et al.) [29]. Briefly, slides were rehydrated through Histo-Clear, 100% ethanol, 95% ethanol, 70% ethanol, 30% ethanol, and deionized water (two changes of 3 min each). Antigen retrieval was performed in 1× sodium citrate buffer in a steamer for 20 min. Slides were washed in PBS, permeabilized for 10 min in 0.1% Triton X-100 in PBS, and blocked for 45 min in 0.1% Tween-20/5% normal donkey serum in PBS. Primary antibodies were diluted in blocking solution and applied overnight at 4 °C. Slides were washed three times in PBS, and secondary antibodies plus DAPI were applied for 60 min at room temperature, followed by three PBS washes and mounting in ProLong Gold.
Fluorescence in situ hybridization (FISH). FISH for *GSTT2* mRNA was performed on paraffin-embedded developing and adult esophageal tissue sections, according to the manufacturer’s instructions. Sections were counterstained with DAPI and imaged.
Expression datasets. GSTT2 mRNA expression was analyzed in three microarray datasets. The GSE37203 cohort (Affymetrix HG-U133A, GPL96) provided 68 esophageal specimens spanning non-dysplastic BE (n = 9), BE with low-grade dysplasia (n = 7), LGD (n = 8), HGD (n = 7), chemotherapy-naïve EAC (n = 15), and therapy-resistant EAC (n = 22); diagnosis annotations were taken from the sample metadata. Normal esophageal tissue for the ancestry comparison was profiled in an independent cohort (AA/EA cohort, Affymetrix Gene ST), comprising 24 normal squamous samples (12 AA, 12 EA) from Ferrer-Torres et al. 2019. Malignant transformation was assessed in a third, independent esophageal/gastroesophageal cohort (Affymetrix Gene ST; Ferrer-Torres, Oncotarget 2016) comprising normal squamous esophagus (n = 8), normal gastric mucosa (n = 5), and gastroesophageal adenocarcinoma (n = 35). Probe-level intensities were collapsed to gene symbols by averaging.
Cross-platform normalization and group comparisons. Because the normal-tissue reference and the progression series were profiled on different microarray platforms, absolute log2 intensities are not directly comparable. To enable a common axis, GSTT2 expression in each sample was expressed as its percentile rank among all genes measured in that sample (within-sample percentile rank), a platform-independent statistic (Supplemental Figure 1A). Differences across the six GSE37203 disease groups were assessed by the Kruskal–Wallis test; pairwise comparisons (therapy-resistant versus chemotherapy-naïve EAC; AA versus EA normal esophagus; and adenocarcinoma versus normal squamous esophagus in the transformation cohort) used the two-sided Mann–Whitney U test. Within the single-platform transformation cohort (Supplemental Figure 1B), GSTT2 is reported as log2 intensity.
GSTT2 co-expression and pathway over-representation. Within each cohort, genes co-expressed with GSTT2 were defined by Pearson correlation (r ≥ 0.5) and restricted to protein-coding genes (biotype annotation via MyGene.info), because the pathway databases used contain no annotations for non-coding or pseudogene loci. Over-representation analysis was performed with Enrichr against seven libraries (GO Biological Process, GO Molecular Function, GO Cellular Component 2023; KEGG 2021 Human; Reactome 2022; WikiPathways 2023 Human; MSigDB Hallmark 2020). Terms with Benjamini–Hochberg FDR < 0.05 were considered significant.
Transcription-Factor Co-expression Screen. Datasets: Two independent microarray datasets were analyzed. Normal esophagus: the Beer ancestry cohort (Affymetrix Human Gene ST array) comprising 40 normal esophageal biopsies (12 AA normal squamous, 12 EA) normal squamous, 8 AA Barrett’s-adjacent normal, and 8 EA Barrett’s-adjacent normal). Therapy-resistant esophageal adenocarcinoma (EAC): the 22 therapy-resistant tumors from GSE37203 (Affymetrix HG-U133A, GPL96), a Barrett’s-to-EAC progression series in which the resistant group was annotated separately from 15 chemo-naïve adenocarcinomas, 9 Barrett’s, 8 low-grade dysplasia, 7 Barrett’s+LGD, and 7 high-grade dysplasia samples.
Probe-to-gene collapse: For the HG-U133A progression matrix, multiple probes mapping to the same gene symbol were collapsed to a single per-gene value by averaging (mean of probe-level log2 intensities), yielding a gene-level matrix of 13,212 genes × 68 samples. The 22 therapy-resistant tumors were selected from this matrix for the resistant-set analysis. The Beer Gene ST matrix was used at the gene level as provided.
Transcription-factor annotation: The reference set of human transcription factors (TF) was obtained from the curated human TF census [30] (humantfs.ccbr.utoronto.ca, v1.01), retaining the 1,639 genes flagged as TFs. Of these, 1,574 were present in the Beer Gene ST matrix and 1,006 in the collapsed HG-U133A matrix.
Correlation analysis: For each dataset, Pearson and Spearman correlation coefficients between GSTT2 log2 expression and every present transcription factor were computed across the samples of that group (normal esophagus, n = 40; therapy-resistant EAC, n = 22). Transcription factors with zero variance were excluded. P-values were adjusted for multiple testing by the Benjamini–Hochberg false-discovery-rate (FDR) procedure across all tested transcription factors within each dataset. Analyses were performed in Python (pandas, NumPy, SciPy, statsmodels).
Patient derived 2D cultures. Patient derived stem cell 2D cultures were established following Ferrer-Torres et al. 2022. In short, fresh samples were collected on cold HYENAC media and processed for culture; otherwise, biopsies were cryopreserved and stored at -80 C until use, at which point they could be thawed and processed for generating new culture lines. To cryopreserve biopsies, tissue was minced into fine pieces and froze using 1ml/vial of HYENAC + 20% CBS serum and 10% DMSO. Cryovials are placed in Mr. Frosty’s at -80 overnight and moved to liquid nitrogen tanks for long-term preservation. For culturing cell lines, we found that fresh biopsies could be processed immediately and grown at 100% success rate. We observed that biopsy samples in HYENAC media can be kept for 24hrs at 4 °C and can be grown successfully. Even further, samples can be shipped, at which point viable cell lines could still be robustly established.
Immunofluorescence analysis of γ-H2AX. PBS was removed from the fixed samples, and the protein-DNA was cross-linked with 500µL of 10% phosphate-buffered formalin for 20min at room temperature (RT). Cells were washed once with 500µL TBS followed by permeabilization with 100% cold methanol (-20 °C) then incubated for 1hr in a blocking buffer containing 5% goat serum, 1% BSA, and 0.2% Triton x100 in TBS (500μl of blocking buffer per well). Each primary antibody (γ-H2AX 1:1500 (#05-636, Millipore) GSTT2-1:500 (#514667, Santa Cruz) was diluted in TBS with 1% BSA such that 150µL was used for each cover glass and allowed to incubate on the cells overnight at 4 °C in a humidified chamber. The following day cells were washed 3 times with TBS-T for 5min. The cells were then incubated with secondary antibody for 1hr at room temperature (1:50 Alexa Fluor 488 goat anti-mouse IgG1, #A21121, Life Technologies; 1:200 Alexa Fluor 594 goat anti-mouse IgG2a, #A21135, Life Technologies), in 1% BSA, followed by three 5min washes with TBS-T. Coverslips were mounted onto slides using DAPI mounting solution (# P36935, Thermo Fisher) and stored at -20 °C prior to microscopic and photographic imaging.
Ki67/TP63 proliferation index. Cultures were co-stained by multiplexed immunofluorescence for Ki67 and TP63, and TP63+/Ki67+ double-positive cells were quantified and normalized to total human nuclear antigen (HuNu)-positive nuclei (n = 4 patients: 2 AA, 2 EA; triplicate quantification per patient) (Figure 5C).
Acid-injury model. Stratified 2D cultures were exposed once to pH 4 medium for 10 min to model the GERD-associated acid microenvironment using HCL to acidify the media. Twenty-four hours after injury, cells were split and replated at equal density (5 × 10⁵ cells/well), and cell number was assessed 5 days post-injury using cell counting Hemocytometer with trypan blue exclusion. DNA damage was quantified by γ-H2AX immunofluorescence 24 h post-injury in cultures co-stained for the basal marker KRT5, scoring the percentage of nuclei with >10 foci (Figure 5D–G).
Alkaline Comet Assay. To determine H2O2 induced DNA damage we used alkaline comet assay as we recently described [25]. Briefly, frosted slides were coated with a layer of agarose and dried. About 2000 cells from different treatment groups were suspended in PBS and mixed with triple the volume of 1% low melting point (LMP) agarose at 37 °C and spread over the agarose coated slides to make a thin layer. These slides were then kept in cold room and allowed to solidify for four hours. The slides were then kept submerged in a highly alkaline lysis buffer (1.2 M NaCl, 100 mM Na2EDTA, 0.1% sodium lauryl sarcosinate, 0.26 M NaOH (pH > 13) overnight for at 4 °C. Next day, the slides were rinsed three times at room temperature in alkaline rinse and electrophoresis solution (0.03 M NaOH, 2 mM Na2EDTA pH 12.3) to remove excess salts from the lysis buffer. The slides were then placed onto a horizontal electrophoresis camber and electrophoresed for 25 min at a voltage of 0.6 V/cm. The slides were then rinsed again with distilled water to remove salts. The gels on the slides were stained with 2.5 μg/ml of propidium iodide (PI) for 20 min, rinsed once with distilled water, and dried overnight and imaged. For each treatment, 50 comet images were captured, and the olive tail moments were calculated using Comet Assay IVTM, Instem software (Staffordshire, UK). The average tail moment was calculated for control and different treatment groups at 24h post-treatment and were subjected to statistical analysis.
Quantification and statistical analysis. Statistical analyses and plots were generated in GraphPad Prism. Tests are specified per experiment above and in the figure legends. A significance threshold of p < 0.05 was applied throughout; exact p-values are reported in the Figures. Unless otherwise stated, cell-based experiments were performed in two to three independent experiments with two to three technical replicates, and data are presented as mean ± s.d.
3. Results
GSTT2 protein localizes throughout the esophageal epithelium. We have previously reported that GSTT2 is overexpressed in the esophagus of AA when compared to EAs [10]. Nonetheless, this was performed on whole tissue biopsies and the spatial characterization of GSTT2 in the human esophagus remains unknown. Even further, characterization of GSTT2 expression in Barrett’s esophagus is unknown. Therefore, to characterize the spatial distribution of GSTT2 mRNA and protein within the human esophagus and in Barrett’s esophagus, we performed fluorescence in situ hybridization (FISH) and immunofluorescence staining on the developing, adult, and Barrett’s esophagus human tissues sections, as well as in a cohort of AA vs EA tissue sections (Figure 1). In the developing human (post conception date 130) and adult esophagus, GSTT2 probes were detected in a broad, diffuse pattern throughout the full thickness of the squamous epithelium, extending from the basal layer toward the lumen, with signal also present in the underlying lamina propria (Figure 1A, top and bottom panels). When looking at the protein localization of GSTT2 within the early vs adult human esophagus, we observed high expression in the ciliated luminal population, as well as in the stratified epithelium and the lamina propria (Figure 1B, left panels). GSTT2 expression in the adult human esophagus was observed throughout the full thickness of the stratified epithelium as well as expression in the lamina propria (Figure 1B, right panel).
To determine whether GSTT2 expression is associated with the basal progenitor cell compartment, we co-stained tissue sections with antibodies against GSTT2 and the established basal/stem cell marker TP63. In both the developing and adult esophagus, GSTT2 (red) and TP63 (green) signals co-localized within the epithelium, demonstrating that GSTT2 is expressed in TP63-positive basal cells (Figure 1B). This co-localization was observed across the full length of the epithelial mucosa in the developing esophagus and at the basal layer of the adult esophageal epithelium, adjacent to the lamina propria. Because we have previously identified GSTT2 as differentially expressed in the esophagus of AA vs EA, we compared the spatial distribution of GSTT2 in these two groups. We could not detect any differences in spatial patterns of expression between the two groups, suggesting GSTT2 localized expression is similar in both groups (Figure 1C).
Having established the spatial distribution of GSTT2 in the normal esophagus, we next asked whether GSTT2 expression is detected in BE tissues with matched normal squamous (NS) (Figure 1D). In NS, GSTT2 was expressed throughout the squamous epithelium and lamina propria, consistent with the pattern described above (Figure 1A-C). In BE however, GSTT2 signal was confined to within metaplastic columnar tissue (Figure 1D). Interestingly, within individual BE specimens, GSTT2 expression was not uniform: regions harboring dysplasia showed higher GSTT2 expression than adjacent non-dysplastic metaplastic regions of the same tissue (Figure 1D, insets 1a-1b). All together, we found that GSTT2 is expressed from development to adult esophagus, it is expressed in both epithelial and lamina propria cells, and within BE tissues, we observed dysplastic regions with higher expression.
GSTT2 mRNA is stable across progression and rises specifically in therapy-resistant EAC. To place these tissue in vivo observations on a quantitative axis of patient samples at the transcription levels, we examined GSTT2 mRNA across the full histological spectrum of esophageal neoplasia in the GSE37203 cohort (n = 68): non-dysplastic BE (n = 9), BE with low-grade dysplasia (n = 7), low-grade dysplasia (LGD, n = 8), high-grade dysplasia (HGD, n = 7), chemotherapy-naïve EAC (n = 15), and therapy-resistant EAC (n = 22). Because the normal esophagus reference and the progression series were profiled on different microarray platforms, we expressed GSTT2 as its within-sample percentile rank across the transcriptome, a platform-independent measure (Supplemental Figure 1A). Relative to normal squamous esophagus (median 57th percentile), GSTT2 rank fell across the BE-to-EAC progression (Barrett’s through chemotherapy-naïve EAC, percentile medians 16–21) and rose specifically in therapy-resistant tumors (median 25th percentile; Kruskal–Wallis p = 1.1 × 10⁻⁵ across disease groups; resistant versus chemotherapy-naïve EAC, Mann–Whitney p = 1.2 × 10⁻⁴; Supplemental Figure 1A). Nonetheless, it is apparent that four HGD and two EAC naïve tissues are above the mean, suggesting a potential earlier increased GSTT2 expression in this tissue types. (Supplemental Figure 1A). To corroborate the reduced expression of GSTT2 in adenocarcinomas relative to normal squamous, we examined a dataset from an independent patient cohort comprising normal squamous esophagus, normal gastric mucosa, and gastroesophageal adenocarcinoma [31]. GSTT2 was highest in normal squamous esophagus (median 6.4 log2) and significantly lower in adenocarcinoma (median 4.2 log2; Mann–Whitney p = 0.013), with normal gastric mucosa being intermediate (Supplemental Figure 1B). Therefore, GSTT2 is not progressively induced along the metaplasia → dysplasia → adenocarcinoma sequence; rather, it is expressed at high levels in normal squamous epithelium, expressed at lower levels in adenocarcinoma development, but selectively increased in the therapy-resistant state.
GSTT2 co-expression switches to a proliferative, cell-cycle program in therapy-resistant EAC. We then asked what transcriptional program accompanies GSTT2 in each disease state. Therefore, we identified genes co-expressed with GSTT2 (Pearson r ≥ 0.5) within each cohort and tested them for pathway over-representation (Figure 2). In normal esophagus, no pathway showed statistical significance after multiple-testing correction (0 terms at FDR < 0.05), nonetheless, oxidative stress was observed as one of the trending pathways (Supplemental Table 1). In the BE-to-EAC progression cohort, with resistant tumors excluded, analyses yielded only three significant terms (UV Response Dn, TFAP2 family, basolateral plasma membrane) (Supplemental Table 2), neither implicating cell-cycle machinery (Figure 2A, B, Supplemental Figure 2). In striking contrast, the GSTT2 co-expression network in therapy-resistant EAC was dominated by proliferation and cell-cycle programs: Hallmark G2-M Checkpoint (54/200 genes, FDR = 2 × 10⁻³¹), E2F Targets (52/200, FDR = 1 × 10⁻²⁹), and Reactome Cell Cycle (93/654, FDR = 6 × 10⁻²⁹) (Figure 2B, D, Supplemental Table 3). The leading-edge genes included the mitotic regulators CDK1, CDC20, CCNB1, BUB1, and UBE2C (Figure 2C) and the number of significantly enriched terms increased from 0 (normal) to 3 (progression only) to 463 (resistant EAC) (Figure 2E). This proliferative signature was contributed almost entirely by the 22 therapy-resistant tumors rather than by Barrett’s-to-EAC progression dataset, identifying a resistance-specific functional switch with GSTT2 becoming coupled to the mitotic machinery.
A prior study using prostate cancer cells reported that GSTT2 expression can be regulated by a redox-regulated transcription factor, NRF2 (encoded by NFE2L2) [32]. Analysis of the gene expression data, however revealed no correlation between NFE2L2 and GSTT2 in normal esophagus, during progression into non-dysplastic BE, LGD, HGD, treatment naïve EACs and even in treatment resistant EACs (Supplemental Figure 3). Such data led us to hypothesize that the induction of GSTT2 noted in treatment-resistant EACs may possibly be attributed to NRF2-independent transcription and post-translational stabilization of GSTT2 protein.
Based on gene expression data in normal esophageal tissues (n=40), we found that 11 transcription factors were highly correlated with GSTT2 (Supplemental Figure 4A). Among them, ZBTB32 was most correlated (r= 0.58; p= 9.9×10⁻⁵) (Supplemental Figure 4B). As the AA population is known to express higher levels of GSTT2 relative to the EA population, ZBTB32 expression also showed higher levels in AA normal esophagus. In treatment resistant EACs (n=22), GSTT2 transcript expression was most correlated with FOXN2 (r=0.82; p=3.4×10⁻⁶) (Supplemental Figure 4C, D), suggesting a switch in gene expression during therapy resistance.
GSTT2 contains putative APC/C- and FBXW7-recognition motifs and is regulated during cell-cycle progression. To understand the importance of post-translational regulation of GSTT2 protein, we analyzed and identified two putative degrons: 154-RPFLAGQQ-161 and 227-TPSPE-231. These motifs may be recognized by two distinct classes of E3 ubiquitin ligases, the anaphase-promoting complex/cyclosome (APC/C) and FBXW7, respectively (Figure 3A). Because both E3 ligases play critical roles in cell-cycle regulation, we hypothesized that GSTT2 may contribute to, or be regulated during, cell-cycle progression. To test this possibility, we used human cervical carcinoma HeLa cells, a wild-type p53 containing and GSTT2-expressing cell line that is widely used in cell-cycle studies (Figure 3B). Cells were synchronized using a double-thymidine block-and-release protocol, as we previously standardized [33]. Following release, we observed increased GSTT2 expression in cells exiting mitosis and entering early G1, as determined by DNA-content analysis using FACS and by cyclin B1 expression (Figure 3C).
As HeLa cells contain wild-type p53, and the presence of mutant p53 is prevalent (>70%) in majority of EACs, we generated isogenic HeLa cell lines expressing different mutant p53 transgenes, particularly the Arg175His (R175H) and the Arg273His (R273H) missense mutant commonly seen in EAC patients. The ectopic expression of mutant p53 was confirmed using the V5 tag (Figure 3D). Notably, mutant p53 expression in HeLa cells further increased GSTT2 levels compared with wild-type p53-containing parental HeLa cells. GSTT2 is predominantly a cytosolic enzyme, although under certain conditions it can be detected in membrane fraction [34]. To further examine the effect of mutant p53 on GSTT2 cell-cycle distribution and subcellular localization, we performed cell synchronization followed by subcellular fractionation in parental HeLa cells and in the two mutant p53-overexpressing isogenic lines. As shown in Figure 3E-F, compared to parental HeLa cells, GSTT2 expression was readily detected in mutant p53 expressing isogenic HeLa cells and the kinetics were comparable in the cytosolic and membrane fractions, with lower expression during S–G2 phases and higher expression as cells exited mitosis and entered G1. Together, these findings indicate that GSTT2 is a cell-cycle-regulated protein, expressed during mitotic exit and early G1 phases.
To evaluate the functional relevance of the D-box and phosphodegron motifs in GSTT2, we treated cells with forskolin, a plant-derived labdane-type diterpenoid that activates adenylate cyclase and increases intracellular cyclic AMP (cAMP) levels [35]. Elevated cAMP activates both protein kinase A (PKA) and extracellular signal-regulated kinase (ERK) [36,37], which can phosphorylate APC/C subunits [38] and FBXW7 [39], respectively, thereby inhibiting their E3 ligase activity. Consistent with this model, forskolin increased GSTT2 levels in Het-1A cells in a dose-dependent manner, suggesting that APC/C-GSTT2 and FBXW7-GSTT2 regulatory pathways may contribute to GSTT2 turnover (Figure 4A).
APC/C is a multi-subunit E3 ubiquitin ligase that uses either Fizzy-related 1/CDH1 or CDC20 as substrate-recognition adaptor proteins in a cell-cycle-stage-dependent manner [40]. APC/C-CDH1 primarily recognizes substrates during G1/S, whereas APC/C-CDC20 functions predominantly during mitosis. Both complexes recognize substrates through the consensus destruction box (D-box) motif, RxxLxxxN/D/E [40]. Because GSTT2 expression was enriched during mitotic exit and early G1 but reduced during S and G2/M phases (Figure 3), we hypothesized that GSTT2 may be regulated by APC/C-CDC20 during G2/M. To test whether GSTT2 interacts with APC/C, we performed immunoprecipitation followed by immunoblotting. GSTT2 was detected in immunocomplexes containing both APC/C-CDH1 and APC/C-CDC20 (Figure 4B). However, CDC20 and CDH1 had opposing effects on GSTT2 abundance: CDC20 overexpression decreased GSTT2 levels, whereas CDH1 overexpression increased GSTT2 expression. Furthermore, forskolin treatment rescued CDC20-mediated GSTT2 degradation. These observations are consistent with the GSTT2 expression kinetics observed during cell-cycle synchronization and suggest that APC/C-CDC20 functions as a novel E3 ligase promoting GSTT2 degradation during the G2/M phase of the cell cycle. Conversely, CDC20 loss increased GSTT2 levels, whereas CDH1 loss decreased GSTT2 levels (Figure 4C).
As GSTT2 expression is low in S-phase cells, we further hypothesized that it may be regulated by FBXW7, an E3 ligase known to be active in S-phase cells. As expected, FBXW7 overexpression resulted in reduced GSTT2 expression, which was rescued by forskolin treatment (Figure 4D). Interestingly, forskolin also increased FBXW7 levels, possibly by inhibiting FBXW7 autoubiquitination and degradation. Unexpectedly, however, FBXW7 loss also destabilized GSTT2 (Figure 4E). Because FBXW7 loss is known to indirectly influence CDC20 levels [41], we hypothesize that following the loss of FBXW7, CDC20 may be upregulated to cause GSTT2 loss. Thus, forskolin that inhibits CDC20, rescued GSTT2 levels in the absence of FBXW7. FBXW7 is a well-established tumor suppressor that regulates several critical cell-cycle proteins, including cyclin E [42]. Loss of FBXW7 or E3 ligase-inactivating mutations have been reported in multiple cancer types [43]. Analysis of cBioPortal datasets across gastroesophageal cancers revealed deletions and mutations in FBXW7, suggesting that inactivation of this pathway may promote GSTT2 protein stabilization in EACs (Supplemental Figure 5A). For this E3 ubiquitin ligase, we did not notice a correlation of gene expression between GSTT2 and FBXW7 in normal esophageal cells, or during EAC progression and therapy resistance (Supplemental Figure 5B). At the protein level however, we have performed dual immunofluorescence staining of GSTT2 and FBXW7 in both the human fetal and adult esophagus and note the colocalized expression of both proteins in these tissues (Supplemental Figure 5C, D).
To determine the functional consequence of forskolin-mediated GSTT2 induction, we performed clonogenic assays in Het-1A cells. Forskolin treatment increased clonogenic survival (Figure 4F), suggesting that GSTT2 induction may enhance cell survival capacity. Because GSTT2 has been implicated in protection against DNA damage [24], we next treated cells with hydrogen peroxide (H2O2) and assessed whether forskolin could protect cells from DNA damage using the alkaline comet assay. As shown in Figure 4G, forskolin produced a non-significant trend toward improved DNA repair. We hypothesize that this limited effect may reflect the G1-specific expression pattern of GSTT2, a phase in which non-homologous end joining (NHEJ) predominates, whereas H2O2-induced double-strand breaks are repaired primarily through homologous recombination repair (HRR). In addition, H2O2-mediated GSTT2 downregulation was not rescued by forskolin, further supporting the minimal effect of forskolin on DNA damage repair under these conditions (Figure 4H).
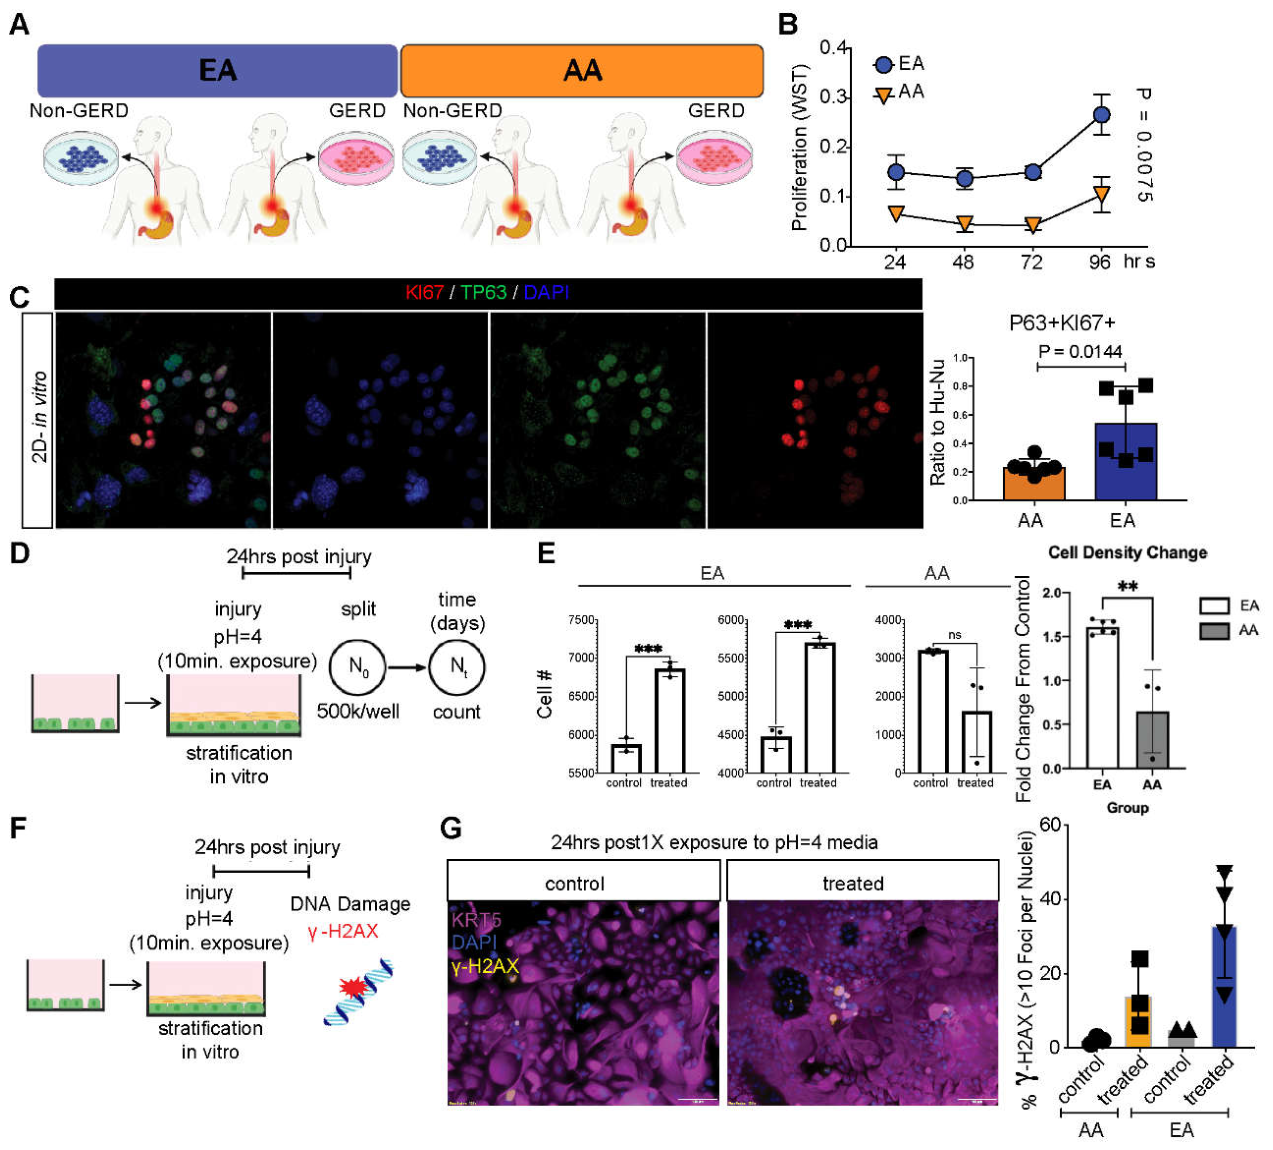
Injury response is significantly different between AA vs EA esophageal basal stem cells. To investigate whether ancestral background influences the esophageal epithelial response to acid injury, we established 2D esophageal epithelial cultures derived from AA and EA patients with and without gastroesophageal reflux disease (GERD) (Figure 5A). Baseline proliferation assessed by WST assay over a 96-hour time course revealed that GERD-associated EA cultures exhibited significantly higher endogenous proliferative capacity compared to AA-derived cultures (p = 0.0075; Figure 5B). This finding was validated at the protein level using multiplex immunofluorescence for the proliferation marker KI67 in combination with the basal epithelial marker TP63. Quantification of TP63+/KI67+ double-positive cells, normalized to total human nuclear antigen (HuNu), confirmed significantly greater proliferative activity in EA cultures relative to AA cultures (p = 0.0144; Figure 5C).
To model the esophageal acid microenvironment associated with GERD-mediated injury, stratified 2D cultures were subjected to a single 10-minute exposure to pH 4 media, 24 hrs after injury they were split and replated at equal density (500k/well) and assessed for cell numbers 5 days post-injury (Figure 5D). Cell counts following acid exposure revealed that EA-derived cultures from two independent patient lines (HT227 and HT180) exhibited significant increase in cell number relative to untreated controls (p < 0.001), while the AA-derived line (HT261) showed no significant change in cell density following injury (Figure 5E). Fold-change analysis confirmed a significantly greater proliferative response to acid injury in EA compared to AA cultures (p < 0.01; Figure 5E, right panel).
To assess whether differential proliferative responses were accompanied by differences in genomic integrity, we quantified DNA double-strand break accumulation using gamma-H2AX (g-H2AX) immunofluorescence 24 hours post-injury in stratified cultures co-stained with the basal marker KRT5 (Figure 5F-G). EA-derived cultures showed a marked increase in the percentage of nuclei with greater than 10 g-H2AX foci following acid exposure compared to untreated controls, while AA cultures demonstrated a comparatively modest injury-associated DNA damage response (Figure 5G). Together, these data indicate that EA and AA esophageal epithelial cells are distinct in their proliferative capacity and in their genomic responses to acid-mediated injury, with EA cells accumulating a more significant but potentially genotoxic regenerative response.
Figure 5.
Injury response is significantly different between AA cells vs EA. (A) We derived 2D-esophagus cultures from AA and EA GERD and Non-GERD patients. (B) Cultures derived from GERD AA vs EA show significance difference in the endogenous proliferation rate of the cells with EA having a higher proliferative rate when compared to AA (p = 0.00075). (C) Ki67 protein was used to validate the endogenous proliferative status between EA cells vs AA depicting significant difference in Ki67+ between AA vs EA. n=4 total patients (n=2 AA vs n=2 EAs) (quantitation data is shown in triplicates per patient). (D-E) Upon stratification and injury exposure, EA cells depict a significant differential response with higher proliferation and accumulation of DNA damage when compared to AA cells. (F-G) EA esophageal KRT5+ (purple) cells exposed to injury with low pH media (pH=4) accumulate more DNA damage as measured by gamma-H2AX when compared to AA cells.
Figure 5.
Injury response is significantly different between AA cells vs EA. (A) We derived 2D-esophagus cultures from AA and EA GERD and Non-GERD patients. (B) Cultures derived from GERD AA vs EA show significance difference in the endogenous proliferation rate of the cells with EA having a higher proliferative rate when compared to AA (p = 0.00075). (C) Ki67 protein was used to validate the endogenous proliferative status between EA cells vs AA depicting significant difference in Ki67+ between AA vs EA. n=4 total patients (n=2 AA vs n=2 EAs) (quantitation data is shown in triplicates per patient). (D-E) Upon stratification and injury exposure, EA cells depict a significant differential response with higher proliferation and accumulation of DNA damage when compared to AA cells. (F-G) EA esophageal KRT5+ (purple) cells exposed to injury with low pH media (pH=4) accumulate more DNA damage as measured by gamma-H2AX when compared to AA cells.
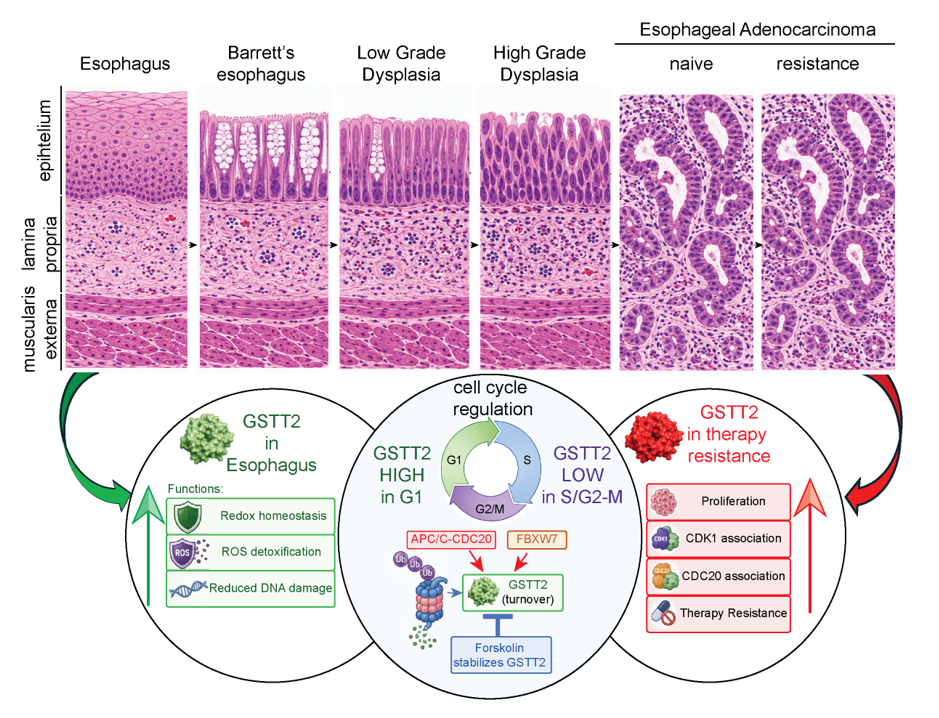
GSTT2 expression increases in treatment-resistant EAC and correlates with mitotic markers. Using microarray-based gene expression data from Barrett’s esophagus (BE), low- and high-grade dysplasia (LGD and HGD), esophageal adenocarcinoma (EAC), and treatment-resistant EAC samples, we observed a gradual increase in GSTT2 expression beginning in cancer samples, with the highest expression detected in the treatment-resistant EAC group (Supplemental Figure 1A). Previous studies have identified an antioxidant response element (ARE) within the GSTT2 gene, which is regulated by the transcription factor NRF2 [32]. Our gene expression dataset revealed increased NRF2 expression specifically in treatment resistant EAC patients (Figure 6A), further correlation studies did not show significance at the transcript level (r = -0.04; p = 0.82) (Supplemental Figure 3H). Because the majority of EACs harbor TP53 mutations, and mutant p53 has been reported to exert oncogenic effects by binding to NRF2 forming heteromeric transcription factor and activating downstream redox-regulatory targets that promote therapy resistance [44], we next examined TP53 expression. We noticed gradual increase in TP53 expression from BE to EAC but a substantial increase in treatment-resistant EAC samples (Figure 6B). Although GSTT2, NRF2, and TP53 all showed increased expression trends in treatment-resistant EAC, Pearson correlation analysis did not reveal significant correlations among these genes (Supplemental Figure 3H, I). At the transcript level, GSTT2 expression in treatment-resistant EAC was most strongly correlated with CDK1, a key cyclin-dependent kinase that drives mitotic progression (Figure 6C). This correlation between GSTT2 and CDK1/CDC20 was not observed in treatment-naïve EAC patients (n = 153; Supplemental Figure 2). Interestingly, CDC20, another critical regulator of mitosis, was also significantly correlated with GSTT2 expression (Figure 6D). This pattern differed from our observations in normal esophageal cells, where CDC20 appeared to function as a regulator of GSTT2 degradation. In EAC cell lines, including Flo-1 and ESO51 cells, we observed loss of GSTT2 protein levels upon CDC20 knockdown, suggesting a potential oncogenic cooperation between the CDC20-GSTT2 axis during progression to cancer (Figure 6E). Together, these findings suggest that GSTT2 may switch from its protective role in normal esophageal tissue to promoting cell survival in therapy resistant cancer cells. This oncogenic function may involve cooperation with mutant p53 and CDC20, possibly in the context of impaired FBXW7 E3 ligase activity caused by allele loss or missense mutation. Such alterations may promote hyperproliferation, enhance DNA damage response capacity, and ultimately contribute to therapy resistance in EAC (Figure 6F).
4. Discussion
In this study, we define the cellular distribution and regulatory features of GSTT2 in the human esophagus and identify a potential context-dependent role for GSTT2 in epithelial homeostasis, cell-cycle regulation, and EAC therapy resistance. Building on our prior observation that GSTT2 transcript and protein levels are higher in AA compared with EA individuals, we show here that GSTT2 protein is broadly expressed throughout the human esophageal epithelium, including p63-positive basal/progenitor cells, as well as higher expression in dysplastic BE regions. Mechanistically, we identify GSTT2 as a cell-cycle-regulated protein whose abundance is influenced by CDC20, CDH1, FBXW7, and forskolin-sensitive signaling. Finally, analysis of patient gene-expression datasets indicates that GSTT2 expression increases in treatment-resistant EACs, where it correlates with mitotic regulators including CDK1 and CDC20. Together, these findings support a model in which GSTT2 contributes to normal epithelial stress-response programs but may be co-opted during therapy resistance promoting better DNA damage response and hyperproliferation.
A key finding of this work is that GSTT2 expression is not restricted to a single epithelial compartment. FISH and immunofluorescence analyses demonstrated GSTT2 mRNA and protein throughout the stratified squamous epithelium, extending from the basal layer toward the luminal surface, with additional signal in the lamina propria. Its presence in p63-positive basal cells is particularly notable because this compartment contains progenitor populations responsible for epithelial maintenance and regeneration [45,46]. These data suggest that GSTT2 may support redox homeostasis or xenobiotic defense not only in differentiated epithelial cells exposed to luminal injury, but also in long-lived progenitor cells that must preserve genomic integrity over time. GSTT2 expression in the developing esophagus further suggests that its activity is established early during epithelial maturation and may represent a conserved protective feature of esophageal tissue biology.
Our spatial analyses also elucidate the cellular basis of previously observed ancestry-associated differences in GSTT2 expression [10]. The overall localization pattern of GSTT2 was similar between AA and EA tissues, suggesting that these differences reflect variation in expression level rather than the occurrence of a distinct GSTT2-positive cell population. This distinction is important because it supports the idea that GSTT2 is part of a shared epithelial program whose baseline activity varies among individuals or populations. Such variation may arise from genetic, epigenetic, environmental, dietary, inflammatory, microbiome-related, as well as interactions among these factors. Therefore, the observed AA and EA differences should not be interpreted as purely genetic or biologically deterministic, but rather as a foundation for future studies investigating mechanisms that regulate GSTT2 expression across diverse populations.
A central and somewhat unexpected finding of this study is that GSTT2 mRNA is not progressively induced along the metaplasia-to-dysplasia-to-adenocarcinoma sequence. On a platform-independent percentile axis, GSTT2 mRNA was highest in normal squamous esophagus, declined across the BE-to-EAC progression, and much more highly expressed in therapy-resistant tumors. The direction of the early change was corroborated in an independent esophageal/gastroesophageal cohort, in which GSTT2 was significantly higher in normal squamous epithelium than in adenocarcinomas. This trajectory suggests GSTT2 as a gene whose high baseline expression is a property of the normal squamous tissue rather than a marker acquired during transformation. Such a pattern is consistent with our spatial data placing GSTT2 in the p63-positive basal/progenitor population: as the epithelium is replaced by intestinalized columnar metaplasia and subsequently by adenocarcinoma, the squamous progenitor programs that sustain high GSTT2 are lost, and average GSTT2 expression falls accordingly. Loss of a squamous antioxidant enzyme during columnar transformation may itself be permissive for disease, because it would be expected to lower the epithelium’s safeguarding capacity against the reflux-associated oxidative stress that drives BE pathogenesis [47,48,49]. Notably, all this analysis were performed at the transcript level; because we observed foci of dysplasia within BE tissue that exhibited elevated GSTT2 protein (Figure 1D), further evaluation of GSTT2 at the protein level across the BE-to-EAC progression sequence will be important.
Beyond its localization and levels of expression, our data identify GSTT2 as a cell-cycle-regulated protein. Sequence analysis revealed putative APC/C- [40] and FBXW7-recognition motifs [50], and synchronized cell-cycle studies showed dynamic GSTT2 expression, with lower levels during S-to-G2/M and increased abundance during mitotic exit and early G1. Subcellular fractionation demonstrated similar cell-cycle-dependent GSTT2 kinetics in cytosolic and membrane fractions, with little detectable nuclear GSTT2 under the conditions tested. These findings suggest that GSTT2 abundance is coordinated with proliferative state, potentially linking redox regulation, protein turnover, and cell-cycle progression.
The third major observation is that the transcriptional pathways associated with GSTT2 changes qualitatively with disease state. In the normal esophagus, genes co-expressed with GSTT2 yielded no pathway surviving multiple-testing correction, but the oxidative stress pathway was observed. In the BE-to-EAC progression cohort with resistant tumors excluded only three terms were significant, none implicating the cell cycle. In therapy-resistant EAC, however, the GSTT2 co-expression network was overwhelmingly proliferative, dominated by the G2-M checkpoint, E2F targets, and Reactome Cell Cycle, with leading-edge mitotic regulators including CDK1, CDC20, CCNB1, BUB1, and UBE2C. The count of significantly enriched terms rose from none in normal esophageal tissue to hundreds in resistant EACs, and this signal was contributed almost entirely by the 22 resistant specimens rather than by the other tumors. We interpret this as a resistance-specific functional switch, in which GSTT2 transitions from its homeostatic role in the quiescent squamous epithelium to becoming coupled to the mitotic program of aggressive, treatment-refractory tumors.
This co-expression switch is mechanistically coherent with the post-translational regulation we describe. The relationship between GSTT2 and APC/C regulation appears complex. GSTT2 was detected in immunocomplexes containing both APC/C co-activators CDC20 and CDH1, yet these factors had opposing effects on GSTT2 abundance. CDC20 overexpression reduced GSTT2 levels, whereas CDC20 loss increased GSTT2, supporting a model in which APC/C–CDC20 promotes GSTT2 degradation during G2/M. In contrast, CDH1 overexpression increased GSTT2 levels, while CDH1 loss decreased GSTT2, suggesting that CDH1 may stabilize GSTT2 in this context, possibly through suppression of CDC20, modulation of upstream signaling, or regulation of additional GSTT2-targeting factors. FBXW7 also influenced GSTT2 abundance, although its effects were similarly context dependent. FBXW7 overexpression reduced GSTT2, whereas FBXW7 depletion also destabilized GSTT2, potentially through indirect upregulation of CDC20 [41]. These data suggest that GSTT2 stability is governed by an interconnected regulatory network rather than a single linear E3 ligase pathway.
Forskolin-mediated induction of GSTT2 further supports the idea that GSTT2 turnover is sensitive to signaling pathways that converge on APC/C- and FBXW7-associated mechanisms [36,37]. Forskolin increased GSTT2 levels in a dose-dependent manner and rescued CDC20- or FBXW7-associated GSTT2 loss. Functionally, forskolin enhanced clonogenic survival of Het-1A cells, suggesting that GSTT2 induction or related forskolin-responsive pathways may improve epithelial cell fitness. However, forskolin did not significantly enhance repair of hydrogen peroxide-induced DNA damage, and H2O2-mediated GSTT2 downregulation was not rescued by forskolin. Thus, GSTT2-mediated protection may be context-specific and may involve detoxification, redox buffering, cell-cycle adaptation, or survival signaling rather than direct repair of acute oxidative DNA lesions.
Analysis of disease-progression datasets suggests that GSTT2 may undergo a functional shift during transformation from normal esophagus to EAC. In normal tissue, GSTT2 expression correlated with oxidative stress-response genes, consistent with its canonical role in glutathione-dependent detoxification and redox homeostasis. In contrast, in treatment-resistant EAC, GSTT2-associated pathways were enriched for DNA damage response, repair, and cell-cycle regulation. The positive correlation between GSTT2 and mitotic regulators CDK1 and CDC20 in treatment-resistant EAC is particularly intriguing. In normal cell-cycle models, CDC20 appeared to promote GSTT2 degradation; however, in EAC cells, CDC20 loss reduced GSTT2 levels, suggesting that the CDC20-GSTT2 relationship may be rewired during malignant progression. In cancer cells, CDC20 may cooperate with GSTT2 to support mitotic progression, survival under therapeutic stress, or adaptation to genomic instability. This switch could reflect altered APC/C substrate specificity, changes in post-translational modification, altered proteasomal activity, or broader oncogenic rewiring of cell-cycle checkpoints. These findings support a model in which GSTT2 is protective in normal esophageal epithelium but may acquire pro-tumorigenic or therapy-resistance functions in EAC.
Prior studies have suggested that GSTT2 can be regulated by NRF2, a master transcription factor controlling antioxidant response pathways [32]. In our datasets, however, GSTT2 did not significantly correlate with NFE2L2/NRF2 across normal esophagus, BE, dysplasia, chemotherapy-naïve EAC, or therapy-resistant EAC. Although NRF2 expression increased in therapy-resistant EAC, the lack of transcript-level correlation with GSTT2 suggests that GSTT2 induction in this context may not be driven solely by canonical NRF2-mediated transcription. Instead, our analysis points toward context-specific regulatory programs. In normal esophagus, GSTT2 correlated with several transcription factors, most notably ZBTB32, whereas in therapy-resistant EAC GSTT2 correlated strongly with FOXN2. These observations suggest that GSTT2 transcriptional control may be rewired during malignant progression and therapy resistance. Because mutant p53 can cooperate with NRF2 and other transcriptional regulators to promote antioxidant and survival programs, it remains possible that GSTT2 is regulated through mutant p53-dependent chromatin remodeling, enhancer activation, or indirect transcriptional networks rather than through NRF2 expression alone [51,52]. To emphasize, neither ZBTB32 nor FOXN2 have been linked to GSTT2 expression. Importantly, ZBTB32, a zinc finger and BTB domain containing transcription factor, is a regulator of immune response and metabolic adaptation [53,54]. In contrast, FOXN2 is a known tumor suppressor which is downregulated in breast cancer [55]. Interestingly, a prior work from our group reported that chromosome 2p (where FOXN2 is located), shows frequent chromosomal gains in EAC [56], suggesting a possible link during development of therapy resistance. Future studies may be necessary to better understand such context dependent GSTT2 biology.
This study has several limitations. The number of human tissue samples analyzed by FISH and immunofluorescence was limited, and larger cohorts will be needed to quantify variation by ancestry, age, sex, disease state, and exposure history. The AA and EA comparisons demonstrate reproducible differences in GSTT2 abundance but do not establish causality or identify the underlying genetic, epigenetic, environmental, or socioeconomic drivers. Mechanistic studies were performed largely in HeLa and Het-1A cells, which are useful experimental models but do not fully represent normal esophageal epithelium or EAC. Validation in patient-derived esophageal organoids, Barrett’s models, and EAC cell lines will be important. In addition, although sequence prediction, co-immunoprecipitation, gain- and loss-of-function experiments, and pharmacologic rescue support APC/C- and FBXW7-associated regulation, direct ubiquitination of GSTT2 and degron dependence remain to be demonstrated. Finally, the association between GSTT2 and treatment resistance is correlative, and functional studies are needed to determine whether GSTT2 directly alters chemotherapy, radiation, or targeted therapy response.
In summary, our findings identify GSTT2 as a broadly expressed esophageal protein present in epithelial, basal/progenitor, and non-epithelial compartments. Mechanistically, GSTT2 abundance is dynamically regulated across the cell cycle and influenced by APC/C–CDC20-, CDH1-, and FBXW7-associated pathways. During EAC progression, GSTT2 expression increases and becomes associated with therapy resistance and mitotic regulators. These results support a model (Figure 6G) in which GSTT2 contributes to normal esophageal stress protection but may become integrated into cancer-associated cell-cycle and survival programs during therapy resistance.
Supplementary Materials
The following supporting information can be downloaded at the website of this paper posted on Preprints.org, Figure S1-S5 and Supplemental Tables S1-S3.
Author Contributions
Experimental design and study concept: D.F.T., P.R., K.H.L., D.G.B., D.R. Development of methodology: D.F.T., J.R.S., D.G.B., D.R. Provided patient sample material and clinical information: S.W., S.S.K., B.M., S.M., D.K.T., J.L., P.D.R.H, K.H.L. Statistical analysis and data interpretation: D.F.T., P.R., D.G.B., D.R. Technical and laboratory support: D.F.T., P.R., N.E., M.A.H., A.G., M.L., V.J. Study supervision: D.F.T., P.R., J.R.S., D.G.B., D.R. Manuscript preparation: D.F.T., P.R., J.R.S., K.H.L., D.G.B., D.R.
Funding
D.F.T. is supported by the National Institute of Diabetes and Digestive and Kidney Diseases (K99.R00DK133804), in part by University of Colorado Cancer Center, the Katy O. and Paul M. Rady Esophageal and Gastric Center of Excellence, and by the Paul R. O’Hara II Seed Grant, University of Colorado Cancer Center Anschutz Medical Campus, Aurora, Colorado. This work is further supported by a R01 CA215596, P50 CA269022, and G002823 (Thomas Charles M. Esophageal Cancer Endowed Research Fund) to D.R. K.H.L. is supported by the Thoracic Surgery Foundation STS Award and American Association for Thoracic Surgery Surgical Investigator Award.
Institutional Review Board and Consent Statement
Histologically normal biopsies of the esophageal squamous epithelium were collected from consenting men and women who underwent upper endoscopy or surgical resection between 2017 and 2020 at the time of scheduled Barrett’s Esophagus screening or tumor surgical resection at the Michigan Medicine. Samples were collected using protocols approved by the University of Michigan Institutional Review Board. The patient’s race was self-identified. For white non-Hispanics, we used the nomenclature European American; for Black, we used African American.
Data Availability Statement
All data presented in this manuscript are predominantly included in the Main Figures, Supporting Figures (S1-S5) and Supporting Tables S1-S3.
Acknowledgments
We acknowledge the University of Colorado Cancer Center Pathology Shared Resource (PSR) for providing tissue procurement services that supported this study. The Pathology Shared Resource is supported in part by the University of Colorado Cancer Center Support Grant (P30CA046934).
Conflicts of Interest
The authors declare no conflicts of interest.
Abbreviations
The following abbreviations are used in this manuscript:
| AA | African American |
| EA | European American |
| BE | Barrett’s esophagus |
| LGD HGD EAC |
Low grade dysplasia High grade dysplasia Esophageal adenocarcinoma |
| GSTT2 | Glutathione S-transferase theta 2 |
| S.D. | Standard deviation |
References
- Morgan, E.; Soerjomataram, I.; Rumgay, H.; Coleman, H.G.; Thrift, A.P.; Vignat, J.; Laversanne, M.; Ferlay, J.; Arnold, M. The Global Landscape of Esophageal Squamous Cell Carcinoma and Esophageal Adenocarcinoma Incidence and Mortality in 2020 and Projections to 2040: New Estimates From GLOBOCAN 2020. Gastroenterology 2022, 163(3), 649–58 e2. [Google Scholar] [CrossRef] [PubMed]
- Tella, S.H.; Mara, K.; Chakrabarti, S.; Jin, Z.; Mahipal, A. A glimpse into the future of esophageal carcinoma in the United States: predicting the future incidence until 2040 based on the current epidemiological data. J. Gastrointest. Oncol. 2023, 14(1), 1–10. [Google Scholar] [CrossRef] [PubMed] [PubMed Central]
- Fitzgerald, R.C. Barrett’s Esophagus Epub 2026/04/29. N Engl. J. Med. 2026, 394(17), 1723–35. [Google Scholar] [CrossRef] [PubMed]
- Stachler, M.D.; Taylor-Weiner, A.; Peng, S.; McKenna, A.; Agoston, A.T.; Odze, R.D.; Davison, J.M.; Nason, K.S.; Loda, M.; Leshchiner, I.; Stewart, C.; Stojanov, P.; Seepo, S.; Lawrence, M.S.; Ferrer-Torres, D.; Lin, J.; Chang, A.C.; Gabriel, S.B.; Lander, E.S.; Beer, D.G.; Getz, G.; Carter, S.L.; Bass, A.J. Paired exome analysis of Barrett’s esophagus and adenocarcinoma. Nat. Genet. 2015, 47(9), 1047–55. [Google Scholar] [CrossRef] [PubMed] [PubMed Central]
- Dulak, A.M.; Stojanov, P.; Peng, S.; Lawrence, M.S.; Fox, C.; Stewart, C.; Bandla, S.; Imamura, Y.; Schumacher, S.E.; Shefler, E.; McKenna, A.; Carter, S.L.; Cibulskis, K.; Sivachenko, A.; Saksena, G.; Voet, D.; Ramos, A.H.; Auclair, D.; Thompson, K.; Sougnez, C.; Onofrio, R.C.; Guiducci, C.; Beroukhim, R.; Zhou, Z.; Lin, L.; Lin, J.; Reddy, R.; Chang, A.; Landrenau, R.; Pennathur, A.; Ogino, S.; Luketich, J.D.; Golub, T.R.; Gabriel, S.B.; Lander, E.S.; Beer, D.G.; Godfrey, T.E.; Getz, G.; Bass, A.J. Exome and whole-genome sequencing of esophageal adenocarcinoma identifies recurrent driver events and mutational complexity. Nat. Genet. 2013, 45(5), 478–86. [Google Scholar] [CrossRef] [PubMed] [PubMed Central]
- Redston, M.; Noffsinger, A.; Kim, A.; Akarca, F.G.; Rara, M.; Stapleton, D.; Nowden, L.; Lash, R.; Bass, A.J.; Stachler, M.D. Abnormal TP53 Predicts Risk of Progression in Patients With Barrett’s Esophagus Regardless of a Diagnosis of Dysplasia. Gastroenterology 2022, 162(2), 468–81. [Google Scholar] [CrossRef] [PubMed] [PubMed Central]
- Han, D.; Zhang, C. The Oxidative Damage and Inflammation Mechanisms in GERD-Induced Barrett’s Esophagus. Front Cell Dev. Biol. 2022, 10, 885537. [Google Scholar] [CrossRef] [PubMed] [PubMed Central]
- Song, J.H.; Han, Y.M.; Kim, W.H.; Park, J.M.; Jeong, M.; Go, E.J.; Hong, S.P.; Hahm, K.B. Oxidative stress from reflux esophagitis to esophageal cancer: the alleviation with antioxidants. Free Radic. Res. 2016, 50(10), 1071-9. [Google Scholar] [CrossRef] [PubMed]
- Peng, D.; Zaika, A.; Que, J.; El-Rifai, W. The antioxidant response in Barrett’s tumorigenesis: A double-edged sword. Redox Biol. 2021, 41, 101894. [Google Scholar] [CrossRef] [PubMed] [PubMed Central]
- Ferrer-Torres, D.; Nancarrow, D.J.; Steinberg, H.; Wang, Z.; Kuick, R.; Weh, K.M.; Mills, R.E.; Ray, D.; Ray, P.; Lin, J.; Chang, A.C.; Reddy, R.M.; Orringer, M.B.; Canto, M.I.; Shaheen, N.J.; Kresty, L.A.; Chak, A.; Wang, T.D.; Rubenstein, J.H.; Beer, D.G. Constitutively Higher Level of GSTT2 in Esophageal Tissues From African Americans Protects Cells Against DNA Damage. Gastroenterology 2019, 156(5), 1404–15. [Google Scholar] [CrossRef] [PubMed] [PubMed Central]
- Hussey, A.J.; Hayes, J.D. Characterization of a human class-Theta glutathione S-transferase with activity towards 1-menaphthyl sulphate. Biochem J. 1992, 286, 929–35. [Google Scholar] [CrossRef] [PubMed] [PubMed Central]
- Rosekrans, S.L.; Baan, B.; Muncan, V.; van den Brink, G.R. Esophageal development and epithelial homeostasis. Am. J. Physiol. Gastrointest. Liver Physiol. 2015, 309(4), G216–28. [Google Scholar] [CrossRef] [PubMed]
- Zhang, Y.; Bailey, D.; Yang, P.; Kim, E.; Que, J. The development and stem cells of the esophagus Epub 2021/03/31. Development 2021, 148(6). [Google Scholar] [CrossRef] [PubMed] [PubMed Central]
- Busslinger, G.A.; Weusten, B.L.A.; Bogte, A.; Begthel, H.; Brosens, L.A.A.; Clevers, H. Human gastrointestinal epithelia of the esophagus, stomach, and duodenum resolved at single-cell resolution. Cell Rep. 2021, 34(10), 108819. [Google Scholar] [CrossRef] [PubMed]
- Busslinger, G.A.; de Barbanson, B.; Oka, R.; Weusten, B.L.A.; de Maat, M.; van Hillegersberg, R.; Brosens, L.A.A.; van Boxtel, R.; van Oudenaarden, A.; Clevers, H. Molecular characterization of Barrett’s esophagus at single-cell resolution. Proc. Natl. Acad. Sci. U S A. 2021, 118(47). [Google Scholar] [CrossRef] [PubMed] [PubMed Central]
- Sarsour, E.H.; Kumar, M.G.; Chaudhuri, L.; Kalen, A.L.; Goswami, P.C. Redox control of the cell cycle in health and disease. Antioxid. Redox Signal 2009, 11(12), 2985–3011. [Google Scholar] [CrossRef] [PubMed] [PubMed Central]
- Li, B.; Ming, H.; Qin, S.; Nice, E.C.; Dong, J.; Du, Z.; Huang, C. Redox regulation: mechanisms, biology and therapeutic targets in diseases. Signal Transduct. Target Ther. 2025, 10(1), 72. [Google Scholar] [CrossRef] [PubMed] [PubMed Central]
- Hirose, W.; Horiuchi, M.; Li, D.; Motoike, I.N.; Zhang, L.; Nishi, H.; Taniyama, Y.; Kamei, T.; Suzuki, M.; Kinoshita, K.; Katsuoka, F.; Taguchi, K.; Yamamoto, M. Selective Elimination of NRF2-Activated Cells by Competition With Neighboring Cells in the Esophageal Epithelium Epub 2022/09/18. Cell Mol. Gastroenterol. Hepatol. 2023, 15(1), 153–78. [Google Scholar] [CrossRef] [PubMed] [PubMed Central]
- Dibb, M.; Ang, Y.S. Targeting the cell cycle in esophageal adenocarcinoma: an adjunct to anticancer treatment. World J. Gastroenterol. 2011, 17(16), 2063–9. [Google Scholar] [CrossRef] [PubMed] [PubMed Central]
- He, F.; Ru, X.; Wen, T. NRF2, a Transcription Factor for Stress Response and Beyond. Int J Mol Sci. 2020, 21. [Google Scholar] [CrossRef] [PubMed] [PubMed Central]
- Lisek, K.; Campaner, E.; Ciani, Y.; Walerych, D.; Del Sal, G. Mutant p53 tunes the NRF2-dependent antioxidant response to support survival of cancer cells. Oncotarget 2018, 9(29), 20508–23. [Google Scholar] [CrossRef] [PubMed] [PubMed Central]
- Harper, J.W.; Burton, J.L.; Solomon, M.J. The anaphase-promoting complex: it’s not just for mitosis any more. Genes Dev. 2002, 16(17), 2179–206. [Google Scholar] [CrossRef] [PubMed]
- Wang, Z.; Inuzuka, H.; Zhong, J.; Wan, L.; Fukushima, H.; Sarkar, F.H.; Wei, W. Tumor suppressor functions of FBW7 in cancer development and progression. FEBS Lett. 2012, 586(10), 1409–18. [Google Scholar] [CrossRef] [PubMed] [PubMed Central]
- Zhang, Q.; Karnak, D.; Tan, M.; Lawrence, T.S.; Morgan, M.A.; Sun, Y. FBXW7 Facilitates Nonhomologous End-Joining via K63-Linked Polyubiquitylation of XRCC4. Mol Cell 2016, 61(3), 419–33. [Google Scholar] [CrossRef] [PubMed] [PubMed Central]
- Ghosh, A.; Ray, P.; Thomas, D.; Jeeyar, V.; Pillai, S.; Basrur, V.; Bondarenko, I.V.; Bellile, E.; Wang, D.H.; Morgan, M.A.; Zhang, Q.; Beer, D.G.; Lagisetty, K.H.; Lawrence, T.S.; Ray, D. ISGylation of gammaH2AX retains MDC1 and facilitates homologous recombination repair causing radioresistance in esophageal adenocarcinoma. J. Biol. Chem. 2026, 302(5), 111358. [Google Scholar] [CrossRef] [PubMed] [PubMed Central]
- Martz, C.A.; Ottina, K.A.; Singleton, K.R.; Jasper, J.S.; Wardell, S.E.; Peraza-Penton, A.; Anderson, G.R.; Winter, P.S.; Wang, T.; Alley, H.M.; Kwong, L.N.; Cooper, Z.A.; Tetzlaff, M.; Chen, P.L.; Rathmell, J.C.; Flaherty, K.T.; Wargo, J.A.; McDonnell, D.P.; Sabatini, D.M.; Wood, K.C. Systematic identification of signaling pathways with potential to confer anticancer drug resistance. Sci. Signal. 2014, 7(357), ra121. [Google Scholar] [CrossRef] [PubMed] [PubMed Central]
- Junk, D.J.; Vrba, L.; Watts, G.S.; Oshiro, M.M.; Martinez, J.D.; Futscher, B.W. Different mutant/wild-type p53 combinations cause a spectrum of increased invasive potential in nonmalignant immortalized human mammary epithelial cells. Neoplasia 2008, 10(5), 450–61. [Google Scholar] [CrossRef] [PubMed] [PubMed Central]
- Ray, D.; Ahsan, A.; Helman, A.; Chen, G.; Hegde, A.; Gurjar, S.R.; Zhao, L.; Kiyokawa, H.; Beer, D.G.; Lawrence, T.S.; Nyati, M.K. Regulation of EGFR protein stability by the HECT-type ubiquitin ligase SMURF2. Neoplasia 2011, 13(7), 570–8. [Google Scholar] [CrossRef] [PubMed] [PubMed Central]
- Ferrer-Torres, D.; Wu, J.H.; Zhang, C.J.; Hammer, M.A.; Dame, M.K.; Wu, A.; Holloway, E.M.; Karpoff, K.; McCarthy, C.L.; Bohm, M.S.; Cuttitta, A.J.; Tigani, D.J.; Huang, S.; Tsai, Y.H.; Miller, A.J.; Walker, T.; Bayer, D.E.; Hogan, S.P.; Turgeon, D.K.; Lin, J.; Higgins, P.D.R.; Sexton, J.; Spence, J.R. Mapping the adult human esophagus in vivo and in vitro Epub 2022/10/25. Development 2022, 149(20). [Google Scholar] [CrossRef] [PubMed] [PubMed Central]
- Lambert, S.A.; Jolma, A.; Campitelli, L.F.; Das, P.K.; Yin, Y.; Albu, M.; Chen, X.; Taipale, J.; Hughes, T.R.; Weirauch, M.T. The Human Transcription Factors. Cell 2018, 172(4), 650–65. [Google Scholar] [CrossRef] [PubMed] [PubMed Central]
- Ferrer-Torres, D.; Nancarrow, D.J.; Kuick, R.; Thomas, D.G.; Nadal, E.; Lin, J.; Chang, A.C.; Reddy, R.M.; Orringer, M.B.; Taylor, J.M.; Wang, T.D.; Beer, D.G. Genomic similarity between gastroesophageal junction and esophageal Barrett’s adenocarcinomas. Oncotarget 2016, 7(34), 54867–82. [Google Scholar] [CrossRef] [PubMed] [PubMed Central]
- Wang, C.; Shu, L.; Zhang, C.; Li, W.; Wu, R.; Guo, Y.; Yang, Y.; Kong, A.N. Histone Methyltransferase Setd7 Regulates Nrf2 Signaling Pathway by Phenethyl Isothiocyanate and Ursolic Acid in Human Prostate Cancer Cells. Mol. Nutr. Food Res. 2018, 62(18), e1700840. [Google Scholar] [CrossRef] [PubMed] [PubMed Central]
- Huang, W.; Ray, P.; Ji, W.; Wang, Z.; Nancarrow, D.; Chen, G.; Galban, S.; Lawrence, T.S.; Beer, D.G.; Rehemtulla, A.; Ramnath, N.; Ray, D. The cytochrome P450 enzyme CYP24A1 increases proliferation of mutant KRAS-dependent lung adenocarcinoma independent of its catalytic activity. J. Biol. Chem. 2020, 295(18), 5906–17. [Google Scholar] [CrossRef] [PubMed] [PubMed Central]
- Alnasser, S.M. The role of glutathione S-transferases in human disease pathogenesis and their current inhibitors. Genes Dis. 2025, 12(4), 101482. [Google Scholar] [CrossRef] [PubMed] [PubMed Central]
- Insel, P.A.; Ostrom, R.S. Forskolin as a tool for examining adenylyl cyclase expression, regulation, and G protein signaling. Cell Mol. Neurobiol. 2003, 23(3), 305–14. [Google Scholar] [CrossRef] [PubMed] [PubMed Central]
- Das, R.; Esposito, V.; Abu-Abed, M.; Anand, G.S.; Taylor, S.S.; Melacini, G. cAMP activation of PKA defines an ancient signaling mechanism. Proc. Natl. Acad. Sci. U S A 2007, 104(1), 93–8. [Google Scholar] [CrossRef] [PubMed] [PubMed Central]
- Takahashi, M.; Li, Y.; Dillon, T.J.; Stork, P.J. Phosphorylation of Rap1 by cAMP-dependent Protein Kinase (PKA) Creates a Binding Site for KSR to Sustain ERK Activation by cAMP. J. Biol. Chem. 2017, 292(4), 1449–61. [Google Scholar] [CrossRef] [PubMed] [PubMed Central]
- Kotani, S.; Tugendreich, S.; Fujii, M.; Jorgensen, P.M.; Watanabe, N.; Hoog, C.; Hieter, P.; Todokoro, K. PKA and MPF-activated polo-like kinase regulate anaphase-promoting complex activity and mitosis progression. Mol. Cell 1998, 1(3), 371–80. [Google Scholar] [CrossRef] [PubMed]
- Ji, S.; Qin, Y.; Shi, S.; Liu, X.; Hu, H.; Zhou, H.; Gao, J.; Zhang, B.; Xu, W.; Liu, J.; Liang, D.; Liu, L.; Liu, C.; Long, J.; Zhou, H.; Chiao, P.J.; Xu, J.; Ni, Q.; Gao, D.; Yu, X. ERK kinase phosphorylates and destabilizes the tumor suppressor FBW7 in pancreatic cancer. Cell Res. 2015, 25(5), 561–73. [Google Scholar] [CrossRef] [PubMed] [PubMed Central]
- Peters, J.M. The anaphase promoting complex/cyclosome: a machine designed to destroy. Nat. Rev. Mol. Cell Biol. 2006, 7(9), 644–56. [Google Scholar] [CrossRef] [PubMed]
- Lau, A.W.; Inuzuka, H.; Fukushima, H.; Wan, L.; Liu, P.; Gao, D.; Sun, Y.; Wei, W. Regulation of APC(Cdh1) E3 ligase activity by the Fbw7/cyclin E signaling axis contributes to the tumor suppressor function of Fbw7. Cell Res. 2013, 23(7), 947–61. [Google Scholar] [CrossRef] [PubMed] [PubMed Central]
- Hao, B.; Oehlmann, S.; Sowa, M.E.; Harper, J.W.; Pavletich, N.P. Structure of a Fbw7-Skp1-cyclin E complex: multisite-phosphorylated substrate recognition by SCF ubiquitin ligases Epub 2007/04/17. Mol. Cell 2007, 26(1), 131–43. [Google Scholar] [CrossRef] [PubMed]
- Jardim, D.L.; Wheler, J.J.; Hess, K.; Tsimberidou, A.M.; Zinner, R.; Janku, F.; Subbiah, V.; Naing, A.; Piha-Paul, S.A.; Westin, S.N.; Roy-Chowdhuri, S.; Meric-Bernstam, F.; Hong, D.S. FBXW7 mutations in patients with advanced cancers: clinical and molecular characteristics and outcomes with mTOR inhibitors. PLoS One 2014, 9(2), e89388. [Google Scholar] [CrossRef] [PubMed] [PubMed Central]
- Chen, R.; Chen, K.; Zhan, X.; Qi, Y.; Wang, H.; Shen, L.; Xue, S.; Chen, J.; Chen, L.; Sheng, Y.; Dai, L.; Wang, A.; Wang, H.; Xiong, Y.; Cheng, G.; Mu, C.; Gu, M.; Li, W. Glutathione S-transferase Theta 2 causes drug resistance by inhibiting arsenic trioxide-induced ferroptosis in pancreatic ductal adenocarcinoma. Free Radic. Biol. Med. 2025, 238, 402–16. [Google Scholar] [CrossRef] [PubMed]
- Doupe, D.P.; Alcolea, M.P.; Roshan, A.; Zhang, G.; Klein, A.M.; Simons, B.D.; Jones, P.H. A single progenitor population switches behavior to maintain and repair esophageal epithelium. Science 2012, 337(6098), 1091–3. [Google Scholar] [CrossRef] [PubMed] [PubMed Central]
- Daniely, Y.; Liao, G.; Dixon, D.; Linnoila, R.I.; Lori, A.; Randell, S.H.; Oren, M.; Jetten, A.M. Critical role of p63 in the development of a normal esophageal and tracheobronchial epithelium Epub 2004/06/11. Am. J. Physiol. Cell Physiol. 2004, 287(1), C171–81. [Google Scholar] [CrossRef] [PubMed]
- Spechler, S.J.; Souza, R.F. Barrett’s esophagus. N Engl. J. Med. 2014, 371(9), 836–45. [Google Scholar] [CrossRef] [PubMed]
- Rustgi, A.K.; El-Serag, H.B. Esophageal carcinoma. N Engl. J. Med. 2014, 371(26), 2499–509. [Google Scholar] [CrossRef] [PubMed]
- Shaheen, N.J.; Falk, G.W.; Iyer, P.G.; Gerson, L.B.; American College of G. ACG Clinical Guideline: Diagnosis and Management of Barrett’s Esophagus. Am. J. Gastroenterol. 2016, 111(1), 30–50. [Google Scholar] [CrossRef] [PubMed] [PubMed Central]
- Welcker, M.; Clurman, B.E. FBW7 ubiquitin ligase: a tumour suppressor at the crossroads of cell division, growth and differentiation. Nat. Rev. Cancer 2008, 8(2), 83–93. [Google Scholar] [CrossRef] [PubMed]
- Pfister, N.T.; Prives, C. Chromatin dysregulation by mutant p53. Oncotarget 2016, 7(21), 29875–6. [Google Scholar] [CrossRef] [PubMed] [PubMed Central]
- Fischer, M.; Schwarz, R.; Riege, K.; Forste, S.; Schwab, K.; Wiechens, E.; van Bommel, A.; Hoffmann, S. p53 reveals principles of chromatin remodeling and enhancer activation Epub 2025/06/06. Nucleic Acids Res. 2025, 53(11). [Google Scholar] [CrossRef] [PubMed] [PubMed Central]
- Pan, B.; Sun, Q.; Li, R.; Feng, J.; Hao, J.; Xie, B.; Zhao, X.; Zhao, Z.; Wei, P.; Lan, Q.; Xie, S.; Xie, T.; Chen, Y.; Wei, K.; Zhong, X.; Qi, H.; Ni, L.; Dong, C. Zbtb32 promotes CD8+ T cell differentiation and function in cancer Epub 2026/02/06. J. Exp. Med. 2026, 223(4). [Google Scholar] [CrossRef] [PubMed]
- Van Wyngene, L.; Vanderhaeghen, T.; Petta, I.; Timmermans, S.; Corbeels, K.; Van der Schueren, B.; Vandewalle, J.; Van Looveren, K.; Wallaeys, C.; Eggermont, M.; Dewaele, S.; Catrysse, L.; van Loo, G.; Beyaert, R.; Vangoitsenhoven, R.; Nakayama, T.; Tavernier, J.; De Bosscher, K.; Libert, C. ZBTB32 performs crosstalk with the glucocorticoid receptor and is crucial in glucocorticoid responses to starvation. iScience 2021, 24(7), 102790. [Google Scholar] [CrossRef] [PubMed] [PubMed Central]
- Ye, H.; Duan, M. FOXN2 is downregulated in breast cancer and regulates migration, invasion, and epithelial- mesenchymal transition through regulation of SLUG. Cancer Manag Res. 2019, 11, 525–35. [Google Scholar] [CrossRef] [PubMed] [PubMed Central]
- Dulak, A.M.; Schumacher, S.E.; van Lieshout, J.; Imamura, Y.; Fox, C.; Shim, B.; Ramos, A.H.; Saksena, G.; Baca, S.C.; Baselga, J.; Tabernero, J.; Barretina, J.; Enzinger, P.C.; Corso, G.; Roviello, F.; Lin, L.; Bandla, S.; Luketich, J.D.; Pennathur, A.; Meyerson, M.; Ogino, S.; Shivdasani, R.A.; Beer, D.G.; Godfrey, T.E.; Beroukhim, R.; Bass, A.J. Gastrointestinal adenocarcinomas of the esophagus, stomach, and colon exhibit distinct patterns of genome instability and oncogenesis. Cancer Res. 2012, 72(17), 4383–93. [Google Scholar] [CrossRef] [PubMed] [PubMed Central]
Figure 1.
Spatial localization of GSTT2 mRNA and protein in developing and adult human esophagus and spatial expression patterns in African American versus European American tissue, and Barrett’s esophagus. (A) Fluorescent in situ hybridization of esophageal tissue sections of early developmental samples vs adult esophagus. (B) Co-immunofluorescence staining for GSTT2 (red), the basal/progenitor cell marker TP63 (green), and DAPI (grey) in developing (left) and adult (right) human esophageal tissue. GSTT2 and TP63 signals co-localize within the epithelial layer in both developmental and adult contexts, demonstrating expression of GSTT2 in TP63-positive basal cells. In both, GSTT2 was expressed in the full thickness stratified epithelium as well as the laminar propria. In early development, there is high levels of GSTT2 expression in the ciliated-luminal compartment. (C) Co-immunofluorescence staining for GSTT2 (red), TP63 (green), and DAPI (grey) in esophageal biopsy tissue from African American (AA, left) and European American (EA, right) subjects. Dashed boxes indicate regions shown at higher magnification in adjacent panels. (D) GSTT2 protein (red) with DAPI (grey) in normal squamous esophagus (NS) and Barrett’s esophagus (BE). Insets 1a–1b, higher-magnification views of BE dysplastic regions display increased GSTT2 signal relative to non-dysplastic metaplastic regions. AA, African American; EA, European American; E, epithelium; LP, lamina propria; L, lumen.
Figure 1.
Spatial localization of GSTT2 mRNA and protein in developing and adult human esophagus and spatial expression patterns in African American versus European American tissue, and Barrett’s esophagus. (A) Fluorescent in situ hybridization of esophageal tissue sections of early developmental samples vs adult esophagus. (B) Co-immunofluorescence staining for GSTT2 (red), the basal/progenitor cell marker TP63 (green), and DAPI (grey) in developing (left) and adult (right) human esophageal tissue. GSTT2 and TP63 signals co-localize within the epithelial layer in both developmental and adult contexts, demonstrating expression of GSTT2 in TP63-positive basal cells. In both, GSTT2 was expressed in the full thickness stratified epithelium as well as the laminar propria. In early development, there is high levels of GSTT2 expression in the ciliated-luminal compartment. (C) Co-immunofluorescence staining for GSTT2 (red), TP63 (green), and DAPI (grey) in esophageal biopsy tissue from African American (AA, left) and European American (EA, right) subjects. Dashed boxes indicate regions shown at higher magnification in adjacent panels. (D) GSTT2 protein (red) with DAPI (grey) in normal squamous esophagus (NS) and Barrett’s esophagus (BE). Insets 1a–1b, higher-magnification views of BE dysplastic regions display increased GSTT2 signal relative to non-dysplastic metaplastic regions. AA, African American; EA, European American; E, epithelium; LP, lamina propria; L, lumen.
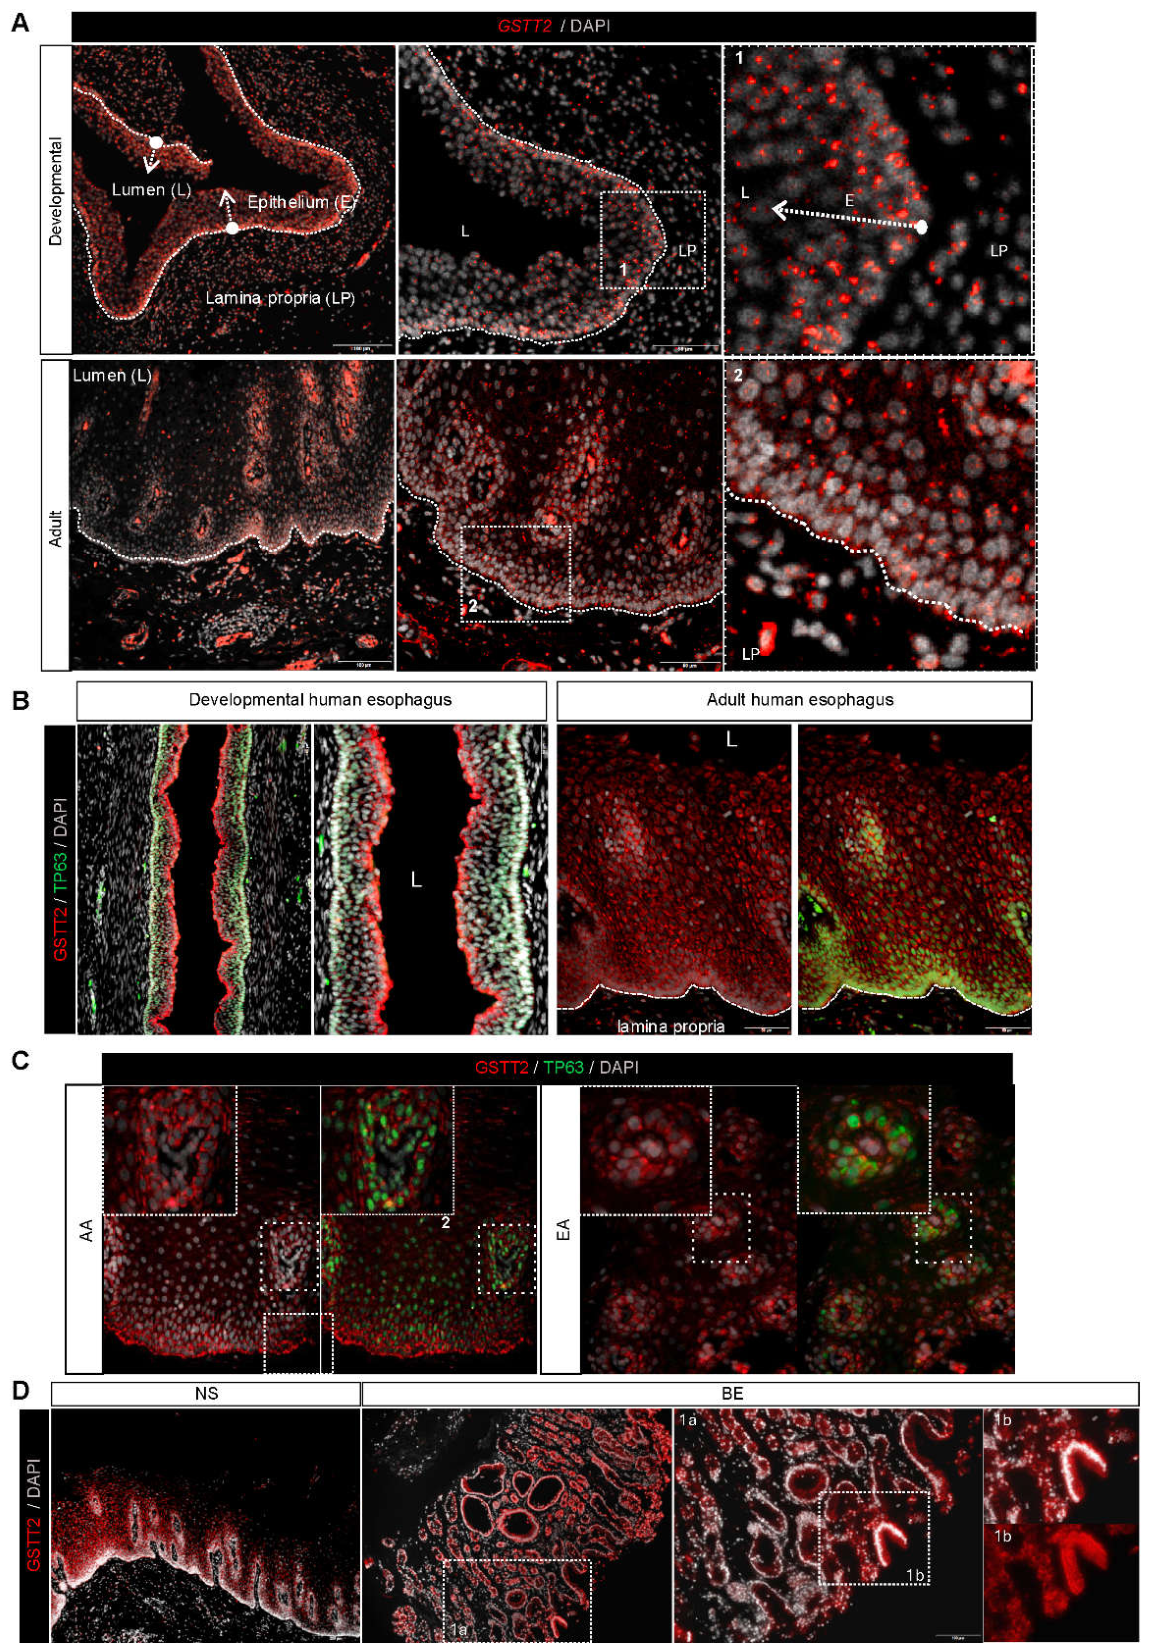
Figure 2.
GSTT2 co-expression switches to a proliferative program in therapy-resistant EAC. Genes co-expressed with GSTT2 (Pearson r ≥ 0.5) were identified within each cohort and tested for pathway over-representation. (A) Schematic of the disease axis. (B) Hallmark pathway enrichment (−log10 FDR) across cohorts; G2-M Checkpoint and E2F Targets rise specifically in resistant EAC. (C) Membership of GSTT2-correlated genes across progression and resistance EAC cohorts. (D) Top enriched pathways in resistant EAC. (E) Number of significantly enriched terms (FDR < 0.05) per cohort: 0 (normal), 3 (progression only), 463 (resistant EAC).
Figure 2.
GSTT2 co-expression switches to a proliferative program in therapy-resistant EAC. Genes co-expressed with GSTT2 (Pearson r ≥ 0.5) were identified within each cohort and tested for pathway over-representation. (A) Schematic of the disease axis. (B) Hallmark pathway enrichment (−log10 FDR) across cohorts; G2-M Checkpoint and E2F Targets rise specifically in resistant EAC. (C) Membership of GSTT2-correlated genes across progression and resistance EAC cohorts. (D) Top enriched pathways in resistant EAC. (E) Number of significantly enriched terms (FDR < 0.05) per cohort: 0 (normal), 3 (progression only), 463 (resistant EAC).
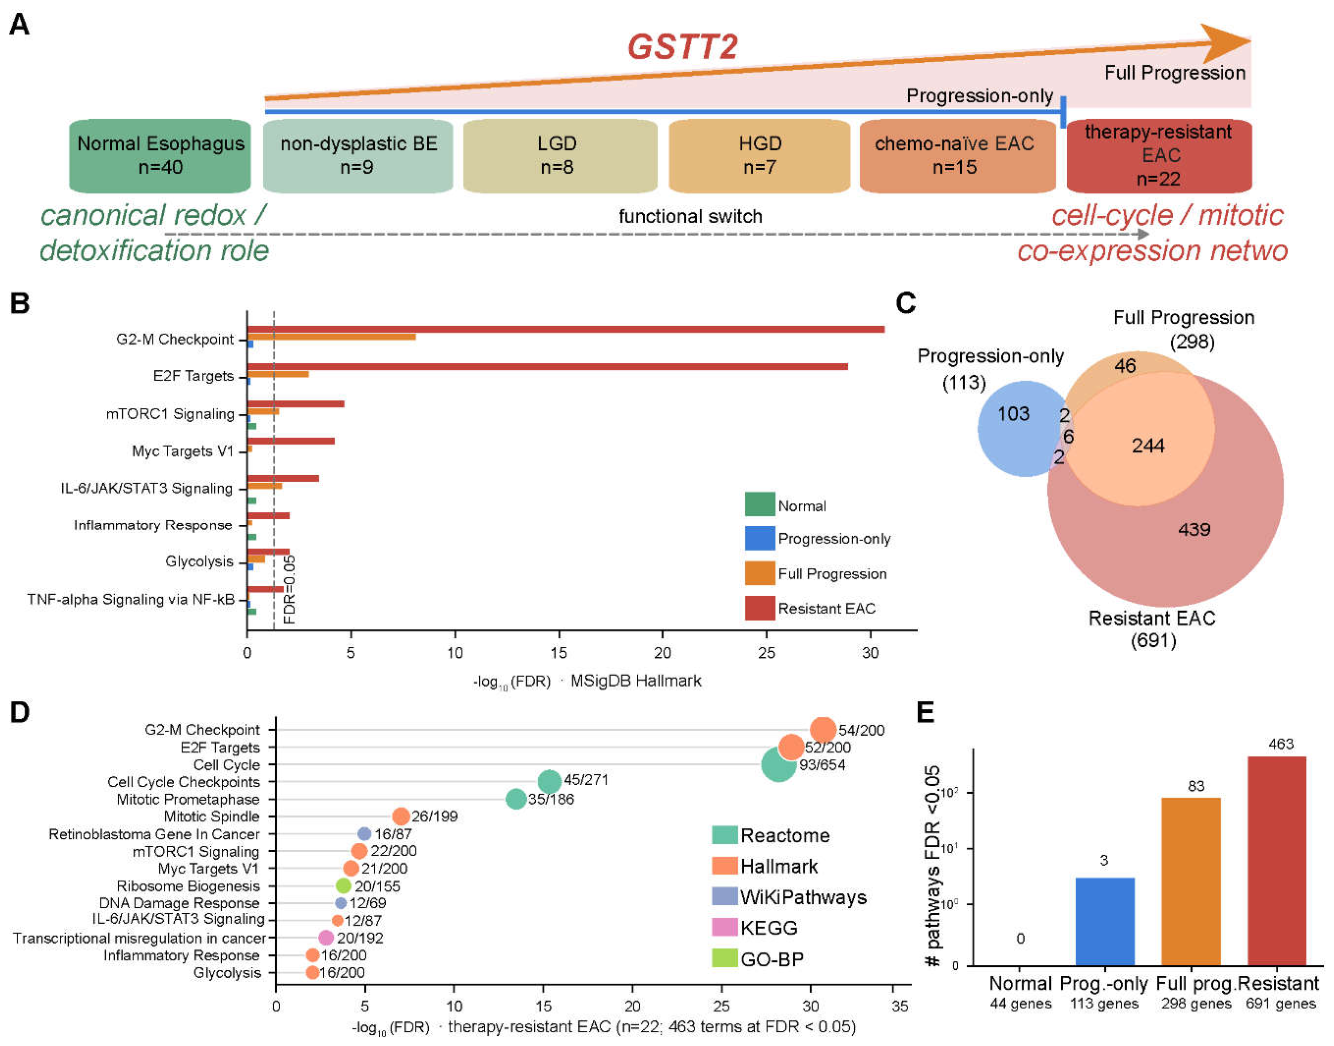
Figure 3.
GSTT2 is a cell cycle regulated protein. (A) Putative APC-C and FBXW7 binding domains are present in GSTT2 protein. (B) HeLa cells were subjected to cell synchronization studies using double thymidine black and release. Following synchronization, cells were harvested every two hours, fixed, and subjected to FACS analysis. (C) Proteins lysates were also prepared from another set of plates and subjected to immunoblotting using indicated antibodies. (D) HeLa cells were infected with lentivirus expressing either p53-R175H-V5 or -R273H-V5 transgene and transduced cells were selected using puromycin and G418 respectively to obtain stable isogenic lines. Cell lysates from the three isogenic lines were subjected to immunoblotting using indicated antibodies. (E, F) The above isogenic HeLa cells were first synchronized and collected at indicated time points. Cells were then subjected to fractionation as detailed in the materials and methods. Cytosolic and membrane fractions were then subjected to immunoblotting, as shown. Alpha-tubulin was used as a cytosolic, and EGFR as a membrane marker.
Figure 3.
GSTT2 is a cell cycle regulated protein. (A) Putative APC-C and FBXW7 binding domains are present in GSTT2 protein. (B) HeLa cells were subjected to cell synchronization studies using double thymidine black and release. Following synchronization, cells were harvested every two hours, fixed, and subjected to FACS analysis. (C) Proteins lysates were also prepared from another set of plates and subjected to immunoblotting using indicated antibodies. (D) HeLa cells were infected with lentivirus expressing either p53-R175H-V5 or -R273H-V5 transgene and transduced cells were selected using puromycin and G418 respectively to obtain stable isogenic lines. Cell lysates from the three isogenic lines were subjected to immunoblotting using indicated antibodies. (E, F) The above isogenic HeLa cells were first synchronized and collected at indicated time points. Cells were then subjected to fractionation as detailed in the materials and methods. Cytosolic and membrane fractions were then subjected to immunoblotting, as shown. Alpha-tubulin was used as a cytosolic, and EGFR as a membrane marker.
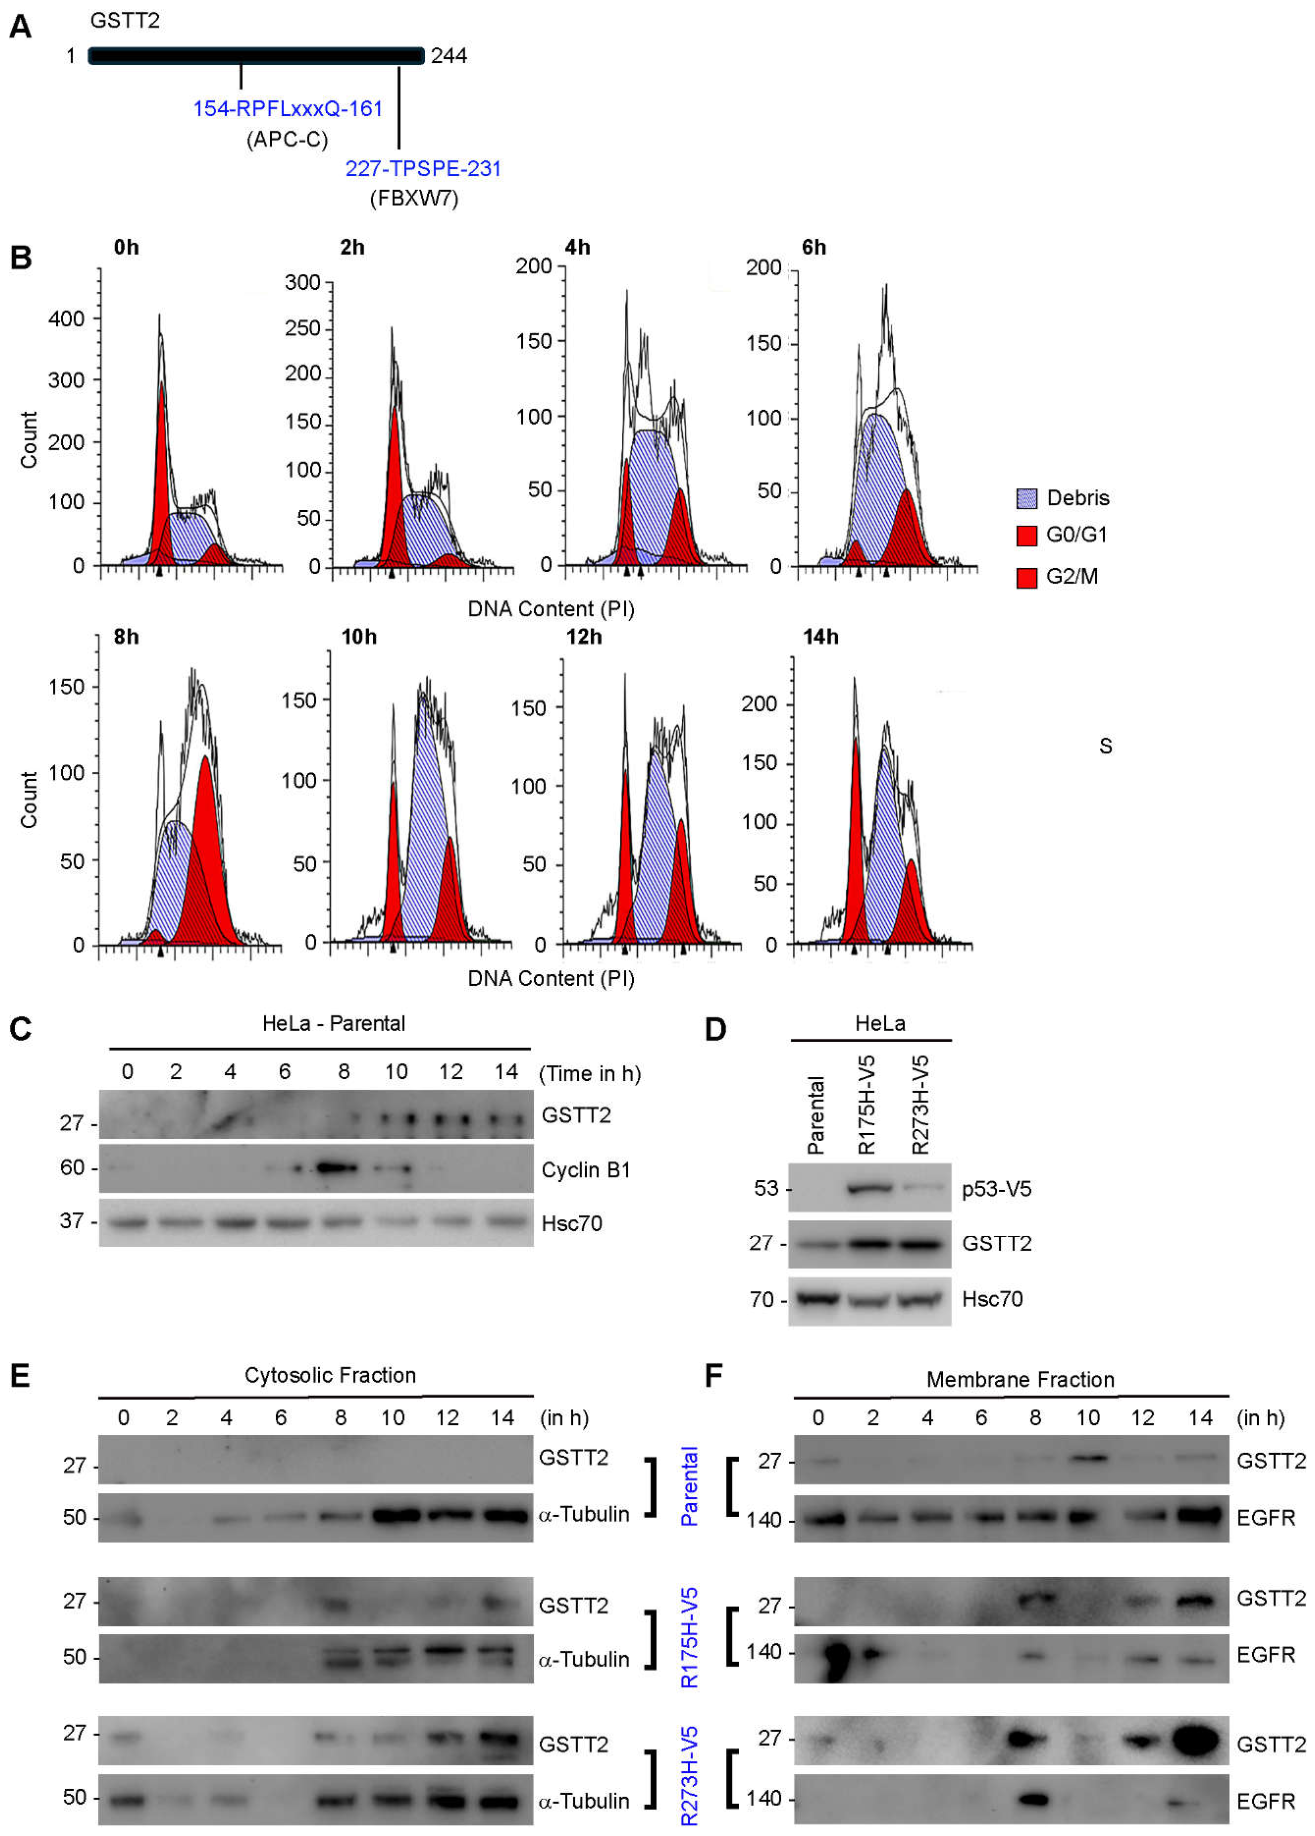
Figure 4.
GSTT2 is a novel substrate of APC-CDC20 and FBXW7. (A) Het-1A cells were treated with different concentrations of forskolin as indicated. Twenty-four hours post-treatment, cells were harvested, and cell lysates were subjected to immunoblotting using indicated antibodies. (B) Human embryonic kidney (HEK-293) cells were transfected with HA-tagged GSTT2 along with either CDH1 or CDC20 (as indicated). Twenty-four hours post-transfection, cells were treated with 10 mM of forskolin for additional 24 hours. Cell lysates were then harvested followed by immunoblotting using GSTT2 antibody and immunoblotted as shown. Total cell lysates were used as inputs. (C) Het-1A cells were transfected with either non-specific (control), CDH1 or CDC20 siRNAs as indicated. Forty-eight hours post-transfection, cell lysates were prepared and immunoblotted as shown. (D) HEK-293 cells were transfected with HSTT2-HA along with DDK-tagged FBXW7 as shown. Twenty-four hours post-transfection, cells were treated with forskolin as above and collected after 24 hours post-treatment. Cell lysates were subjected to immunoblotting as indicated. (E) Het-1A cells were subjected to siRNA transfection using either control or FBXW7 specific siRNAs as indicated. Forty-eight hours post-transfection, cells were treated with forskolin as above and 24 hours post-treatment, cell lysates were prepared and immunoblotted. (F) Het-1A cells were plated in triplicate at a clonal density and 24 hours post-plating treated with different doses of forskolin. Cells were left for clonogenic survival assay as detailed in materials and methods. Survival fraction (SF) was calculated for each treatment setting considering DMSO treated condition as ‘1’. Similar experiments were performed three independent times and statistical significance were calculated by unpaired t-test (1 mM: ns; 3 mM: p =0.019; 10 mM: p =0.0012). Error bars represent mean ± SD. (G) Het-1A cells were treated with 50 mM H2O2 and cells’ ability to repair damaged DNA were determined at different at 24 hours post-treatment using alkaline comet assay. Results showing quantification of olive tail moment (n=50 cells) showing repair defects upon H2O2 damage and subsequent treatment of forskolin treatment (10 mM). The statistical significance of differences between control, H2O2, and H2O2+forskolin treated groups were evaluated using 2-way ANOVA and p values were included. (H) Cell lysates from the above study were also harvested and subjected to immunoblotting using indicated antibodies.
Figure 4.
GSTT2 is a novel substrate of APC-CDC20 and FBXW7. (A) Het-1A cells were treated with different concentrations of forskolin as indicated. Twenty-four hours post-treatment, cells were harvested, and cell lysates were subjected to immunoblotting using indicated antibodies. (B) Human embryonic kidney (HEK-293) cells were transfected with HA-tagged GSTT2 along with either CDH1 or CDC20 (as indicated). Twenty-four hours post-transfection, cells were treated with 10 mM of forskolin for additional 24 hours. Cell lysates were then harvested followed by immunoblotting using GSTT2 antibody and immunoblotted as shown. Total cell lysates were used as inputs. (C) Het-1A cells were transfected with either non-specific (control), CDH1 or CDC20 siRNAs as indicated. Forty-eight hours post-transfection, cell lysates were prepared and immunoblotted as shown. (D) HEK-293 cells were transfected with HSTT2-HA along with DDK-tagged FBXW7 as shown. Twenty-four hours post-transfection, cells were treated with forskolin as above and collected after 24 hours post-treatment. Cell lysates were subjected to immunoblotting as indicated. (E) Het-1A cells were subjected to siRNA transfection using either control or FBXW7 specific siRNAs as indicated. Forty-eight hours post-transfection, cells were treated with forskolin as above and 24 hours post-treatment, cell lysates were prepared and immunoblotted. (F) Het-1A cells were plated in triplicate at a clonal density and 24 hours post-plating treated with different doses of forskolin. Cells were left for clonogenic survival assay as detailed in materials and methods. Survival fraction (SF) was calculated for each treatment setting considering DMSO treated condition as ‘1’. Similar experiments were performed three independent times and statistical significance were calculated by unpaired t-test (1 mM: ns; 3 mM: p =0.019; 10 mM: p =0.0012). Error bars represent mean ± SD. (G) Het-1A cells were treated with 50 mM H2O2 and cells’ ability to repair damaged DNA were determined at different at 24 hours post-treatment using alkaline comet assay. Results showing quantification of olive tail moment (n=50 cells) showing repair defects upon H2O2 damage and subsequent treatment of forskolin treatment (10 mM). The statistical significance of differences between control, H2O2, and H2O2+forskolin treated groups were evaluated using 2-way ANOVA and p values were included. (H) Cell lysates from the above study were also harvested and subjected to immunoblotting using indicated antibodies.
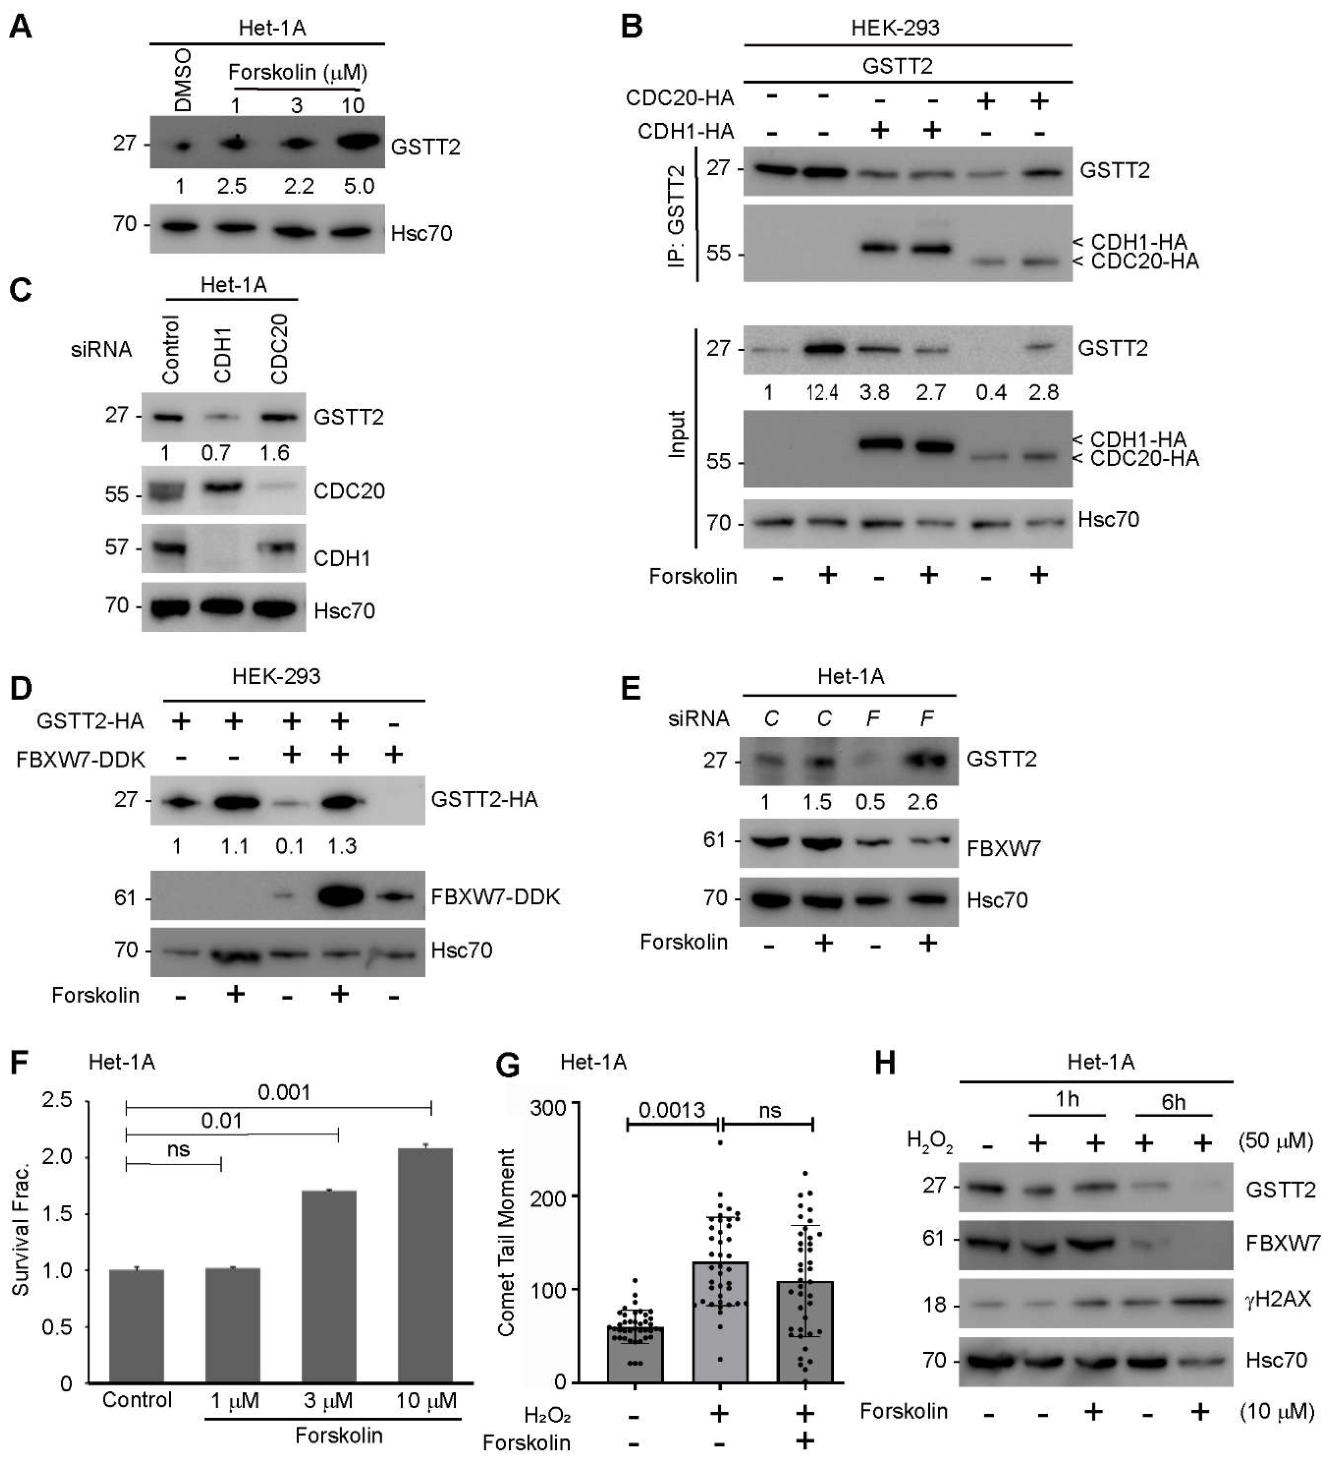
Figure 6.
In treatment resistant EACs, GSTT2 expression is induced and is correlated with mitotic regulators. (A) Affymetrix based gene expression of GSTT2, NFE2L2 and TP53 were analyzed isolated from six different groups (Barrett’s (BE), low- and high-grade dysplasia (LGD, HGD), EAC and treatment resistant EAC as shown. (B-E) We have performed correlation of gene expression between GSTT2 and CDK1, between GSTT2 and CDC20 in treatment resistant EAC patients (n=22) and in an independent cohort of EAC/GEJ tumors (n=122) as indicated. Analyses include Pearson correlation (r value) and statistical significance (p-value) for each gene set. (F) Two EAC cell lines (Flo1 and Eso51) were transfected with either control or CDC20 siRNAs. Forty-eight hours post transfection, cell lysates were prepared and subjected to immunoblotting using indicated antibodies. (G) Schematic model showing: (i) In normal esophagus: the importance of FBXW7/CDC20-GSTT2 axis involved in degrading GSTT2 protein levels in wild-type p53 containing normal esophageal cells, maintain cellular homeostasis via protecting cells from redox-induced DNA damage repair; and (ii) in contrast, in EAC cells with mutant p53 and additional presence of FBXW7 loss or mutation, causing aberrant CDC20 expression/activation that stabilizing GSTT2 protein to promote efficient DNA damage repair and hyperproliferative potential causing therapy resistance.
Figure 6.
In treatment resistant EACs, GSTT2 expression is induced and is correlated with mitotic regulators. (A) Affymetrix based gene expression of GSTT2, NFE2L2 and TP53 were analyzed isolated from six different groups (Barrett’s (BE), low- and high-grade dysplasia (LGD, HGD), EAC and treatment resistant EAC as shown. (B-E) We have performed correlation of gene expression between GSTT2 and CDK1, between GSTT2 and CDC20 in treatment resistant EAC patients (n=22) and in an independent cohort of EAC/GEJ tumors (n=122) as indicated. Analyses include Pearson correlation (r value) and statistical significance (p-value) for each gene set. (F) Two EAC cell lines (Flo1 and Eso51) were transfected with either control or CDC20 siRNAs. Forty-eight hours post transfection, cell lysates were prepared and subjected to immunoblotting using indicated antibodies. (G) Schematic model showing: (i) In normal esophagus: the importance of FBXW7/CDC20-GSTT2 axis involved in degrading GSTT2 protein levels in wild-type p53 containing normal esophageal cells, maintain cellular homeostasis via protecting cells from redox-induced DNA damage repair; and (ii) in contrast, in EAC cells with mutant p53 and additional presence of FBXW7 loss or mutation, causing aberrant CDC20 expression/activation that stabilizing GSTT2 protein to promote efficient DNA damage repair and hyperproliferative potential causing therapy resistance.
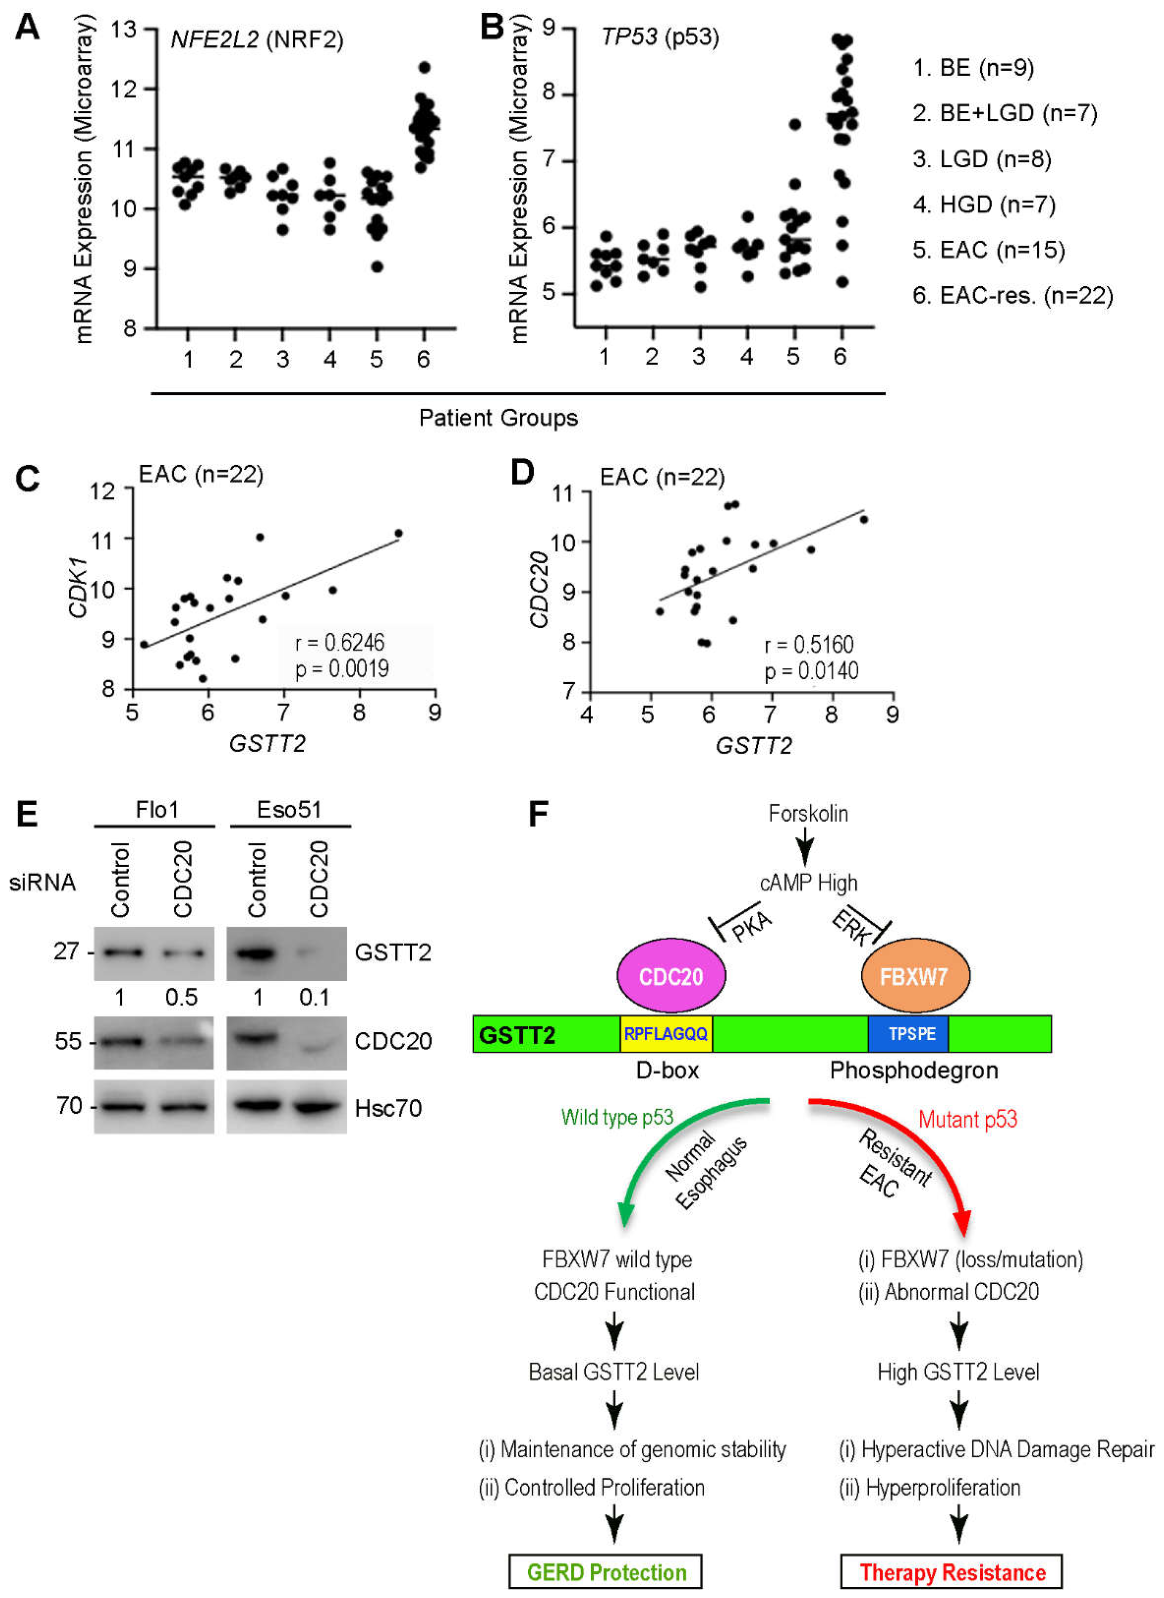
Disclaimer/Publisher’s Note: The statements, opinions and data contained in all publications are solely those of the individual author(s) and contributor(s) and not of MDPI and/or the editor(s). MDPI and/or the editor(s) disclaim responsibility for any injury to people or property resulting from any ideas, methods, instructions or products referred to in the content. |
© 2026 by the authors. Licensee MDPI, Basel, Switzerland. This article is an open access article distributed under the terms and conditions of the Creative Commons Attribution (CC BY) license (http://creativecommons.org/licenses/by/4.0/).
Copyright: This open access article is published under a Creative Commons CC BY 4.0 license, which permit the free download, distribution, and reuse, provided that the author and preprint are cited in any reuse.