
Submitted:
26 August 2026
Posted:
26 August 2026
You are already at the latest version
Abstract
Astragalus L. species are recognized for their prominent biological activities, making them useful in the treatment of several diseases. Astragalus spruneri (AS), a perennial prostrate herbaceous wild plant endemic to Southeast Europe and Turkey, remains insufficiently explored to date. The present study investigated total phenolic content, DPPH radical-scavenging activity, and in vitro cytotoxic activity of extracts from aerial parts of A. spruneri. We analyzed the potential of methanolic (ASM) and ethanolic (ASE) extracts to induce cell death in MCF-7 cells using the Incucyte® Cytotox NIR dye and bright-field microscopy. ASE of the leaf was richer in flavonoids, whereas ASM of the leaf displayed higher antioxidant activity than the stem. Live-cell analysis showed that ASE of the leaf exhibited the highest cytotoxic potency (EC50 = 125 μg/mL after 48 hours) and induced a time- and concentration-dependent increase in Cytotox NIR signal. Compared with the vehicle control, ASE of the leaf produced an earlier onset and more significant sustained cytotoxic activity in MCF-7 cells. Western blot analysis further demonstrated that AS extract modulated PUMA protein expression. The Cytotox NIR assay provided new insights into distinct extract- and tissue-dependent cytotoxic responses against MCF-7 cancer cells, with ethanolic leaf extracts exhibiting the most prominent effect. Thus, it can be concluded that A. spruneri serves as a valuable source of natural bioactive compounds with promising cytotoxic activity. Hence, further research is needed to confirm its anticancer potential and assess its safety profile.
Keywords:
Astragalus spruneri
; cytotoxic effect
; bioactive compounds
; MCF-7 cells
; live-cell analysis
1. Introduction
Cancer represents one of the most prevalent causes of death worldwide, comprising about 10 million globally in 2020 [1]. Notably, breast cancer is the most commonly diagnosed malignancy across countries, with about 2.3 million new cases, making up 11.7% of all cancer diagnoses. According to estimates of the World Health Organization [2], the incidence in developed nations was 88% higher, whereas mortality rate was 17% lower compared to developing regions. In contrast with other regions, the significant incidence increases in Europe and Oceania were preferentially detected in estrogen receptor-positive cancer, while estrogen receptor-negative cancer rates are falling. Overall, it continues to be the highest mortality among women with a significant public health burden [3].
Investigations spanning in vitro assays, animal models, and clinical trials have largely attributed natural products as necessary candidates for preclinical development and future therapeutic interventions. To this purpose, numerous plant extracts and bioactive compounds in part revealed to promote antitumor effects [4,5,6,7,8,9,10]. Interestingly, plants or vitamins were selected by 60% of patients as their most favoured form of cancer therapy [11]. Furthermore, the US National Cancer Institute (NCI) from the 1960s to 1980s tested 114,000 natural product extracts and compounds for their potential antitumor activity [12].
A hallmark in carcinogenesis, the disruption of the balance between cell proliferation and apoptosis, may be counteracted by plant-derived biomolecules. Phytochemicals regulate inappropriate molecular activity underlying processes, leading to a curative approach [13]. Subtle alterations in cell death can lead to cell loss and remain a central focus of biological research, bringing to light the importance of targeting these pathways. In this study, cell death is analyzed using Incucyte® Cytotox NIR dye (Sartorius 4646), enabling real-time, robust, and precise measurements. Unlike endpoint assays, which provide only a single snapshot of cell state and exclude time-dependent information, real-time kinetic assays capture the entire time-course of the cell death response. This continuous monitoring reduces inter-sample variation between replicates and minimizes susceptibility to human error, thereby improving precision in longitudinal assessment. The Incucyte® Cytotoxicity Assay enables real-time monitoring of cell death kinetics by automatically scrutinizing dying cells over time using Incucyte® Cytotox NIR Dye. This dye remains non-fluorescent in viable cells but, upon loss of membrane integrity, it binds nucleic acid and emits a near-infrared fluorescent signal at 685-756 nm.
The genus Astragalus is among the largest vascular plant genera of herbs and small shrubs, within the family Fabaceae, distributed across the temperate regions of Europe, Asia, and North America, with particularly pronounced diversity in the Mediterranean and Central Asia. Species of Astragalus have been widely explored for their rich content of bioactive metabolites, including flavonoids, saponins, polysaccharides, and phenolic acids, many of which have demonstrated cytotoxic and antiproliferative activities both in vitro and in vivo [14,15,16,17]. Comprehensively characterized species, such as A. membranaceus, mongholicus etc, are already recognized in both traditional medicine and modern pharmacology for their anticancer potential [18,19,20,21,22], thereby highlighting the genus as a valuable reservoir of antitumor plants.
Nonetheless, Astragalus spruneri Boiss., a perennial, prostrate, ground-hugging herbaceous plant endemic to Southeast Europe and Turkey, remains insufficiently explored to date. It has a limited distribution in its natural habitat and has not been specified for medicinal purposes in traditional medicine. In early studies, phytochemical profiling of Astragalus spruneri demonstrated a valuable reservoir of flavonoids and saponins in the defatted extract, which collectively delineate the plant’s potent antioxidant signature [23,24]. The total volatile compounds of A. spruneri, inhibited REH cells (human acute lymphoid blast leukaemia cells) in a concentration-dependent manner, although their effect was moderate relative to that of other Astragalus species [25]. Therefore, further research with an emphasis on its cytotoxic profile is required to clarify whether it can feasibly contribute to anticancer activity.
Herein, a well-established approach was used to evaluate variation in total phenolic content, total flavonoid content, and antioxidant potential of extracts obtained from aerial parts of Astragalus spruneri using solvents with different polarities to enable the differential extraction of bioactive constituents, including phenolic and flavonoid compounds. These extracts were subsequently investigated using label-free live-cell analysis for their ability to selectively induce cell death in MCF-7 cells, to gain new insights into the tissue-specific and solvent-dependent bioactivity of A. spruneri. In addition, morphological changes and PUMA protein expression were assessed to distinguish further insights into the cellular mechanisms associated with extract-induced cell death. Collectively, this study provides the first report describing kinetic cytotoxic responses of A. spruneri using real-time live-cell analysis to enlighten the understanding of this underexplored species as a potential source of bioactive compounds with anticancer properties.
2. Materials and Methods
2.1. Plant Material
Astragalus spruneri (Fabaceae) was collected from regions with temperate and arid climates in Funare Village, Elbasan, Albania (729 m, 41°16′01″N, 20°17′27″E0), Albania (2025), and authenticated by a botanist at the Department of Biology, University of Elbasan “A. Xhuvani”, Albania. A voucher specimen was deposited at the departmental herbarium for future reference. This plant was shade-dried and then ground.
2.2. Preparation and Extraction Process
Ten grams of dried powdered (flower, leaf, and stem) Astragalus spruneri was successively extracted by dynamic maceration with 100 ml of solvents and water at room temperature for 24 hours (3 times each solvent). The extraction was carried out using ultrasound-assisted extraction (UAE) for 60 minutes at 35–40 °C. The recovery of phenolic compounds from different parts of the A. spuneri was performed consecutively by solid-liquid extraction methods using two different solvent systems: methanol: water (60:40) and ethanol: water (80:20). The phenolic extract was then filtered using a 0.45 µm membrane and stored at -20°C until further analysis.
2.3. Determination of Total Phenolic Content (TPC)
The total phenolic content (TPC) was determined using the Folin–Ciocalteu method, as previously described [26]. Polyphenols were quantified based on the prepared calibration curve (0–10 mgGA/mL; y=1.3839x -0.0006, where R2=0.9997) using standard solutions of gallic acid obtained from Sigma-Aldrich.
The assay sample, 0.5 mL of phenolic extract, 10 mL of distilled water, and 2.5 mL of Folin-Ciocalteu reagent were added to each test tube. The mixture was vortexed and incubated in the dark for 10 minutes. Afterwards, 2 mL of 7.5% sodium carbonate was added to each tube and mixed again. All samples were incubated in a water bath previously preheated to 40°C and allowed to react for 40 minutes. Absorbance was measured at 760 nm at room temperature using a UV-Vis spectrophotometer. The results were expressed as mg gallic acid equivalent per gram of dried plant (mgGAE/g). All measurements were performed in 3 replicates.
2.4. Determination of Total Flavonoid Content (TFC)
The total flavonoid content (TFC) of extracts from different parts of Astragalus spruneri was determined using the aluminum chloride colorimetric method described by [27], with minor modifications. A calibration curve was prepared using standard quercetin (100-1000 μg/mL). Briefly, 1 mL of the dissolved extract was mixed with 4 mL of distilled water in a test tube. Then, 0.3 mL of a 5% sodium nitrite (NaNO2) solution was added, and the mixture was allowed to stand for 6 minutes. Subsequently, 1 mL of 10% aluminum chloride (AlCl3) solution was introduced, and the reaction mixture was left to stand for another 6 minutes. Finally, 0.4 mL of distilled water and 4 mL of 4% sodium hydroxide (NaOH) solution were added, resulting in a colour change from yellow to red. The mixture was then allowed to react in the dark for 15 minutes, after which the absorbance was recorded at 510 nm. The total flavonoid content was expressed in milligrams of quercetin equivalents per gram of oven-dried plant powder (mg QE/g OP).
2.5. DPPH Free Radical Scavenging Activity Assay
dical scavenging activity of Astragalus spruneri extracts was assessed using the stable 1,1-diphenyl-2 picrylhydrazyl (DPPH)-free radical activity [28]. In each test tube, 40 μL of the extract was stirred with 1960 μL of methanol and 2000 μL of 0.1 mM DPPH solution. The blend was then shaken at room temperature and left to react in a dark place for 40 min. The absorbance of each solution was determined at 515 nm using a spectrophotometer, with methanol as a blank. The control consisted of 0.1mM DPPH in methanol. The equation for the total antioxidant activity was employed to establish the relationship as a percentage of total inhibition of DPPH, plotting the following formula:
% DPPH.
Where: A0 was the absorbance reading of the DPPH control measured at the initial time, whereas Ac represents the absorbance reading of the extract after a 40-minute rest in a dark place.
2.6. MCF-7 Cell Culture
MFC- 7 cells were cultured in RPMI-1640 medium (Gibco) supplemented with 10% fetal bovine serum (FBS). Cells were seeded in 6-well tissue culture plates (TPP) and incubated in a humidified incubator at 37°C with a gas mixture of 5% CO₂ and 20% O₂. The medium was refreshed every 2-3 days to maintain appropriate growth conditions. For passaging, cells were detached using TrypLE Express (Gibco) and subcultured at a 1:6 split ratio.
2.7. MFC-7 Cytotoxicity Screening
MFC-7 cells were cultured in RPMI-1640 medium (Gibco) supplemented with 10% fetal bovine serum (FBS) and treated with the target compound at concentrations of 50, 100, 200, and 400 µg/mL, prepared from a 1:100 stock solution in DMSO. Corresponding controls were included: 1% DMSO (vehicle control) and untreated cells. During the treatment period, the medium was supplemented with Incucyte® Cytotox NIR dye (Sartorius, catalogue no. 4646) at a final dilution of 1:1000. Cell imaging was performed every 2 hours using a 4x objective with a 400 ms exposure time on the Incucyte® SX5 Live-Cell Analysis System (Sartorius). Changes in fluorescent intensity over the time course were quantified by calculating the total integrated intensity based on NIR fluorescence using the Incucyte software. Representative bright-field images were processed using Fiji (ImageJ, NIH, Bethesda, MD, USA) to enhance clarity for visualisation. Identical adjustment parameters were applied to all images.
2.8. Western Blot Analysis
Cell lysates were prepared from pelleted MCF-7 cells by adding cold RIPA Lysis Buffer (MILLIPORE, 20-188) with protease inhibitor mix (EDTA-free, Roche), followed by a 30-minute incubation on ice and pipetting every 10 minutes. Supernatants were retained after 5-minute centrifugation (4°C) for SDS-PAGE. 20 µg of protein from the cell lysates were mixed with NuPAGE LDS Sample Buffer (Thermo Scientific, NP0007) and NuPAGE Sample Reducing Agent (Thermo Scientific, NP0004) followed by an incubation at 70°C for 10 minutes. Samples were separated on NuPage 4-12% Bis-Tris Gel (Thermo Scientific, NW04120) in Novex NuPAGE MES SDS Running Buffer (Thermo Scientific, NP0002) alongside PageRuler Plus Prestained Protein Ladder (Thermo Scientific, 26619). The proteins were transferred to a PVDF membrane by iBlot2 Life Technologies Apparatus. PUMA antibody (Proteintech, 55120-1-AP, dilution 1:500) followed by GAPDH (Santa Cruz Biotechnology, Sc-47724, 1:10 000) was incubated with the membrane overnight at 4°C. Secondary peroxidase-conjugated anti-rabbit or anti-mouse IgG (Dako) incubation was performed at room temperature for 1 hour. The signal was obtained using the Thermo Scientific Super Signal West Pico Plus Chemiluminescent substrate kit and detected by an Amersham Imager 600.
2.9. Statistical Analysis
All measurements for bioactive compound, antioxidant activity, and PUMA were conducted in triplicate. Data were expressed as the mean ± SD (standard deviation). P values less than 0.05 were considered statistically significant. The Pearson correlation coefficient test was performed on values obtained for TPC, TFC, and DPPH. Nonlinear regression was carried out to estimate the corresponding IC50 values. Data were analyzed using GraphPad Prism version 11.0.2 for Windows (GraphPad Software, Boston, Massachusetts, USA). One-way and two-way ANOVA followed by Dunnett's or Tukey's post hoc test were used to compare differences among distinct groups.
3. Results and Discussions
3.1. Total Flavonoid, Total Phenol Content, and Antioxidant Capacity Determined by the DPPH Assay
Phenolic and flavonoid compounds have been widely recognized for their diverse biological activities and are considered key phytochemicals responsible for many of the health-promoting properties of medicinal plants. These secondary plant metabolites are involved in normal growth and development while serving as important components in defence mechanisms against oxidative stress and reactive oxygen species (ROS).
Total phenolic content, flavonoid content, and DPPH Free Radical Scavenging activity are presented in Table 1 and Table 2. Overall, the accumulation of these bioactive compounds varied considerably among the tested extracts, depending on the extraction solvent and plant organ. The analysis revealed that the total flavonoid content (TFC) differed between 5.59±0.18 and 10.29±0.81 mg QE/g extract in the methanol extract (Table 1) and from 8.03±0.67 to 13.31±1.06 mg QE/g extract in the ethanol extract (Table 2). On the other hand, total phenolic content (TPC) was higher in the methanolic extracts (6.94±0.56 to 11.49±1.31 mg GAE/g) than in the ethanolic extracts (4.58±0.42 to 8.97±0.35 mg GAE/g). The greatest levels of phenolics and flavonoids were detected in the flower methanol extract (11.49±1.31 mg GAE/g and 10.29±0.81 mg QE/g) and the ethanol extract (8.97± 0.35 mg GAE/g and 13.31±1.06 mg QE/g), correspondingly.
The TFC observed in previously studied samples showed substantial variance depending on the Astragalus species and the plant part analyzed. Platikanov [29], reported a notably high flavonoid concentration in the aerial parts, reaching 49.13 ± 0.51 mg REs/g extract, whereas the highest phenolic content was observed in the leaves with the value of 26.34 ± 0.50 mg GAEs/g extract. Moreover, leaves of A. glycyphyllos and A. cicer [30] contained higher flavonoid levels compared to the stem extracts. This pattern aligns with the findings of the present study on ethanol extract.
A similar distribution pattern of TPC and TFC was reported by Arumugam [16], with generally lower values in plant parts of A. glycyphyllos. However, the flowering plant investigated in our study accumulated higher levels of total flavonoid content in flowers and leaves than those reported for A. cicer, although these levels were lower than those observed in A. glycyphyllos and A. ponticus [16]. In addition, the methanolic extracts of leaf and flower displayed the highest DPPH free radical scavenging activity at 95.80±0.1%, highlighting stronger DPPH radical-scavenging activity than the stem (Table 1) extracts. Conversely, ethanolic extracts underscore no variability in antioxidant capacity among different plant parts (Table 2).
3.2. In Vitro Cytotoxicity IncuCyte® Live-Cell Assay of A. spruneri Extracts in MCF-7 Cells
Cell death represents a critical parameter for evaluating the potential bioactivity of plant extracts. To assess the ability of Astragalus spruneri (AS) to induce cell death, different extracts were tested for in vitro cytotoxicity against estrogen receptor-positive (ER+) and progesterone receptor-positive (PR+) human breast adenocarcinoma cell line MCF-7. Congruently, we evidenced fluorescent signal accumulation and proceeded with visible morphological changes in cells using bright-field microscopy to compare the relative effects of different AS extracts.
Hence, straightforward data analysis of real-time monitoring of NIR signal dynamics was performed with the IncuCyte® Live-Cell Analysis System, enabling the assessment of cellular responses over time while minimizing human intervention. This approach reduces variability associated with endpoint measurements and improves the precision and reproducibility of NIR signal quantification across time points.
The influence of stem extracts of Astragalus spruneri (ASS) on cell death and cell morphology was initially evidenced using IncuCyte® Cytotox NIR dye, which penetrates cells following membrane compromise, binds to nuclear DNA, and emits a fluorescent signal. To this end, four different concentrations of ASS (50, 100, 200, and 400 µg/mL) were applied to MCF-7 cells for 72 hours. As demonstrated in Figure 1A,B, the accumulation of the NIR-positive cells at 50 or 100 µg/mL did not differ appreciably from that observed in untreated cells or those treated with 1% DMSO. Cytotoxicity became evident at 200 µg/mL and more prominent at 400 µg/mL, where the NIR signal (Figure 2A) was significantly elevated by approximately 2-fold after 72 hours compared with 48 hours of incubation, and more than 4-fold compared with 24 hours. The data indicate that the ethanolic extract induced cytotoxic effects only at concentrations ≥200 µg/mL. As the treatment dose increased, cellular damage accumulated over time, leading to progressively greater cytotoxic effects.
To further highlight the distinct effects of ASS ethanolic and methanolic extracts, we analyzed the cumulative maximal NIR signal. Notably, incubation of MCF-7cell lines with ethanolic ASS extracts (Figure 2B) resulted in 7.6-fold greater fluorescence intensity over time at 400 µg/mL compared with 200 µg/mL. Furthermore, total maximum NIR intensity was markedly altered, showing a 5.9-fold increase in cells treated with 400µg/mL ethanolic ASS extract compared with those exposed to ASS methanolic extracts at the same concentration. Thus, treatment of MCF-7 cells with higher concentrations of ethanolic extracts led to progressive disruption of the plasma membrane and a corresponding increase in NIR dye accumulation.
Furthermore, the in vitro cytotoxic activity of crude ethanol and methanol leaf extracts of A. spruneri (ASL) was characterized against the MCF-7 cell line after 24, 48, and 72 hours of exposure to varying concentrations relative to the vehicle control. Figure 3A‒C demonstrates a dose-dependent enhancement of cytotoxicity induced by treatment. At 200 µg/mL, the ethanolic crude extract increased the maximum NIR signal by approximately 73% after 24 h, 90% after 48 h, and 60% after 72 h (p < 0.001) compared to 1% DMSO. Alternatively, methanolic crude extract induced comparatively modest changes, reaching optimal accumulation of approximately 15% at 24 h, followed by a reduced activity of about 10% persisting through 48 h and 72 h.
Treatment with 50 µg/mL of the ethanolic extracts (Figure 3D) exerted only negligible cytotoxic effects. Moreover, concentrations above 100 µg/mL induced prominent membrane damage, as evidenced by an increase in Cytotoxic NIR signal, which rose nearly 6.4-fold at 200 µg/mL and 8.5-fold at 400 µg/mL compared to the vehicle control. The results of the ethanolic crude extracts appear to reach their peak cytotoxic potential at maximal concentration after the first 24 h of treatment (Figure 3E,F), while prolonged exposure produced no additional increases in treatment-induced cytotoxicity. At concentrations of 200 µg/mL and 400 µg/mL, ethanol extract of the leaf showed significant maximum NIR signals of 73% and 95% over 24 h, respectively, compared to the vehicle control. Meanwhile, the methanol leaf extract produced responses of 15% and 35%, respectively, under the same conditions. Thus, the most striking cytotoxic effect occurred within the first 24 hours, and the ethanol leaf extract was consistently more potent than the methanol extract throughout the treatment period. In addition, exposure to the methanolic extract produced only a noticeably weaker and divergent effect.
Cytotoxicity was quantified kinetically, and the overall response was summarized as the area under the fluorescence curve (AUC) (Figure 4A). The AUC showed a concentration-dependent increase in cumulative Cytotox NIR signal over the measurement period. The effect became notable at 100 µg/mL and reached its greatest effect at 400 µg/mL, resulting in a 1.74-fold increase compared with 200 µg/mL ethanol extract treatment. On the other hand, methanol extracts of ASL elicited considerably lower cumulative cytotoxic responses in a dose-dependent pattern.
Based on the normalized dose–response curves, the half-maximal effective concentrations (EC50) of the tested ASL extracts were calculated by nonlinear regression using a four-parametric logistic model [log(concentration) versus response variable slope]. The EC50 values and their 95% confidence intervals were calculated from normalized and transformed Cytotox NIR responses (Figure 5). The estimated EC50 results for ethanolic extracts were 151.5, 125, and 158.1 μg/mL over 24, 48, and 72 h, respectively. Breast cancer MCF-7 cells showed the highest sensitivity towards the ASL ethanol extract, with an EC50 of 125 μg/mL determined after 48 h of treatment, compared to the methanol extract EC50 >200 μg/mL.
The cytotoxic activity observed for ASL extracts differed from previous findings reported on other Astragalus species [31], which documented IC50 values ranging from 601.00 to 1307.00 μg /mL for ethanolic extracts of Astragalus globosus and Astragalus breviflorus, respectively, against the MCF-7 cell line using the MTT assay. Among other Astragalus species that have been investigated for cytotoxic activities in previous studies, Astragalus polysaccharides [32] showed an antiproliferative effect against the MCF-7 cell line, with an IC50 of 945 µg/ml at 24 h. Although direct comparison with the EC50 value obtained in the present study is constrained by differences in assay endpoints and data analysis methods, the ASL ethanolic extracts nevertheless exhibited moderate cytotoxic activity under kinetic Cytotox NIR assay conditions used in this study.
3.3. Morphological Alteration in MCF-7 Cells Induced by Astragalus spruneri Leaf Extracts
The cytotoxic performance of the Astragalus spruneri leaf extracts against human breast malignancies (MCF-7) demonstrated marked variation based on both the extraction solvent and applied concentration. The bright-field micrograph of MCF-7 cells treated with ethanolic extracts of AS leaf revealed a prominent dose- and time-dependent progression (Figure 5). Following 4 hours of treatment at 100 ug/ml, MCF-7 cells predominantly retained their baseline features, exhibiting active growth, polygonal morphology, and tight intercellular connections, while morphological alterations developed more gradually. In stark contrast, the highest concentration of 400 ug/ml elicited an immediate response, evident as early as 4 hours, with visible, rounded, disrupted cells and a pronounced reduction in confluence.
Prolonged incubation and higher concentrations triggered a dramatic morphological shift. The dense monolayer starts to disintegrate over 12 and 24 hours, giving way to distinct structural features characteristic of apoptosis, including significant cell shrinkage, rounding, loss of substrate anchoring, and cellular fragmentation into spherical apoptotic bodies. The primary pathway of cell death appeared to be apoptotic-like changes; the extensive cell degradation and severe monolayer retraction observed by 24 hours suggest that the cells ultimately progress to secondary necrosis in the late stages of treatment. ASE treatment led to a sustained and significant increase in NIR signal with an earlier onset of cytotoxicity at 15 min of exposure (Figure 3F), and was also evident after 60 min and 105 min of exposure to MCF-7 cells. Bright-field microscopy revealed the onset of cell damage starting from 4 h of incubation at 400 µg/ml, 200 µg/ml, and 8 h at 100 µg/ml (Figure 5).
We simultaneously evaluated both the ethanolic and methanolic stem extracts of AS. However, because these samples showed only minor Cytotoxic NIR response under all tested conditions, their data did not warrant further kinetic or morphological characterization. Treatment with the methanolic extract of the leaf (Figure 6) led to alterations in cellular and nuclear morphology, indicative of cytotoxic activity. At 100 ug/ml, the extract did not exert a detectable cytotoxic effect on the cell line throughout the 72-h timeline. Instead, cells preserved their standard architecture, characterized by tightly cohesive, proliferating epithelial-like clusters, and promoted cell growth.
At 200 ug/ml, changes in cellular shape were first observed in a subset of MCF-7 cells after 6 hours of exposure, whereas by 24 h, the majority of cells exhibited evident changes characterized by cell rounding and condensation. The response was considerably more prominent at 400 ug/m. At this treatment, changes in cell morphology were already apparent in the majority of cells after 6 h, while by 24 h, virtually all cells had undergone marked morphological deterioration accompanied by accumulation of cellular remnants.
3.4. Association between Phytochemical Composition and Cytotoxic Activity
The previous finding of the higher DPPH radical-scavenging activity observed in methanolic leaf extracts was associated with a strong correlation between flavonoid content (R=0.975) and phenolic content (R=0.691) (Table 1), suggesting that these compounds may contribute substantially to antioxidant properties. Although, the extract’s biological activity may be explained by either a single active phytochemical or the synergistic interaction of multiple phytochemicals. The anticancer effect of ASL may primarily reflect the contribution of flavonoids as a major phytochemical profile. These compounds can disrupt redox homeostasis by increasing intracellular ROS levels, which in turn promotes oxidative stress and cell death [33].
The significantly higher leaf flavonoid content compared with the stem extracts was accompanied by greater cytotoxic activity against MCF-7 cells. Moreover, phenolics and flavonoids exhibited a moderate negative correlation with DPPH radical scavenging activity (R = ‒0.53). Simply, this association supports the hypothesis that flavonoids may promote cell death pathways in MCF-7 cells. Previous research has revealed 12 major flavonoids in Astragalus spruneri and three rare flavonoids from the aerial part of the plant [23,34], which may participate in triggering the obvious cytotoxicity. It is known that isolated flavonoids from Astragalus species have demonstrated antiproliferative and cytotoxic effects in different cancer models, such as human leukemia cells (HL-60), hepatocarcinoma (SMM7721 and HepG2), and breast cancer cells [35,36,37,38]. Total flavonoids extracted from the roots of Astragalus membranaceus (IC50=98.63 ug/ml), as well as its isolated compound calycosin, effectively inhibited the proliferation of K562 [9]. The use of solvents with varying polarities enables the differential extraction of bioactive constituents including phenolic compounds, flavonoids, and other secondary metabolites from A. spruneri. Even so, the potential contributions of other phytochemicals such as saponins identified in Astragalus spruneri [23,34] should not be overlooked, as they are reported to possess potent cytotoxic activity in Astragalus species [35].
3.5. Association of PUMA with MCF-7 Cells
Subsequently, we explored the involvement of the pro-apoptotic regulator PUMA by Western blot analysis. The PUMA level was normalized to GAPDH and compared across ethanol and methanol in leaf and stem extracts, as well as vehicle control (DMSO 1%) and untreated cells (Figure 7). PUMA expression was evaluated at 6 h, and the reduced protein abundance may suggest transient regulation of PUMA expression or degradation during progression of extract-induced cell death. Notably, the extract producing the strongest cytotoxic effect exhibited the lowest detectable PUMA protein level. Since the Incucyte data showed that the ethanolic extract (stem, leaf) induced greater cytotoxicity, more cells likely progressed to later stages of cell death than those treated with the methanolic extract (stem, leaf). The inverse relationship was stronger for the leaf extracts, while stem extracts induced a weaker cytotoxic response and smaller changes in PUMA expression.
PUMA plays a critical role in mediating cell death pathways [39,40], facilitating crosstalk determined by the severity of extracellular or intracellular stress-induced stimuli. In MCF-7 cells, estrogen inactivates the p53 pathway, downregulating PUMA transcription through binding upstream of its transcription start site [41,42]. Instead, our results indicate that the greater cytotoxic activity of the ethanolic extracts may be associated with more rapid progression of regulated cell death and temporal regulation of PUMA expression. Thus, further investigations are required to characterize the molecular mechanisms and determine the type of regulated cell death induced by A. spruneri extracts in MCF-7 cells, as well as the role of PUMA in this process.
4. Conclusions
The Cytotox NIR assay provided new insights into distinct extract- and tissue-dependent cytotoxic responses of Astragalus spruneri extracts against MCF-7 cancer cells, with ethanolic leaf extracts exhibiting the most prominent effect. These findings provide the first comprehensive kinetic characterization of the cytotoxic activity of AS, suggesting that flavonoid-enriched ethanolic leaf extracts induced an earlier onset and more sustained cytotoxic response. The results support A. spruneri as a promising source of bioactive compounds and highlight the importance of integrating real-time cellular analysis for evaluating its biological potential. Further investigation is required to elucidate the effects of Astragalus spruneri ethanolic leaf extract on cell death, the underlying molecular pathways, and the active constituents responsible for its antitumor potential.
Supplementary Materials
The following supporting information can be downloaded at the website of this paper posted on Preprints.org, Bright Field microscopy of Astragalus spruneri extracts. Figure 1: methanol extracts of the leaf at 4h, 12h and 24h; ethanol extracts of the leaf at 4h, 12h and 24h; methanol extracts of the stem at at 6h, 24h and 72h; ethanol extracts of the stem 6h, 24h and 72h.
Author Contributions
Contributed to project design and manuscript drafting and editing, E.P. and M.L.; participated in the in vitro assay, J.K.; performed the Western blotting, A.R.; analyzed the bioactive compounds, A.D.; conceptualization, A.D.; analyzed part of the results, F.D.; resources, B.P.; wrote part of the manuscript, S.V.; investigation, R.S. and D.P; Fund raising, E.P. and M.L.
Funding
This research is funded by the Albanian-American Development Foundation, READ Grants, Tirana, Albania.
Institutional Review Board Statement
Not applicable.
Informed Consent Statement
Not applicable.
Data Availability Statement
Data reported in this study are contained within the article. The underlying raw data is available on request from the corresponding author.
Conflicts of Interest
The authors report no conflicts of interest. The authors alone are responsible for the content and writing of this article.
Abbreviations
The following abbreviations are used in this manuscript:
| ASS | Astragalus spruneri stem |
| ASL | Astragalus spruneri leaves |
| VC | Vehicle control |
| U | Untreated group |
References
- International Agency for Research on Cancer (IARC). Latest Global Cancer Data 2020: Q&A. Available online: https://www.iarc.who.int/faq/latest-global-cancer-data-2020-qa/.
- World Health Organization (WHO). Global Health Estimates 2020: Deaths by Cause, Age, Sex, by Country and by Region. 2026. Available online: https://www.who.int/data/global-health-estimates.
- Sung, H.; Ferlay, J.; Siegel, R.L.; Laversanne, M.; Soerjomataram, I.; Jemal, A.; Bray, F. Global Cancer Statistics 2020: GLOBOCAN Estimates of Incidence and Mortality Worldwide for 36 Cancers in 185 Countries. CA Cancer J. Clin. 2021, 71(3), 209–249. [Google Scholar] [CrossRef] [PubMed]
- Cao, Z.; Zhu, S.; Xue, Z.; Zhang, F.; Zhang, L.; Zhang, Y.; Guo, Y.; Zhan, G.; Zhang, X.; Guo, Z. Isoquinoline alkaloids from Hylomecon japonica and their potential anti-breast cancer activities. Phytochemistry 2022, 202, 113321. [Google Scholar] [CrossRef] [PubMed]
- Freeling, J.L.; Scholl, J.L.; Eikanger, M.; Knoblich, C.; Potts, R.A.; Anderson, D.J.; Rower, J.E.; Farjoo, M.H.; Zhao, H.; Pillatzki, A. Pre-clinical safety and therapeutic efficacy of a plant-based alkaloid in a human colon cancer xenograft model. Cell Death Discov. 2022, 8, 135. [Google Scholar] [CrossRef] [PubMed]
- Esnaashari, S.S.; Muhammadnejad, S.; Amanpour, S.; Amani, A. A combinational approach towards treatment of breast cancer: An analysis of noscapine-loaded polymeric nanoparticles and doxorubicin. AAPS PharmSciTech 2020, 21, 166. [Google Scholar] [CrossRef] [PubMed]
- Hsiang, Y. H.; Hertzberg, R.; Hecht, S.; Liu, L. Camptothecin induces protein-linked DNA breaks via mammalian DNA topoisomerase. I J. Biol. Chem. 1985, 260, 14873–14878. [Google Scholar] [CrossRef]
- Oberlies, N.H.; Kroll, D.J. Camptothecin and taxol: Historic achievements in natural products research. J. Nat. Prod. 2004, 67, 129–135. [Google Scholar] [CrossRef] [PubMed]
- Zhang, D.; Zhuang, Y.; Pan, J.; Wang, H.; Li, H.; Yu, Y.; et al. Investigation of effects and mechanisms of total flavonoids of Astragalus and calycosin on human erythroleukemia cells. Oxid. MedCell Longev. 2012, 209843. [Google Scholar]
- Kapinova, A.; Stefanicka, P.; Kubatka, P.; Zubor, P.; Uramova, S.; Kello, M.; Mojzis, J.; Blahutova, D.; Qaradakhi, T.; Zulli, A.; et al. Are plant-based functional foods better choice against cancer than single phytochemicals? A critical review of current breast cancer research. Biomed. Pharmacother. 2017, 96, 1465–1477. [Google Scholar] [CrossRef] [PubMed]
- Madhuri, S.; Pandey, G. Some dietary agricultural plants with anticancer properties. Plant Arch. 2008, 8, 13–16. [Google Scholar]
- Newman, D.J.; Cragg, G.M. The discovery of anticancer drugs from natural sources. In Natural Products: Drug Discovery and Therapeutic Medicine; Zhang, L., Demain, A.L., Eds.; Humana Press: Totowa, NJ, USA, 2005; pp. 129–168. [Google Scholar]
- Asma, S.T.; Acaroz, U.; Imre, K.; Morar, A.; Shah, S.R.A.; Hussain, S.Z.; Arslan-Acaroz, D.; Demirbas, H.; Hajrulai-Musliu, Z.; Istanbullugil, F.R.; et al. Natural Products/Bioactive Compounds as a Source of Anticancer Drugs. Cancers 2022, 14, 6203. [Google Scholar] [CrossRef] [PubMed]
- Çeçen, Ö.; Aytac, Z.; Misirdali, H. Astragalus unalii (Fabaceae), a new species from Turkey. Turk. J. Bot. 2016, 40, 81–86. [Google Scholar] [CrossRef]
- Bratkov, V.M.; Shkondrov, A.M.; Zdraveva, P.K.; Krasteva, I.N. Flavonoids from the genus Astragalus: Phytochemistry and biological activity. Phcog Rev. 2016, 10, 11–32. [Google Scholar] [CrossRef] [PubMed]
- Arumugam, R.; Kirkan, B.; Sarikurkcu, C. Phenolic profile, antioxidant and enzyme inhibitory potential of methanolic extracts from different parts of Astragalus ponticus Pall. South Afr. J. Bot. 2019, 120, 268–273. [Google Scholar] [CrossRef]
- Sarikurkcu, C.; Zengin, G. Polyphenol Profile and Biological Activity Comparisons of Different Parts of Astragalus macrocephalus subsp. finitimus from Turkey. Biology 2020, 9, 231. [Google Scholar] [CrossRef] [PubMed]
- Li, X.; Qu, L.; Dong, Y.; Han, L.; Liu, E.; Fang, S.; Zhang, Y. A Review of Recent Research Progress on the Astragalus Genus. Molecules 2014, 19(11), 18850–18880. [Google Scholar] [CrossRef] [PubMed]
- Tang, Z.; Tian, X. Astragalus membranaceus: A Traditional Chinese Medicine with Multifaceted Impacts on Breast Cancer Treatment. Biomolecules 2024, 14(10), 1339. [Google Scholar] [CrossRef] [PubMed]
- Liu, J.; Wang, D.; Ren, N.; Zhang, L.; Wang, T. Metabolites of Astragalus membranaceus and their pro-apoptotic and cytotoxic activities: insights into targeted metabolic pathways. Front. Pharmacol. 2025, 16, 1647958. [Google Scholar] [CrossRef] [PubMed]
- He, Z.; Liu, X.; Qin, S.; Yang, Q.; Na, J.; Xue, Z.; Zhong, L. Anticancer Mechanism of Astragalus Polysaccharide and Its Application in Cancer Immunotherapy. Pharmaceuticals 2024, 17(5), 636. [Google Scholar] [CrossRef] [PubMed]
- Li, S.; Hu, X.; Liu, F.; Hu, W. Bioactive components and clinical potential of Astragalus species. Front. Pharmacol. 2025, 16, 1585697. [Google Scholar] [CrossRef] [PubMed]
- Kondeva-Burdina, M.; Shkondrov, A.; Simeonova, R.; Vitcheva, V.; Krasteva, I.; Ionkova, I. In vitro/in vivo antioxidant and hepatoprotective potential of defatted extract and flavonoids isolated from Astragalus spruneri Boiss. (Fabaceae). Food Chem. Toxicol. 2018, 111, 631–640. [Google Scholar] [CrossRef] [PubMed]
- Simeonova, R.L.; Vitcheva, V.B.; Kondeva-Burdina, M.S.; Popov, G.S.; Shkondrov, A.M.; Krasteva, I.N.; Manov, V.K. Evaluation of the antioxidant potential of defatted extract from Astragalus spruneri in spontaneously hypertensive rats (SHRs). Bulg. Chem. Commun. 2018, 50 (Spec. Issue C), 105–111. [Google Scholar]
- Momekov, G.; Krasteva, I.; Platikanov, S.; Nikolov, S.; Konstantinov, S. Cytotoxic Activity of Volatiles from Four Astragalus Species. Compt Rend. Acad. Bulg. Sci. 2007, 60(9), 1023–1026. [Google Scholar]
- Pikuli, K.; Devolli, A.; Muça, K. Fortified wheat bread with dried three-phase olive pomace: effect on physicochemical, antioxidant, nutritional, and sensory characteristics. Ital. J. Food Saf. 2026, 15, 4642. [Google Scholar] [CrossRef] [PubMed]
- Patel, S.; Patel, J.; Patel, R.K. To study proximate analysis & biological evaluation of Triphala Guggulu formulation. Int. J. PharmTech Res. 2012, 4(4), 1520–1526. [Google Scholar]
- Atoui, A.K.; Mansouri, A.; Boskou, G.; Kefalas, P. Tea and herbal infusions: Their antioxidant activity and phenolic profile. Food Chem. 2005, 89, 27–36. [Google Scholar] [CrossRef]
- Platikanov, S.; Nikolov, S.; Pavlova, D.; Evstatieva, L.; Popov, S. Volatiles from four Astragalus species: phenological changes and their chemotaxonomical application. Z. Fur Naturforschung C- A J. Biosci. 2005, 60, 591–599. [Google Scholar] [CrossRef] [PubMed]
- Butkute, B.; Dagilyte, A.; Benetis, R.; Padarauskas, A.; Ceseviciene, J.; Olsauskaite, V.; Lemeziene, N. Mineral and phytochemical profiles and antioxidant activity of herbal material from two temperate Astragalus species. BioMed Res. Int. 2018, 11. [Google Scholar] [CrossRef] [PubMed]
- Kalaycı, B.; Özek, N.S.; Aysin, F.; Özbek, H.; Kazaz, C.; Önal, M.; Güvenalp, Z. Evaluation of cytotoxic and apoptotic effects of the extracts and phenolic compounds of Astragalus globosus Vahl and Astragalus breviflorus DC. Saudi Pharmautical journal. 2023, 31, 8. [Google Scholar] [CrossRef] [PubMed]
- Yang, Sh; Sun, Sh; XU, W.; YU, B.; Wang, G.; Wang, H. Astragalus polysaccharide inhibits breast cancer cell migration and invasion by regulating epithelial-mesenchymal transition via the Wnt/β-catenin signaling pathway. Mol. Med. Rep. 2020, 21, 1819–1832. [Google Scholar] [CrossRef] [PubMed]
- Xiaoqin, A.; Yu, W.; Liu, J.; Tang, D.; Yang, L.; Chen, X. Oxidative cell death in cancer: mechanisms and therapeutic opportunities. Cell Death Dis. Vol. 2024, 15, 556. [Google Scholar] [CrossRef] [PubMed]
- Shkondrov, A.; Krasteva, I.; Bucar, F.; Kunert, O.; Kondeva-Burdina, M.; Ionkova, I. Flavonoids and saponins from two Bulgarian Astragalus species and their neuroprotective activity. Phytochem. Lett. 2018, 26, 44–49. [Google Scholar] [CrossRef]
- Dekinash, M.F.; Okda, T.M.; Elmahallawy, E.K.; Al-Harthi, S.; Al-Harthi, H.; Al-Harthi, A.; Al-Harthi, M.; Al-Harthi, A.; Al-Harthi, S.; Al-Harthi, H.; et al. Insights into HPLC-MS/MS Analysis, Antioxidant and Cytotoxic Activity of Astragalus fruticosus against Different Types of Cancer Cell Lines. Pharmaceuticals 2022, 15(11), 1406. [Google Scholar] [CrossRef] [PubMed]
- Buhagiar, J.A.; Bertoli, A.; Podesta, M.T.; Pistelli, L. In vitro apoptotic activity of flavonoids from Astragalus verrucosus Morris. Nat. Prod. Commun. 2008, 3, 2007-12. [Google Scholar] [CrossRef]
- Hu, Y.; Liu, C.Y.; Du, C.M.; Zhang, J.; Wu, W.Q.; Gu, Z.L. Induction of apoptosis in human hepatocarcinoma SMMC-7721 cells in vitro by flavonoids from. Astragalus Complanatus J. Ethnopharmacol. 2009, 123, 293-301. [Google Scholar] [CrossRef] [PubMed]
- Chen, J.; Li, Y.; Yang, L.Q.; Li, Y.Z.; Nan, Z.B.; Gao, K. Biological activities of flavonoids from pathogenic-infected Astragalus adsurgens. Food Chem. 2012, 131, 546-51. [Google Scholar] [CrossRef]
- Donovan, M.; Cotter, T.G. Control of mitochondrial apoptosis by the Bcl-2 family. Cell Death Differ. 2004, 11(6), 601–609. [Google Scholar]
- Pemberton, J.M.; Nguyen, D.; Osterlund, E.J.; Schormann, W.; Pogmore, J.P.; Hirmiz, N.; Leber, B.; Andrews, D.W. The carboxyl-terminal sequence of PUMA binds to both anti-apoptotic proteins and membranes. eLife 2023, 12, e88329. [Google Scholar] [CrossRef] [PubMed]
- Tat, Sh.; Mandal, K.Sh.; Sharma, T.; Ghate, B.N.; Rajesh, N.; Gachhe; Manas; Santra, K. The multifaceted role of PUMA in cell death pathways: its therapeutic potential across cancer types. Cell Commun. Signal. 2025, 23, 499. [Google Scholar] [CrossRef] [PubMed]
- Win, S.; Than, T.A.; Kaplowitz, N. Mitochondrial P-JNK target, SAB (SH3BP5), in regulation of cell death. Front. Cell Dev. Biol. 2024, 12, 1359152. [Google Scholar] [CrossRef] [PubMed]
Figure 1.
Time-course of mean near-infrared fluorescence intensity in MCF-7 cells treated with 50, 100, 200, and 400 µg/mL ethanolic (E) and methanolic (M) Astragalus spruneri stem extracts and vehicle control DMSO1%; untreated. NIR fluorescence was dynamically monitored over 72 hours using the Incucyte® SX5 Live-Cell Analysis System, with images acquired every 30 minutes and data points represented at 8-hour intervals. Fluorescence intensity was quantified as total integrated intensity using Incucyte software.
Figure 1.
Time-course of mean near-infrared fluorescence intensity in MCF-7 cells treated with 50, 100, 200, and 400 µg/mL ethanolic (E) and methanolic (M) Astragalus spruneri stem extracts and vehicle control DMSO1%; untreated. NIR fluorescence was dynamically monitored over 72 hours using the Incucyte® SX5 Live-Cell Analysis System, with images acquired every 30 minutes and data points represented at 8-hour intervals. Fluorescence intensity was quantified as total integrated intensity using Incucyte software.
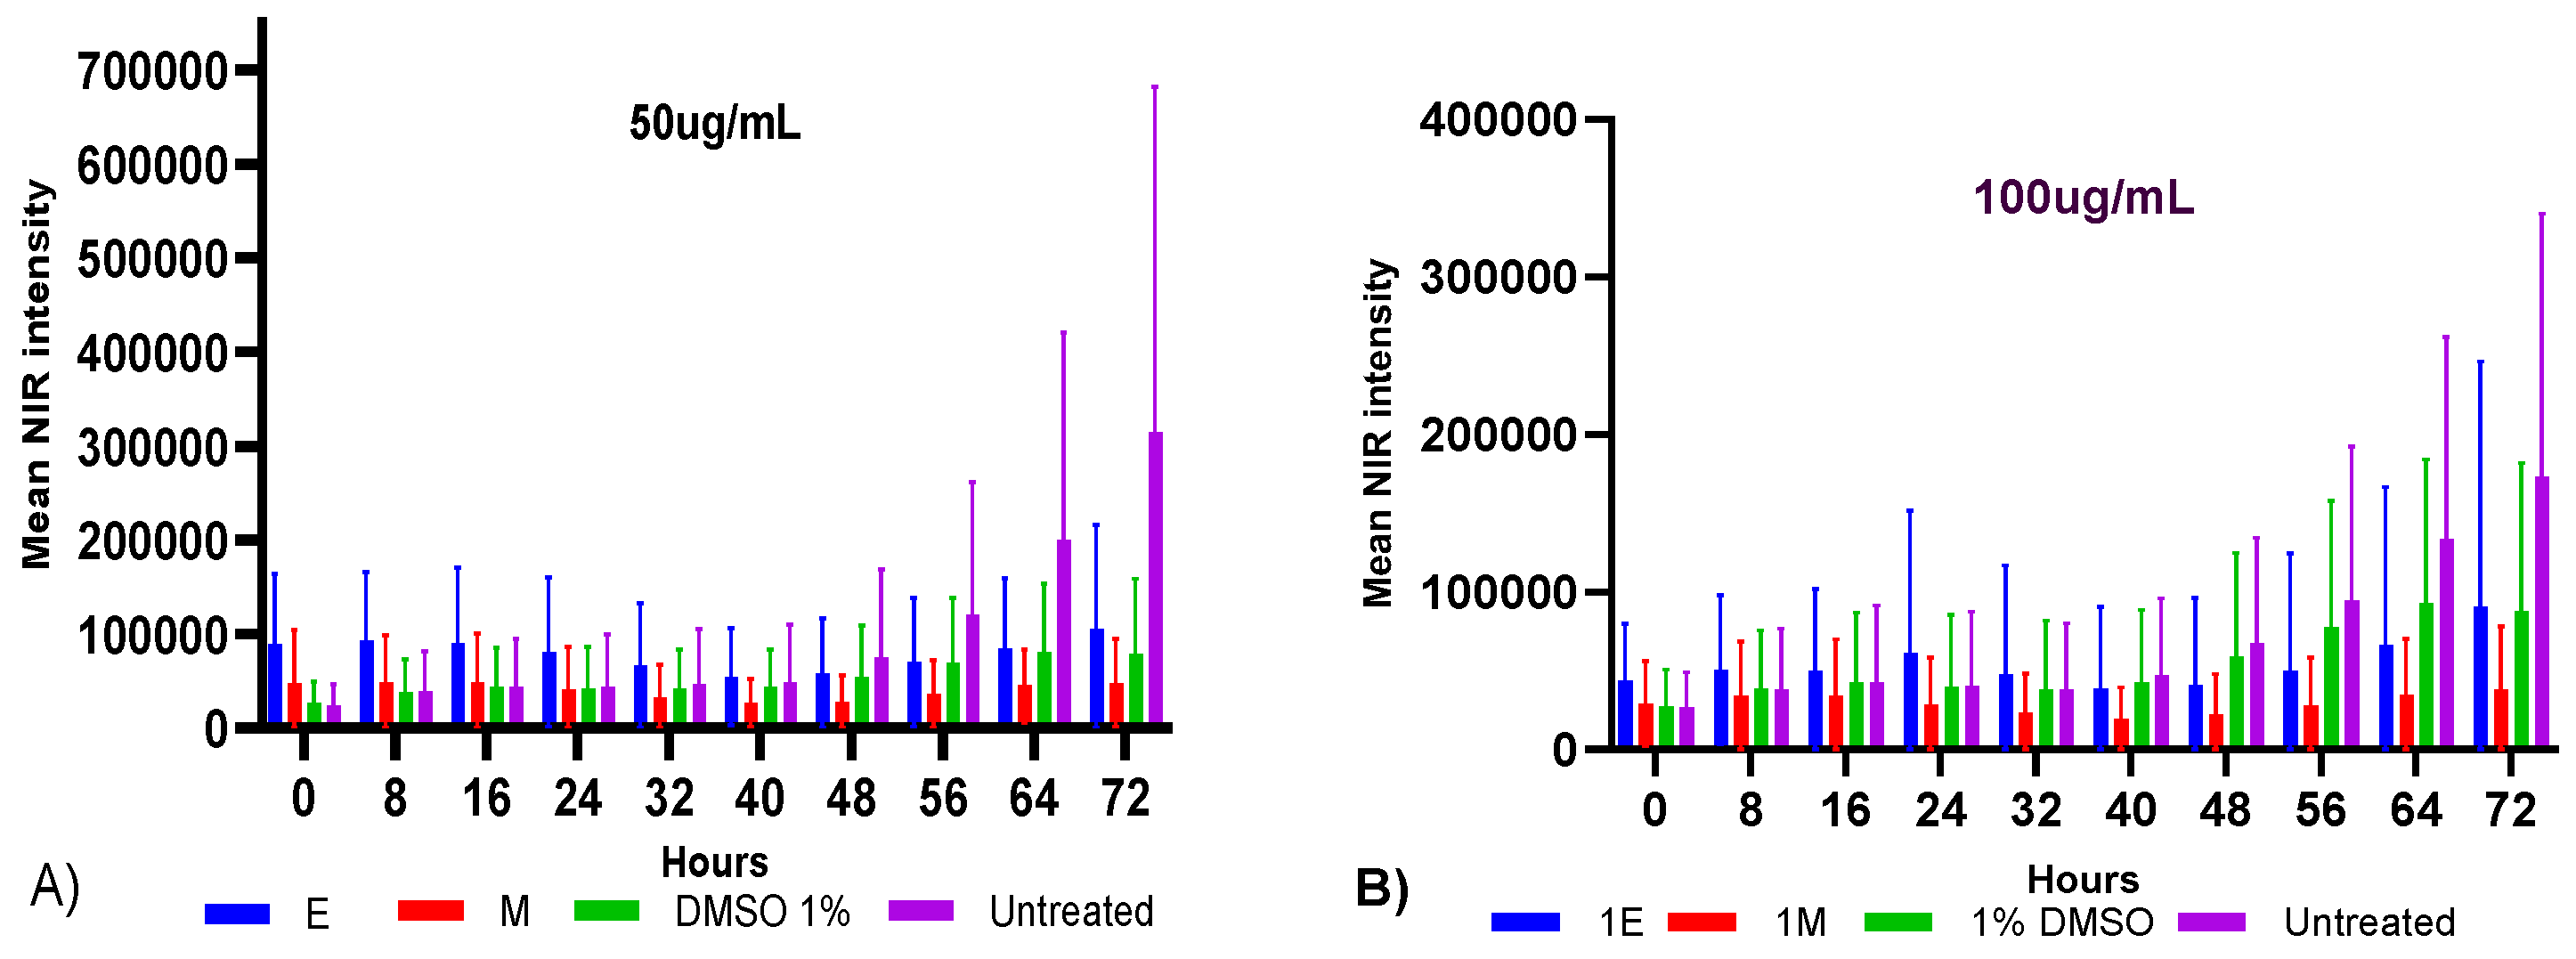
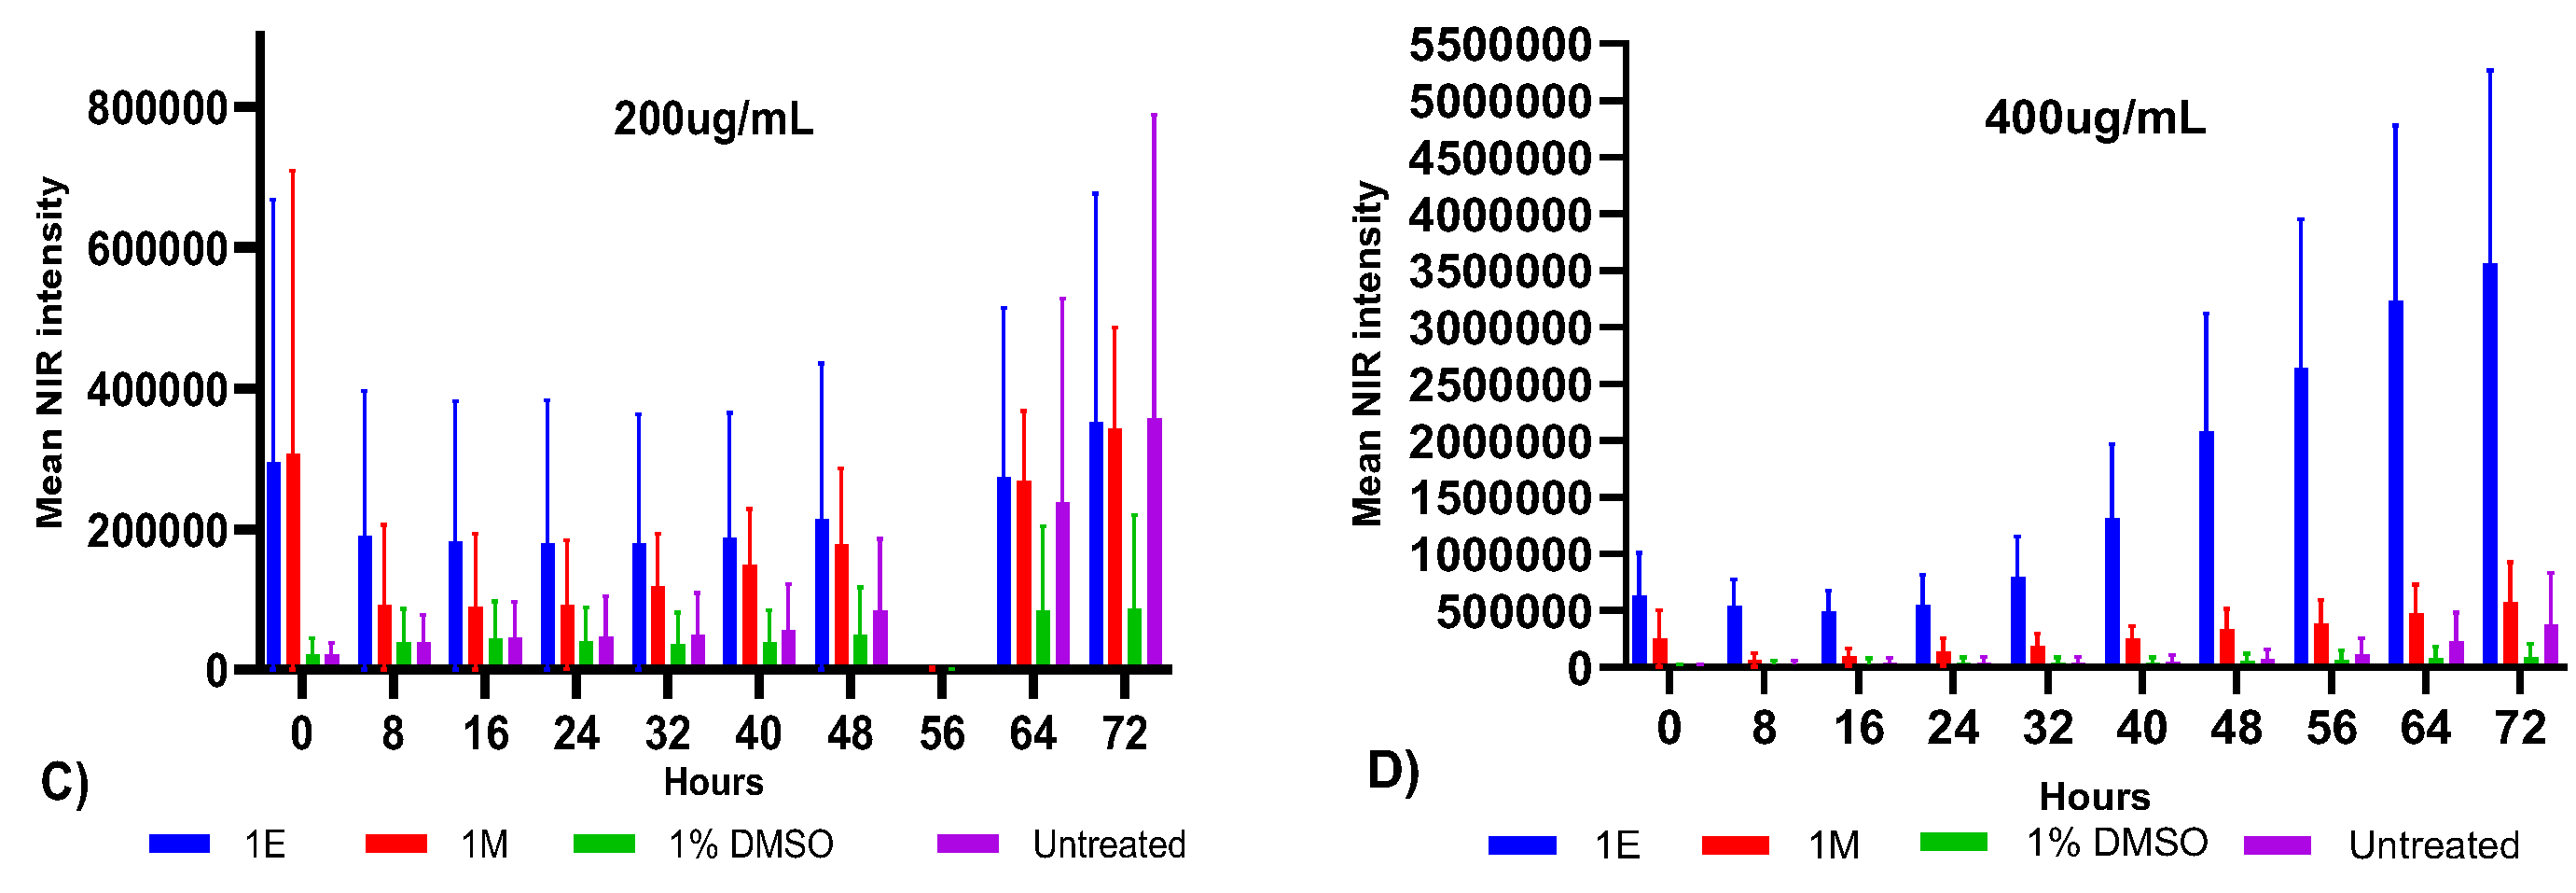
Figure 2.
(a) Near-infrared fluorescence during 72 hours, X-axis: log concentrations of Astragalus spruneri stem (ASS) extracts from 50 to 400 μg/mL and Y-axis: normalized maximum absorbance. (b) Cumulative maximal NIR for 200 μg/ml and 400 μg/ml in treatment with ASS and control DMSO1% in MCF-7 cells; n = 3, ns, not statistically significant; ** p < 0.01, and **** p < 0.0001.
Figure 2.
(a) Near-infrared fluorescence during 72 hours, X-axis: log concentrations of Astragalus spruneri stem (ASS) extracts from 50 to 400 μg/mL and Y-axis: normalized maximum absorbance. (b) Cumulative maximal NIR for 200 μg/ml and 400 μg/ml in treatment with ASS and control DMSO1% in MCF-7 cells; n = 3, ns, not statistically significant; ** p < 0.01, and **** p < 0.0001.
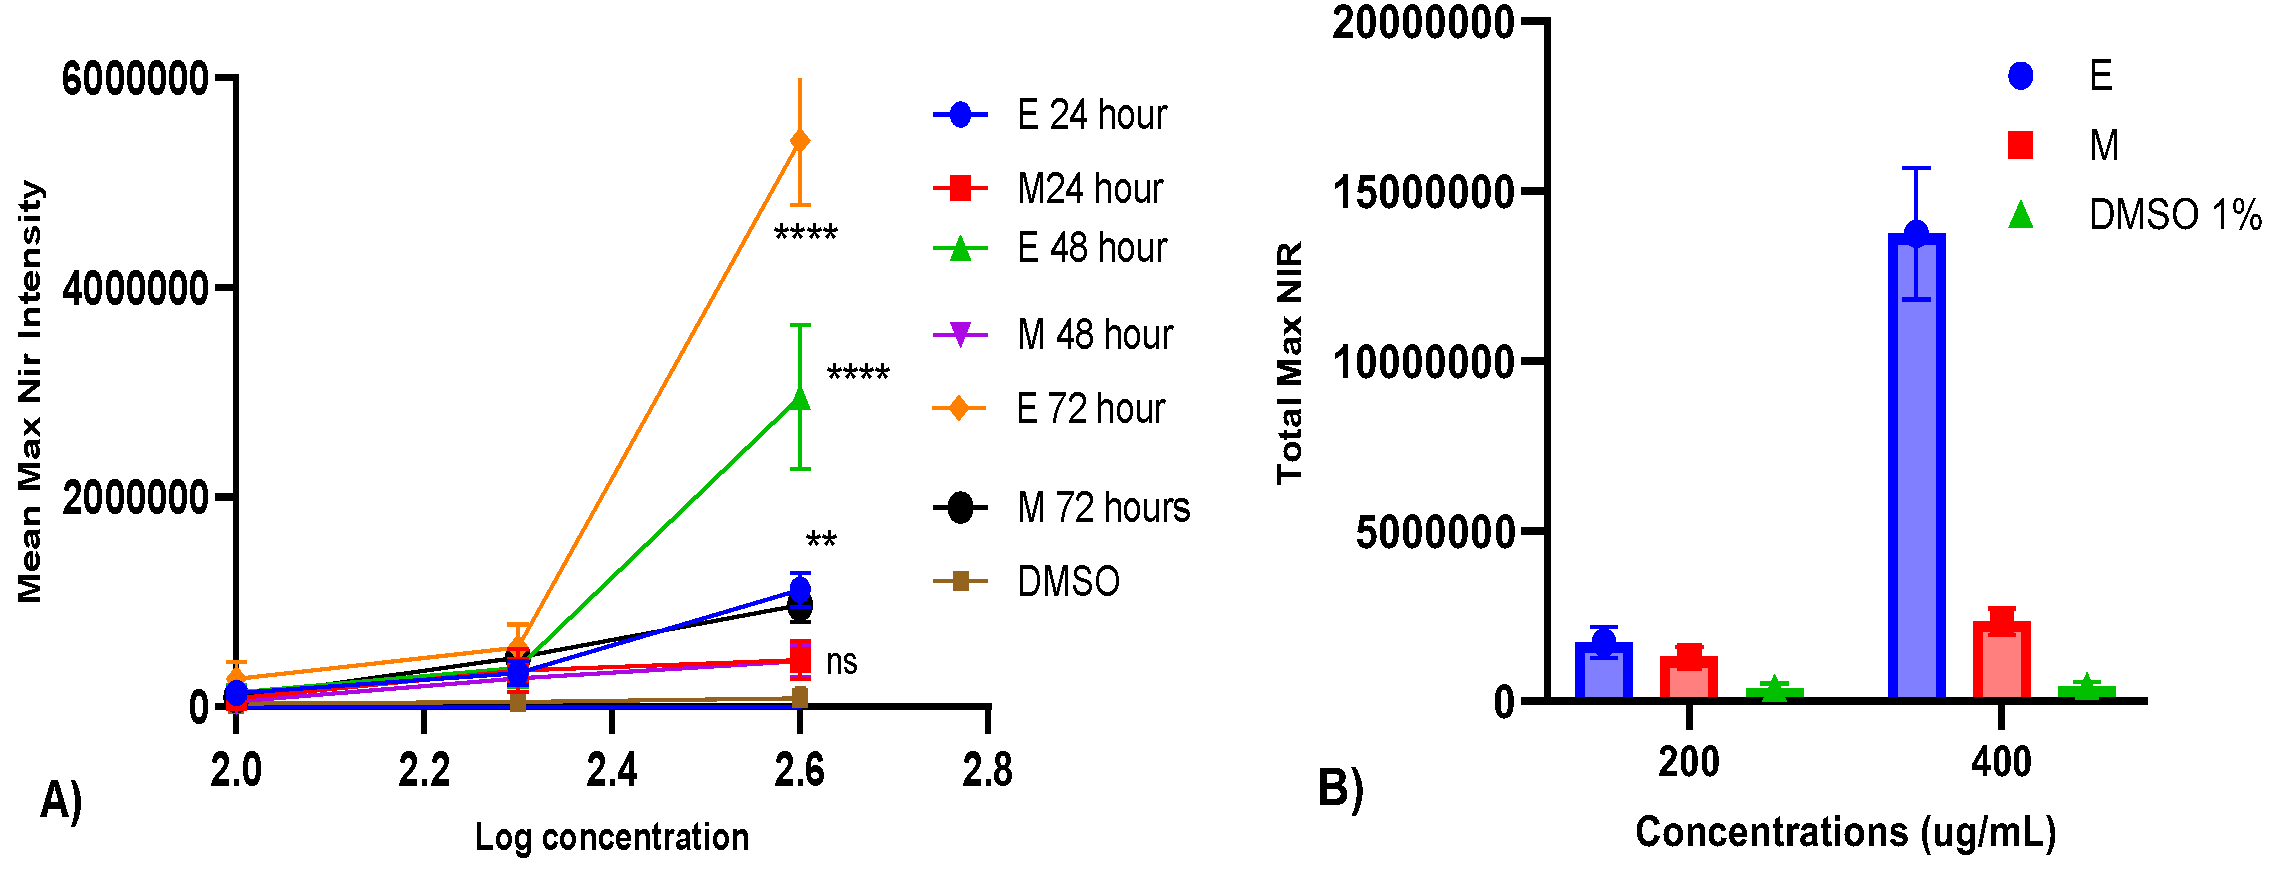
Figure 3.
Concentration- and time-dependent near-infrared fluorescence by IncuCyte® Cytotox NIR Dye of adherent MCF-7 cells treated with 50, 100, 200, and 400 µg/mL ethanolic and methanolic Astragalus spruneri leaf extracts, compared with 1% DMSO as a control. Data are presented as mean ± SD (n = 3). (A) (B) (C) Time-course for the concentration-dependent effect of ASL ethanol and methanol extracts on cell death as measured at 24, 48, and 72 hours, respectively. (D) Cumulative maximum intensity analysis of the NIR fluorescent 24-hour time-course (E) ethanol crude extract concentration response at 24, 48, and 72 hours, monitored values. (F) Effects of a 120 min treatment with different concentrations-unpaired t-test with Welch's correction and statistically analyzed. * p < 0.05, ** p < 0.01, *** p < 0.001, with Tukey's multiple comparisons test.
Figure 3.
Concentration- and time-dependent near-infrared fluorescence by IncuCyte® Cytotox NIR Dye of adherent MCF-7 cells treated with 50, 100, 200, and 400 µg/mL ethanolic and methanolic Astragalus spruneri leaf extracts, compared with 1% DMSO as a control. Data are presented as mean ± SD (n = 3). (A) (B) (C) Time-course for the concentration-dependent effect of ASL ethanol and methanol extracts on cell death as measured at 24, 48, and 72 hours, respectively. (D) Cumulative maximum intensity analysis of the NIR fluorescent 24-hour time-course (E) ethanol crude extract concentration response at 24, 48, and 72 hours, monitored values. (F) Effects of a 120 min treatment with different concentrations-unpaired t-test with Welch's correction and statistically analyzed. * p < 0.05, ** p < 0.01, *** p < 0.001, with Tukey's multiple comparisons test.
Figure 4.
. A) Dose-dependent cumulative cytotoxicity with standard deviation (SD) of ethanolic and methanolic crude leaf extracts of Astragalus spruneri (ASL), n=3. Cells were treated with the indicated concentrations of the extracts, and the cytotoxicity was assessed using the IncuCyte Cytotox NIR assay. DMSO 1% served as the vehicle control. B) Comparison of EC50 of ethanol ASL plant extract on MCF-7 cells, over 24, 48, and 72 h (Y-axis: concentration in (μg/mL). EC50 estimates with 95% confidence intervals.
Figure 4.
. A) Dose-dependent cumulative cytotoxicity with standard deviation (SD) of ethanolic and methanolic crude leaf extracts of Astragalus spruneri (ASL), n=3. Cells were treated with the indicated concentrations of the extracts, and the cytotoxicity was assessed using the IncuCyte Cytotox NIR assay. DMSO 1% served as the vehicle control. B) Comparison of EC50 of ethanol ASL plant extract on MCF-7 cells, over 24, 48, and 72 h (Y-axis: concentration in (μg/mL). EC50 estimates with 95% confidence intervals.
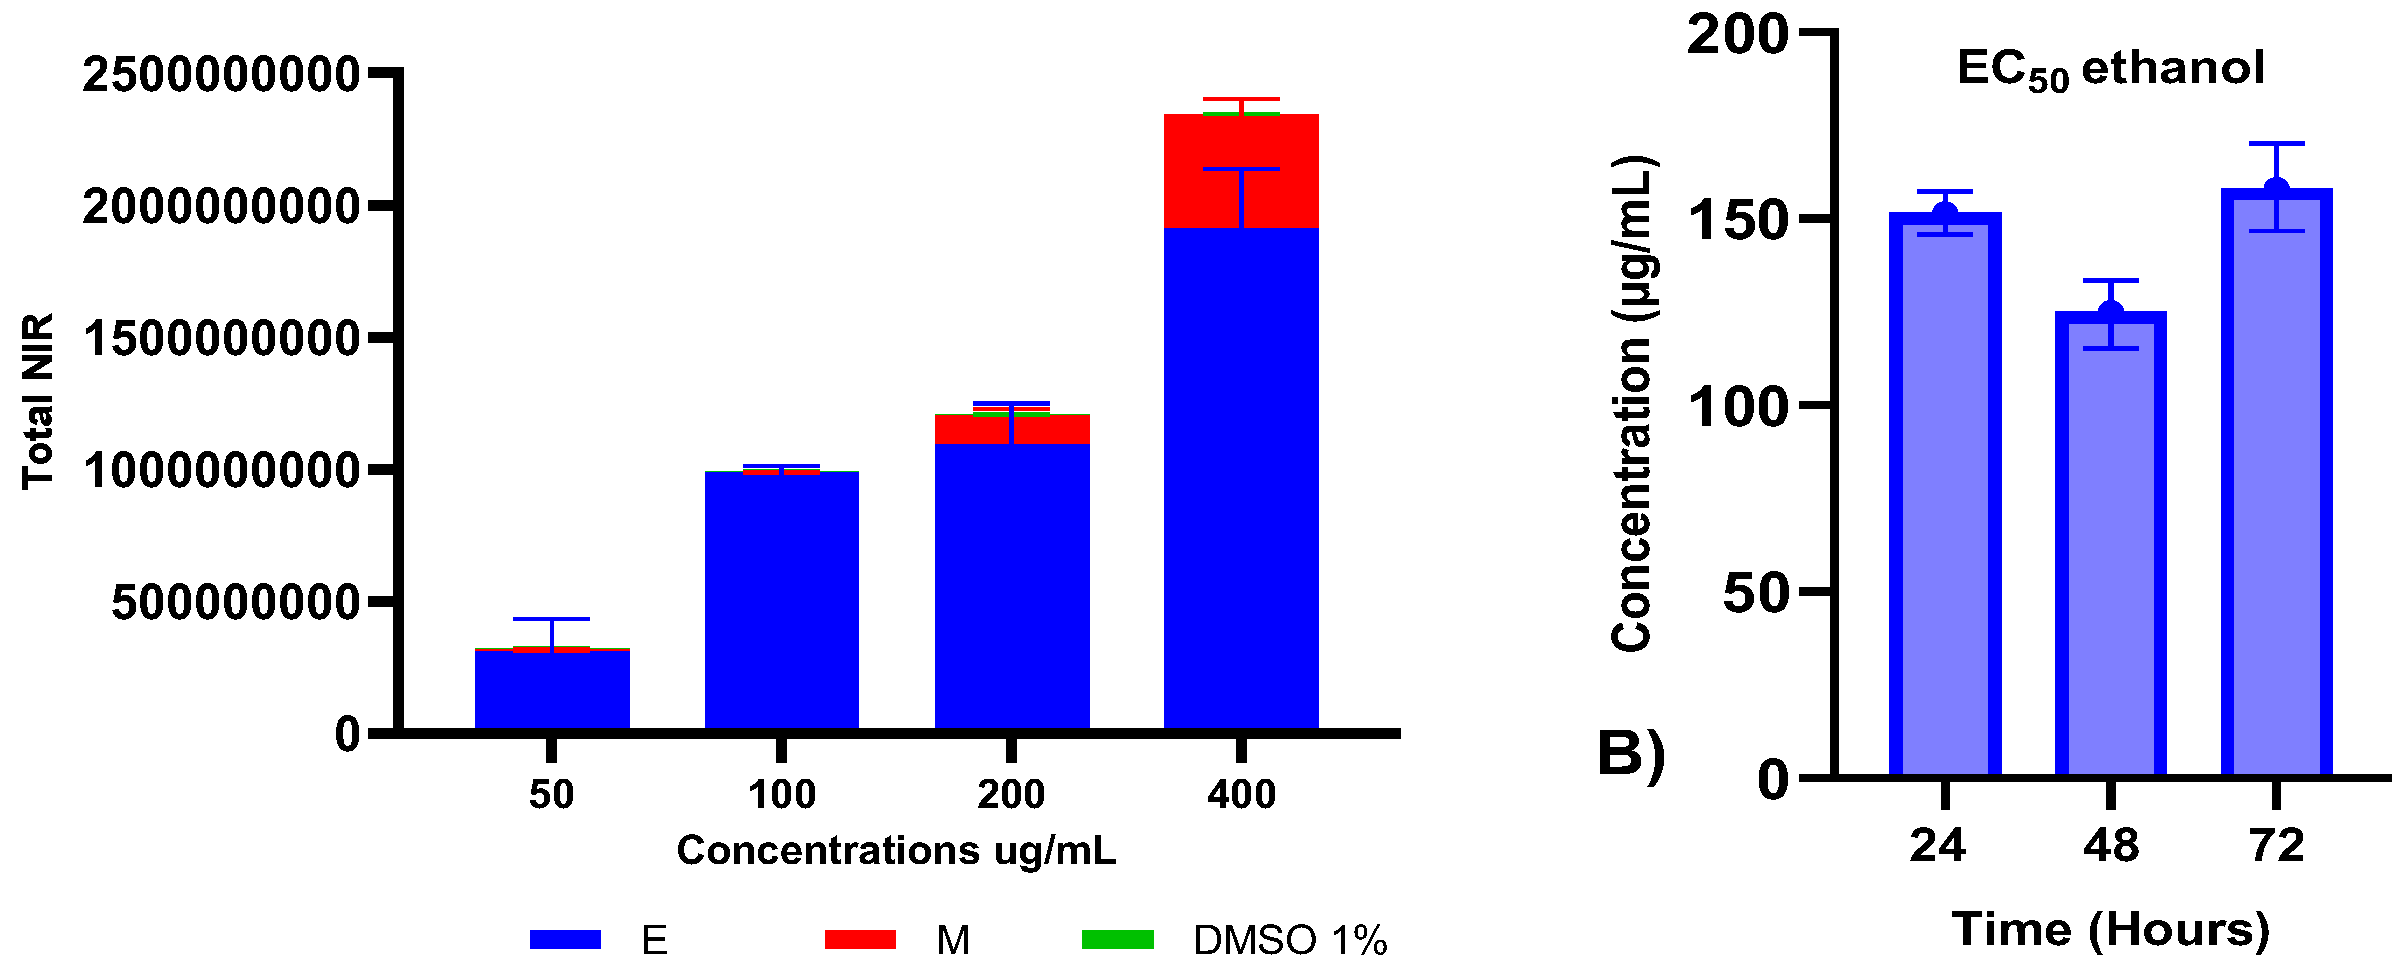
Figure 5.
Morphological appearance of MCF7 live cells in real-time bright-field microscopy at 4, 12, and 24 hours with the 100, 200, and 400 ug/ml ethanolic extract of the AS leaf, 4× magnification: scale bar = 100 µm.
Figure 5.
Morphological appearance of MCF7 live cells in real-time bright-field microscopy at 4, 12, and 24 hours with the 100, 200, and 400 ug/ml ethanolic extract of the AS leaf, 4× magnification: scale bar = 100 µm.
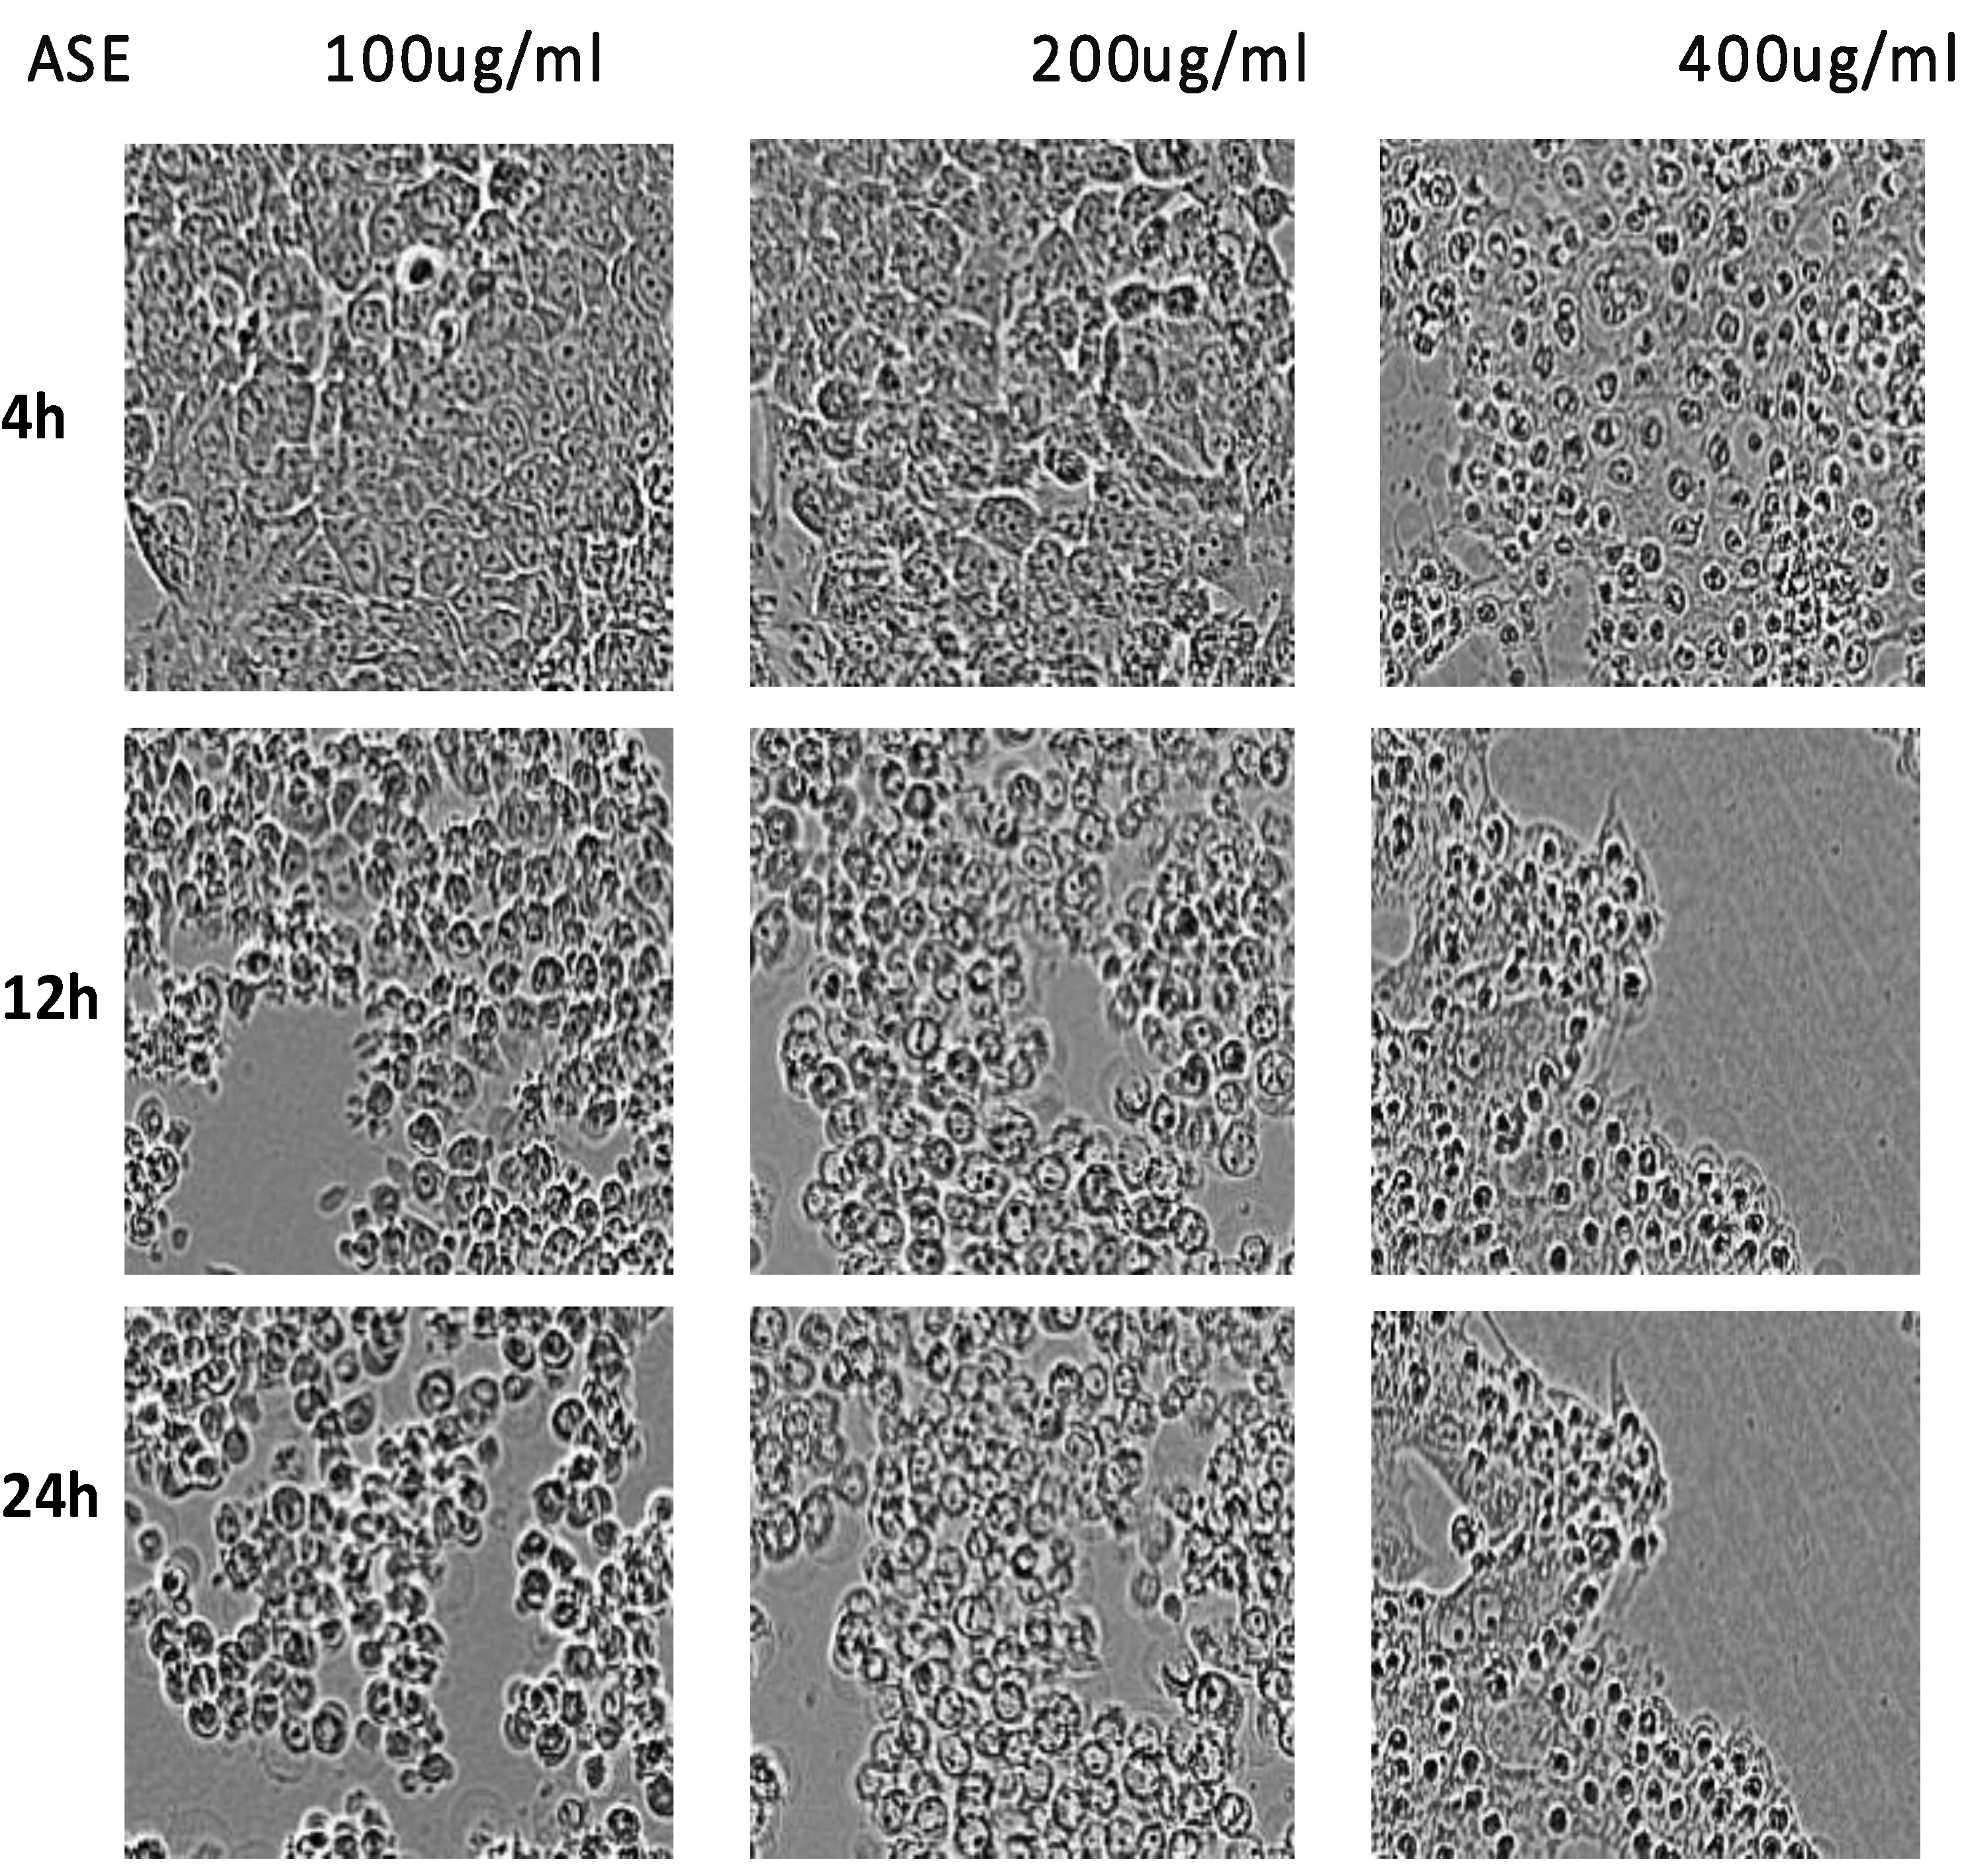
Figure 6.
Bright-field images of McF-7 cells treated with different concentrations of AS methanol extract of the leaf for 6 h, 24 h, and 72 hours. Images were taken at fourfold magnification on the Incucyte® SX5 Live-Cell Analysis System: scale bar = 100 µm.
Figure 6.
Bright-field images of McF-7 cells treated with different concentrations of AS methanol extract of the leaf for 6 h, 24 h, and 72 hours. Images were taken at fourfold magnification on the Incucyte® SX5 Live-Cell Analysis System: scale bar = 100 µm.
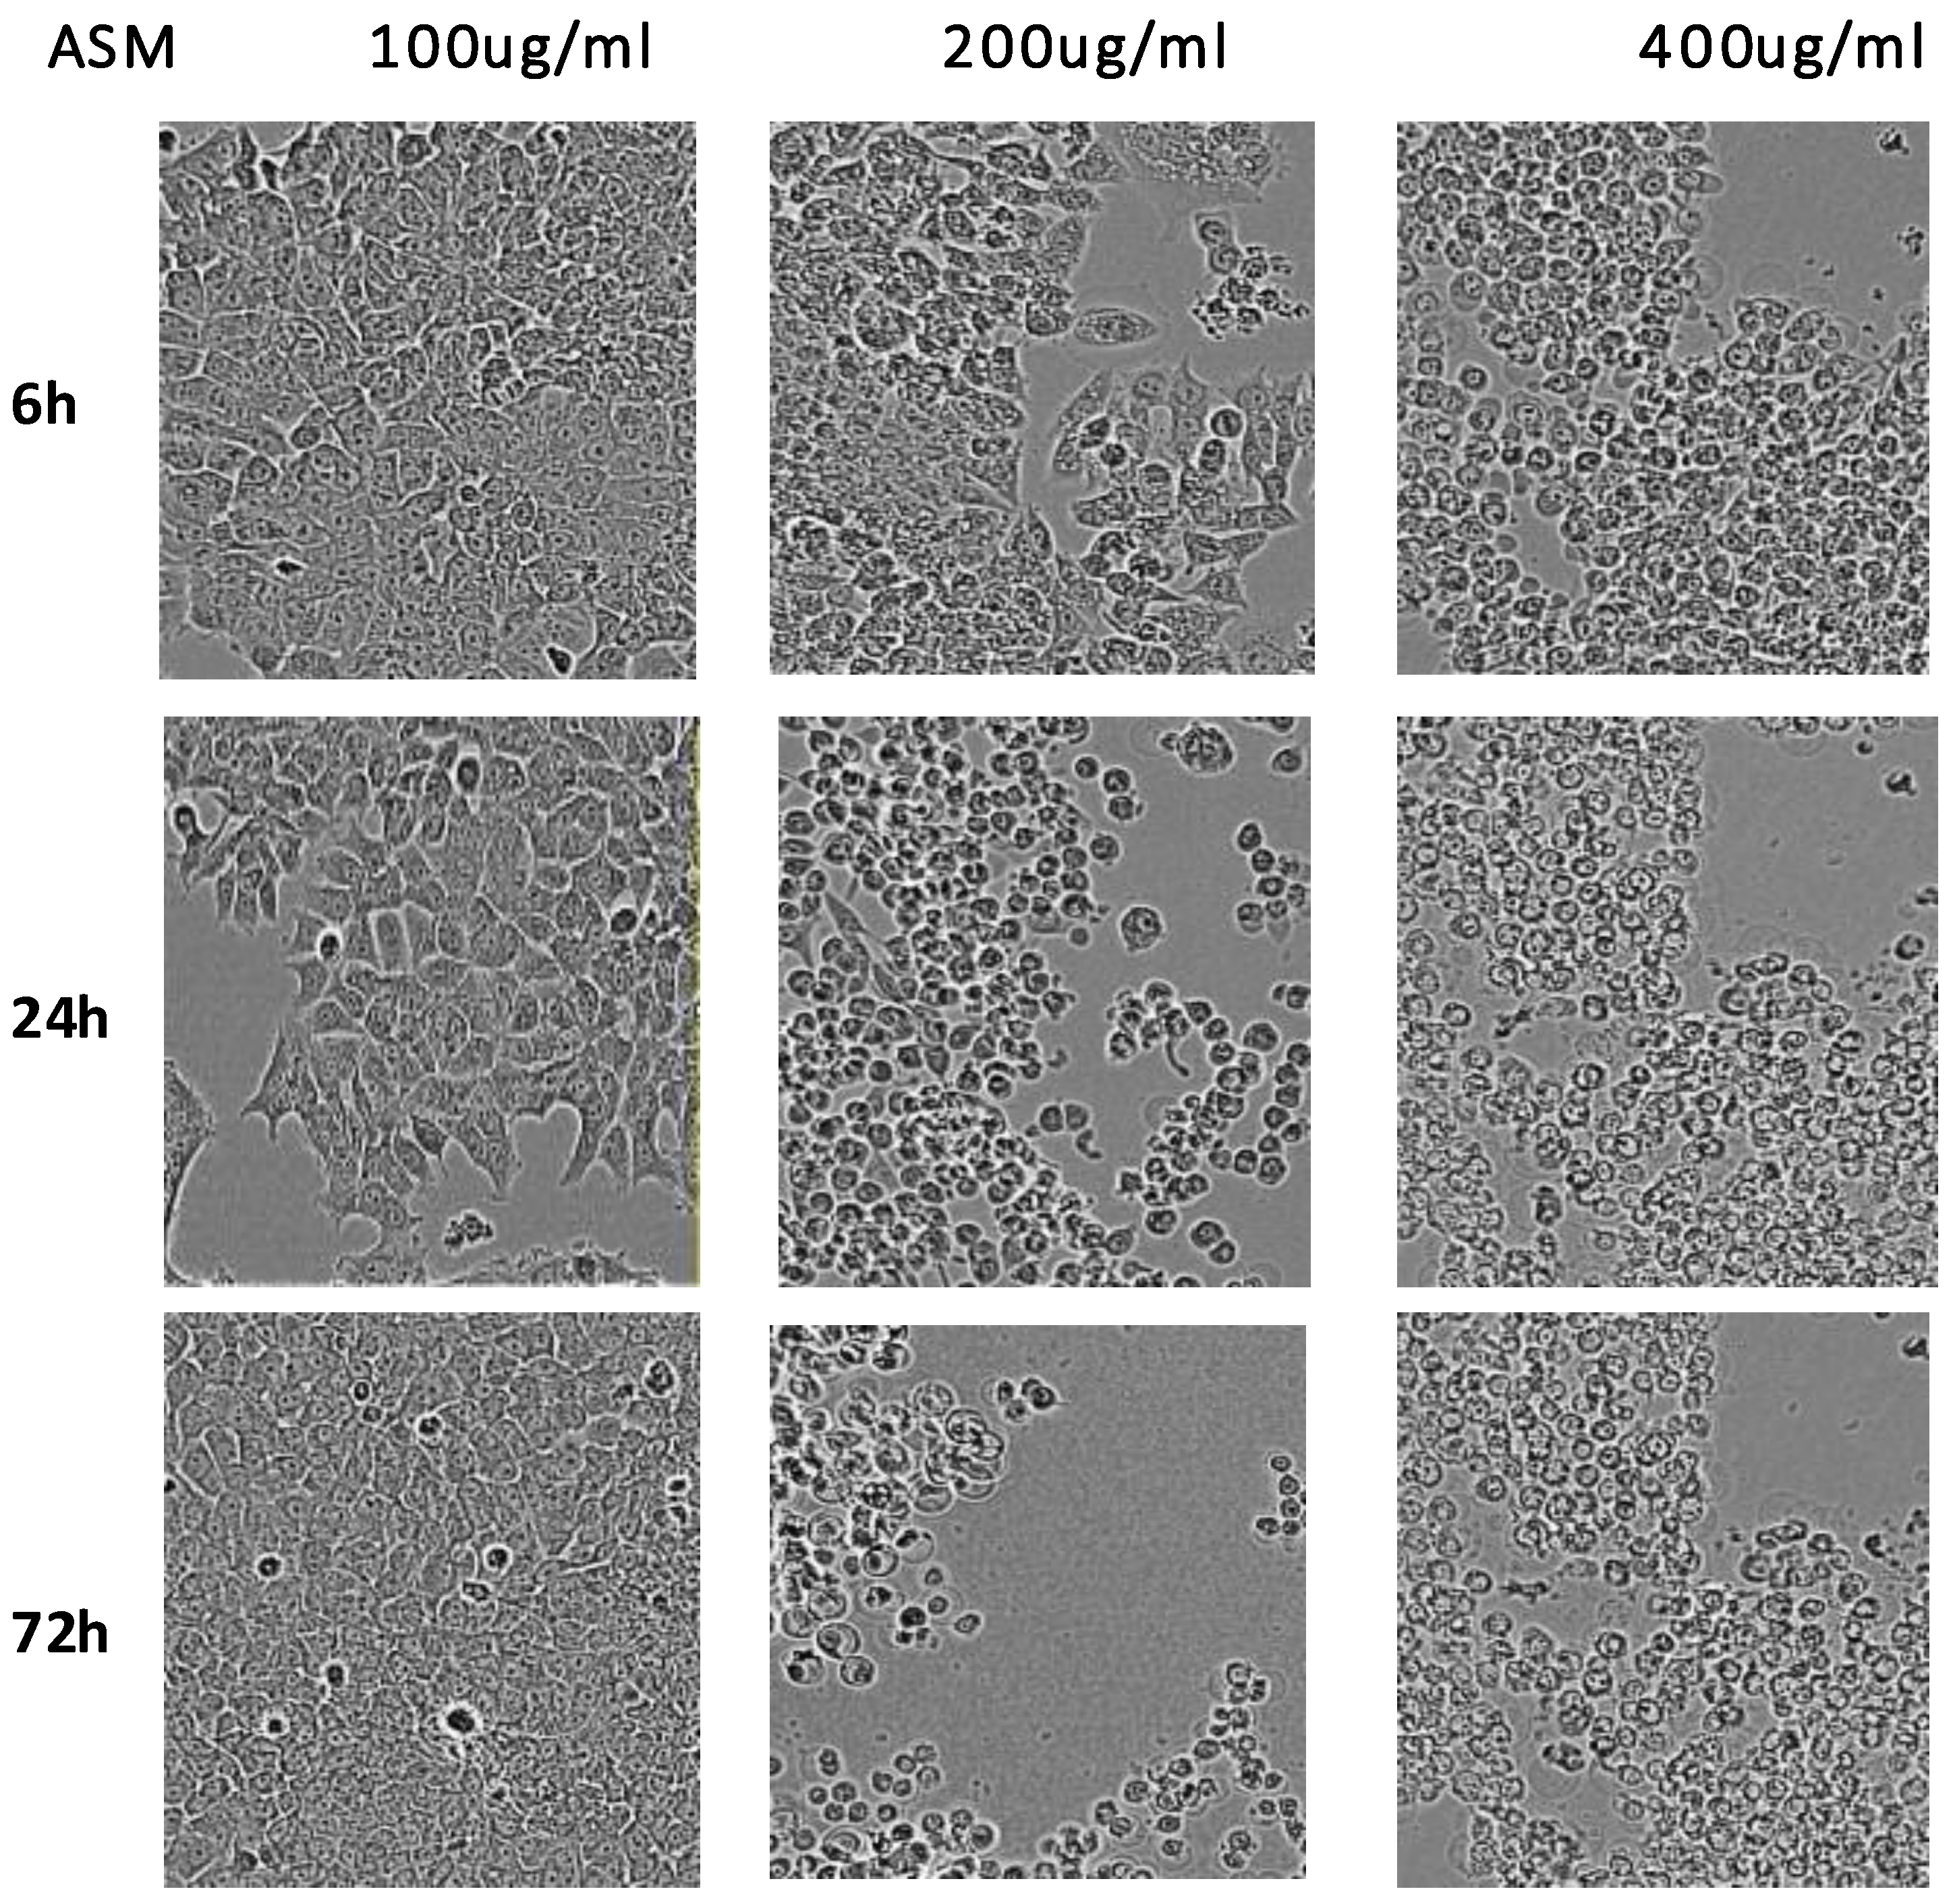
Figure 7.
Western blot analysis of PUMA steady-state levels in the MCF-7 line in the control group and model group, 1-ASS (A. spruneri stem) group, 2-ASL (A. spruneri leaves), E-ethanol, M-methanol group, VC-vehicle control, and U-untreated group. The graph represents the relative intensity of each band normalized to GAPDH. The data were presented as the mean ±SD. At least, N=2. Dunnett's multiple comparisons test, one-way ANOVA; ns, not statistically significant; *p<0.05.
Figure 7.
Western blot analysis of PUMA steady-state levels in the MCF-7 line in the control group and model group, 1-ASS (A. spruneri stem) group, 2-ASL (A. spruneri leaves), E-ethanol, M-methanol group, VC-vehicle control, and U-untreated group. The graph represents the relative intensity of each band normalized to GAPDH. The data were presented as the mean ±SD. At least, N=2. Dunnett's multiple comparisons test, one-way ANOVA; ns, not statistically significant; *p<0.05.
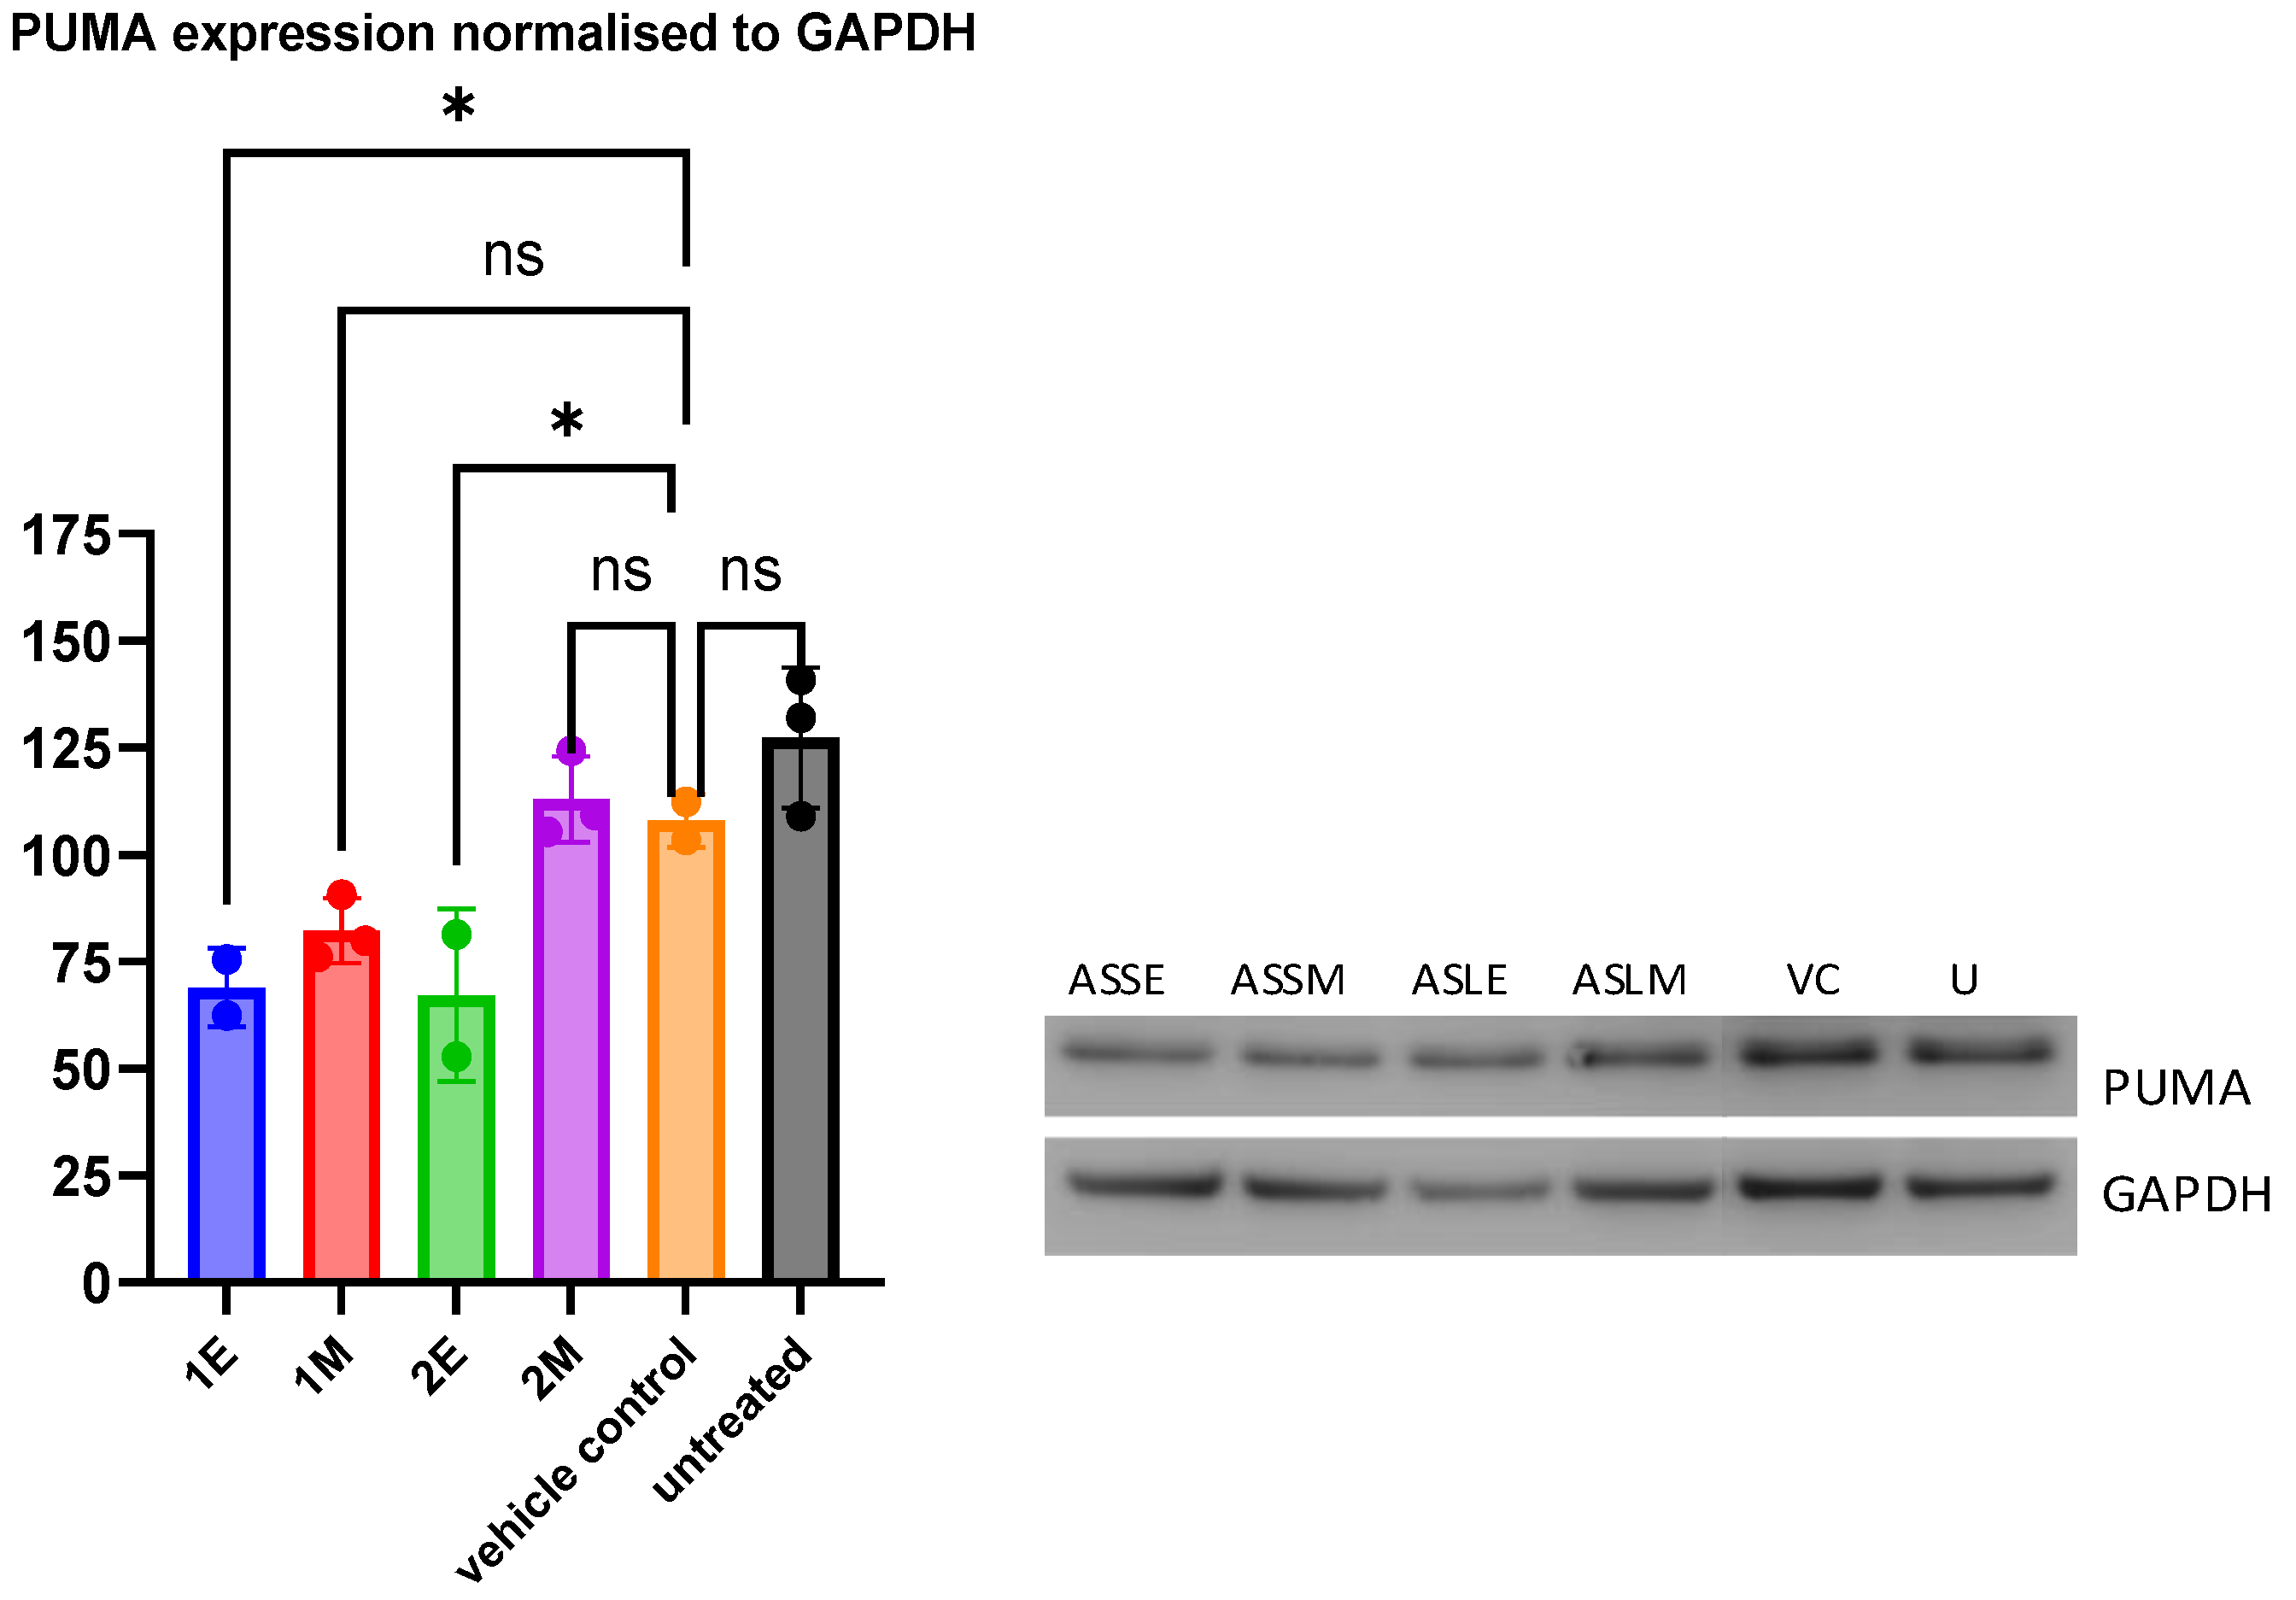

Table 1.
Total phenolic, flavonoid contents, and antioxidant capacity of the methanol extracts from different parts of A. spruneri.
Table 1.
Total phenolic, flavonoid contents, and antioxidant capacity of the methanol extracts from different parts of A. spruneri.
| Samples |
Total Flavonoids (mg QE/g Extract) |
Total Phenolics (mg GAE/g Extract |
DPPH |
| Leaves | 8.64±1.43 cd | 7.47±3.27 cd | 91.59±0.42 ac |
| Stem | 5.59±0.18 a | 6.94 ±0.56 a | 66.22±0.21 ab |
| Flower | 10.29±0.81 ef | 11.49±1.31 ef | 95.80 ±0.1 bde |
Within each column and row, means sharing the different superscripts (a–b) show comparison between the extracts using Tukey’s test at p < 0.05, QEs, Quercetin equivalents, and GAEs, Gallic acid equivalents.
Table 2.
Total phenolic content, flavonoid content, and antioxidant capacity of ethanol extracts from different parts of A. spruneri.
Table 2.
Total phenolic content, flavonoid content, and antioxidant capacity of ethanol extracts from different parts of A. spruneri.
| Samples |
Total Flavonoids (mgQE/g Extract) |
Total Phenolics (mgGAE/g Extract) |
DPPH |
| Leaves | 13.10±0.77 acd | 6.68±0.63 ab | 89.22±0.04 a |
| Stem | 8.03±0.67 c | 4.58±0.42 f | 93.09±0.42 bdf |
| Flower | 13.31±1.06 e | 8.97± 0.35 e | 92.79±0.42e |
Within each column and row, means sharing the different superscripts (a–f) show comparisons between the extracts using Tukey’s test at p < 0.05; Gallic acid equivalents, GAEs and Quercetin equivalents, QEs.
Disclaimer/Publisher’s Note: The statements, opinions and data contained in all publications are solely those of the individual author(s) and contributor(s) and not of MDPI and/or the editor(s). MDPI and/or the editor(s) disclaim responsibility for any injury to people or property resulting from any ideas, methods, instructions or products referred to in the content. |
© 2026 by the authors. Licensee MDPI, Basel, Switzerland. This article is an open access article distributed under the terms and conditions of the Creative Commons Attribution (CC BY) license (http://creativecommons.org/licenses/by/4.0/).
Copyright: This open access article is published under a Creative Commons CC BY 4.0 license, which permit the free download, distribution, and reuse, provided that the author and preprint are cited in any reuse.