

Submitted:
25 August 2026
Posted:
26 August 2026
You are already at the latest version
Abstract
Background: Current guidelines by the American College of Obstetrics and Gynecology require a two-step procedure for diagnosis of gestational diabetes (GD). This two-step procedure is challenging in resource limited settings. We determined if electrocardiography (ECG) done combined with artificial intelligence techniques can predict GD to provide a non-invasive, early gatekeeper strategy for GD risk stratification. Methods: Data for this study came from the Markers of Early Risk-stratification of Gestational Diabetes (MERGD) study and included 10s, 12-lead ECGs collected at the first antenatal visit. Patients were invited to undergo GCT at 24-28 weeks and, if required, an OGTT was conducted. GCT result was considered positive if the 1-hour, 50g glucose load blood glucose level was ≥130 mg/dL. ECGs were preprocessed, filtered, and a synthetic dataset was generated by using features from autoencoders, device-reported variables and heart rate variability parameters. A random forest model (RF-ECG) was trained on the synthetic data and validated first by 10-fold cross-validation, then on a held-out test of the synthetic data and finally on the original data not seen by the model. Results: Total 1,036 quality checked, preprocessed ECGs were used in the study. A total of 123 (11.87%) women developed GD. The fully trained RF-ECG model provided validation performance as follows: 78.28% accuracy, 87.80% sensitivity, 77.00% specificity and a likelihood ratio of positive test of 3.82. The RF-ECG model outperformed existing models of GD risk stratification. Importance metric identified 40 features as contributory to the model’s diagnostic logic. Conclusions: ECGs can accurately predict the likelihood of GD ahead of the final diagnosis. If supported by external validation in future studies, our approach can help noninvasively identify GD risk early during pregnancy in resource limited settings.
Keywords:
gestational diabetes
; artificial intelligence
; machine learning
; deep learning
; electrocardiography
; screening
1. Introduction
Gestational diabetes (GD) continues to be an important antenatal complication that can adversely affect maternal and fetal outcomes. The International Diabetes Federation (IDF) Diabetes Atlas estimated that the global prevalence of GD is as high as 14% of pregnancies.[1] However, there exists wide variation in the prevalence estimates for GD across continents, across countries and states within countries.[1] A primary reason for this variation is a lack of unified definition of GD. For example, the American College of Obstetrics and Gynecology (ACOG) recommends a two-step procedure for GD diagnosis[2] – the first step is a glucose challenge test (GCT) with 50g glucose, and the second step is an oral glucose tolerance test (OGTT). The GCT involves a measurement of blood glucose 1 hour after ingestion of the glucose load and patients with ≥130 mg/dl (≥7.2 mmol/L) of blood glucose are recalled at 24-28 weeks for a 3-hour OGTT. This method benefits from the combination of a sensitive (GCT) and a specific (OGTT). However, in low- to middle-income countries, it is pragmatically challenging to conduct a two-step procedure for GD diagnosis.[3,4,5] Therefore, different countries adopt different practices and definitions of GD diagnosis.[6] Unification of such diverse approaches to arrive at standardized, comparable estimates of GD prevalence is therefore needed. While OGTT remains the confirmatory test, the step of glucose challenge test is less suited to low-resource settings.
Considering this, several attempts have been made to develop and validate early risk assessment strategies for gestational diabetes. For example, the Monash Early Pregnancy Risk Score,[7] uses clinical variables such as age, height, weight, ethnicity, family history of diabetes and past history of GD to predict subsequent risk of GD during the first trimester of pregnancy. Similarly, the Tianjin Women and Children's Health Center Model, validated in large Chinese cohorts additionally uses information on physical activity, passive smoking and weight gain.[8] The accuracy of these scoring systems was 70.2% and 71.2%, respectively. The pre-pregnancy biomarker risk score developed by Badon et al[9] used biomarkers such as sex hormone-binding globulin, adiponectin, fasting glucose and homeostatic model for assessment of insulin resistance to achieve an accuracy of 73%. The recently developed gestational diabetes risk prediction model[10] achieved an improved accuracy of 78% by additionally including glycated hemoglobin (HbA1c).In India, a recent study that combined clinical and biochemical predictors achieved an accuracy of 92% when used during the second trimester.[11] Together these studies indicate that improved and more accurate models are needed to predict the risk of GDM early during pregnancy.
There is now burgeoning evidence to support the hypothesis that electrocardiographic (ECG) changes accompany glucose level variations and that ECG patterns are characteristic of prediabetes and diabetes.[5,12,13] Furthermore, ECG changes have been described in women who developed gestational diabetes.[14] We, therefore, hypothesized that the potential diagnosis of GD may be reflected in subtle ECG changes early during pregnancy. If this hypothesis is supported by data, then ECG can be potentially used as a first screen at the first possible healthcare contact during pregnancy. However, such subtle and non-linear changes in ECG are unlikely to be picked up using clinical gestalt or traditional association statistics. Therefore, we conducted this study where we combined the information captured by the ECG with novel feature extraction procedures and the power of deep learning to discriminate identify women who, on follow-up, progressed to GD.
2. Materials and Methods
2.1. Study Participants
Data for this study came as a part of the Markers of Early Risk-stratification of Gestational Diabetes (MERGD) study (registered with the Clinical Trials Registry—India, CTRI/2018/05/013946).The study protocol has been described in detail previously.[15] Briefly, the MERGD study was conducted on eligible and consenting pregnant women who reported to the Daga Memorial Women’s Hospital, Nagpur – a secondary care hospital specializing in obstetric care. Inclusion criteria were consecutive, newly registered pregnant women at the Study Center, with a gestational age at first contact < 20 weeks, no history of type 2 diabetes, and who had provided written, informed consent. Enrollment took place between 21 May 2018 and 11 August 2018 and participants were followed up for outcomes assessment till the end of delivery. Last date of follow-up was 22 February 2019. This study was approved by the Ethics Research Committee of the Daga Memorial Women’s Hospital, Nagpur, India on 10 May 2018. A total of 1,040 women were enrolled in the study.
2.2. Ground Truth
Gestational diabetes was defined as a compound phenotype as follows: The study used a two-step procedure recommended by the American College of Obstetrics and Gynecology (ACOG) in which the first step was a 50 g glucose load, 1 h glucose challenge test (GCT), where a cutoff post-load plasma glucose concentration of 130 mg/dL (7.2 mmol/L) was used to decide the need for an oral glucose tolerance test (OGTT). The second step was carried out in women with an abnormal GCT value and included a 100 g glucose load OGTT using a 100 g glucose load for a 3 h OGTT. Abnormal glucose values were investigated at the time of glucose load (fasting) and then hourly after glucose load. An abnormal value was defined using both the Carpenter–Coustan (C&C) criteria[16] and the National Diabetes Data Group (NDDG) criteria.[17] The C&C criteria used were: fasting—≥95 mg/dL (5.28 mmol/L); 1 h—≥180 mg/dL (10.0 mmol/L); 2 h—≥155 mg/dL; and 3 h—≥140 mg/dL (7.78 mmol/L). The NDDG criteria were: fasting—≥105 mg/dL, one hour—≥190 mg/dL, two hour—≥165 mg/dL and three hour—≥145 mg/dL. Presence of one or more abnormal values was defined as GD. In addition, an HbA1c of ≥6.5% was also considered as GD.
2.3. ECG Recording and Preprocessing
Study participants underwent the standard, 12-lead ECG which was recorded using a digital ECG device (Cardiart 6208, BPL Medical Technologies, Mumbai, Maharashtra, India). All recordings were for a duration of 10 s, with ≥12 bit analogue to digital converters, 0.05–150 Hz bandwidth and a sampling frequency of 1000 Hz. ECG recordings were saved as dicom files and deidentified before analytical use.
Considering the sampling frequency and duration, each ECG resulted in an array of 10,000x12 readings. We then used the Neurokit 2[18] Python library for initial preprocessing of the ECG. Each lead was separately preprocessed using the ecg.clean() analytical pipeline. Under this, the lead-specific ECG corrected for baseline wander and then followed the Pan & Tompkins algorithm.[19] This included bandpass filtering (to isolate 5-40 Hz frequency, QRS detection using differentiation, sliding widow integration and adaptive thresholding. Further, we used the Zhao method[20] to determine the ECG quality.
The cleaned, lead-specific ECG signals were then stacked back to into a two-dimensional array of 10,000x12 array. The full dataset thus represented an array of size 1,036x10,000x12 as shown in Figure 1. We then used the SciPy library[21] to resample the signal at 100 Hz and therefore the final data array had a size of 1,036x1000x12. This array was saved as a Numpy[22] binary file and used for subsequent analyses.
2.4. Feature Extraction
Our first step was to extract features from the ECG signal. We extracted features from three sources – using an autoencoder, collating basic time domain characteristics reported by the recording device and extracting features of heart rate variability (HRV) extracted by the Neurokit 2 library.
2.4.1. Autoencoder-Based Feature Extraction
The motivation for this step was to represent the entire 10s ECG signal for each lead in as few but informative number of features as possible. For this, we used an autoencoder framework which comprised of the encoder and decoder components as shown in Figure 1. The encoder used a series of compressing blocks each of which contained a convolution neural network (CNN) with prespecified number of 3x3 kernels, a batch normalization layer and a layer that applied the leaky rectified unit (leaky relu) activation function. The number of CNN layers started with 1000 (the input dimension) and proceeded to 512, 256, 128 and 64. This last layer of 64 kernels represented the bottleneck layer and the decoder component of the autoencoder used this layer as input. The decoder proceeded in a mirror image fashion and recreated the 1000 points that the encoder started out with. The loss function for the autoencoder was the mean squared error (MSE) that compared the input of the encoder function to the output of the decoder layer. The autoencoder was trained using tensorflow/keras platform.[23,24] Since we aimed to characterize a normal ECG signal, we used data only from women who did not develop GD for the autoencoder training. The autoencoder model was trained on a 2/3 training set and validated on the remaining 1/3 data. The best autoencoder model that provided the minimum MAE was used for feature extraction. To extract features, we predicted each lead of each 12-lead ECG into a 1x64 feature map drawn from the output of the encoder component. Thus, for each ECG we had 12 such feature maps which were finally horizontally stacked to create a feature vector of dimension 1x768 and contained a total of 768 features extracted from all 12 leads. Together, the feature array was of size 1,036x768 representing 768 features extracted from each ECG.
2.4.2. Basic Features Reported by the ECG Device
The ECG recording machine reported basic time domain features for each recorded ECG at the time of recording. These features (Nfeatures = 10) were heart rate, duration of the P wave, PR interval, duration of the QRS complex, QTcorrected interval, mean axis for the P, QRS and T waves and two voltages – the R peak in lead V5 and the S depth in lead V1. From these we created an array of size 1,036x10 as the second set of features.
2.4.3. Features Related to Heart Rate Variability
The Neurokit 2 library has an in-built function (ecg.hrv()) to estimate several features related to heart rate variability from a given ECG signal. We used the signal from lead II of each ECG to estimate these features (Nfeatures = 40) and generated a 1,036x40 array of HRV-based features. Lastly, we horizontally stacked the features arrays from each of three abovementioned sources to construct a full feature map of size 1,036x818 (represented as a black rectangle in Figure 1).
2.5. Generation of Synthetic Data for Classification Model Training
To develop and train a classification model, we aimed to create a synthetic dataset based off the actual feature map (1,036x818) described above. For this, we created 15 copies of the original dataset each of which was augmented by adding Gaussian noise with different parameters. Five values of mean (-0.2, -0.1, 0, 0.1, and 0.2) and three values of standard deviation (0.1, 0.2, and 0.3) yielded these 15 combinations. Each copy had the same number of women who developed GD. In the next step, we used the synthetic minority oversampling technique (SMOTE)[25] to balance each copy and then vertically stacked these datasets to generate an array with 27,690 rows and 818 columns. This array represented the synthetic dataset which was then minmax standardized and used for further analyses. It should be noted that not a single instance of the 27,690 rows in this dataset directly represented any instance in the original data of 1,036x818 features. Thus, the model was trained on a completely synthetic dataset and then validated on the original, unseen data.
2.6. Random Forest Model Training
We used the Scikit-Learn library[26] to implement, train, cross-validate and then internally validate a random forest (RF) model for classification. We first split the synthetic dataset into a training and test set (95% and 5%, respectively. The training set was used for model development. Best performing model was chosen from a combination of hyperparameter grid search and the 10 folds based on the training set. Following hyperparameter space was used to generate different combinations in the grid search: maximum tree depth (2,3,4), maximum number of features (2,3,4), minimum number of samples per leaf (1,2,3), minimum samples per split (2,3,4) and number of trees (75,100). Together these hyperparameter choices and the 10 folds meant that a total of 1,620 model fits were assessed to choose the best performing model. The loss function used is optimization process was logloss for binary classification.
2.7. Validation
We validated the RF model in three steps on three different datasets. First, we used 10-fold cross validation during model training to ensure that the model performed consistently within the training set. Second, we chose the best model to assess its classification performance in the test set. Third, we evaluated the classification performance of the best model in the original dataset of 1,036x818 features in two ways. We first used receiver operating characteristic (ROC) curve-based statistics to quantitatively measure the predictive performance of the model and then we compared this performance with that of clinical predictors only. Further, we compared the predictive performance of the RF model with that of well-established, externally validated risk scoring systems used to predict the risk of GD. A recent, comprehensive meta-analysis[27] recommended four risk scoring systems by Naylor et al,[28] Teede et al,[7] van Leeuwen et al[29] and Nanda et al[30] as early screens for the risk of GD. We compared the performance of our RF model with these four risk scoring systems as well.
2.8. Statistical Analyses
Descriptive statistics included mean and standard deviation for continuous variables and number and percentages for categorical variables. Difference between women with and without GD was tested using Student’s t test for continuous variables, and χ2 test for categorical variables. In case of cell counts less than 5 for categorical variables, Fisher’s exact test was used in place of the χ2 test. Classification performance was assessed by plotting the ROC curve and estimating the area under the ROC curve (AUC). Comparison of AUC of two curves was done using the De Long and De Long test. Best threshold to evaluate a test performance was chosen as the point on the ROC curve nearest to the upper-left corner. Dichotomous classification performance was assessed by estimating sensitivity (true positives/total positives), specificity (true negatives/total negatives), precision (true positives/predicted positives), accuracy (proportion of correctly classified individuals) and F1 score (harmonic mean of sensitivity and precision). We also estimated the likelihood ratio of positive (LR+) and negative (LR-) prediction of GD. Importance of individual features was assessed using mean decrease in impurity (MDI) metric[31] and informative number of features was estimated using the kneedle algorithm.[32] Statistical analyses were conducted using dedicated python scripts and using the Stata 18.0 (Stata Corp, College Station, TX) software package. Statistical significance was tested at a global type I error rate of 0.05.
3. Results
3.1. Study Participants
Details of the MERGD cohort have been described previously.[15] In this study, we included a total of 1,036 participants for whom first visit ECGs were available. Table 1 describes and compares the baseline characteristics of participants who did (n = 123, 11.87%) and did not (88.13%) develop GD. Briefly, women who developed GD were, on an average, 1.31 years older and registered 0.65 weeks earlier for antenatal care as compared to the women who did not develop GD. Family income, caste and religion were all associated with the risk of GD. Specifically, of the women who developed GD, 20.83% belonged to families earning ≥ ₹ 200,000 per annum, 44.72% belonged to the open caste and 32.52% were Muslim.
Comparatively, these numbers in the women who did not develop GD were 13.41%, 30.04% and 32.52%, respectively and were statistically significant (p = 0.0291, 0.0010, and 0.0029, respectively). Further, women who developed GD had a significantly higher body mass index (BMI, p = 0.0003), systolic blood pressure (p = 0.0012), diastolic blood pressure (p = 0.0001) and mean arterial pressure (p = 0.0001). Lipid profile showed that women with GD had significantly higher serum triglycerides and very low-density lipoproteins (p = 0.0063 each).
As per the MERGD study protocol, the date of conception was determined using ultrasonography (USG, Figure 2). Using this date as day 0, the average gestational age at the first visit was 16.15 weeks, a glucose challenge test (GCT) was conducted at an average of 24.66 weeks and oral glucose tolerance test (OGTT, if needed based on GCT result) at 26.56 weeks. Thus, there was a lead time of 10.41 weeks between ECG measurement and OGTT-confirmed diagnosis of GD. Detailed study protocol has been described previously.(XX)
3.2. Feature Extraction, Model Training, and Validation
Supplementary Figure S1 shows the convergence of the MSE when training the autoencoders for feature extraction. Recordings from each ECG lead were separately used for training and for each lead the convergence was quick, taking a minimum of 17 (lead aVF) to a maximum of 156 (lead aVR) epochs (Supplementary Table S1). The overall estimate of MSE across the leads ranged from a minimum of 5.74x10⁻⁴ (lead aVL) to a maximum of 1.80x10⁻³ (lead V5). When we used the features extracted by the encoders and basic as well as HRV features (total number of features = 818) to train a random forest model on a SMOTE-balanced dataset in a 10-fold cross-validation framework on the training set only, we found that the model performed consistently highly across the folds (Supplementary Figure S2) and the best performing hyperparameter combination was: maximum tree depth = 4, maximum number of features = 3, minimum samples per leaf = 1, minimum samples per split = 2 and number of estimators = 75.
The classification performance (point and 95% CI estimate) of this model averaged across the 10-folds was as follows: AUC, 0.9198 (0.9164 - 0.9233), accuracy, 0.8188 (0.8139 - 0.8237); precision, 0.7370 (0.7316 - 0.7424); recall, 0.9921 (0.9900 - 0.9942); and F1-ratio, 0.8457 (0.8422 - 0.8492). For validation, we used the held-out test set (N = 1,370 with 675 instances of GD) and observed that the model provided comparable and highly accurate prediction of GD status. The classification performance (point and 95% CI estimate) of this model in this held-out test set was as follows: AUC, 0.9152 (0.9005 – 0.9299), accuracy, 0.8445 (0.8244 – 0.8627); sensitivity, 0.8904 (0.8646 – 0.9118); specificity, 0.8000 (0.7656 – 0.8281); precision, 0.8122 (0.7624 – 0.8387); and F1-ratio, 0.8495 (0.8295 – 0.8495) (Figure 3A and 3B). For further analyses, we dubbed this model as the RF-ECG model.
As a final step in validation, we used the model trained on the synthetic data to predict the probability of GD in the original dataset (N = 1,036; 123 instances of GD). In this dataset, the RF-ECG model yielded following metrics (point and 95% confidence interval) of classification performance: AUC, 0.8989 (0.8765 – 0.9213); accuracy 0.7828 (0.7567 – 0.8069); sensitivity 0.8780 (0.8085 – 0.9247); specificity 0.7700 (0.7416 – 0.7961); precision 0.3396 (0.2898 – 0.3933) and F1-ratio 0.4898 (0.4309 – 0.5455). We posited that the decrease in precision and F1-ratio observed in this dataset compared to the held-out test set in the augmented data was primarily due to the stark difference in the prevalence of GD in the two datasets. To that end, we estimated the likelihood ratio of a positive test (LR+) and negative test (LR-) – metrics that are known to be prevalence-agnostic (XX). We observed that in this original dataset, the LR+ was 3.82 (95% CI 3.33 – 4.37) and the LR- was 0.16 (0.10 – 0.25). These estimates were comparable to the LR+ and LR- for the RF-ECG model in the held-out test set of the augmented data: 4.45 (95% CI 3.82 3 – 5.18) and 0.14 (0.11 – 0.17), respectively.
3.3. Comparison of Our Model with Existing Models of GD Risk Prediction
We first investigated if the classification performance of the RF-model improved further by adding statistically significant baseline characteristics (shown in Table 1). The results of these analyses are shown in Figure 3E. The model based on baseline characteristics alone (the MERGD model, blue colored curve in Figure 3E) had a moderate AUC of 0.6670 (95% CI 0.6118 – 0.7221), whereas the AUC (95% CI) for the RF-ECG model alone in the original dataset (red colored curve in Figure 3E) was 0.8989 (0.8765 – 0.9213). However, when this model was combined with the predictions from the MERGD model (green colored curve in Figure 3E), the estimated AUC (95% CI) improved to 0.9103 (0.8889 – 0.9318). This improved AUC (total increase in AUC = 0.0114) was statistically significant (p = 0.0298).
Next, we compared the GD prediction performance of the RF model to that of other externally validated, established risk scoring systems. Specifically, we included the models by Naylor et al [30], the Monash model [7], the van Leeuwen model [29] and the Nanda et al [30] models along with the MERGD and the RF-ECG models alluded to above. The results of these analyses (Figure 3F) showed that all the models based on clinical and socio-demographic characteristics had a comparable AUC (ranging from a minimum of 0.5986 for the Monash model to a maximum of 0.6670 for the MERGD model). However, the classification performance of the RF-ECG model far exceeded that of any of the remaining five models.
3.4. Feature Importances and Model Explanation
In a quest to understand the reasoning behind the predictions provided by the RF-ECG model, we found that the elbow for the plot of feature importances and feature ranks was found at a rank of 40 (4.88%, Figure 4A). Therefore, we focused on the top 40 most important features (which cumulatively accounted for an importance of 28.89%) of all the features. Full list of all the features and their importances (along with their distribution in the dataset) is provided in Supplementary Table S2.
As shown in Figure 4B, an overview of the important features indicated that of the top 40 features, three (mean heart rate, QT interval and P-wave axis) represented basic ECG features reported by the recording device, seven features were related to HRV (six from time domain and one from frequency domain) while the remaining 30 features were identified by the autoencoders. Of these 30 AE-related features (Figure 4C), majority (12, 40%) were in the lead V2 and lead V4 (8, 26.67%).
Figure 4D shows the distribution of the comparative feature values in women who did or did not develop GD. The log percent difference (between GD- and no-GD participants) showed that women with GD had a significantly higher heart rate and a rightward shift of the P-wave axis. The short QT interval observed in women with GD was consistent with a higher heart rate (features corroborating findings shown in Table 1). The six time-domain HRV-related features were PRC80NN (80th percentile of all normal heartbeat-to-heartbeat intervals), MedianNN (median of all normal heartbeat-to-heartbeat intervals), PRC20NN (20th percentile of all normal heartbeat-to-heartbeat intervals), MaxNN (maximum of all normal heartbeat-to-heartbeat intervals), PNN20 (proportion or of successive heartbeat intervals that differ by more than 20 milliseconds), and TINN (triangular interpolation of the NN interval histogram). The only frequency-domain feature that was included in the top 40 features was VLF (very-low frequency power). As shown in Figure 4D, all the HRV-related features showed lower values in the GD patients as compared to the non-GD participants, indicating reduced HRV associated with GD. Together, the feature importance analysis indicated that patients with GD had higher heart rate, rightward deviation of the P-wave axis, reduced heart rate variability and a concentration of convolutionally detected features on the V2 and V4 leads.
4. Discussion
We developed and validated a deep learning/machine learning model to predict incident GD early during pregnancy using electrocardiography. The model predicted GD with high degree of accuracy and outperformed the existing clinical risk stratification systems for GD. While electrocardiographic changes have been consistently shown to be associated with the risk of GD, to our knowledge, this is first such model that taps subtle ECG features to predict the risk of GD 10.41 weeks ahead of a confirmatory OGTT. This lead time can be efficiently used in clinical practice to meliorate the risk of incident GD. Lastly, our results also point towards the possibility of combining the ECG-based model with other clinical and socio-demographic variables to further improve its classification performance.
Zhang et al[33] conducted an elegant meta-analysis of 25 studies using machine learning models for prediction of gestational diabetes. These models used tabular, clinical data extracted from electronic health records containing combinations of the following variables: maternal age, family history of diabetes, fasting plasma glucose, pre-pregnancy BMI, history of diabetes, serum triglycerides, hemoglobin A1c, systolic blood pressure and high-sensitivity C-reactive protein. The pooled AUC for these machine learning models was reported to be 0.84 but the dichotomized performance for GDM diagnosis had a sensitivity of 0.69 and specificity of 0.75. However, currently there are no studies that use digital electrocardiographic input and combine these with artificial intelligence for prediction of GD. Moreover, the sensitivity and specificity of our model was superior to the estimates reported by Zhang et al.[33]
The biological plausibility of ECG as a marker of GD rides on previous studies. Pregnancy offers a high-stress environment to the mother’s heart.[34] As a result, the maternal heart is in a process of adaptation throughout pregnancy. Thirunavukarasu et al[35] demonstrated that a higher left ventricular (LV) mass, lower LV end-diastolic volume and lower global longitudinal shortening are characteristic of patients with GD. These changes are suggestive concentric LV hypertrophy consistent with hypertensive heart disease. Heart rate variability measures (QT dispersion)[14,36] and ECG-based body surface mapping[37] have also been shown to be associated with GD. Gasic et al [38] have also shown that features of cardiac autonomic neuropathy (CAN) are more frequent in GD than in non-GD women. Notably, GD is often associated with insulin resistance which exercises a metabolic strain on the heart muscle in addition to the preload due to plasma volume expansion.[34] In this context, two findings from our study deserve a mention. First, we found features suggestive of an increased right heart preload in GD (P-wave axis shift and increased heart rate). This finding is concomitant with the expected expansion of plasma early during pregnancy.[39] Second, we observed a reduced HRV with reduced very-low frequency power in women with GD – a finding that corroborates a likely autonomic axis to the involvement of maternal heart in GD.[40]
There are some important limitations of the study that preclude immediate generalization of the findings. First, despite the robustness of cross validation and of using the original dataset as an external dataset (Figure 1), the real test of the algorithm will be in external, independent datasets. Unfortunately, such well-curated datasets that include digitally collected ECGS are currently unavailable. Till the time the models are externally validated in independent data sets, generalization of the model cannot be done. Second, the autoencoder-related features are essentially uncharacterized. Therefore, a full understanding of the ECG features contributing to GD is still not possible at this time. Further studies are needed (e.g. the morphing methods used by Obermeyer et al [41]) to innovatively characterize the subtle ECG features that are associated with GD. Third, GD is mixed bag od varying definitions and thresholds. The ground truth definition used in this study was based on a previous paper focusing on the study population. This definition of GD is not universal and therefore the model will need to be made adaptable to the varying definitions of GD. At this time, our study is a proof-of-principle endeavor to demonstrate the utility of deep learning / machine learning in developing an ECG-based biomarker for GD.
5. Conclusions
Akin to the fact that a GCT is a gate-keeper first step recommended [2] in the diagnosis of GD and that the GCT can also be informative in the context of future cardiovascular health,[42] we have developed a non-invasive, early and accurate method to predict the likelihood of GD that promises substantial lead time. The model detected features consistent with clinical expectations and more accurately than existing risk stratification systems for GD. If the classification performance of our model is supported by external datasets in future studies, then our approach has a potential to provide a feasible alternative strategy for GD diagnosis, especially in resource limited settings.
Supplementary Materials
The following supporting information can be downloaded at the website of this paper posted on Preprints.org, Table S1: Summary of convergence of autoencoder models; Table S2: Full list of features and their importance Figure S1: Convergence of the autoencoder models in the training and test sets; Figure S2: Parallel coordinating plot showing the relative performance of the RF-ECG model across folds and hyperparameter combinations; Note S1: Visual Basic for Applications (VBA) code to calculate risk scores and probabilities.
Author Contributions
H.K and M.M.—Concept, study design, data collection, statistical analysis, writing—original draft; K.K. and A.B.P.—study design, data collection, manuscript review; A.P., M.J., K.V.P., S.B., S.P. and V.K.—data collection, manuscript review; P.K.D.—study design, manuscript review. The authors have reviewed and edited the output and take full responsibility for the content of this publication. All authors have read and agreed to the published version of the manuscript.
Funding
This research was intramurally funded by the Lata Medical Research Foundation, Nagpur, India. The article processing charges were also funded by the Lata Medical research Foundation, Nagpur, India.
Institutional Review Board Statement
The study was conducted in accordance with the Declaration of Helsinki and approved by the Ethics Research Committee of the Daga Memorial Women’s Hospital, Nagpur, India on 10 May 2018.
Informed Consent Statement
Written informed consent was obtained from all subjects involved in the study.
Data Availability Statement
The data that support the findings of this study are not publicly available since restrictions apply to the availability of these data, as outlined in the recommendations of the Ethics Research Committee of the Lata Medical Research Foundation, Nagpur, India. Limited data permitted by the Ethics Research Committee of the Lata Medical Research Foundation, Nagpur, India are, however, available from the authors upon reasonable request.
Acknowledgments
The authors are indebted to the data collection team, which included Abhishek Dagamwar, Mayuri Parate, Chaitali Gedam, Nargis Kausar, Jyotsna Bansod and Monali Chachere from the Lata Medical Research Foundation, Nagpur, India. The authors also gratefully appreciate the administrative support from Smita Puppalwar and Shilpa Pawar (Lata Medical Research Foundation, Nagpur, India); Madhuri Thorat and Sulbha Mool (Daga Memorial Women’s Hospital, Nagpur) and Madhavi Deshmukh (Dhruv Pathology and Molecular Diagnostic Laboratory, Nagpur, India).
Conflicts of Interest
The authors declare no conflicts of interest.
Abbreviations
The following abbreviations are used in this manuscript:
| ACOG | American College of Obstetrics and Gynecology |
| AUC | Area under receiver operating characteristic curve |
| BMI | Body mass index |
| CI | Confidence interval |
| CNN | Convolution neural network |
| ECG | Electrocardiography |
| GCT | Glucose challenge test |
| GD | Gestational diabetes |
| HRV | Heart rate variability |
| IDF | International Diabetes Federation |
| LR | Likelihood ratio |
| MERGD | Markers of Early Risk-stratification of Gestational Diabetes |
| MSE | Mean squared error |
| NDDG | National Diabetes Data Group |
| OGTT | Oral glucose tolerance test |
| RF | Random forest |
| ROC | Receiver operating characteristics curve |
| SMOTE | Synthetic minority oversampling technique |
References
- Wang, H.; Li, N.; Chivese, T.; Werfalli, M.; Sun, H.; Yuen, L.; Hoegfeldt, C.A.; Elise Powe, C.; Immanuel, J.; Karuranga, S.; et al. IDF Diabetes Atlas: Estimation of Global and Regional Gestational Diabetes Mellitus Prevalence for 2021 by International Association of Diabetes in Pregnancy Study Group's Criteria. Diabetes Res. Clin. Pract. 2022, 183, 109050. [Google Scholar] [CrossRef] [PubMed]
- ACOG Practice Bulletin No. 190: Gestational Diabetes Mellitus. Obstet. Gynecol. 2018, 131, e49–e64. [CrossRef] [PubMed]
- Khan, S.; Bal, H.; Khan, I.D.; Paul, D. Evaluation of the diabetes in pregnancy study group of India criteria and Carpenter-Coustan criteria in the diagnosis of gestational diabetes mellitus. Turk. J. Obstet. Gynecol. 2018, 15, 75–79. [Google Scholar] [CrossRef] [PubMed]
- Seshiah, V.; Balaji, V.; Bronson, S.C.; Jain, R.; Chandrasekar, A. Diagnosing Gestational Diabetes by a Single-Test Procedure Is a Propitious Step Towards Containing the Epidemic of Diabetes. Cureus 2021, 13, e19910. [Google Scholar] [CrossRef] [PubMed]
- Kulkarni, A.R.; Patel, A.A.; Pipal, K.V.; Jaiswal, S.G.; Jaisinghani, M.T.; Thulkar, V.; Gajbhiye, L.; Gondane, P.; Patel, A.B.; Mamtani, M.; et al. Machine-learning algorithm to non-invasively detect diabetes and pre-diabetes from electrocardiogram. BMJ Innov. 2023, 9, 32–42. [Google Scholar] [CrossRef]
- Li-Zhen, L.; Yun, X.; Xiao-Dong, Z.; Shu-Bin, H.; Zi-Lian, W.; Adrian Sandra, D.; Bin, L. Evaluation of guidelines on the screening and diagnosis of gestational diabetes mellitus: systematic review. BMJ Open 2019, 9, e023014. [Google Scholar] [CrossRef] [PubMed]
- Teede, H.J.; Harrison, C.L.; Teh, W.T.; Paul, E.; Allan, C.A. Gestational diabetes: development of an early risk prediction tool to facilitate opportunities for prevention. Aust. N Z. J. Obstet. Gynaecol. 2011, 51, 499–504. [Google Scholar] [CrossRef] [PubMed]
- Gao, S.; Leng, J.; Liu, H.; Wang, S.; Li, W.; Wang, Y.; Hu, G.; Chan, J.C.N.; Yu, Z.; Zhu, H.; et al. Development and validation of an early pregnancy risk score for the prediction of gestational diabetes mellitus in Chinese pregnant women. BMJ Open Diabetes Res. Care 2020, 8. [Google Scholar] [CrossRef] [PubMed]
- Badon, S.E.; Zhu, Y.; Sridhar, S.B.; Xu, F.; Lee, C.; Ehrlich, S.F.; Quesenberry, C.P.; Hedderson, M.M. A Pre-Pregnancy Biomarker Risk Score Improves Prediction of Future Gestational Diabetes. J. Endocr. Soc. 2018, 2, 1158–1169. [Google Scholar] [CrossRef] [PubMed]
- Niu, Z.R.; Bai, L.W.; Lu, Q. Establishment of gestational diabetes risk prediction model and clinical verification. J. Endocrinol. Invest 2024, 47, 1281–1287. [Google Scholar] [CrossRef] [PubMed]
- Dinakaran, A.; Thiruvengadam, R.; Srinivasan, A.R.; Manikandan; Nanda, S.K.; Daniel, M.; Rajagambeeram, R. Prediction Models for Gestational Diabetes Mellitus: Diagnostic Utility of Clinical and Biochemical Markers. Indian J. Endocrinol. Metab. 2025, 29, 295–302. [Google Scholar] [CrossRef] [PubMed]
- Stern, K.; Cho, Y.H.; Benitez-Aguirre, P.; Jenkins, A.J.; McGill, M.; Mitchell, P.; Keech, A.C.; Donaghue, K.C. QT interval, corrected for heart rate, is associated with HbA1c concentration and autonomic function in diabetes. Diabet. Med. 2016, 33, 1415–1421. [Google Scholar] [CrossRef] [PubMed]
- Stern, S.; Sclarowsky, S. The ECG in diabetes mellitus. Circulation 2009, 120, 1633–1636. [Google Scholar] [CrossRef] [PubMed]
- Medova, E.; Fialova, E.; Mlcek, M.; Slavicek, J.; Dohnalova, A.; Charvat, J.; Zakovicova, E.; Kittnar, O. QT dispersion and electrocardiographic changes in women with gestational diabetes mellitus. Physiol. Res. 2012, 61, S49–55. [Google Scholar] [CrossRef] [PubMed]
- Mamtani, M.; Kurhe, K.; Patel, A.; Jaisinghani, M.; Pipal, K.V.; Bhargav, S.; Mundhada, S.; Das, P.K.; Parvekar, S.; Khedikar, V.; et al. Opportunity Screening for Early Detection of Gestational Diabetes: Results from the MERGD Study. J. Clin. Med. 2025, 14. [Google Scholar] [CrossRef] [PubMed]
- Carpenter, M.W.; Coustan, D.R. Criteria for screening tests for gestational diabetes. Am. J. Obstet. Gynecol. 1982, 144, 768–773. [Google Scholar] [CrossRef] [PubMed]
- American Diabetes, A. 2. Classification and Diagnosis of Diabetes: Standards of Medical Care in Diabetes-2018. Diabetes Care 2018, 41, S13–S27. [Google Scholar] [CrossRef] [PubMed]
- Makowski, D.; Pham, T.; Lau, Z.J.; Lespinasse, F.; Pham, H.; Schölzel, C.; Chen, S.A. NeuroKit2: A Python toolbox for neurophysiological signal processing. Behav. Res. Methods 2021, 53, 1689–1696. [Google Scholar] [CrossRef] [PubMed]
- Pan, J.; Tompkins, W.J. A real-time QRS detection algorithm. IEEE Trans. BioMed Eng. 1985, 32, 230–236. [Google Scholar] [CrossRef] [PubMed]
- Zhao, Z.; Zhang, Y. SQI Quality Evaluation Mechanism of Single-Lead ECG Signal Based on Simple Heuristic Fusion and Fuzzy Comprehensive Evaluation. Front Physiol. 2018, 9, 727. [Google Scholar] [CrossRef] [PubMed]
- Virtanen, P.; Gommers, R.; Oliphant, T.E.; Haberland, M.; Reddy, T.; Cournapeau, D.; Burovski, E.; Peterson, P.; Weckesser, W.; Bright, J.; et al. SciPy 1.0: fundamental algorithms for scientific computing in Python. Nat. Methods 2020, 17, 261–272. [Google Scholar] [CrossRef] [PubMed]
- Harris, C.R.; Millman, K.J.; van der Walt, S.J.; Gommers, R.; Virtanen, P.; Cournapeau, D.; Wieser, E.; Taylor, J.; Berg, S.; Smith, N.J.; et al. Array programming with NumPy. Nature 2020, 585, 357–362. [Google Scholar] [CrossRef] [PubMed]
- Abadi, M.; Barham, P.; Chen, J.; Checn, Z.; Davis, A.; Dean, J.; Devin, M.; Ghemawat, S.; Irving, G.; Isard, M.; et al. TensorFlow: A System for Large-Scale Machine Learning. In Proceedings of the 12th USELIX Symposium on Operating Systems Design and Implementation, Savannah, GA, USA, Nov 2-4, 2016, 2015. [Google Scholar]
- Chollet, F.; Watson, M.; Kulkarni, H.; Bursztein, E.; Rahman, F.; de Marmiesse, G.; Lee, T. Keras 2015. [CrossRef] [PubMed]
- Chawla, N.V.; Bower, K.; Kevin, W.; Hall, L.O.; Kegelmeyer, W.P. SMOTE: synthetic minority over-sampling technique. J. Artif. Intel. Res. 2002, 16, 321–357. [Google Scholar] [CrossRef]
- Abraham, A.; Pedregosa, F.; Eickenberg, M.; Gervais, P.; Mueller, A.; Kossaifi, J.; Gramfort, A.; Thirion, B.; Varoquaux, G. Machine learning for neuroimaging with scikit-learn. Front Neuroinform 2014, 8, 14. [Google Scholar] [CrossRef] [PubMed]
- Seifu, B.L.; Belsti, Y.; Yimer, N.B.; Goldstein, R.F.; Enticott, J.; Teede, H. Externally validated risk prediction models for gestational diabetes mellitus: A systematic review and meta-analysis. Acta Obstet. Gynecol. Scand. 2026. [Google Scholar] [CrossRef] [PubMed]
- Naylor, C.D.; Sermer, M.; Chen, E.; Farine, D. Selective screening for gestational diabetes mellitus. Toronto Trihospital Gestational Diabetes Project Investigators. N Engl. J. Med. 1997, 337, 1591–1596. [Google Scholar] [CrossRef] [PubMed]
- van Leeuwen, M.; Opmeer, B.C.; Zweers, E.J.; van Ballegooie, E.; ter Brugge, H.G.; de Valk, H.W.; Visser, G.H.; Mol, B.W. Estimating the risk of gestational diabetes mellitus: a clinical prediction model based on patient characteristics and medical history. BJOG 2010, 117, 69–75. [Google Scholar] [CrossRef] [PubMed]
- Nanda, S.; Savvidou, M.; Syngelaki, A.; Akolekar, R.; Nicolaides, K.H. Prediction of gestational diabetes mellitus by maternal factors and biomarkers at 11 to 13 weeks. Prenat. Diagn. 2011, 31, 135–141. [Google Scholar] [CrossRef] [PubMed]
- Breiman, L. Random Forests. Mach. Learn. 2001, 45, 5–32. [Google Scholar] [CrossRef]
- Satopää, V.; Albrecht, J.; Irwin, D.; Raghavan, B. Kneedle" in a Haystack: Detecting Knee Points in System Behavior. In Proceedings of the 31st International Conference on Distributed Computing Systems Workshops, 2011; pp. 166–171. [Google Scholar]
- Zhang, Z.; Yang, L.; Han, W.; Wu, Y.; Zhang, L.; Gao, C.; Jiang, K.; Liu, Y.; Wu, H. Machine Learning Prediction Models for Gestational Diabetes Mellitus: Meta-analysis. J. Med. Internet Res. 2022, 24, e26634. [Google Scholar] [CrossRef] [PubMed]
- Nolan, C.J. Gestational Diabetes Mellitus and the Maternal Heart. Diabetes Care 2022, 45, 2820–2822. [Google Scholar] [CrossRef] [PubMed]
- Thirunavukarasu, S.; Ansari, F.; Cubbon, R.; Forbes, K.; Bucciarelli-Ducci, C.; Newby, D.E.; Dweck, M.R.; Rider, O.J.; Valkovic, L.; Rodgers, C.T.; et al. Maternal Cardiac Changes in Women With Obesity and Gestational Diabetes Mellitus. Diabetes Care 2022, 45, 3007–3015. [Google Scholar] [CrossRef] [PubMed]
- Arslan, D.; Guvenc, O.; Cimen, D.; Ulu, H.; Oran, B. Prolonged QT dispersion in the infants of diabetic mothers. Pediatr. Cardiol. 2014, 35, 1052–1056. [Google Scholar] [CrossRef] [PubMed]
- Zakovicova, E.; Kittnar, O.; Slavicek, J.; Medova, E.; Svab, P.; Charvat, J. ECG body surface mapping in patients with gestational diabetes mellitus and optimal metabolic compensation. Physiol. Res. 2014, 63, S479–487. [Google Scholar] [CrossRef] [PubMed]
- Gasic, S.; Winzer, C.; Bayerle-Eder, M.; Roden, A.; Pacini, G.; Kautzky-Willer, A. Impaired cardiac autonomic function in women with prior gestational diabetes mellitus. Eur. J. Clin. Invest 2007, 37, 42–47. [Google Scholar] [CrossRef] [PubMed]
- Sanghavi, M.; Rutherford, J.D. Cardiovascular physiology of pregnancy. Circulation 2014, 130, 1003–1008. [Google Scholar] [CrossRef] [PubMed]
- Sartayeva, A.; Kudabayeva, K.; Abenova, N.; Bazargaliyev, Y.; Danyarova, L.; Adilova, G.; Zhylkybekova, A.; Tamadon, A. A Cross-Sectional Analysis of Maternal Cardiac Autonomic Function in Kazakh Pregnant Women with Gestational Diabetes. Int. J. Womens Health 2025, 17, 865–877. [Google Scholar] [CrossRef] [PubMed]
- Obermeyer, Z.; Schubert, A.; Ross, J.; Mullainathan, S.; Lingman, M. An ECG biomarker for sudden cardiac death discovered with deep learning. Nature 2026, 655, 210–218. [Google Scholar] [CrossRef] [PubMed]
- Retnakaran, R.; Ye, C.; Hanley, A.J.; Connelly, P.W.; Sermer, M.; Zinman, B. Screening Glucose Challenge Test in Pregnancy Can Identify Women With an Adverse Postpartum Cardiovascular Risk Factor Profile: Implications for Cardiovascular Risk Reduction. J. Am. Heart Assoc. 2019, 8, e014231. [Google Scholar] [CrossRef] [PubMed]
Figure 1.
Analytical pipeline. After data preprocessing, an autoencoder (AE) was trained on the data from women who did not develop GD and the encoder output of this AE yielded a set of 768 features as shown. Combined with basic time domain features and features of heart rate variability (HRV) a feature map was created for all participants. Synthetic data using pre-specified mean(m) and standard deviation (s) combinations was generated, balanced using SMOTE (green hexagon labeled S) and then stacked into a minmax scaled (hexagon labeled M) array. The filled part of all boxes represent proportion of participants who developed GD. This array was split into a training (95%) and test (5%) set. Random forest modeling was used after choosing best one from grid search hyperparameter tuning and 10-fold cross-validation. The best model was first internally validated on the test synthetic set and then externally on the original feature set.
Figure 1.
Analytical pipeline. After data preprocessing, an autoencoder (AE) was trained on the data from women who did not develop GD and the encoder output of this AE yielded a set of 768 features as shown. Combined with basic time domain features and features of heart rate variability (HRV) a feature map was created for all participants. Synthetic data using pre-specified mean(m) and standard deviation (s) combinations was generated, balanced using SMOTE (green hexagon labeled S) and then stacked into a minmax scaled (hexagon labeled M) array. The filled part of all boxes represent proportion of participants who developed GD. This array was split into a training (95%) and test (5%) set. Random forest modeling was used after choosing best one from grid search hyperparameter tuning and 10-fold cross-validation. The best model was first internally validated on the test synthetic set and then externally on the original feature set.
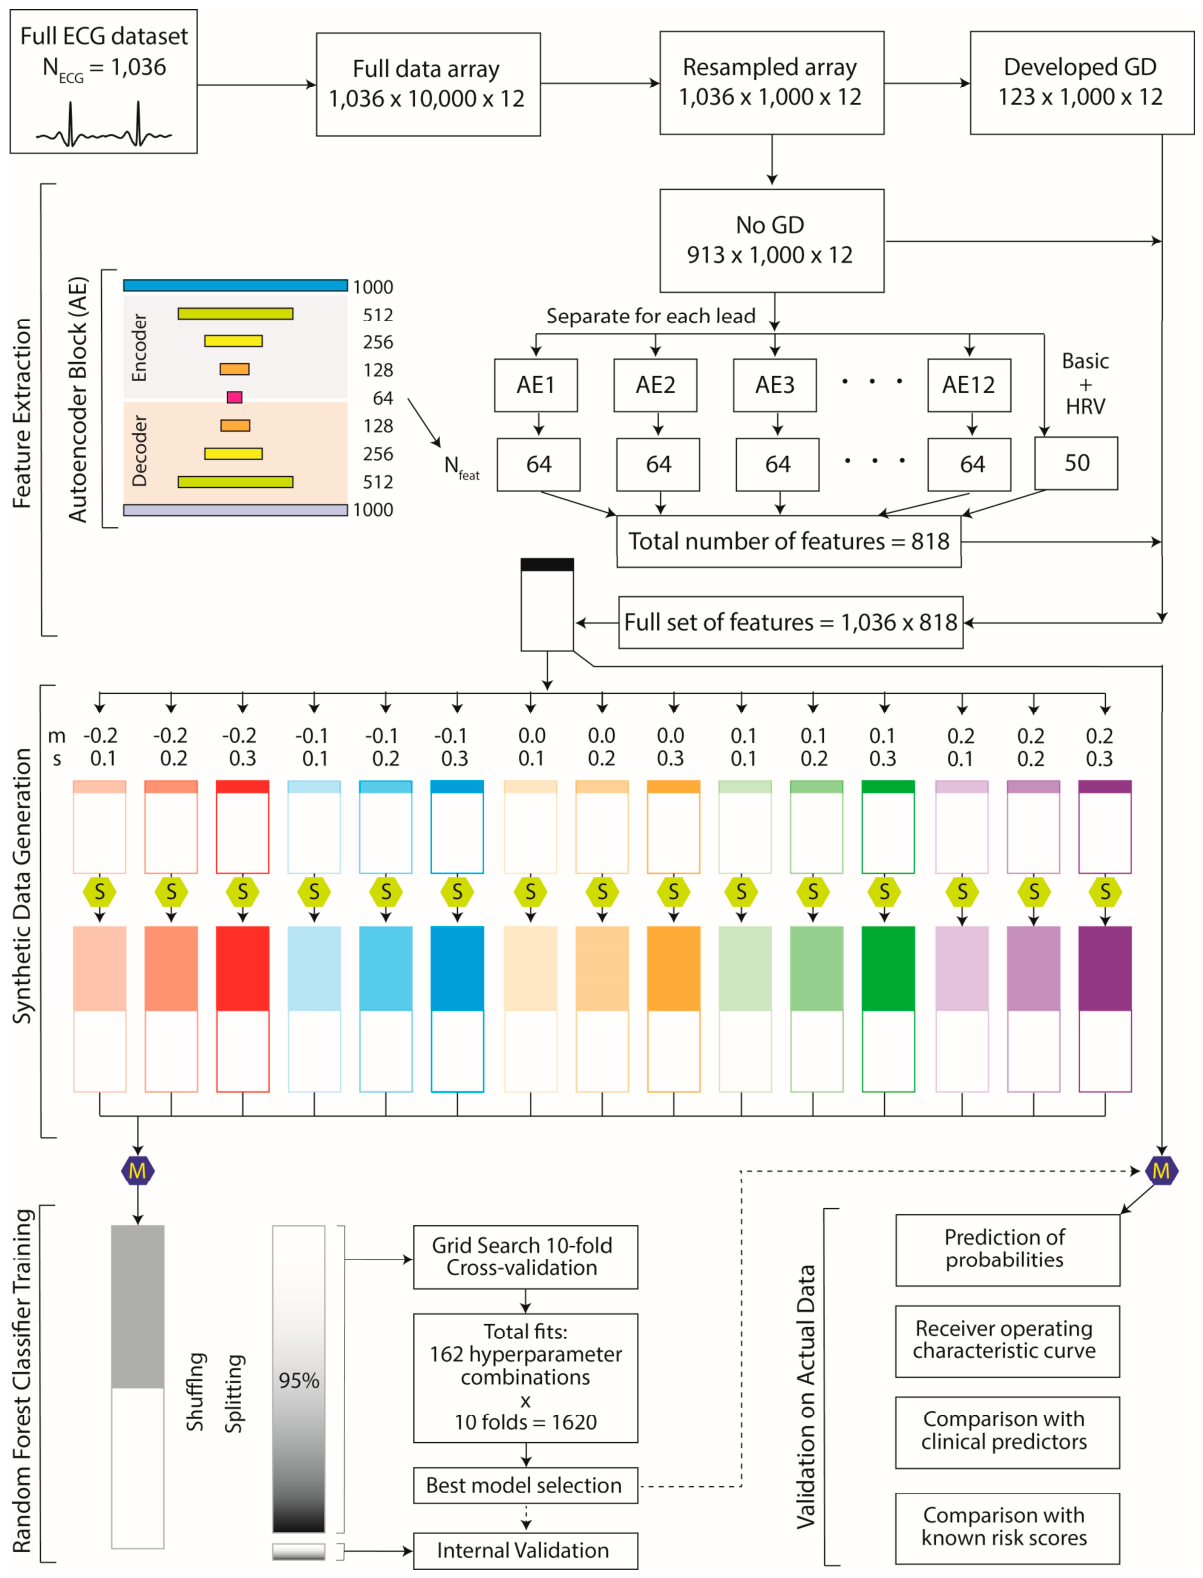
Figure 2.
Average gestational age at key time points in the study protocol. ECG, electrocardiography; GCT, glucose challenge test; OGTT, oral glucose tolerance test; PPAQ, pregnancy-related physical activity questionnaire; USG, ultrasonography. Vertical lines show the mean gestational age and the dark bands around the vertical lines show the 95% confidence intervals for gestational age.
Figure 2.
Average gestational age at key time points in the study protocol. ECG, electrocardiography; GCT, glucose challenge test; OGTT, oral glucose tolerance test; PPAQ, pregnancy-related physical activity questionnaire; USG, ultrasonography. Vertical lines show the mean gestational age and the dark bands around the vertical lines show the 95% confidence intervals for gestational age.
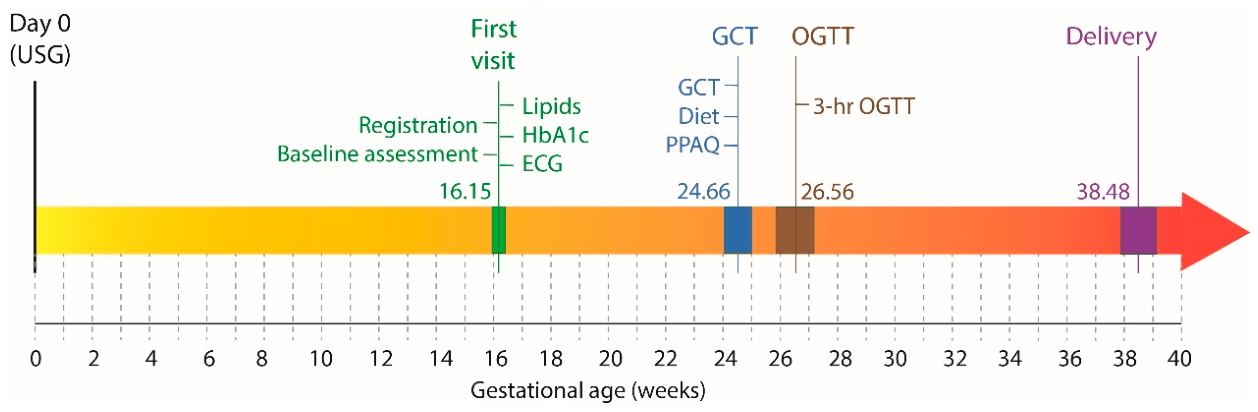
Figure 3.
Validation of the RF-ECG model. (A-B) Validation performance in the held-out test set as a subset of the augmented dataset used of training of the RF-ECG model. Panel A shows the confusion matrix and panel B shows the receiver operating characteristic curve (ROC) for the predicted probabilities of GD. (C-D) Validation performance in the original dataset. The model was trained on this dataset and represented unseen, external data for the RF-ECG model. (E-F) Comparison of the RF-ECG model performance with that of other risk scoring systems for GD. Panel E shows comparison with a model based on the baseline characteristics (the MERGD model) while panel F shows the comparison with externally validated available models. Programming code for these models is provided in Supplementary Note S1. Data in panel F (N=1,012) is based only on women for whom all variables needed for all the risk scoring systems were available. AUC, area under the ROC curve; CI, confidence interval; GD, gestational diabetes.
Figure 3.
Validation of the RF-ECG model. (A-B) Validation performance in the held-out test set as a subset of the augmented dataset used of training of the RF-ECG model. Panel A shows the confusion matrix and panel B shows the receiver operating characteristic curve (ROC) for the predicted probabilities of GD. (C-D) Validation performance in the original dataset. The model was trained on this dataset and represented unseen, external data for the RF-ECG model. (E-F) Comparison of the RF-ECG model performance with that of other risk scoring systems for GD. Panel E shows comparison with a model based on the baseline characteristics (the MERGD model) while panel F shows the comparison with externally validated available models. Programming code for these models is provided in Supplementary Note S1. Data in panel F (N=1,012) is based only on women for whom all variables needed for all the risk scoring systems were available. AUC, area under the ROC curve; CI, confidence interval; GD, gestational diabetes.
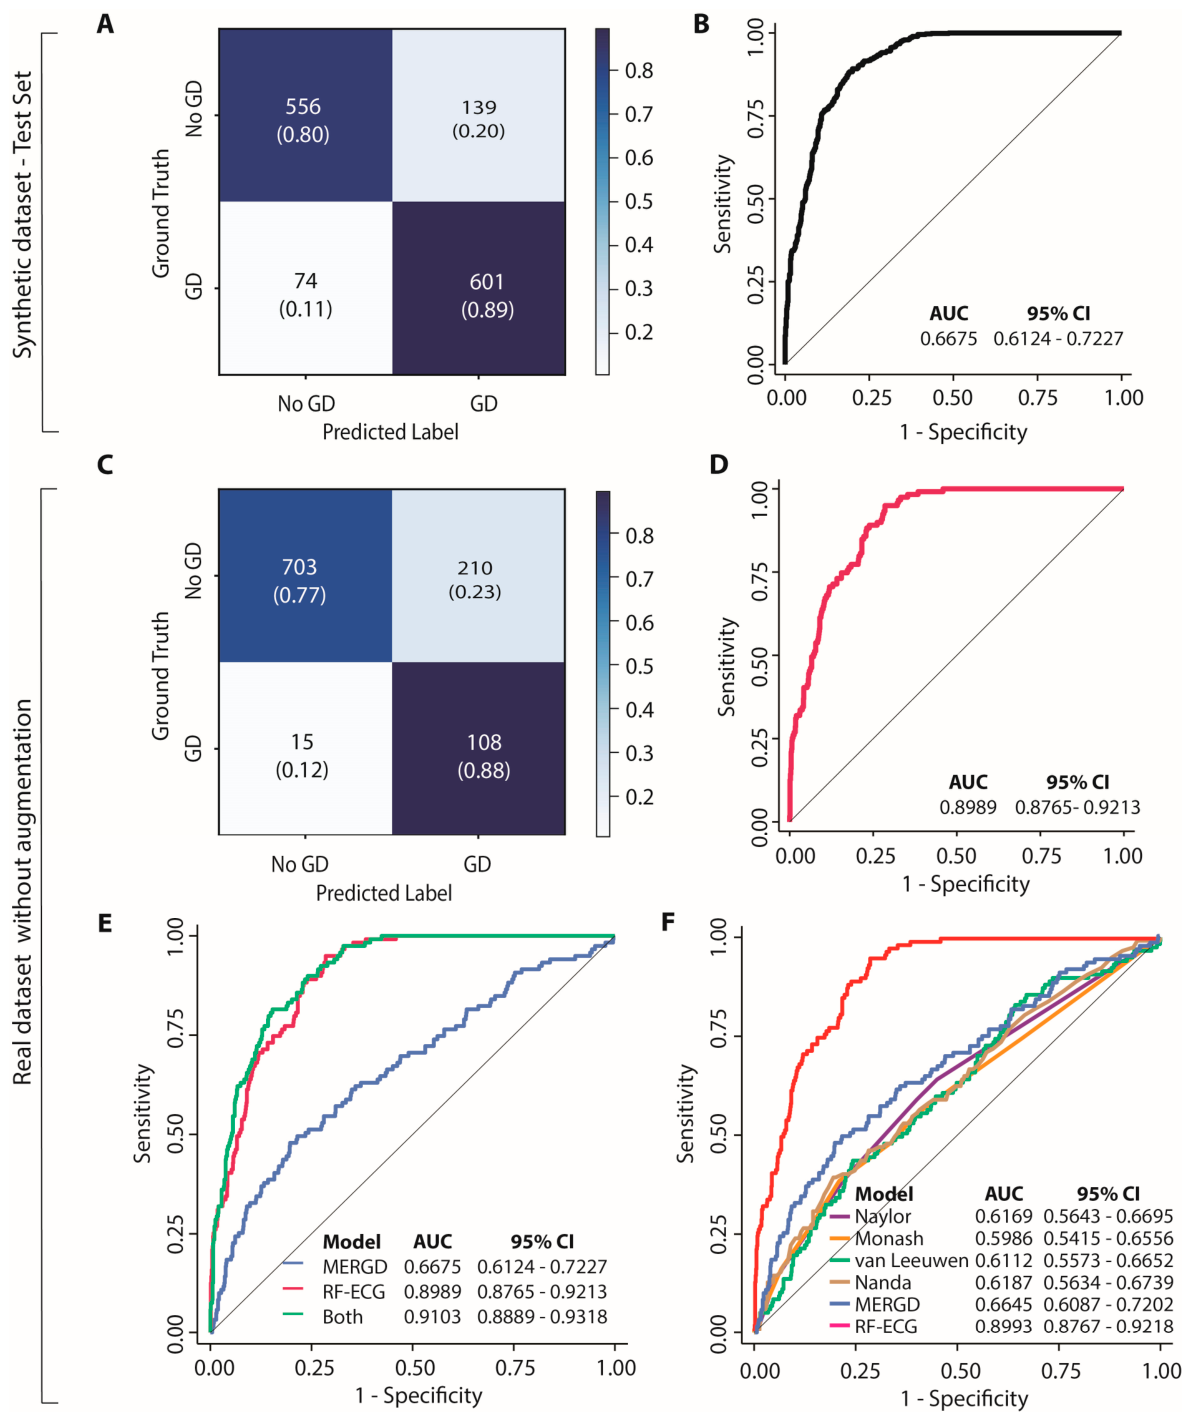
Figure 4.
Feature importances. (A) Elbow plot showing ranked features (abscissa) and their importance (ordinate, blue curve). The elbow point (determined using the kneedle algorithm) was estimated to be 40 (dashed gray vertical line) and corresponded with a cumulative importance contribution (red curve) of 0.29. (B) Types of features included in the top 40 most important features. BASIC, features reported by the recording device; HRV, heart rate variability, AE, autoencoders. (C) Leadwise distribution of most important autoencoder features. (D) Log10 percent difference of feature values between GD and non-GD participants. Color codes in panels B and D are same.
Figure 4.
Feature importances. (A) Elbow plot showing ranked features (abscissa) and their importance (ordinate, blue curve). The elbow point (determined using the kneedle algorithm) was estimated to be 40 (dashed gray vertical line) and corresponded with a cumulative importance contribution (red curve) of 0.29. (B) Types of features included in the top 40 most important features. BASIC, features reported by the recording device; HRV, heart rate variability, AE, autoencoders. (C) Leadwise distribution of most important autoencoder features. (D) Log10 percent difference of feature values between GD and non-GD participants. Color codes in panels B and D are same.
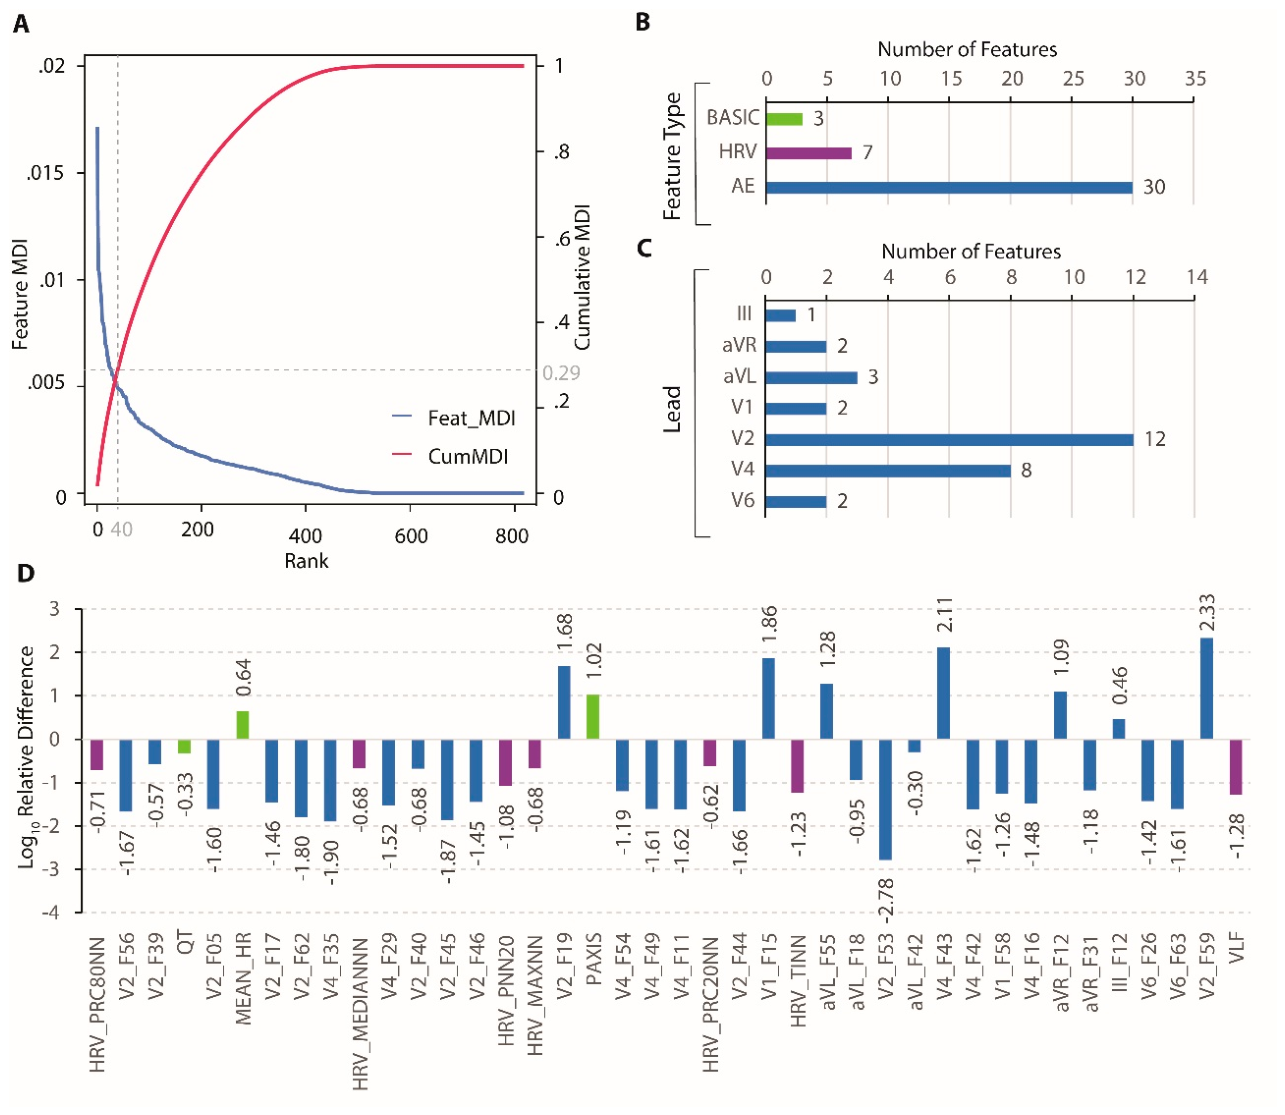

Table 1.
Baseline characteristics of the study participants based on membership of the GD risk group, MERGD 2018.
Table 1.
Baseline characteristics of the study participants based on membership of the GD risk group, MERGD 2018.
| Characteristic | No GD | GD | P | ||
| N | Mean (SD) or N (%) |
N | Mean (SD) or N (%) |
||
| Enrollment characteristics | |||||
| Maternal age at enrollment (y) | 913 | 25.24 (3.91) | 123 | 26.55 (4.62) | 0.0007 |
| Gestational age at enrollment (wk) | 913 | 16.23 (2.88) | 123 | 15.58 (3.23) | 0.0224 |
| Singleton pregnancy | 912 | 895 (98.14) | 123 | 122 (99.19) | 0.7318 |
| Demographics | |||||
| Maternal education | 911 | 123 | 0.1146 | ||
| Never schooled / kindergarten only | 7 (0.77) | 4 (3.25) | |||
| Class 1-8 | 148 (16.25) | 20 (16.26) | |||
| Class 9-10 | 311 (34.14) | 37 (30.08) | |||
| Class 11-12 | 248 (27.22) | 37 (30.08) | |||
| College 1-3 years | 139 (15.26) | 17 (13.82) | |||
| College >3 years | 42 (4.61) | 8 (6.50) | |||
| Degree / Masters | 16 (1.76) | 0 (0.00) | |||
| Family income | 902 | 120 | 0.0163e | ||
| INR <100,000 per annum | 369 (40.91) | 54 (45.00) | |||
| INR 100,000-<200,000 per annum | 412 (45.68) | 41 (34.17) | |||
| INR 200,000-<300,000 per annum | 93 (10.31) | 16 (13.33) | |||
| INR 300,000-<400,000 per annum | 21 (2.33) | 5 (4.17) | |||
| INR 400,000-<600,000 per annum | 4 (0.44) | 3 (2.50) | |||
| INR 600,000-<1,000,000 per annum | 2 (0.22) | 0 (0.00) | |||
| INR >=1,000,000 per annum | 1 (0.11) | 1 (0.83) | |||
| Caste | 912 | 123 | 0.0180 e | ||
| Open | 274 (30.04) | 55 (44.72) | |||
| Other backward classes | 319 (34.98) | 38 (30.89) | |||
| Scheduled caste | 207 (22.70) | 17 (13.82) | |||
| Scheduled tribe | 48 (5.26) | 6 (4.88) | |||
| Nomadic tribe / Vimukta Jaati | 37 (4.06) | 6 (4.88) | |||
| Other | 27 (2.96) | 1 (0.81) | |||
| Religion | 910 | 123 | 0.0897 e | ||
| Hindu | 560 (61.54) | 67 (54.47) | |||
| Buddhist | 156 (17.14) | 16 (13.01) | |||
| Muslim | 188 (20.66) | 40 (35.52) | |||
| Sikh | 4 (0.44) | 0 (0.00) | |||
| Christian | 1 (0.11) | 0 (0.00) | |||
| Other | 1 (0.11) | 0 (0.00) | |||
| Obstetric history | |||||
| Previous pregnancies | 912 | 123 | 0.3263 e | ||
| 0 | 410 (44.96) | 65 (52.84) | |||
| 1 | 317 (34.76) | 33 (26.83) | |||
| 2 | 144 (15.79) | 18 (14.63) | |||
| 3 | 32 (3.51) | 5 (4.07) | |||
| 4 | 6 (0.66) | 1 (0.81) | |||
| 5 | 2 (0.22) | 1 (0.81) | |||
| 6 | 1 (0.11) | 0 (0.00) | |||
| Previous livebirths* (502+58) | 502 | 58 | 0.1276 e | ||
| 0 | 88 (17.53) | 13 (22.41) | |||
| 1 | 348 (69.32) | 33 (56.90) | |||
| 2 | 59 (11.75) | 12 (20.69) | |||
| 3 | 7 (1.39) | 0 (0.00) | |||
| Previous cesarean section | 913 | 137 (15.01) | 123 | 19 (15.45) | 0.8977 |
| Body mass index (BMI Kg/m2) | 909 | 21.37 (3.93) | 121 | 22.76 (4.29) | 0.0003 |
| Obesity (BMI≥27.5 Kg/m2) | 909 | 64 (7.01) | 121 | 19 (15.45) | 0.0023 |
| Blood pressure | |||||
| Systolic (mmHg) | 911 | 101.28 (8.20) | 122 | 103.90 (9.41) | 0.0012 |
| Diastolic (mmHg) | 911 | 63.78 (8.35) | 122 | 66.14 (7.03) | 0.0001 |
| Pulse pressure (mmHg) | 911 | 37.50 (5.81) | 122 | 37.76 (6.31) | 0.6504 |
| Mean arterial pressure (mmHg) | 911 | 76.28 (6.46) | 122 | 78.73 (7.32) | 0.0001 |
| Hypertension exact | 911 | 14 (1.54) | 122 | 4 (3.28) | 0.1535 |
| Blood lipid profile | |||||
| Total serum cholesterol (mg/dl) | 906 | 158.31 (31.90) | 122 | 161.08 (31.04) | 0.3673 |
| Serum triglycerides (mg/dl) | 906 | 106.62 (45.82) | 122 | 118.76 (47.01) | 0.0063 |
| Serum high density lipoprotein (mg/dl) | 906 | 50.74 (8.88) | 122 | 49.30 (8.38) | 0.0918 |
| Serum low density lipoprotein (mg/dl) | 906 | 86.25 (28.15) | 122 | 88.03 (26.94) | 0.5114 |
| Serum very low-density lipoprotein (mg/dl) | 906 | 21.32 (9.16) | 122 | 23.75 (9.40) | 0.0063 |
| Electrocardiography (ECG) features | |||||
| Heart rate | 913 | 83.26 (11.10) | 123 | 87.61 (12.92) | 7.45x10⁻⁵ |
| R-wave height in lead V5 (V) | 913 | 1.19 (0.35) | 123 | 1.21 (0.31) | 0.5125 |
| S-wave depth in lead V1 (V) | 913 | 0.69 (0.26) | 123 | 0.69 (0.26) | 0.8847 |
| P-wave duration (ms) | 913 | 93.53 (10.74) | 123 | 94.07 (9.65) | 0.5944 |
| QRS complex duration (ms) | 913 | 76.58 (6.60) | 123 | 76.59 (6.55) | 0.9820 |
| PR interval (ms) | 913 | 131.92 (1897) | 123 | 131.87 (16.65) | 0.9775 |
| QTc interval (ms) | 913 | 415.45 (15.62) | 123 | 416.54 (15.64) | 0.4707 |
| P-wave axis (⁰) | 913 | 45.89 (20.23) | 123 | 51.06 (18.02) | 0.0074 |
| QRS axis (⁰) | 913 | 54.87 (18.96) | 123 | 53.25 (18.79) | 0.3749 |
*, Proportions are out of 502 women with no GDM and 58 women with GDM with history of previous pregnancies. Numbers in each cell indicate mean and standard error for continuous variables; and counts (n) and percentage (%) for categorical variables; p is significance value estimated using Student’s T test for continuous variables and Pearson’s chi-square test for categorical variables. When indicated with e, Fisher’s exact test was used.
Disclaimer/Publisher’s Note: The statements, opinions and data contained in all publications are solely those of the individual author(s) and contributor(s) and not of MDPI and/or the editor(s). MDPI and/or the editor(s) disclaim responsibility for any injury to people or property resulting from any ideas, methods, instructions or products referred to in the content. |
© 2026 by the authors. Licensee MDPI, Basel, Switzerland. This article is an open access article distributed under the terms and conditions of the Creative Commons Attribution (CC BY) license (http://creativecommons.org/licenses/by/4.0/).
Copyright: This open access article is published under a Creative Commons CC BY 4.0 license, which permit the free download, distribution, and reuse, provided that the author and preprint are cited in any reuse.