
Submitted:
22 August 2026
Posted:
25 August 2026
You are already at the latest version
Abstract
Reversible changes in the quaternary structure of eukaryotic cytochrome c oxidase (CcO) are presumably associated with the regulation of enzyme activity. Standard methods for determining the quaternary structure are quite complex. We applied the dynamic light scattering (DLS) to estimate the size of CсO in micelles. The molecular weights of different forms of the enzyme were determined using thin-layer gel filtration (TLGF) and native electrophoresis (NB-PAGE). Cytochrome oxidase аа3 from Rhodobacter sphaeroides served as a control. As a result, different quaternary forms of CсO in dynamic equilibrium have been identified. Increasing protein concentration, acidification, and high cholate shift the equilibrium toward larger micelle sizes, probably due to enzyme oligomerization. Oligomer dissociation is induced by protein dilution, high dodecyl maltoside (DM), alkalization, and treatment with high Triton X100 (ТХ100). The molecular weights of CсO in diluted and concentrated preparations correspond to monomers and dimers, respectively. The size of bacterial cytochrome oxidase micelles does not change under conditions that cause CсO oligomerization. Amphipol complexes of the monomeric and dimeric CсO retain the characteristic sizes over a wide range of enzyme concentrations. Thus, DLS appears to be a convenient method for identifying quaternary states of CcO in solution and monitoring their interconversions.
Keywords:
Cytochrome c oxidase
; Dynamic light scattering
; Dimerization
; Monomerization
; Amphipol
1. Introduction
Cytochrome c oxidase (CcO) is a key enzyme of the electron transport chain, which is located in the inner mitochondrial membrane and provides aerobic respiration. CcO catalyzes the final reaction of respiration by transferring 4 electrons to molecular oxygen to form water. The direct electron donor for CcO is soluble cytochrome c which contacts the enzyme from the outside (from the intermembrane space). During the oxidase reaction, "chemical" protons that participate in the formation of H2O molecules are captured from the internal aqueous environment (mitochondrial matrix). In addition, oxygen reduction drives the transfer of "pump" protons from the matrix to the external environment (intermembrane space). Thus, the catalytic activity of CcO is coupled with ΔμH+ generation on the membrane (see recent reviews [1,2,3]). Heme-copper terminal oxidases of aerobic bacteria localized in the plasma membrane work in a similar way. They typically consist of 3-4 subunits homologous to the core subunits of mitochondrial CcO [4,5]. One of the most studied bacterial oxidases is cytochrome oxidase aa3 from Rhodobacter sphaeroides (see for example [6,7]).
Since the early studies, it was noted that upon solubilization, the mitochondrial CcO is found in two forms, monomeric and dimeric [8]. The ratio of these forms depended on the details of the isolation and, in particular, on the detergents used [9,10,11]. The first isolation methods involved the use of cholate and deoxycholate which allowed the stable multi-subunit enzyme to be obtained in good yield [12,13]. It was soon discovered that bile salts inhibit CcO [14,15], however, the enzyme activity could be partially restored by replacing these detergents with non-ionic ones [16]. Because of this, using cholate in the beginning of isolation and non-ionic detergents at the final stages has become widespread [8,17]. Later, an alternative procedure has been developed using exclusively non-ionic detergents as DM or TX100 [18]. In other laboratories, CcO is still isolated with the help of bile salts [19,20], with the enzyme then activated by diluting it in an assay medium containing DM [21].
Since high cholate inhibits CcO, at the final stage of isolation its concentration has to be reduced. In addition to its inhibitory effect, cholate has another one on the enzyme, causing its dimerization [22,23]. Cholate molecules are thought to structurally and chemically resemble a currently unknown physiological ligand (possibly ADP) that induces reversible dimerization of CcO. The cholate molecules involved in dimerization bind to the enzyme with high affinity, and, because of the inevitable admixture of this detergent, the mitochondrial CcO preparation isolated by the standard method apparently contains predominantly dimers. For this reason, until recently, all three-dimensional X-ray structures of eucariotic CcO showed the dimeric form of the enzyme [24,25]. In contrast, procariotic heme-copper terminal oxidases look in the X-ray structure as monomers [6,26,27,28] (see however the recent low-temperature electron microscopy data on the structure of bo3 oxidase [29]). Figure 1 shows the three-dimensional structures of mitochondrial CcO dimer (panel A) and cytochrome oxidase aa3 from R. sphaeroides (panel B). For ease of comparison, the second case shows two protein molecules oriented in the same way as the two monomers in panel A. It can be seen that in the bacterial enzyme the formation of a common surface between monomers is hampered by the alpha helices of the IV subunit.
It has long been noted that a number of factors (protein dilution, alkaline pH, non-ionic detergents) promote the transition of solubilized mitochondrial CcO to the monomeric state [30]. Musatov's group studied in detail the reversible transition between the monomeric and dimeric forms, and determined the exact conditions that support one or another quaternary structure [22]. To dimerize solubilized CcO, it is sufficient to add cholate to the medium in excess of the non-ionic detergent. Reducing cholate to a critical level launch monomerization. In the absence of cholate, the enzyme is completely monomerized regardless of other conditions such as protein concentration and pH. In general, there is a dynamic equilibrium in a CcO solution between the dimeric and monomeric forms. The equilibrium is shifted by various factors – mainly protein and detergent concentration, pH, and also some special agents. Among the latter, a strong non-ionic detergent TX100 is worth mentioning. An effective and long-developed method of rapid and complete CcO monomerization is a treatment with high TX100 (tens to hundreds of mM) in an alkaline medium[31,32,33]. The resulting preparation is homogeneous, stable, has a normal optical spectrum, but completely lacks catalytic activity, which, however, can be partially restored by replacing the detergent [34].
The state in which CcO functions in vivo remains a subject of debate [23]. Currently, many believe that both monomers and dimers are physiological forms, and that reversible dimerization of CcO is an important link in the regulation the respiratory chain as a whole [35,36,37]. It is noteworthy that in preparations obtained using digitonin, CcO was found in another state, as a component of the respirosome complex. Such a complex usually includes, in addition to the CcO monomer, a monomer of respiratory complex I and a dimer of respiratory complex bc1 (see, for example, [38,39,40]). However, the ratio of components in vivo has not been unambiguously established (see the discussion of the issue in [23]). Notably, respirosomes include the NDUFA4 CcO subunit, which is typical of the monomeric state of the enzyme [41] and is thought to prevent its dimerization [37]. The hypothesis of the respirosomal organization of respiratory chain is quite well-reasoned. Indeed, direct contact between some enzymes could lead to an acceleration of electron transfer overall. Besides, it has been shown in some cases that the formation of respirosomes correlates with a decrease in the production of reactive oxygen species during respiration [40]. However, at present it cannot be definitively ruled out that respirosomes are an isolation artifact.
Quite recently, the Shinzawa-Ytoh group was the first to obtain the three-dimensional X-ray structure of the mitochondrial CcO in a monomeric form which is in many ways different from the previously known dimeric one [42,43]. In addition, the authors were able to stabilize and study different quaternary forms of CсO in solution. To achieve this, the protein was placed in the environment of an amphipathic polymer, amphipol. Amphipols consist of a hydrophobic homopolymer backbone and amphiphilic groups attached to it which interact with the target protein providing its stabilization. This new class of compounds has found wide application in the solubilization of membrane proteins (see reviews [44,45]). In the work of Shinzawa-Ytoh et al. [42], amphipol A8-35 not only ensured the solubility of CcO but also prevented the interaction of protein molecules with each other. Owing to this, the catalytic activity of both quaternary forms was measured separately for the first time (for the monomer, at least under those conditions, it was about twice as high).
Apparently, the properties of CcO with different quaternary structures differ in many ways. These differences are of importance both in themselves and because they may determine the specific behavior of the enzyme under experimental conditions. Therefore, it looks desirable to have a reliable and rapid method for determining the state of the enzyme in the preparation being studied. The most commonly used methods for determining the quaternary structure of CcO are native electrophoresis [42], gel filtration [11], and analytical ultracentrifugation [8]. Unfortunately, all of them are rather complex procedures, and the second and third methods also involve significant sample consumption. DLS is a technique based on particle size determination in a liquid sample. It seem to be an extremely attractive way to distinguish quaternary states of solubilized proteins. The data presented in this study indicate that DLS is indeed able to distinguish between the monomeric and dimeric forms of solubilized CcO, and to record their interconversions.
2. Results
DLS analysis of CcO in detergent micelles reveals particle size distribution. The method is not strictly quantitative since it does not take into account the actual shape of the particles. Experimental data are presented as the result of the movement of ideal spheres. The output shows the contribution of “spheres” of different diameters to the total volume. The contribution of particles related to diameter A±x is determined by the integral of the distribution function in the vicinity of the maximum A.
2.1. Size Distribution of CcO in DM Micelles
The first sample was an aqueous solution of DM with a concentration of 0.05% (1 mM), which is 6.5 times higher than cmc and is standard in most studies on solubilized CcO. The particle size distribution is represented by the black curve in Figure 2A. It appears as a symmetrical maximum centered around 5 nm and with a half-width of 2.2 nm. The obtained estimate of the diameter of a conventional sphere simulating a detergent micelle is in very good agreement with the literature data. Indeed, according to the results of small-angle X-ray scattering, the DM micelle in an aqueous environment is an ellipsoid with axes of about 2 and less than 6 nm [46]. After adding solubilized CсO to the DM solution (red curve), the response associated with empty detergent micelles is no longer detected. This can be explained by the sharp increase in the measured signal (the count rate in the sample after adding the protein is more than an order of magnitude higher comparing the initial one, see figure caption). The broad asymmetric maximum on the red curve indicates the presence of particles with a nominal diameter significantly exceeding 5 nm. Clearly, the observed response is determined now by protein-containing micelles. Our further experiments will focus on assessing the size of such micelles.
It should be noted that resolution of the maxima (and, accordingly, the exact position of their centers) varied slightly between CcO preparations. In addition, a shift of the maximum within a few nm was sometimes observed over time on the same sample (cf. black and red curves in Figure S1 in the Supplementary Material), which may be due to aggregation and partial precipitation of micelles. The distribution shape was not affected by the ionic strength of the medium (compare the red curve with the green one in Fig. S1, obtained after adding 100 mM KCl), which indicates a purely hydrophobic nature of the interaction between the particles.
In CcO samples well equilibrated in the measuring medium, the resolution of the maxima increased. The data obtained for different concentrations of CсO after 30 min preincubation (0.05% DM, pH 7.4, +250 C) are shown in Figure 2B. At the lowest concentration of CcO (1 μM), the distribution maximum is in the range of 8-10 nm. The distribution is asymmetrical: particles with a diameter of less than 5 nm are practically absent, while those with a diameter of 15 nm make up about 20% of the total volume. With an increase in CcO concentration, the distribution maximum at 8-10 nm decreases in amplitude, which is accompanied by the appearance and growth of a new, wider maximum centered at 22-24 nm. It is important to note that the distribution shape characteristic of each CcO concentration was not influenced by the way of achievement that concentration (dilution or concentration of the sample). This indicates the reversibility of the observed concentration-dependent process. The ratios of the areas under the distribution function in the region of 8-10 nm vs 22-24 nm are approximately 3:1 for 2 μM CO, 1:4 for 3 μM CO, 1:7 for 4 μM CO and 1:10 for 5 μM CcO. At 10 μM CcO, the 8-10 nm maximum is virtually absent, while the position of the second one shifts to 20 nm. Additionally, very broad local maxima begin to appear at tens and hundreds of nm, which apparently indicates nonspecific aggregation.
Data from an experiment similar to Figure 2B but carried out at a higher detergent concentration (0.2% = 4 mM DM) are given in the Supplementary Material (Figure S2A). Under these conditions, the distribution at 1 μM CcO exhibits a single maximum near 8 nm as previously. However, with increasing protein concentration, instead of a second maximum appearing, a shift of the single one to the right is observed, reaching a final position of 16-18 nm (at CcO concentrations greater than 20 μM). After incubation of CсO in the measurement medium for an hour, the distribution takes the shape with two maxima at 8 and 22 nm, similar to that observed at a lower DM concentration (blue curve in Figure S2A, cf. Figure 2B). Figure S2B demonstrates the size particle distributions at three different DM concentrations, at a fixed CcO concentration. In all cases, the distribution shows two maxima: the first, narrower, at 7-9 nm, and the second, wider, at 22-25 nm. An increase in DM concentration is accompanied by a growth of the first maximum and a gradual disappearance of the second.
The micelle size distribution was also studied on cytochrome oxidase aa3 from R. sphaeroides (Figure 2C). A comparison of panels B and C shows that, unlike mitochondrial CcO, the concentration of the bacterial enzyme has virtually no effect on the distribution curve, which in all cases demonstrates a single maximum in the region of 10 nm.
Samples of mitochondrial and bacterial cytochrome oxidases used in DLS studies were analyzed in parallel by thin-layer gel filtration, which made it possible to estimate the molecular weights of the protein components they contained (see Supplementary Material, Figure S7). In the solubilized CcO preparations, two protein fractions with molecular masses of approximately 200 and 400 kDa were detected (see Supplementary Material, Figure S7A). The low-molecular-weight component was identified when 25-45 γ of protein was loaded to the gel, whereas the high-molecular-weight one was detected at 90 or more γ of protein applied (Figure S7B). The preparation of R. sphaeroides cytochrome oxidase aa3 contained a single protein component about 130 kDa, regardless of the amount of sample loaded (Figure S7B).
2.2. Changes in CcO Quaternary Structure are Reflected in the Size of Micelles
The size distribution of CcO micelles was further studied in the presence of specific detergents that alter the quaternary structure of the protein. The classic method for monomerizing mitochondrial CcO is treatment with high TX100 under alkaline conditions. Figure 3A shows the distribution of micelles in a solution containing TX100 and CcO. The red curve obtained under monomerization conditions (5% = 77 mM TX100, pH 9.5) has a single narrow maximum at 7.5 nm. As a control, a sample was tested in the presence of a low concentration of TX100 (0.7 mM, which only slightly exceeds cmc) in a slightly acidic medium. The distribution in the control shows a maximum at 11 nm, as well as a second, very wide one, centered around 30 nm. Noteworthy, although the distribution pattern in the control sample changed significantly upon varied CcO concentration, the shape of the curve under monomerization conditions was always reproducible, showing a single narrow maximum at 7.5 nm (see Figure S3 in the Supplementary Material). The control demonstrating the dependence of micelle size distribution on pH per se is given in Figure S4. Alkaline conditions cause a shift in the distribution curve to lower values, with the differences compared to acidic conditions leveling out as the enzyme concentration decreases and the detergent concentration increases.
Another modifier of mitochondrial CcO quaternary structure is cholate. It is known that a multiple excess of cholate over non-ionic detergents launches reversible dimerization of the enzyme [22]. The data in Figure 3B demonstrate the change in the size of CсO-containing micelles after the addition of cholate in a 4:1 molar excess relative to DM. It is important to note that in this experiment an additionally purified “Cholate-free” CcO preparation was used which contained, according to our estimates, no more than 2 μM of this substance (see Methods). The figure shows the dynamics of changes in the distribution curve after adding cholate to the measuring cuvette: after 45 minutes the maximum shifts to 14-15 nm, and after 6 hours to 16-17 nm. If DM concentration in the experimental medium exceeded that of cholate, no shift in the maximum occurred (see Supplementary Material, Figure S5A). As opposed to the mitochondrial enzyme, in the case of cytochrome oxidase aa3 from R. sphaeroides the addition of cholate in a 4-fold excess relative to DM did not lead to any shift in the distribution maximum (Figure S5B). Remarkably, the micelle size distribution on the “Cholate-free” CcO did not demonstrate the dependence on the protein concentration. In the range 1-9 μМ the curve has a single maximum near 10 nm (Figure S5C). As an additional control, we examined the micelle size distribution over the same concentration range using the "Cholate-riched" CcO preparation containing 1% (23 mM) cholate (see Methods). At CcO concentrations above 1 μM, a single broad maximum is observed near 18 nm. (Figure S5D).
2.3. Size Distribution of CcO in Amphipol Preparations
Next, we attempted to fix the quaternary state of CсO by converting the protein into a complex with amphipol (see Methods). The obtained preparations of the presumably monomeric and dimeric forms (AmM and AmD, respectively) were completely water-soluble, had a normal optical absorption spectrum and high cytochrome oxidase activity. Native electrophoresis (NB-PAGE) revealed two protein bands in each of these preparations, adjucent to the ca. 200 and 400 kDa markers. The former component strongly dominated in AmM and the latter in AmD (Supplementary Material, Figure S6). Thin-layer gel filtration (TLGF) provided a similar molecular weight estimates (see Supplementary Material, Figure 7C).
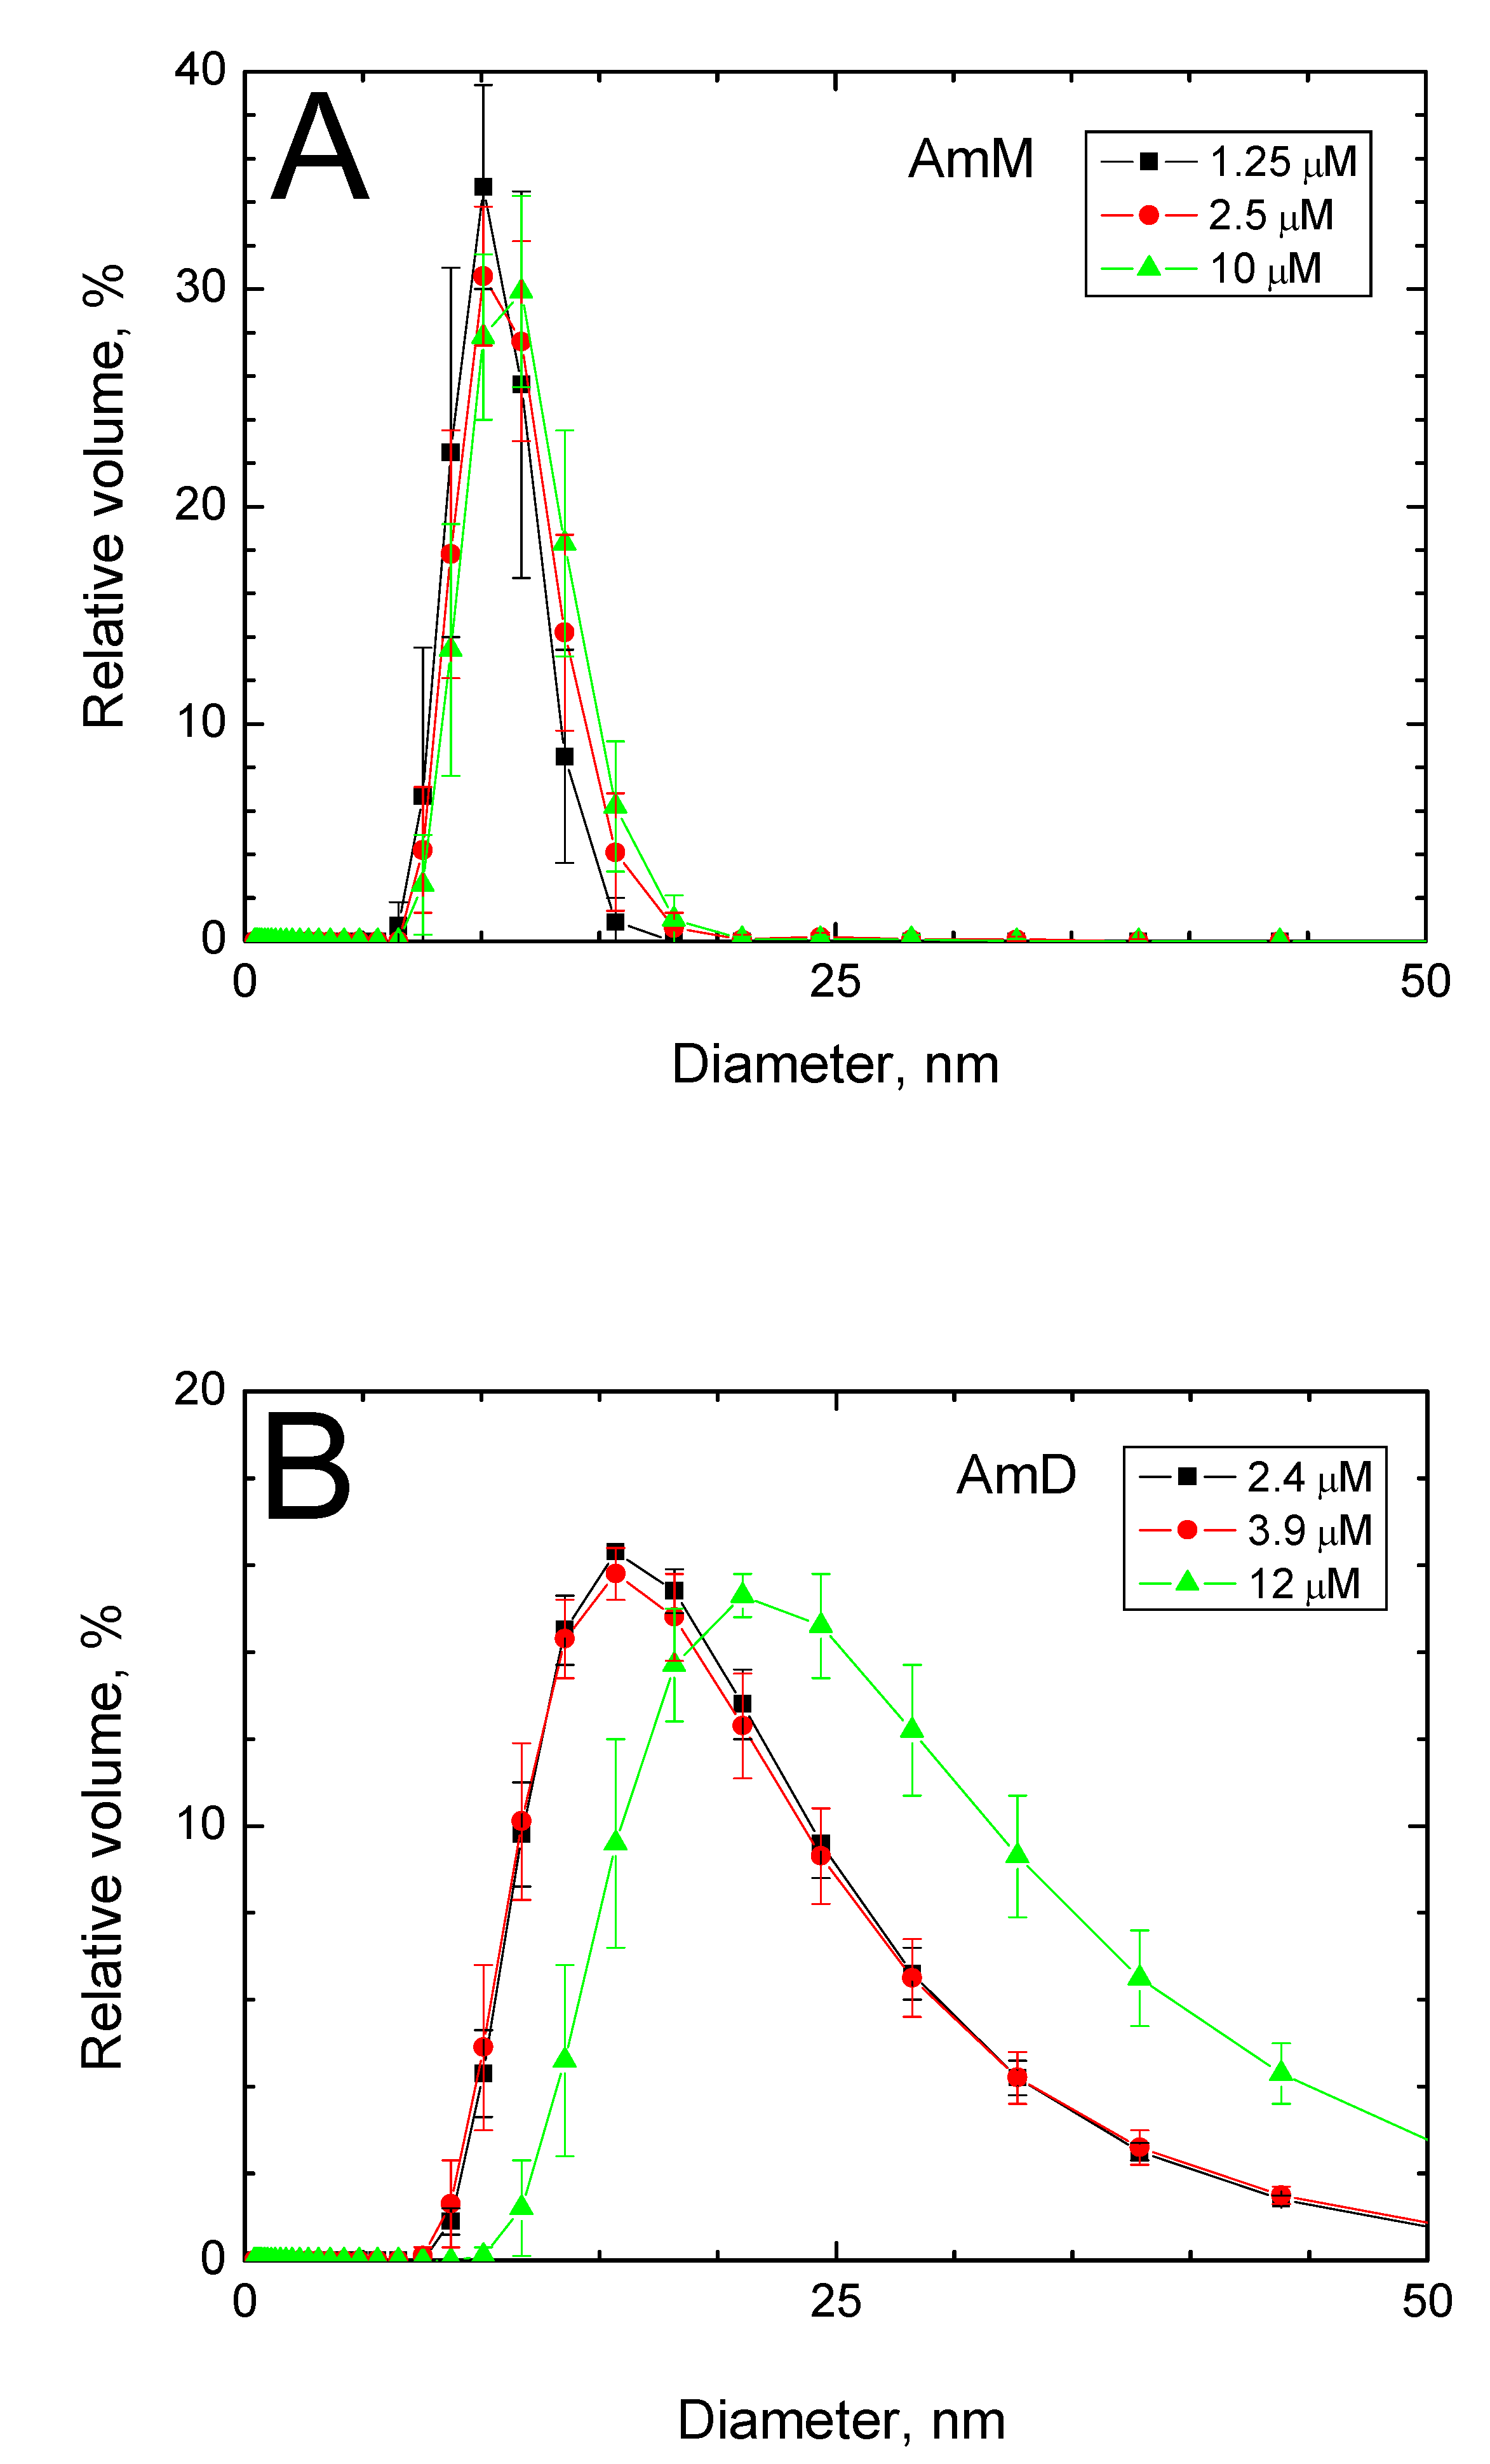
The results of the DLS assay on AmM and AmD samples are presented in Figure 4.
In the case of AmM (panel A), over the entire range of concentrations studied (1–10 μM CcO), the distribution of micelles has a single maximum at 9 nm, which is fairly narrow and symmetrical, indicating the homogeneity of the sample. In the case of AmD (panel B), the distribution is characterized by an asymmetric maximum at 15 nm with an extended flank on the side of larger diameters. When CcO increases to 12 μM, the maximum shifts to 20 nm (green curve).
During long-term storage of the frozen preparations, the DLS characteristics of AmM are generally preserved. In the case of AmD, the maximum shifts further, to 24–25 nm, and broadens on both flanks (Supplementary Material, Figure S8). According to NB-PAGE data, this is accompanied by an increase in the 200 kDa component, as well as the appearance of higher molecular weight aggregates in AmD preparation (compare panels A-B-C in Figure S6).
3. Discussion
Studying CсО in a detergent solution by DLS technique, we reproducibly observed two discrete maxima of the particle size distribution under different conditions: at 7–10 nm and in the region of 16–24 nm. The first maximum is relatively narrow and more symmetrical compared to the second. A conventional sphere with a diameter of 7-10 nm is comparable with the linear dimensions of monomeric CсO (Figure 1). However, this coincidence does not prove that the maximum at 7-10 nm characterizes a monomeric preparation. Quantitative estimates based on DLS data are sensitive not only to size but also to other particle characteristics, most notably their shape, which in the case of CcO is clearly not spherical. Nevertheless, we suggest that in our study the maximum of 7-10 nm actually corresponds to the monomeric state of the enzyme. This is indicated by the following combination of circumstances.
- 1)
- 2)
- 3)
- 4)
- 5)
- In the “Cholate-free” CcO preparation, the particle distribution retains the shape with a single maximum near 10 nm even with a significant increase in the enzyme concentration (Figure S5C). This is consistent with the known role of cholate as an inducer of reversible dimerization [22].
- 6)
- Preparations of solubilized cytochrome oxidase aa3 from R. sphaeroides exhibit a distribution with a single maximum near 10 nm, the position of which does not depend on either the enzyme concentration or the presence of cholate in the medium (Figure 2C, S5B). Indeed, bacterial terminal oxidases are characterize by monomeric quaternary structure [6].
- 7)
- 8)
- According to TLGF data, diluted CcO samples are dominated by a protein component with a molecular weight of approximately 200 kDa which is very close to that of the monomer [47]. On the contrary, with increasing sample concentration, a component with a molecular weight of ca. 400 kDa predominates, which well correspond to the dimeric form of the enzyme (Figure S7A, B).
The origin of the maximum at ≥ 16 nm is difficult to interpret unambiguously. Its exact position varies under different experimental conditions. Addition of cholate to the “Cholate-free” CcO induces a peak shift to 16–17 nm (Figure 3B). A similar position of the maximum is observed for the particle size distribution of the AmD sample obtained at a high cholate concentration (Figure 4B, black and red curves). Since excess cholate relative to DM is known to induce reversible dimerization of the mitochondrial enzyme, it is reasonable to assume that the observed micelle size about 16-17 nm corresponds to the CcO dimer. A number of factors apparently promote the shift of the maximum further to the right: to 21-22 nm (the AmD sample at a high concentration, see the green curve in Figure 4B), 24-25 nm (AmD after long-term storage with repeated freezing/thawing, the red curve in Figure S8) and 24-26 nm (CсO in a 0.05% DM at high protein concentrations, Figure 2B). Moreover, high enzyme concentration and acidic environment cause the appearance of additional minor maxima at values of 30 nm and above (see purple curve in Figure 2B and black curve in Figure 3A).
The shape of the second maximum also varies depending on the conditions. One of the reasons for the asymmetry of the particle size distribution as detected by DLS may be the asymmetry of the particles themselves. From this perspective, one would expect the CcO dimer (less symmetrical than the monomer, see Figure 1) to exhibit a less symmetrical size distribution. This is precisely what is observed (Figure 4, cf. A vs. B). The second obvious reason for asymmetry may be the aggregation of particles, both among themselves and with smaller ones (for example, detergent or amphipol molecules). NB-PAGE data indicate the appearance of aggregated protein forms in the AmD samples during long-term storage (Figure S6, panel C). In parallel, DLS data register in the same preparation a significant expansion of the distribution to the right (Figure S8, red curve – compare with Figure 4B).
The question arises whether the concentration-dependent change in micelle size reflects the reversible dimerization of CcO. This assumption is supported by the reversibility of the changes observed in Figure 2B (the shape of the curve is determined solely by the final concentration of CcO, which can be achieved either by diluting a more concentrated sample or by concentrating a more dilute one). At the same time, the position of the second maximum (ca. 25 nm) differs significantly from the position of 16-17 nm which characterizes the size of micelles in the presence of excess cholate. In addition, the assessment of the ratio of the areas under the curves in the vicinity of the first and second maxima does not confirm that the observed concentration-dependent processes can be reduced to the dimerization reaction M + M ↔ D (where M and D are the monomeric and dimeric forms of CсO, respectively). It can be assumed that the changes in Figure 2B are associated, in addition to dimerization, with accompanying non-stoichiometric aggregation of micelles.
To summarize, it can be stated that in some of our experiments (under the conditions of cholate-induced dimerization) DLS technique seems to reveal the dimeric form of CcO. The absence of a cholate dependent distribution shift in the case of bacterial oxidase indicates that the action of cholate is specific and the observed increase in particle size is not due to random aggregation. On the other hand, the dimeric form of CсO appears to adsorb readily other particles, resulting in a broadening of the right flank of the distribution, a shift of the maximum toward higher values, and an increase in the area under the curve.
The possibility of fixing the quaternary structure of CcO with amphipol seems to be very promising. The amphipol complex of the monomeric enzyme appears to be particularly stable, retaining its properties during long-term storage. Fresh preparations of the dimeric enzyme with amphipol appear to be stable enough to conduct experiments. This opens the possibility of studying CсO in defintely monomeric and dimeric forms.
A series of our recent studies was devoted to the regulatory site of mitochondrial CсO that binds amphipathic ligands [34,48,49,50]. This is presumably the Bile Acid Binding Site (BABS), first described in the X-ray structure of the dimer by the Ferguson-Miller group [51,52,53]. Judged on structural data, canonical BABS can only exist in the dimeric form of the enzyme. Excitingly, for the monomeric form of mitochondrial CcO, another regulatory site that binds steroids and is located at a distance of about 20 angstroms from BABS was described in the work of Di Trani et al [54]. The presence of functionally similar but spatially separated regulatory sites inherent in different quaternary forms of CcO appears to be an interesting case of crossing regulatory pathways [55]. Further study of this phenomenon requires enzyme preparations with a fixed quaternary structure that does not change during experiments. In this regard, monomeric and dimeric CсO complexed with amphipol may prove very useful.
In general, our results indicate that DLS is an adequate and convenient technique that allows one to monitor changes in the quaternary structure of solubilized CcO in real time.
4. Materials and Methods
4.1. Chemicals
High-purity reagents of foreign and domestic production were used, including: pH buffers HEPES, Tris and CHES, potassium and sodium phosphates, ammonium sulphate (Amresco, USA), cholic acid, Triton X100 (Sigma, USA), n-dodecyl β-D-maltoside (Anatrace, USA), Amphipol 8-35 (Thermo-Fisher, USA), sucrose (high purity grade H-1807, Trilab, Russia).
4.2. Preparations
Isolation of mitochondrial CcO from bovine heart mitochondria was carried out according to Fowler et al. [20] with minor modifications as described in [21]. After separation of respiratory complexes I and III, the precipitated CcO was solubilized with cholate (1 mg/mg protein) and then precipitated with increasing concentrations of ammonium sulfate. The precipitate was solubilized with 0.05% DM in 50 mM HEPES/Tris buffer, pH 8.0. The resulting CcO preparation contained, according to our estimates, 1–2 mM cholate impurity.
A "Cholate-free" CcO preparation was further purified from cholate by a 1000-fold dilution. For this purpose, the sample was concentrated using Amicon Ultra cut-off 100,000 kDa mini-filters (Millipore, USA) to a minimum volume and diluted 10-fold with medium (50 mM HEPES/Tris, pH 8.0, 0.05% DM). The procedure was repeated three times.
A “Cholate-riched” CcO preparation was obtained using the method described above including precipitation of the enzyme with ammonium sulfate. The precipitate was solubilized with cholate (2%) and further purified by ultracentrifugation in a linear sucrose gradient (5-20%) in 0.5 M potassium phosphate buffer, pH 7.4 [56]. The final preparation contained cholate at a concentration about 1% (23 mM).
Monomeric CcO in a complex with amphipol was prepared according to the method described for the terminal oxidase bo3 from Escherichia coli [29]. The isolated CcO was diluted to 7.5 μM with medium (50 mM HEPES/Tris, pH 8.5, 50 mM KCl, 0.05% DM). Then, a threefold excess of amphipol A8-35 by weight was added to the protein. The sample was gently shaken for 4 h at +70 C. Then, activated Bio-Bead particles (Bio-Rad, USA) were added up to 20 mg/ml and incubation was continued for 12 h. The resulting sample was concentrated 5 times using Amicon Ultra cut-off 100,000 kDa mini-filters.
Dimeric CcO in a complex with amphipol was obtained according to the method described in [57] with the following modifications. Initially, CcO was converted into cholate micelles. For this purpose, 5-15 mg of the protein isolated by the standard method was dialyzed against 250 ml of medium (100 mM sodium phosphate, pH 7.5) contained 1% sodium cholate for 15 h at +70 C. Then, a threefold excess of amphipol A8-35 by weight was added to the protein and the preparation was gently mixed for 30 min at 00 C. Next, the detergent was removed with β-cyclodextrin during 2 h dialysis against 250 ml of medium (100 mM HEPES/NaOH, pH 7.8, 1% β-cyclodextrin). After 1 h, the buffer was replaced with fresh one. After dialysis, the preparation was centrifuged in a sucrose gradient from 5% to 35% in 40 mM HEPES/NaOH, pH 7.8, for 12 h, at 100,000 g.
Cytochrome oxidase aa3 from R. sphaeroides was obtained from membranes of the wild-type strain modified by the addition of six histidine residues (His-tag) to the C-terminus of subunit I. Isolation was performed on a Ni-NTA agarose column as described in [58].
Cytochrome oxidase from R. sphaeroides in a complex with amphipol was obtained similarly to the amphipol complex of monomeric mitochondrial CcO (see above). The final sample was concentrated using Amicon Ultra cut-off 30,000 kDa mini-filters.
All the above-mentioned preparations were stored at -740 C, freezing was carried out using liquid nitrogen.
4.3. Measurements
Dynamic light scattering was registered with a commercial Zetasizer Nano ZS instrument (Malvern Instruments, Malvern, Worcestershire, UK) at +25° C. A helium-neon laser operating at 633 nm served as the light source. The sample was placed in a cuvette (optical path 10 mm, final volume 100 µl) and incubated at the specified temperature for 1-3 min, after which data collection began. One experiment included 10 measurements, each consisting of ten 25-s recordings. The results were processed using the Dispersion Technology Software supplied with the instrument. The error in the results was estimated as the standard deviation when averaging the data.
NB-PAGE – see Supplementary Material, Fig. S6.
TLGF – see Supplementary Material, Fig. S7.
4.4. Data Presentation
DLS data were further processed for final presentation using Microcal Origin, versions 7 and 9 (https://www.originlab.com/). PyMol (https://pymol.org/2/) was used to visualize the 3D structures.
5. Conclusions
Depending on the experimental conditions, two main patterns of CcO size distribution in micelles are detected by the DLS techniques. Rather symmetrical distribution with a narrow maximum at 7.5-10 nm is promoted by conditions that stabilize the monomeric state of the enzyme. In the corresponding CcO sample, a single protein component with a molecular mass of approximately 200 kDa is identified, which still predominates upon conversion the enzyme into a complex with amphipol (AmM preparation). AmM is characterized by the distribution maximum at 7.5-10 nm, regardless of the sample concentration. The same applies to the solubilized bacterial cytochrome oxidase. The above mentioned indicates that the maximum at 7.5–10 nm most likely corresponds to the monomeric state of solubilized CcO.
The second distribution pattern has a rather wide and asymmetrical peak at 16 nm or more. It is observed under conditions that promote reversible dimerization of CcO. In the corresponding samples, a single or dominant protein component with a molecular mass ca. 400 kDa is identified. For the enzyme in the presence of cholate, as well as for the dimeric form of CcO in a complex with amphipol (AmD preparation), the distribution has a maximum at 16–17 nm. Apparently, this value is determined by the dimeric state of the enzyme. The shift to higher values is caused by factors that promote non-stoichiometric aggregation of particles.
Thus, the DLS method can register changes associated with the reversible dimerization of CcO in solution and identify individual quaternary states of the enzyme.
Supplementary Materials
The following supporting information can be downloaded at the website of this paper posted on Preprints.org, Figure S1: Stability of the size distribution of CcO in DM micelles; Figure S2: Size distribution of CcO in micelles depending on the concentration of protein and detergent; Figure S3: Monomerization of CcO by treatment with high TX100 under alkaline conditions; Figure S4: Size distribution of CcO in micelles at different pH; Figure S5: Effect of cholate on the size distribution of CсO in micelles; Figure S6: NB-PAGE of preparations containing CcO complexed with amphipol; Figure S7: Determination of the molecular weight of CcO by TLGF; Figure S8: Particle size distribution in CcO preparations with amphipol.
Author Contributions
Conceptualization, N.A., I.O. and T.V.; methodology, N.A., I.O., V.O., M.M. and T.V.; software, I.O., V.O.; validation, N.A. and M.M.; formal analysis, N.A., V.O. and M.M.; investigation, N.A., V.O. and M.M.; resources, M.M. and T.V.; data curation, N.A and T.V.; writing—original draft preparation, N.A.; writing—review and editing, N.A., I.O., V.O., M.M. and T.V.; visualization, I.O.; supervision, N.A. and T.V.; project administration, N.A. and T.V.; funding acquisition, T.V. All authors have read and agreed to the published version of the manuscript.
Funding
The work was carried out within the framework of the state assignment of Moscow State University on the topic “Study of the mechanisms of energy conversion in membrane systems associated with the cyclic transfer of hydrogen and sodium ions by enzymes of electron transport chains, the mechanisms of production of reactive oxygen species and their role in cell physiology” state registration number AAAA-A19-119031390114-5.
Institutional Review Board Statement
Not applicable.
Informed Consent Statement
Not applicable.
Data Availability Statement
All data obtained in this study are contained in the main text of the article and in the supplementary materials.
Conflicts of Interest
The authors declare no conflicts of interest. The funders had no role in the design of the study; in the collection, analyses, or interpretation of data; in the writing of the manuscript; or in the decision to publish the results.
Abbreviations
The following abbreviations are used in this manuscript:
| AmD | Dimeric CcO in complex with amphipol |
| AmM | Monomeric CcO in complex with amphipol |
| BABS | Bile Acid Binding Site |
| CcO | Cytochrome с Oxidase |
| DLS | Dynamic Light Scattering |
| DM | n-Dodecyl β-D-maltoside |
| NB-PAGE | Native Blue Polyacrilamide Gel Electrophoresis |
| TLGF | Thin Layer Gel Filtration |
| ТХ100 | Tritone Х100 |
References
- Rich, P.R. Mitochondrial cytochrome c oxidase: Catalysis, coupling and controversies. Biochem. Soc. Trans. 2017, 45, 813–829. [Google Scholar] [CrossRef] [PubMed]
- Wikström, M.; Sharma, V. Proton pumping by cytochrome c oxidase—A 40 year anniversary. Biochim. Biophys. Acta (Bioenergetics) 2018, 1859, 692–698. [Google Scholar] [CrossRef] [PubMed]
- Siletsky, S.A.; Borisov, V.B. Proton pumping and non-pumping terminal respiratory oxidases: Active sites intermediates of these molecular machines and their derivatives. Int. J. Mol. Sci. 2021, 10852. [Google Scholar] [CrossRef]
- Hendler, R.W.; Pardhasaradhi, K.; Reynafarje, B.; Ludwig, B. Comparison of energy-transducing capabilities of the two-and three-subunit cytochromes aa3 from Paracoccus denitrificans and the 13-subunit beef heart enzyme. Biophys. J. 1991, 60, 415–423. [Google Scholar] [CrossRef] [PubMed]
- Sousa, F.L.; Alves, R.J.; Ribeiro, M.A.; Pereira-Leal, J.B.; Teixeira, M.; Pereira, M.M. The superfamily of heme–copper oxygen reductases: Types and evolutionary considerations. Biochim. Biophys. Acta (Bioenergetics) 2012, 1817, 629–637. [Google Scholar] [CrossRef] [PubMed]
- Svensson-Ek, M.; Abramson, J.; Larsson, G.; Törnroth, S.; Brzezinski, P.; Iwata, S. The X-ray crystal structures of wild-type and EQ (I-286) mutant cytochrome c oxidases from. Rhodobacter Sphaeroides J. Mol. Biol. 2002, 321, 329–339. [Google Scholar] [CrossRef] [PubMed]
- Qin, L.; Hiser, C.; Mulichak, A.; Garavito, R.M.; Ferguson-Miller, S. Identification of conserved lipid/detergent-binding sites in a high-resolution structure of the membrane protein cytochrome c oxidase. Proc. Natl. Acad. Sci. USA 2006, 103, 16117–16122. [Google Scholar] [CrossRef] [PubMed]
- Love, B.; Chan, S.H.; Stotz, E. Molecular weight of two states of cytochrome c oxidase. J. Biol. Chem. 1970, 245, 6664–6668. [Google Scholar] [CrossRef]
- Takemori, S.; Sekuzu, I.; Okunuki, K. Studies on cytochrome a VII. Physico-chemical properties of purified cytochrome. A Biochim. Biophys. Acta 1961, 51, 464–472. [Google Scholar] [CrossRef] [PubMed]
- Tzagoloff, A.; Yang, P.C.; Wharton, D.C.; Rieske, J.S. Studies on the electron-transfer system LX. Molecular weights of some components of the electron transfer chain in beef-heart mitochondria. Biochim. Biophys. Acta (Nucleic Acids and Protein Synthesis)) 1965, 96, 1–8. [Google Scholar] [CrossRef] [PubMed]
- Hakvoort, T.B.; Moolenaar, K.; Lankvelt, A.H.; Sinjorgo, K.M.; Dekker, H.L.; Muijsers, A.O. Separation, stability and kinetics of monomeric and dimeric bovine heart cytochrome c oxidase. Biochim. Biophys. Acta (Bioenergetics) 1987, 894, 347–354. [Google Scholar] [CrossRef] [PubMed]
- Okunaki, K.; Sekuzu, I.; Yonetani, T.; Takemori, S. Studies on cytochrome A. I. Extraction, purification and some properties of cytochrome A. J. Biochem. 1958, 45, 847–854. [Google Scholar] [CrossRef]
- Yonetani, T.; Takemori, S.; Sekuzu, I.; Okunuki, K. Activation of cytochrome oxidase by synthetic detergents. Nature 1958, 181, 1339–1340. [Google Scholar] [CrossRef] [PubMed]
- Horie, S.; Morrison, M.; Bright, J. Cytochrome c Oxidase Components: I. Purification and properties. J. Biol. Chem. 1963, 238, 1855–1860. [Google Scholar] [CrossRef]
- Van Buuren, K.J.H.; Van Gelder, B.F. Biochemical and biophysical studies on cytochrome c oxidase. XIII. Effect of cholate on the enzymic activity. Biochim. Biophys. Acta (Bioenergetics) 1974, 333, 209–217. [Google Scholar] [CrossRef] [PubMed]
- Yu, C.; Yu, L.; King, T.E. Studies on cytochrome oxidase. Interactions of the cytochrome oxidase protein with phospholipids and cytochrome. C J. Biol. Chem. 1975, 250, 1383–1392. [Google Scholar] [CrossRef]
- Yonetani, T. Studies on Cytochrome Oxidase: III. IMPROVED PREPARATION AND SOME PROPERTIES. J. Biol. Chem. 1961, 236, 1680–1688. [Google Scholar] [CrossRef]
- Soulimane, T.; Buse, G. Integral cytochrome-c oxidase. Preparation and progress towards a three-dimensional crystallization. Eur. J. Biochem. 1995, 227, 588–595. [Google Scholar] [CrossRef] [PubMed]
- Griffiths, D.E.; Wharton, D.C. Studies of the electron transport system: XXXV. Purification and properties of cytochrome oxidase. J. Biol. Chem. 1961, 236, 1850–1856. [Google Scholar] [CrossRef]
- Fowler, L.R.; Richardson, S.H.; Hatefi, Y. A rapid method for the preparation of highly purified cytochrome oxidase. Biochim. Biophys. Acta 1962, 64, 170–173. [Google Scholar] [CrossRef] [PubMed]
- Vygodina, T.V.; Kirichenko, A.; Konstantinov, A.A. Cation binding site of cytochrome c oxidase: Progress report. Biochim. Biophys. Acta 2014, 1837, 1188–1195. [Google Scholar] [CrossRef] [PubMed]
- Musatov, A.; Robinson, N.C. Cholate-induced dimerization of detergent- or phospholipid-solubilized bovine cytochrome c oxidase. Biochemistry 2002, 41, 4371–4376. [Google Scholar] [CrossRef] [PubMed]
- Sedlak, E.; Kozar, T.; Musatov, A. The interplay among subunit composition, cardiolipin content, and aggregation state of bovine heart cytochrome c oxidase. Cells 2020, 9, 2588. [Google Scholar] [CrossRef] [PubMed]
- Tsukihara, T.; Aoyama, H.; Yamashita, E.; Tomizaki, T.; Yamaguchi, H.; Shinzawa-Itoh, K.; Nakashima, R.; Yaono, R.; Yoshikawa, S. The whole structure of the 13-subunit oxidized cytochrome c oxidase at 2.8 Å. Science 1996, 272, 1136–1144. [Google Scholar] [CrossRef] [PubMed]
- Lee, S.J.; Yamashita, E.; Abe, T.; Fukumoto, Y.; Tsukihara, T.; Shinzawa-Itoh, K.; Ueda, H.; Yoshikawa, S. Intermonomer interactions in dimer of bovine heart cytochrome c oxidase. Acta Crystallogr. D. Biol. Crystallogr. 2001, 57, 941–947. [Google Scholar] [CrossRef] [PubMed]
- Koepke, J.; Olkhova, E.; Angerer, H.; Muller, H.; Peng, G.; Michel, H. High resolution crystal structure of Paracoccus denitrificans cytochrome c oxidase: New insights into the active site and the proton transfer pathways. Biochim. Biophys. Acta (Bioenergetics) 2009, 1787, 635–645. [Google Scholar] [CrossRef] [PubMed]
- Lyons, J.A.; Aragão, D.; Slattery, O.; Pisliakov, A.V.; Soulimane, T.; Caffrey, M. Structural insights into electron transfer in caa3-type cytochrome oxidase. Nature 2012, 487, 514–518. [Google Scholar] [CrossRef] [PubMed]
- Abramson, J.; Riistama, S.; Larsson, G.; Jasaitis, A.; Svensson-Ek, M.; Laakkonen, L.; Puustinen, A.; Iwata, S.; Wikström, M. The structure of the ubiquinol oxidase from Escherichia coli and its ubiquinone binding site. Nat. Struct. Biol. 2000, 7, 910–917. [Google Scholar] [CrossRef] [PubMed]
- Guo, Y.; Karimullina, E.; Emde, T.; Otwinowski, Z.; Borek, D.; Savchenko, A. Monomer and dimer structures of cytochrome bo3 ubiquinol oxidase from Escherichia coli. Prot. Sci. 2023, 32, e4616. [Google Scholar] [CrossRef] [PubMed]
- Chan, S.H.; Love, B.; Stotz, E. Absorption spectra and enzymatic properties of monomer and dimer states of cytochrome c oxidase. J. Biol. Chem. 1970, 245, 6669–6674. [Google Scholar] [CrossRef]
- Georgevich, G.; Darley-Usmar, V.M.; Malatesta, F.; Capaldi, R.A. Electron transfer in monomeric forms of beef and shark heart cytochrome c oxidase. Biochemistry 1983, 22, 1317–1322. [Google Scholar] [CrossRef] [PubMed]
- Robinson, N.C.; Talbert, L. Triton X-100 induced dissociation of beef heart cytochrome c oxidase into monomers. Biochemistry 1986, 25, 2328–2335. [Google Scholar] [CrossRef] [PubMed]
- Sadoski, R.C.; Zaslavsky, D.; Gennis, R.B.; Durham, B.; Millett, F. Exposure of bovine cytochrome c oxidase to high triton X-100 or to alkaline conditions causes a dramatic change in the rate of reduction of compound F. J. Biol. Chem. 2001, 276, 33616–33620. [Google Scholar] [CrossRef] [PubMed]
- Oleynikov, I.P.; Azarkina, N.V.; Vygodina, T.V.; Konstantinov, A.A. Mechanism of inhibition of cytochrome c oxidase by Triton X-100. Biochemistry 2021, 86, 44–58. [Google Scholar] [CrossRef] [PubMed]
- Kadenbach, B. Regulation of Mammalian 13-Subunit Cytochrome c Oxidase and Binding of other Proteins: Role of NDUFA4. Trends Endocrinol. Metab. 2017, 28, 761–770. [Google Scholar] [CrossRef] [PubMed]
- Ramzan, R.; Rhiel, A.; Weber, P.; Kadenbach, B.; Vogt, S. Reversible dimerization of cytochrome c oxidase regulates mitochondrial respiration. Mitochondrion 2019, 49, 149–155. [Google Scholar] [CrossRef] [PubMed]
- Ramzan, R.; Kadenbach, B.; Vogt, S. Multiple mechanisms regulate eukaryotic cytochrome c oxidase. Cells 2021, 10, 514. [Google Scholar] [CrossRef] [PubMed]
- Althoff, T.; Mills, D.J.; Popot, J.L.; Kuhlbrandt, W. Arrangement of electron transport chain components in bovine mitochondrial supercomplex I1III2IV1. EMBO J. 2011, 30, 4652–4664. [Google Scholar] [CrossRef] [PubMed]
- Genova, M.L.; Lenaz, G. Functional role of mitochondrial respiratory supercomplexes. Biochim. Biophys. Acta (Bioenergetics) 2014, 1837, 427–443. [Google Scholar] [CrossRef] [PubMed]
- Lopez-Fabuel, I.; Le Douce, J.; Logan, A.; Bolaños, J.P. Complex I assembly into supercomplexes determines differential mito chondrial ROS production in neurons and astrocytes. Proc. Natl. Acad. Sci. 2016, 113, 13063–13068. [Google Scholar] [CrossRef] [PubMed]
- Zong, S.; Wu, M.; Gu, J.; Liu, T.; Guo, R.; Yang, M. Structure of the intact 14-subunit human cytochrome c oxidase. Cell Res. 2018, 28, 1026–1034. [Google Scholar] [CrossRef] [PubMed]
- Shinzawa-Itoh, K.; Sugimura, T.; Misaki, T.; Tadehara, Y.; Yamamoto, S.; Hanada, M.; Yano, N.; Nakagawa, T.; Uene, S.; Yamada, T.; Aoyama, H.; Yamashita, E.; Tsukihara, T.; Yoshikawa, S.; Muramoto, K. Monomeric structure of an active form of bovine cytochrome c oxidase. Proc. Natl. Acad. Sci. USA 2019, 116, 19945–19951. [Google Scholar] [CrossRef] [PubMed]
- Shinzawa-Itoh, K.; Muramoto, K. Biochemical and crystallographic studies of monomeric and dimeric bovine cytochrome c oxidase. Biophys. Physicobiol. 2021, 18, 186–195. [Google Scholar] [CrossRef] [PubMed]
- Popot, J.L.; Althoff, T.; Bagnard, D.; Banères, J.L.; Bazzacco, P.; Billon-Denis, E.; Catoire, L.J.; Champeil, P.; Charvolin, D.; Cocco, M.J.; Crémel, G.; Dahmane, T.; de la Maza, L.M.; Ebel, C.; Gabel, F.; Giusti, F.; Gohon, Y.; Goormaghtigh, E.; Guittet, E.; Kleinschmidt, J.H.; Kühlbrandt, W.; Le Bon, C.; Martinez, K.L.; Picard, M.; Pucci, B.; Sachs, J.N.; Tribet, C.; van Heijenoort, C.; Wien, F.; Zito, F.; Zoonens, M. Amphipols from A to Z. Annu. Rev. Biophys. 2011, 40, 379–408. [Google Scholar] [CrossRef] [PubMed]
- Zoonens, M.; Popot, J.L. Amphipols for each season. J. Membr. Biol. 2014, 247, 759–796. [Google Scholar] [CrossRef] [PubMed]
- Oliver, R.C.; Lipfert, J.; Fox, D.A.; Lo; Doniach, R.H.; Columbus, S. Dependence of micelle size and shape on detergent alkyl chain length and head group. PLoS ONE 2013, 8, e62488. [Google Scholar] [CrossRef] [PubMed]
- Liko, I.; Degiacomi, M.T.; Mohammed, S.; Yoshikawa, S.; Schmidt, C.; Robinson, C.V. Dimer interface of bovine cytochrome c oxidase is influenced by local posttranslational modifications and lipid binding. Proc. Natl. Acad. Sci. USA 2016, 113, 8230–8235. [Google Scholar] [CrossRef] [PubMed]
- Oleynikov, I.P.; Azarkina, N.V.; Vygodina, T.V.; Konstantinov, A.A. Interaction of cytochrome c oxidase with steroid hormones. Cells 2020, 9, 2211. [Google Scholar] [CrossRef] [PubMed]
- Oleynikov, I.P.; Sudakov, R.V.; Azarkina, N.V.; Vygodina, T.V. Direct Interaction of Mitochondrial Cytochrome c Oxidase with Thyroid Hormones: Evidence for Two Binding Sites. Cells 2022, 11, 908. [Google Scholar] [CrossRef] [PubMed]
- Oleynikov, I.P.; Sudakov, R.V.; Radyukhin, V.A.; Arutyunyan, A.M.; Azarkina, N.V.; Vygodina, T.V. Interaction of Amphipathic Peptide from Influenza Virus M1 Protein with Mitochondrial Cytochrome Oxidase. Int. J. Mol. Sci. 2023, 24, 4119. [Google Scholar] [CrossRef] [PubMed]
- Qin, L.; Mills, D.A.; Buhrow, L.; Hiser, C.; Ferguson-Miller, S. A Conserved steroid binding site in cytochrome c . Biochemistry 2008, 47, 9931–9933. [Google Scholar] [CrossRef] [PubMed]
- Hiser, C.; Buhrow, L.; Liu, J.; Kuhn, L.; Ferguson-Miller, S. A conserved amphipathic ligand binding region influences K-path-dependent activity of cytochrome c oxidase. Biochemistry 2013, 52, 1385–1396. [Google Scholar] [CrossRef] [PubMed]
- Buhrow, L.; Hiser, C.; van Voorst, J.R.; Ferguson-Miller, S.; Kuhn, L.A. Computational prediction and in vitro analysis of potential physiological ligands of the bile acid binding site in cytochrome c oxidase. Biochemistry 2013, 52, 6995–7006. [Google Scholar] [CrossRef] [PubMed]
- Di Trani, J.M.; Moe, A.; Riepl, D.; Saura, P.; Kaila, V.R.; Brzezinski, P.; Rubinstein, J.L. Structural basis of mammalian complex IV inhibition by steroids. Proc. Natl. Acad. Sci. USA 2022, 119, e2205228119. [Google Scholar] [CrossRef] [PubMed]
- Azarkina, N.V.; Borisov, V.B.; Oleynikov, I.P.; Sudakov, R.V.; Vygodina, T.V. Interaction of terminal oxidases with amphipathic molecules. Int. J..Mol. Sci. 2023, 24, 6428. [Google Scholar] [CrossRef] [PubMed]
- Finel, M.; Wikstrom, M. Studies on the role of the oligomeric state and subunit III of cytochrome oxidase in proton translocation. Biochim. Biophys. Acta (Bioenergetics) 1986, 851, 99–108. [Google Scholar] [CrossRef] [PubMed]
- Shinzawa-Itoh, K.; Shimomura, H.; Yanagisawa, S.; Shimada, S.; Takahashi, R.; Oosaki, M.; Ogura, T.; Tsukihara, T. Purification of Active Respiratory Supercomplex from Bovine Heart Mitochondria Enables Functional Studies. J. Biol. Chem. 2016, 291, 4178–4184. [Google Scholar] [CrossRef] [PubMed]
- Mitchell, D.M.; Gennis, R.B. Rapid purification of wildtype and mutant cytochrome c oxidase from Rhodobacter sphaeroides by Ni2+-NTA affinity chromatography. FEBS Lett. 1995, 368, 148–150. [Google Scholar] [CrossRef] [PubMed]
Figure 1.
Three-dimensional structures of cytochrome oxidase. View from the intermembrane space. (А) Dimer of CcO from bovine heart mitochondria (PDB 5b1a). Different monomers are highlighted in green and blue. (B) Cytochrome oxidase aa3 from R. sphaeroides (PDB 1m56). The two monomers (green and blue) are aligned with the structure of the mitochondrial dimer (panel A). Subunit IV of each monomer is highlighted in darker color.
Figure 1.
Three-dimensional structures of cytochrome oxidase. View from the intermembrane space. (А) Dimer of CcO from bovine heart mitochondria (PDB 5b1a). Different monomers are highlighted in green and blue. (B) Cytochrome oxidase aa3 from R. sphaeroides (PDB 1m56). The two monomers (green and blue) are aligned with the structure of the mitochondrial dimer (panel A). Subunit IV of each monomer is highlighted in darker color.
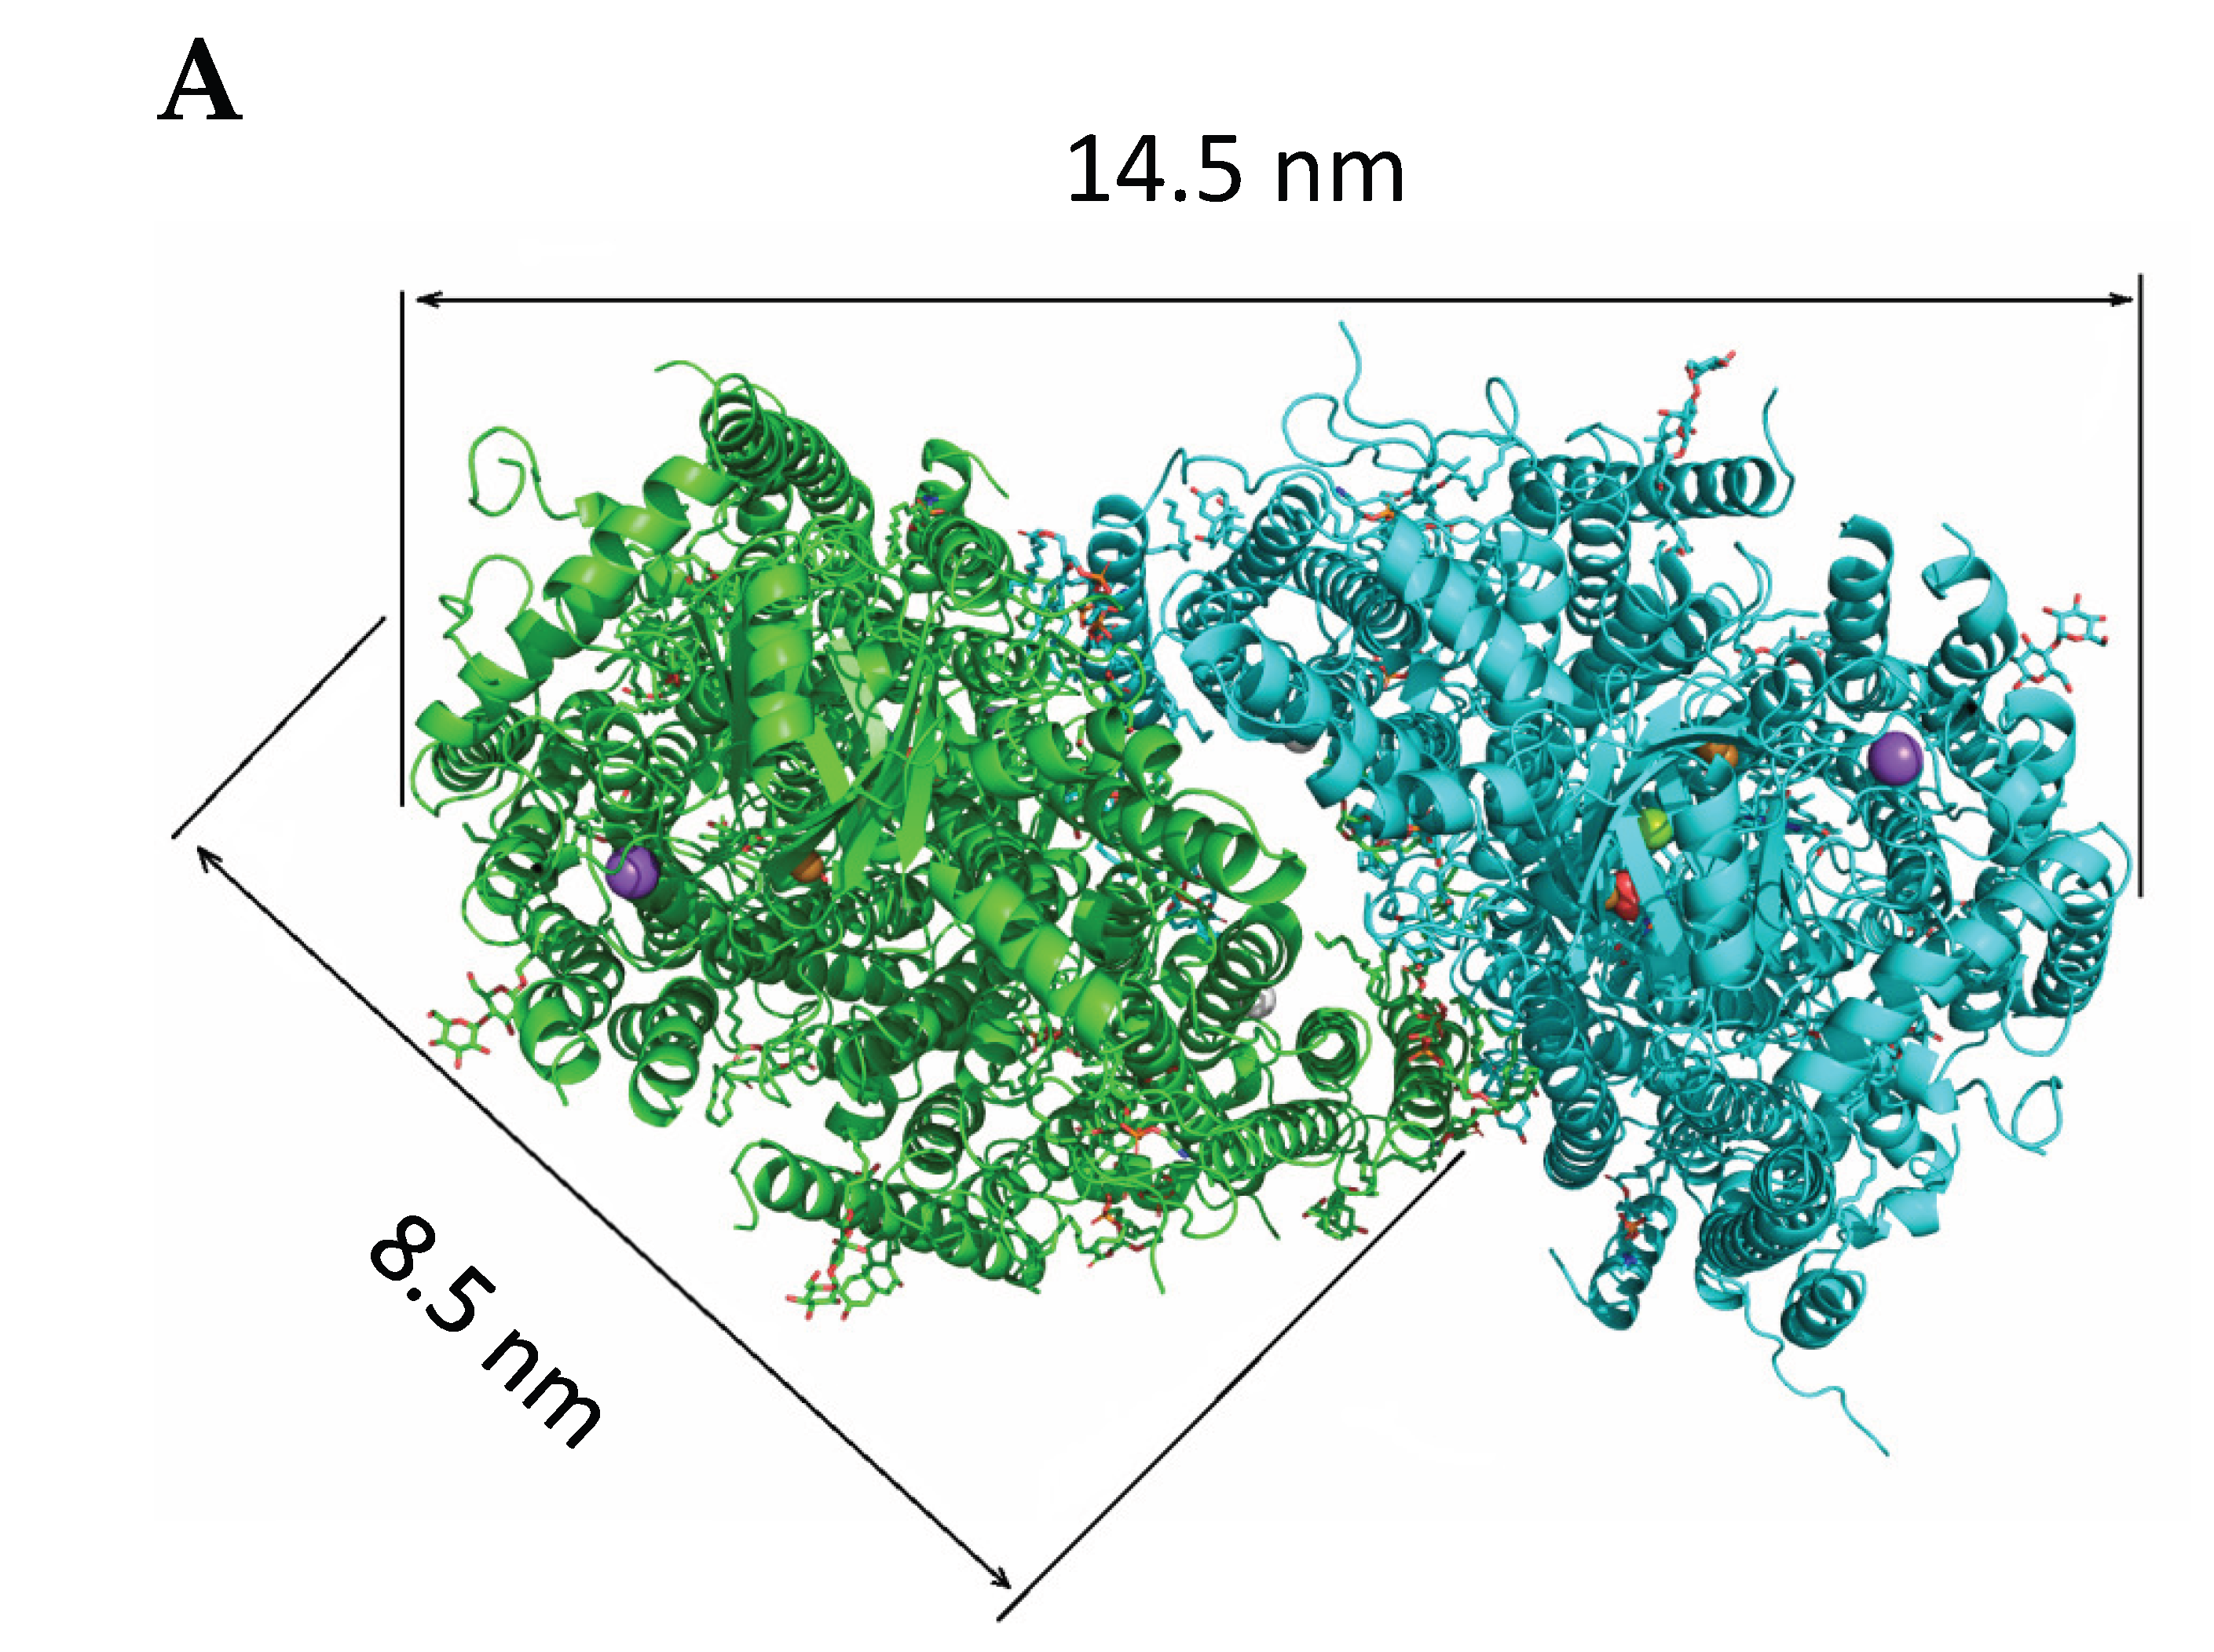
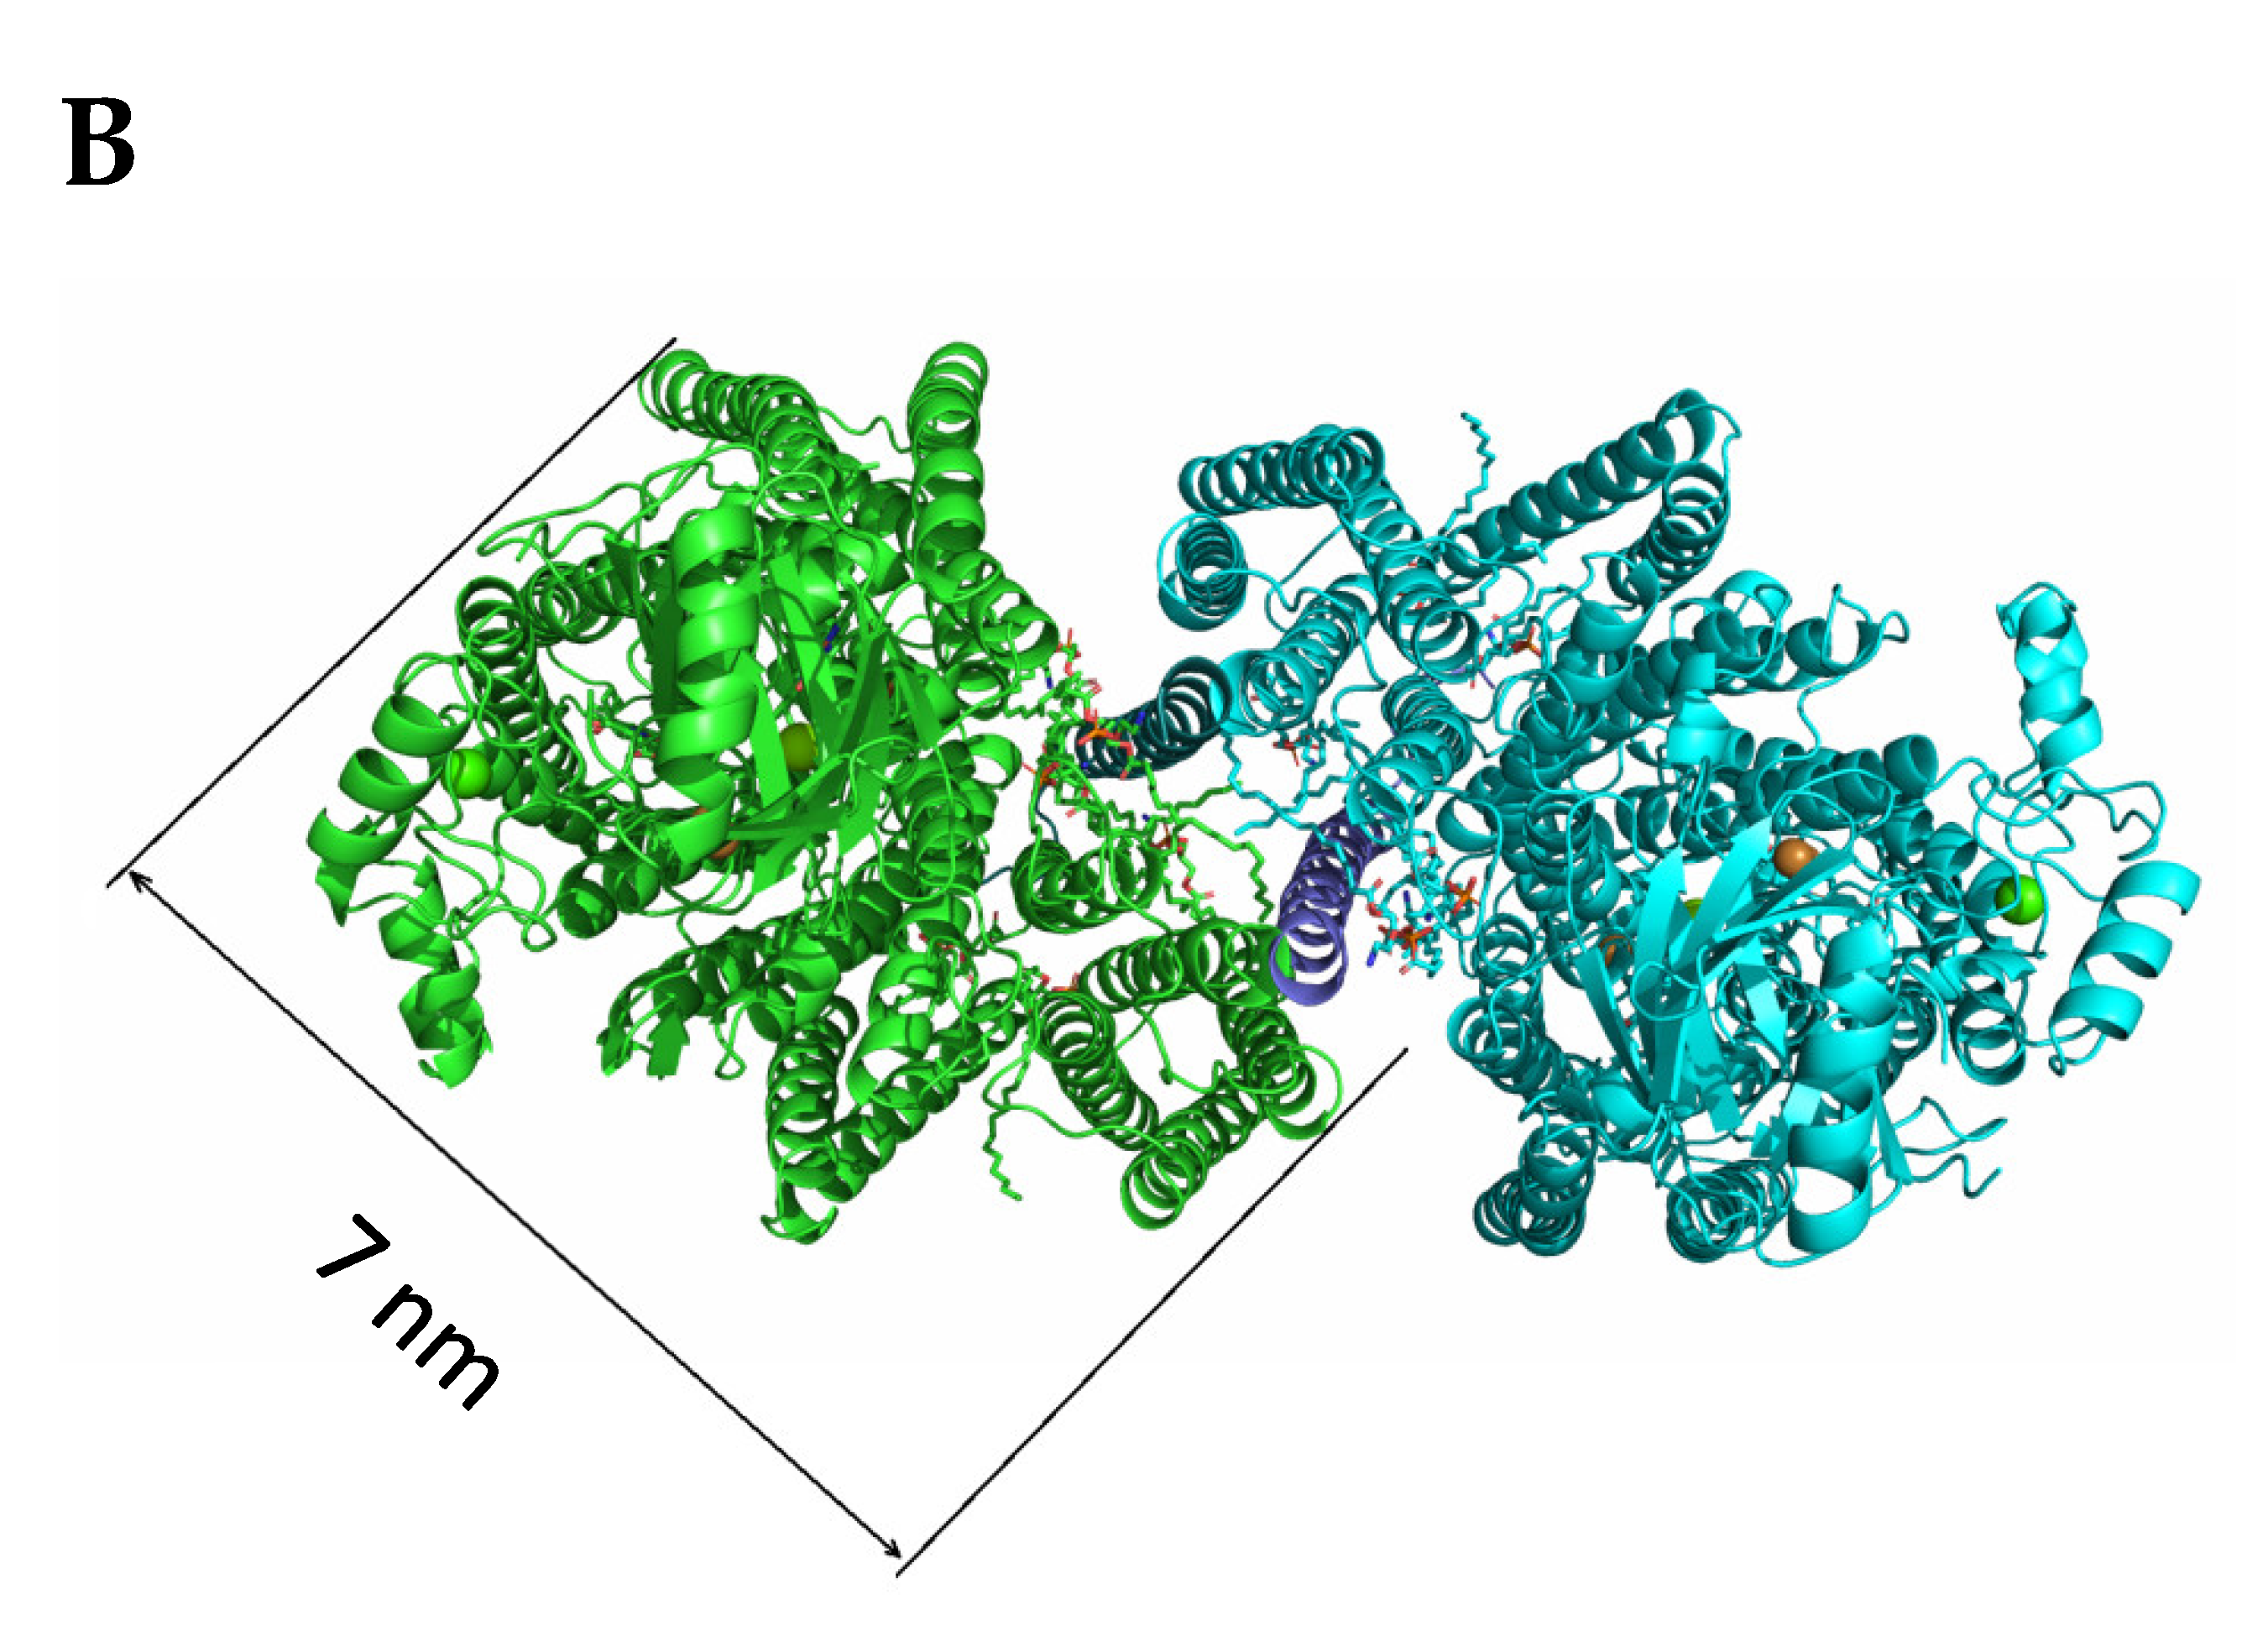
Figure 2.
Micelle size distribution in a solution containing DM and CcO. Experimental medium: 50 mM potassium phosphate, pH 7.4, 0.05% DM. From here on, the symbols represent average values and are presented with standard deviations. For clarity, they are connected by curves of the corresponding colors. (А) Distribution of DM micelles in the absence of protein (black squares) and after the addition of 4 μM mitochondrial CcO (red circles). During the experiment, the count rate in the second case was approximately 30 times higher than in the first. (B) Distribution of micelles in the presence of different concentrations of mitochondrial CcO: 1 μM (black squares), 2 μM (red circles), 3 μM (green triangles), 4 μM (blue triangles), 5 μM (light blue diamonds), 10 μM (purple triangles). (C) Distribution of micelles in the presence of different concentrations of cytochrome oxidase aa3 from R. sphaeroides: 0.83 μM (black squares), 4 μM (red circles), 25 μM (green triangles).
Figure 2.
Micelle size distribution in a solution containing DM and CcO. Experimental medium: 50 mM potassium phosphate, pH 7.4, 0.05% DM. From here on, the symbols represent average values and are presented with standard deviations. For clarity, they are connected by curves of the corresponding colors. (А) Distribution of DM micelles in the absence of protein (black squares) and after the addition of 4 μM mitochondrial CcO (red circles). During the experiment, the count rate in the second case was approximately 30 times higher than in the first. (B) Distribution of micelles in the presence of different concentrations of mitochondrial CcO: 1 μM (black squares), 2 μM (red circles), 3 μM (green triangles), 4 μM (blue triangles), 5 μM (light blue diamonds), 10 μM (purple triangles). (C) Distribution of micelles in the presence of different concentrations of cytochrome oxidase aa3 from R. sphaeroides: 0.83 μM (black squares), 4 μM (red circles), 25 μM (green triangles).
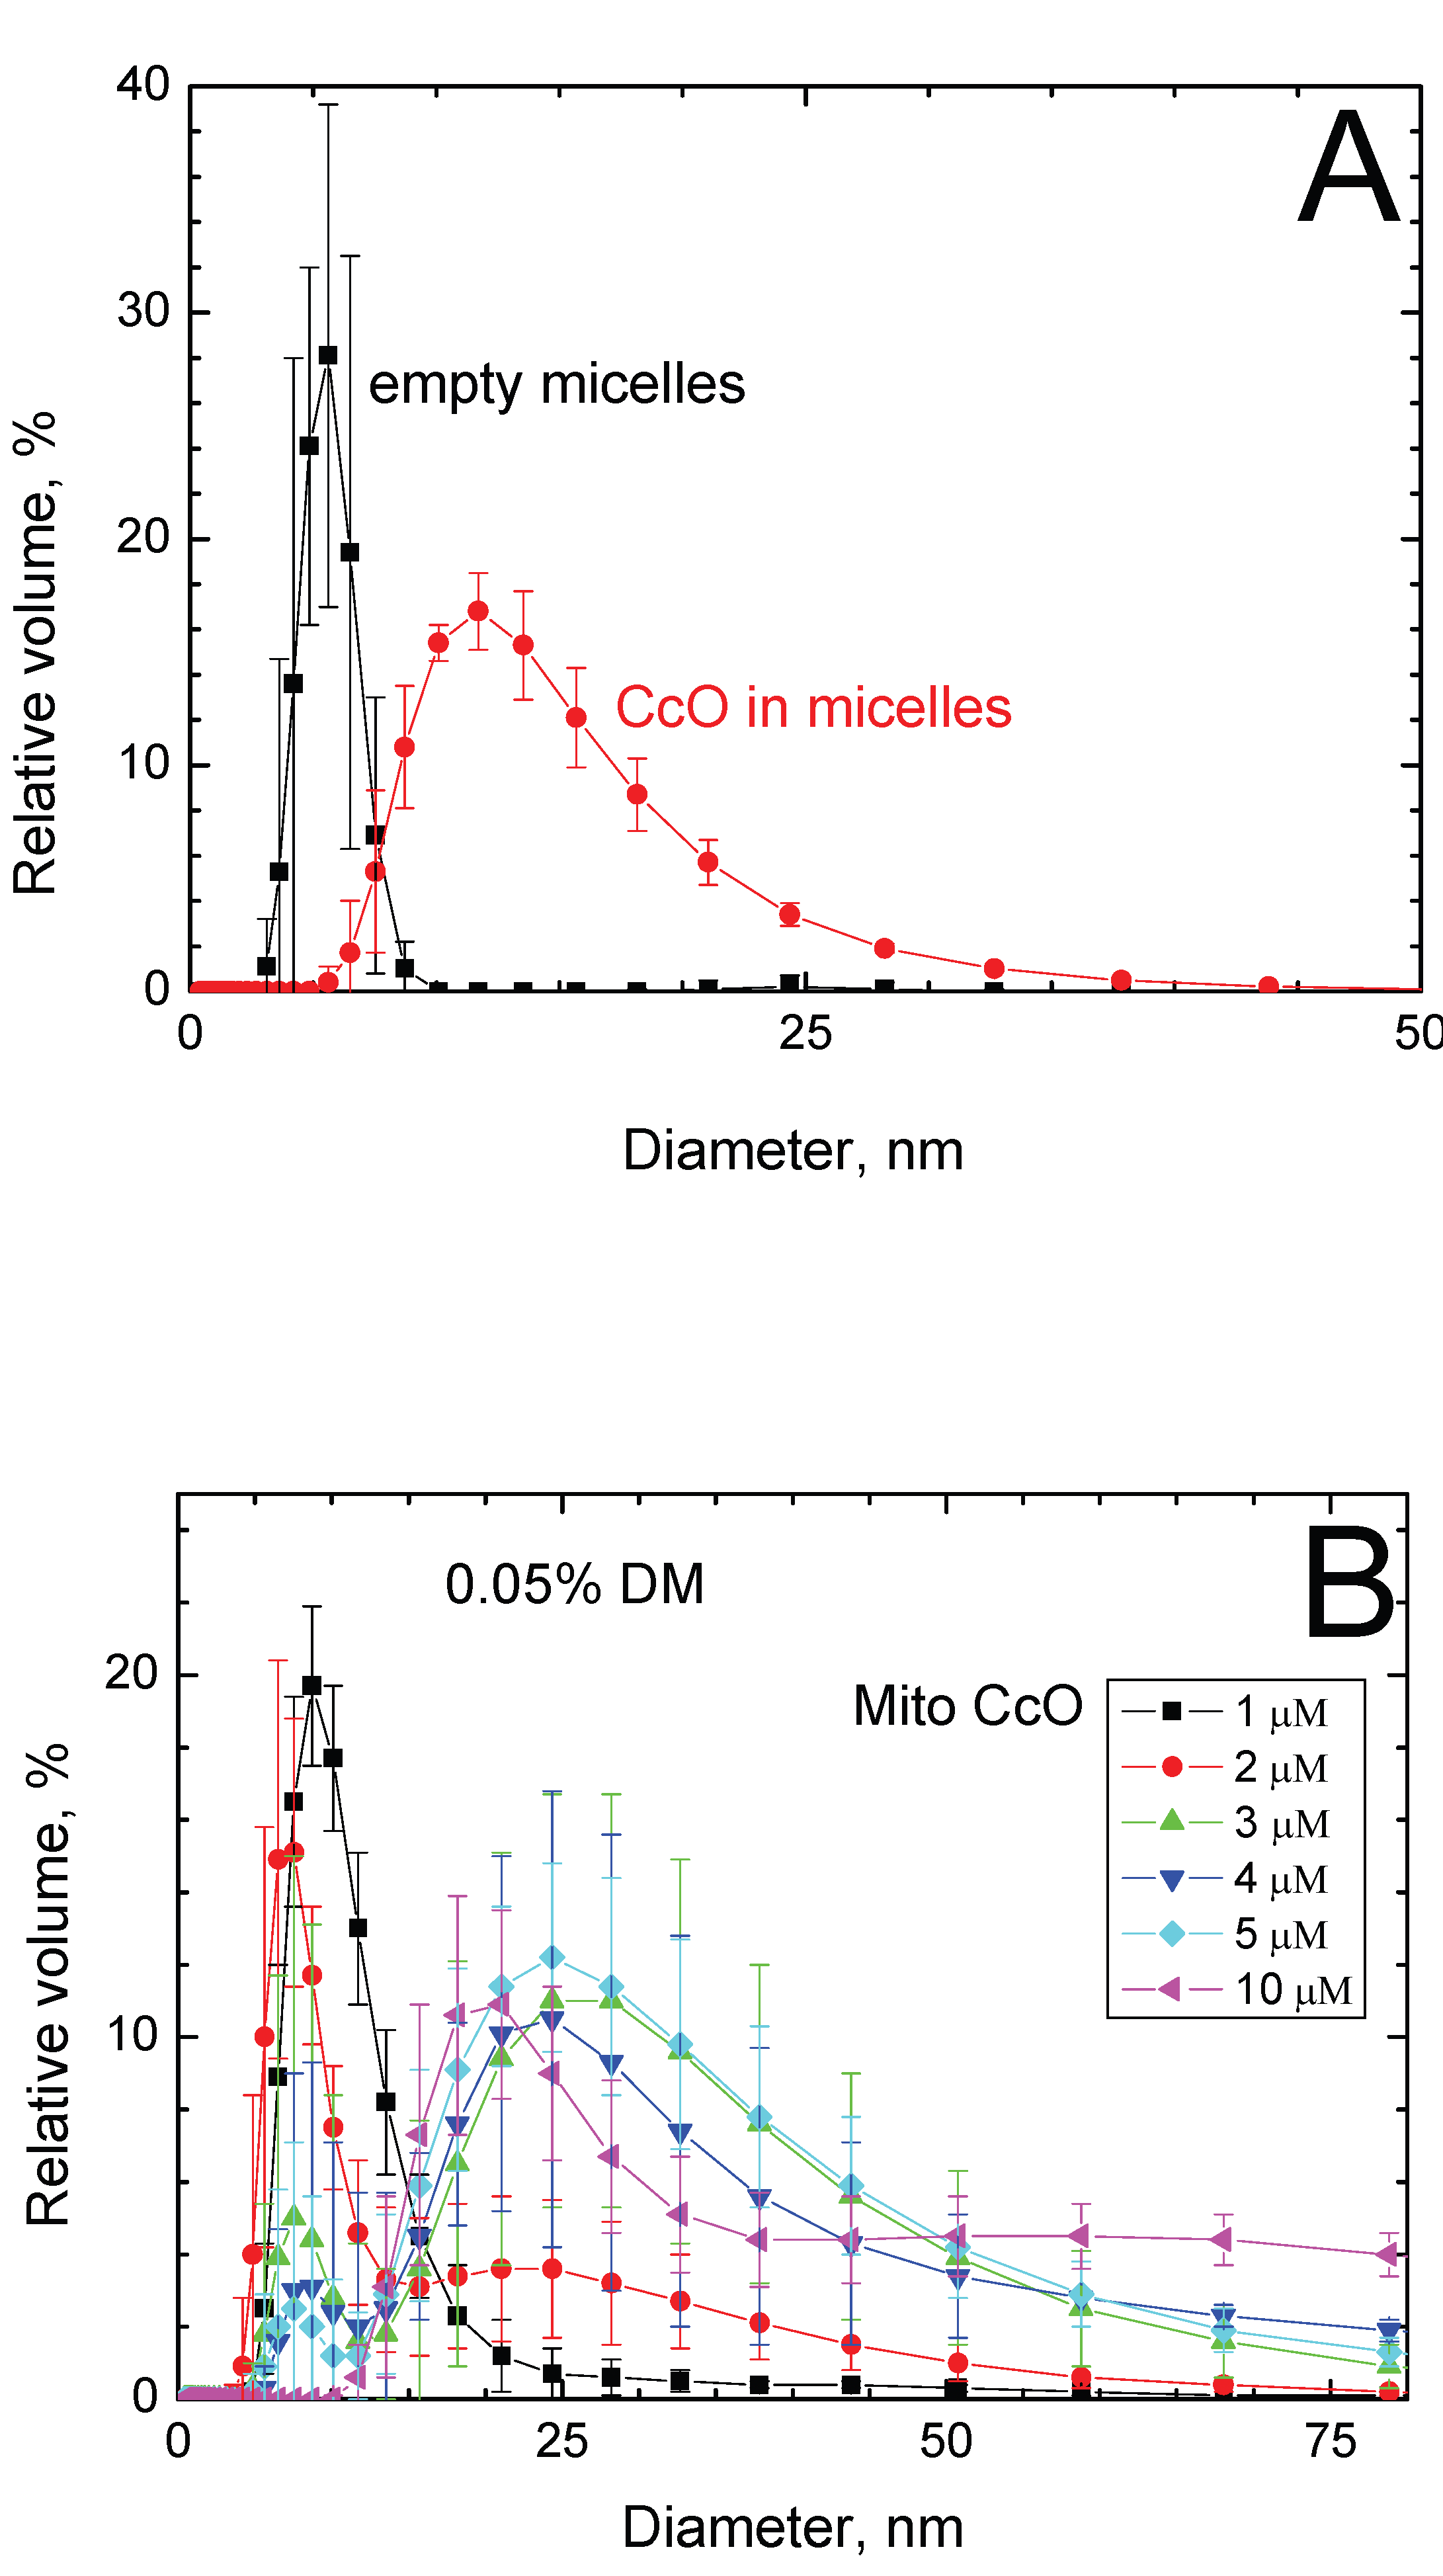
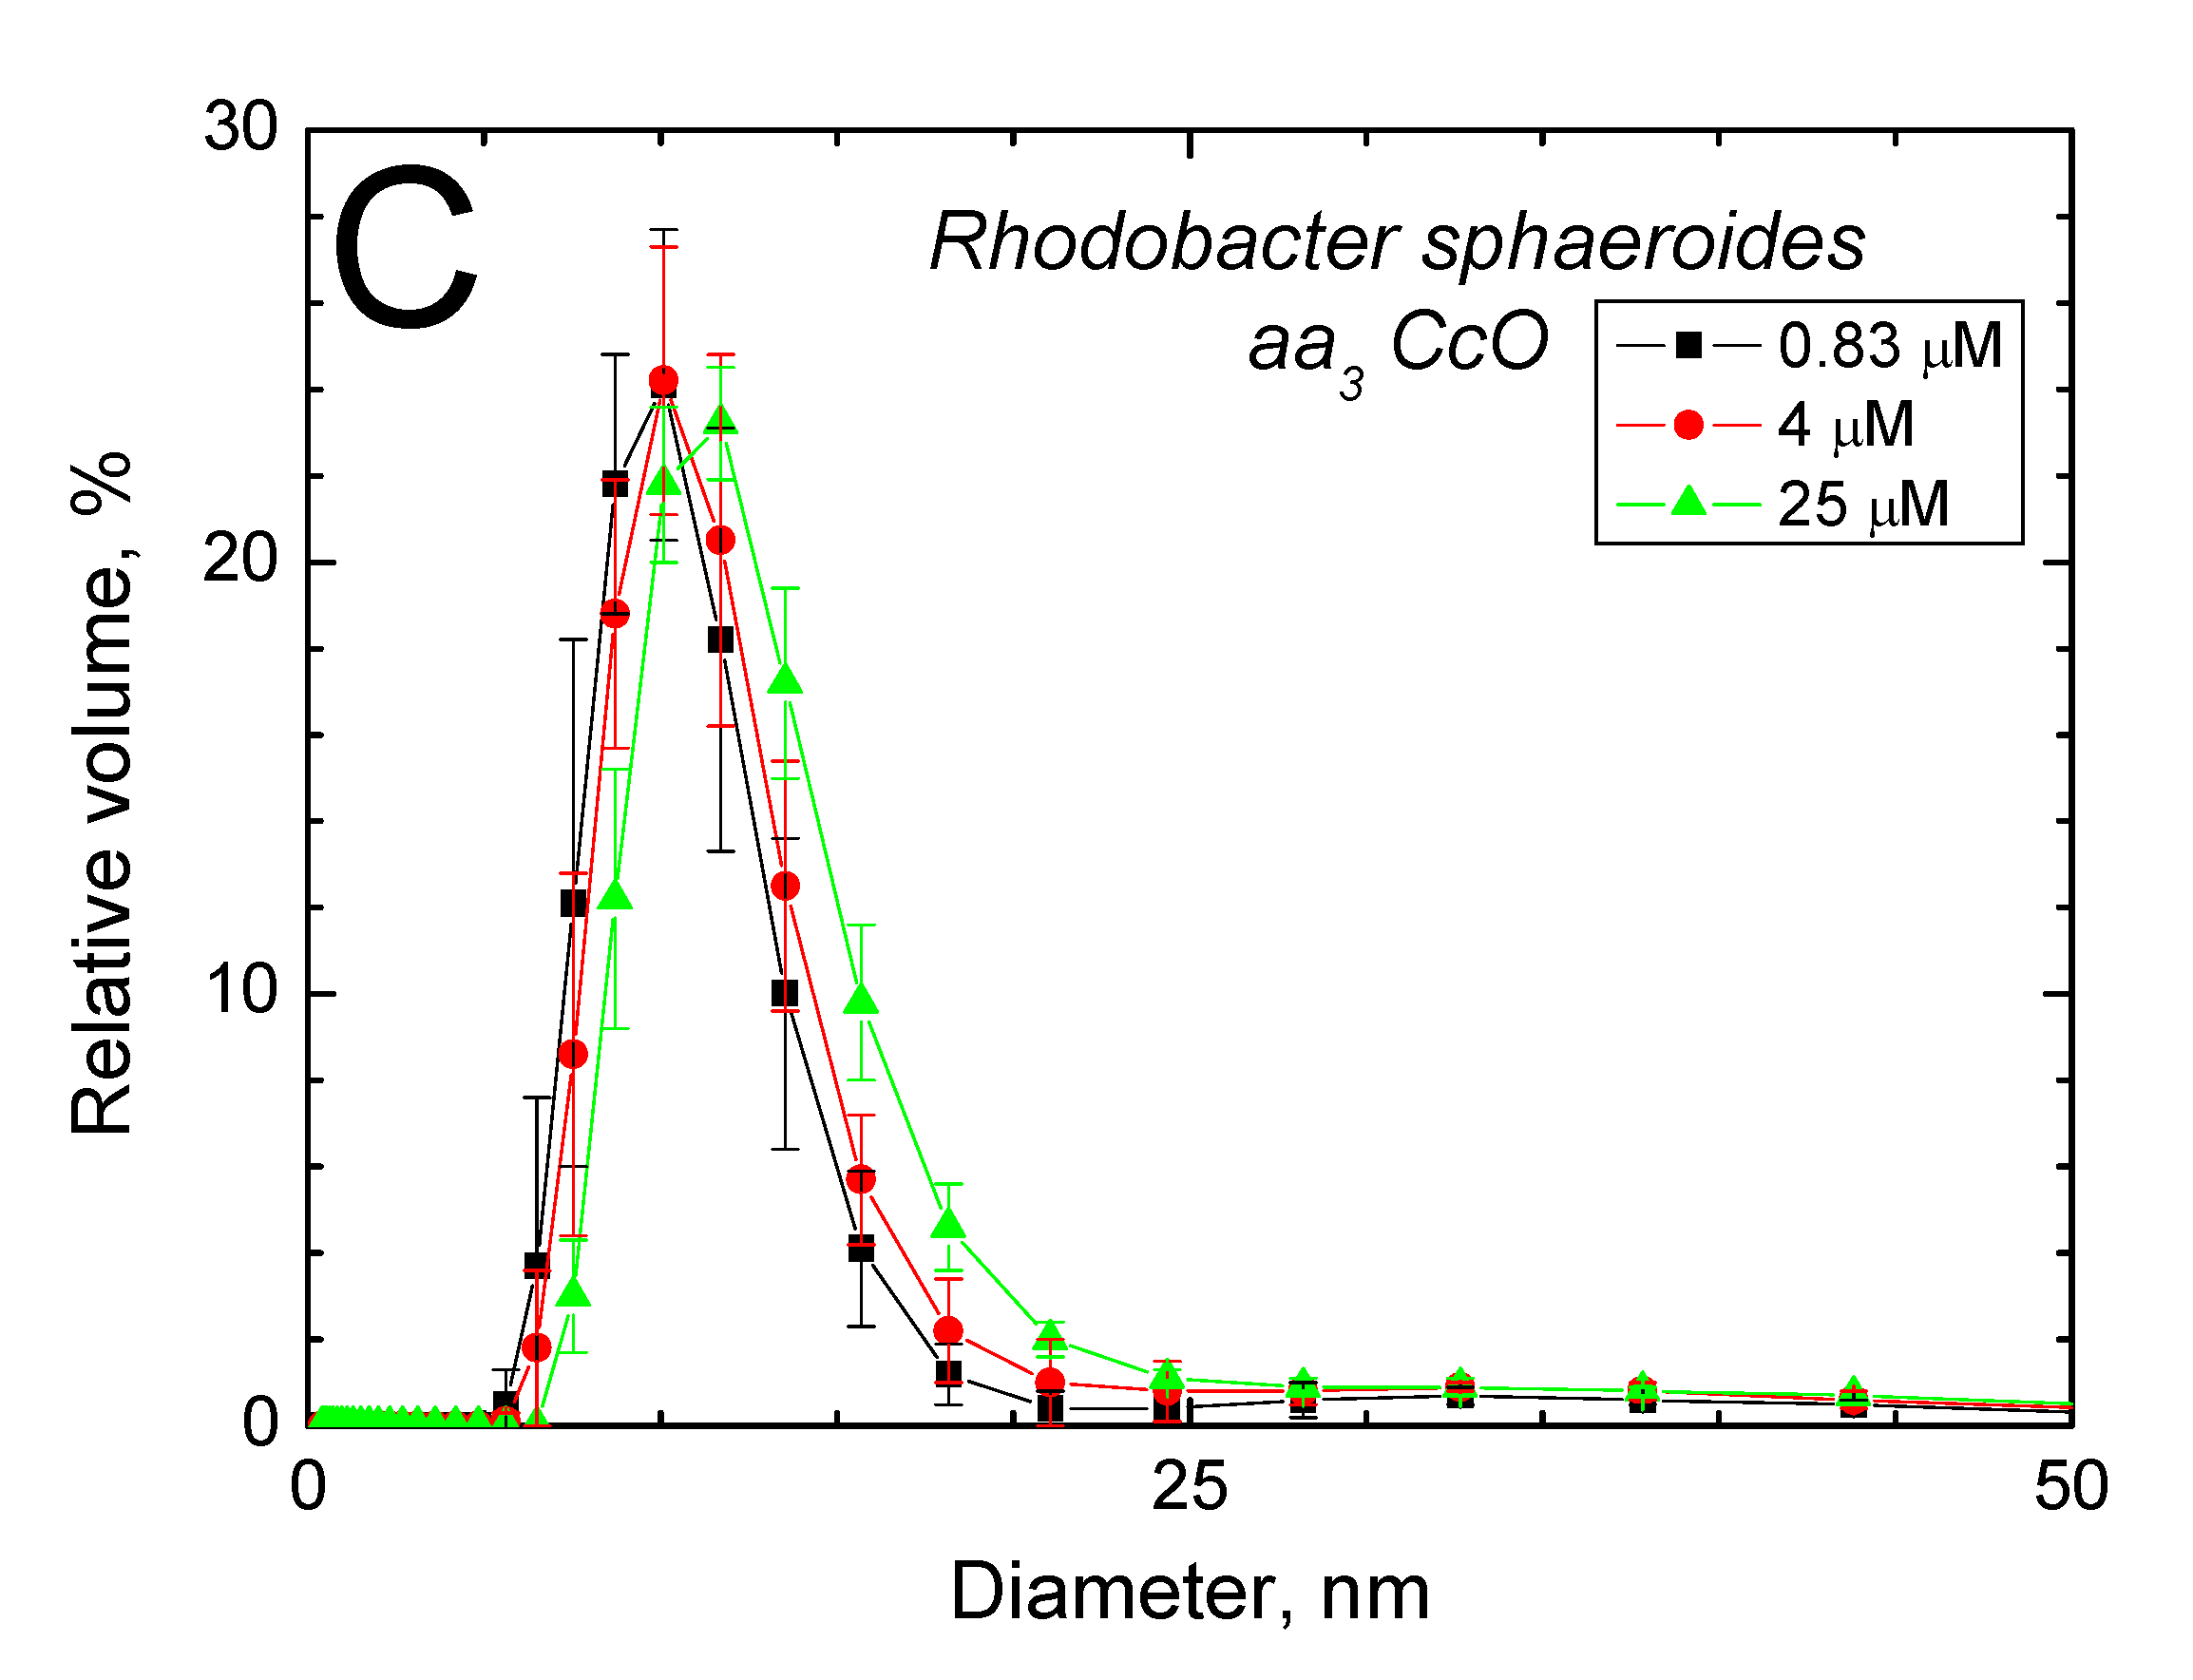
Figure 3.
Change in micelle size in the presence of agents affecting the quaternary structure of CсO. (А) Effect of Triton X100. CcO concentration is 5 μM. Control: 0.05% TX100, 50 mM potassium phosphate buffer, pH 6.5 (black squares). Monomerizing conditions: 5% TX100, 100 mM CHES, pH 9.5 (red circles). (B) Cholate effect. Concentration of CcO is 2.8 μM (“Cholate-free” preparation, see Methods). Control: 50 mM potassium phosphate buffer, pH 7.4, 0.05% DM (black squares). Dimerizing conditions: 4 mM cholate was added to the experimental medium; recording was made 45 min (red circles) and 6 h (green triangles) after addition.
Figure 3.
Change in micelle size in the presence of agents affecting the quaternary structure of CсO. (А) Effect of Triton X100. CcO concentration is 5 μM. Control: 0.05% TX100, 50 mM potassium phosphate buffer, pH 6.5 (black squares). Monomerizing conditions: 5% TX100, 100 mM CHES, pH 9.5 (red circles). (B) Cholate effect. Concentration of CcO is 2.8 μM (“Cholate-free” preparation, see Methods). Control: 50 mM potassium phosphate buffer, pH 7.4, 0.05% DM (black squares). Dimerizing conditions: 4 mM cholate was added to the experimental medium; recording was made 45 min (red circles) and 6 h (green triangles) after addition.
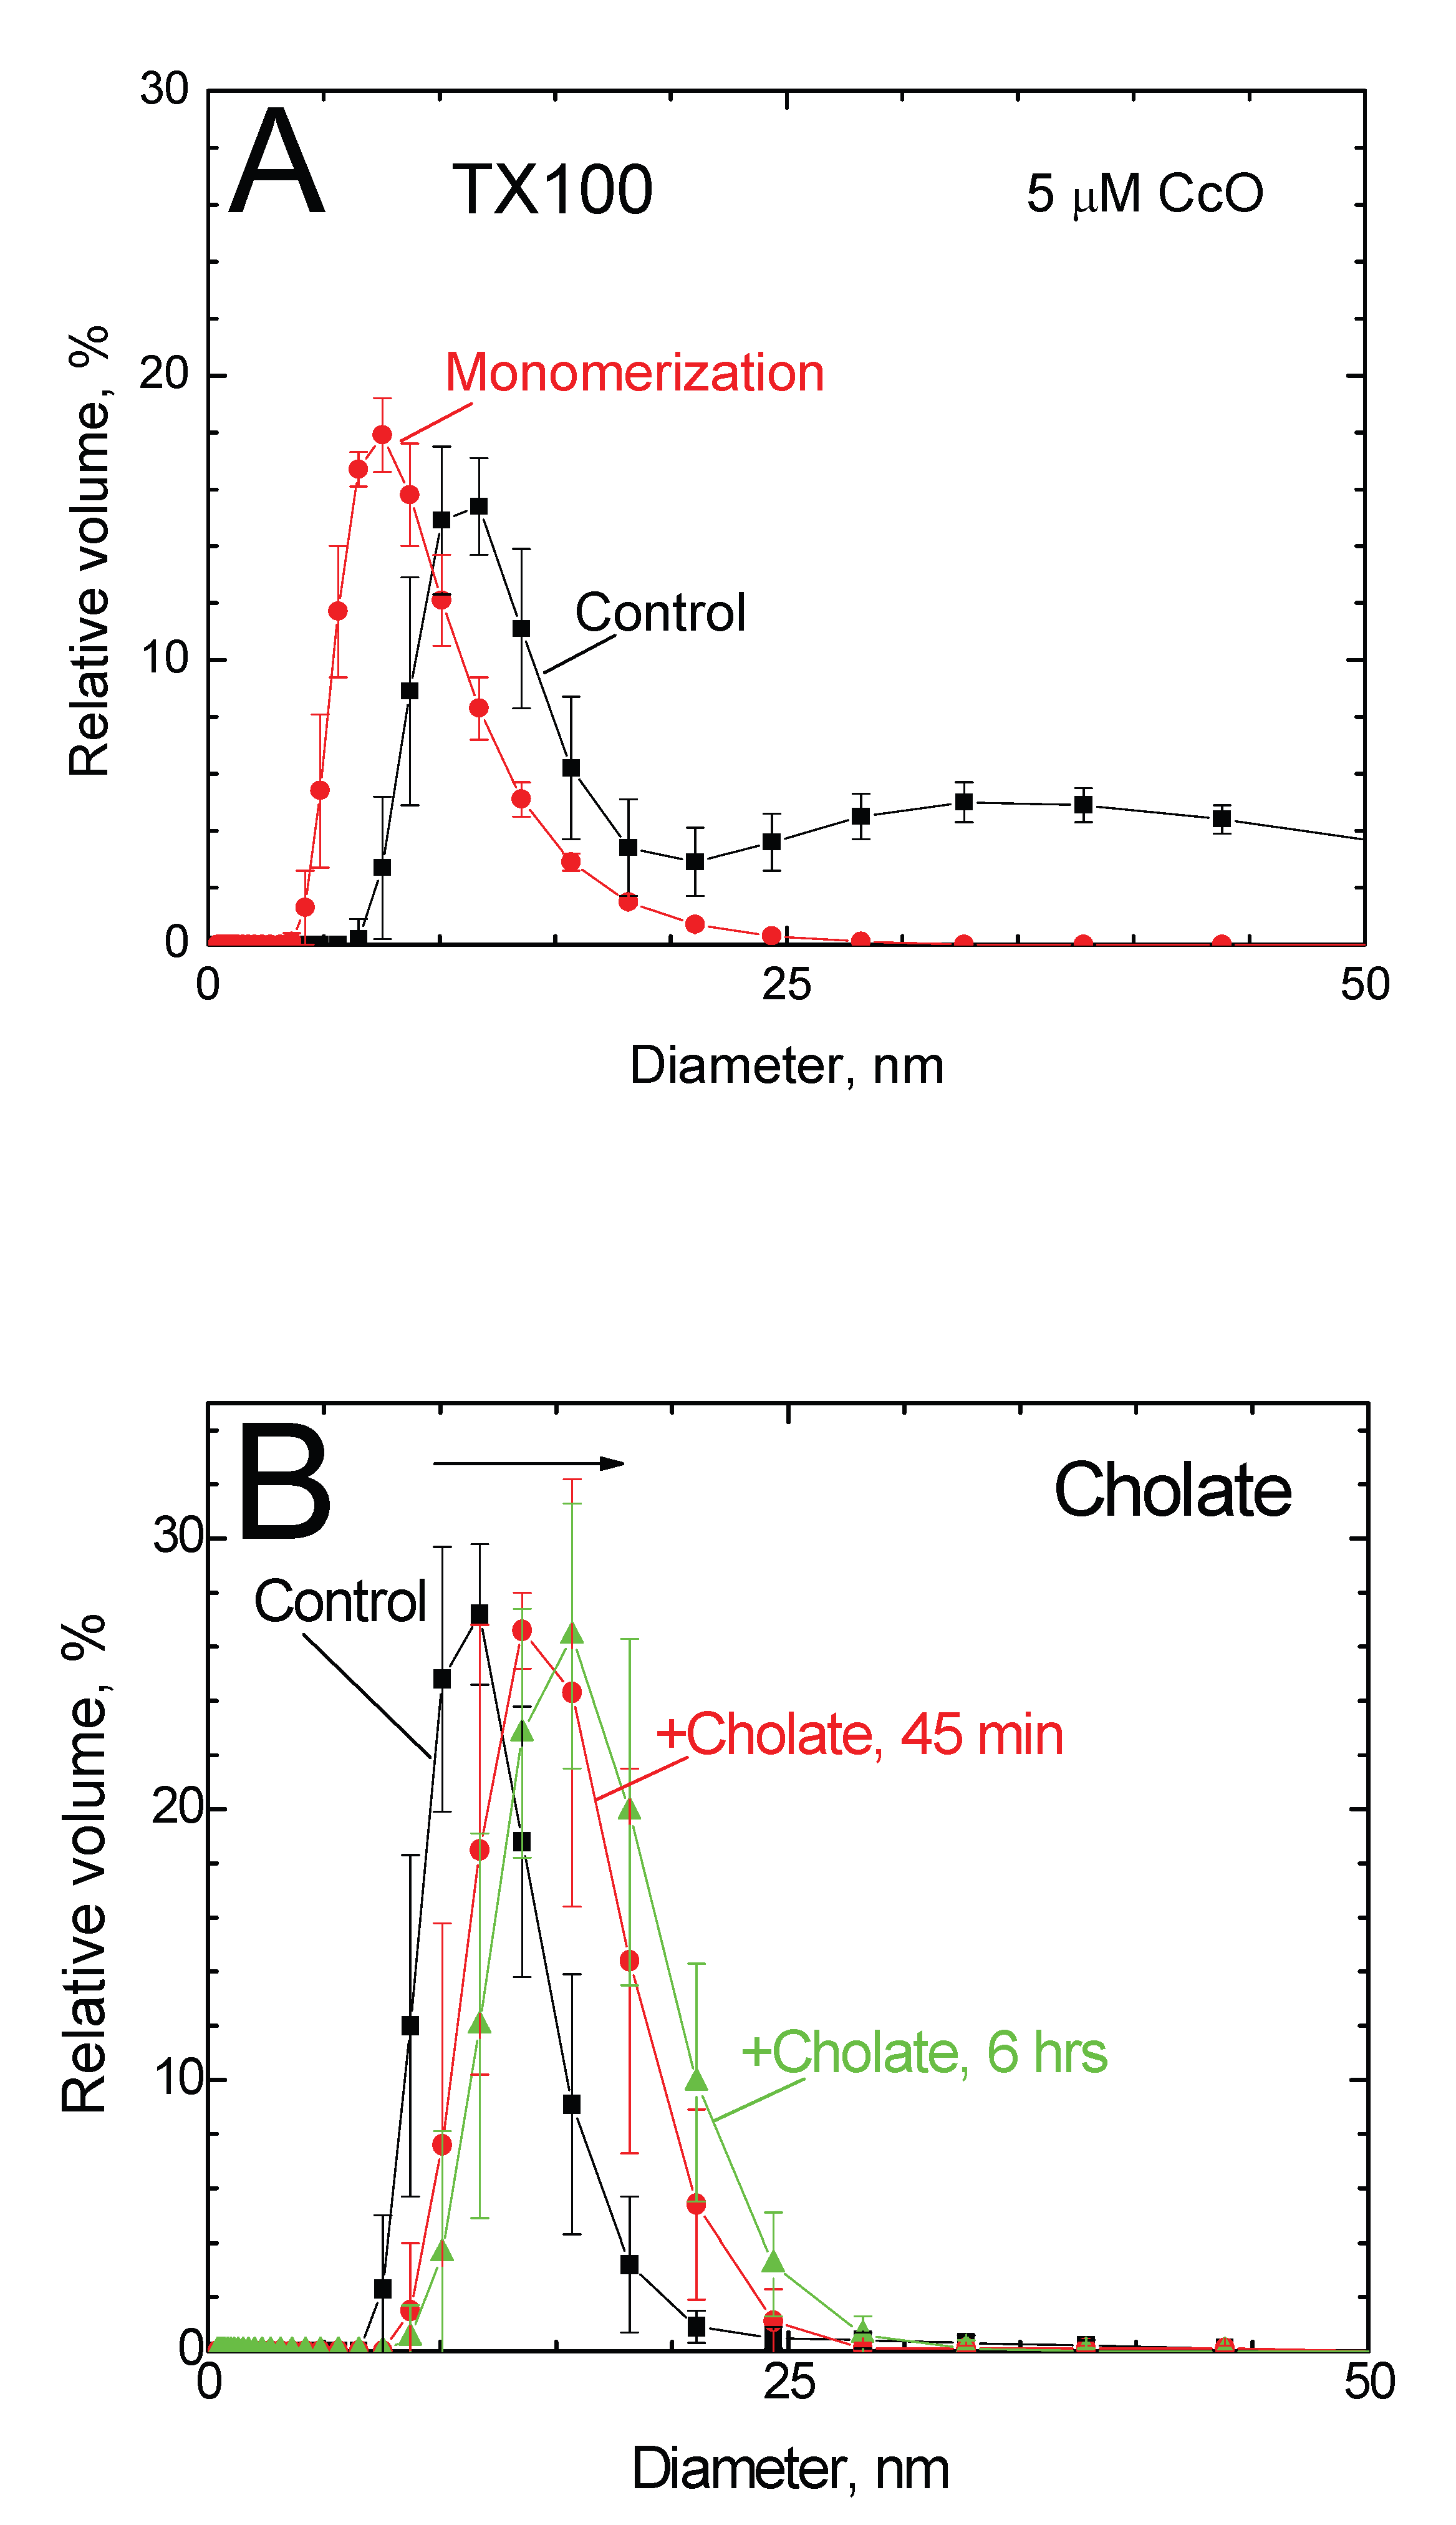
Figure 4.
Particle size distribution in CcO samples complexed with amphipol. Experimental medium: 50 mM HEPES/NaOH, pH 7.5. The assay was conducted the day after sample preparation. (A) Monomeric CcO with amphpol (AmM). CcO concentrations: 1.25 μM (black squares), 2.5 μM (red circles), 10 μM (green triangles). (B) Dimeric CcO with amphpol (AmD). CcO concentrations: 2.4 μM (black squares), 3.9 μM (red circles), 12 μM (green triangles).
Figure 4.
Particle size distribution in CcO samples complexed with amphipol. Experimental medium: 50 mM HEPES/NaOH, pH 7.5. The assay was conducted the day after sample preparation. (A) Monomeric CcO with amphpol (AmM). CcO concentrations: 1.25 μM (black squares), 2.5 μM (red circles), 10 μM (green triangles). (B) Dimeric CcO with amphpol (AmD). CcO concentrations: 2.4 μM (black squares), 3.9 μM (red circles), 12 μM (green triangles).
Disclaimer/Publisher’s Note: The statements, opinions and data contained in all publications are solely those of the individual author(s) and contributor(s) and not of MDPI and/or the editor(s). MDPI and/or the editor(s) disclaim responsibility for any injury to people or property resulting from any ideas, methods, instructions or products referred to in the content. |
© 2026 by the authors. Licensee MDPI, Basel, Switzerland. This article is an open access article distributed under the terms and conditions of the Creative Commons Attribution (CC BY) license.
Copyright: This open access article is published under a Creative Commons CC BY 4.0 license, which permit the free download, distribution, and reuse, provided that the author and preprint are cited in any reuse.