
Submitted:
24 August 2026
Posted:
25 August 2026
You are already at the latest version
Abstract
Background: Esophageal squamous cell carcinoma (ESCC) accounts for over 80% of esophageal cancer cases globally. Accurate preoperative prediction of lymph node metastasis (LNM) is critical for treatment decision-making, yet current clinical staging frequently underestimates nodal disease burden. Pathomics — the high-throughput quantitative analysis of histopathological images — offers an opportunity to capture tumor microenvironmental patterns invisible to routine microscopy. We aimed to develop and validate a pathomics-clinical integrated model for predicting LNM in resectable ESCC.
Methods: A total of 477 consecutive ESCC patients who underwent radical esophagectomy were retrospectively enrolled. After excluding 61 patients with missing data, 416 patients were included in the final analysis (LNM-positive: 217, 52.2%). H&E-stained whole-slide images were acquired using a KFBIO KF-PRO-400-HI scanner at 20× magnification (pixel size 0.5 μm/px). Nuclear morphological features were extracted via QuPath hematoxylin optical density (OD)-based detection, yielding 17 pathomic features selected by LASSO-logistic regression. A combined clinical-pathomics nomogram was constructed and internally validated via 10-fold cross-validation (out-of-fold, OOF), with apparent (resubstitution) performance reported alongside to quantify optimism. Secondary analyses examined survival stratification within node-negative (pN0) patients and across whole-cohort risk groups. The final nomogram was additionally applied, without refitting, to an independent external cohort of 101 ESCC patients from a separate institution to assess transportability.
Results: The combined nomogram achieved an out-of-fold (cross-validated) AUC of 0.821 (95% CI 0.779–0.858), compared with 0.791 for the clinical model and 0.762 for the pathomics-alone model. In multivariable analysis, the pathomics score remained an independent predictor of LNM (adjusted OR 2.47, 95% CI 1.80–3.39; P < 0.001), with significant incremental value over clinical variables alone (likelihood-ratio χ² = 35.5, P = 2.56e-09). Risk stratification by nomogram score tertiles showed a clear gradient of LNM prevalence: 15.8% (low-risk), 55.1% (intermediate-risk), and 85.6% (high-risk) (Cochran-Armitage trend P < 0.001). In the pN0 subgroup (n = 199), patients with high pathomics risk had significantly worse overall survival (3-year OS: 77.2% vs. 94.3%; log-rank P = 0.005) and progression-free survival (3-year PFS: 75.5% vs. 88.9%; log-rank P = 0.007). Externally, in an independent cohort of 101 patients from a separate institution (LNM+ = 25, 24.8%), the combined model achieved an AUC of 0.774 (95% CI 0.663–0.870), the clinical model 0.801, and the pathomics-alone model 0.685, confirming partial transportability of the clinical component while the pathomics signature showed limited generalizability across centers.
Conclusions: The integration of quantitative pathomic features with conventional clinicopathological variables provides robust predictive power for LNM in ESCC and identifies a subset of node-negative patients at elevated risk of poor outcomes. These findings support the potential utility of pathomics as a complementary tool for preoperative risk stratification in ESCC. External validation in an independent cohort confirmed partial transportability of the clinical component but highlighted limited generalizability of the pathomics signature, underscoring the need for multi-center harmonization before clinical deployment.
Keywords:
esophageal squamous cell carcinoma
; lymph node metastasis
; pathomics
; nomogram
; machine learning
; prognosis
1. Introduction
Esophageal squamous cell carcinoma (ESCC) remains a leading cause of cancer-related mortality worldwide, particularly in East Asia and sub-Saharan Africa [1,2]. Despite advances in multimodal therapy, lymph node metastasis (LNM) is the single most important prognostic factor determining survival after surgical resection [3]. The presence of occult nodal disease in patients staged as node-negative by conventional imaging and endoscopic ultrasound contributes substantially to locoregional recurrence rates of 20–40% even after apparently curative esophagectomy [4].
Current preoperative assessment of nodal status relies primarily on computed tomography (CT), positron emission tomography (PET), and endoscopic ultrasonography (EUS), all of which have limited sensitivity for detecting micrometastases and small-volume nodal involvement [5,6]. The TNM staging system, while universally adopted, does not incorporate quantitative histomorphological information from the primary tumor that may reflect its biological aggressiveness and metastatic propensity [7].
Pathomics, also termed computational pathology or histomics, refers to the high-throughput extraction of quantitative morphological, intensity, and texture features from digitized histopathological images [8,9]. By converting H&E-stained tissue sections into mineable, standardized quantitative data, pathomics can capture subtle patterns of nuclear pleomorphism, spatial tissue architecture, and staining heterogeneity that escape visual assessment [8,9], and enables reproducible, benchmarked feature extraction [10]. Recent studies have demonstrated the feasibility of pathomic signatures for predicting treatment response and prognosis [11], as well as molecular alterations [12,13], in esophageal and other gastrointestinal cancers, and deep learning on H&E whole-slide images has identified cancerous and precancerous esophagus tissue [24] and predicted nodal metastasis from lymph-node sections in gastric cancer [25]. However, the application of pathomics to predict LNM specifically in ESCC remains underexplored.
In this study, we developed a pathomics-based signature derived from H&E-stained whole-slide images of primary ESCC tumors and integrated it with established clinicopathological predictors into a unified nomogram. Our primary objective was to evaluate whether quantitative pathomic features provide independent and incremental value beyond conventional clinical factors for predicting LNM. As a secondary objective, we assessed whether the pathomics signature could identify high-risk patients among those classified as node-negative by standard pathology, potentially guiding adjuvant therapy decisions.
2. Materials and Methods
This study was conducted and reported in accordance with the STROBE statement [26] (Strengthening the Reporting of Observational Studies in Epidemiology) and the TRIPOD statement [27] (Transparent Reporting of a multivariable prediction model for Individual Prognosis Or Diagnosis), and aligns with the REMARK reporting guidelines for tumor-marker prognostic studies [28].
2.1. Study design and patients
This retrospective study was conducted at Fujian Medical University Union Hospital and approved by the Institutional Review Board (approval no. 2024KY060). The requirement for informed consent was waived due to the retrospective nature of the study.
We consecutively enrolled 477 patients with histologically confirmed ESCC who underwent radical esophagectomy between 2012 and 2017. Inclusion criteria were: (1) primary ESCC confirmed by preoperative biopsy; (2) R0 resection achieved; (3) availability of H&E-stained tumor slides suitable for digital scanning; and (4) complete clinicopathological and follow-up data. Patients were excluded for two reasons: (i) receipt of neoadjuvant therapy before surgery, which precludes pathological assessment of lymph node metastasis in the resection specimen, or (ii) missing data in key variables (pathomic features, LNM status, or clinical covariates). A total of 61 patients were excluded for these reasons, and the final cohort comprised 416 patients (Figure 1).
2.2. Pathological Image Acquisition and Feature Extraction
Formalin-fixed paraffin-embedded (FFPE) tumor blocks were sectioned at 4 μm thickness and stained with H&E using a standardized protocol. Representative sections containing the largest cross-sectional area of the invasive tumor component were selected by an experienced pathologist blinded to clinical outcomes. Whole-slide images (WSIs) were acquired using a KFBIO KF-PRO-400-HI digital slide scanner (KFBIO, Ningbo, China) at 20× optical magnification (pixel resolution 0.5 μm/pixel).Image analysis was performed using QuPath (version 0.5.1) [14]. Nuclei were detected automatically using the hematoxylin optical density (OD) algorithm with the following parameters: pixel size 0.5 μm; background radius 8 μm; sigma 1.5 μm; OD threshold 0.1; maximum background intensity 2.0; remaining parameters at default values. Each WSI was partitioned into multiple tiles covering the full tumor area. For each tile, 41 pathomic features were extracted, encompassing nuclear morphology (area, perimeter, circularity, eccentricity, caliper dimensions), hematoxylin optical density (OD) metrics (sum, mean, standard deviation, minimum, maximum, range), eosin OD metrics (sum, mean, standard deviation, minimum, maximum, range), cytoplasmic OD metrics, and the nucleus-to-cell area ratio. Tile-level features were aggregated to the patient level by computing the mean value across all tiles per patient.
2.3. Clinical and Pathological Variables
The following clinicopathological variables were collected from medical records: age at surgery (continuous, years); sex (male/female); tumor location (upper/middle/lower thoracic esophagus); T category (dichotomized as T1/T2 vs. T3/T4 to avoid sparse-cell instability in advanced stages); histological grade (G1 well-differentiated, G2 moderately differentiated, G3 poorly differentiated/undifferentiated); and total number of lymph nodes retrieved. The primary endpoint was postoperative LNM status (pN0 vs. pN+) determined by histopathological examination according to the AJCC/UICC TNM classification system (8th edition). Secondary endpoints included overall survival (OS, defined as time from surgery to death from any cause) and progression-free survival (PFS, defined as time from surgery to first documented recurrence or death).
2.4. External Validation Cohort and Procedures
To assess transportability beyond the development center, the frozen combined nomogram — including the StandardScaler transform, the LASSO-selected pathomics weights, and the logistic regression coefficients — was applied without any refitting to an independent external cohort of 101 ESCC patients treated at a separate institution (Jiangsu), of whom 25 (24.8%) had pathologically confirmed LNM. Pathomic features were extracted from the external H&E whole-slide images using the identical QuPath pipeline and the same 41-feature set, and clinical variables were mapped onto the same schema used in the development cohort. Because the two centers used different slide scanners and H&E staining protocols, we evaluated — and, in exploratory analyses, attempted — batch-effect correction (ComBat) [29]; this did not improve external performance and was therefore not adopted, so all external results reflect the uncalibrated frozen model. External discrimination was summarized by AUC with 95% confidence intervals from 2,000 bootstrap resamples; calibration by slope, intercept, and Brier score; model comparison by DeLong’s test; and risk stratification by the same nomogram-score tertiles used internally, tested for trend by the Cochran-Armitage test.
2.5. Model Development and Statistical Analysis
All patients were included in both feature selection and model training; internal validation was performed by 10-fold stratified cross-validation (out-of-fold, OOF) so that every patient’s prediction was generated by a model trained on the remaining nine folds, avoiding information leakage. Feature selection (LASSO) and the nomogram coefficients were derived from the full cohort; these apparent (resubstitution) estimates are reported only to illustrate optimism, whereas all performance conclusions are based on the OOF predictions.
Feature selection was performed using LASSO (Least Absolute Shrinkage and Selection Operator) logistic regression with 5-fold cross-validation to identify the optimal penalization parameter (λ) minimizing the deviance. Features with non-zero coefficients at the optimal λ were retained, and their linear combination constituted the pathomics score (pathScore).
Three logistic regression models were developed and compared:
- Clinical model: sex, age, tumor location, T category, histological grade.
- Pathomics model: pathScore alone.
- Combined model: all clinical variables plus pathScore.
Discrimination was assessed by the area under the receiver operating characteristic curve (AUC). For internal validation, OOF AUCs with 95% confidence intervals (bootstrap, 2,000 resamples) were computed from the out-of-fold predictions; apparent (resubstitution) AUCs — obtained by refitting each model on the full cohort — were reported alongside to quantify optimism (apparent minus OOF). Pairwise comparison of models was performed using DeLong’s test [15]. Model calibration was assessed graphically by calibration plots and quantitatively by Brier scores. The net clinical benefit of each model was evaluated using decision curve analysis (DCA) [16].
The independent prognostic value of the pathomics score was tested by incorporating it into a multivariable logistic regression alongside clinical factors, reporting odds ratios (ORs) with 95% confidence intervals and Wald P-values. Incremental value was assessed by likelihood-ratio tests comparing nested models.
For risk stratification, patients were categorized into low-, intermediate-, and high-risk groups based on tertiles of the combined nomogram-predicted probability. The Cochran-Armitage test for trend was used to assess the monotonic relationship between risk group and LNM prevalence.
Secondary survival analyses were conducted: (1) within the pN0 subgroup, Kaplan-Meier curves and log-rank tests compared OS and PFS between patients dichotomized by the median pathScore within the pN0 subgroup (an exploratory, data-driven cutoff defined as the subgroup median); univariate Cox proportional hazards models reported hazard ratios (HRs) per 1-SD increase in continuous pathScore; and (2) across the entire cohort, Kaplan-Meier curves compared OS and PFS among the three nomogram-derived risk groups.
All statistical tests were two-sided, and P < 0.05 was considered statistically significant. Analyses were performed using Python (version 3.11.x) with scikit-learn, statsmodels, lifelines, and matplotlib.
3. Results
3.1. Patient Characteristics
Of 477 screened patients, 416 were included in the final analysis (Figure 1). The mean age was 58.5 years (SD 8.3), and 306 (73.6%) were male. Tumors were located in the middle thoracic esophagus in 256 (61.5%) patients, followed by lower (126, 30.3%) and upper (34, 8.2%) locations. Histological grades were predominantly G1 (174) and G2 (213), with G3 tumors accounting for 29 cases. The mean number of retrieved lymph nodes was 32.0 (SD 12.8).
LNM was identified in 217 patients (52.2%). Compared with node-negative patients, those with LNM were more likely to be male (79.7% vs. 66.8%), had more advanced T categories, higher-grade tumors, and a slightly greater number of retrieved lymph nodes (33.0 vs. 31.0). Detailed characteristics are summarized in Table 1.
3.2. Feature Selection and Pathomics Score Construction
From the initial pool of 41 candidate pathomic features, LASSO-logistic regression selected 17 non-zero features (Figure 2a) associated with LNM status when fitted on the full cohort (the apparent framework). The selected features predominantly captured nuclear shape irregularity (eccentricity, caliper dimensions), hematoxylin OD variation (reflecting chromatin density heterogeneity), and eosin OD distribution patterns (reflecting cytoplasmic texture). These features were linearly weighted by their LASSO coefficients to form a composite pathomics score (pathScore), which was then standardized (mean = 0, SD = 1) before incorporation into the combined model. Consistent with the pre-specified analytic plan, feature selection was performed on the full cohort; the resulting apparent estimates are shown only to illustrate the selected signature, whereas all performance and incremental-value conclusions in this study are based on cross-validated out-of-fold (OOF) predictions.
3.3. Multivariable Analysis and Model Performance
In multivariable logistic regression (Table 2), the pathomics score emerged as the strongest independent predictor of LNM (adjusted OR 2.47, 95% CI 1.80–3.39; P < 0.001), followed by T category (OR 2.39, 95% CI 1.79–3.20; P < 0.001) and histological grade (OR 1.37, 95% CI 1.07–1.75; P = 0.013). Sex, age, and tumor location did not reach statistical significance. The addition of the pathomics score to the clinical model yielded significant improvement in fit (likelihood-ratio χ2 = 35.5; P = 2.56e-09).
Across 10-fold cross-validation, the combined model achieved an out-of-fold AUC of 0.821 (95% CI 0.779–0.858), which was significantly superior to the pathomics-only model (AUC 0.762, 95% CI 0.715–0.806; DeLong P = 0.0006), while showing comparable discrimination to the clinical model (AUC 0.791, 95% CI 0.744–0.835; P = 0.039). The apparent (resubstitution) AUC of the combined model was 0.847, indicating a modest optimism of +0.026 that was mitigated by cross-validation. The Brier score for the combined model was 0.173, and the calibration slope and intercept were 0.869 and 0.019, respectively, indicating that predicted probabilities were well calibrated (slope near 1, intercept near 0) (Figure 3a).
Because apparent (resubstitution) AUCs are optimistically inflated by refitting the model on the full cohort, all performance and incremental-value conclusions in this manuscript are based on the cross-validated out-of-fold estimates. The apparent (solid) curves in Figure 2b are reported only to convey the magnitude of optimism relative to the OOF (dashed) curves.
To quantify the clinical benefit of integrating pathomics into clinical prediction, we computed the net reclassification improvement (NRI), integrated discrimination improvement (IDI), and ΔAUC (Figure 2c, d). Compared with the clinical model alone, adding pathomics yielded a modest but statistically significant ΔAUC of 0.029 (DeLong P = 0.0389), NRI = 0.048 (95% CI -0.039–0.164), and IDI = 0.0411 (95% CI 0.0137–0.0669). In contrast, the improvement over the pathomics-only model was more substantial: ΔAUC = 0.058 (DeLong P = 0.0006), NRI = 0.135 (95% CI 0.000–0.235), and IDI = 0.1280 (95% CI 0.0969–0.1579). These findings indicate that clinicopathological and pathomic information are complementary rather than redundant: each contributes independent signal, and their integration—not either modality alone—yields the strongest discrimination. Pathomics thus provides a small but statistically robust increment to established clinicopathological risk assessment.
3.4. Risk Stratification
Patients were stratified into three risk groups based on tertiles of the combined nomogram score. The observed LNM prevalence increased monotonically from 15.8% in the low-risk group (n = 139) to 55.1% in the intermediate-risk group (n = 138) and 85.6% in the high-risk group (n = 139); Cochran-Armitage trend P < 0.001 (Figure 3c). This gradient demonstrates the nomogram’s ability to effectively discriminate patients across the full spectrum of LNM risk. The resulting nomogram, integrating clinical variables with the pathomics score, is presented in Figure 4.
3.5. Survival Analysis in the pN0 Subgroup
Among the 199 node-negative patients, we examined whether the pathomics score could identify a subset at elevated risk of poor survival despite being classified as conventionally ‘low-risk’. Using the subgroup median pathScore as an exploratory, data-driven cutoff, 99 patients were classified as high-risk and 100 as low-risk.
High-risk pN0 patients had significantly worse overall survival than their low-risk counterparts (3-year OS: 77.2% vs. 94.3%; log-rank P = 0.005; HR per 1-SD increase = 1.49, 95% CI 1.07–2.05; P = 0.016). A similar pattern was observed for progression-free survival (3-year PFS: 75.5% vs. 88.9%; log-rank P = 0.007; HR = 1.41, 95% CI 1.05–1.88; P = 0.020) (Figure 5a, b).
In contrast, among pN+ patients (n = 217), the pathomics score showed no significant association with OS (log-rank P = 0.199), and only a weak association with PFS (log-rank P = 0.039). This is consistent with the interpretation that the pathomics signature largely encodes tumor invasiveness and metastatic propensity — information that is already captured once nodal metastasis is established (pN+) — so little independent prognostic signal remains within this subgroup; the mechanistic implication is discussed below.
3.6. Whole-Cohort Prognostic Stratification
When the entire cohort was stratified by the combined nomogram risk groups, a robust prognostic gradient emerged. For overall survival, the 3-year OS rates were 89.2% (low-risk), 64.9% (intermediate-risk), and 57.1% (high-risk); log-rank P < 0.001 (Figure 5c). The corresponding 3-year PFS rates were 85.5%, 61.0%, and 50.9%; log-rank P < 0.001 (Figure 5d). These findings indicate that the combined model captures biological aggressiveness relevant not only to nodal status but also to long-term survival.
3.7. External Validation
To assess transportability, we applied the frozen combined nomogram to an independent external cohort of 101 ESCC patients treated at a separate institution, of whom 25 (24.8%) had pathologically confirmed LNM. The combined model attained an external AUC of 0.774 (95% CI 0.663–0.870), which was lower than its internal OOF estimate of 0.821 and below the external clinical-only model (0.801, 95% CI 0.693–0.895; DeLong P = 0.008). The pathomics-alone model performed least well externally (AUC 0.685, 95% CI 0.555–0.802; DeLong vs. combined P < 0.001), indicating that the pathomics signature did not generalize to the external center (Table S1). Calibration was suboptimal (slope 0.459, intercept 5.331, Brier 0.247), reflecting systematic over-optimism of the internally derived probabilities when applied elsewhere (Figure S1b). Nevertheless, external risk stratification by nomogram tertiles remained informative: observed LNM prevalence was 8.8% (low-risk, n = 34), 15.2% (intermediate-risk, n = 33), and 50.0% (high-risk, n = 34); Cochran-Armitage trend P < 0.001 (Figure S1a). These findings position the present work as a single-center proof-of-concept: the clinical component transports reasonably, whereas the pathomics component requires multi-center harmonization before it can be relied upon externally.
4. Discussion
In this study, we built a combined clinical-pathomics nomogram to predict LNM in a single-center cohort of 416 ESCC patients who underwent radical esophagectomy, and we tested it in an independent external cohort. Three findings stand out. First, the pathomics signature, derived entirely from routine H&E-stained primary tumor slides, carries independent predictive value beyond established clinicopathological factors (adjusted OR 2.47, P < 0.001). Second, the combined model showed good discriminative performance (out-of-fold AUC 0.821) with well-behaved calibration and a clear risk gradient across tertiles (LNM prevalence 15.8% → 55.1% → 85.6%). Third, the signature identified a subset of node-negative patients at markedly higher risk of death and recurrence (3-year OS 77.2% vs. 94.3%), which could help guide adjuvant-therapy decisions in this conventionally ‘low-risk’ group. We stress that the combined model’s absolute gain over the clinical model was modest (ΔAUC ≈ 0.03); decision curve analysis showed net benefit across most threshold probabilities, yet the clinical value of this increment still needs prospective confirmation.
The external validation exposes a clear weakness in the pathomics component. Its AUC fell to 0.685, well below the combined model’s 0.774, and the combined model no longer beat the clinical model (DeLong P = 0.008). This pattern fits center-specific differences in slide scanning and H&E staining that change nuclear optical-density features. In short, the signature is valuable at our center but cannot be assumed to transfer without recalibration or harmonization. That caveat tempers the single-center findings without invalidating them.
The modest absolute ΔAUC needs context. Rank-based AUC alone understates what pathomics adds; metrics that gauge individualized risk estimation tell a clearer story. Adding the pathomics score to the clinical model improved discrimination on every complementary metric: out-of-fold ΔAUC = 0.029 (DeLong P = 0.0389), and the integrated discrimination improvement was significant (IDI = 0.0411, 95% CI 0.0137–0.0669; P < 0.001). IDI matters most at the bedside because it captures how much each patient’s predicted LNM probability improves on a continuous scale, exactly what a nomogram reports. The net reclassification improvement was not significant (NRI = 0.048, 95% CI −0.039–0.164); NRI depends on arbitrary risk thresholds (we used data-driven tertiles) and is less sensitive than IDI to small, gradual probability shifts, so its null result is not inconsistent with the significant IDI and ΔAUC. Together with the incremental likelihood-ratio test for the pathomics score (χ2 = 35.5, P = 2.6e-09), these results show that pathomics contributes independent signal beyond T stage, grade, and other routine variables. The combined model also beat both single-modality baselines (over the pathomics-only model: ΔAUC = 0.058, P < 0.001; over the clinical model: ΔAUC = 0.029, P = 0.0389), confirming that pathomics and clinicopathological features are complementary, not redundant. Because the signature comes from one routine H&E slide with no bespoke hardware, it is a low-barrier adjunct that can sharpen individualized LNM risk estimates where current models leave uncertainty, most visibly in the pN0 subgroup where staging is uninformative yet outcomes vary widely.
Our selected pathomic features are biologically plausible. The LASSO signature concentrates on nuclear shape irregularity (eccentricity, caliper dimensions), hematoxylin OD variability (chromatin texture and nuclear membrane integrity), and eosin OD distribution (cytoplasmic and stromal patterns). These traits encode cellular atypia and architectural disorganization that pathologists have long linked to aggressive tumor behavior [22,23]. The link is not metaphorical: decades ago, nuclear morphometry of superficial ESCC already showed that nuclear area and shape factor separate tumors with and without nodal metastasis [17]; across carcinomas, chromatin fractal dimension is an independent prognostic factor that mechanically ties architectural complexity to aggressive biology [23]; and the ratio of metastatic to examined nodes refines risk beyond raw counts [18]. Pathomics adds the ability to quantify these patterns objectively and reproducibly across thousands of cells per slide, capturing heterogeneity that subjective grading misses.
Our results fit within and extend the computational-pathology literature on esophageal cancer. Deep learning on H&E slides now predicts treatment response [11], prognosis [12], and molecular alterations [13] in esophageal and gastroesophageal junction cancers; multicenter AI systems improve preoperative nodal diagnosis in ESCC [31]; and multiple-instance learning on whole-slide images predicts nodal metastasis in ESCC [30]. Our single-center, interpretable nuclear-morphometry approach complements these heavier pipelines. Most prior work, however, depends on convolutional networks that need large samples and heavy computation. Our method uses handcrafted nuclear features from widely available software (QuPath) and runs without dedicated GPU infrastructure, making it more accessible and interpretable. That such simple features still yield an OR > 2 for LNM implies a sizable share of metastatic potential resides in basic nuclear phenotypes.
Measured against published CT-radiomics nomograms for ESCC LNM, our out-of-fold AUCs (pathomics-alone 0.762; combined 0.821) sit squarely within the reported range. Tan et al. [21] reached a test AUC of 0.773 for a radiomics nomogram in resectable ESCC, showing that H&E-derived nuclear features match cross-sectional radiomics without dedicated imaging. Newer CT-radiomics studies report higher values, but cohort and stage differences block direct comparison. Against H&E-based deep learning, Ren et al. [20] reported an internal-test AUC of 0.949 for LNM in T1 ESCC from whole-slide images, yet that work studied a narrower, earlier-stage (endoscopic-resection) population where the task is easier; the higher AUC reflects both the network and the homogeneous low-stage cohort, not a head-to-head win over routine nuclear morphometry. Taken together, single-section pathomic features give LNM discrimination on par with radiomics and form a practical, low-cost complement to clinical staging, though external validation is still required before any superiority claim. The pN0 subgroup deserves particular attention. Guidelines recommend observation, not adjuvant therapy, for completely resected node-negative ESCC, yet up to one-third of these patients still recur [19]. Our data suggest that primary-tumor pathomic analysis could flag the pN0 patients at high enough risk to warrant closer surveillance or adjuvant treatment. If confirmed prospectively, this approach could refine management without extra invasive procedures or molecular assays.
One boundary condition on pathScore’s prognostic value deserves emphasis. Within the pN+ subgroup, pathScore did not predict survival, yet it sharply stratified the pN0 subgroup. The simplest explanation is that pathScore largely encodes tumor invasiveness and metastatic propensity, information already captured once nodal metastasis is present, so little independent prognostic signal remains in pN+ patients. Far from undermining pathScore’s intended use (preoperative nodal prediction), this shows that pathScore and pN status are mechanistically aligned rather than independent markers. A natural next step is to test whether pathScore keeps independent prognostic value in external pN+ cohorts enriched for covariates such as metastatic-node count, adjuvant treatment, and molecular subtype, and whether it predicts non-survival endpoints like adjuvant-therapy response.
This study has several limitations. First, the external cohort was small (n = 101; events = 25), and the combined model’s external AUC (0.774) fell below both its internal OOF estimate (0.821) and the external clinical model (0.801); the pathomics signature in particular transported poorly (external AUC 0.685), probably because of center-specific scanner and staining differences. Multi-center validation with prospective harmonization of image acquisition is still needed to prove generalizability. Second, the retrospective design carries selection bias, and excluding mostly incomplete-data patients may have enriched the cohort toward earlier, better-documented cases. Third, features came from one representative section per patient, which may miss intratumoral heterogeneity; calibration (Brier score, calibration plot, intercept, and slope in Figure 3a) was generally good, but these metrics still need external validation. Fourth, although the QuPath detection pipeline is standardized, inter-observer variation in region-of-interest selection could affect reproducibility; fully automated tumor segmentation should be explored. Fifth, whether the modest incremental gain over the clinical model (ΔAUC ≈ 0.03) justifies the cost of slide digitization and feature extraction remains to be tested in prospective trials that ask whether pathomics-guided decisions improve outcomes.
Even with these limitations, this study shows that quantitative pathomic analysis of routine H&E slides provides a modest but statistically robust increment to standard clinicopathological assessment for LNM prediction in ESCC. Clinically, the pathomic-augmented nomogram singles out node-negative patients at elevated risk of poor outcomes—a subgroup current staging cannot flag—supporting a targeted-surveillance role that complements, rather than replaces, pathology review. Because the pathomic signature transported poorly across centers whereas the clinical component did not, multi-center harmonization of staining and scanning is the rate-limiting step before deployment. Future work should pursue deep-learning feature extraction for possible performance gains, test this targeted-surveillance strategy prospectively in high-risk node-negative patients, and establish standardized image-acquisition protocols that let the signature travel.
5. Conclusions
We developed and internally validated a pathomics-clinical integrated nomogram for predicting LNM in ESCC. The pathomics signature, derived from routine H&E slides via QuPath-based nuclear morphometric analysis, serves as an independent predictor of nodal metastasis (OR 2.47, P < 0.001) and identifies high-risk patients within the conventionally node-negative population. These findings support the potential role of pathomics as a practical, cost-effective complement to current staging systems for refined risk stratification in ESCC. Multi-center prospective validation is warranted to confirm generalizability and assess clinical impact.
Supplementary Materials
The following supporting information can be downloaded at the website of this paper posted on Preprints.org. Figure S1. External validation on an independent cohort of 101 patients. (a) Receiver operating characteristic curves for the three models. (b) Calibration plot of the combined model (observed vs. predicted LNM probability); Table S1. External validation performance (independent cohort, N = 101). AUCs with 95% CIs from 2,000 bootstrap resamples. Brier score and calibration slope/intercept are reported for the com-bined model; the pathomics and clinical models are shown for discrimination comparison.
Author Contributions
Kaiming Peng, Jieming Lu and Peipei Zhang contributed equally to this work. Kaiming Peng and Shuchen Chen conceived the study. Jieming Lu and Peipei Zhang collected and analyzed the data. Weiguang Zhang, Jinlong Fang and Junhuang Lin assisted with data interpretation. Mingqiang Kang supervised the project. All authors contributed to drafting and editing the manuscript. All authors read and approved the final manuscript.
Funding
This work was supported by the Joint Funds for the Innovation of Science and Technology, Fujian Province (grant no. 2024Y9267). The funder had no role in study design, data collection, analysis, interpretation, or writing.
Institutional Review Board Statement
This study was approved by the Institutional Review Board of Fujian Medical University Union Hospital (approval no. 2024KY060, issued 14 March 2024), and was conducted in accordance with the Declaration of Helsinki. The requirement for informed consent was waived by the IRB owing to the retrospective, non-interventional design and the use of fully anonymized data.
Informed Consent Statement
Informed consent was waived by the Institutional Review Board of Fujian Medical University Union Hospital (approval no. 2024KY060) because of the retrospective design and the anonymized nature of the data. No identifiable patient information is reported.
Data Availability Statement
The anonymized clinicopathological dataset and the extracted pathomic feature matrix supporting the findings of this study are available from the corresponding author upon reasonable request, subject to institutional data-sharing approval. The whole-slide images cannot be made publicly available owing to patient-privacy restrictions.
Code Availability
The analysis code is available from the corresponding author upon reasonable request and is not publicly available.
Acknowledgments
In this section, you can acknowledge any support given which is not covered by the author contribution or funding sections. This may include administrative and technical support, or donations in kind (e.g., materials used for experiments). Where GenAI has been used for purposes such as generating text, data, or graphics, or for study design, data collection, analysis, or interpretation of data, please add “During the preparation of this manuscript/study, the author(s) used [tool name, version information] for the purposes of [description of use]. The authors have reviewed and edited the output and take full responsibility for the content of this publication.”.
Conflicts of Interest
The authors declare that they have no competing interests.
Abbreviations
The following abbreviations are used in this manuscript:
| ESCC | Esophageal squamous cell carcinoma |
| LNM | Lymph node metastasis |
| H&E | Hematoxylin and eosin |
| WSI | Whole-slide image |
| OD | Optical density |
| LASSO | Least absolute shrinkage and selection operator |
| AUC | Area under the receiver operating characteristic curve |
| CI | Confidence interval |
| OR | Odds ratio |
| HR | Hazard ratio |
| OS | Overall survival |
| PFS | Progression-free survival |
| DCA | Decision curve analysis |
| KM | Kaplan-Meier |
| pN0 | Pathologically node-negative |
| pN+ | Pathologically node-positive |
| SD | Standard deviation |
| TNM | Tumor-node-metastasis |
| AJCC | American Joint Committee on Cancer |
| UICC | Union for International Cancer Control |
| FFPE | Formalin-fixed paraffin-embedded |
| CT | Computed tomography |
| PET | Positron emission tomographyV |
| EUS | Endoscopic ultrasonography |
References
- Sung, H.; Ferlay, J.; Siegel, R.L.; et al. Global Cancer Statistics 2020: GLOBOCAN estimates of incidence and mortality worldwide for 36 cancers in 185 countries. CA Cancer J. Clin. 2021, 71(3), 209–49. [Google Scholar] [CrossRef] [PubMed]
- Arnold, M.; Pandeya, N.; Byrnes, G.; et al. Global burden of oesophageal cancer: has incidence now risen above gastric cancer? Ann. Oncol. 2020, 31(3), 388–97. [Google Scholar]
- Hagens, E.R.; Rura van der Marel, A.P.; Bootsma, G.E.; et al. Prognostic lymph node examination in esophageal cancer surgery. Ann. Surg. Oncol. 2020, 27(13), 4982–90. [Google Scholar] [CrossRef]
- Mariette, C.; Piessen, G.; Briet, N.; et al. The number of metastatic lymph nodes and the ratio between metastatic and examined lymph nodes are independent prognostic factors in esophageal cancer regardless of neoadjuvant chemoradiation or lymphadenectomy extent. Ann. Surg. 2008, 248(3), 456–65. [Google Scholar] [CrossRef]
- van Vliet, E.P.; Heijenbrok-Kal, M.H.; Hunink, M.G.; et al. Staging investigations for oesophageal cancer: a meta-analysis. Br. J. Cancer 2008, 98(3), 547–57. [Google Scholar] [CrossRef]
- Lerut, T.; Coosemans, W.; Decker, G.; et al. Extended lymphadenectomy for cancer of the esophagus and gastroesophageal junction in 174 R0 resections: impact on staging, disease-free survival, and outcome: a plea for adequate pathology. J. Thorac. Cardiovasc Surg. 2004, 128(6), 859–66. [Google Scholar]
- Rice, T.W.; Patil, D.T.; Blackstone, E.H. 8th edition AJCC/UICC staging of cancers of the esophagus and esophagogastric junction. Ann. Thorac. Surg. 2017, 103(6), 1834–41. [Google Scholar]
- Gurcan, M.N.; Boucheron, L.E.; Can, A.; et al. Histopathological image analysis: a review. IEEE Rev. BioMed Eng. 2009, 2, 147–71. [Google Scholar] [CrossRef]
- Schmauch, B.; Romagnoni, A.; Pronier, E.; et al. A deep learning model to predict RNA-Seq expression of tumours from whole slide images. Nat. Commun. 2020, 11, 3877. [Google Scholar] [CrossRef]
- Zwanenburg, A.; Vallières, M.; Abdalah, M.A.; Aerts, H.J.W.L.; Andrearczyk, V.; Apte, A.; et al. The Image Biomarker Standardization Initiative: standardized quantitative radiomics for high-throughput image-based phenotyping. Radiology 2020, 295(2), 328–38. [Google Scholar] [CrossRef] [PubMed]
- Li, B.; Qin, W.; Yang, L.; Li, H.; Jiang, C.; Yao, Y.; et al. From pixels to patient care: deep learning-enabled pathomics signature offers precise outcome predictions for immunotherapy in esophageal squamous cell cancer. J. Transl. Med. 2024, 22, 195. [Google Scholar] [CrossRef]
- Cui, H.; Zhu, Z.; Xu, E.; Qi, L.; Cheng, Y.; Zhang, Y.; et al. The consensus molecular subtypes of esophageal squamous cell carcinoma. Signal Transduct. Target Ther. 2026, 11, 65. [Google Scholar] [CrossRef]
- Kather, J.N.; et al. Deep learning can predict microsatellite instability directly from histology in gastrointestinal cancers. Nat. Med. 2019, 25(7), 1054–1056. [Google Scholar] [CrossRef] [PubMed]
- Bankhead, P.; Loughrey, M.B.; Fernández, J.A.; et al. QuPath: Open source software for digital pathology image analysis. Sci. Rep. 2017, 7, 16878. [Google Scholar] [CrossRef]
- DeLong, E.R.; DeLong, D.M.; Clarke-Pearson, D.L. Comparing the areas under two or more correlated receiver operating characteristic curves: a nonparametric approach. Biometrics 1988, 44(3), 837–45. [Google Scholar] [CrossRef]
- Vickers, A.J.; Elkin, E.B. Decision curve analysis: a novel method for evaluating prediction models. Med. Decis. Mak. 2006, 26(6), 565–74. [Google Scholar] [CrossRef] [PubMed]
- Tajima, Y.; Nakanishi, Y.; Ochiai, A.; Tachimori, Y.; Kato, H.; Watanabe, H.; et al. Histopathologic findings predicting lymph node metastasis and prognosis of patients with superficial esophageal carcinoma: analysis of 240 surgically resected tumors. Cancer 2000, 88(6), 1285–1293. [Google Scholar]
- Huang, J.; Hu, W.; Pang, L.; Chen, J.; Yang, H. Value of positive lymph node ratio for predicting postoperative distant metastasis and prognosis in esophageal squamous cell carcinoma. Oncol. Res. Treat. 2015, 38(9), 424–428. [Google Scholar] [CrossRef]
- Mariette, C.; Balon, J.M.; Piessen, G.; Fabre, S.; Van Seuningen, I.; Triboulet, J.P. Pattern of recurrence following complete resection of esophageal carcinoma and factors predictive of recurrent disease. Cancer 2003, 97(7), 1616–1623. [Google Scholar] [CrossRef]
- Ren, L.H.; Ding, Y.; Zhang, Y.X.; Teng, K.H.; Wang, L.; Zhang, W.Y.; et al. Artificial intelligence-driven prediction of lymph node metastasis in T1 esophageal squamous cell carcinoma using whole slide images. npj Precis Oncol. 2025, 9(1), 403. [Google Scholar] [CrossRef]
- Tan, X.; Ma, Z.; Yan, L.; Ye, W.; Liu, Z.; Liang, C.; et al. Radiomics nomogram outperforms size criteria in discriminating lymph node metastasis in resectable esophageal squamous cell carcinoma. Eur. Radiol. 2019, 29(1), 392–400. [Google Scholar] [CrossRef]
- Maesawa, C.; Tamura, G.; Monma, N.; Satodate, R.; Ishida, K.; Saito, K. Nuclear morphometric and DNA content analyses of cancer cells in superficial esophageal cancer with reference to lymph node metastasis. Jpn. J. Surg. 1991, 92(7), 807–812. [Google Scholar]
- Bedin, V.; Adam, R.L.; de Sá, B.C.; Landman, G.; Metze, K. Fractal dimension of chromatin is an independent prognostic factor for survival in melanoma. BMC Cancer 2010, 10, 260. [Google Scholar] [CrossRef]
- Tomita, N.; Abdollahi, B.; Wei, J.; Ren, B.; Suriawinata, A.; Hassanpour, S.; et al. Attention-based deep neural networks for detection of cancerous and precancerous esophagus tissue on histopathological slides. JAMA Netw. Open 2019, 2(12), e1914645. [Google Scholar] [CrossRef]
- Wang, S.; Zhu, Y.; Li, H.; et al. Predicting gastric cancer outcome from resected lymph node histopathology images using deep learning. Nat. Commun. 2021, 12, 1637. [Google Scholar] [CrossRef]
- von Elm, E.; Altman, D.G.; Egger, M.; Pocock, S.J.; Gøtzsche, P.C.; Vandenbroucke, J.P.; STROBE Initiative. The Strengthening the Reporting of Observational Studies in Epidemiology (STROBE) statement: guidelines for reporting observational studies. Lancet 2007, 370(9596), 1453–1457. [Google Scholar] [CrossRef] [PubMed]
- Collins, G.S.; Reitsma, J.B.; Altman, D.G.; Moons, K.G.M. Transparent Reporting of a multivariable prediction model for Individual Prognosis Or Diagnosis (TRIPOD): the TRIPOD Statement. Ann. Intern Med. 2015, 162(1), 55–63. [Google Scholar] [CrossRef]
- McShane, L.M.; Altman, D.G.; Sauerbrei, W.; Taube, S.E.; Gion, M.; Clark, G.M. National Cancer Institute Prostate-Specific Antigen Working Group. REporting recommendations for tumor MARKer prognostic studies (REMARK). Nat. Clin. Pract. Oncol. 2005, 2(8), 416–422. [Google Scholar]
- Johnson, W.E.; Li, C.; Rabinovic, A. Adjusting batch effects in microarray expression data using empirical Bayes methods. Biostatistics 2007, 8(1), 118–127. [Google Scholar] [CrossRef]
- Kang, H.; Yang, M.; Zhang, F.; Xu, H.; Ren, S.; Li, J.; et al. Identification of lymph node metastasis in esophageal squamous cell carcinoma using whole slide images and a hybrid network of multiple instance and transfer learning. BioMed Signal Process Control 2023, 85, 104577. [Google Scholar]
- Zhang, S.Y.; Wang, S.Y.; Zhang, J.; Dong, D.; Mu, W.; Xia, X.E.; et al. Artificial intelligence-based computer-aided diagnosis system supports diagnosis of lymph node metastasis in esophageal squamous cell carcinoma: a multicenter study. Heliyon 2023, 9(3), e14030. [Google Scholar] [CrossRef]
Figure 1.
STROBE flow diagram of patient enrollment and cohort partitioning. (a) Development cohort (single-center, Institution A): 477 patients assessed, 61 excluded for missing pathomics/clinical data, 416 included in the final analysis. (b) Independent external validation cohort (Institution B, Jiangsu): 104 patients assessed, 3 excluded for missing data, 101 included.
Figure 1.
STROBE flow diagram of patient enrollment and cohort partitioning. (a) Development cohort (single-center, Institution A): 477 patients assessed, 61 excluded for missing pathomics/clinical data, 416 included in the final analysis. (b) Independent external validation cohort (Institution B, Jiangsu): 104 patients assessed, 3 excluded for missing data, 101 included.
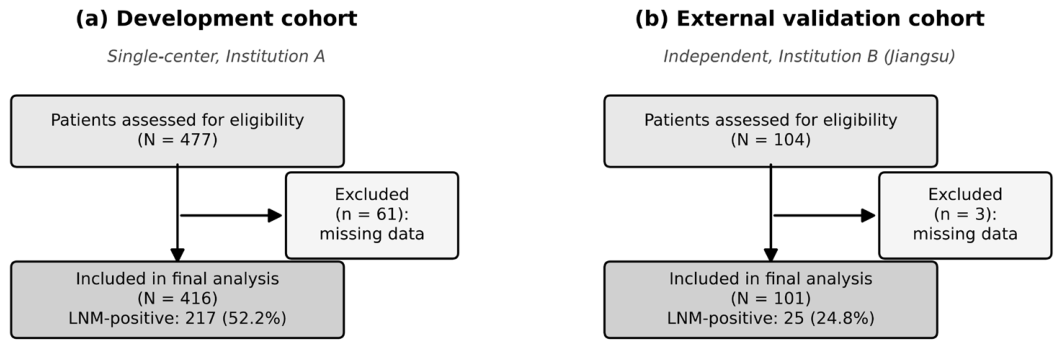
Figure 2.
Pathomic feature selection and model discrimination. (a) LASSO coefficient regularization path; each line shows the trajectory of one pathomic feature’s coefficient as the penalty relaxes (log10 C increases left→right), and the vertical dashed line marks the optimal penalty (λ) selected by 5-fold cross-validation, at which 17 features (red) remain in the model; grey lines denote features shrunk to zero. (b) Receiver operating characteristic (ROC) curves of the three models (N=416); solid lines show apparent (resubstitution) estimates and dashed lines show cross-validated out-of-fold (OOF) estimates (combined OOF AUC = 0.821, 95% CI 0.779–0.858). (c) Incremental ΔAUC (out-of-fold) of the combined model over single-modality baselines, with DeLong P values. (d) Net reclassification improvement (NRI) and integrated discrimination improvement (IDI); bootstrap B=2000.
Figure 2.
Pathomic feature selection and model discrimination. (a) LASSO coefficient regularization path; each line shows the trajectory of one pathomic feature’s coefficient as the penalty relaxes (log10 C increases left→right), and the vertical dashed line marks the optimal penalty (λ) selected by 5-fold cross-validation, at which 17 features (red) remain in the model; grey lines denote features shrunk to zero. (b) Receiver operating characteristic (ROC) curves of the three models (N=416); solid lines show apparent (resubstitution) estimates and dashed lines show cross-validated out-of-fold (OOF) estimates (combined OOF AUC = 0.821, 95% CI 0.779–0.858). (c) Incremental ΔAUC (out-of-fold) of the combined model over single-modality baselines, with DeLong P values. (d) Net reclassification improvement (NRI) and integrated discrimination improvement (IDI); bootstrap B=2000.
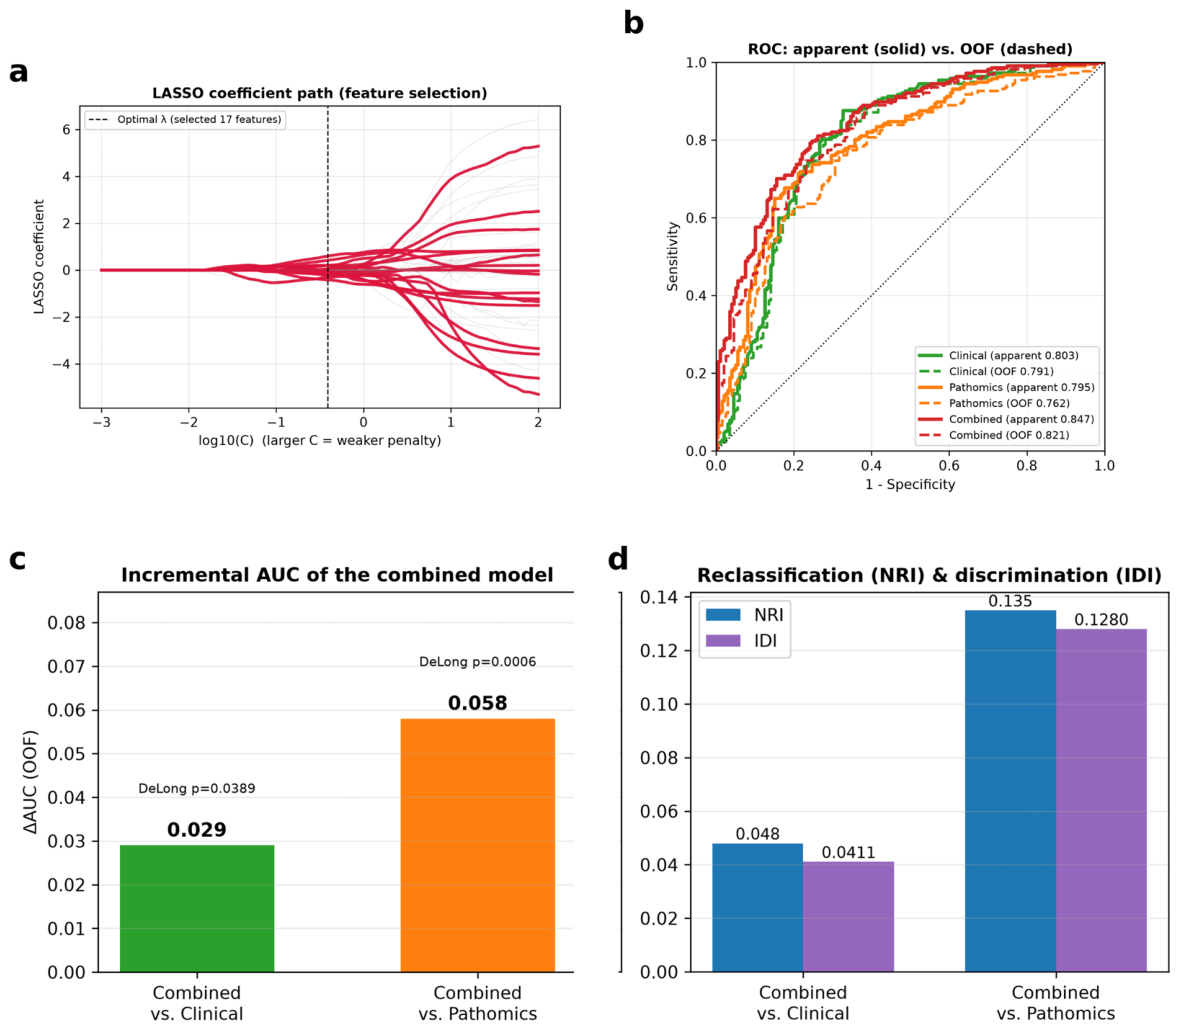
Figure 3.
Clinical utility of the combined nomogram based on out-of-fold predictions. (a) Calibration plot; the diagonal dashed line represents perfect calibration. Calibration intercept (calibration-in-the-large) = 0.019 and slope = 0.869, indicating that predicted probabilities are close to ideal (intercept ≈ 0, slope ≈ 1). (b) Decision curve analysis comparing the net clinical benefit of the three models across threshold probabilities. (c) LNM prevalence across nomogram-defined risk groups (low 15.8%, intermediate 55.1%, high 85.6%; Cochran-Armitage trend P < 0.001).
Figure 3.
Clinical utility of the combined nomogram based on out-of-fold predictions. (a) Calibration plot; the diagonal dashed line represents perfect calibration. Calibration intercept (calibration-in-the-large) = 0.019 and slope = 0.869, indicating that predicted probabilities are close to ideal (intercept ≈ 0, slope ≈ 1). (b) Decision curve analysis comparing the net clinical benefit of the three models across threshold probabilities. (c) LNM prevalence across nomogram-defined risk groups (low 15.8%, intermediate 55.1%, high 85.6%; Cochran-Armitage trend P < 0.001).
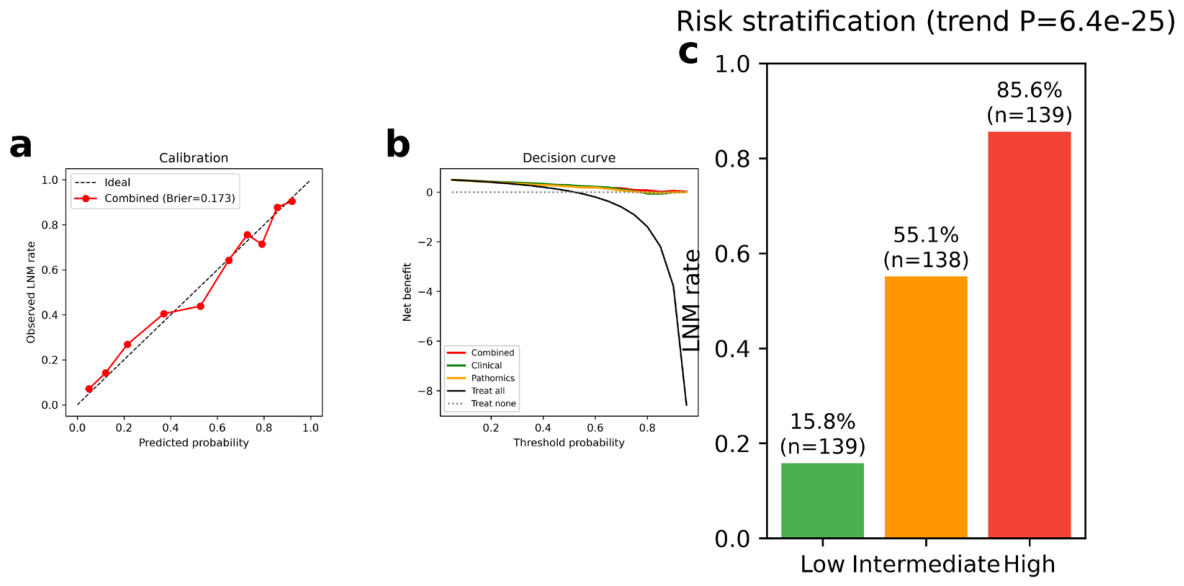
Figure 4.
Nomogram integrating clinical variables and pathomics score for predicting LNM. To use: locate each variable on its axis, draw a vertical line upward to the ‘Points’ axis to obtain the point value, sum all points, locate the total on the ‘Total Points’ axis, and read the corresponding predicted LNM probability.
Figure 4.
Nomogram integrating clinical variables and pathomics score for predicting LNM. To use: locate each variable on its axis, draw a vertical line upward to the ‘Points’ axis to obtain the point value, sum all points, locate the total on the ‘Total Points’ axis, and read the corresponding predicted LNM probability.
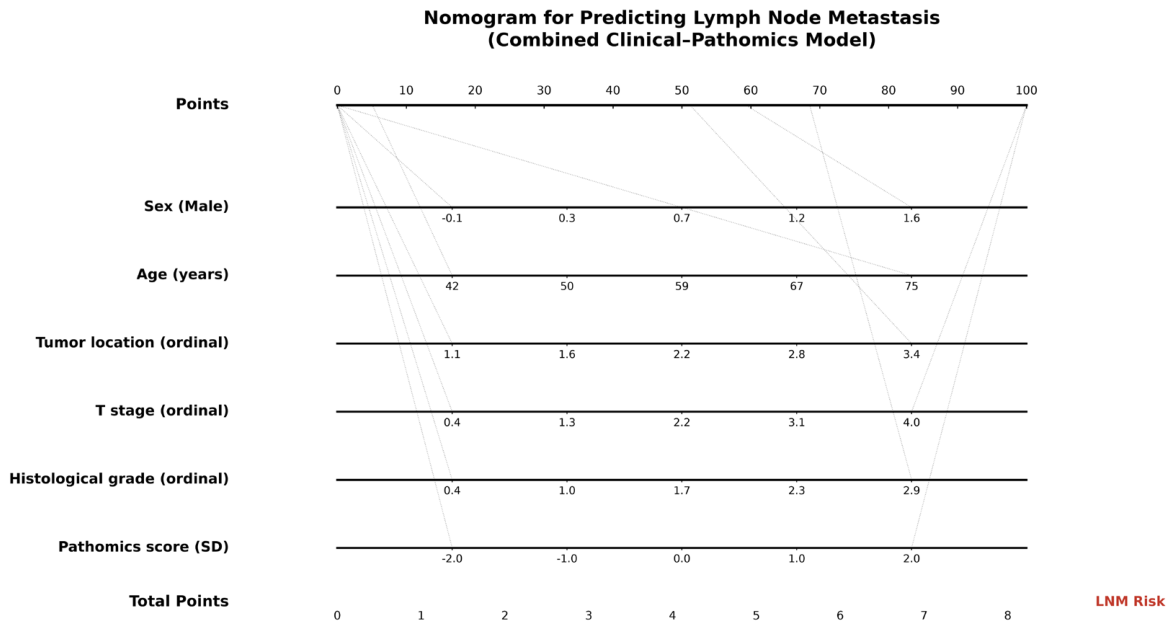
Figure 5.
Kaplan-Meier survival curves. (a, b) pN0 subgroup (n=199) stratified by pathomics risk (median pathScore cutoff): (a) overall survival (log-rank P = 0.005); (b) progression-free survival (log-rank P = 0.007). (c, d) Whole cohort (N=416) stratified by nomogram-defined risk groups: (c) overall survival (3-year OS 89.2% / 64.9% / 57.1% for low / intermediate / high risk; log-rank P < 0.001); (d) progression-free survival (3-year PFS 85.5% / 61.0% / 50.9%; log-rank P < 0.001).
Figure 5.
Kaplan-Meier survival curves. (a, b) pN0 subgroup (n=199) stratified by pathomics risk (median pathScore cutoff): (a) overall survival (log-rank P = 0.005); (b) progression-free survival (log-rank P = 0.007). (c, d) Whole cohort (N=416) stratified by nomogram-defined risk groups: (c) overall survival (3-year OS 89.2% / 64.9% / 57.1% for low / intermediate / high risk; log-rank P < 0.001); (d) progression-free survival (3-year PFS 85.5% / 61.0% / 50.9%; log-rank P < 0.001).
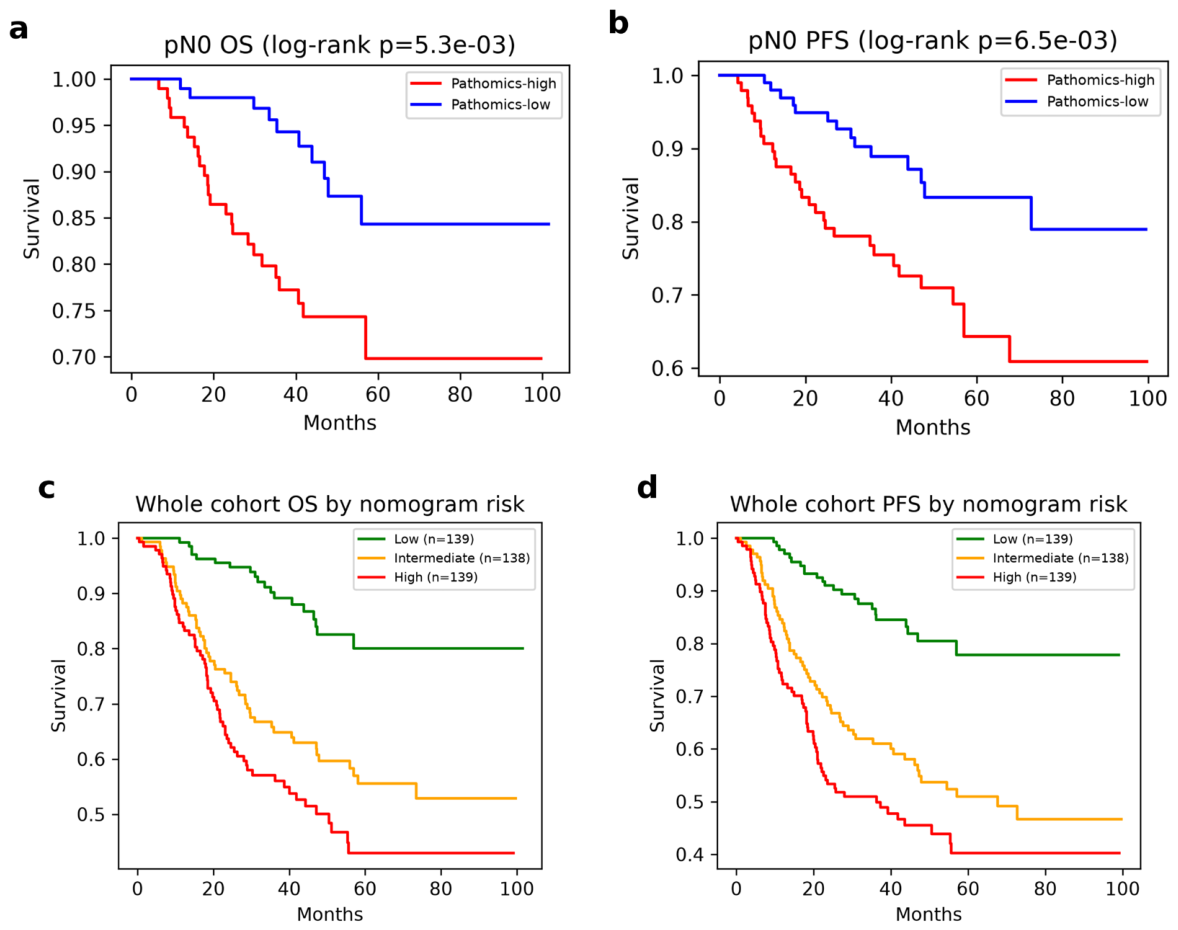

Table 1.
Baseline characteristics of the study cohort.
| Variable | Overall (N=416) | pN0 (n=199) | pN+ (n=217) |
| Age, years, mean ± SD | 58.5 ± 8.3 | 58.8 ± 8.3 | 58.2 ± 8.4 |
| Sex, male, n (%) | 306 (73.6%) | 133 (66.8%) | 173 (79.7%) |
| Tumor location, n (%) | |||
| Upper | 34 (8.2%) | 17 (8.5%) | 17 (7.8%) |
| Middle | 256 (61.5%) | 129 (64.8%) | 127 (58.5%) |
| Lower | 126 (30.3%) | 53 (26.6%) | 73 (33.6%) |
| Histological grade, n (%) | |||
| G1 | 174 (41.8%) | 92 (46.2%) | 82 (37.8%) |
| G2 | 213 (51.2%) | 97 (48.7%) | 116 (53.5%) |
| G3 | 29 (7.0%) | 10 (5.0%) | 19 (8.8%) |
| T category (T1/T2 vs T3/T4), n (%) | |||
| T1/T2 | 210 (50.5%) | 152 (76.4%) | 58 (26.7%) |
| T3/T4 | 206 (49.5%) | 47 (23.6%) | 159 (73.3%) |
| Lymph nodes retrieved, mean ± SD | 32.0 ± 12.8 | 31.0 ± 12.9 | 33.0 ± 12.6 |
Table 2.
Multivariable logistic regression for LNM prediction (combined model, N=416). Incremental likelihood-ratio test for pathomics score: χ2 = 35.5, P = 2.56e-09.
Table 2.
Multivariable logistic regression for LNM prediction (combined model, N=416). Incremental likelihood-ratio test for pathomics score: χ2 = 35.5, P = 2.56e-09.
| Variable | OR | 95% CI | P-value |
| sex | 1.213 | 0.940–1.566 | 0.138 |
| age | 0.943 | 0.738–1.205 | 0.639 |
| Tumor_location | 1.242 | 0.970–1.591 | 0.086 |
| T_merge | 2.392 | 1.791–3.196 | 3.56e-09 |
| Grade | 1.368 | 1.069–1.749 | 0.013 |
| Pathomics score | 2.473 | 1.803–3.392 | 1.97e-08 |
Table 3.
Internal validation performance of the three models (N=416). OOF = out-of-fold (10-fold cross-validation); Apparent = resubstitution; Optimism = Apparent − OOF. DeLong P compares each model against the combined model.
Table 3.
Internal validation performance of the three models (N=416). OOF = out-of-fold (10-fold cross-validation); Apparent = resubstitution; Optimism = Apparent − OOF. DeLong P compares each model against the combined model.
| Model | OOF AUC (95% CI) | Apparent AUC | Optimism | DeLong vs. combined (P) |
| Clinical | 0.791 (0.744–0.835) | 0.803 | +0.012 | 0.0389 |
| Pathomics | 0.762 (0.715–0.806) | 0.795 | +0.033 | 0.0006 |
| Combined | 0.821 (0.779–0.858) | 0.847 | +0.026 | reference |
Disclaimer/Publisher’s Note: The statements, opinions and data contained in all publications are solely those of the individual author(s) and contributor(s) and not of MDPI and/or the editor(s). MDPI and/or the editor(s) disclaim responsibility for any injury to people or property resulting from any ideas, methods, instructions or products referred to in the content. |
© 2026 by the authors. Licensee MDPI, Basel, Switzerland. This article is an open access article distributed under the terms and conditions of the Creative Commons Attribution (CC BY) license.
Copyright: This open access article is published under a Creative Commons CC BY 4.0 license, which permit the free download, distribution, and reuse, provided that the author and preprint are cited in any reuse.