
Submitted:
24 August 2026
Posted:
25 August 2026
You are already at the latest version
Abstract
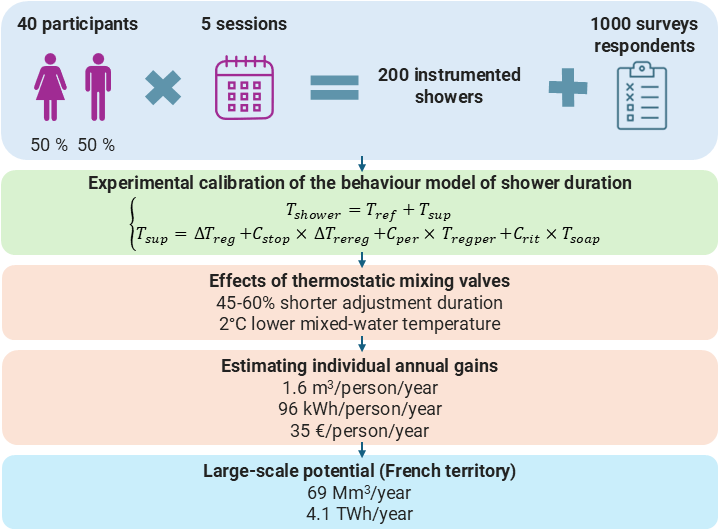
Showering represents a major component of residential water consumption and domestic hot-water energy demand. Although thermostatic mixing valves (TMVs) are widely used to improve thermal comfort and reduce the risk of scalding, their influence on showering behaviour and associated resource savings remains poorly quantified. This study proposes a conceptual model linking shower duration to temperature adjustment activities, flow interruptions during soaping, and user responses to hydraulic disturbances. Model parameters were estimated through two experimental campaigns involving 40 volunteers and 200 instrumented showers, complemented by an online survey of 1,000 French respondents. Four faucet technologies were compared under controlled laboratory conditions: a thermostatic mixing valve, a mechanical mixer tap, a two-handle mixing tap and a pressure-balance valve. The results showed that TMVs significantly reduced the initial temperature adjustment duration compared with all other faucet technologies, with reductions ranging from 45% to 60%. TMVs also led to significantly lower mixed-water temperatures, averaging 2.05 °C below those observed with conventional faucets. While no significant reduction in total shower duration was observed during experimental testing, the analysis revealed that TMVs substantially decrease adjustment-related activities during showering. The proportion of users interrupting water flow while soaping was estimated at 66%, whereas 41% of respondents reported being affected by hydraulic disturbances in their dwelling. Based on representative French showering conditions, the proposed model predicts annual savings of approximately 1.6 m³ of water and 96 kWh of energy per person. Extrapolation to the French residential building stock suggests a theoretical saving potential of 69 million m³ of water and 4.1 TWh of energy per year. These findings demonstrate that TMVs can reduce the environmental footprint of showering while maintaining user comfort and highlight their potential as a large-scale water- and energy-efficiency measure in residential buildings.
Keywords:
thermostatic mixing valve
; showering
; plumbing systems
; residential buildings
; water consumption
; energy consumption
; user behaviour
Introduction
In the context of climate change and growing pressure on water resources, and because residential water use constitutes a significant share of total water resources utilization, the investigation of solutions to reduce the building water footprint is becoming increasingly critical. Among the various domestic water end uses, showering represents the largest component of household water consumption and associated domestic hot water energy demand. Various strategies may be implemented to lower both water consumption and related energy use, ranging from technological interventions (e.g., efficient faucets, smart showerheads) to behavioural approaches (e.g., habit changes and behavioural nudges). Efforts to reduce water consumption must not compromise user comfort, as diminished comfort would negatively affect the acceptability of the proposed solutions [1].
The difficulty lies in the lack of knowledge about water usage behaviours and habits in residential buildings, particularly during showering [2]. Nevertheless, this specific usage is of major interest due to the proportion it represents in total domestic water consumption and in energy consumption associated with the production of domestic hot water. Analysis of the French SISPEA database [3], which compiles a set of indicators identified by water management entities shows that, on average at the municipal level, domestic drinking water consumption varies between 25 and 80 m3/inhabitant/year. On average, just under 50 m3 are consumed per inhabitant per year [4]. This data is consistent with feedback from water utilities, which base their new user subscription contracts on 40 m3 per inhabitant of the dwelling covered by the subscription. Furthermore, breaking down this consumption by use is essential for measuring the potential of certain water-saving measures. In France, a major survey conducted by the Water Information Center (C.I. Eau) in 2007 [5] made it possible to establish a national benchmark for the breakdown of domestic water consumption by use. A number of studies have been conducted in Europe and Australia to produce various benchmarks for consumption distribution by use, based either on surveys or on water consumption measurement campaigns [6,7,8,9,10]. Water consumption per person per day is relatively similar in France, Germany, Austria, and the Netherlands [11], while studies conducted in Australia and England reveal significantly higher consumption levels [12,13,14]. Significant differences were observed in usage from one country to another, particularly in relation to showering, which can account for 20% to 40% of total consumption depending on the study and the country. The frequency of use per person per day for different water uses was also studied. In particular, for showering, the frequency varies between 0.65 and 1 time per day. Only Australia and England report significant bathing usage, at 0.34 and 0.3 times per day per capita, which may explain why water consumption in these studies is significantly higher for these two countries than in other studies.
Across several experiments, thermally neutral or preferred shower-water temperatures have been studied and the results converge around 38-39 °C, with large individual variation (between 33 and 45 °C) [15,16]. People are very sensitive to fluctuations in water temperature. A recent scoping review on human thermoregulation during water immersion further highlighted substantial inter-individual differences in thermal sensation and confirmed the importance of maintaining stable thermal conditions to ensure comfort [17]. Indeed, some notice and found changes less than 0.5 °C uncomfortable, while others tolerate ±4 °C without discomfort [18]. Also, preferred temperature varies between seasons, with a difference of around 2 °C higher in winter compared to summer [19].
Showering duration changes with context (e.g., workplace showering, tourist hotels, home habits) and is highly variable across individuals and countries [20,21]. For example, average showering durations of around 14 minutes in summer and 17 minutes in winter have been reported, with seasonal preferences for hotter water in winter [15]. The amount of time spent in the shower, and consequently, the amount of water used, varies greatly depending on usage: for example, people who do not wash their hair use an average of 36 liters, while washing hair increases water consumption by 78% [22]. Comfort is dynamic over pre-, mid-, and post-shower phases, and both water temperature and duration are the dominant drivers of mid-shower comfort [23].
User behaviour in the shower is a key factor in water and energy consumption, and several studies show that targeted behavioural interventions can significantly reduce these uses. In the study by Salmon and Brouwer [24], the use of action plans formulated as “if… then…” statements resulted in an approximately 6% reduction in household water consumption, with reductions reaching 8.6% among the most committed participants. Similarly, the installation of a visual alert system that displays real-time shower water usage led to an immediate 25% to 27% reduction in the amount of water used per shower [25,26], without explicit economic incentives, and deliberately cooling water over time can shorten showers while remaining acceptable to most users [27]. With regard to the influence of thermal parameters and shower control habits, it has been demonstrated that user behaviour, and in particular water flow management, identified as the most decisive variable, plays a major role in the energy consumption associated with water heating [28].
These various studies agree that, while water-saving technologies (faucets, showerheads, control systems, feedback devices) are necessary, their effectiveness depends heavily on users’ ability to make lasting changes to their showering routines and to maintain these changes over time [25]. Studies on the adoption of efficient household appliances have further shown that environmental attitudes and complementary green behaviours strongly influence the actual savings achieved by water-efficient technologies [29].
Regarding technological solutions to lower water and energy consumption, design work on showerheads shows that spray intensity, distribution, and heat loss also shape comfort and shower duration, beyond flow rate alone [30]. The use of flow-restricting showerheads can reduce water consumption by about 30%, although users tend to turn up the water temperature to compensate for this restriction [22]. For instantaneous heaters and non-storage DHW systems, maintaining stable outlet temperature is crucial because load-induced fluctuations strongly affect comfort. Thermostatic mixer valves (TMVs) in baths reduce outlet temperatures from around 55–56 °C to 45–46 °C, improving perceived safety and satisfaction and staying effective at 12 months [31].
Mathematical models have shown that water temperature and flow rate are among the main determinants of the energy required for domestic hot water production. Several studies suggest that satisfactory thermal comfort can generally be maintained with shower temperatures below 40 °C and moderate flow rates, thereby offering opportunities for simultaneous reductions in water and energy consumption [32].
Consumer-footprint studies further demonstrate that shower duration, water temperature and technology choice are the dominant drivers of water, energy and greenhouse-gas emissions associated with showering, highlighting the importance of understanding behavioural responses to technological innovations [33].
Research Context
In this research, the assumption is made that thermostatic mixing valves could be a promising solution for reducing both water and energy consumption during showering. Indeed, this expectation is encouraged by their ability to provide fast, precise and stable temperature control, which affects user behaviour and comfort, in comparison to other types of faucets.
First, one of the key advantages of the thermostatic mixers lies in the ease and precision of adjustment of the desired temperature by users. The target temperature is set once at the beginning and is automatically maintained during the whole duration of the shower, avoiding the need for repeated manual adjustments generally required with conventional mixer faucets.
At startup, thermostatic mixing valves are expected to shorten the temperature adjustment phase owing to their operating principle. In contrast to conventional mixer faucets, reaching the desired temperature mainly depends on the hydraulic and thermal characteristics of the system rather than on the user’s ability to manually adjust the hot and cold-water flows.
Likewise, when users temporarily interrupt the water flow, typically during soaping, the preset temperature is rapidly restored when the flow resumes. This easy-to-use feature limits the time needed to readjust the water temperature and could therefore encourage users who were previously reluctant to turn off the faucet while soaping up for fear of having to find the optimal setting again to turn off the water.
Finally, thermostatic mixers are also designed to respond effectively to supply pressure or flow disturbances, such as those resulting from simultaneous water use elsewhere in the dwelling for another purpose (e.g., flushing a toilet). Several studies have reported that shower and bath comfort strongly depends on having water near the preferred range (around 35–40 °C) and avoiding fluctuations. Indeed, some users find changes inferior to 0.5 °C already uncomfortable [18,34]. Thermostatic mixing valves are designed to keep outlet temperature stable despite changes in demand or supply conditions, avoiding discomfort from sudden hot or cold spikes [35,36]. The stability of outlet temperature and flow rate despite external disturbances help preserve thermal comfort and avoid abrupt fluctuations that may lead users to intervene manually or prolong shower duration.
Taken together, these mechanisms suggest that the use of a thermostatic mixing valve may reduce the time spent in several adjustment-related activities during showering. Consequently, the difference between a thermostatic mixer and conventional faucets can be interpreted as the cumulative effect of several time-consuming events occurring during a shower.
Based on the mechanisms described above, we hypothesize that a shower performed with a thermostatic mixing valve corresponds to a reference duration . In contrast, showers using other faucet technologies may include an additional duration, , associated with temperature adjustments when the shower is turned on or after flow interruptions, and responses to hydraulic disturbances. This supplementary duration is defined by the equation (Equation (1)):
With : Initial temperature adjustment duration (s) (depending on the type of faucet). Then corresponds to the difference between the adjustment temperature duration of tested faucet and the adjustment temperature duration of thermostatic mixing valve.
: Percentage of people who turn off the water while soaping
: Readjustment duration after flow interruption (s) (depending on the type of faucet). Then corresponds to the difference between the readjustment temperature duration of tested faucet and the readjustment temperature duration of thermostatic mixing valve
: Percentage of showers where there is a hydraulic disturbance
: Readjustment duration after hydraulic disturbance (s) (depending on the type of faucet). It is considered equal to zero for thermostatic mixing valve because hydraulic disturbances do not affect the temperature setting
: Percentage of people who will turn off the water while soaping by replacing their current faucet with a thermostatic one
: Soaping duration
Although previous studies have examined shower temperatures, duration, comfort and behavioural interventions, no study has quantified the individual contributions of adjustment time, post-interruption readjustment and hydraulic disturbances to overall shower duration according to faucet technology. However, quantifying these parameters is essential for testing the proposed conceptual model and assessing the water- and energy-saving potential of thermostatic mixing valves.
All parameters of the proposed model, except , were estimated from two experimental campaigns specifically designed for this study and/or using online survey. The parameter is inherently more difficult to assess because it reflects behavioural changes that may arise from the adoption of a new technology. As these behavioural adaptations cannot be directly measured within the scope of the present work, was initially assumed to be equal to zero. The influence of this assumption could subsequently be examined through a sensitivity analysis based on evidence from the literature regarding behavioural changes associated with technological transitions, such as the adoption of eco-driving practices by electric vehicle users [37,38].
To estimate or define values for each parameter of the model, an experimental study based on a panel of 40 people was conducted, supplemented by an online survey of a panel of 1,000 respondents. The experimental study is composed of two parts. The first step was to conduct an experimental study under controlled laboratory conditions to measure the mean shower duration , the initial temperature adjustment duration , the proportion of people who turn off the water while soaping , the time for readjustment when reopening after flow has stopped for soaping and the soaping duration , as well as complementary data such as mixed-water temperatures, number of soaping, liking or comfort. The second experimental step focused on simulating a hydraulic disturbance by creating a pressure drop on the network to describe the reaction of panel and measure the readjustment time . Finally, an online survey on a representative sample of the French population was conducted in order to evaluate the mean shower duration , the proportion of showers affected by hydraulic disturbances , the proportion of people who turn off the water while soaping , and the soaping duration , and additional data such as the number of daily showers or the number of soaping. Some measures could be compared across the different approaches, while others helped to supplement the analyses.
Finally, the objectives of this study are therefore (i) to quantify the effect of faucet technology on shower characteristics, (ii) to estimate the influence of temperature adjustment, flow interruption and hydraulic disturbances on shower behaviour, and (iii) to assess the resulting water- and energy-saving potential of thermostatic mixing valves.
Materials and Methods
Panel
A panel of forty volunteers was recruited for the first step of the experimental study. The distribution criteria were chosen to ensure that the panel was representative in terms of gender (50% females and 50% males), age (25% aged 18 to 34, 32% aged 35 to 54, and 43% aged 55 and over), and occupant profile of the dwelling (50% owner-occupier and 50% tenant). The recruitment and compensation of the panel were carried out by a specialized service provider. They signed an informed consent before the beginning of the study.
For step 2, eighteen volunteers among the original panel were invited to participate in an additional session, based on the outcomes of the first experimental stage. Participants were selected according to their preferred shower temperature in order to ensure that the temperature decrease induced by the simulated pressure drop could be clearly perceived.
Faucets and Showerheads
Four different faucet technologies were tested; To ensure that the tested faucets met adequate performance standards, NF077 French certification was a prerequisite in the selection of the faucet models tested. A thermostatic mixing valve, a mechanical mixer tap, a two-handle mixing tap and a pressure balance valve were chosen for this experimental campaign. In association with the faucet, two showerheads were used: showerhead 1 (maximal flow rate: 19.0 L/min) and showerhead 2 with a reduced flowrate (maximal flow rate: 9.2 L/min).
Test Bench
The tests were conducted in two shower stalls in the Aquasim building of CSTB Nantes. One shower stall was dedicated to men (number 1), the other one to women (number 2). Pressure, flow, and temperature sensors were installed in each shower stall to accurately measure the data for each shower profile. Table 1 presents the detailed instrumentation used to measure the various physical parameters monitored during the experimental campaign.
The terminal pipe lengths were standardized so that the initial volume of cold water contained in the installation would be identical between the two shower stalls. This volume was representative of a volume typically found in a large house (approximately 3 liters), based on the regulations regarding standard pipe lengths [39]. Indeed, to maintain the same initial conditions between each participant, the hot water was purged using a 3-way valve located on the first floor of the building. This valve allowed cold water to be diverted to the hot water supply. For Step 2, a hydraulic disturbance was simulated by adding a hot-water shut-off valve. The valve was remotely activated by the experimenter during the shower, after which the panellists adjusted the shower temperature. The complete diagram of the experimental bench and instrumentation is shown in Figure 1.
Experimental Protocol
The combination of four faucet technologies and two showerheads resulted in eight possible test configurations. To enable a robust evaluation of the configurations and to allow for a compromise to limit panelist fatigue, the tests were carried out according to a balanced incomplete block design. Each panelist evaluated five configurations among the eight, leading to 5 sessions for each volunteer. Data were collected from 200 showers.
Upon arrival, participants were welcomed and given instructions. Participants were asked to shower in the same way they would at home: they were allowed to use the handheld showerhead, adjust its height and angle, etc. They could also adjust the water temperature and flow as they wished. Soap/shampoo was provided, but they had the option of using their own toiletries. Once they had finished showering, the participants joined the experimenter to complete the questionnaire and debrief about their experience.
Between each experiment, the shower cubicle was cleaned and disinfected and the hot water was purged using the 3-way valve. When cold water was diverted to the hot water supply, the faucets were left running at full hot water on the ground floor in the shower cubicles for 1 minute 30 seconds to ensure complete flushing.
Online Survey
For the online survey, a questionnaire was developed to poll a panel of 1,000 respondents, representative of the French population according to quotas provided by INSEE. This questionnaire, made of 51 questions, covered household composition, type of housing, characteristics of the apartment/house, use of the bathtub and shower, use of faucets (bath and/or shower), ecological behaviours, and characteristics of the respondents. The online survey took place during the summer of 2024.
Data Analysis
A shower event was defined as the complete sequence of activities occurring between the first opening and the final closure of the faucet during a shower. Within a shower event, one or several water-flow sequences could be identified.
A water-flow sequence was defined as a continuous period during which either the hot-water flow rate or the cold-water flow rate was non-zero. The beginning of a sequence corresponded to the moment when either the hot-water or cold-water flow rate became non-zero, while its end corresponded to the moment when both flow rates returned to zero.
An example of two experimental shower signatures obtained during the shower stalls number 1 and 2 of a same session is given in Figure 2. The first signature corresponds to a thermostatic mixing valve whereas the second corresponds to a pressure balance faucet. Both shower events comprise two distinct water-flow sequences separated by a soaping interruption.
The shower signature from the shower stall N° 1 shows that the thermostatic faucet was initially used to draw hot water exclusively during the first 20 seconds (①), then the mixer was turned off for soaping (②), and finally the mixer was turned back on for rinsing (③). The signature from the shower stall N°2 shows that the use of the pressure balance faucet first allowed for simultaneous cold and hot water to be drawn (❶), then the measurement shows the faucet being turned off for soaping (❷) and finally turned back on for rinsing (❸).
The shower duration was calculated as the sum of the durations of all water-flow sequences composing a given shower event. Consequently, when participants interrupted the water flow during soaping activities, several water-flow sequences could be observed within the same shower event, and the inactive periods corresponding to soaping were excluded from the shower duration.
For each water-flow sequence, steady-state values of mixed-water temperature and flow rate were calculated from the mean values measured between 15 s and 5 s before the end of the considered water-flow sequence. This period was selected to ensure that the system had reached steady-state operating conditions while avoiding the influence of flow termination. When a shower event contained several water-flow sequences, the characteristic values associated with the event were calculated as the arithmetic mean of the characteristic values obtained for each sequence.
The initial temperature adjustment duration was defined as the time elapsed between the beginning of a water-flow sequence, identified by the first non-zero hot-water or cold-water flow rate, and the moment at which the mixed-water temperature reached a stable value. Temperature stability was considered achieved when the mixed-water temperature remained within ±0.2 °C of its steady-state value for at least 5 s. This threshold was selected because it is larger than the measurement uncertainty of the temperature sensors and remains below the magnitude of temperature fluctuations reported to affect users’ thermal perception during showering, which is on the order of 0.5 °C [18,32]. It therefore provides a conservative criterion for identifying steady-state thermal conditions.
Flow interruptions associated with soaping activities were identified as periods during which both hot-water and cold-water flow rates were equal to zero between two consecutive water-flow sequences belonging to the same shower event. The duration and number of these interruptions were recorded for each shower event. When several soaping events occurred during the same shower, the characteristic soaping duration was defined as the mean duration of all recorded interruptions.
Whenever a soaping event was identified, the readjustment duration after flow interruption () was calculated using the same methodology as for the initial temperature adjustment duration (). More specifically, was defined as the time elapsed between the reopening of the faucet, identified by the reappearance of a non-zero hot-water or cold-water flow rate, and the moment at which the mixed-water temperature reached steady-state conditions. Temperature stability was considered achieved when the mixed-water temperature remained within ±0.2 °C of its steady-state value for at least 5 s. When several soaping events occurred during the same shower, the characteristic readjustment duration was calculated as the mean value of all measured durations.
When a hydraulic disturbance was applied during the second step of the experimental campaign, the readjustment duration after hydraulic disturbance () was calculated as the time elapsed between the initiation of the disturbance and the return of the mixed-water temperature to steady-state conditions. Temperature stability was assessed using the same criterion as that adopted for or .
The proportion of users turning off the water during soaping activities () was calculated as the ratio between the number of shower events containing more than one water-flow sequence and the total number of shower events. The underlying assumption is that the occurrence of several water-flow sequences within a same shower event reflects a voluntary interruption of water flow for soaping purposes. This approach was considered representative of participants’ usual behaviour, as showering is generally regarded as a highly routinized and ritualized daily activity. Furthermore, participants were explicitly instructed to shower as they would under normal home conditions, and no incentives or recommendations regarding water-saving behaviours were provided during the experiments. Consequently, the observed frequency of flow interruptions was assumed to reflect participants’ habitual showering practices.

Table 2.
Extracted parameters from the experimental shower signatures.
| Parameter | Symbol | Definition |
|---|---|---|
| Shower duration (s) | Sum of water-flow sequence durations. | |
| Number of soaping events | Number of flow interruptions associated with soaping activities during the shower. | |
| Soaping duration (s) | Duration of the water flow stoppage during the shower. | |
| Percentage of people who turn off the water while soaping (%) | Ratio between showers associated with non-zero Nsoap and total number showers. | |
| Mean mixed-water temperature (°C) | θshower | Arithmetic average of steady-state values of mixed-water temperature. |
| Initial temperature adjustment duration (s) | Time elapsed between the first non-zero hot- or cold-water flow rate and the moment when the mixed-water temperature reaches steady-state conditions. | |
| Readjustment duration after flow interruption (s) | Time elapsed between the reopening of the faucet following a soaping event, identified by the reappearance of a non-zero hot-water or cold-water flow rate, and the moment at which the mixed-water temperature reaches steady-state conditions. When several soaping events occur during the same shower, is calculated as the mean value of all measured readjustment durations. | |
| Readjustment duration after hydraulic disturbance (s) | Time elapsed between the onset of a hydraulic disturbance and the moment at which the mixed-water temperature returns to steady-state conditions. |
All statistical analyses were performed in Python (version 3.14.5) using the SciPy, scikit-posthocs and statannotations packages. As the assumptions of normality and homoscedasticity were not systematically met, non-parametric methods were employed. Differences among multiple groups were first evaluated using the Kruskal-Wallis rank-sum test. When a significant overall effect was detected, pairwise post hoc comparisons were performed using Dunn’s test with Holm adjustment for multiple comparisons. For analyses involving showerhead type within each faucet technology, adjusted p-values were calculated separately and only significant pairwise differences were reported on the figures. Boxplots display the median, interquartile range, and extreme values, while diamonds indicate arithmetic means. Statistical significance was defined as p < 0.05 and is represented on all the figures by one, two, three or four stars corresponding to respectively to p<0.05, p<0.01, p<0.001 and p<0.0001.
For the online survey, descriptive statistics were calculated using weighting factors provided by the survey company to ensure representativeness of the French population. Shower and soaping durations ( and ) were estimated based on two questions offering several response options (n) in the form of time intervals (i) (respectively five modalities from less than 2 minutes to more than 6 minutes and seven modalities from less than 15 seconds to more than 2 minutes). For each interval, a representative duration corresponding to the midpoint of the interval (mi) was assigned (with the exception of the upper intervals for which the values were chosen using a conservative approach, respectively 7 minutes and 2.5 minutes). The average durations were then calculated as weighted averages of these representative durations, with the weight assigned to each interval being the number of respondents (Ni) who selected the corresponding option. Since respondents could select a modality corresponding to “I don’t know” the estimation of and ) was based respectively on 918 and 956 responses.
The percentage of people who turn off the water while soaping () was calculated from the response to the question “During the shower, do you turn off the water while soaping up?” (Yes/No). As responses to this question were not mandatory the calculation was made with 985 responses.
These results were compared with measurements obtained during the experimental campaign to assess the consistency of reported and observed showering behaviours.
In addition, the percentage of people who feel hydraulic disturbance at home () could only be determined by the online survey from the response to the question “When you’re taking a shower and someone else in your household is using water at another fixture (kitchen sink, toilet), do you notice any disruption to your water pressure?” (Yes/No). The calculation was made with 1000 responses.
Table 3.
Extracted parameters from the online survey.
| Parameter | Symbol | Definition |
|---|---|---|
| Shower duration (s) | ||
| Soaping duration (s) | ||
| Percentage of people who turn off the water while soaping | Ratio of the number of responses from people who declare interrupting flow during shower to the number of responses from the total sample | |
| Percentage of people who feel hydraulic disturbance at home | Ratio of the number of responses from people who declare feeling hydraulic disturbance to the number of responses from the total sample |
Results
Quantification of Mean Shower Characteristics
Shower Duration
A significant effect of gender was observed on shower duration (Figure 3), with male participants exhibiting longer shower durations than female participants (3’20’’ versus 2’40’’).
No significant effect of faucet technology on shower duration was observed under the experimental conditions considered (Figure 4). Although the mean shower duration tended to be lower for both thermostatic mixing valves and mechanical mixers compared with the pressure-balance valve, these differences did not reach statistical significance. On average, showers performed with thermostatic mixing valves and mechanical mixers were approximately 16% shorter than those performed with the pressure-balance valve and 6% with the two-handle mixer.
The absence of statistical significance suggests that the variability observed between participants was greater than the differences attributable to faucet technology alone. Nevertheless, the consistency of the observed trend across the two mixer-based technologies may indicate a potential influence of temperature-control mechanisms on shower duration. Although this tendency should be interpreted with caution, it remains consistent with the conceptual framework proposed in this study, which hypothesizes that technologies facilitating temperature control may contribute to reducing certain time-consuming activities occurring during showering. Additional investigations involving a larger sample size would be necessary to determine whether the observed 13% or 6% reductions reflect a genuine effect of faucet technology or simply natural inter-individual variability.
Moreover, a tendency for interaction between faucet technology and showerhead type was observed for shower duration. When the water-efficient showerhead was combined with a two-handle mixer, shower duration increased by approximately 15% compared with the non-restricted showerhead configuration. This result suggests that users may compensate for the reduced flow rate by spending more time under the shower to achieve a comparable level of comfort or rinsing efficiency.
In contrast, no tendency for interaction of the water-efficient showerhead on shower duration was observed when associated with the other faucet technologies tested, namely the thermostatic mixing valve, the mechanical mixer and the pressure-balance valve. For these technologies, shower duration remained almost unchanged despite the reduction in available flow rate.
These findings indicate that the behavioural response to flow restriction depends on the type of faucet used. The increase in shower duration observed with the two-handle mixer may reflect additional user adjustments or a lower perceived comfort when flow reduction is combined with manual temperature regulation. Conversely, the stability and ease of temperature control provided by the other faucet technologies may limit compensatory behaviours and help maintain shower duration at a constant level.
Mixed-Water Temperature
No significant difference in mixed-water temperature (θshower) was observed between male and female participants (Figure 5), indicating that both groups exhibited similar thermal preferences under the experimental conditions considered. This result suggests that gender was not a determining factor in the selection of shower temperature, despite the significant differences observed in shower duration.
In contrast, faucet technology had a significant effect on the mixed-water temperature selected by users (Figure 6). Showers equipped with thermostatic mixing valves were associated with significantly lower mixed-water temperatures than those equipped with mechanical mixers or two-handle mixers. This finding suggests that the greater precision and stability of thermostatic temperature control may encourage users to select lower temperature setpoints while maintaining satisfactory thermal comfort.
One possible explanation is that the stable temperature delivered by thermostatic mixing valves reduces the need for users to compensate for anticipated temperature fluctuations by selecting higher temperatures. Conversely, with manual temperature-control devices such as mechanical and two-handle mixers, users may intentionally choose a slightly higher temperature to ensure thermal comfort despite potential variations in water temperature during use.
From an energy perspective, this result is particularly relevant, as domestic hot water energy consumption is directly linked to the temperature of the mixed water delivered to the user. Consequently, the lower temperatures observed with thermostatic mixing valves may contribute to reduce energy demand for water heating, even in the absence of a significant reduction in shower duration. These findings therefore support the hypothesis that thermostatic mixing valves may generate energy savings not only through reductions in adjustment times but also through a modification of users’ temperature-setting behaviour.
Quantification of Model Parameters
Initial Temperature Adjustment Duration
Figure 7 presents the distribution of the initial temperature adjustment durations according to faucet technology. A significant effect of faucet technology was observed on initial temperature adjustment duration. Thermostatic mixing valves exhibited the shortest adjustment durations, with a median value close to 26 s and a mean value of the same order of magnitude. In comparison, adjustment times were substantially longer for pressure-balance valves, mechanical mixers and two-handle mixers, whose mean values ranged from approximately 48 to 69 s.
Statistical analyses confirmed that the adjustment duration associated with thermostatic mixing valves was significantly lower than that observed for all other faucet technologies. On average, the adjustment time was reduced by approximately 45 to 60% compared with conventional systems, depending on the technology considered. These results are consistent with the operating principle of thermostatic mixing valves, which automatically regulate the proportion of hot and cold water required to reach the target temperature, thereby limiting the user interventions required during the start-up phase.
Soaping Activities and Consequences
The soap application durations and the number of soap applications were calculated only for shower signatures showing at least one interruption in the water flow during the shower. This data was extracted from 105 showers out of the 200 experiments conducted. In addition, the same parameter was evaluated from the online survey without discriminating against the type of faucet. The results are presented in Table 4 for these two parameters.
The results show that the type of faucet has no significant influence on behaviour (soap use time, turning off the water, etc.). The ritual behaviour of soaping up while showering does not seem to be affected by the type of faucet or shower head.
Regarding the proportion of individuals who temporarily stopped the water flow while showering to apply soap, the discrepancy between the experimentally observed value (62%) and the survey-based estimate (72%) highlights the limitations of relying solely on either direct measurements or self-reported data to characterize behavioural parameters. While the experimental campaign captures actual practices, self-reported data likely better reflect long-term habits but may be affected by social desirability bias. Consequently, a conservative compromise value of 66% was adopted for , balancing observed and declared behaviours and reducing the uncertainty associated with each method individually.
Following a soaping event, users may need to readjust the water temperature when reopening the faucet. The experimental results showed that the readjustment duration after flow interruption () was significantly lower for thermostatic mixing valve than for two-handle mixer (Figure 8).
Nevertheless, the readjustment duration differences between the thermostatic mixing valves and the two others faucets are close to being statistically significant (p=0.07), especially since the sample size used for the analysis is smaller than the one used for initial adjustment temperature duration due to the 62% of people who turned off the water during the shower. This result can be explained by the ability of thermostatic valves to maintain the selected temperature setting during flow interruptions, allowing the desired temperature to be restored rapidly when the water flow resumes. Consequently, thermostatic mixing valves reduce the effort and time required to return to comfortable showering conditions after soaping activities.
Hydraulic Disturbance During the Shower
According to the online survey, 41% of respondents reported experiencing hydraulic disturbances in their dwelling that could lead to sudden temperature fluctuations while showering. This proportion was retained as the value of the parameter in the proposed model. The result suggests that hydraulic disturbances constitute a frequent situation in residential buildings and may therefore contribute significantly to overall shower adjustment durations. However, this phenomenon does not appear systematically during showering and we propose setting the frequency of occurrence at 1 shower out of every 3.
The second step of the experimental campaign was specifically designed to evaluate the readjustment duration following a hydraulic disturbance (). This parameter was assessed only for mechanical mixers and two-handle mixer. Thermostatic mixing valves and pressure-balance valves were not considered in this analysis, as their operating principles are specifically intended to compensate automatically for supply pressure fluctuations and maintain a stable outlet temperature without requiring user intervention.
The results presented in Table 4 show that the mean readjustment duration following a hydraulic disturbance was approximately from 30 to 35 s for both mechanical mixers and two-handle mixers. This indicates that, when exposed to a sudden temperature variation resulting from a pressure disturbance elsewhere in the plumbing system, users generally required about half a minute to recover comfortable showering conditions and restore their preferred water temperature.
Table 4.
Readjustment durations after a hydraulic disturbance (in seconds) for the two-handle mixing tap and the mechanical mixer tap.
Table 4.
Readjustment durations after a hydraulic disturbance (in seconds) for the two-handle mixing tap and the mechanical mixer tap.
| Two-handle mixing tap | Mechanical mixer tap | |
| (s) | 35,2 | 31,4 |
Expected Water-Energy Savings Using Thermostatic Faucet
The proposed model was used to estimate the water-energy savings potential of thermostatic mixing valves under the following assumptions:
- was assumed to be equal to zero (conservative approach);
- an average shower duration of 4 minutes was considered, corresponding to a conservative compromise between the results of the online survey and the values reported in the scientific literature, which tend to overestimate actual shower duration;
- an average flow rate of 9 L·min⁻¹ was assumed, corresponding to the flow rate of the most efficient showerhead tested in this study and representative of commercially available water-efficient showerheads;
- a shower frequency of 0.83 shower per person per day was derived from the online survey.
- National hypothesis corresponding to French data
Under these assumptions, the use of thermostatic mixing valves would result in water savings of approximately 1.6 m³ per person per year.
In addition, the reduction in shower duration given by the model, combined with the 2.05 °C decrease in mixed-water temperature would lead to an estimated energy saving of approximately 96 kWh per person per year. Assuming typical French water and electricity tariffs of respectively 4.5 €·m⁻³ and 0.28 €·kWh⁻¹, the resulting economic benefit is estimated at approximately 35 € per person per year.
Although these savings may appear modest at the individual scale, they could become substantial when extrapolated to the building stock or national scale given the widespread use of showering in residential buildings. Furthermore, these annual per-capita savings should be assessed against the investment cost of a thermostatic mixing valve, which is approximately 150 € for a high-quality product.
Discussion
The Paradox of Shower Duration
Although thermostatic mixing valves significantly reduced both the initial adjustment duration () and the readjustment duration after flow interruption (), no significant reduction in total shower duration was observed. This apparent paradox may be explained by several factors.
First, the average shower durations measured during the experimental campaign (approximately 3 min) were substantially shorter than those typically reported in the literature, suggesting that participants may have slightly modified their behaviour under laboratory conditions. Under such circumstances, adjustment-related activities represent only a small fraction of the total shower event, making differences between faucet technologies more difficult to detect. In some cases, participants even seemed to stop the shower just before the desired comfort temperature had been reached, indicating that the shortened shower durations observed under laboratory conditions likely reduced the apparent influence of faucet adjustment times on total shower duration.
Second, the online survey showed that mechanical mixers are the dominant technology in French dwellings (49.6%), while thermostatic mixing valves already account for 34.0% of installations. Consequently, many participants were already familiar with technologies providing relatively fast and intuitive temperature control, limiting the potential behavioural change associated with the use of a thermostatic mixing valve during the experiment.
Finally, total shower duration is strongly influenced by personal hygiene routines and comfort preferences, which introduce substantial inter-individual variability. Therefore, the absence of a significant effect on overall shower duration should not be interpreted as an absence of savings potential. On the contrary, the significant reductions observed for adjustment times and mixed-water temperature demonstrate that thermostatic mixing valves modify specific components of showering behaviour that contribute directly to water and energy savings.
The Effect of the Initial Adjustment Temperature Duration
The significantly shorter adjustment durations observed for thermostatic mixing valves support the central hypothesis of this study. Unlike conventional mixer faucets and pressure-balance valves, reaching the target temperature mainly depends on the operating principle of the valve rather than on the user’s ability to manually achieve comfortable showering conditions. As a result, the time spent searching for and stabilizing the desired temperature is substantially reduced.
The pressure-balance valve exhibited the longest adjustment times and the greatest inter-individual variability. This result suggests that users experienced greater difficulty in reaching their preferred temperature with this technology, leading to longer adjustment phases. It should also be noted that pressure-balance valves remain largely unfamiliar to French users, which may have contributed to the observed variability. Mechanical mixers and two-handle mixers showed intermediate performances but still required significantly longer adjustment durations than thermostatic mixing valves.
It is important to note that the adjustment duration considered in this study includes both the time required for hot water to reach the mixing device and the time needed to achieve stable thermal comfort conditions. To ensure comparability across configurations, identical initial conditions were applied before each experiment, and the test bench incorporated terminal pipe lengths representative of residential plumbing installations, corresponding to an initial cold-water volume of approximately 3 L. Consequently, the measured adjustment times can be regarded as representative of average waiting times experienced under realistic domestic conditions.
Overall, these results demonstrate that faucet technology is a key determinant of the initial adjustment phase and confirm that thermostatic mixing valves can significantly reduce water and energy losses occurring before stable showering conditions are reached. This benefit is expected to be particularly relevant in plumbing installations characterized by long hot-water waiting times. As adjustment duration corresponds to a period during which water flows without providing the desired level of comfort, reducing this duration directly decreases unnecessary water consumption and the associated energy required for domestic hot-water production.
The Effect of Readjustment Temperature Duration
These findings highlight the potential advantage of technologies designed to automatically maintain temperature stability. By eliminating the need for manual readjustment after hydraulic disturbances, thermostatic mixing valves and pressure-balance valves may reduce user inconvenience while avoiding the additional water and energy consumption associated with prolonged adjustment periods.
Sensitivity of Savings Estimates to Behavioural Changes
In the baseline scenario, the parameter , representing the proportion of users who would adopt the habit of turning off the water while soaping after switching to a thermostatic mixing valve, was conservatively assumed to be equal to zero. Under this assumption, the proposed model predicts annual water savings of approximately 1.63 m³ per person.
To evaluate the influence of this assumption, a simple sensitivity analysis was conducted. Assuming that 10% of users adopt this additional water-saving behaviour following the installation of a thermostatic mixing valve, the estimated annual water savings increase from 1.63 to 1.80 m³ per person. If this behavioural change affects 20% of users, the estimated annual savings reach 1.97 m³ per person.
These results indicate that the parameter has a moderate but non-negligible influence on the model outputs. Compared with the baseline scenario, water savings increase by approximately 10% and 21% for values of 10% and 20%, respectively. This analysis suggests that the savings estimated in the present study should be regarded as conservative, as they do not account for potential behavioural adaptations induced by the ease of use and improved temperature stability provided by thermostatic mixing valves.
More generally, the results highlight that the largest share of savings originates from the reduction of adjustment-related activities quantified experimentally. Behavioural changes associated with increased flow interruptions during soaping may further enhance the water-saving potential of thermostatic mixing valves, but they do not constitute the primary driver of the predicted savings.
From Individual Gains to Large-Scale Benefits
Although the savings estimated in this study may appear modest at the individual scale, their cumulative impact becomes substantial when considered at the national level.
The online survey revealed that only 34.0% of respondents were equipped with thermostatic mixing valves, whereas 49.6% used mechanical mixers and 13.9% still relied on two-handle mixers. Consequently, approximately 63.5% of the population remains equipped with faucet technologies that could potentially be replaced by thermostatic mixing valves.
Assuming that the savings observed in this study can be generalized to these households, the large-scale deployment of thermostatic mixing valves could theoretically save approximately 69 million m³ of water and 4.1 TWh of energy annually across France. Under current water and electricity tariffs, this corresponds to a potential economic benefit exceeding 1.5 billion euros per year.
These figures illustrate how relatively small individual savings can translate into major collective benefits when applied across a large population. In addition to reducing drinking water consumption and domestic hot-water energy demand, thermostatic mixing valves offer the advantage of maintaining user comfort while requiring little or no behavioural adaptation. Unlike many behavioural interventions, whose effectiveness may decrease over time, the savings generated by thermostatic mixing valves are expected to persist throughout the service life of the device.
Although these estimates should be regarded as indicative and depend on assumptions regarding showering habits, plumbing configurations and utility prices, they nevertheless highlight the considerable untapped potential associated with the modernization of residential plumbing fixtures. From this perspective, the replacement of conventional faucets by thermostatic mixing valves could represent an effective and easily deployable lever for simultaneously addressing water conservation and energy-efficiency objectives at the national scale.
Conclusions
This study investigated the influence of faucet technology on showering behaviour and quantified the resulting water- and energy-saving potential of thermostatic mixing valves.
The results showed that thermostatic mixing valves significantly reduce the time required to reach comfortable showering conditions. Compared with conventional faucet technologies, the initial adjustment duration was reduced by 45 to 60%, while readjustment after flow interruption was also shortened. In addition, users selected significantly lower mixed-water temperatures when using thermostatic mixing valves, with an average reduction of 2.05 °C.
Although no statistically significant reduction in total shower duration was observed during experimental testing, the proposed model demonstrated that the accumulation of these adjustment-related effects can generate measurable savings. Under representative French showering conditions, the use of thermostatic mixing valves was estimated to save approximately 1.6 m³ of water and 96 kWh of energy per person per year, corresponding to an annual economic benefit of around 35 € per person.
The combination of experimental observations and survey data further highlighted the large untapped potential associated with the replacement of conventional faucets. Considering the current penetration rate of faucet technologies in France, widespread adoption of thermostatic mixing valves could theoretically save approximately 69 million m³ of water and 4.1 TWh of energy annually.
Overall, the findings confirm that thermostatic mixing valves constitute an effective technological solution for reducing the environmental footprint of showering while maintaining user comfort. Future work should focus on validating the proposed model under real-life residential conditions and on quantifying the long-term behavioural changes associated with the adoption of thermostatic mixing valves.
Funding
This work was partially funded by Vernet Group. The experimental campaign, data analysis and interpretation of results were conducted independently by CSTB.
Conflicts of Interest
Vernet Group had no role in the statistical analysis of the data, the interpretation of the results or the decision to submit the manuscript for publication.
References
- Lee, M.; Tansel, B. Water conservation quantities vs customer opinion and satisfaction with water efficient appliances in Miami, Florida. J. Environ. Manag. 2013, 128, 683–689. [Google Scholar] [CrossRef]
- Kwon, H.; Fischer, J.E.; Flintham, M.; Colley, J. The Connected Shower: Studying Intimate Data in Everyday Life. Proc. ACM Interact. Mob. Wearable Ubiquitous Technol. 2018, 2, 1–22. [Google Scholar] [CrossRef]
- SISPEA Database. n.d. Available online: https://www.services.eaufrance.fr/pro/telechargement (accessed on 27 February 2026).
- L’UNION SOCIALE POUR L’HABITAT, BANQUE DES TERRITOIRES, CSTB, CAP FLUIDES CONSULTING, Suivi des consommations d’eau: cadre réglementaire et usages de la donnée. Repères 2026, 169.
- CI EAU, B.V.A. Etude des comportements de consommation de l’eau en France; 2006. [Google Scholar]
- Mazzoni, F.; Alvisi, S.; Franchini, M.; Blokker, M. Exploiting high-resolution data to investigate the characteristics of water consumption at the end-use level: A Dutch case study. Water Resour. Ind. 2023, 29, 100198. [Google Scholar] [CrossRef]
- Ashton, V. Integration of behavioural change into demand forecasting and water efficiency practices, UK Water Industry Research. 2016. Available online: https://ukwir.org/Integration-of-behavioural-change-into-demand-forecasting-and-water-efficiency-practices (accessed on 26 February 2026).
- Mazzoni, F.; Alvisi, S.; Blokker, M.; Buchberger, S.; Castelletti, A.; Cominola, A.; Gross, M.-P.; Jacobs, H.E.; Mayer, P.; Steffelbauer, D.B.; Stewart, R.A.; Stillwell, A.S.; Tzatchkov, V.; Yamanaka, V.-H.A.; Franchini, M. Residential End Uses of Water: Global Evidence. 3rd Int. Jt. Conf. Water Distrib. Syst. Anal. Amp Comput. Control Water Ind. WDSACCWI;MDPI 2024, 2024, 149. [Google Scholar] [CrossRef]
- Mayer, P.W.; DeOreo, W.B.; Opitz, E.M.; Kiefer, J.; Davis, W.Y.; Dziegielewski, B.; Nelson, J.O. Residential End Uses of Water, AWWA Res. Found.; 1999. [Google Scholar]
- DeOreo, W.B.; Mayer, P.W.; Dziegielewski, B.; Kiefer, J. Residential End Uses of Water, Version 2; Water Research Foundation, 2016. [Google Scholar]
- Reynaud; Commission, European (Eds.) Modelling household water demand in Europe; Publications Office, Luxembourg, 2015. [Google Scholar] [CrossRef]
- Willis, R.M.; Stewart, R.A.; Giurco, D.P.; Talebpour, M.R.; Mousavinejad, A. End use water consumption in households: impact of socio-demographic factors and efficient devices. J. Clean. Prod. 2013, 60, 107–115. [Google Scholar] [CrossRef]
- Willis, R.M.; Stewart, R.A.; Panuwatwanich, K.; Williams, P.R.; Hollingsworth, A.L. Quantifying the influence of environmental and water conservation attitudes on household end use water consumption. J. Environ. Manag. 2011, 92, 1996–2009. [Google Scholar] [CrossRef]
- At home with water; Energy Saving Trust, 2013.
- Wong, L.-T.; Mui, K.-W.; Chan, Y.-W. Showering Thermal Sensation in Residential Bathrooms. Water 2022, 14, 2940. [Google Scholar] [CrossRef]
- Herrmann, C.; Candas, V.; Hoeft, A.; Garreaud, I. Humans under showers: Thermal sensitivity, thermoneutral sensations, and comfort estimates. Physiol. Behav. 1994, 56, 1003–1008. [Google Scholar] [CrossRef]
- Ntoumani, M.; Dugué, B.; Rivas, E.; Gongaki, K. Thermoregulation and thermal sensation during whole-body water immersion at different water temperatures in healthy individuals: A scoping review. J. Therm. Biol. 2023, 112, 103430. [Google Scholar] [CrossRef]
- Keuler, J.; Albrecht, K.; Pärisch, P. Evaluation of thermal comfort during showering with system-related temperature fluctuations. J. Build. Eng. 2024, 88, 109162. [Google Scholar] [CrossRef]
- Ohno, H.; Mano, T.; Nishina, D.; Kawano, N. The Preferred Shower Temperatures with Post-shower Physiological and Subjective Responses for Young Females in Summer and Winter Experiments. J. Hum.-Environ. Syst. 2000, 4, 61–68. [Google Scholar] [CrossRef]
- Shan, Y.; Yang, L.; Perren, K.; Zhang, Y. Household Water Consumption: Insight from a Survey in Greece and Poland. Procedia Eng. 2015, 119, 1409–1418. [Google Scholar] [CrossRef]
- Athuraliya; Roberts, P.; Brown, A. Residential water use study. In -Summer 2012, Yarra Val. Water Melb.; 2012; volume 2. [Google Scholar]
- Rohles, F.H.; Konz, S.A. Human Factors Implications of Showering Behavior. Proc. Hum. Factors Soc. Annu. Meet. 1981, 25, 477–481. [Google Scholar] [CrossRef]
- Luo, M.; Xu, S.; Tang, Y.; Yu, H.; Zhou, X.; Chen, Z. Dynamic thermal responses and showering thermal comfort under different conditions. Build. Environ. 2023, 237, 110322. [Google Scholar] [CrossRef]
- Salmon, S.J.; Brouwer, S. Boosting water conservation in shower behaviour: the impact of implementation intentions. Sustain. Water Resour. Manag. 2025, 11, 56. [Google Scholar] [CrossRef]
- Stewart, R.A.; Willis, R.M.; Panuwatwanich, K.; Sahin, O. Showering behavioural response to alarming visual display monitors: longitudinal mixed method study. Behav. Inf. Technol. 2013, 32, 695–711. [Google Scholar] [CrossRef]
- Reducing Shower Duration in Tourist Accommodations: A Covert True Experiment of Continuous Real-Time Eco-Feedback and Persuasive Messaging. n.d. [CrossRef]
- Saniei, N.; Shibata, E.; Lui, S.; Magcalas, J.; McPhee, B.; Tariq, S.; Shu, L.H. Exploring a Temperature-Decreasing Shower Concept to Conserve Water and Energy; American Society of Mechanical Engineers Digital Collection, 2021. [Google Scholar] [CrossRef]
- Zhang, D.; Mui, K.-W.; Wong, L.-T. Establishing the Relationship between Occupants’ Thermal Behavior and Energy Consumption during Showering. Buildings 2023, 13, 1300. [Google Scholar] [CrossRef]
- Dieu-Hang, T.; Grafton, R.Q.; Martínez-Espiñeira, R.; Garcia-Valiñas, M. Household adoption of energy and water-efficient appliances: An analysis of attitudes, labelling and complementary green behaviours in selected OECD countries. J. Environ. Manag. 2017, 197, 140–150. [Google Scholar] [CrossRef]
- Adeyeye, K.; She, K.; Meireles, I. Beyond the flow rate: the importance of thermal range, flow intensity, and distribution for water-efficient showers. Environ. Sci. Pollut. Res. 2020, 27, 4640–4660. [Google Scholar] [CrossRef]
- Kendrick, D.; Stewart, J.; Smith, S.; Coupland, C.; Hopkins, N.; Groom, L.; Towner, E.; Hayes, M.; Gibson, D.; Ryan, J.; O’Donnell, G.; Radford, D.; Phillips, C.; Murphy, R. Randomised controlled trial of thermostatic mixer valves in reducing bath hot tap water temperature in families with young children in social housing. Arch. Dis. Child. 2011, 96, 232–239. [Google Scholar] [CrossRef]
- Zhang, D.; Mui, K.-W.; Wong, L.-T. Establishing the Relationship between Occupants’ Thermal Behavior and Energy Consumption during Showering. Buildings 2023, 13, 1300. [Google Scholar] [CrossRef]
- Shahmohammadi, S.; Steinmann, Z.; King, H.; Hendrickx, H.; Huijbregts, M.A.J. The influence of consumer behavior on energy, greenhouse gas, and water footprints of showering. J. Ind. Ecol. 2019, 23, 1186–1195. [Google Scholar] [CrossRef]
- Albrecht, K.; Keuler, J.; Pärisch, P. Influence of specific characteristics of subjects and environmental conditions on comfort level during showering. J. Phys. Conf. Ser. 2023, 2600, 092014. [Google Scholar] [CrossRef]
- Bruce-Konuah; Jones, R.V.; Fuertes, A.; Messi, L.; Giretti, A. The role of thermostatic radiator valves for the control of space heating in UK social-rented households. Energy Build. 2018, 173, 206–220. [Google Scholar] [CrossRef]
- Stephen, F.R.; Murray, J.P. Prevention of hot tap water burns - a comparative study of three types of automatic mixing valve. Burns 1993, 19, 56–62. [Google Scholar] [CrossRef]
- Fafoutellis, P.; Mantouka, E.G.; Vlahogianni, E.I. Eco-Driving and Its Impacts on Fuel Efficiency: An Overview of Technologies and Data-Driven Methods. Sustainability 2020, 13, 226. [Google Scholar] [CrossRef]
- Miqdady, T.; Benavente, J.; Coloma, J.F.; García, M. Driving Sustainability: Analyzing Eco-Driving Efficiency Across Urban and Interurban Roads with Electric and Combustion Vehicles. World Electr. Veh. J. 2025, 16, 143. [Google Scholar] [CrossRef]
- JORF; n°291, Arrêté du 30 novembre 2005 modifiant l’arrêté du 23 juin 1978 relatif aux installations fixes destinées au chauffage et à l’alimentation en eau chaude sanitaire des bâtiments d’habitation, des locaux de travail ou des locaux recevant du public. 2005.
Figure 1.
Detailed instrumentation for the recording of physical parameters during showering.
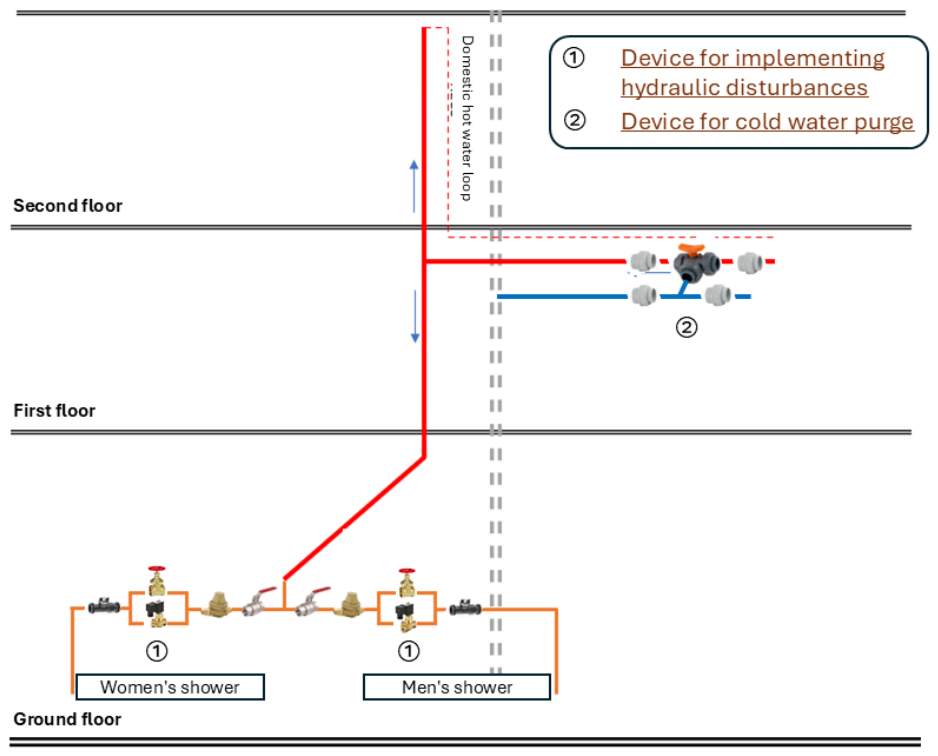
Figure 2.
Experimental shower signatures (cold water and hot water flow rates respectively in blue and green for the shower stall N° 1, and cold water and hot water flow rates respectively in red and purple for the shower stall N° 2).
Figure 2.
Experimental shower signatures (cold water and hot water flow rates respectively in blue and green for the shower stall N° 1, and cold water and hot water flow rates respectively in red and purple for the shower stall N° 2).
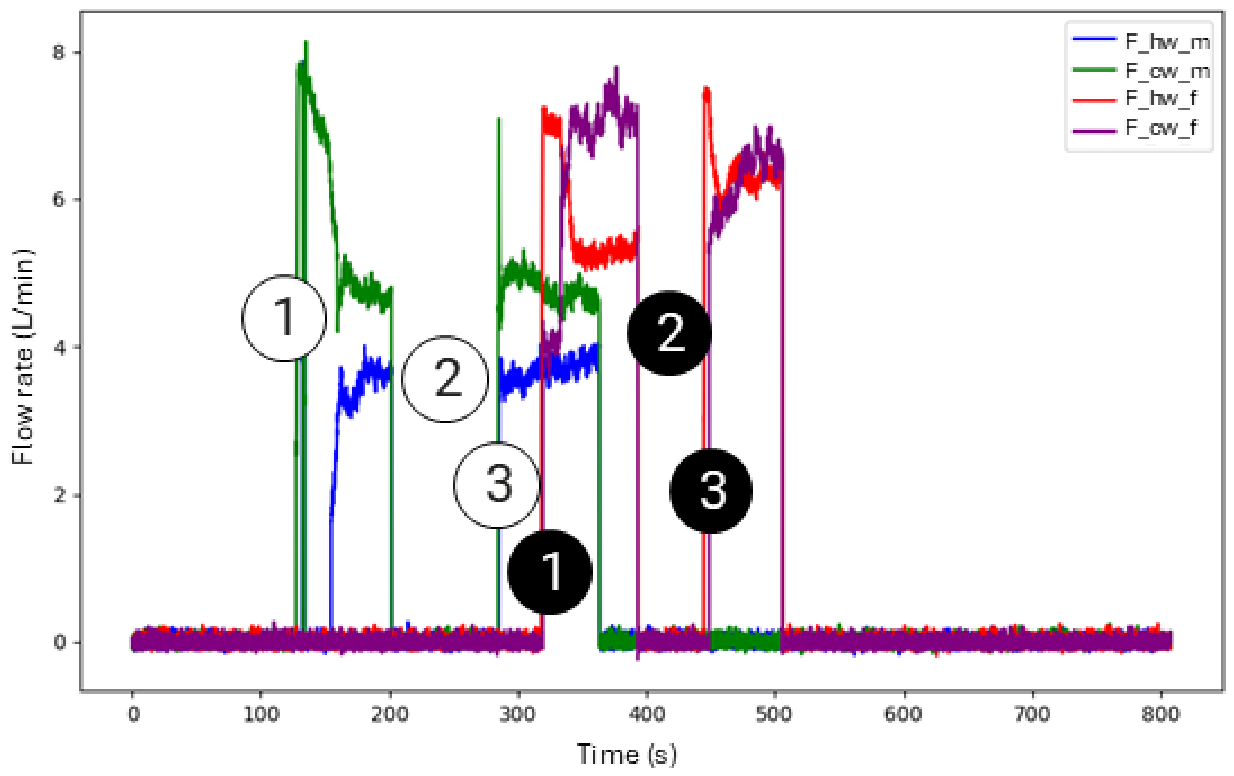
Figure 3.
Distribution of shower durations by gender.
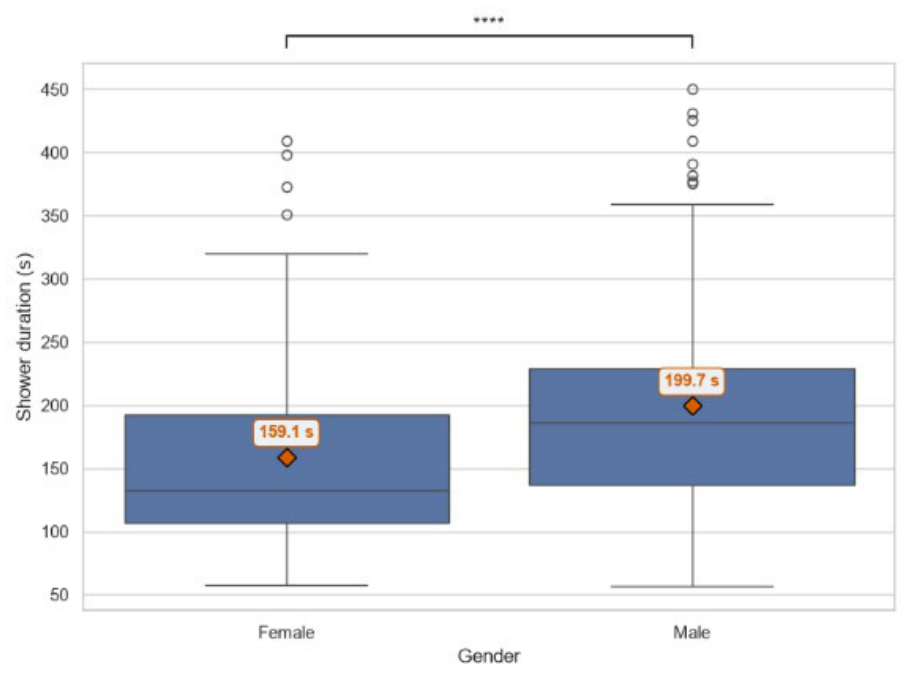
Figure 4.
Distribution of shower durations by faucet and showerhead technology.
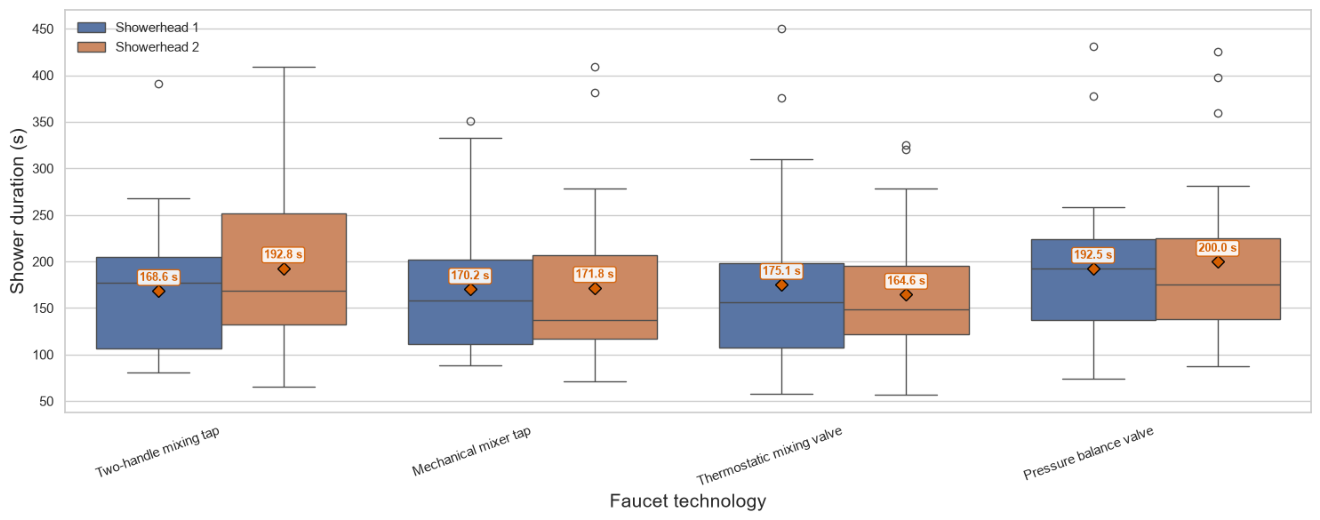
Figure 5.
Distribution of mixed-water temperatures by gender.
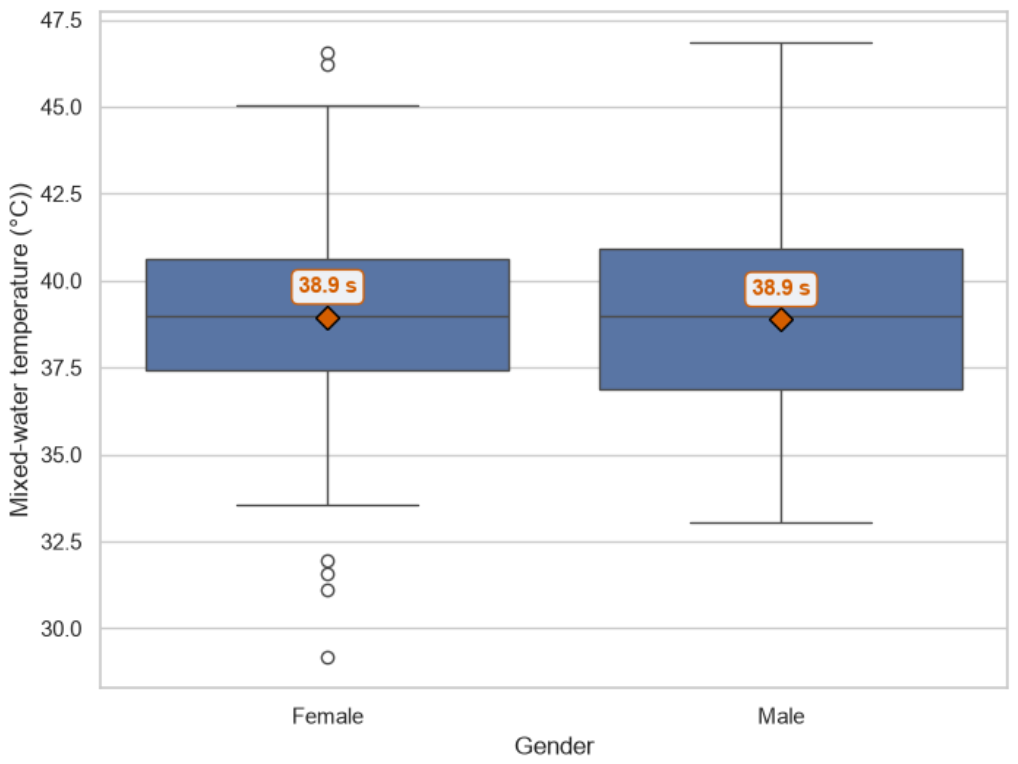
Figure 6.
Distribution of mixed-water temperature by faucet technology.
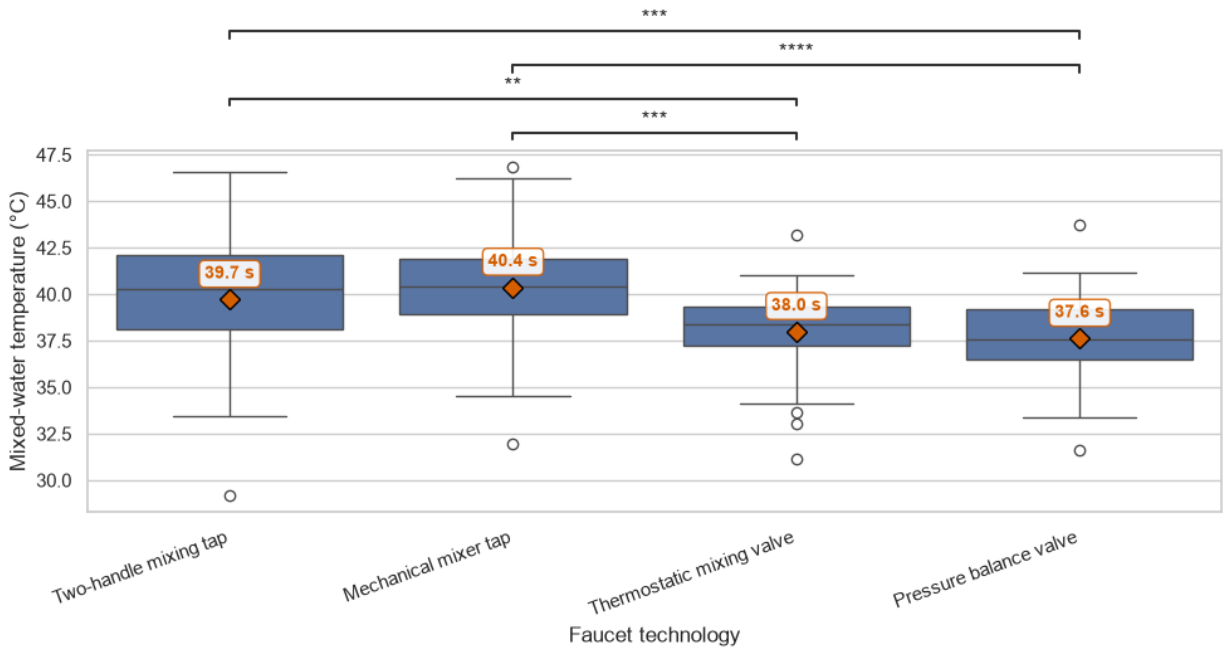
Figure 7.
Distribution of initial temperature adjustment duration by faucet technology.
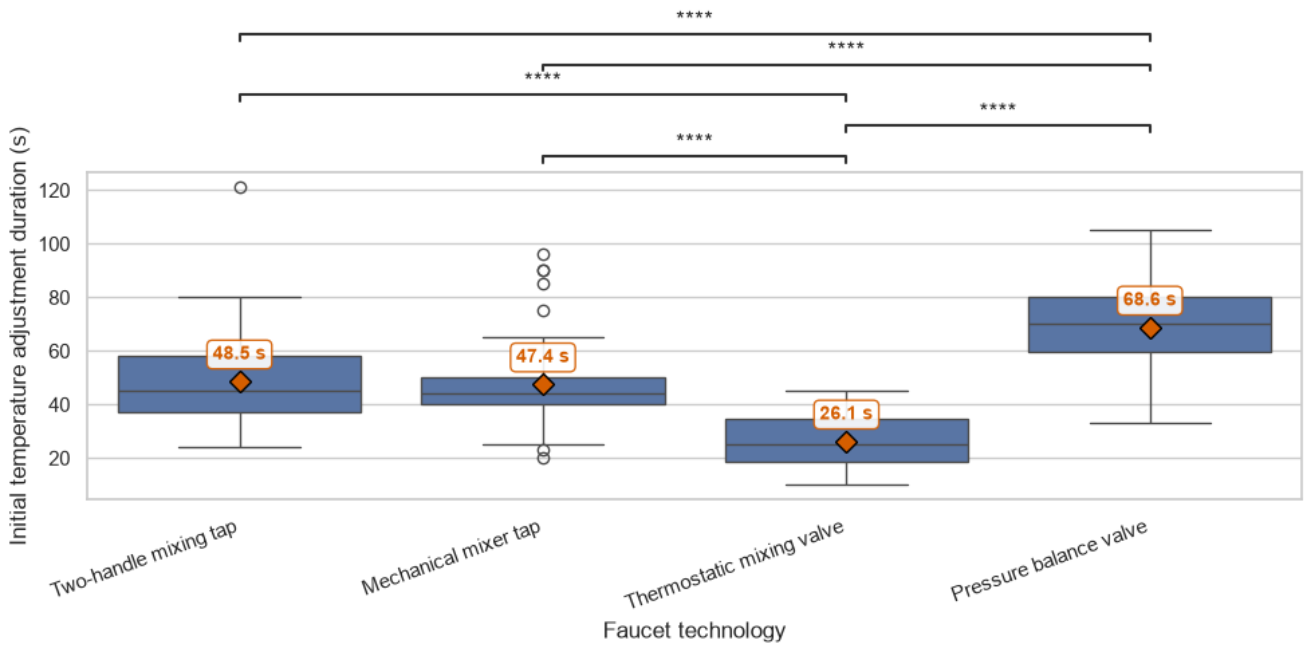
Figure 8.
Distribution of readjustment duration after interrupting flow by faucet technology.
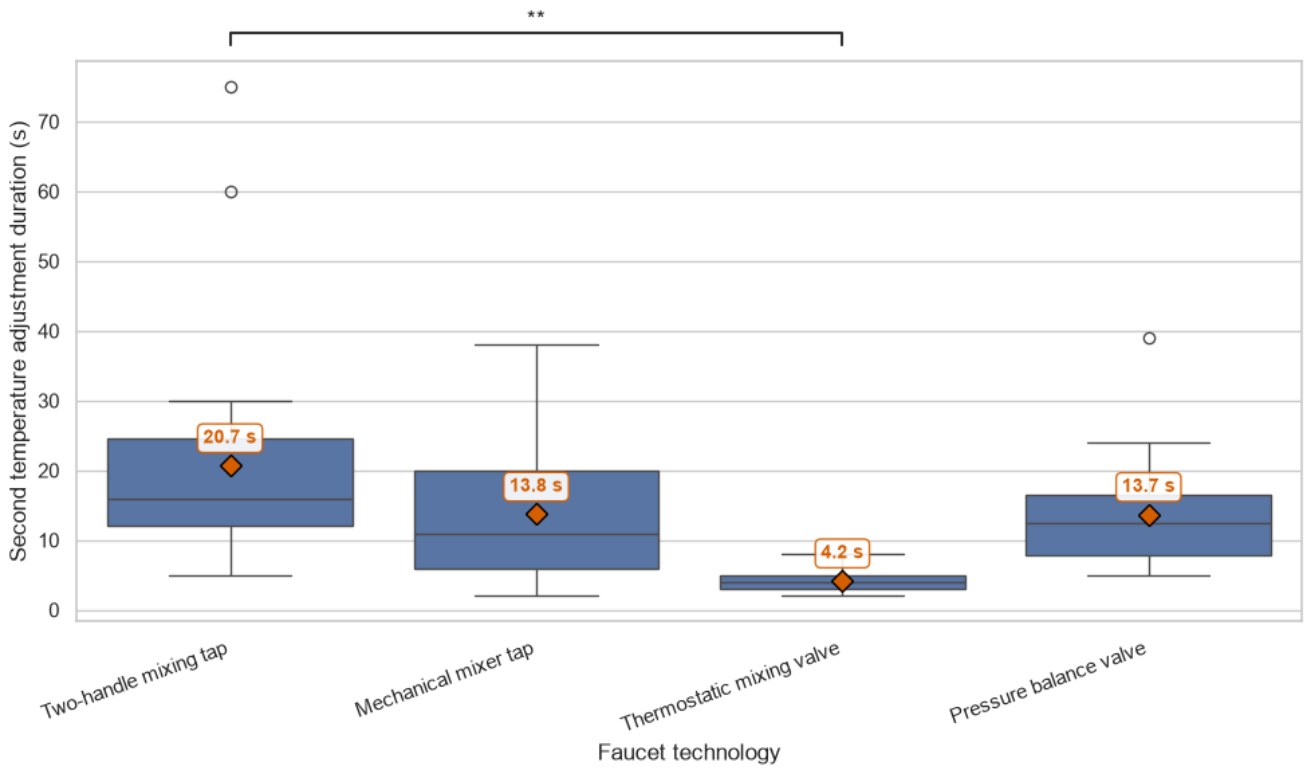
Table 1.
Detailed instrumentation for the recording of physical parameters during showering.
| Parameter | Sensor position | Material | Measuring range | Illustration |
|---|---|---|---|---|
| Pressure | cold water supply | Digital pressure gauge PM63 (Nöding Messtechnik GmbH) | 0 to 6 bars | 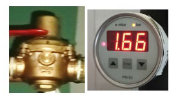 |
| hot water supply | ||||
| Flow rate | cold water supply | vortex flow meter (DN8 caliber, Bamo mesures) | 0.9 to 15 L/min | 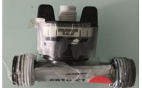 |
| hot water supply | ||||
| Temperature | cold water supply | PT100 sensor | -40 °C-350 °C, class A (+/-0.15 °C) | 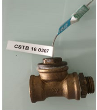 |
| hot water supply | ||||
| at the mixer tap outlet (mixed water) |
Table 4.
Soap application durations (in seconds) and the number of soap applications by faucet technology.
Table 4.
Soap application durations (in seconds) and the number of soap applications by faucet technology.
| Soap application duration per shower event (s) |
Number of soap applications per shower event (s) |
|||
|---|---|---|---|---|
| From experimental testing | From online survey | From experimental testing | From online survey | |
| Pressure balance valve | 39 | 1.17 | ||
| Mechanical mixer tap | 34 | 1.10 | ||
| Two-handle mixing tap | 37 | 1.08 | ||
| Thermostatic mixing valve | 41 | 1.20 | ||
| Mean | 37.5 | 60 | 1.13 | 1,4 |
Disclaimer/Publisher’s Note: The statements, opinions and data contained in all publications are solely those of the individual author(s) and contributor(s) and not of MDPI and/or the editor(s). MDPI and/or the editor(s) disclaim responsibility for any injury to people or property resulting from any ideas, methods, instructions or products referred to in the content. |
© 2026 by the authors. Licensee MDPI, Basel, Switzerland. This article is an open access article distributed under the terms and conditions of the Creative Commons Attribution (CC BY) license (http://creativecommons.org/licenses/by/4.0/).
Copyright: This open access article is published under a Creative Commons CC BY 4.0 license, which permit the free download, distribution, and reuse, provided that the author and preprint are cited in any reuse.