

Submitted:
22 August 2026
Posted:
25 August 2026
You are already at the latest version
Abstract
Triatoma infestans is the main vector of Trypanosoma cruzi in the South Cone, where vectorial transmission of Chagas is still occurring despite control campaigns with pyrethroid insecticides. High pyrethroid resistance was detected in T. infestans populations from Argentina and Bolivia. This raises the urgent need of including strategies for monitoring and management of insecticide resistance as an essential component of control campaigns. Voltage-gated sodium channel is the target site of pyrethroids; single-nucleotide polymorphisms in the gene encoding this channel, called kdr variants, are associated with pyrethroid resistance in T. infestans. The early detection of kdr in a population allows taking control decisions timely. In this work, we present the development of a high-throughput assay based on multiplex High Resolution Melting for genotyping kdr variants in this species. We characterized T. Infestans populations according to their toxicological response to deltamethrin, and efficiently used this assay for genotyping. Our work confirms that high pyrethroid resistance is strongly associated with kdr variants in T. Infestans, and provides a high-throughput method for vector surveillance and resistance management.
Keywords:
voltage-gated sodium channel
; insecticide
; vector management
; L1014f
; L925i
1. Introduction
Chagas disease was recognized as a neglected tropical disease (NTD) in 2005 by the World Health Organization (WHO), and was subsequently included it in its global plans and roadmaps for neglected tropical diseases [1]. It is caused by the protozoan parasite Trypanosoma cruzi, which is transmitted to humans through the feces of triatomine insects (kissing bugs) during feeding on host blood. The disease affects around 8 million people over the world, being endemic in tropical areas from Central and South America; global warming and population movements spread Chagas to non-endemic areas [1]. Thirty to 40% of people living with Chagas develop cardiac and/or digestive disease, which are cause of disability and even death. Despite efforts in control campaigns using pyrethroid insecticides, vectorial transmission of T. cruzi could not be stopped in wide areas of the Southern Cone, where Triatoma infestans act as a domiciliary vector. Insecticide resistance and domiciliation of T. infestans in both urban and rural dwellings are important challenges for the prevention of T. cruzi transmission [2].
Spraying of infested dwellings with pyrethroid insecticides has been the method of choice for triatomine control for the last 30 years, given the favorable toxicological properties of these insecticides [3]. Since 2005, high pyrethroid resistance has been reported in the Bolivian-Argentinean border and in the Chaco province in Argentina, regions where both infestations of dwellings with T. infestans and T. cruzi transmission occur [3]. Regulatory and toxicological considerations prevent the use of alternative insecticides, making pyrethroid resistance a relevant problem for public health [4]. Integrated vector management strategies are recommended by the WHO for an efficient and sustainable control of arthropod vectors [5]. Among these strategies, the early monitoring of resistance is essential for a cost-effective and integrated vector management [5]. The diagnostics of single nucleotide polymorphisms associated with resistance allows an early detection, given that the detection of a carrying individual, before the mutation is fixed in the population, can be achieved.
Pyrethroid insecticides act through the voltage-gated sodium channel (VGSC), present in the membranes of excitable cells. Genetic variants in the gene encoding this channel have been associated with high levels of pyrethroid resistance in insects [6]. These mutations are called knockdown resistance (kdr) variants, given that they confer low sensitivity for pyrethroids, and the consequent resistance to knockdown [6]. Most kdr mutations in insects were found in domain II of this large membrane protein, particularly in the region comprised between transmembrane segments IV and VI (IIS4-IIS6 region). In our previous work, we described two kdr mutations located in domain II of the gene (Figure 1): Leu to Ile in position 925 (L925I), present in resistant populations from the Argentinean Chaco, and Leu to Phe in position 1014 (L1014F), characteristic of resistant populations in the Bolivian-Argentinean border [7,8,9]. Even though other contributive mechanisms could exist [10,11,12,13,14], kdr is the main insecticide-conferring resistance mechanism known for triatomines reported to date.
Sensitive detection of pyrethroid resistance is a prerequisite for vector management. For this, the genotyping of kdr variants is a valuable tool, faster and more sensitive than toxicological determinations [15]. In our previous work, we have developed two methods for the molecular diagnosis of L925I and L1014F variants; these methods are based on differential digestion by restriction endonucleases (REA) or allele-specific PCR (PASA), respectively [7,8,9]. Both methods are robust and can be carried out in laboratories with basic equipment. However, real-time PCR-based methods, such as multiplex High Resolution Melting (mHRM), could improve the throughput of the genotyping, by resolving both mutations in a single PCR reaction, followed by the analysis of melting curves (MCs) [16].
HRM is a high-throughput genotyping technique, based on the interpretation of the MC produced during denaturation step, after PCR amplification with a double-strand DNA dye [16]. Given the high sensitivity of the technique, single mutations will cause distinguishable melting temperatures (MTs) and/or different shapes in the MC, which are more evident whenever the substitution is a guanine/cytosine by adenine/thymidine. However, a possible drawback of HRM method is that MC interpretation could be challenging and time-consuming, mainly when the substitution occurs between two purinic or two pyrmdinic bases, given the smaller shift in the MT of the amplicons.
In this work, we present the development of an efficient mHRM-based assay to genotype kdr mutations in VGSC from T. infestans. We compared HRM with previous methods regarding their performance and cost-efficiency. Finally, we determined the pyrethroid resistance status of different natural populations from Argentina, and tested the presence of kdr variants in these populations by mHRM. Our results confirm that kdr mutations strongly correlate with high-resistant phenotype in the species, and indicates that mHRM is a cost-effective method for genotyping these mutations in T. infestans. We conclude that kdr genotyping by mHRM could be incorporated for resistance monitoring and management of T. cruzi vectors in the Southern Cone.
2. Material and Methods:
2.1. mHRM Assay Development
The Primers3 v.0.4.0 software (http://bioinfo.ut.ee/primer3–0.4.0/primer3/) was used for the primer design flanking the positions named 925 and 1014 of the vgsc gene from T. infestans (see primer sequences in Table 1). Amplicons’ MTs were predicted with the uMELT online software (https://www.dna.utah.edu/umelt/umelt.html). GC tails were added to forward and reverse primers of 1014 amplicon to differentiate at least for 2 °C MT both amplicons.
| Table 1 | ||
| Primer name | 5’-3’ sequence | |
| VGSC925 qPCR Fw | TGGCCAACATTGAATTTATTGATATC | |
| VGSC925 qPCR Rv | TAAGACAAATGTCAAATTGCCAA | |
| VGSC1014 qPCR Fw GC | CCGGCGGCGGTGTGGGACTGTATGCACGTT | |
| VGSC1014 qPCR Rv GC | CCGGCGGCGGAATATATAAAGTACTTACAAC |
Plasmidic DNA was used for setting mHRM reaction. Standard templates were prepared based on the strategy described previously [7]. Briefly, genomic DNA fragments encompassing the L1014F or L925I resistance alleles were PCR-amplified from pools of 10 insects with known genotypes from Villa del Carmen (L1014F) and El Juramento (L925I) populations. The PCR products were cloned into pGEM-T (Promega) plasmids, and the resulting plasmids were used to generate standards with defined resistant:susceptible molar ratios for each position. The standard DNA templates were mixed at the following molar ratios: 0:10, 1:9, 2:8, 3:7, 4:6, 5:5, 6:4, 7:3, 8:2, 9:1, 10:0 (resistant allele: susceptible allele at each mutation site). The identity of the cloned inserts was confirmed by Sanger sequencing (Macrogen. Seoul, Korea)
Both the RT-PCR and mHRM reaction steps were performed on the ArialMx Real time PCR instrument (Applied Biosystems). PCR was performed in 12 μl containing 6 μl Eva green master mix (Applied Biosystems) and either plasmidic (10 ng) or genomic DNA (40-100ng). The primer concentrations were optimized individually for the specific amplicons, and later in the mHRM, in order to obtain both amplicons in a similar concentration. The following primer combinations were assayed: a) 150 nM VGSC925 qPCR Fw and VGSC925 qPCR Rev/ 300 nM VGSC1014 qPCR Fw GC Fw and VGSC1014 qPCR Rv GC; b) 300 nM VGSC925 qPCR Fw and VGSC925 qPCR Rv/ 150 nM VGSC1014 qPCR Fw GC and VGSC1014 qPCR Rv GC; c) 200 nM VGSC925 qPCR Fw and VGSC925 qPCR Rv/ 200 nM VGSC1014 qPCR Fw GC and VGSC1014 qPCR Rv GC. For further mHRM assays, the first alternative was used. The PCR amplification protocol began with a denaturation step at 95 °C for 3 min, followed by 40 cycles of 5 seconds denaturation at 95 °C and 30 seconds annealing-extension at 62 °C. After amplification, the reaction tubes were cooled to 55 °C; then warmed from 55 °C to 95 °C at the rate of 0.2 °C/second. The MCs were analyzed with AriaMX 1.5 software (Agilent). Plasmids carrying inserts of known genotype were used as standard reference in all the reactions.
2.2. Sensitivity Determination
The standard DNA templates of known genotype inserted in plasmids were pooled in known proportions of “kdr” and “susceptible” genotype in each mutation position (925 or 1014). Samples of 100%, 90%, 80%, 70%, 60%, 50%, 40%, 30%, 20%, 10% and 0% of kdr mutation were obtained for each one of these sites.
2.3. Insects
T. infestans were collected from Argentinean localities (Figure 2; Table 2) as previously described [7]. For the populations from El Juramento, La Gerónima, El Malá, and the Bolivian populations from Tierras Nuevas and Villa del Carmen, DNA previously obtained in that study was used; the remaining populations analyzed were genotyped here for the first time (Table 2). The insects collected in the field were raised at the former Centro de Referencia de Vectores (Córdoba, Argentina) under controlled conditions (26 ± 1 ° C, 60 ± 10% RH and 12:12 LD). Insects were fed on chickens every 15 days. The corresponding protocol for chicken care has been officially submitted to the Institutional Animal Care and Use Committee (CICUAL - FCE-UNLP) and is under registration number 005-00-26. The housing, care, feeding, and handling of the chickens adhered to Resolution 1047/2005 (Consejo Nacional de Investigaciones Científicas y Técnicas, CONICET, http://tux.iar.unlp.edu.ar/boletin/bol-set08/RD20080711_1619.pdf). This resolution outlines the national ethical framework for biomedical research involving laboratory, farm, and wild animals, and is consistent with international standard procedures. Biosafety measures were in accordance with CONICET Resolution 1619/2008, which aligns with the World Health Organization Laboratory Biosafety Manual (https://www.who.int/publications/i/item/9789240011311).
2.4. Toxicological Determinations
The insects collected in the field were raised until obtain the F1. Toxicological status of each population was determined by topical application 0.01 mg/ml of deltamethrin in acetone, which is the discriminating dose (DD) for T. infestans. DD was applied by the topical bioassay according to the WHO protocol [20]. Briefly, a volume of 0.2 μl (2 ng) of deltamethrin in acetone was applied on the dorsal abdomen of first instar nymphs (5–7 days old, mean weight 1.3 ± 0.2 mg) starved since hatching. The application was performed with a 10-μl Hamilton syringe (Hamilton, Reno, NV) provided with a repeating dispenser. Ten insects were used for each replicate and each sample was replicated at least three times. Control groups received pure acetone. After exposition, insects were kept at laboratory conditions for 24 h when the mortality was evaluated. Criterion for mortality was the inability to walk from the center to the border of a circular 11-cm diameter filter paper. Whenever 100% of the individuals die at DD, the population was considered susceptible. For resistant populations, at least 4 doses were applied within a range that provoked from 10% to 90% mortality. Dose-mortality data were subjected to probit analysis [21] to estimate the lethal dose required to kill 50% of treated individuals (LD50) using the POLO PLUS Software. Mortality data were corrected using Abbot’s formula implemented in the POLO PLUS package. Resistance ratios (RR50s) and 95% confidence limits (CIs) were calculated as described [22]. The differences between susceptibilities of two strains were evaluated through the Lethal Dose Ratio (LDR) [22]. The LDR and its 95% CIs compare dose–response curves pairs and are based on estimates of each line (i.e., slope and its variance, intercept and its variance, and the slope-intercept covariance) and a coefficient according to the level of response in which the lines are compared (50% mortality level). Thus, the LDR estimate the susceptibility ratio between the strains compared. LDR is significantly different to 1 when the 95% CIs did not include the number 1 (P <0.05). In the context of evaluation of resistance, LDR is named the resistance ratio (RR). A given populations was considered resistant when RR50s significant differs from 1. RR50 < 10 were considered low resistance, and RR50 > 100 were considered high resistance.
2.5. DNA Extraction
For the extraction of genomic DNA, three legs and one antenna were dissected from each insect. A total of 10 insects from each population were used in pool for genomic DNA extractions with the commercial Quick Genomic DNA extraction Kit (Dongsheng Biotech, China) following the manufacturer instructions.
2.6. Statistical Analysis
For melting temperature comparisons (Figure 5C,D), the susceptible groups comprised 9 independent samples in position 925 and 11 in position 1014. The resistant groups comprised 4 independent samples in position 925 and 2 independent samples in position 1014. Each population-level DNA pool was analyzed in technical mHRM replicates. Technical replicates were treated as independent observations in the t-test, given that within-population variability was negligible compared to the genotype-associated shift in melting temperature. Differences in MT between amplicons carrying different variants in genomic DNA were analyzed by using t-test, with Welch’s correction when variances were not homogeneous, with Prism software.
3. Results
3.1. Setting mHRM Reaction
Plasmids carrying an insert of known genotype were used as standard for setting the mHRM reaction. The 925 and 1014 positions were amplified in duplex PCR, with two primer pairs in a single reaction tube. By the addition of GCs tails in 5’ regions of vgscHRM1014 forward and reverse primers (
Table 1
) a difference in MT of nearby 3 °C between 925 (MT around 75 °C) and 1014 (MT around 78,5 °C) amplicons was achieved (
Figure 3
A). This difference allowed the individual analysis of both polymorphic sites using two primer pairs in a single reaction.
As expected for a substitution of a cytosine (in the wild type) by an adenine (in the kdr variant), melting curves of the amplicon in the 925 position showed a shift of -0.4 °C when the kdr genotype L925Ikdr is present. MT was around 74.8 °C for samples carrying a cysteine (sensitive-like), and 74.4 °C for the amplicons carrying an adenine (L925Ikdr-like). The shift in MT was smaller in 1014 than in 925 position when the substitution associated with L1014Fkdr was present, given that the mutation conferring resistance is an adenine by a thymidine. This would indicate that the genotype in this position could not be easily distinguished by MT shift. The shape of the melting curve was different depending on the genotype of the amplicon in both 925 and 1014 positions, even though this difference in shape is better distinguishable in the latter (
Figure 3
B to 3E). Hence, despite the low or undetectable change in MT, L1014Fkdr substitution could be detected by analyzing the shape of the melting curve.
We studied the sensitivity of the assay for detecting the resistant mutations in a sample with complex allele composition. For this, a set of standard DNA template mixtures of known genotype were adjusted to contain an increasing frequency of one resistant mutation: 0; 10; 20; 30; 40; 50; 60; 70; 80; 90 and 100%; this strategy was repeated for both mutations. For 925 position, increasing the percentage of L925I genotype provoked a gradual shift to lower MT (
Figure 4
A). For this position, a linear correlation (R2=0.97) was observed between MTs and genotype proportions of the kdr mutation in the sample. This could allow the estimation of the percentage of mutant individuals in a test sample, by comparing with a standard curve. In the case of kdr mutation in 1014 position, the proportion between melting temperature and percentage of DNA carrying the mutation does not fit a linear regression (
Figure 4
B).
3.2. Toxicology and Genotyping of Wild Populations
Six natural T. infestans populations from 5 Argentinean provinces were evaluated to determine their resistance status by a toxicological assay (
Figure 2
;
Table 2
). The localities studied are located in La Rioja (San Martín), Catamarca (Capayán), Córdoba (Minas), Formosa (Chiriguanos), Quitilipi (Chaco), and Nueva Pompeya (Chaco); all of them were classified as sensitive according to their response to a DD of deltamethrin.
As suggested by a previous report [7] we hypothesized that high resistance in T. infestans populations correlates to either L925Ikdr or L1014Fkdr variants. To test this hypothesis, individuals obtained from sensitive, low-resistant, or high-resistant populations were evaluated by mHRM (Table 2). Besides the samples from populations evaluated here for the first time at the toxicological level, we included samples previously classified as sensitive, middle or highly resistant (Table 2; Figure 2).
Populations were evaluated in pools of 10 individuals; the characteristic changes in the shape of the melting curve for both 925 and 1014 positions were observed (
Figure 5
A,B). Also, wild-type samples were distinguished from samples carrying the L925Ikdr variant by the expected significant shift in MT; 74.81 (+/-0.02) °C for S and 74.33 (+/- 0.02) °C for L925Ikdr (t-test, p<0.0001, N=16-30) (
Figure 5
C). For 1014 position, the shift in MT (78.27 (+/-0.02) °C for samples classified as S and 78.84 (+/- 0.11 °C) for samples classified as L1014Fkdr also reached statistical significance (t-test, p<0.001, N=27-11) (
Figure 5
D).
Figure 5.
Results of genotyping 925 and 1014 position in T. infestans vgsc gene. mHRMs were performed using genomic DNA extracted from populations presenting different toxicological phenotypes. Each dot represents a single technical replicate. A: Melting curves for amplicons in the 925 position. B: Melting curve for amplicons in the 1014 position. C: Melting temperatures of samples classified as susceptibles (S) or L925Ikdr. ***=p<0.0001 (t-test). D: Melting temperatures of samples classified as susceptibles (S) or L1014Fkdr ***=p<0.0001 (t-test with Welch’s correction).
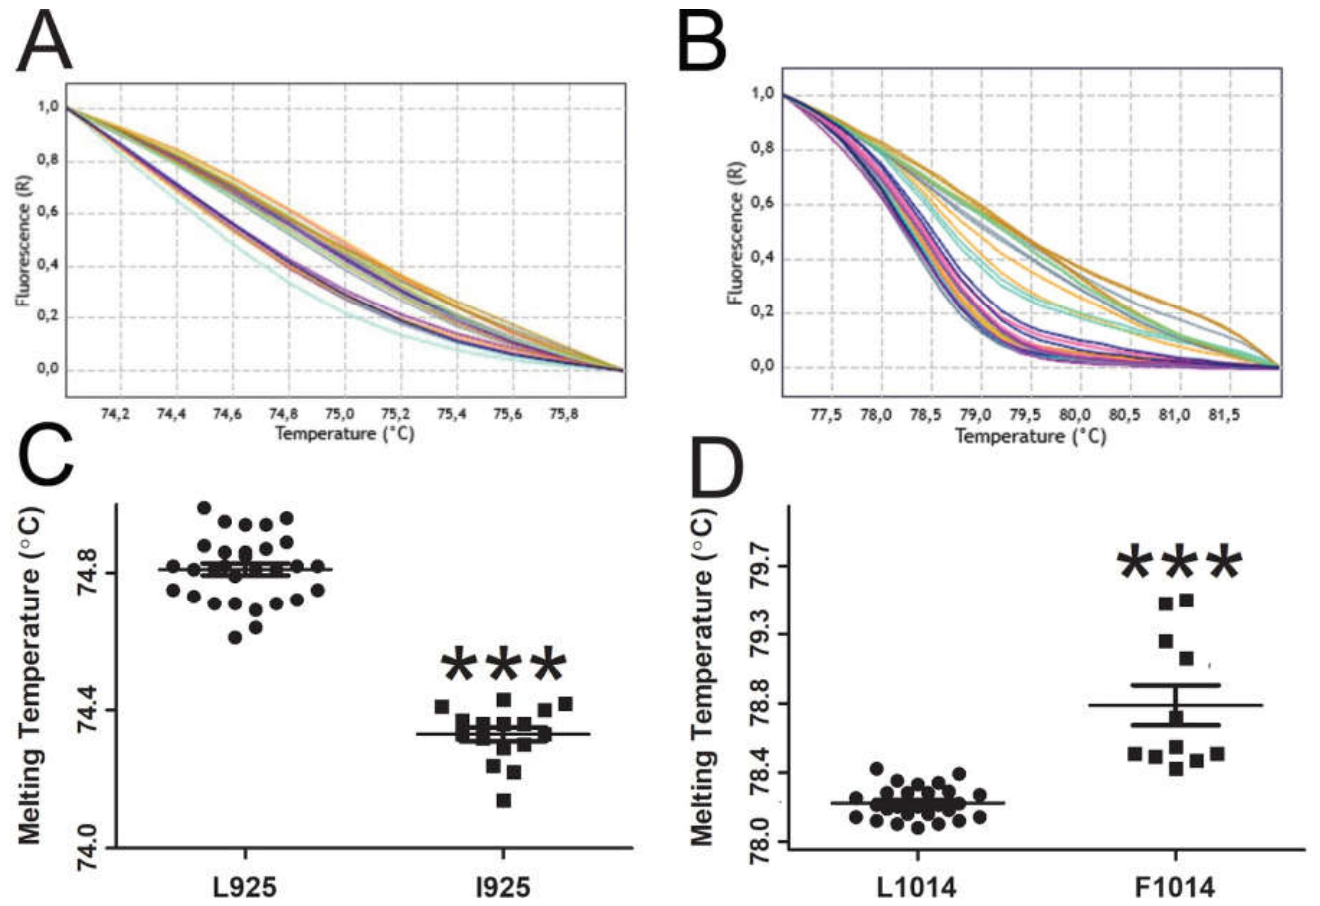
Interestingly, we found that all the individuals belonging to populations classified as susceptible or low resistant in toxicological assays were assigned to the susceptible variant in both 925 and 1014 positions. Conversely, the individuals from high resistant populations from Argentina were assigned to the L925Ikdr, and those from the Bolivian middle resistant populations were assigned to the L1014Fkdr variant (
Table 2
).
4. Discussion
Insecticide resistance spreading is a challenge for the vector control programs; for this reason, strategies to delay resistance must be implemented in rational control campaigns. Monitoring of resistant-associated mutations in the field is a requisite for the implementation of management strategies that prolong the utility of insecticides. This information is an important resource for successful decisions making on control strategies.
T. infestans demonstrated a potential to develop extremely high levels of resistance to pyrethroids [2,23], which is recognized as one of the main challenges for stopping the vectorial transmission of T. cruzi in the South Cone. The results presented here (Table 2) are in agreement with previous reports [7,8,9], indicating that this extremely resistant phenotype is mainly due to kdr mutations in vgsc gene. In that sense, the kdr variants could be considered a reliable molecular marker for determination of resistance in the field, a relevant information for decision making in vector control campaigns. The genotyping of kdr could be rapid, straightforward, and sensitive when compared with toxicological determinations. For this, the development of high-throughput genotyping methods will be necessary.
In our previous work, we provided two molecular genotyping methods based on PASA and REA, to genotype L1014Fkdr and L925Ikdr in T. infestans, respectively [7,8,9]. Here we present a new method based on mHRM, that augments the throughput in those laboratories with access to a well-calibrated qRT-PCR system. A comparison of PASA+REA and mHRM for the genotyping of both kdr mutations is provided in Table 3. Both methods are efficient and reliable; the main advantage of mHRM is its higher throughput and lower cost. This is due to the characteristic “one-step” closed-tube method that allows the genotyping of both kdr mutations in a single reaction. The frequency observed in the kdr mutations in T. infestans, where genotypes are almost fixed in populations, allows the pooled analysis (i.e up to 10 individuals in a single tube), to save time and resources. In the case that individual genotyping is necessary, these costs will be increased, particularly for 1014 positions, where variants are more difficult to distinguish from pooled samples. Hence, we estimated that the implementation of mHRM implies a 3 h by quantification of around 88 samples (one complete plate). The experimental steps include DNA purification and mHRM reactions, whereas PASA+REA involve DNA purification, 5 PCRs, 1 enzymatic digestion and gel electrophoresis. The main advantage of PASA+REA is that it can be implemented in a middle-equipped lab (Table 3).
As expected, results showed that L925Ikdr is more easily distinguished from the wild-type than L1014F by mHRM technique. This is due to the higher shift in MT in the substitution C to A (position 925) compared with A to T (position 1014); we found that a change in MC shape is useful for complementing the genotyping in both positions. In further developments, algorithms could be designed for automatic interpretation of mHRM results, by considering both MT and MC parameters. In suspicious cases or populations with mixed genotypes, mHRM could be complemented with alternative techniques, such as Sanger sequencing, PASA and REA [8,9]. The increase in the throughput of the method with respect to previous alternatives could help in the implementation of genotype monitoring as a routine activity before insecticide treatments. In the regions with vector presence, triatomine control is a task organized and implemented by governments. This could facilitate the centralization of the genotyping activity in a single laboratory receiving samples from a wide region. Hence, the initial investment in equipment required for high-throughput genotyping methods would be justified by the reduction in time and costs.
Resistance to pyrethroids in T. infestans has expanded in last years. From the original reports in Bolivian-Argentinean border and the Chaco province in Argentina, other regions with variable resistance levels were reported [19,23]. However, the higher percentages of highly resistant populations were reported in Güemes department, Chaco province [19,23]. We did not found toxicological resistance nor kdr substitutions in the previously unreported populations from Catamarca, Córdoba, Formosa, La Rioja and Chaco. Interestingly, we found that either L925Ikdr or L1014Fkdr always correlated with a phenotype of high resistance to pyrethroids. We confirmed that the L925Ikdr is characteristic of resistant populations originary from Güemes department in Chaco Province (Argentina) and L1014Fkdr in those from Tarija Department (Bolivia), reinforcing the hypothesis of two resistant origins [7]. Genotyping of individuals from susceptible, middle and high resistant natural populations would be important to obtain further insights on the situation of resistance in the field, and in the molecular background of resistance in T. infestans. This information will be important in both basic entomology, and for a better design of the vector control strategies. The early detection of populations with the potential to develop high resistance is required, in order to take rational decisions on time. In this context, we present here a high-throughput tool that can accelerate the genotyping of kdr mutations associated with high resistance in the species. The implementation of safe alternatives is becoming urgent, in order to complement or replace pyrethroids when resistance is detected.
Author Contributions
IS: Conceptualization, sample preparation, formal analysis, data curation, writing review and editing. LMT: Conceptualization, data curation, formal analysis, AG: sample preparation, formal analysis; PAL: Conceptualization, sample preparation, manuscript editing, GMC: Conceptualization, sample preparation, manuscript editing; GD: data curation, formal analysis. MSS: Conceptualization, funding acquisition. SO: Conceptualization, investigation, formal analysis, data curation, writing the original draft, project administration, funding acquisition.
Funding
Funding for experiments were provided by Agencia Nacional de Promoción de la Investigación, el Desarrollo Tecnológico y la Innovación (PICT startup 2018-0275).
Data availability
All the data supporting the results is provided in the manuscript.
Acknowledgments
IS, LMT, SO, GMC, PAL and MSS are researchers from Consejo Nacional de Investigaciones Científicas y Técnicas (CONICET). GD is technical personnel from CONICET. .:
References
- World Health Organization. Ending the Neglect to Attain the Sustainable Development Goals: A Road Map for Neglected Tropical Diseases 2021–2030; World Health Organization, 2020. [Google Scholar]
- Mougabure-Cueto, G.; Fronza, G.; Nattero, J. What happens when the insecticide does not kill? A review of sublethal toxicology and insecticide resistance in triatomines. Med. Vet. Entomol. At. 2024. [Google Scholar] [CrossRef] [PubMed]
- Mougabure-Cueto, G.; Picollo, M. I. Insecticide Resistance in Triatomines. In Triatominae - The Biology of Chagas Disease Vectors; Guarneri, A. A., Lorenzo, M. G., Eds.; Springer, 2021; pp. 537–555. [Google Scholar]
- Gurtler, R.; Cecere, M. C. Chagas disease vector control. In Triatominae - The Biology of Chagas Disease Vectors; 2021; pp. 491–594. [Google Scholar]
- Cameron, M. M.; Bell, M.; Howard, A. F. V. Integrated vector management. Biol. Environ. Control Dis. Vectors 2013, 24, 175–189. [Google Scholar] [CrossRef]
- Zhorov, B. S.; Dong, K. Pyrethroids in an AlphaFold2 Model of the Insect Sodium Channel. Insects 2022, 13. [Google Scholar] [CrossRef] [PubMed]
- Sierra, I.; Capriotti, N.; Fronza, G.; Mougabure-Cueto, G.; Ons, S. Kdr mutations in Triatoma infestans from the Gran Chaco are distributed in two differentiated foci: Implications for pyrethroid resistance management. Acta Trop. 2016, 158, 208–213. [Google Scholar] [CrossRef] [PubMed]
- Fabro, J.; et al. Identification of a point mutation associated with pyrethroid resistance in the para-type sodium channel of Triatoma infestans, a vector of Chagas’ disease. Infect. Genet. Evol. 2012, 12, 487–91. [Google Scholar] [CrossRef] [PubMed]
- Capriotti, N.; Mougabure-Cueto, G.; Rivera-Pomar, R.; Ons, S. L925I mutation in the Para-type sodium channel is associated with pyrethroid resistance in Triatoma infestans from the Gran Chaco region. PLoS Negl. Trop. Dis. 2014, 8, e2659. [Google Scholar] [CrossRef] [PubMed]
- Orihuela, P. L. S.; Vassena, C. V.; Zerba, E. N.; Picollo, M. I. Relative contribution of monooxygenase and esterase to pyrethroid resistance in Triatoma infestans (Hemiptera: Reduviidae) from Argentina and Bolivia. J. Med. Entomol. 2008, 45, 298–306. [Google Scholar] [CrossRef]
- Pedrini, N.; et al. Control of pyrethroid-resistant Chagas disease vectors with entomopathogenic fungi. PLoS Negl. Trop. Dis. 2009, 3, e434. [Google Scholar] [CrossRef] [PubMed]
- Germano, M. D.; et al. New Findings of Insecticide Resistance in Triatoma infestans (Heteroptera: Reduviidae) From the Gran Chaco. J. Med. Entomol. 2010, 47, 1077–1081. [Google Scholar] [CrossRef] [PubMed]
- Dulbecco, A. B.; et al. Integument CYP genes of the largest genome-wide cytochrome P450 expansions in triatomines participate in detoxification in deltamethrin-resistant Triatoma infestans. Sci. Rep. 2018, 8, 2–13. [Google Scholar] [CrossRef] [PubMed]
- Fronza, G.; et al. Insecticide Resistance Mechanisms in Triatoma infestans (Reduviidae: Triatominae): The Putative Role of Enhanced Detoxification and Knockdown Resistance (kdr) Allele in a Resistant Hotspot From the Argentine Chaco. J. Med. Entomol. 2020, 57. [Google Scholar] [CrossRef] [PubMed]
- Devillers, J.; et al. Integrated Plan of Insecticide Resistance Surveillance in Mosquito Vectors in France. Insects 2023, 14, 1–17. [Google Scholar] [CrossRef] [PubMed]
- Barrera-Illanes, A. N.; et al. First report on knockdown resistance mutations in wild populations of Aedes aegypti from Argentina determined by a novel multiplex high-resolution melting polymerase chain reaction method. Parasites Vectors 2023, 16. [Google Scholar] [CrossRef] [PubMed]
- Remón, C.; et al. Resistance to deltamethrin in Triatoma infestans: Microgeographical distribution, validation of a rapid detection bioassay and evaluation of a fumigant canister as control alternative strategy. Bull. Entomol. Res. 2020, 110, 645–653. [Google Scholar] [CrossRef] [PubMed]
- Carvajal, G.; Mougabure-Cueto, G.; Toloza, A. C. Toxicity of non-pyrethroid insecticides against Triatoma infestans (Hemiptera: Reduviidae). Mem. Inst. Oswaldo Cruz 2012, 107, 675–9. [Google Scholar] [CrossRef] [PubMed]
- Fronza, G.; Toloza, A. C.; Mougabure-Cueto, G. A.; Carbajo, A. E. Pyrethroid resistance distribution in Triatoma infestans and environmental association along the Argentine endemic zone. Acta Trop. 2024, 257. [Google Scholar] [CrossRef] [PubMed]
- World Health Organization (WHO). Protocolo de evaluación de efecto insecticida sobre triatominos. Acta Toxicol. Argent. 1994, 2, 29–32. [Google Scholar]
- LITCHFIELD, J. T.; WILCOXON, F. A simplified method of evaluating dose-effect experiments. J. Pharmacol. Exp. Ther. 1949, 96, 99–113. [Google Scholar] [CrossRef]
- Robertson, J.; Russell, R.; Prisler, H.; Sabin, N.E. Bioassays with Arthropods. 2007. [Google Scholar] [CrossRef]
- Lobbia, P. A.; et al. Spatio-temporal dynamics of deltamethrin resistance in Triatoma infestans: Challenges for chagas disease vector control in Argentina. Acta Trop. 2025, 270. [Google Scholar] [CrossRef] [PubMed]
Figure 1.
Triatoma infestans voltage-gated sodium channel scheme. Positions of the variants 925 and 1014 are indicated. For each variant, the corresponding nucleotide and encoded aminoacid (between brackets) are indicated. The channel is represented with domains I-IV, each with the six transmembrane segments (S1-S6).
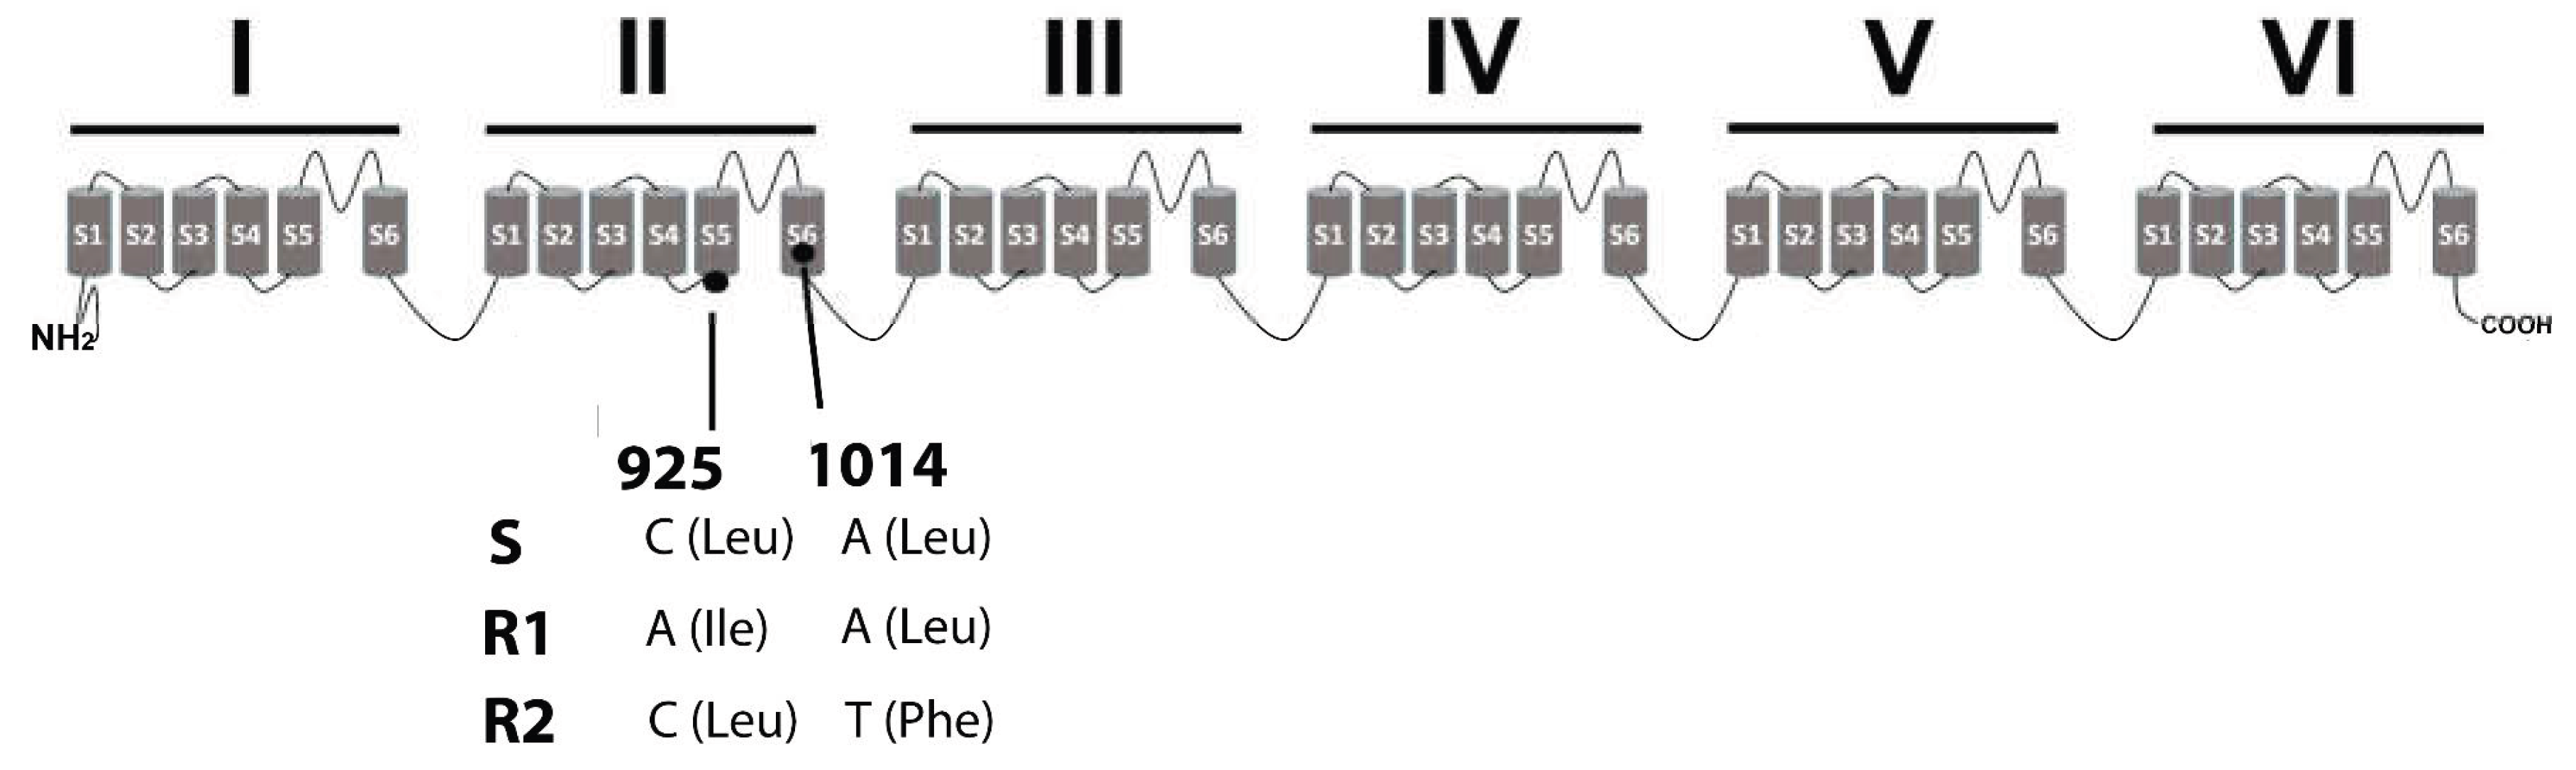
Figure 2.
Geographic distribution of the populations that originated the strains assayed in this study. Green circles indicate susceptibility; red circle indicates high resistant L925Ikdr ; yellow circle indicates high resistant L1014Fkdr. 25M; 25 de Mayo; BP: Balde de Punta; CH: Chiriguanos; EA: El Asustado; EJ: El Juramento; EM: El Malá; LG: La Gerónima; M: Minas; SM: San Martín; NP: Nueva Pompeya; PA: Pampa Argentina; TN: Tierras Nuevas; VC: Villa del Carmen.
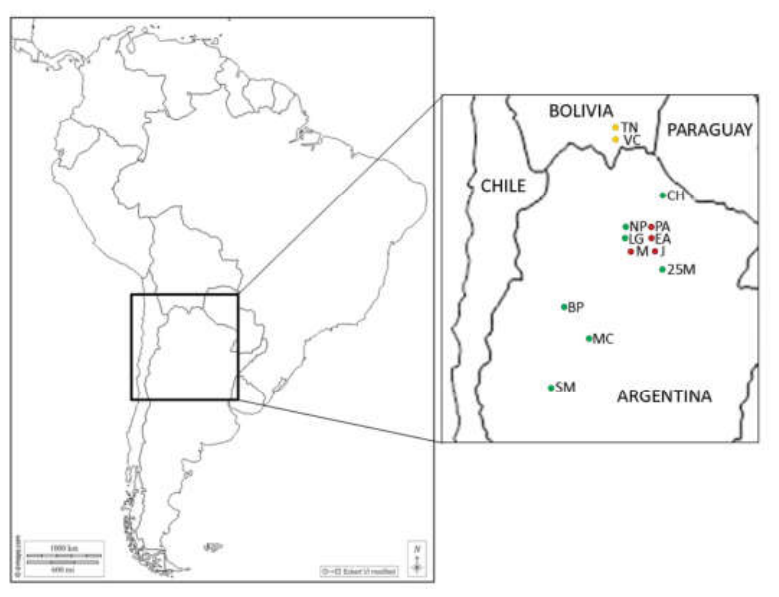
Figure 3.
Results of genotyping 925 and 1014 position in T. infestans vgsc gene with mHRM. Detection of kdr variants by melt curve analysis of standard samples. A: Raw results of mHRM. Peaks on the left and on the right belong respectively to 925 and 1014 amplicons. B: Difference melting plots for amplicons with variation in the 925 position (green: L925 variant; red: L925Ikdr variant). C: Difference melting plots for amplicons with variation in the 1014 position (green: L1014 variant; red: L1014Fkdr variant). D: Melting curve for amplicons with variation in the 925 position (green: L925 variant; red: L925Ikdr variant). E: Melting curve for amplicons with variation in the 1014 position (green: L1014 variant; red: L1014Fkdr variant).
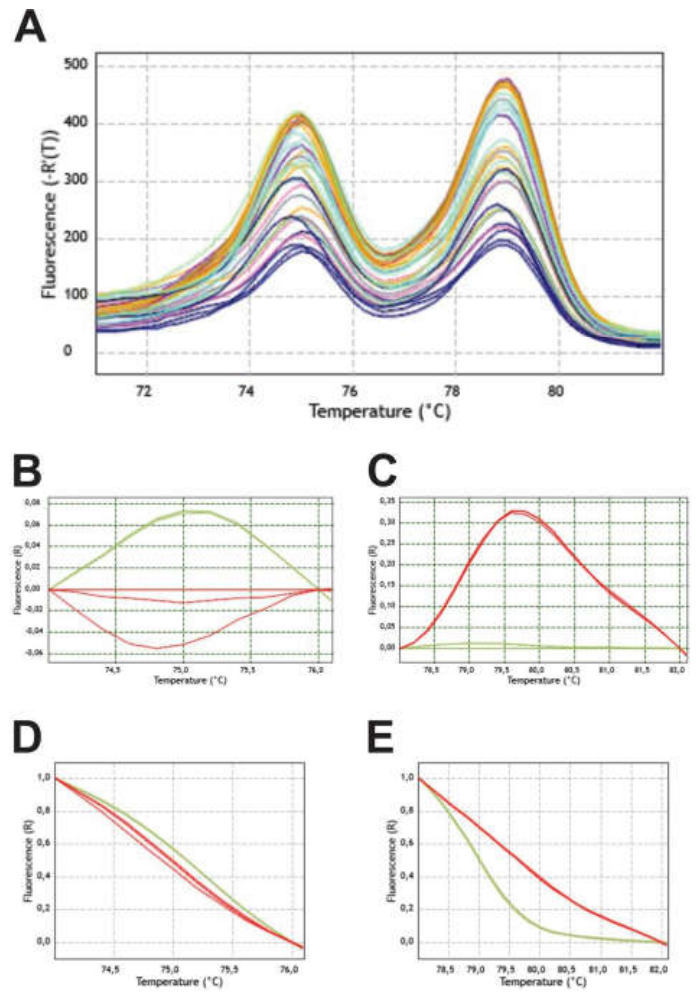
Figure 4.
Difference in Melting temperature plots obtained from DNA mixtures containing increasing proportions (0–100%) of the resistant genotype. A: DNA mixtures containing increasing proportions of the L925Ikdr variant. B: DNA mixtures containing increasing proportions of the L1014Fkdr variant, showing limited discrimination of intermediate genotype proportions.
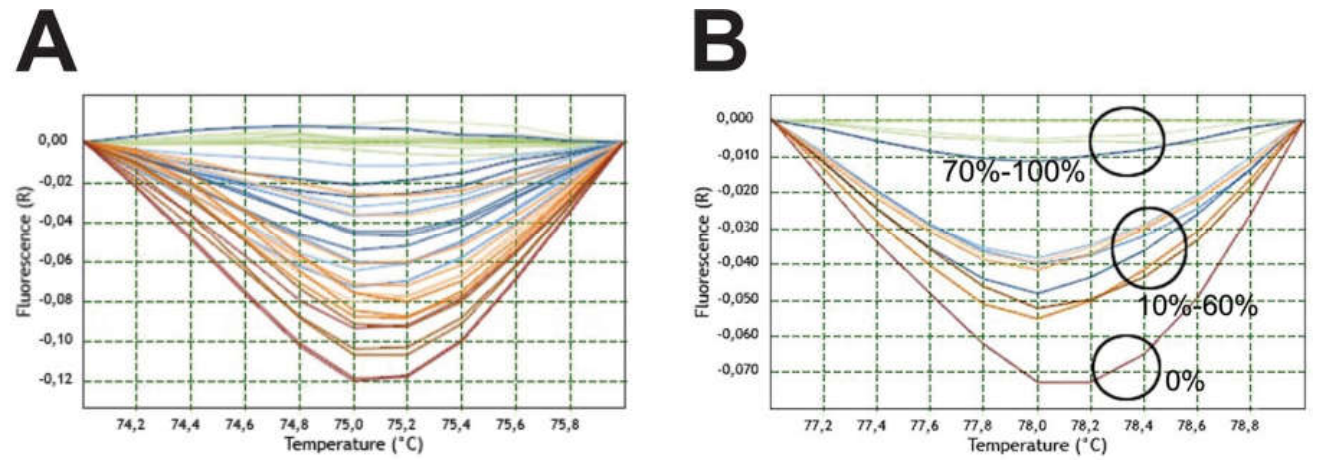

Table 2.
Genotypes in populations from different regions in Argentina.
| Country | Province/Department | Locality | Toxicological phenotype | VGSC Genotype determined by mHRM |
|---|---|---|---|---|
| Argentina | Catamarca/Capayán | Balde de Punta | Susceptible | S |
| La Rioja/San Martín | San Martín | Susceptible | S | |
| Córdoba/Cruz del Eje | Minas | Susceptible | S | |
| Formosa/Bermejo | Chiriguanos | Susceptible | S | |
| Chaco/Güemes | El Asustado | High resistant (a) | L925I kdr | |
| Chaco/Güemes | Nueva Pompeya | Susceptible | S | |
| Chaco/Güemes | Pampa Argentina | High resistant (b) | L925I kdr | |
| Chaco/Güemes | La Gerónima | Low resistant (c) | S | |
| Chaco/Güemes | El Juramento | High resistant (c) | L925I kdr | |
| Chaco/Güemes | El Malá | High resistant (d) | L925I kdr | |
| Chaco/Quitilipi | 25 de Mayo | Susceptible | S | |
| Bolivia | Gran Chaco/Tarija | Tierras Nuevas | High resistant (e) | L1014F kdr |
| Gran Chaco/Tarija | Villa del Carmen | High resistant (e) | L1014F kdr | |
| a= [19]; b= [17]; c: [7]; d: [18]; e: [12]. | ||||
Table 3.
Comparison of PASA+REA and mHRM assays for the genotyping of KDR mutations in T. infestans.
Table 3.
Comparison of PASA+REA and mHRM assays for the genotyping of KDR mutations in T. infestans.
| HRM | REA+PASA | |
|---|---|---|
| Equipment required (cost in USD) | calibrated real-time thermocycler (25000) | Thermocycler + electrophoresis + image acquisition (15000) |
| required analysis time | 3 hours | 13 hours |
| Workflow | Closed-tube assay | Nested PCR amplifications, restriction enzyme digestion and gel electrophoresis |
| Number of experimental steps | Two | Six |
| Primer sets required | Two primer pairs | Four primer pairs |
| Reaction wells/tubes required for 450 samples. | 96 | 360 |
| Estimated reagent cost for 440 pooled samples (USD) | 64 | 77 |
Disclaimer/Publisher’s Note: The statements, opinions and data contained in all publications are solely those of the individual author(s) and contributor(s) and not of MDPI and/or the editor(s). MDPI and/or the editor(s) disclaim responsibility for any injury to people or property resulting from any ideas, methods, instructions or products referred to in the content. |
© 2026 by the authors. Licensee MDPI, Basel, Switzerland. This article is an open access article distributed under the terms and conditions of the Creative Commons Attribution (CC BY) license (http://creativecommons.org/licenses/by/4.0/).
Copyright: This open access article is published under a Creative Commons CC BY 4.0 license, which permit the free download, distribution, and reuse, provided that the author and preprint are cited in any reuse.