

Submitted:
21 August 2026
Posted:
24 August 2026
You are already at the latest version
Abstract
Longitudinal oncologic imaging poses a tracking challenge because lesions can split, merge, or transiently disappear, violating one-to-one correspondence assumptions. We propose spatio-temporal lesion graphs constructed via nearest-centroid matching across all previous time points for lineage assignment, with bidirectional matching between consecutive scans to classify splits, merges, and continuations without learning. Modality-agnostic matching naturally captures phenotypic switching across imaging different modalities. Evaluated on longitudinal PSMA-/FDG-PET/CT during 177Lu-PSMA therapy (4 patients, 11-13 scans each), the graphs recovered 50 topology changes (22 splits, 28 merges) missed by forward-only matching and revealed persistently high intra-patient SUVpeak heterogeneity (median CV=0.74), demonstrating that aggregate metrics obscure substantial inter-lesion variation. The resulting graph provides a compact lesion-level representation for response assessment and potentially lesion-specific diagnostics and local therapy. The code and data are available at: https://github.com/lukasf98/spatio-temporal-graph.
Keywords:
lesion tracking
; graph-based methods
; longitudinal imaging
; response assessment
; topology changes
; radioligand therapy
; PSMA-PET/CT
1. Introduction
Longitudinal medical imaging generates sequences of lesion segmentations that must be matched across time to quantify disease progression or treatment response. This temporal correspondence problem is fundamental to automated RECIST measurement [1], response assessment in clinical trials [2], and patient-specific disease modeling [3]. Yet, current clinical practice relies on aggregate metrics such as total tumor volume, SUVmax, or mean apparent diffusion coefficient (ADC) that summarize disease burden at the patient level but obscure intra-patient heterogeneity. Individual lesions within the same patient may respond very differently to therapy: some regress while others persist, and lesions may recur at sites of prior disease. Identifying such outlier lesions has direct clinical implications for lesion-specific diagnostics (e.g., biopsy guidance) and local therapy (e.g., focal radiotherapy boost, and targeted resection in oligoprogressive disease).
Most correspondence methods assume one-to-one matching between consecutive time points using centroid distance, overlap, shape descriptors, or learned embeddings [4,5,6]. This bijective assumption fails in oncologic imaging where lesions split, merge, or transiently disappear below detection threshold (e.g., Figure 1). We therefore cast longitudinal tracking as graph construction: given segmentations , build a directed acyclic graph where nodes are lesions and edges encode continuation as well as topology changes.
Our contributions are: (1) Bidirectional matching for split/merge detection. Between consecutive time points, forward-backward nearest-neighbor cardinality directly classifies splits and merges (Section 3.2) without threshold tuning or learning. (2) Cross-modality lineage tracking. By imposing no same-tracer/sequence restriction on centroid matching, lineages naturally extend across imaging tracers (e.g., PSMA and FDG) or parametric sequences (e.g., ADC and contrast-enhanced T1-weighted MRI) at the same anatomical location (Section 3.3). (3) Heterogeneity quantification metrics. We derive graph-based metrics (lineage divergence, split/merge rate) that capture temporal dynamics beyond single-time point radiomics (Section 3.4).
We validate on 4 patients with 11–13 PET/CT scans each (49 scans, 391 lesion nodes) and 17 dual PSMA/FDG acquisitions within 30 days undergoing radioligand therapy (RLT), demonstrating superior tracking accuracy compared to nearest-neighbor and overlap-based baselines. We show that intra-patient lesion heterogeneity is persistently high throughout therapy, revealing divergent response patterns invisible to aggregate metrics as seen in clinical routine.
2. Related Work
- Lesion Correspondence Across Time points.
In literature, lesions are matched across longitudinal radiological scans using centroid distance, overlap, and shape similarity [4,7], and more recently via learned embeddings for correspondence [6]. However, most approaches enforce one-to-one matching and do not explicitly represent many-to-one or one-to-many relations, limiting their ability to handle splits, merges, and disappearance/reappearance.
- Cell Tracking and Lineage Trees.
The closest methodological analogue to our problem is cell tracking in microscopy, where division events (splits) are handled via probabilistic graphical models [8], min-cost flow optimization [9], or deep metric learning [10]. The Cell Tracking Challenge [11] provides a rigorous benchmark for such methods. However, the imaging regime differs fundamentally from radiology: microscopy offers subcellular resolution, high frame rates (1 to 10 minutes), and controlled acquisition conditions. Radiological imaging, by contrast, presents lower SNR, substantial patient motion, and temporal gaps of weeks to months that render optimization-based microscopy approaches poorly suited.
- Tumor Heterogeneity and Clonal Evolution.
On the other hand, intra-tumor heterogeneity is well established as a driver of treatment resistance [12]. Multi-region sequencing infers clonal trees from genetic variants [13], but cannot be performed longitudinally in routine clinical practice. Radiomics captures spatial heterogeneity from single images [14] but does not model how heterogeneity evolves over time under therapy. Our work bridges this gap: by constructing lesion lineage graphs from longitudinal imaging, we infer phenotypic trajectories at the individual lesion level without requiring genetic profiling, making the approach directly applicable in clinical workflows.
To our knowledge, no existing automated framework for RECIST or PERCIST assessment explicitly models topology changes such as lesion splits, merges, or disappearance and reappearance events.
3. Methods
3.1. Problem Formulation
Motivated by the clinical need to track individual lesion fates under therapy, we formalize longitudinal lesion tracking as a graph construction problem over registered image sequences, explicitly accommodating topology changes that violate the bijective matching assumption of prior work.
Let be a sequence of registered radiological images (e.g., CT or MRI) with corresponding binary segmentations . At time point t, connected component analysis yields lesions with centroids and feature vectors (volume, voxel statistics - such as SUV, HU or ADC, and organ label). We construct a directed graph where the node set contains one node per lesion, storing its time point, index, centroid , and feature vector . Edges connect lesions across time points, including non-consecutive ones when a lesion temporarily disappears, and carry a type label .
Objective: Infer E and edge types such that: (1) edges encode true temporal correspondences despite topology changes, (2) connected subgraphs form biologically plausible lineages, (3) the framework generalizes across modalities.
3.2. Centroid Matching and Edge Classification
We construct edges in two stages: (1) nearest-centroid matching against all previously observed nodes for lineage assignment, and (2) bidirectional matching between consecutive time points for edge type classification.
- Lineage Assignment.
Processing time points sequentially, each node is matched to the nearest centroid among all previously observed nodes :
where is the maximum plausible displacement between scans (e.g., mm for PET). If the nearest centroid lies within , the node inherits the lineage of its match; otherwise a new lineage is created. Because matching considers all previous time points, lesions that transiently fall below detection threshold are re-identified when they reappear, producing edges that may span multiple scan intervals.
- Edge Type Classification.
To classify topology changes, we perform bidirectional matching between consecutive time points and . Let denote the nearest neighbor of in (forward), and the nearest neighbor of in (backward), each subject to . The edge set is . For each edge, compute:
We classify edge type as:
3.3. Lineage Assignment and Cross-Tracer Tracking
Lineage identifiers are assigned during the matching stage (Section 3.2): each matched node inherits the lineage of its nearest predecessor, while unmatched nodes initiate new lineages. When a merge is detected (multiple parents for one child), the child inherits the lineage of the largest parent by volume. This yields a set of named lineages that can be tracked across the full longitudinal sequence, including across gaps where lesions transiently disappear as explained above.
- Cross-Tracer Tracking.
The centroid matching imposes no same-tracer restriction: a lesion visible on one tracer (e.g., FDG) can match to a spatially co-located lesion on a different tracer (e.g., PSMA) at a subsequent time point, provided . This naturally extends lineage identity across tracer boundaries, capturing phenotypic plasticity in molecular imaging [15]. Such approach can also be applied to multiple modalities in MRI, different phases in contrast-enhanced CT, and many more, including multimodal setups (e.g. PSMA PET/CT and ADC in prostate cancer).
3.4. Quantitative Heterogeneity Metrics
The lesion graph enables heterogeneity quantification at multiple levels. We define three complementary metrics that together characterize divergent lesion behavior over time. For PET we use SUVpeak, but for other modalities equivalent metrics can be used.
- Temporal Coefficient of Variation.
At each time point t, we compute the dispersion of SUVpeak across all active lesions:
A high CV indicates diverging lesion behaviors, with some lesions responding while others progress; temporal changes in CV reflect the dynamic nature of this heterogeneity under therapy.
- Lineage Divergence Score.
For each lineage , we quantify deviation from the patient-level aggregate at the final time point T:
where and are the mean and standard deviation across all lesions at time point T.
- Split/Merge Rate.
Per patient, we summarize topology-changing events normalized by the number of intervals:
High split rates may indicate treatment-driven lesion fragmentation, while high merge rates suggest coalescence during disease progression.
4. Experiments
4.1. Dataset and Implementation
We evaluated four metastatic castration-resistant prostate cancer patients undergoing 177Lu-PSMA therapy with 11–13 scans each (49 scans total). Data were collected prospectively within a larger trial with approval of the local ethics committee [16]. Scans were first rigidly, then deformably registered to baseline CT using elastix [17]. Lesions were segmented with autoPET 3 [18]; organ labels were obtained with TotalSegmentator [19]. We implemented connected components (SimpleITK), distance computation (NumPy), and graph operations (NetworkX). We set mm.
4.2. Quantitative Tracking Results
Table 1 summarizes graph statistics per patient. Our method identified 391 nodes, 286 temporal edges, and 105 lineages across the cohort. Bidirectional matching detected 22 split and 28 merge events, both topology changes that would be misclassified as disconnected appearances or disappearances by standard forward-only matching.
- Baseline Comparison.
We compared against nearest-neighbor (NN) with forward matching only, one-to-one constraint (if multiple children, select nearest).
NN detected 0/22 splits, which is by construction, as forward-only matching assigns each parent at most one child, making split detection impossible. It also detected 26/28 merges (2 missed due to asymmetric nearest-neighbor topology). Our bidirectional method detected all 22 splits and all 28 merges, with 3 additional edges attributed to registration error upon visual inspection.
4.3. Heterogeneity Dynamics
All patients exhibited persistently high CV of SUVpeak across lesions (range 0.16–1.05, median 0.74), indicating that aggregate metrics consistently obscure substantial inter-lesion variation. CV trajectories fluctuated over the treatment course rather than following a monotonic trend, reflecting dynamic and non-uniform treatment responses only visible through lesion-level tracking. Such behavior is commonly seen in clinical routine.
4.4. Split/Merge Event Analysis
Figure 2 shows an example lineage with dynamic topology changes (pat_3, Lineage 1). This lesion underwent: (1) initial continuation (1→1), (2) split into 4 fragments (1→4), (3) merge back to two lesions (4→2), (4) further split (2→3), (5) partial merge (3→1), and (6) final split (1→2). Standard forward-only tracking would assign each parent a single child, fragmenting this lineage into disconnected segments and missing all split events entirely.
4.5. Cross-Tracer Phenotypic Switching
Across the four patients, 20 lineages spanned both PSMA and FDG tracers, with 74 cross-tracer edges linking lesions at the same anatomical location across modalities. Figure 1 illustrates one example (pat_3, Lineage 13): two FDG-avid lesions near the right iliac vein (SUVpeak 2.1 and 2.6) had no PSMA-avid counterpart 6 days later, but a PSMA-avid lesion appeared at the same location 6 months later (SUVpeak 8.1, mm), growing further at month 10 (SUVpeak 7.8). This FDG-to-PSMA transition is consistent with phenotypic switching under neuroendocrine transdifferentiation [15] and would be missed by single-tracer tracking.
4.6. Sensitivity Analysis
We evaluated the sensitivity of tracking results to the distance threshold and matching strategy. Reducing to 20 mm increased disappearance events by 15%, while increasing it to 40 mm introduced 8% spurious edges between anatomically distinct lesions. The chosen mm (mean lesion diameter ) yielded stable graph topology across the 28–32 mm range. Removing the backward matching pass missed all 22 splits and 2 of 28 merges. Removing the cross-tracer extension excluded all 20 cross-tracer lineages from the graph.
5. Discussion
- Technical Advantages.
Our bidirectional matching scheme provides a one-parameter () classification of topology changes: the cardinality of forward/backward neighbor sets directly determines edge type without threshold tuning. This contrasts with probabilistic approaches [8] requiring learned transition models, or optimization methods [9] solving NP-hard assignment problems. The complexity per time point pair is manageable for clinical radiological imaging, such as whole-body PET (typically lesions), and easily parallelizable.
- Generalization to Other Modalities.
While validated on PET, our framework applies to any longitudinal imaging where: (1) lesions can be segmented as connected components, (2) centroids are well-defined, (3) registration aligns scans to common coordinate frame. This includes, e.g., CT-based RECIST tracking, MRI in multiple sclerosis (lesion splitting during inflammation), and ultrasound in prenatal imaging (fetal organ development). The cross-modality extension generalizes to any dual-contrast protocol (T1/T2 MRI, contrast-enhanced CT phases), but could potentially be used in multimodality setups (e.g., PSMA PET and ADC in prostate cancer).
- Limitations and Future Work.
Our method uses rule-based matching; deep learning methods could improve matching accuracy. The distance threshold , sole parameter of the method, is currently set heuristically (lesion diameter); adaptive thresholds based on local registration uncertainty [20] could improve robustness. For very large lesions (cm), centroid displacement may exceed despite correct correspondence; incorporating shape features or learned distance metrics [6] into the matching cost could address this.
6. Conclusion
We presented a graph-based framework for tracking topology changes in longitudinal medical imaging, with bidirectional centroid matching enabling parameter-free detection of split, merge, and cross-modality switching events. Applied to 49 PET scans across four patients, our method detected 50 topology-changing events (22 splits, 28 merges) missed by forward-only matching, and revealed persistently high intra-patient heterogeneity (median CV = 0.74) that aggregate metrics obscure. The modality-agnostic framework can be generalized to CT, MRI, and other longitudinal scenarios; future work will incorporate registration uncertainty and learned distance metrics to improve robustness.
The authors used Claude Opus 4.8 (Anthropic) to assist with drafting and editing the text of this manuscript. All AI-assisted content was reviewed, verified, and edited by the authors.
Acknowledgments
This research was partially funded by the Intramural Research Funding Grants “AI-driven Longitudinal Lesion Tracking” of the Faculty of Medicine, University of Augsburg, the Bavarian Center for Cancer Research as part of the Lighthouse “Local Therapies” and the Study Group “Surrogate parameters for CNS Tumors in Childhood”, as well as by the Bavarian Ministry of Economic Affairs, Regional Development and Energy (StMWi) under grant number DIK-2310-0004//DIK0556/02.
References
- Tang, Y.; Zhang, N.; Wang, Y.; He, S.; Han, M.; Xiao, J.; Lin, R.S. Accurate and Robust Lesion RECIST Diameter Prediction and Segmentation with Transformers. In Medical Image Computing and Computer Assisted Intervention – MICCAI 2022; Wang, L.; Dou, Q.; Fletcher, P.T.; Speidel, S.; Li, S., Eds.; Springer Nature Switzerland: Cham, 2022; Vol. 13434, pp. 535–544. [CrossRef]
- Wahl, R.L.; Jacene, H.; Kasamon, Y.; Lodge, M.A. From RECIST to PERCIST: Evolving Considerations for PET Response Criteria in Solid Tumors. Journal of Nuclear Medicine 2009, 50, 122S–150S. [CrossRef]
- Zeghlache, R.; Conze, P.H.; El Habib Daho, M.; Li, Y.; Le Boité, H.; Tadayoni, R.; Massin, P.; Cochener, B.; Rezaei, A.; Brahim, I.; et al. LaTiM: Longitudinal Representation Learning in Continuous-Time Models to Predict Disease Progression. In Medical Image Computing and Computer Assisted Intervention – MICCAI 2024; Linguraru, M.G.; Dou, Q.; Feragen, A.; Giannarou, S.; Glocker, B.; Lekadir, K.; Schnabel, J.A., Eds.; Springer Nature Switzerland: Cham, 2024; Vol. 15005, pp. 404–414. [CrossRef]
- Moltz, J.H.; Bornemann, L.; Kuhnigk, J.M.; Dicken, V.; Peitgen, E.; Meier, S.; Bolte, H.; Fabel, M.; Bauknecht, H.C.; Hittinger, M.; et al. Advanced Segmentation Techniques for Lung Nodules, Liver Metastases, and Enlarged Lymph Nodes in CT Scans. IEEE Journal of Selected Topics in Signal Processing 2009, 3, 122–134. [CrossRef]
- Xu, D.M.; Gietema, H.; De Koning, H.; Vernhout, R.; Nackaerts, K.; Prokop, M.; Weenink, C.; Lammers, J.W.; Groen, H.; Oudkerk, M.; et al. Nodule management protocol of the NELSON randomised lung cancer screening trial. Lung Cancer 2006, 54, 177–184. [CrossRef]
- Yan, K.; Wang, X.; Lu, L.; Summers, R.M. DeepLesion: automated mining of large-scale lesion annotations and universal lesion detection with deep learning. Journal of Medical Imaging 2018, 5, 1. [CrossRef]
- Belongie, S.; Malik, J.; Puzicha, J. Shape matching and object recognition using shape contexts. IEEE Transactions on Pattern Analysis and Machine Intelligence 2002, 24, 509–522. [CrossRef]
- Schiegg, M.; Hanslovsky, P.; Haubold, C.; Koethe, U.; Hufnagel, L.; Hamprecht, F.A. Graphical model for joint segmentation and tracking of multiple dividing cells. Bioinformatics 2015, 31, 948–956. [CrossRef]
- Magnusson, K.E.G.; Jalden, J.; Gilbert, P.M.; Blau, H.M. Global Linking of Cell Tracks Using the Viterbi Algorithm. IEEE Transactions on Medical Imaging 2015, 34, 911–929. [CrossRef]
- He, T.; Mao, H.; Guo, J.; Yi, Z. Cell tracking using deep neural networks with multi-task learning. Image and Vision Computing 2017, 60, 142–153. [CrossRef]
- Ulman, V.; Maška, M.; Magnusson, K.E.G.; Ronneberger, O.; Haubold, C.; Harder, N.; Matula, P.; Matula, P.; Svoboda, D.; Radojevic, M.; et al. An objective comparison of cell-tracking algorithms. Nature Methods 2017, 14, 1141–1152. [CrossRef]
- Dentro, S.C.; Leshchiner, I.; Haase, K.; Tarabichi, M.; Wintersinger, J.; Deshwar, A.G.; Yu, K.; Rubanova, Y.; Macintyre, G.; Demeulemeester, J.; et al. Characterizing genetic intra-tumor heterogeneity across 2,658 human cancer genomes. Cell 2021, 184, 2239–2254.e39. [CrossRef]
- Singer, J.; Kuipers, J.; Jahn, K.; Beerenwinkel, N. Single-cell mutation identification via phylogenetic inference. Nature Communications 2018, 9, 5144. [CrossRef]
- Gillies, R.J.; Kinahan, P.E.; Hricak, H. Radiomics: Images Are More than Pictures, They Are Data. Radiology 2016, 278, 563–577. [CrossRef]
- Aggarwal, R.; Huang, J.; Alumkal, J.J.; Zhang, L.; Feng, F.Y.; Thomas, G.V.; Weinstein, A.S.; Friedl, V.; Zhang, C.; Witte, O.N.; et al. Clinical and Genomic Characterization of Treatment-Emergent Small-Cell Neuroendocrine Prostate Cancer: A Multi-institutional Prospective Study. Journal of Clinical Oncology 2018, 36, 2492–2503. [CrossRef]
- Sommer, S.; Schmutz, M.; Hildebrand, K.; Schiwitza, A.; Benedikt, S.; Eberle, M.; Mögele, T.; Sultan, A.; Reichl, L.; Campillo, M.; et al. Concept and feasibility of the Augsburg Longitudinal Plasma Study (ALPS)–a prospective trial for comprehensive liquid biopsy-based longitudinal monitoring of solid cancer patients. Journal of Laboratory Medicine 2024, 48, 107–119. [CrossRef]
- Klein, S.; Staring, M.; Murphy, K.; Viergever, M.; Pluim, J. elastix: A Toolbox for Intensity-Based Medical Image Registration. IEEE Transactions on Medical Imaging 2010, 29, 196–205. [CrossRef]
- Rokuss, M.; Kovacs, B.; Kirchhoff, Y.; Xiao, S.; Ulrich, C.; Maier-Hein, K.H.; Isensee, F. From FDG to PSMA: A Hitchhiker’s Guide to Multitracer, Multicenter Lesion Segmentation in PET/CT Imaging, 2024. [CrossRef]
- Wasserthal, J.; Breit, H.C.; Meyer, M.T.; Pradella, M.; Hinck, D.; Sauter, A.W.; Heye, T.; Boll, D.T.; Cyriac, J.; Yang, S.; et al. TotalSegmentator: Robust Segmentation of 104 Anatomic Structures in CT Images. Radiology: Artificial Intelligence 2023, 5, e230024. [CrossRef]
- Risser, L.; Vialard, F.X.; Wolz, R.; Holm, D.D.; Rueckert, D. Simultaneous Fine and Coarse Diffeomorphic Registration: Application to Atrophy Measurement in Alzheimer’s Disease. In Medical Image Computing and Computer-Assisted Intervention – MICCAI 2010; Jiang, T.; Navab, N.; Pluim, J.P.W.; Viergever, M.A., Eds.; Springer Berlin Heidelberg: Berlin, Heidelberg, 2010; Vol. 6362, pp. 610–617. [CrossRef]
Figure 1.
Topology changes in longitudinal PET. Lesion is visible in FDG-PET at time point but not in PSMA-PET at time point , six days after. Yet, it appears on PSMA-PET at time point (phenotypic switching), roughly six months later.
Figure 1.
Topology changes in longitudinal PET. Lesion is visible in FDG-PET at time point but not in PSMA-PET at time point , six days after. Yet, it appears on PSMA-PET at time point (phenotypic switching), roughly six months later.
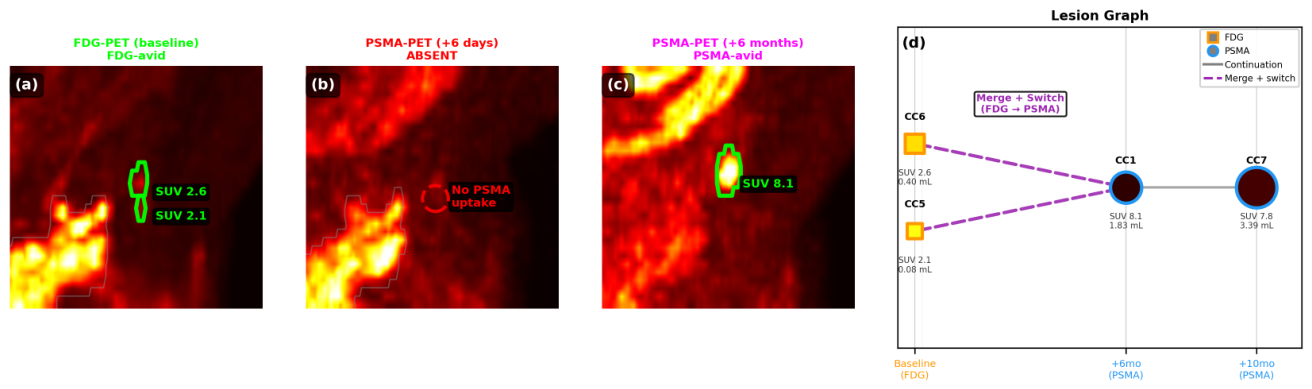
Figure 2.
Spatio-temporal evolution of one lesion lineage in serial PSMA-PET/CT. (a) Lesion graph with continuation (gray), splits (blue dashed), and merges (red dashed). Node size encodes volume; color encodes SUVpeak. (b) SUVpeak trajectory of the same lineage versus all others (aggregate metrics), illustrating divergent response despite topology changes.
Figure 2.
Spatio-temporal evolution of one lesion lineage in serial PSMA-PET/CT. (a) Lesion graph with continuation (gray), splits (blue dashed), and merges (red dashed). Node size encodes volume; color encodes SUVpeak. (b) SUVpeak trajectory of the same lineage versus all others (aggregate metrics), illustrating divergent response despite topology changes.
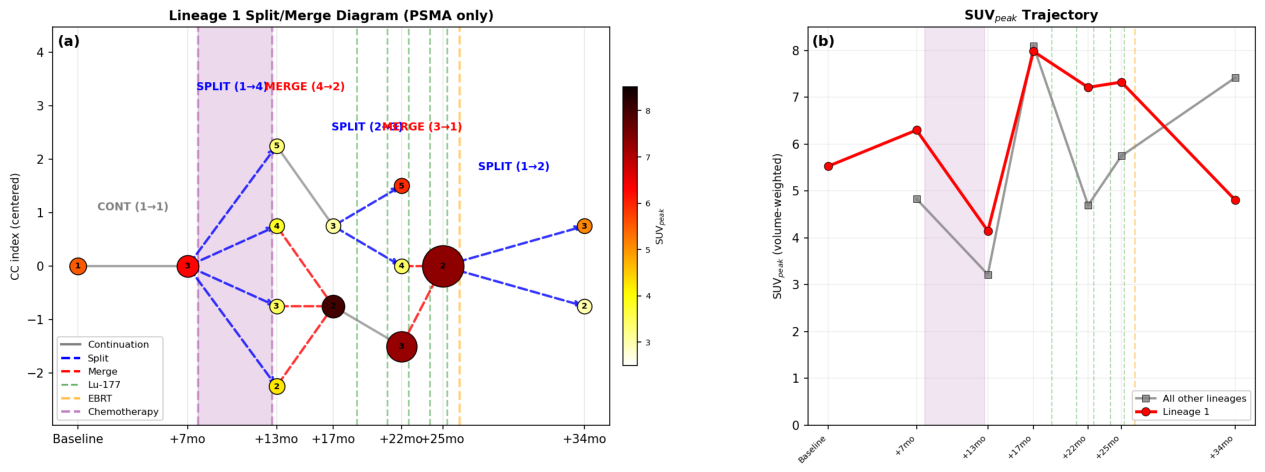

Table 1.
Quantitative tracking results across four patients. CV of SUVpeak measures inter-lesion heterogeneity at the first and last PSMA scan with ≥2 lesions. Splits/merges counted via bidirectional matching across all tracer time points.
Table 1.
Quantitative tracking results across four patients. CV of SUVpeak measures inter-lesion heterogeneity at the first and last PSMA scan with ≥2 lesions. Splits/merges counted via bidirectional matching across all tracer time points.
| Patient | Scans | Nodes | Edges | Lineages | First CV | Last CV | Splits/Merges |
|---|---|---|---|---|---|---|---|
| pat_1 | 13 | 92 | 72 | 20 | 0.73 | 0.88 | 6 / 7 |
| pat_2 | 11 | 96 | 59 | 37 | 0.98 | 0.68 | 2 / 2 |
| pat_3 | 13 | 52 | 36 | 16 | 0.52 | 0.42 | 3 / 4 |
| pat_4 | 12 | 151 | 119 | 32 | 0.86 | 0.58 | 11 / 15 |
| Total/Mean | 49 | 391 | 286 | 105 | 0.77±0.17 | 0.64±0.17 | 22 / 28 |
Disclaimer/Publisher’s Note: The statements, opinions and data contained in all publications are solely those of the individual author(s) and contributor(s) and not of MDPI and/or the editor(s). MDPI and/or the editor(s) disclaim responsibility for any injury to people or property resulting from any ideas, methods, instructions or products referred to in the content. |
© 2026 by the authors. Licensee MDPI, Basel, Switzerland. This article is an open access article distributed under the terms and conditions of the Creative Commons Attribution (CC BY) license (http://creativecommons.org/licenses/by/4.0/).
Copyright: This open access article is published under a Creative Commons CC BY 4.0 license, which permit the free download, distribution, and reuse, provided that the author and preprint are cited in any reuse.