
Submitted:
21 August 2026
Posted:
24 August 2026
You are already at the latest version
Abstract
This study investigates the influence of ESG message strategies on purchase intention in new energy vehicle (NEV) advertising. Grounded in advertising message strategy, speech act and consumer behavior theories, the research examines strategy presence, directness, and boundary conditions. Two experiments (N=604) were conducted: Study 1 (n=204) used a control design to test ESG message strategy presence, while Study 2 (n=400) employed a 2 (Direct vs. Indirect) × 2 (Luxury vs. Affordable) between-subjects design. Results indicate that ESG messaging significantly enhances purchase intention, with direct strategies outperforming indirect ones. Psychological responses (brand trust, image, and attitude) partially mediate this relationship. Furthermore, brand type moderates the effect: while direct messaging increases purchase intention for both categories, the impact is significantly stronger for affordable brands. These findings extend speech act theory to sustainability marketing and provide strategic guidance for NEV advertisers.
Keywords:
ESG message
; message strategy
; ESG message strategy
; purchase intention
; new energy vehicle
; advertising
1. Introduction
The transformation of global transportation systems through new energy vehicles represents one of the most significant industrial shifts of the early twenty-first century. With global NEV sales reaching 18.236 million units in 2024, a 24.4 % year-on-year increase, and projected to hit 20 million in 2025 according to the International Energy Agency (IEA)’s Global EV Outlook 2025, this sector has emerged as a critical pathway toward sustainable mobility [1,2]. This extraordinary growth trajectory reflects not merely technological advancement but a fundamental reimagining of automotive value propositions, wherein environmental stewardship has become inseparable from product innovation. As regulatory frameworks tighten and climate imperatives intensify, NEV manufacturers find themselves navigating unprecedented expectations for corporate sustainability performance, transforming ESG considerations from peripheral concerns into core strategic imperatives [3,4].
The automotive sector’s substantial contribution to global carbon emissions, approximately 16% according to recent assessments [5], has catalyzed intense scrutiny of manufacturers’ sustainability practices. This scrutiny extends beyond operational metrics to encompass the full spectrum of corporate communications, particularly advertising strategies that shape consumer perceptions and purchase decisions. Contemporary NEV manufacturers have responded by weaving ESG narratives throughout their marketing communications, prominently featuring achievements in carbon neutrality, renewable energy adoption, and ethical supply chain management [6,7]. Tesla’s emphasis on solar integration, BYD’s celebration of battery recycling innovations, and Volkswagen’s carbon-neutral production campaigns exemplify this trend toward sustainability-centered brand positioning.
Yet beneath this proliferation of ESG messaging lies a fundamental empirical void. While intuition suggests that sustainability credentials should resonate with environmentally conscious consumers, the actual impact of ESG message on purchase intentions remains surprisingly under-explored. The assumption that highlighting environmental achievements automatically translates into consumer preference lacks robust empirical substantiation, particularly within the NEV context where products inherently embody environmental benefits [8]. This paradox, wherein ostensibly sustainable products require additional sustainability messaging, raises critical questions about information processing, value perception, and the boundaries of green marketing effectiveness.
The challenge of understanding ESG communication effectiveness extends beyond simple presence or absence of sustainability information. ESG represents a multidimensional construct encompassing environmental protection, social responsibility, and governance excellence, dimensions that consumers may process through distinctly different cognitive and affective pathways [9,10]. Within the NEV marketplace, this complexity intensifies as consumers must simultaneously evaluate technical specifications, performance characteristics, and sustainability credentials. Research indicates that while most of prospective NEV buyers consider ESG performance important [11], the mechanisms through which ESG message influences actual purchase decisions remain vague [12,13], suggesting a disconnect between stated preferences and revealed behaviors that warrants systematic investigation.
Equally significant, though often overlooked, is the question of how ESG message should be communicated to maximize persuasive impact. The effectiveness of sustainability messaging depends not merely on informational content but crucially on linguistic presentation and rhetorical strategy [14,15]. Speech act theory, originating in the philosophical work of Austin [16] and refined by Searle [17], provides a sophisticated framework for understanding how different modes of expression perform distinct communicative functions [16,17]. Within advertising contexts, this theoretical lens reveals a fundamental distinction between direct message strategy, which is explicit statement of measurable environmental achievements, and indirect approaches that employ imagery, metaphor, and narrative to convey sustainability values through consumer inference [18,19].
This distinction between direct and indirect expression carries profound implications for message processing and persuasion. Direct expressions offer precision and verifiability, potentially enhancing credibility among consumers seeking factual substantiation of environmental claims [20]. Such approaches align with regulatory pressures for transparency and the growing sophistication of environmentally literate consumers who demand quantifiable evidence of sustainability performance. Conversely, indirect expressions that incorporate natural imagery or sustainability narratives may activate deeper interpretive processes, fostering emotional resonance and self-generated persuasion that transcends rational evaluation [21]. The high-involvement nature of vehicle purchases, characterized by extended deliberation and substantial financial commitment, creates a unique context wherein these contrasting expression strategies may produce differential effects on consumer decision-making.
Current scholarship has predominantly examined ESG communication through the lens of corporate disclosure and investor relations, focusing on financial markets rather than consumer markets [22,23,24]. While green advertising effectiveness has attracted considerable academic attention [25,26], research specifically addressing the intersection of ESG expression strategies and consumer purchase intentions remains remarkably sparse. This gap becomes particularly salient within the NEV sector, where the inherent environmental benefits of the products create a unique communication paradox: How does one effectively communicate sustainability advantages when the product category itself represents sustainable innovation?
Moreover, the psychological mechanisms mediating the relationship between ESG message strategies and purchase intentions remain largely unexplored territory. Different expression modes may activate distinct cognitive and affective processing routes — direct message strategy potentially facilitating analytical evaluation while indirect message strategy triggers associative processing and emotional engagement [27,28]. Understanding these differential processing pathways becomes essential for developing theoretically grounded communication strategies that resonate across diverse consumer segments while maintaining authenticity and avoiding greenwashing perceptions.
The NEV industry provides an exceptionally rich and necessary context for investigating these questions due to several distinctive factors. Unlike conventional products where sustainability is an additional feature, NEVs inherently embody environmental benefits, making ESG communication not merely promotional but integral to product identity. This unique positioning creates a paradox: consumers expect substantive sustainability narratives yet may react skeptically to messages perceived as redundant or incongruent with the product’s core promise. Consequently, NEV consumers typically exhibit heightened environmental consciousness alongside heightened scrutiny toward ESG claims, creating an audience that is receptive to sustainability messaging [29,30]. Additionally, the substantial financial investment and long-term commitment inherent in vehicle purchases motivate extensive information search and deliberation, amplifying the stakes and impact of advertising messages. The technical complexity of NEV technology, combined with multifaceted ESG considerations, creates an information-rich environment wherein expression strategies may play a decisive role in shaping consumer understanding, preference formation, and ultimately, purchase decisions.
This investigation therefore pursues three interrelated lines of inquiry that progressively deepen our understanding of ESG advertising effectiveness within the NEV context. First, we examine whether the inclusion of ESG message in advertisements demonstrably enhances consumer purchase intentions for new energy vehicles, establishing the baseline value of sustainability messaging. Second, we investigate how different message expression strategies (direct vs. indirect) modulate the persuasive impact of ESG message, revealing the importance of linguistic and rhetorical choices in sustainability communication. Third, we explore the underlying psychological mechanisms through which these expression strategies operate, illuminating the cognitive and affective pathways that mediate the relationship between ESG messaging and consumer behavior.
Through systematic investigation of these questions, this research advances both theoretical understanding and practical application. Theoretically, we extend speech act theory into the domain of sustainability marketing, demonstrating how linguistic choices in ESG communication perform differential persuasive functions. We contribute to the expanding literature on sustainable consumption by identifying boundary conditions that determine when and how ESG message enhances purchase intentions. From a practical perspective, our findings offer evidence-based guidance for NEV marketers navigating the complex terrain of sustainability communication, providing insights into optimal strategies for balancing transparency, credibility, and persuasive impact in an increasingly sustainability-conscious marketplace.
Our methodological approach employs controlled experimentation complemented by survey-based data collection to ensure both internal validity and external generalizability. The investigation unfolds through a series of carefully designed experiments that isolate and examine the effects of ESG message presence, expression strategies, and their interaction with consumer characteristics. This multi-study design enables robust causal inference while capturing the nuanced psychological processes that shape consumer responses to sustainability messaging in the high-stakes context of new energy vehicle purchases.
2. Theoretical Foundation and Hypotheses Development
2.1. ESG Message and ESG Message Strategy
The effectiveness of corporate sustainability communication depends critically on both the content of ESG messages and the linguistic strategies employed to convey them. As stakeholders increasingly demand transparency regarding environmental, social, and governance practices, enterprises must navigate complex decisions about not only what sustainability information to disclose but also how to articulate such commitments in ways that resonate with target audiences [31,32]. This dual consideration: message substance and expression modality, constitutes the foundation upon which ESG communication effectiveness is built. This section first examines the conceptual foundations of ESG messages as communicative artifacts, subsequently developing the theoretical framework for understanding how different expression strategies shape consumer responses to sustainability communications in the context of new energy vehicle advertising.
2.1.1. ESG Message
ESG message refers to corporate communications that convey information pertaining to environmental stewardship, social responsibility, and governance practices to external stakeholders [33]. The conceptual evolution of ESG messaging reflects a significant transformation from initially focusing on environmental protection and social responsibility reporting toward a comprehensive framework encompassing environmental, social, and governance dimensions [34]. This evolutionary trajectory demonstrates a fundamental shift from passive compliance to proactive value creation, though academic discourse reveals persistent divergence in defining core elements, directly impacting assessment standard uniformity across national contexts [35].
ESG messages exhibit distinctive characteristics differentiating them from traditional corporate communications. Their non-financial nature manifests in emphasis on qualitative indicators such as environmental performance and social responsibility, contrasting with quantitative financial data [35]. This characteristic more comprehensively reflects corporate sustainable development potential while simultaneously leading to inconsistent disclosure quality due to lack of unified measurement standards [36]. Long-term orientation represents another core dimension, with research indicating environmental investment return periods averaging 5-7 years [37]. Additionally, the multidimensional structure spanning numerous sub-indicators results in significant evaluation focus differences among stakeholder groups, where institutional investors prioritize governance indicators while consumer groups emphasize environmental metrics [37,38]. Transparency deficits remain particularly prominent, with inter-industry disclosure standard differences significantly reducing cross-enterprise comparability [39].
In the domain of marketing communication, scholarly exploration of ESG message integration within advertising has been grounded in diverse theoretical frameworks. Empirical investigations applying Signaling Theory have demonstrated how ESG disclosures reduce information asymmetry and enhance brand credibility through third-party verification mechanisms, with recent studies revealing that perceived transparency in environmental and governance dimensions significantly strengthens consumer trust and purchase intentions [19,40,41]. Research employing Attribution Theory and Dual-Process Theories has examined how consumers decode corporate ESG motives, distinguishing between value-driven versus stakeholder-driven attributions, with findings indicating that advertising skepticism and persuasion knowledge critically moderate message effectiveness [14,42,43]. From a process-oriented perspective, studies grounded in the Stimulus-Organism-Response (S-O-R) framework have conceptualized ESG messages as external stimuli that trigger affective evaluations, such as perceived warmth and competence, subsequently driving behavioral intentions [44,45]. Furthermore, investigations utilizing the Theory of Planned Behavior (TPB) and Value-Belief-Norm (VBN) Theory have explored how ESG narratives activate personal norms, social identity, and subjective beliefs, particularly in high-involvement sectors where ethical alignment is scrutinized [46,47,48]. However, while extant study has predominantly focused on ESG message content and its psychological outcomes, systematic exploration of how ESG message should be strategically expressed remains underexplored, representing a critical gap this research aims to address.
2.1.2. ESG Message Strategy
ESG message strategy (MS) derives from advertising message strategy, defined as the systematic framework governing informational content (“what to say”) and rhetorical execution (“how to say it”) in persuasive communication [49,50,51,52]. This strategic dimension, which is distinct from executional tactics, fundamentally shapes consumer cognitive processing and behavioral outcomes, with empirical evidence demonstrating that message strategy variations exert proportionally greater campaign impact than media expenditure differences [53,54,55]. Contemporary research has synthesized diverse message strategy typologies into integrated frameworks distinguishing informational approaches (emphasizing factual substantiation and rational persuasion) from transformational approaches (emphasizing symbolic association and emotional resonance), thereby establishing systematic taxonomies for analyzing strategic message architecture across advertising contexts [56,57].
Building upon this foundation, ESG message strategy is defined as the systematic framework governing how corporations linguistically construct and rhetorically formulate ESG-related information in consumer-facing advertising, encompassing strategic decisions regarding content substantiation and communicative directness. While conventional ESG disclosure research emphasizes regulatory compliance and stakeholder-specific framing through signaling and stakeholder theories, MS foregrounds a critical yet underexplored dimension: how linguistic encoding and rhetorical packaging determine persuasive impact independent of substantive content [58,59,60,61]. Emerging empirical research demonstrates that identical ESG content generates divergent consumer responses, including differential trust formation, perceived authenticity, and behavioral intentions, depending upon whether claims are explicitly asserted versus implicitly suggested, thereby necessitating theoretical frameworks capable of systematically explicating these strategic variation patterns [43,58,62].
The theoretical basis for distinguishing direct versus indirect ESG message derives from Speech Act Theory (SAT), which conceptualizes language as performative action wherein utterances accomplish illocutionary functions beyond propositional content transmission [17,63]. The core distinction of SAT between direct speech acts, where surface linguistic form transparently matches illocutionary intention, and indirect speech acts, where intended meaning requires contextual inference beyond literal semantics, provides systematic classification criteria applicable to advertising discourse [64,65]. Empirical applications of SAT to advertising contexts demonstrate that speech act selection critically influences persuasive effectiveness, with assertive, commissive, and directive illocutionary forces serving distinct strategic functions in commercial communication [66,67]. Within ESG advertising specifically, recent study has begun examining how illocutionary force embedded in sustainability claims, whether explicit assertions, implicit suggestions, or interrogative provocations, shapes consumer interpretation and trust formation [68], establishing theoretical foundations for differentiating messages that explicitly declare ESG performance from those implicitly evoking environmental values through narrative or aesthetic symbolism.
Grounded in SAT’s direct-indirect dichotomy and integrated with advertising typology traditions [50,56], this research uses two strategic modalities. In this study, the direct–indirect distinction is operationalized as the explicitness and verifiability of ESG messages in advertising discourse. A direct ESG message strategy expresses ESG-related performance or commitments through explicit, propositionally clear statements that provide concrete evidence (e.g., quantified metrics, specific practices, or time-bound targets), thereby allowing consumers to evaluate claim accuracy with minimal inferential effort. An indirect ESG message strategy conveys ESG meanings in an implicit, value-laden manner (e.g., narrative or metaphorical wording, aspirational visions, or rhetorical questions) that foregrounds affective resonance rather than verifiable details, thereby requiring greater pragmatic inference to recover the intended ESG implication. This operationalization preserves SAT’s core insight: differences in inferential demand, while aligning with advertising message strategy research that contrasts fact-based informational appeals with implicit or transformational framing.
2.2. ESG Message Strategy and Purchase Intention
Purchase intention (PI) refers to the likelihood or willingness of a consumer to purchase a product or service in the future [69,70]. As a pivotal indicator of consumer behavior, PI bridges attitudinal evaluations and actual purchasing actions, and has been extensively examined as both a dependent variable and a predictor of market behavior [71,72]. While traditional research attributes PI to functional factors such as perceived value, product quality, and price [73,74,75,76], growing empirical evidence indicates that non-financial factors, particularly corporate sustainability and ESG performance, exert significant influence on contemporary consumer decisions [77,78]. Consumers increasingly evaluate brands not only on functional attributes but also on the ethical and social dimensions of corporate conduct [79], driving a substantial body of research into how ESG-related communications shape purchase behavior [80,81].
The foundational purpose of advertising message strategy is to translate corporate value propositions into consumer behavioral outcomes [52,57,82]. When this strategic logic is applied to ESG communications, MS serves as the operative mechanism through which sustainability commitments are transformed into persuasive stimuli capable of shaping consumer decisions. Grounded in Signaling Theory, ESG communications have been demonstrated to function as credible quality cues that reduce information asymmetry and generate brand trust, subsequently driving purchase intention [40,83]. Research applying the S-O-R framework has established that ESG advertising, as an external stimulus, activates affective and cognitive evaluations, including perceived warmth, competence, and advertising value, that translate into heightened purchase intention [84]. Drawing on TPB, ESG messages have been shown to shape consumer attitudes toward sustainable consumption, reinforce subjective norms through alignment with social sustainability expectations, and strengthen perceived behavioral control by clarifying the societal impact of individual purchase choices [48,85]. Across retail, green product, and NEV markets, convergent empirical evidence indicates that ESG communications build brand trust and enhance brand image, both of which are robust predictors of purchase intention [12,86]. Based on this theoretical and empirical foundation, the following hypothesis is proposed:
H1: The inclusion of ESG message strategy in NEV advertisements enhances consumers’ purchase intention.
Building on the established relationship between ESG message strategy and purchase intention, a theoretically consequential question concerns whether the structural form of MS (direct or indirect) differently influences its persuasive efficacy. The explanatory framework for this differential effect draws upon the cognitive processing mechanisms embedded within Consumer Behavior Theory (CBT) and TPB. CBT identifies perceived trust and consumer attitude as core determinants of purchase decisions, wherein trust functions to attenuate psychological risk under conditions of informational uncertainty [87,88]. TPB specifies that behavioral intention is jointly shaped by attitude formation and perceived behavioral control, both of which are sensitive to the clarity and verifiability of incoming information [48]. Taken together, these frameworks suggest that the structural properties of MS, particularly its degree of explicitness, constitute a meaningful moderator of persuasion effectiveness.
The divergent effects of direct and indirect ESG message strategies can be elucidated through the dual-process logic of the Elaboration Likelihood Model (ELM). Direct ESG message strategy, characterized by the form-function alignment of literal speech acts (i.e., declarative and directive utterances), activates systematic processing via the central route, whereby consumers evaluate argument quality, logical coherence, and the verifiability of stated claims [89]. This processing mode is particularly congruent with consumer demands for transparency and accountability in sustainability communications, where the capacity to assess factual accuracy directly reinforces trust formation and attitude consolidation. Indirect ESG message strategy, by contrast, employs narrative, metaphorical, or interrogative expressions whose communicative intent is not surface-transparent, thereby initiating heuristic processing via the peripheral route. While such strategies may enhance affective engagement, the interpretive demands they impose can amplify advertising skepticism and trigger persuasion knowledge activation, particularly when consumers perceive a misalignment between implied claims and verifiable corporate conduct [28,90]
Empirical evidence substantiates the relative advantage of direct message expression in high-involvement purchase contexts. Choi and Choi [14] demonstrated that rational, fact-based ESG presentations generated significantly stronger behavioral intentions compared to emotionally framed counterparts. Lee, Raschke, and Krishen [19] confirmed that explicit ESG signals improve information transparency and thereby enhance brand valuation. Complementary evidence indicates that consumers in the NEV sector demonstrate greater responsiveness to specific, measurable impact evidence than to abstract sustainability narratives [58,91]. The systematic capacity of direct ESG message strategy to supply verifiable, cognitively accessible information thus facilitates trust formation, reinforces positive attitude development, and ultimately strengthens purchase intention to a greater degree than its indirect counterpart. Based on this theoretical and empirical foundation, the following hypothesis is proposed:
H2: Direct ESG message strategy exerts a more positive influence on consumers’ purchase intention than indirect ESG message strategy.
2.3. The Mediating Effect of Psychological Responses
Consumer psychological responses (PR) constitute fundamental determinants of consumer behavior, encompassing multifaceted cognitive and emotional processes that shape individual decision-making patterns [92,93,94]. Within the theoretical framework of consumer behavior, psychological responses manifest through various dimensions including consumer perceptions, motivations, trust evaluations, and attitudinal formations, all of which serve as critical mediating factors between marketing stimuli and behavioral outcomes [95,96]. Among these psychological dimensions, three core components emerge as particularly influential in contemporary marketing contexts: perceived brand trust, perceived brand image, and consumer attitudes, each representing distinct yet interconnected facets of consumer psychological responses to brand communications [97]. Therefore,
H3: Consumers’ psychological responses mediate the relationship between ESG message strategy and consumers’ purchase intention.
2.3.1. Perceived Brand Trust
Consumer perceived brand trust (BT) represents the fundamental belief that a brand will consistently meet consumer expectations and act with integrity, ensuring reliability in both product offerings and brand behaviors [98,99]. Within ESG communication contexts, perceived trust emerges as a critical mediating mechanism linking message expression strategies to purchase intentions [100]. Direct ESG message fosters cognitive trust through verifiable, transparent information provision, while indirect message cultivates emotional trust via subtle cues and appeals invoking shared values [101]. Research demonstrates dual mediating pathways: cognitive trust from direct message translates into rational purchase decisions, whereas emotional trust from indirect message encourages engagement through empathy and value congruence [12,102]. Evidence from food and beverage industries reveals that trust formed through both message modes significantly enhances purchase intentions, illustrating how different strategies bridge sustainability communications and consumer decisions through complementary trust-building mechanisms [14,91]. Based on the above analysis, the following hypothesis is proposed:
H3-1: Consumers’ perceived brand trust mediates the relationship between ESG message strategy and consumers’ purchase intention.
2.3.2. Perceived Brand Image
Brand image (BI) encompasses the comprehensive associations, attitudes, and beliefs consumers develop through brand interactions [103], integrating tangible product qualities with intangible attributes including ethical practices and sustainability initiatives [104]. In ESG communication contexts, brand image serves as a critical mediating mechanism between expression methods and purchase intentions [105]. The manner of ESG message strategy communication, through transparency, trustworthiness, and emotional engagement, directly shapes brand image perceptions, subsequently affecting purchasing willingness [106,107]. Evidence indicates that transparent, emotionally engaging ESG message formats enhance brand credibility and positively impact overall image [107,108], facilitating brand love and loyalty development as consumers form stronger connections with ethically aligned brands [109]. This mediating effect proves particularly pronounced among low-involvement consumers, where ESG message strategies serve as pivotal decision determinants [110,111]. The relationship between ESG message strategy and purchase intention operates partially through brand image mediation, as positive perceptions cultivated through effective communication strategies influence purchasing decisions [112,113]. Based on the above analysis, the following hypothesis is proposed:
H3-2: Consumers’ perceived brand image mediates the relationship between ESG message strategy and consumers’ purchase intention.
2.3.3. Consumer Attitude
Consumer attitude (CA) represents a psychological tendency integrating cognitive, emotional, and behavioral components in evaluating products, brands, or services [114,115], capturing predispositions to respond favorably or unfavorably based on beliefs, feelings, and intended behaviors [116]. Within ESG communication frameworks, consumer attitude functions as a mediating variable transmitting the influence of message strategies to purchase intentions [105]. The framing and communication of ESG message affects purchase behavior through attitude formation [111,117], fostering cognitive and emotional brand connections that influence purchasing behavior [100,111]. Empirical evidence confirms that attitudes shaped by ESG message strategy framing mediate advertising effects on consumer behavior, particularly increasing purchase willingness and brand engagement [118]. Consumer attitude thus serves as the psychological mechanism translating ESG message into consumer action and brand loyalty [119]. Therefore, based on the above analysis, the following hypothesis is proposed:
H3-3: Consumers attitude mediates the relationship between ESG messagestrategy and consumers’ purchase intention.
2.4. The Moderating Role of Brand Type
The moderating role of brand type is grounded in brand identity signaling theory and the divergent expectations embedded in consumer-brand relationships. According to this framework, luxury brands function primarily as symbols of social identity and self-concept, where consumption is associated with status, uniqueness, and emotional experience [120,121] The consumer-brand relationship in this context expects communication that is implicit, subtle, and experience-driven [122]. Consequently, indirect ESG message strategies, such as aesthetic narratives or value-implications, align more congruently with luxury brand identity, enhancing brand appeal through emotional resonance and self-projection [123,124]. Overly direct or utilitarian ESG claims, however, may be perceived as undermining the brand’s exclusivity and symbolic aura [125,126].
In contrast, affordable brands primarily serve as providers of functional value, with consumer relationships built on expectations of cost-effectiveness, reliability, and transparency [127]. Within this relational framework, direct ESG message strategies can more effectively convey signals of credibility and honesty, satisfying consumers’ demands for information transparency and functional performance verification [128]. Research further indicates that consumers of affordable brands tend to prioritize practical considerations over emotional or symbolic appeals, rendering straightforward sustainability claims more persuasive [40].
Thus, brand type not only defines market positioning but also presets the psychological framing through which consumers process and evaluate ESG-related message, thereby moderating the persuasive effectiveness of different message strategies. Based on this analysis, the following hypotheses are proposed:
H4: Brand type moderates the relationship between ESG message strategyand consumers’ purchase intention.
H4-1: For luxury brands, indirect ESG message strategy exerts a stronger positive influence on consumers’ purchase intention than direct ESG message strategy.
H4-2: For affordable brands, direct ESG message strategy exerts a stronger positive influence on consumers’ purchase intention than indirect ESG message strategy.
The research framework integrates the above hypotheses into a comprehensive model examining how ESG message strategy influence consumer purchase intentions through multiple mediating mechanisms, with brand type serving as a critical moderator. The research framework diagram of this study is as follows:
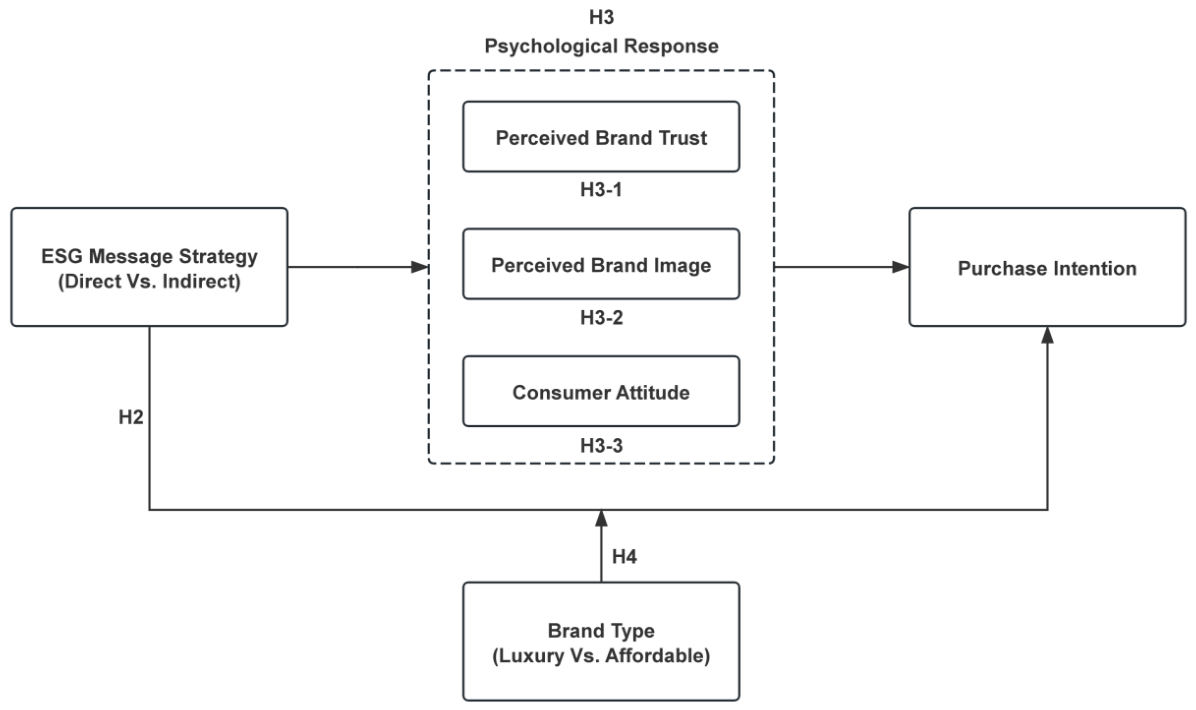
Figure 1.
Research framework diagram.
3. Research Design and Methodologies
This chapter presents the methodological framework designed to test the proposed hypotheses through two sequential experimental studies. Study 1 employed a single-factor between-subjects design comparing MS-present versus MS-absent conditions to examine the baseline effect of MS on PI (H1). Study 2 utilized a 2 (Message Strategy: Direct vs. Indirect) × 2 (Brand Type: Luxury vs. Affordable) between-subjects factorial design to investigate the differential effects of message strategies (H2), the mediating role of psychological responses including brand trust, brand image, and consumer attitude (H3), and the moderating effect of brand type (H4). Prior to the main studies, two preliminary tests were conducted to validate the experimental stimuli and ensure that participants reliably distinguished between conditions. All experimental materials featured fictional NEV brands and were presented in text-only format without any visual or auditory stimuli. The chapter subsequently details the measurement instruments adapted from established scales, the questionnaire development process, and the data collection and screening procedures that yielded a combined valid sample of 604 respondents.
3.1. Research Design
3.1.1. Preliminary Tests
Preliminary test A: Message strategy presence manipulation check. A single-factor between-subjects design was employed with two conditions: an experimental group (Group 1) exposed to an MS present advertisement, and a control group (Group 2) exposed to an MS absent advertisement. The experimental group’s material incorporated ESG-related content addressing environmental commitments, social contributions, and governance practices, while the control group’s material contained only vehicle performance descriptions. Both advertisements featured a fictional NEV brand and were presented in text-only format without any visual or auditory stimuli. The word count difference between the two materials was controlled within 5 characters to ensure equivalent information load.
60 potential NEV consumers (aged above 18 with the intention to purchase NEV within one year) were recruited through a combined offline and online strategy. This approach was designed to enhance the validity and diversity of the sample. Offline, participants were recruited via on-site visits to authorized NEV dealerships (4S stores) in multiple regions (Tianjin and Hebei), where prospective customers expressing purchase interest were invited to participate. Online, recruitment was conducted via social networking platforms (primarily WeChat) through a referral process. All eligible participants were then randomly assigned to either the control or experimental condition, with 30 participants per group. After reading the assigned advertisement, participants completed a manipulation check questionnaire comprising five items designed based on GRI standards. These items assessed participants’ perception of ESG message in the advertisement. All items were measured on a 5-point Likert scale (1 = Strongly Disagree, 5 = Strongly Agree).
Independent-samples t-tests revealed significantly higher composite scores in the experimental group (M1 = 19.40, SD1 = 3.92) compared to the Control Group (M2 = 11.67, SD2 = 4.54), t = -7.067, p < .001, Cohen’s d = 1.83. All individual items demonstrated large effect sizes (d ranging from 1.69 to 2.15, all p < .001), confirming that participants successfully discriminated between the two advertisement types. Detailed statistics for all items are provided in Table 1.
Preliminary test B: Message strategy manipulation check. A single-factor between-subjects design was employed with two conditions (direct vs. indirect). Consistent with SAT’s direct–indirect distinction, the manipulation targeted the explicitness and verifiability of ESG claims. In the direct condition, ESG content was communicated through explicit, evidence-oriented statements (e.g., concrete metrics or specific practices). In the indirect condition, ESG content was conveyed implicitly through value-oriented and interpretive wording (e.g., narrative/metaphorical phrasing or rhetorical questions) that highlighted sustainability vision without providing verifiable details. Both stimuli featured a fictional NEV brand and were presented in text-only form without any visual or auditory stimuli, so that participants were exposed only to textual content. The word count difference between the two materials was kept within five words to ensure comparable information load.
Using the same multi-channel recruitment strategy as Preliminary Test A, 60 eligible participants were randomly assigned to the direct (Group 1) or indirect (Group 2) condition (n = 30 per group). After reading the assigned advertisement, participants completed a six-item manipulation check adapted from Kim and Ferguson [129] and Du, Bhattacharya, and Sen [32]. Perceived message directness was measured by items capturing the extent to which the ESG message provided specific descriptions, clear data support, and a fact-based nature. Perceived message indirectness was assessed with items capturing the extent to which the ESG message required inference, emphasized emotional resonance, and foregrounded vision and values. All items were measured on a 5-point Likert scale (1 = Strongly Disagree, 5 = Strongly Agree).
As expected, the Direct Group scored significantly higher on the perceived directness dimension (M1 = 4.23, SD1 = 0.89) compared to the Indirect Group (M2 = 2.02, SD2 = 1.08), t = 8.173, p < .001, Cohen’s d = 2.239. Conversely, the Indirect Group scored significantly higher on the perceived indirectness dimension (M2 = 4.58, SD2 = 0.74) compared to the Direct Group (M1 = 1.90, SD1 = 1.05), t(58) = -10.701, p < .001, Cohen’s d = 2.943. The large effect sizes (d > 2.0) indicate a successful manipulation. Item-level statistics are reported in Table 2. Following prior advertising research, this study operationalized directness/indirectness at the level of ESG claim explicitness and inferential demand, rather than exhaustively coding illocutionary categories.
3.1.2. Main Studies
Study 1: The Impact of MS presence on PI. This research employed a single-factor between-subjects design with two conditions: MS present versus MS absent. The experimental materials were identical to those validated in pre-test A, which had confirmed that participants reliably distinguished between the two conditions.
Participants were recruited using the multi-channel approach established in the preliminary tests, combining offline intercepts at NEV dealerships across multiple regions with online recruitment via social media platforms. The target sample size was determined through a priori power analysis using G*Power 3.1. To detect a medium effect size (d = 0.50) with α = .05 and statistical power of .80, a minimum of 128 participants (64 per condition) was required. A total of 225 questionnaires were distributed, with eligibility criteria identical to those in the preliminary studies.
Following recruitment, participants were randomly assigned to either the control group or the experimental group, with each group receiving its corresponding questionnaire version. Upon accessing the questionnaire, participants first read an introductory statement explaining that the study aimed to investigate consumer interests toward NEV advertising. They were informed that a fictional brand would be used and were instructed to respond based on their genuine impressions. Participants then read a brief brand positioning description introducing the fictional NEV manufacturer. Following this introduction, participants proceeded to view the stimuli ads which were the same materials used in pre-test A.
After reading the advertisement, participants first completed an attention check item asking them to recall the vehicle’s starting price mentioned in the material. This verification served to confirm careful reading and provided grounds for excluding inattentive respondents. Participants then completed measures of brand trust, brand image, consumer attitude, and purchase intention. Finally, participants answered demographic questions including age, gender, education level, and annual income. The entire procedure took approximately 8-10 minutes. The complete questionnaire is provided in Appendix I.
Study 2: The effect mechanism of MS on PI. Study 2 employed a 2 (Message Strategy: Direct vs. Indirect) × 2 (Brand Type: Luxury vs. Affordable) between-subjects design to test the main effect of message strategy (H2), the mediating effect of psychological responses (H3), and the moderating effect of brand type (H4).
Following the established multi-channel recruitment protocol, 450 questionnaires were distributed using the same eligibility criteria as previous studies. After recruitment, participants were randomly assigned to one of the four experimental conditions. Upon accessing the questionnaire, participants first read a brand profile designed to activate specific cognitive situations. Those in luxury conditions read a description emphasizing premium high-end positioning and comparability with international luxury brands, anchored by a price of 598,000 RMB, designed to activate a situation associated with exclusivity and status. Those in affordable conditions read a description emphasizing lower end mass-market orientation and practicality, anchored by a price of 59,900 RMB, designed to activate a situation associated with accessibility and value. The tenfold price disparity reinforced the distinct market positions.
Participants then viewed an ESG advertisement corresponding to their assigned message-strategy condition. The stimuli were identical to those validated in Pretest B. In the direct condition, ESG message was presented through explicit, evidence-oriented claims with concrete and verifiable details; in the indirect condition, ESG message was conveyed implicitly through value-oriented and interpretive wording that emphasized sustainability vision and required greater inference. The materials were presented in text-only form and were matched in length to ensure comparable information load.
After exposure, participants first completed an attention check regarding the vehicle’s price. They then assessed the three mediating variables (BT, BI, CA) followed by the dependent variable of purchase intention. The whole session concluded with demographic questions, lasting approximately 10-12 minutes. The complete questionnaire is provided in Appendix II.
3.2. Variable Measurement
The measurement instrument for this study was developed based on the established theoretical framework to assess four key variables: BT, BI, CA, and PI. To form the scales, items were adapted from established and validated scales found in prior literature. Modifications were made to these items to align them with the context and objectives of the present research. The final adapted scales constituted the standardized questionnaire used for data collection.
3.2.1. Brand Trust
BT measurement in Table 3 was synthesized from multiple sources, incorporating items from Sung and Kim [130] addressing general trust perceptions, Morgan and Hunt [131] contributing safety and quality trust dimensions, and Sirdeshmukh, Singh, and Sabol [132] providing items capturing honesty and security perceptions. The scale was refined through reverse-coding of the quality concern item to mitigate acquiescence bias while maintaining construct coverage.
3.2.2. Brand Image
BI perception in Table 4 was synthesized from contemporary branding literature. Items adapted from Bernarto et al. [133] assess prestige and personality dimensions, while Bianchi, Bruno, and Sarabia-Sanchez [134] contribute items capturing overall brand evaluation and attractiveness. The inclusion of an environmental image item specifically addresses green brand positioning, crucial for examining ESG communication effectiveness.
3.2.3. Consumer Attitude
CA measurement scale in Table 5 was drawn from the TPB framework [135] and subsequent applications in electric vehicle adoption research. Items from Bennett and Vijaygopal [136] capture evaluative attitudes toward electric vehicles, while Shih and Fang [137]’s contributions address behavioral attitudes regarding usage intentions. The attitude scale specifically focuses on product-level attitudes rather than brand attitudes, maintaining conceptual clarity in the mediation model.
3.2.4. Purchase Intention
PI measurement scale in Table 6 was established in sustainable consumption research contexts. The scale synthesizes contributions from Han, Hwang, and Lee [138] addressing immediate purchase intentions, Barbarossa et al. [139] capturing temporal purchase expectations, and He, Zhan, and Hu [140] contributing items addressing consideration and recommendation intentions.
3.3. Questionnaire Design
The development of the survey instrument for this study followed a systematic, multi-stage process to ensure its contextual relevance, reliability, and validity.
The process began with a review of existing literature to identify and adapt measurement items from established and validated scales corresponding to the core constructs of the study. Subsequently, these English-language scales were localized. This involved translation and a phase of cultural and contextual adaptation. For this purpose, the initial item pool was refined based on feedback from an expert panel of scholars in relevant fields. To ensure the theoretical framework was appropriately reconstructed for the local market, qualitative insights were also gathered through in-depth interviews and analyses of media texts. The findings from this qualitative stage served to adapt the constructs to the specific context of the Chinese NEV market. Finally, the refined questionnaire was evaluated in an empirical validation phase. Pre-tests were conducted with a sample of the target population to assess the instrument’s psychometric properties. The reliability and validity of the scales were examined, and minor adjustments were made based on the results. This procedure resulted in the final version of the questionnaire used for the main data collection.
The questionnaire was structured into three parts. The first part is information collection regarding NEVs. The second part, including stimuli materials, which were identical to the tested materials in pretest A and B, measures the 4 key variables: BT, BI, CA, and PI. This section consists of 20 structured items. All items in this section were measured on a 5-point Likert scale (1 = Strongly Disagree, 5 = Strongly Agree). The final part collects participants’ basic demographic data. The complete questionnaires for all experimental conditions are provided in Appendix I and II.
3.4. Data Collection and Screening
This study targets the potential NEV consumers and a multi-source data collection approach was implemented. A two-stage data cleaning procedure was applied to exclude invalid responses, including those with a completion time of less than 90 seconds, patterned responses, and failures in attention check questions.
The screening results for each study are as follows. For Study 1 (N1), 21 invalid responses were identified and removed from the 225 distributed questionnaires, resulting in a final valid sample of 204 (100 for control group, 102 for experimental group) for hypothesis testing. To ensure a balanced experimental design and maximize statistical power, Study 2 (N2) employed a dynamic quota-based recruitment strategy targeting 100 valid responses per condition. Given the one-on-one nature of our data collection (via offline intercepts and online social media platforms), we were able to monitor data quality in real-time. Throughout the process, strict exclusion criteria were applied (incomplete responses, completion times under 90 seconds, or failed attention checks). Consequently, recruitment followed a rolling protocol: whenever an invalid response was identified in any of the four experimental cells, the recruitment continued until the target was achieved. This procedure resulted in approximately 450 total distributions, continuing strictly until the target of 400 valid responses was met (100 per cell).
Consequently, from a total collected N=675, 71 invalid questionnaires were removed, yielding a combined valid sample of 604 (valid response rate = 89.5%). All subsequent hypothesis testing was performed on the respective study’s valid sample (N1 = 204; N2 = 400). The combined sample size of 604 far exceeds the minimum requirement of 145 (29 measured variables × 5) for Structural Equation Modeling, providing a solid foundation for multivariate statistical analysis.
4. Data Analysis
4.1. Measurement Model Assessment (Pooled Sample N=604)
Prior to hypothesis testing, the psychometric properties of the measurement instruments were evaluated to ensure data reliability and construct validity. This section reports the results of confirmatory factor analysis (CFA), internal consistency reliability, and construct validity assessments (convergent and discriminant validity) conducted on the pooled sample.
Rationale for pooled-sample validation. This study comprises two sequential experiments: Study 1 (N₁=204) examining message strategy presence effects, and Study 2 (N₂=400) investigating message strategy and brand type effects. Critically, both studies employed identical measurement instruments for all focal constructs (BT, BI, CA, PI) and demographic variables, differing only in experimental stimuli and attention-check items. Given this measurement equivalence, psychometric validation was conducted on the combined sample (N=604) to maximize statistical power and ensure robust parameter estimation in structural equation modeling, consistent with established methodological practices in multi-study experimental research [141,142,143]. This approach enables definitive assessment of scale reliability and factorial structure while hypothesis testing for each study utilizes its respective sub-sample. The combined sample size substantially exceeds conventional SEM requirements (29 observed variables × 5 = 145 minimum cases), providing adequate statistical power for multivariate analyses.
The following subsections report: (1) CFA results demonstrating adequate model-data fit; (2) internal consistency coefficients (Cronbach’s α and corrected item-total correlations) confirming scale reliability; (3) convergent validity indices (standardized loadings, composite reliability, average variance extracted) verifying within-construct coherence; and (4) discriminant validity tests (Fornell-Larcker criterion) establishing between-construct distinctiveness
4.1.1. Confirmatory Factor Analysis (CFA)
CFA tests whether the hypothesized four-factor measurement model adequately represents the observed data structure. This analysis evaluates: (1) sampling adequacy through the Kaiser-Meyer-Olkin (KMO) measure (threshold >0.70) and Bartlett’s test of sphericity (p<.05), which confirm whether variables are sufficiently correlated for factor analysis [144]; and (2) model-data fit through multiple indices including chi-square to degrees-of-freedom ratio (χ²/df <5), RMSEA (<0.08), and incremental fit indices (GFI, NFI, IFI, TLI, CFI >0.90) [145].
Prior to CFA, KMO and Bartlett’s tests verified sampling adequacy across all constructs. As shown in Table 7, KMO values ranged from 0.863 to 0.886, substantially exceeding the 0.70 threshold: BT (0.867), BI (0.877), CA (0.863), and PI (0.886). Bartlett’s test of sphericity yielded significant results for all constructs (all p<.001): BT (χ²=895.989, df=10), BI (χ²=1105.951, df=10), CA (χ²=786.667, df=10), and PI (χ²=1181.454, df=10). These results confirm that the correlation matrix is factorable and appropriate for subsequent CFA.
CFA was conducted using AMOS 26.0 to test the hypothesized four-factor structure, with 20 observed indicators loading onto four latent constructs: BT (5 items), BI (5 items), CA (5 items), and PI (5 items). The model allowed correlations among the four latent constructs while constraining items to load only on their designated factors. Figure 2 presents the standardized solution of the measurement model, displaying factor loadings and interconstruct correlations.
As presented in Table 8, all fit indices in model fit evaluation met or exceeded recommended thresholds, indicating excellent model-data correspondence. The χ²/df=1.936 (<5), suggesting acceptable model parsimony. RMSEA=0.048 (<0.08) indicated close fit with minimal approximation error. All incremental fit indices exceeded 0.90: GFI=0.923, NFI=0.929, IFI=0.964, TLI=0.959, and CFI=0.964. These results collectively confirm that the hypothesized four-factor measurement model provides an excellent representation of the observed covariance structure, supporting the validity of the factor structure for subsequent analyses.
4.1.2. Reliability Analysis (CR)
Reliability analysis assesses internal consistency through two indicators: Cronbach’s α and corrected item-total correlation (CITC). Cronbach’s α values above 0.70 indicate acceptable reliability [146]. while CITC values exceeding 0.40 demonstrate adequate item discrimination [147]. Additionally, “Cronbach’s α if item deleted” values are examined; if deletion of any item substantially increases α, that item may be reducing scale reliability and warrants removal.
Reliability analysis was conducted using SPSS 27.0. As presented in Table 9, all constructs demonstrated excellent internal consistency: BT (α=0.869), BI (α=0.895), CA (α=0.854), and PI (α=0.902), all exceeding the 0.70 threshold. CITC values ranged from 0.641 to 0.800, substantially above the 0.40 criterion, confirming strong item-construct relationships across all 20 items. Examination of “Cronbach’s α if item deleted” revealed no item whose removal would increase scale reliability (range: 0.816–0.893), indicating that each item contributes meaningfully to its construct without redundancy.
4.1.3. Convergent Validity (Factor Loadings, CR, AVE)
Convergent validity assesses whether multiple indicators designed to measure the same construct demonstrate strong interrelationships, confirming that items within a scale converge on a common underlying dimension. Three key indices evaluate convergent validity [148]: (1) standardized factor loadings, which should exceed 0.70, indicating that each observed variable strongly represents its latent construct; (2) composite reliability (CR), which should surpass 0.70, demonstrating that the set of indicators reliably measures the construct; and (3) average variance extracted (AVE), which should exceed 0.50, confirming that the construct explains more than half of the variance in its indicators, thereby validating that shared variance among items exceeds measurement error variance.
As presented in Table 10, all standardized factor loadings substantially exceeded the 0.70 threshold, ranging from 0.700 to 0.863 across all constructs. For BT, loadings ranged from 0.721 to 0.809; for BI, from 0.760 to 0.830; for CA, from 0.700 to 0.763; and for PI, from 0.738 to 0.863. All unstandardized factor loadings were statistically significant (all p < .001), with critical ratios ranging from 13.276 to 19.941, confirming good relationships between observed indicators and their latent constructs. CR values for all constructs surpassed 0.7: BT (CR = 0.87), BI (CR = 0.895), CA (CR = 0.854), and PI (CR = 0.902). AVE values also met the criterion: BT (AVE = 0.573), BI (AVE = 0.629), CA (AVE = 0.54), and PI (AVE = 0.649).
4.1.4. Discriminant Validity (Fornell-Larcker Criterion)
Discriminant validity assesses whether distinct constructs are distinguishable. Following the Fornell-Larcker criterion [148], discriminant validity is confirmed when the square root of each construct’s AVE exceeds its correlations with other constructs, indicating that constructs share more variance with their own indicators than with each other. Interconstruct correlations should remain below 0.85 to avoid multicollinearity [149].
Discriminant validity was assessed by comparing the square root of AVE for each construct against its interconstruct correlations. As presented in Table 11, the square roots of AVE (diagonal elements in boldface) were: BT = 0.757, BI = 0.793, CA = 0.735, and PI = 0.806. All square roots of AVE exceeded their corresponding row and column correlations. The highest observed correlation was r = 0.371 (between BT and CA), substantially lower than the smallest AVE square root (0.735 for CA). All other interconstruct correlations ranged from 0.308 to 0.367, well below the 0.85 multicollinearity threshold. These results demonstrate that each construct shares more variance with its own indicators than with other constructs, confirming adequate discriminant validity and establishing that BT, BI, CA, and PI represent empirically distinct dimensions.
4.2. Study 1: Testing the Effect of ESG Message Strategy Presence
Study 1 represents the initial phase of the empirical investigation, primarily aimed at establishing the baseline effect of MS presence on PI. Building directly upon the randomized between-subjects design outlined in Section 3.1.2, this study seeks to verify H1 by comparing consumer responses to advertisements with and without MS. The following subsections are structured to provide a rigorous transition from descriptive evidence to causal inference: first, presenting the demographic and behavioral profile of the sample to ensure its market relevance (Section 4.2.1); second, reporting the manipulation check results to confirm the internal validity of the experimental stimuli (Section 4.2.2); and finally, performing inferential statistical testing to evaluate the primary research hypothesis (Section 4.2.3). By sequentially examining these components, Study 1 provides the foundational evidence necessary for the more granular mechanism explorations in Study 2.
4.2.1. Descriptive statistics and sample characteristics
This section presents the descriptive statistical analysis of the NEV information and the demographic data collected from Study 1. A total of 204 valid responses were obtained and included in the final data analysis.
As presented in Table 12, the sample comprised 204 participants and the demographic and behavioral characteristics demonstrate strong relevance to the research context. The gender composition showed a female majority (66.18%, n = 135), with male participants representing 33.82% (n = 69). The age distribution was concentrated in the 26-35 age group (28.43%, n = 58), followed closely by the 36-45 bracket (24.02%, n = 49), reflecting the core consumer group typically associated with NEV adoption. Educational attainment was notably high, with 51.49% holding a Bachelor’s degree or above (Bachelor’s: 27.45%, Master’s: 9.80%, Doctorate: 13.24%), suggesting substantial cognitive capacity for evaluating complex advertising messages. Family annual income was relatively evenly distributed across middle-income brackets, with 50.51% earning between CNY 100,000 and 300,000, indicating adequate purchasing power for automotive decisions.
Importantly, the sample demonstrated substantial NEV market engagement. Nearly all participants reported prior NEV purchase experience (95.59%, n = 195) and current ownership (91.17%, n = 186), establishing them as informed consumers rather than novices. Market familiarity was correspondingly high, with 87.76% reporting moderate to extreme awareness of NEVs. Advertising exposure patterns revealed active engagement, as 67.75% frequently or very frequently attended to NEV advertisements. Most critically, all 204 participants (100%) confirmed definite purchase or repurchase intentions within the next year, ensuring that the sample directly represents the target population for whom ESG messaging strategies are commercially relevant.
4.2.2. Manipulation Check (ESG Message Strategy Presence)
The manipulation check confirmed that participants reliably distinguished between MS-present and MS-absent advertisements (see Section 3.1.1 for detailed design). Results of the independent-samples t-test indicated that participants in the MS-present group perceived significantly higher levels of ESG message than those in the control group (Mpresent = 19.40 vs. Mabsent = 11.67, t = -7.067, p < .001, Cohen’s d = 1.83). This large effect size indicates successful manipulation.
4.2.3. H1 Testing Results
Study 1 employed a between-subjects design in which participants were randomly assigned to either a control condition (advertisement without MS) or an experimental condition (advertisement with MS), with PI as the sole dependent variable to test H1 (the inclusion of MS in NEV advertisements would significantly enhance consumers’ PI). An independent samples t-test was conducted to compare PI scores between the two conditions.
Results (in Table 13) indicated a statistically significant difference between groups (t = −6.756, p < .001). Participants in the experimental condition reported substantially higher PI (M = 4.23, SD = 0.63) compared to the control group (M = 3.56, SD = 1.05), with a mean difference of 0.67. The negative t-value reflects the calculation direction (Control − Experimental), confirming that MS inclusion produced higher purchase intention, fully supporting H1.
4.3. Study 2: Testing the Effect of ESG Message Strategy
Study 2 serves as the core empirical component of this research, aiming to systematically verify the causal relationships between MS and PI. While building upon the preliminary findings, this study employs a 2×2 between-subjects experimental design to achieve three primary objectives: (1) to validate the main effect of direct versus indirect MS on PI (H2); (2) to elucidate the internal psychological mechanisms through both second order and first-order mediation models (H3); and (3) to identify the boundary conditions imposed by brand type (H4). The following sections detail the sample characteristics, manipulation effectiveness, and the sequential testing of the hypothesized direct, mediating, and moderating effects, providing a comprehensive statistical basis for the subsequent discussion of theoretical and managerial implications.
4.3.1. Descriptive Statistics and Sample Characteristics
This section presents the descriptive statistical analysis of the NEV information and the demographic data collected for the 2×2 experiment in Study 2. A total of 400 valid responses were obtained and included in the final data analysis.
As detailed in Table 14, the sample of 400 participants provides a relevant basis for this study. The gender distribution is relatively balanced, with a slight majority of female respondents (51.00%, n=204). The age structure is concentrated in the 26-35 bracket (34.00%, n=136), which aligns with the primary consumer demographic in the current NEV market. A significant portion of the sample holds a Bachelor’s degree or higher (46.50% combined), suggesting a strong capacity for processing informational cues in advertising. In terms of economic capacity, the majority of respondents report an family annual income between CNY 100,000 and 300,000 (62.25%), indicating their financial standing is appropriate for automobile consumption and lending credibility to their purchase considerations.
Crucially, the sample predominantly consists of experienced NEV users, as the vast majority have either previously purchased (91.50%) or currently own (93.75%) an NEV. Consistent with this experience, respondents exhibit a high degree of market awareness, with 87.25% being generally familiar or better with NEV and 87.75% paying at least occasional attention to NEV advertisements. Most importantly, all participants (100%, n=400) express a clear intention to purchase or repurchase an NEV within the next year, underscoring the sample’s direct relevance to the research questions of this study.
4.3.2. Manipulation Checks
To verify the distinction between direct and indirect MS, a manipulation check was performed as detailed in Section 3.1.2. The direct group reported significantly higher perceived directness (M = 4.23) compared to the indirect group (M = 2.02, t = 8.173, p < .001), while the indirect group perceived significantly more inferential and metaphorical elements (M = 4.58) than the direct group (M = 1.90, t = -10.701, p < .001). These results confirm that participants could clearly discriminate between the two message strategies, ensuring the internal validity of the subsequent main analysis.
4.3.3. Main effect testing (H2)
H2 proposed that direct ESG message strategy would exert a more positive influence on consumers’ purchase intention than indirect ESG message strategy. To test H2, Study 2 exposed participants to either a direct or indirect MS under a 2×2 experimental design, with PI as the dependent variable. An independent samples t-test was conducted to compare PI scores between the two message strategy groups.
Results (Table 15) revealed a statistically significant group difference (t = −7.292, p < .001, 95% CI [−0.806, −0.342]). Participants exposed to direct MS reported significantly higher PI (M = 3.93, SD = 0.85) than those in the indirect condition (M = 3.30, SD = 0.89), with a mean difference of 0.63. These findings confirm that direct MS framing produces more favorable purchase intentions than indirect framing, supporting H2.
4.3.4. Mediation Effect Testing (H3)
To comprehensively examine the mediating mechanisms of psychological responses, this study adopted a two-stage analytical strategy: first, BT, BI, and CA were aggregated into the second-order factor “psychological response (PR)” to test its overall mediation effect; subsequently, the independent mediating effects of the three dimensions were tested in parallel to identify specific pathways. All mediation analyses were conducted using bootstrapping procedures with 5,000 resamples and 95% bias-corrected confidence intervals (CI). A mediation effect is confirmed when the confidence interval excludes zero.
Second-order factor model (PR as overall mediator). A second-order structural equation model was employed to test H3. Model fit indices demonstrated excellent fit: CMIN/DF = 1.851 (<5), GFI = 0.923, NFI = 0.925, IFI = 0.964, TLI = 0.959, CFI = 0.964 (all >0.90), and RMSEA = 0.046 (<0.08). As showed in Figure 3, path analysis revealed that MS significantly predicted PR (β = 0.34), and PR significantly influenced PI (β = 0.60). The direct effect of MS on PI was small (β = 0.15), while the indirect effect through PR (0.34 × 0.60 = 0.204) was larger. These results indicate that PR partially mediates the MS–PI relationship, with the indirect pathway accounting for a considerable proportion of the total effect.
A second-order SEM path analysis was conducted to test H3. Result showed (in Table 16) all hypothesized paths were significant. MS significantly predicted PR (β = 0.343, C.R. = 4.98, p < .001), and PR significantly predicted PI (β = 0.598, C.R. = 6.472, p < .001). The direct effect of MS on PI was also significant (β = 0.154, C.R. = 2.86, p = .004).
Bootstrap analysis was conducted to further validate the mediation effect of H3 and its results further confirmed partial mediation (Table 17). The indirect effect of MS on PI through PR was significant (β = 0.205, SE = 0.043, 95% CI [0.129, 0.298], p < .001), accounting for 57.1% of the total effect. The direct effect also remained significant (β = 0.154, SE = 0.055, 95% CI [0.042, 0.258], p = .008), comprising 42.9%. The total effect was β = 0.359 (95% CI [0.265, 0.449]). Since neither confidence interval contained zero, both pathways were statistically significant, confirming partial mediation. These findings collectively confirm that PR partially mediates the MS–PI relationship, therefore H3 is supported.
First-order factor model (BT/BI/CA as sub-mediators). A first-order structural equation model was employed to test H3-1, H3-2, and H3-3. Model fit indices demonstrated excellent fit: CMIN/DF = 2.402, GFI = 0.901, NFI = 0.904, IFI = 0.941, TLI = 0.932, CFI = 0.941 (all >0.90), and RMSEA = 0.059 (<0.08). As showed in Figure 4, MS significantly predicted all three mediators: BT (β = 0.23), BI (β = 0.18), and CA (β = 0.23). Each mediator exerted a positive effect on PI: BI demonstrated the strongest influence (β = 0.27), followed by BT (β = 0.21) and CA (β = 0.18). The direct path from MS to PI was β = 0.23. Standardized path coefficients are consistent with the SEM result reported in Table 18.
A first-order SEM path analysis was conducted to test the mediation effect in H3-1, H3-2, and H3-3. As shown in Table 18, all hypothesized relationships were significant (p < .001): MS → BT (β = 0.230), MS → BI (β = 0.176), MS → CA (β = 0.229), BT → PI (β = 0.215), BI → PI (β = 0.266), CA → PI (β = 0.180), and MS → PI (β = 0.235).
Bootstrap analysis was employed to further confirm the sub-mediation effect of H3 three sub-hypothesis. Result was showed in Table 19. The indirect effect through BT was 0.049 (95% CI [0.022, 0.093], p < .001), accounting for 13.17% of total effect, supporting H3-1. The indirect effect through BI was 0.047 (95% CI [0.019, 0.087], p < .001), comprising 12.63%, supporting H3-2. The indirect effect through CA was 0.041 (95% CI [0.014, 0.084], p = .001), representing 11.02%, supporting H3-3. The combined indirect effects (36.83%) and direct effect (63.17%, β = 0.235) yielded a total effect of 0.372. All three sub-mediation hypotheses were supported.
4.3.5. Moderation effect testing (H4)
H4 proposed that brand type moderates the effect of MS on PI. Specifically, H4-1 predicted that luxury brand consumers would respond more favorably to indirect MS, while H4-2 predicted that affordable brand consumers would exhibit stronger purchase intentions under direct MS. To test these predictions, Study 2 employed a 2×2 between-subjects design crossing MS (direct vs. indirect) with brand type (luxury vs. affordable). A two-way ANOVA was conducted to assess whether the influence of MS on PI differs systematically across brand contexts.
The overall model was significant, results (in Table 20) showed F (3, 396) = 27.254, p < .001, R² = .171 (adjusted R² = .165), indicating that the experimental manipulations collectively explained 17.1% of the variance in PI. Significant main effects were observed for both brand type, F (1, 396) = 11.659, p = .001, partial η² = .029, and MS, F (1, 396) = 48.330, p < .001, partial η² = .109, confirming independent effects of both factors on PI.
Critically, the moderation effect of H4 was significant, F (1, 396) = 13.796, p < .001, partial η² = .034, indicating that the effect of MS on PI is contingent upon brand type. Descriptive statistics (Table 21) reveal a clear divergence in the magnitude of the direct–indirect difference across brand conditions. For affordable brands, PI increased substantially from the indirect condition (M = 3.28) to the direct condition (M = 4.19), yielding a large difference (Δ = 0.91), supporting H4-2. For luxury brands, PI also increased from the indirect condition (M = 3.31) to the direct condition (M = 3.58), but the magnitude was markedly smaller (Δ = 0.27), indication that H4-1 was not supported.
Synthesizing the results of the preceding analyses, the overall hypothesis testing results are summarized in Table 22.
5. Discussion and Implications
This chapter synthesizes the empirical findings to provide a comprehensive interpretation of how ESG message strategies influence consumer behavior in NEV sector. By integrating Advertising Theory and SAT with CBT models, the discussion extends beyond statistical verification to explore the underlying psychological mechanisms and boundary conditions governing sustainability communication.
Section 5.1 interprets the research findings, specifically examining the necessity of explicit ESG signaling, the cognitive superiority of direct MS, the mediating pathways of psychological responses, and the moderating influence of brand positioning. Subsequently, Section 5.2 translates these theoretical insights into actionable marketing implications, offering strategic guidance for practitioners to optimize ESG advertising in credibility-sensitive contexts. Collectively, this chapter elucidates the transition from linguistic strategy to behavioral outcome, refining the theoretical boundaries of sustainability marketing.
5.1. Discussions on Research Findings
The empirical findings provide evident support for all hypothesized relationships, offering significant theoretical and practical insights into ESG communication effectiveness within the NEV sector.
5.1.1. Necessity of Explicit ESG Communication in NEV Advertising
The significant enhancement of purchase intention through ESG message strategy (H1) reveals a counter-intuitive insight: even for inherently sustainable products like NEVs, consumers require explicit sustainability communication. This occurs because NEV purchase decisions involve two distinct evaluative dimensions, namely product-level environmental performance and enterprise-level sustainability commitment [150,151]. Consumers perceive the vehicle itself as merely one manifestation of corporate environmental philosophy. ESG message delivered by advertisements bridges this gap by signaling systemic commitment beyond the product, thereby reducing uncertainty about brand authenticity and long-term reliability [152].
5.1.2. Cognitive Advantage of Direct ESG Messaging
The superiority of direct over indirect ESG message strategy (H2) reflects the unique psychological dynamics of high-involvement sustainable consumption. NEV purchases entail substantial financial commitment and identity investment, creating heightened information-seeking motivation. In this context, consumers require cognitive signs, specifically verifiable data and concrete metrics, to justify both the economic premium and the identity claim associated with sustainable consumption. Indirect messages, while potentially evoking emotional resonance, fail to provide the evidentiary foundation that consumers need to rationalize their decisions to themselves and others. This explains why the processing advantage of direct message becomes particularly pronounced in contexts where consumers must defend their choices against potential skepticism [14,153,154].
5.1.3. Mediating Mechanism of Psychological Responses
Psychological responses serve as the critical transmission mechanism through which ESG message strategies influence purchase intention (H3). The second-order structural equation model demonstrates that the higher-order construct of PR — encompassing brand trust, brand image, and consumer attitude as its first-order dimensions — carries a substantial indirect effect of 57.1% (β = 0.205, 95% CI [0.129, 0.298]), significantly exceeding the direct pathway (42.9%). This finding confirms that ESG communication operates primarily through relationship-building rather than direct persuasion, aligning with the S-O-R framework that positions psychological states as the organismic mechanisms translating external stimuli into behavioral outcomes.
Delving into the specific dimensions, the first-order mediation analysis reveals that all three psychological response dimensions contribute independently yet complementarily to this mediating process. BI operates as the cognitive-associative dimension (indirect effect = 12.63%), functioning as the knowledge structure through which consumers organize and interpret ESG messages, forming holistic mental representations of the brand’s sustainability positioning. BT serves as the affective-evaluative dimension (13.17%), generating emotional security and relational bonds that reduce perceived risk through feelings of confidence and safety in the brand’s ESG commitments. CA functions as the conative-intentional dimension (11.02%), representing the behavioral readiness and action tendencies that translate cognitive evaluations and affective responses into explicit purchase predispositions.
Notably, while each dimension demonstrates comparable effect sizes (approximately 11–13%), their sequential activation — from cognitive processing (image formation) through affective evaluation (trust development) to behavioral intention (attitude formation) — mirrors the classical hierarchy-of-effects model in consumer psychology. This mechanism suggests that BT, BI, and CA function as interconnected psychological contracts between consumers and brands, wherein ESG messages serve as the currency negotiating value alignment across cognitive, emotional, and behavioral domains. The comparable magnitude of the three pathways indicates that ESG communication effectiveness requires simultaneous activation of brand knowledge structures (cognitive), emotional bonds (affective), and behavioral readiness (conative), with no single dimension dominating the persuasive process.
5.1.4. Boundary Effects of Brand Positioning
The moderation analysis reveals a significant interaction between brand type and ESG message strategy (F(1, 396) = 13.796, p < .001, partial η² = .034), confirming H4 that brand type moderates the MS–PI relationship. However, the specific pattern deviates from theoretical expectations. While H4-2 was strongly supported (direct strategy superior for affordable brands), H4-1 was not supported, with direct messaging proved more effective than indirect messaging even for luxury brands, though with a substantially attenuated effect size (Δ = 0.27 for luxury vs. Δ = 0.91 for affordable).
The significant interaction effect indicates that brand positioning fundamentally shapes how consumers interpret and utilize ESG messages. For affordable brands, purchase decisions are typically framed as value optimization under budget constraints; thus, direct and verifiable ESG claims function as efficient credibility cues that reduce perceived decision risk at low cognitive cost. The markedly larger strategy effect in the affordable condition (Δ = 0.91) suggests that consumers treat direct ESG messages not merely as “green” credentials but as diagnostic signals of operational efficiency and corporate reliability. This aligns with our expectation that explicitness is particularly persuasive when consumers are highly cost- and risk-sensitive. In the affordable brand context, where functional value dominates symbolic value, direct ESG claims serve a dual purpose: (1) they signal corporate competence (the brand can afford to be transparent about its sustainability practices), and (2) they reduce information search costs (consumers need not infer environmental performance from vague narratives). This result is consistent with prior evidence that concrete, evidence-based claims enhance perceived diagnosticity and trust, especially under uncertainty or risk [58,61].
At the same time, our finding contrasts sharply with research in luxury branding, which suggests that persuasion is more effective when it relies on subtle, symbolic cues rather than overt, prominent claims [122], and that explicit CSR messages may even backfire when they conflict with self-enhancement brand concepts [125]. The unsupported H4-1 suggests that context-specific credibility demands can override brand-typical communication preferences in the ESG domain. Traditional luxury branding theory posits that implicit, symbolic communication aligns with luxury brand identity by preserving mystique, exclusivity, and allowing consumers to project personal meanings [122,125]. However, our findings indicate that in high-stakes ESG contexts — where claims are subject to greenwashing skepticism, regulatory scrutiny, and societal accountability — the credibility function of direct communication supersedes the symbolic function of indirect communication.
Three interrelated mechanisms explain why the expected luxury-indirect alignment did not materialize. Firstly, unlike traditional luxury attributes (craftsmanship, heritage, exclusivity) that derive value from subjective appreciation, ESG performance carries objective societal consequences that compel verification regardless of brand tier. For luxury NEV consumers, purchase decisions involve identity signaling requiring social defensibility — direct ESG claims provide the necessary “audit trail” to justify premium expenditure to peers and society, rendering symbolic subtlety functionally inadequate when moral legitimacy is at stake. Secondly, NEVs embody a semiotic contradiction as both status symbols and moral choices; while luxury consumers typically prefer implicit messaging for hedonic attributes, sustainability claims trigger moral licensing concerns demanding explicit verification. Indirect ESG messaging risks being perceived as evasive or insufficiently committed, creating authenticity dissonance for consumers paying premiums for environmental technology. This suggests greenwashing vigilance operates independently of brand prestige — luxury halo effects cannot compensate for informational opacity in sustainability domains. Thirdly, while indirect strategies impose cognitive burdens that luxury consumers typically accept for experiential benefits, ESG evaluation involves risk assessment rather than aesthetic appreciation, making inferential effort a liability rather than an engagement mechanism. For affordable brands, this liability compounds with budget constraints (explaining the dramatic Δ = 0.91 effect), whereas for luxury brands, reputational risk — being associated with inauthentic claims — creates analogous pressure for clarity, explaining the persistent though attenuated direct strategy advantage (Δ = 0.27).
The significant but smaller direct–indirect difference for luxury brands (Δ = 0.27 vs. Δ = 0.91) suggests that luxury positioning moderates the magnitude but not the direction of message strategy effects. This attenuation pattern indicates that luxury brand equity provides partial insulation against the disadvantages of indirect messaging — perhaps through halo effects that confer baseline trust, or through consumer willingness to engage in charitable interpretation of ambiguous claims — but cannot fully overcome the credibility imperative inherent in ESG communication. This finding refines the theoretical boundary of brand-congruent communication theory. When message content involves verifiable ethical claims subject to third-party scrutiny and social accountability, the traditional preference for implicit luxury communication yields to transparency demands that transcend brand tier. The luxury brand’s role shifts from dictating communication style to moderating sensitivity to informational clarity — luxury consumers still benefit from direct claims, but their purchase intentions are less dependent on explicitness than affordable brand consumers who lack compensatory brand equity and face higher relative decision risk.
5.2. Marketing Implications
The findings yield actionable implications for integrating ESG message into advertising strategy, particularly in credibility-sensitive contexts such as NEVs where sustainability claims are subject to heightened consumer scrutiny.
First, position ESG messages as decision-relevant information rather than peripheral corporate storytelling. The positive effect of ESG message strategy inclusion on purchase intention (H1) indicates that sustainability content should be integrated into the core value proposition, not relegated to footnotes or CSR pages. In high-involvement categories, such as automobiles, durable goods, financial services, ESG claims function as quality signals and risk-reduction cues that shape consumer judgment. Managers should therefore embed ESG content within primary advertising copy and align it strategically with the brand's functional promise.
Second, adopt direct, verifiable ESG claims as the default strategic approach. Direct ESG message strategies significantly outperform indirect strategies in driving purchase intention (H2), demonstrating that explicitness and verifiability reduce inferential burden and increase message diagnosticity. Practitioners should apply an “evidence-first” principle by translating ESG performance into concrete, evaluable claims: (a) specify measurable outcomes (e.g., quantified emission reductions, certified performance metrics); (b) describe operational practices or processes; and (c) indicate verification mechanisms (third-party audits, industry certifications, standardized reporting frameworks). This approach does not require increased message length but demands replacing vague sustainability language with high-information, substantiated content, particularly critical when audiences harbor greenwashing concerns.
Third, leverage ESG advertising as a trust-building mechanism. Mediation analyses reveal that ESG message strategy influences purchase intention primarily through brand trust, brand image, and consumer attitude (H3), underscoring the importance of credibility-based brand equity. Two execution principles follow: (1) align external claims with internal operations and publicly available disclosures to avoid credibility erosion; (2) facilitate consumer verification by incorporating standardized indicators, transparent baselines, and access pathways to detailed evidence (e.g., QR codes linking to certification records or sustainability reports). Through this approach, ESG advertising shifts from moral signaling to substantive trust enhancement that translates into behavioral intention.
Fourth, calibrate message execution to brand positioning while preserving verifiable substance. The moderating effect of brand type (H4) demonstrates that direct messaging improves purchase intention for both luxury and affordable brands, with substantially stronger effects for affordable brands. For affordable brands operating in value-driven decision contexts, direct ESG claims serve as efficient credibility cues signaling reliability and operational competence; managers should emphasize evidence-based ESG message as functional quality indicators. For luxury brands, where direct claims yield smaller incremental gains, a hybrid execution proves optimal: retain brand-appropriate aesthetic framing and premium-congruent language while embedding verifiable ESG metrics, practices, and accountability mechanisms. Luxury positioning should shape the stylistic presentation of ESG communication, not substitute verifiability with symbolic ambiguity.
Fifth, extend strategic principles beyond NEVs to other credibility-sensitive categories. Although empirically grounded in the NEV context, these implications generalize to product domains where ESG claims are evaluated through heightened credibility standards, such as energy-related products, household durables, mobility services, and sustainability-labeled consumer goods. In such contexts, indirect ESG storytelling may complement communication by building emotional resonance but should not replace evaluable evidence. Managers are advised to employ indirect narratives as supportive framing layered atop direct, verifiable claims, particularly when purchase decisions involve high perceived risk or consumer skepticism regarding corporate sustainability motives.
6. Limitations and Future Research
This study has several limitations that offer directions for future inquiry. First, although SAT provides the conceptual foundation for the direct–indirect distinction, the present experiments operationalize the construct at the level of advertising claim explicitness and inferential demand in text-based stimuli, rather than offering a full taxonomic coding of all illocutionary categories. Second, the use of a fictional brand ensured internal validity by controlling for pre-existing brand attitudes, but it may limit ecological validity. In real markets, established brand heritage and existing consumer relationships could significantly amplify or attenuate the effects of ESG messaging, suggesting the need for replication with real-world brands. Third, the cross-sectional experimental design, while establishing controlled causal relationships between message exposure and immediate intentions, cannot capture the longitudinal dynamics of consumer decision-making. The formation of trust, attitude, and purchase intention in high-involvement purchases like NEVs is a process that unfolds over time and through multiple touchpoints, which our snapshot methodology could not observe. Future longitudinal or field studies tracking consumers from ad exposure to actual purchase are recommended. Consequently, the generalizability of our findings to all NEV consumers, particularly those in offline-dominant or less digitally engaged segments, should be interpreted with caution.
This study points to several promising avenues for future research that would both extend its theoretical contributions and enhance its practical relevance. First, to strengthen external validity, research should replicate and extend these findings using real automotive brands. Investigating how pre-existing brand equity, heritage, and established consumer relationships interact with ESG message strategies would provide more ecologically valid guidance for marketers. Second, a critical limitation of the experimental snapshot is its inability to capture the temporal dynamics of consumer decision-making. Future work should employ longitudinal or field-study designs to track how exposure to different ESG communications influences perceptions and behaviors across the entire customer journey, from initial awareness to post-purchase loyalty. Third, the influence of cultural context remains an open question. Cross-cultural comparative studies are needed to examine whether the observed effects — particularly the moderating role of brand type — hold in markets with differing sustainability priorities, communication norms, and consumer values, such as comparing Western individualistic versus Eastern collectivist societies. Finally, moving beyond the direct/indirect dichotomy, researchers should investigate integrated or sequential message strategies. A key frontier is exploring the efficacy of mixed-message frameworks that strategically combine indirect emotional narratives with direct factual substantiation, potentially creating a more robust and resilient persuasive effect that mitigates the weaknesses of either approach used in isolation. Pursuing these directions will be essential for developing a more nuanced, dynamic, and globally applicable understanding of ESG communication in the evolving automotive landscape.
Furthermore, the unsupported H4-1 provides several future research directions too. First, boundary condition testing should examine whether direct messaging dominance in luxury contexts generalizes to other high-accountability domains (health claims, data privacy, financial transparency) or is unique to sustainability. Second, hybrid strategy investigation is warranted — luxury brands may optimize outcomes by combining direct ESG substance with indirect aesthetic framing, creating transparent sophistication that satisfies both credibility and exclusivity needs. Third, cross-cultural replication should test whether this pattern holds in individualistic versus collectivist cultures, where luxury consumption motives and ESG accountability perceptions may differ systematically.
Funding
This research did not receive any specific grant from funding agencies in the public, commercial, or not-for-profit sectors.
Informed Consent Statement
Informed consent was obtained from all participants involved in the study. Before beginning the questionnaire, participants were informed of the purpose of the research, the voluntary nature of their participation, the anonymous and confidential treatment of their responses, and the use of the collected data solely for academic research. Participants indicated their informed consent by voluntarily proceeding with and submitting the questionnaire.
Data Availability Statement
The authors confirm that the data supporting the findings of this study are available within the article and its supplementary materials.
Declaration of Generative AI and AI-Assisted Technologies in the Writing Process
During the preparation of this work the authors used ChatGPT to improve language. After using this tool, the authors reviewed and edited the content as needed and take full responsibility for the content of the publication.
Conflicts of Interest
The authors report there are no competing interests to declare.
First Author:
Wenjuan Lu is a Professor and Ph.D. in the Department of International Business at Tianjin Foreign Studies University. She received her bachelor’s degree from Tianjin University of Technology, and both her M.S. degree and Ph.D. degree from Nankai University. Her research focuses on marketing management and consumer behavior. She teaches courses in Marketing, Human Resource Management, Management, and Business Research Methods. Professor Lu has published more than 15 papers and works in the fields of marketing and consumer behavior, with substantial research achievements. She was awarded the first prize in the 11th Tianjin Higher Education Young Teachers’ Basic Teaching Skills Competition (English Group).
Second Author:
Yufan Qiu received the B.S. degree in Business English from Ningbo University, Zhejiang, China, in 2022. She is currently working toward the M.S. degree in Business English with the Department of English Studies, Tianjin Foreign Studies University, Tianjin, China. Her research interests include Marketing, Business English and Linguistics.
Third Author:
Philip Laird is Senior Vice President of Global Engagement and Government Relations at Trinity Western University and is currently on a one-year secondment to Trinity International University. His research focuses on psychology, intercultural engagement, and higher education innovation. His extensive involvement in China has fostered academic, governmental, and institutional partnerships.
References
- Agency, International Energy. 2024. "World Energy Outlook 2024." In.
- Raimi, Daniel; Zhu, Yuqi; Newell, Richard G; Prest, Brian C. Global energy outlook 2024: Peaks or plateaus; Resources for the Future: Washington, DC, USA, 2024. [Google Scholar]
- Näsman, Mattias; Ballor, Grace. The car industry and climate change: A historical review; Working Paper Series; 2024. [Google Scholar]
- Paudel, Dolendra. "Corporate Sustainablity Implementation in the Asian Automotive Industry: An Analysis of Sustainability Reports.". 2025. [Google Scholar] [CrossRef]
- Lee, Hoesung; Calvin, Katherine; Dasgupta, Dipak; Krinner, Gerhard; Mukherji, Aditi; Thorne, Peter W.; Trisos, Christopher; et al. "Climate Change 2023: Synthesis Report. 2023, 35–115. [Google Scholar] [CrossRef]
- Li, Yan; Li, Jilian. The Relationship between Environmental, Social, Governance, and Export Performance in Manufacturing Companies: A Literature Review. Theor. Pract. Res. Econ. Fields 2023, 14(2), 345–356. [Google Scholar] [CrossRef]
- Wang, Zeng; Niu, Shifan; Hu, Shijie; Yang, Wenqi; Huang, Lingyu. "How to promote sustainable consumption and development of NEV? Decoding complex interrelationships in consumer requirements and design practice. J. Clean. Prod. 2025, 486, 144524. [Google Scholar] [CrossRef]
- Balderjahn, Ingo; Peyer, Mathias; Seegebarth, Barbara; Wiedmann, Klaus-Peter; Weber, Anja. The many faces of sustainability-conscious consumers: A category-independent typology. J. Bus. Res. 2018, 91, 83–93. [Google Scholar] [CrossRef]
- Martiny, Alice; Taglialatela, Jonathan; Testa, Francesco; Iraldo, Fabio. Determinants of environmental social and governance (ESG) performance: A systematic literature review. J. Clean. Prod. 2024, 456, 142213. [Google Scholar] [CrossRef]
- Palla Maier, Gunther, Marcos Serena, and Dulcimar José Julkovski. ENVIRONMENTAL, SOCIAL AND GOVERNANCE (ESG) AND CONSUMER BEHAVIOR: TRENDS TOWARDS CONSCIOUS CONSUMPTION. Environ. Soc. Manag. Journal/Revista De Gestão Soc. E Ambient. 2024, 18(10). [CrossRef]
- Fana, Yunqi; Wangb, Cong. The Impact of ESG Practices on the Financial Performance of New Energy Vehicle Manufacturing Enterprises. Acad. J. Bus. Manag. 2025, 7(2), 82–88. [Google Scholar] [CrossRef]
- Li, Youyou; Chen, Xiaoya. "Can Corporate ESG Practices Promote Consumers' Purchase Intention of Green Food? The Mediating Role of Brand Trust. Front. Sustain. Food Syst. 2025, 9, 1622653. [Google Scholar] [CrossRef]
- Zhang, Fei; Zhang, Yi; Liao, Shiyu; Zhou, Xingjian; Ma, Xiaogang. Research on the impact of matched effects between green advertising appeals and product type on consumer purchase intention. J. Retail. Consum. Serv. 2025, 85, 104265. [Google Scholar] [CrossRef]
- Choi, Miju; Choi, Youngjoon. Emotional or rational? Effective ESG advertising messages for travel enterprises. J. Travel Tour. Mark. 2024, 41(1), 68–87. [Google Scholar] [CrossRef]
- Jayadatta, S. The Role of Social Media in Promoting ESG–A Theoretical Assimilation. Int. J. Mark. Bus. Commun. 2023, 12(2), 25–36. [Google Scholar]
- Austin, J.L. "Speech acts; Oxford, 1962. [Google Scholar]
- Searle, John R. Speech acts: An essay in the philosophy of language; Cambridge university press, 1969. [Google Scholar]
- Khan, Wania. "Corporate narratives in CSR communication?"; SLU, Dept. of Urban and Rural Development, 2024. [Google Scholar]
- Lee, Michael T; Raschke, Robyn L; Krishen, Anjala S. Signaling green! firm ESG signals in an interconnected environment that promote brand valuation. J. Bus. Res. 2022, 138, 1–11. [Google Scholar] [CrossRef]
- Nurhidayah, Indah; Pratama, Hendi; Fitriati, Sri Wuli. The realization of expressive speech act used in smartphone advertisement videos on YouTube. Engl. Educ. J. 2024, 14(1), 1–25. [Google Scholar]
- Dewi, Anggraeni Purnama; Nur, Tajudin; Machdalena, Susi; Shmelkova, Vera Viktorovna. Illocutionary speech acts on Balinese hospitality advertising discourse in Russian: A pragmatic study. Theory Pract. Lang. Stud. 2024, 14(1), 192–201. [Google Scholar] [CrossRef]
- Gartia, Umakanta; Panda, Ajaya Kumar; Hegde, Apoorva; Nanda, Swagatika. Environmental, social and governance aspects and financial performance: A symbiotic relationship in Indian manufacturing. Clean. Prod. Lett. 2024, 7, 100076. [Google Scholar] [CrossRef]
- Liang, Xinye; Cao, Peng. "Does corporate ESG disclosure enhance investor relationship management? Evidence from China. Account. Financ. 2024, 64(2), 2011–2035. [Google Scholar] [CrossRef]
- Srivastava, Anjali; Anand. Six decades of corporate disclosure research: a bibliometric review. Manag. Financ. 2024, 50(4), 768–790. [Google Scholar] [CrossRef]
- Carrión-Bósquez, Nelson Geovany; Ortiz-Regalado, Oscar; Veas-González, Ivan; Naranjo-Armijo, Franklin Gerardo; Guerra-Regalado, Wilson Fernando. "The mediating role of attitude and environmental awareness in the influence of green advertising and eco-labels on green purchasing behaviors. Span. J. Mark.-ESIC 2025, 29(3), 330–350. [Google Scholar] [CrossRef]
- Lima, Pedro Augusto Bertucci; Falguera, Fernanda Pereira Sartori; da Silva, Hermes Moretti Ribeiro; Maciel, Suely; Mariano, Enzo Barberio; Elgaaied-Gambier, Leila. From green advertising to sustainable behavior: a systematic literature review through the lens of value-belief-norm framework. Int. J. Advert. 2024, 43(1), 53–96. [Google Scholar] [CrossRef]
- Holtgraves, Thomas. Emoji, speech acts, and perceived communicative success. J. Lang. Soc. Psychol. 2024, 43(1), 83–103. [Google Scholar] [CrossRef]
- Prastio, Bambang; Ibrahim, Abdul Syukur; Susanto, Gatut; Nurzafira, Istiqomah. Pattern of indirect directive speech acts on online advertisements. Bhs. Dan Seni J. Bhs. Sastra Seni Dan Pengajarannya 2024, 49(2), 2. [Google Scholar]
- Hu, Xiaofang; Yusof, Raja Nerina Raja; Mansor, Zuraina Dato. "Consumers’ Purchase Intentions Towards New Energy Vehicles Based on the Theory of Planned Behaviour on Perceived Value: An Empirical Survey of China. World Electr. Veh. J. 2025, 16(3), 120. [Google Scholar] [CrossRef]
- Lienig, Larissa. The Sustainability of a Green Shared Rhetorical Vision: Opportunities and Encumbrances of Green Marketing in the Automobile Industry; Juniata College, 2020. [Google Scholar]
- Barkemeyer, R.; Comyns, B.; Figge, F.; Napolitano, G. CEO statements in sustainability reports: Substantive information or background noise? Paper presented at the Accounting Forum, 2014. [Google Scholar]
- Du, Shuili; Bhattacharya, Chitrabhan B; Sen, Sankar. Maximizing business returns to corporate social responsibility (CSR): The role of CSR communication. Int. J. Manag. Rev. 2010, 12(1), 8–19. [Google Scholar] [CrossRef]
- Gillan, Stuart L; Koch, Andrew; Starks, Laura T. Firms and social responsibility: A review of ESG and CSR research in corporate finance. J. Corp. Financ. 2021, 66, 101889. [Google Scholar] [CrossRef]
- Afanasiev, M.P.; Shash, N.N. New Information in Financial Disclosures Related to Sustainable Development in the Concept of ESG (Version IFRS). Stud. Russ. Econ. Dev. 2023, 34(5), 696–703. [Google Scholar] [CrossRef]
- Hassani, Hossein; Unger, Stephan; Entezarian, Mohammad Reza. Information content measurement of esg factors via entropy and its impact on society and security. Information 2021, 12(10), 391. [Google Scholar] [CrossRef]
- Egorova, Alexandra A; Grishunin, Sergei V; Karminsky, Alexander M. The Impact of ESG factors on the performance of Information Technology Companies. Procedia Comput. Sci. 2022, 199, 339–345. [Google Scholar] [CrossRef]
- Kim, Yanghee; Jang, Hojoon; Seok, Junhee. Uncovering the relationship between ESG practices and firm value: the role of reputation and industry sensitivity. Asia Mark. J. 2024, 25(4), 207–218. [Google Scholar] [CrossRef]
- ODINTSOVA, Tatyana. ESG INFORMATION PRACTICES AS A DRIVER OF VALUE CREATION. J. Eur. Econ. 2024, 23(2), 225–249. [Google Scholar] [CrossRef]
- Zheng, Qiaoyang; Talib, Zunirah Mohd. CHALLENGES ON CHINA LISTED COMPANIES’HIGH-QUALITY DEVELOPMENT FROM THE STANDPOINT OF ESG INFORMATION DISCLOSURE: A CONCEPTUAL PAPER. Int. J. Bus. Econ. 2023, 5(4), 1–17. [Google Scholar]
- Zhang, Ran; Zhou, Xiaolong; Liu, Qijia; Wang, Chen. "Brand attitude as the catalyst: transforming perceived ESG to consumer's purchase intention in low-carbon consumption. Front. Psychol. 2025, 16, 1599472. [Google Scholar] [CrossRef]
- Al-Issa, Nermain; Khaki, Audil Rashid; Jreisat, Ammar; Al-Mohamad, Somar; Fahl, Dina; Limani, Emira. Impact of environmental, social, governance, and corporate social responsibility factors on firm’s marketing expenses and firm value: A panel study of US companies. Cogent Bus. Manag. 2022, 9(1), 2135214. [Google Scholar] [CrossRef]
- Balaskas, Stefanos; Stamatiou, Ioannis; Komis, Kyriakos; Nikolopoulos, Theofanis. "Perceptions of Greenwashing and Purchase Intentions: A Model of Gen Z Responses to ESG-Labeled Digital Advertising. Risks 2025, 13(8), 157. [Google Scholar] [CrossRef]
- Waites, Stacie F. "Decoding ESG: Consumer Perceptions, Ethical Signals and Financial Outcomes. J. Risk Financ. Manag. 2025, 18(7), 361. [Google Scholar] [CrossRef]
- Guerreiro, João; Pacheco, Mariana. How green trust, consumer brand engagement and green word-of-mouth mediate purchasing intentions. Sustainability 2021, 13(14), 7877. [Google Scholar] [CrossRef]
- Cheng, Li Keng; Huang, Hsien-Long. Influence of environmental, social and governance (ESG) disclosures on consumer brand perceptions and behavioral intentions. Asia Pac. J. Mark. Logist. 2025, 37(7), 1955–1971. [Google Scholar] [CrossRef]
- Ahmed, Bilal; El-Gohary, Hatem; Khan, Rukaiza; Gul, Muhammad Asif; Hussain, Arif; Shah, Syed Mohsin Ali. The Influence of Behavioral and ESG Drivers on Consumer Intentions for Online Fashion Renting: A Pathway Toward Sustainable Consumption in China’s Fashion Industry. 2024. [Google Scholar] [CrossRef]
- Jung, Bub-yeon; Park, Cheong-Yeul; Huber, Thomas P. "The Impact of Consumer Perceptions of SMEs' ESG Activities: The Mediating Effect of Corporate Image and the Moderated Mediating Effect of Ethical Consumption Tendency. Int. J. Contents 2025, 21(1), 114–134. [Google Scholar] [CrossRef]
- Ajzen, Icek. The theory of planned behavior. Organ. Behav. Hum. Decis. Process. 1991, 50(2), 179–211. [Google Scholar] [CrossRef]
- Altstiel, Tom; Grow, Jean. Advertising strategy: creative tactics from the outside/in; Sage, 2006. [Google Scholar]
- Laskey, Henry A; Day, Ellen; Crask, Melvin R. Typology of main message strategies for television commercials. J. Advert. 1989, 18(1), 36–41. [Google Scholar] [CrossRef]
- Taylor, Ronald E. A six-segment message strategy wheel. J. Advert. Res. 1999, 39(6), 7–17. [Google Scholar] [CrossRef]
- Frazer, Charles F. Creative Strategy: A Management Perspective. J. Advert. 1983, 12(4), 36–41. [Google Scholar] [CrossRef]
- den Putte, Bas van. "What matters most in advertising campaigns? Int. J. Advert. 2009a, 28, 669–690. [Google Scholar] [CrossRef]
- den Putte, Bas van. "What matters most in advertising campaigns? The relative effect of media expenditure and message content strategy. Int. J. Advert. 2009b, 28(4), 669–690. [Google Scholar]
- Papadopoulou, Christina; Hultman, Magnus; Oghazi, Pejvak. "Authenticity Perceptions of Informational and Transformational Advertising: Decoding the Role of Construal Level Mindset. Psychol. Mark. 2025, 42(3), 817–841. [Google Scholar] [CrossRef]
- Wang, Liyong; Praet, Carolus LC. Message strategy typologies: A review, integration, and empirical validation in China. Advances in Advertising Research (Vol. VI) The Digital, the Classic, the Subtle, and the Alternative 2015, 201–213. [Google Scholar]
- Puto, Christopher P; Wells, William D. Informational and Transformational Advertising: The Differential Effects of Time. Adv. Consum. Res. 1984, 11(1). [Google Scholar]
- Rahim, Abdul; Basit, Abdul; Wang, Li; Rabeeu, Ahmed. "Implicit or Explicit? Understanding Consumer Responses to ESG-Related Claims and ESG Disclosure in the Consumer-Packaged Goods Industry: An Emerging Economy Perspective. Corp. Soc. Responsib. Environ. Manag. 2025. [Google Scholar] [CrossRef]
- Tsang, Albert; Frost, Tracie; Cao, Huijuan. Environmental, social, and governance (ESG) disclosure: A literature review. Br. Account. Rev. 2023, 55(1), 101149. [Google Scholar] [CrossRef]
- Del Gesso, Carla; Lodhi, Rab Nawaz. "Theories underlying environmental, social and governance (ESG) disclosure: a systematic review of accounting studies. J. Account. Lit. 2025, 47(2), 433–461. [Google Scholar] [CrossRef]
- Kolling, Camila; Ribeiro, José Luis Duarte. "Leveraging Product Labels for Sustainable Consumption: Circular Economy, Corporate Social Responsibility, and ESG Messaging on Consumers' Purchase Decisions. Corp. Soc. Responsib. Environ. Manag. 2025. [Google Scholar] [CrossRef]
- Ahmed, Tahmina; Maharaj, Gajindra; Saxton, Gregory D.; Zhang, Shujie. "ESG Communication Tactics and Reputational Capital on Social Media. Information 2025, 16(12), 1063. [Google Scholar] [CrossRef]
- Austin; Langshaw, John. How to do things with words; Harvard university press, 1975. [Google Scholar]
- Searle, John R. "Indirect speech acts. In Speech acts; Brill, 1975; pp. 59–82. [Google Scholar]
- Searle, John R. Expression and meaning: Studies in the theory of speech acts; Cambridge University Press, 1979. [Google Scholar]
- Simon, Simona; Dejica-Cartis, Daniel. Speech acts in written advertisements: Identification, classification and analysis. Procedia-Soc. Behav. Sci. 2015, 192, 234–239. [Google Scholar] [CrossRef]
- Ludwig, Stephan; de Ruyter, Ko. Decoding social media speak: developing a speech act theory research agenda. J. Consum. Mark. 2016, 33(2), 124–134. [Google Scholar] [CrossRef]
- Sundararajan, Binod. An analysis of leaderspeak about sustainability using the lenses of speech act theory and social identity framing. In Paper presented at the Proceedings of the Transforming Emerging Economies and Sustainability Conference (TEES 2016), 2016. [Google Scholar]
- Morrison, Donald G. Purchase intentions and purchase behavior. J. Mark. 1979, 43(2), 65–74. [Google Scholar] [CrossRef]
- Morwitz, Vicki. Consumers' purchase intentions and their behavior. Found. Trends Mark. 2014, 7(3), 181–230. [Google Scholar] [CrossRef]
- Akar, Ezgi; Nasir, V Aslihan. A review of literature on consumers' online purchase intentions. J. Cust. Behav. 2015, 14(3), 215–233. [Google Scholar] [CrossRef]
- Shastry, Venkatesh S. Consumer attitude and their purchase intention: A review of literature. Int. Rev. Bus. Econ. 2021, 5(2), 3. [Google Scholar] [CrossRef]
- Chang, Tung-Zong; Wildt, Albert R. Price, product information, and purchase intention: An empirical study. J. Acad. Mark. Sci. 1994, 22, 16–27. [Google Scholar] [CrossRef]
- Mirabi, Vahidreza; Akbariyeh, Hamid; Tahmasebifard, Hamid. A study of factors affecting on customers purchase intention. J. Multidiscip. Eng. Sci. Technol. (JMEST) 2015, 2(1). [Google Scholar] [CrossRef]
- Singh, Ramendra Pratap; Banerjee, Neelotpaul. Exploring the influence of celebrity credibility on brand attitude, advertisement attitude and purchase intention. Glob. Bus. Rev. 2018, 19(6), 1622–1639. [Google Scholar] [CrossRef]
- Younus, Sohail; Rasheed, Faiza; Zia, Anas. Identifying the factors affecting customer purchase intention. Glob. J. Manag. Bus. Res. 2015, 15(2), 8–13. [Google Scholar]
- Mursandi, Doddy Adhi; Sudirman, Hudyah Astuti; Militina, Theresia. The impact of green marketing and corporate social responsibility on brand image, purchase intention, and purchase decision (Study on the body shop in Samarinda). Int. J. Econ. Bus. Account. Res. (IJEBAR) 2020, 4(4). [Google Scholar]
- Sharma, Vinod; Poulose, Jeanne; Mohanta, Subhasmita; Antony, Liza Elizabeth. Influence of the dimensions of CSR activities on consumer purchase intention. Innov. Mark. 2018, 14(1), 23. [Google Scholar] [CrossRef]
- Eom, Hui-ryang; Kim, Hyun-a; Kim, Hee-young; Gim, Gwang-yong. The impact of ESG activities in midsize manufacturing companies on purchase intentions: Focusing on the mediating roles of corporate reputation, brand image, and perceived quality. Paper presented at the IEEE/ACIS International Conference on Big Data, Cloud Computing, and Data Science Engineering, 2023. [Google Scholar]
- Bi, Chao; Jin, Shujuan; Li, Shizhuo; Li, Ya'nan. Can green advertising increase consumers' purchase intention of electric vehicles? An experimental study from China. J. Clean. Prod. 2023, 419, 138260. [Google Scholar] [CrossRef]
- Huang, Chun-Chen; Yen, Szu-Wei; Liu, Cheng-Yi; Huang, Pei-Chen. The relationship among corporate social responsibility, service quality, corporate image and purchase intention. Int. J. Organ. Innov. 2014, 6(3). [Google Scholar]
- Deng, Tao; Pysarchik, Dawn. COMPARING INFORMATIONAL, TRANSFORMATIONAL AND TRANSPORTATIONAL ADVERTISING STRATEGIES. Paper presented at the American Academy of Advertising. Conference. Proceedings (Online)., 2020. [Google Scholar]
- Lee, Michael T; Raschke, Robyn L. Understanding employee motivation and organizational performance: Arguments for a set-theoretic approach. J. Innov. Knowl. 2016, 1(3), 162–169. [Google Scholar] [CrossRef]
- Chen, Hsin-Ju; Wang, Hsing-Wen; Hung, Chung-Hsien. "“Feel the Flow, See the Value”: S–O–R Model of Consumer Responses to ESG Advertising. Sustainability 2025. [Google Scholar] [CrossRef]
- Van Hoang, Dinh; Anh, Nguyen Ngoc Ngan; Xuan, Nguyen Thi; Han, Pham Ngoc; Ngan, Do Phuong; Linh, Nguyen Le Khanh; Khoi, Luu Nguyen; Tung, Vuong Thiet; Duong, Trang Thi-Thuy. "Pathways to Green Purchase Intention in FMCG Industry: A Combined Approach of PLS-SEM and fsQCA. Sage Open 2025, 15(3), 21582440251378964. [Google Scholar] [CrossRef]
- Cao, Yuxiao. ESG, Brand Trust and Brand Loyalty. Commun. Humanit. Res. 2023, 22(1), 183–189. [Google Scholar] [CrossRef]
- Harridge-March, Sally. "Can the building of trust overcome consumer perceived risk online? Mark. Intell. Plan. 2006, 24(7), 746–761. [Google Scholar] [CrossRef]
- Quintal, Vanessa Ann; Lee, Julie Anne; Soutar, Geoffrey N. Risk, uncertainty and the theory of planned behavior: A tourism example. Tour. Manag. 2010, 31(6), 797–805. [Google Scholar] [CrossRef]
- Petty, Richard E; Cacioppo, John T. The elaboration likelihood model of persuasion; Springer, 1986. [Google Scholar]
- Basso, Kenny; Pauli, Jandir; Cerutti, Priscila; Perin, Marcia; Dalla Corte, Vitor Francisco; Dal Moro, Leila. "Greenwash, show your true colours: how verbal and visual messages influence consumers' perception? Int. J. Environ. Sustain. Dev. 2023, 22(2), 210–225. [Google Scholar] [CrossRef]
- Cheng, Li Keng; Huang, Hsien-Long. Influence of environmental, social and governance (ESG) disclosures on consumer brand perceptions and behavioral intentions. Asia Pac. J. Mark. Logist. 2024. [Google Scholar] [CrossRef]
- Ajzen, Icek. Consumer attitudes and behavior. In Handbook of consumer psychology; Routledge, 2018; pp. 529–552. [Google Scholar]
- Blundell, Richard. Consumer behaviour: theory and empirical evidence—a survey. Econ. J. 1988, 98(389), 16–65. [Google Scholar] [CrossRef]
- Fishbein, Martin; Ajzen, Icek. Belief, attitude, intention, and behavior: An introduction to theory and research; 1977. [Google Scholar]
- Manuere; Takudzwa, Henry; Chikazhe, Lovemore; Manyeruke, Josphat. Theoretical models of consumer behaviour: A literature review. Int. J. Educ. Humanit. Soc. Sci. 2022, 5(2), 105–112. [Google Scholar] [CrossRef]
- Schiffman, Leon; O'Cass, Aron; Paladino, Angela; Carlson, Jamie. Consumer behaviour; Pearson Higher Education AU, 2013. [Google Scholar]
- Sharma, Kirti; Trott, Sangeeta; Sahadev, Sunil; Singh, Ramendra. Emotions and consumer behaviour: A review and research agenda. Int. J. Consum. Stud. 2023, 47(6), 2396–2416. [Google Scholar] [CrossRef]
- Chaudhuri, Arjun; Holbrook, Morris B. The chain of effects from brand trust and brand affect to brand performance: the role of brand loyalty. J. Mark. 2001, 65(2), 81–93. [Google Scholar] [CrossRef]
- Dierks, Leef H. Does trust influence consumer behaviour? Agrar. Z. Für Betriebswirtschaft Marktforsch. Und Agrarpolit. 2007, 56(2), 106–111. [Google Scholar] [CrossRef]
- Zettergren, Elsa. "THE IMPACT OF ESG MARKETING: A qualitative study on brand trust, brand attractiveness and purchase intentions in environments possibly sceptic to sustainability.". 2025. [Google Scholar]
- Bae, Gum-Kwang; Lee, Sang-Mook; Luan, Bui-Kim. The impact of ESG on brand trust and word of mouth in food and beverage companies: Focusing on Jeju Island tourists. Sustainability 2023, 15(3), 2348. [Google Scholar] [CrossRef]
- Desmarais, Fabrice; Vignolles, Alexandra; Mukherjee, Abhishek. "Perceptions of Warmth and Competence Conveyed by Hard Sell and Soft Sell Voices: A Cross-Cultural Study. J. Curr. Issues Res. Advert. 2025, 1–36. [Google Scholar] [CrossRef]
- ADDIN, E.N. REFLIST Aaker, David A The value of brand equity. J. Bus. Strategy 1992, 13(4), 27–32. [Google Scholar]
- Kapferer, Jean-Noel. The new strategic brand management: Creating and sustaining brand equity long term; Kogan Page Publishers, 2008. [Google Scholar]
- Soares, Laura Nascimento Pinto. The Social Media Impact on Companies´ ESG Image: And how it Inspires Consumers and their Intention to Buy; Universidade NOVA de Lisboa (Portugal), 2025. [Google Scholar]
- Kim, Songmee; Jeong, Jin; Lee, Yuri. Effects of social identification on consumers' attitude and purchase intention for university logo products - Focusing on moderating effects of university prestige and online shopping frequency. Res. J. Costume Cult. 2020, 28(6), 755–770. [Google Scholar] [CrossRef]
- Koh, Hee-Kyung; Burnasheva, Regina; Suh, Yong Gu. Perceived ESG (environmental, social, governance) and consumers’ responses: The mediating role of brand credibility, Brand Image, and perceived quality. Sustainability 2022, 14(8), 4515. [Google Scholar] [CrossRef]
- Jung, Bub-yeon; Park, Cheong-Yeul; Huber, Thomas P. The Impact of ESG Management of Small and Medium Enterprises on Purchase Intention: The Mediating Effect of Corporate Image and Trust. Asia-Pac. J. Converg. Res. Interchange (APJCRI) 2024, 169–192. [Google Scholar] [CrossRef]
- Tripopsakul, Suchart; Puriwat, Wilert. Understanding the impact of ESG on brand trust and customer engagement. J. Hum. Earth Future 2022, 3(4), 430–440. [Google Scholar] [CrossRef]
- La, Dong-ki; Seo, Young Wook. "Study on the Impact of Corporate ESG Activities and Digital Transformat ion on Consumer Recommendation Intention: Mediating Effects of Corporate Image, Corporate Trust, and Brand Attitude. Ind. Promot. Res. 2025, 10(2), 1–15. [Google Scholar]
- Rastogi, Neha; Singh, Jitendra; Tyagi, Shagun; Ahmad, Vasim; Kumar, Rakesh; Singh, Rajesh; Sharma, Ayushi; Priyadarshi, Neeraj; Twala, Bhekisipho. "Building Trust through ESG: A Study on Consumer Behaviour in Sustainable Fashion.". F1000Research 2025, 14, 97. [Google Scholar] [CrossRef]
- Lee, Hyuck Jin; Rhee, Tae-hwan. "How Does Corporate ESG Management Affect Consumers’ Brand Choice?". Sustainability 2023, 15(8), 6795. [Google Scholar] [CrossRef]
- Zia, Anas; Younus, Sohail; Mirza, Farhan. Investigating the impact of brand image and brand loyalty on brand equity: the mediating role of brand awareness. Int. J. Innov. Creat. Change 2021, 15(2), 1091–1106. [Google Scholar]
- Ajzen, Icek; Cote, N Gilbert. Attitudes and the prediction of behavior. Attitudes Attitude Change 2008, 13, 289–305. [Google Scholar]
- Choo Yeon, KIM, PYO Ji Min, and Seong Soo CHA. Effects of ESG Management of Retail Companies on Consumer Values and Attitudes. J. Distrib. Sci. 2023, 21(4), 113–119.
- Abun, Damianus; Ubasa, Alvin Luciano A; Magallanes, Theogenia; Encarnacion, Mary Joy; Ranay, Frelyn B. Attitude toward the work and its influence on the Individual work performance of employees: Basis for Attitude Management. Tech. Soc. Sci. J. 2021, 18, 378. [Google Scholar]
- Yang, Qin; Lee, Young-Chan. The effect of live streaming commerce quality on customers’ purchase intention: extending the elaboration likelihood model with herd behaviour. Behav. Inf. Technol. 2024, 43(5), 907–928. [Google Scholar] [CrossRef]
- Puriwat, Wilert; Tripopsakul, Suchart. Sustainability matters: Unravelling the power of ESG in fostering brand love and loyalty across generations and product involvements. Sustainability 2023, 15(15), 11578. [Google Scholar] [CrossRef]
- Li, Youyou; Kim, Youngmi. "The Impact of Corporate ESG Performance on Sustainable Brand Management: Research Progress and Future Directions. Acad. J. Bus. Manag. 2025, 7(4), 149–155. [Google Scholar] [CrossRef]
- Vigneron, Franck; Johnson, Lester W. A review and a conceptual framework of prestige-seeking consumer behavior. Acad. Mark. Sci. Rev. 1999, 1(1), 1–15. [Google Scholar]
- Wiedmann, Klaus-Peter; Hennigs, Nadine; Siebels, Astrid. Value-based segmentation of luxury consumption behavior. Psychol. Mark. 2009, 26(7), 625–651. [Google Scholar] [CrossRef]
- Han, Young Jee; Nunes, Joseph C; Drèze, Xavier. Signaling status with luxury goods: The role of brand prominence. J. Mark. 2010, 74(4), 15–30. [Google Scholar] [CrossRef]
- Joy, Annamma; Sherry, John F, Jr.; Venkatesh, Alladi; Wang, Jeff; Chan, Ricky. Fast fashion, sustainability, and the ethical appeal of luxury brands. Fash. Theory 2012, 16(3), 273–295. [Google Scholar] [CrossRef]
- Kapferer, Jean-Noël; Michaut-Denizeau, Anne. "Is luxury compatible with sustainability? Luxury consumers’ viewpoint. In Advances in luxury brand management; Springer, 2017; pp. 123–156. [Google Scholar]
- Torelli, Carlos J; Monga, Alokparna Basu; Kaikati, Andrew M. Doing poorly by doing good: Corporate social responsibility and brand concepts. J. Consum. Res. 2012, 38(5), 948–963. [Google Scholar] [CrossRef]
- Achabou, Mohamed Akli; Dekhili, Sihem. Luxury and sustainable development: Is there a match? J. Bus. Res. 2013, 66(10), 1896–1903. [Google Scholar] [CrossRef]
- Kam‐Sing Wong, Stanley. The influence of green product competitiveness on the success of green product innovation: Empirical evidence from the Chinese electrical and electronics industry. Eur. J. Innov. Manag. 2012, 15(4), 468–490.
- Schmuck, Desirée; Matthes, Jörg; Naderer, Brigitte. Misleading consumers with green advertising? An affect–reason–involvement account of greenwashing effects in environmental advertising. J. Advert. 2018, 47(2), 127–145. [Google Scholar] [CrossRef]
- Kim, Sora; Ferguson, Mary T. Public expectations of CSR communication: What and how to communicate CSR. Public Relat. J. 2014, 8(3), 1–22. [Google Scholar]
- Sung, Yongjun; Kim, Jooyoung. Effects of brand personality on brand trust and brand affect. Psychol. Mark. 2010, 27(7), 639–661. [Google Scholar] [CrossRef]
- Morgan, Robert M; Hunt, Shelby D. The commitment-trust theory of relationship marketing. J. Mark. 1994, 58(3), 20–38. [Google Scholar] [CrossRef]
- Sirdeshmukh, Deepak; Singh, Jagdip; Sabol, Barry. Consumer trust, value, and loyalty in relational exchanges. J. Mark. 2002, 66(1), 15–37. [Google Scholar] [CrossRef]
- Bernarto, Innocentius; Berlianto, Margaretha Pink; Meilani, Yohana F Cahya Palupi; Masman, Ronnie Resdianto; Suryawan, Ian Nurpatria. The influence of brand awareness, brand image, and brand trust on brand loyalty. J. Manaj. 2020, 24(3), 412–426. [Google Scholar] [CrossRef]
- Bianchi, Enrique; Bruno, Juan Manuel; Sarabia-Sanchez, Francisco J. The impact of perceived CSR on corporate reputation and purchase intention. Eur. J. Manag. Bus. Econ. 2019, 28(3), 206–221. [Google Scholar] [CrossRef]
- Ajzen, Icek. Constructing a TPB questionnaire: Conceptual and methodological considerations. 2002. [Google Scholar]
- Bennett, Roger; Vijaygopal, Rohini. Consumer attitudes towards electric vehicles: Effects of product user stereotypes and self-image congruence. Eur. J. Mark. 2018, 52(3/4), 499–527. [Google Scholar]
- Shih, Ya-Yueh; Fang, Kwoting. The use of a decomposed theory of planned behavior to study Internet banking in Taiwan. Internet Res. 2004, 14(3), 213–223. [Google Scholar] [CrossRef]
- Han, Heesup; Hwang, Jinsoo; Lee, Myong Jae. The value–belief–emotion–norm model: Investigating customers’ eco-friendly behavior. J. Travel Tour. Mark. 2017, 34(5), 590–607. [Google Scholar] [CrossRef]
- Barbarossa, Camilla; Beckmann, Suzanne C.; De Pelsmacker, Patrick; Moons, Ingrid; Gwozdz, Wencke. A self-identity based model of electric car adoption intention: A cross-cultural comparative study. J. Environ. Psychol. 2015, 42, 149–160. [Google Scholar] [CrossRef]
- He, Xiuhong; Zhan, Wenjie; Hu, Yingying. Consumer purchase intention of electric vehicles in China: The roles of perception and personality. J. Clean. Prod. 2018, 204, 1060–1069. [Google Scholar] [CrossRef]
- Goodman, Joseph K; Cryder, Cynthia E; Cheema, Amar. Data collection in a flat world: The strengths and weaknesses of Mechanical Turk samples. J. Behav. Decis. Mak. 2013, 26(3), 213–224. [Google Scholar] [CrossRef]
- Preacher, Kristopher J; Rucker, Derek D; MacCallum, Robert C; Nicewander, W Alan. Use of the extreme groups approach: a critical reexamination and new recommendations. Psychol. Methods 2005, 10(2), 178. [Google Scholar] [CrossRef]
- Cortina, Jose M; Sheng, Zitong; Keener, Sheila K; Keeler, Kathleen R; Grubb, Leah K; Schmitt, Neal; Tonidandel, Scott; Summerville, Karoline M; Heggestad, Eric D; Banks, George C. From alpha to omega and beyond! A look at the past, present, and (possible) future of psychometric soundness in the Journal of Applied Psychology. J. Appl. Psychol. 2020, 105(12), 1351. [Google Scholar] [CrossRef]
- Kaiser, Henry F. An index of factorial simplicity. psychometrika 1974, 39(1), 31–36. [Google Scholar] [CrossRef]
- Hu, Li-tze; Bentler, Peter M. Cutoff criteria for fit indexes in covariance structure analysis: Conventional criteria versus new alternatives. Struct. Equ. Model. A Multidiscip. J. 1999, 6(1), 1–55. [Google Scholar] [CrossRef]
- Nunnally, Jum C. Psychometric theory—25 years ago and now. Educ. Res. 1975, 4(10), 7–21. [Google Scholar] [CrossRef]
- Field, Andy. Discovering statistics using IBM SPSS statistics; Sage publications limited, 2024. [Google Scholar]
- Fornell, Claes; Larcker, David F. Evaluating structural equation models with unobservable variables and measurement error. J. Mark. Res. 1981, 18(1), 39–50. [Google Scholar] [CrossRef]
- Kline, Rex B. Principles and practice of structural equation modeling; Guilford publications, 2023. [Google Scholar]
- Bian, Xiangyu; Panyagometh, Aweewan. The influence of perceived ESG and policy incentives on consumers’ intention to purchase new energy vehicles: Empirical evidence from China. Innov. Mark. 2023, 19(4), 187–198. [Google Scholar] [CrossRef]
- Rena, Ying; Leeb, Eon-Seong; Dingc, Jiangmin. "ESG as a Market Signal in the New Energy Vehicle Era: Effects on Consumers’ Green Perceived Value and Purchase Intention. 무역연구 2025, 21(5), 131–147. [Google Scholar] [CrossRef]
- Connelly, Brian L; Certo, S Trevis; Ireland, R Duane; Reutzel, Christopher R. Signaling theory: A review and assessment. J. Manag. 2011, 37(1), 39–67. [Google Scholar] [CrossRef]
- Ganz, Benjamin; Grimes, Anthony. How claim specificity can improve claim credibility in Green Advertising: Measures that can boost outcomes from environmental product claims. J. Advert. Res. 2018, 58(4), 476–486. [Google Scholar]
- Yu, Jiahong; Sun, Xixiang; Huang, Ying; Jia, Yige. "Concrete or Abstract? The Impact of Green Advertising Appeals and Information Framing on Consumer Responses. J. Theor. Appl. Electron. Commer. Res. 2025, 20(2), 130. [Google Scholar] [CrossRef]
- Du, S.; Bhattacharya, C. B.; Sen, S. Maximizing business returns to corporate social responsibility (CSR): The role of CSR communication. Int. J. Manag. Rev. 2010, 12(1), 8–19. [Google Scholar] [CrossRef]
- Kim, Seung-wook. Study on Developing the Information System for ESG Disclosure Management. J. Ventur. Innov. 2024, 7(1), 77–90. [Google Scholar] [CrossRef]
- Morgan, R.M. The commitment-trust theory of relationship marketing. J. Mark. 1994. [Google Scholar] [CrossRef]
Appendix
Appendix I Questionnaire design of Study 1
Questionnaire A (Control Group):
Study on the Impact of ESG message strategy in NEV Advertisements on Purchase Intentions
Dear Respondent:
Hello! We are conducting a survey on new energy vehicles to understand your attitudes and perceptions toward related advertisements. Your honest feedback will help us better comprehend consumer needs and provide valuable insights for future advertising design.
Instructions:
--------------------------------------------------------------------------------------------------------------
- This questionnaire takes approximately 10 MINUTES to complete. Please answer based on your genuine feelings;
--------------------------------------------------------------------------------------------------------------
2. The survey is ANONYMOUS. All data will be used solely for ACADEMIC RESEARCH. Please feel free to complete it with confidence.
3. There are NO RIGHT OR WRONG answers, and we are solely interested in your genuine thoughts;
Thank you again for your participation and support
--------------------------------------------------------------------------------------------------------------
For this study, we are using a FICTIONAL new energy vehicle (NEV) brand as our research subject.
Below is a brief introduction to this virtual brand. Please read carefully:
This brand is a manufacturer of NEV, offering a variety of models including sedans and SUVs.
Next, you will see an advertisement for one of the brand’s NEV. Please read it carefully and answer the questions based on your genuine feelings.
Advertisement:
600km Range. 5-Min Charge. Your New Family Powerhouse is Here.
Stop settling for ordinary family cars. Meet the SUV that brings “Thrill” to every mile.
--------------------------------------------------------------------------------------------------------------
- Zero Anxiety: 600km range + 5mins of charging for a 100km boost. Long trips just got shorter.
- Smart Spaces: A massive 15.6 floating display meets immersive audio. It’s not just a car; it’s your mobile cinema.
- Precision Design: Aerodynamic, lightweight, and incredibly smooth. Drive the future of performance.
--------------------------------------------------------------------------------------------------------------
Own the future starting at 300,000 RMB, and be the first to drive the change.
--------------------------------------------------------------------------------------------------------------
Attention detection:
- What’s the price of this NEV?
-
300,000 RMB
- 29,000 RMB
- 6,000 RMB
- I don’t know
Part I. NEV Information
-
Have you or your family ever purchased a new energy vehicle?
- Yes
- No
-
Do you or your household currently own a new energy vehicle?
- Yes
- No
-
Are you familiar with new energy vehicles?
- 3.
- Not at all familiar — I do not know what NEV is.
- 4.
- Slightly familiar — I know what NEV is, but am unfamiliar with their specific types and features.
- 5.
- Moderately familiar — I know the main types and some brands, and have basic usage knowledge.
- 6.
- Very familiar — I am familiar with various NEV types, their performance characteristics, and market landscape.
- 7.
- Extremely familiar — I have professional knowledge or work experience, and can analyze NEV technologies, supply chains, and regulations in depth.
-
Have you recently paid attention to advertisements for new energy vehicles?
- Not at all
- Rarely pay attention
- Occasionally
- Frequently
- Very frequently
-
Do you or your household plan to purchase or repurchase a new energy vehicle in the near future (within the next year)?
- 8.
- Yes
- 9.
- No
- 10.
- Unsure
Part II. Variables measurement
Please use the scale below to rate your agreement with the following statements (Rating scale: 1 = Strongly disagree, 2 = Disagree, 3 = Neutral, 4 = Agree, 5 = Strongly agree)
| Brand Trust | Strongly disagree | Disagree | Neutral | Agree | Strongly Agree |
| I trust this brand. | 1 | 2 | 3 | 4 | 5 |
| I believe this brand is safe. | 1 | 2 | 3 | 4 | 5 |
| I’m concerned about the quality of this brand. | 1 | 2 | 3 | 4 | 5 |
| I believe this brand is honest with its customers. | 1 | 2 | 3 | 4 | 5 |
| I trust this brand’s customer service. | 1 | 2 | 3 | 4 | 5 |
| Brand Image | |||||
| I feel this brand has a highly reputable image. | 1 | 2 | 3 | 4 | 5 |
| I feel this brand has a distinct personality. | 1 | 2 | 3 | 4 | 5 |
| I believe this brand has an eco-friendly image. | 1 | 2 | 3 | 4 | 5 |
| I have a favorable impression of this brand. | 1 | 2 | 3 | 4 | 5 |
| I find this brand to be highly appealing. | 1 | 2 | 3 | 4 | 5 |
| Consumer Attitudes | |||||
| I find this brand’s NEV appealing. | 1 | 2 | 3 | 4 | 5 |
| I do not support this brand’s NEV. | 1 | 2 | 3 | 4 | 5 |
| I am very satisfied with this brand’s NEV. | 1 | 2 | 3 | 4 | 5 |
| I think using this brand’s NEV is a good choice. | 1 | 2 | 3 | 4 | 5 |
| I like using this brand’s NEV. | 1 | 2 | 3 | 4 | 5 |
| Purchase Intention | |||||
| I intend to purchase and use this NEV. | 1 | 2 | 3 | 4 | 5 |
| I am willing to purchase and use this NEV. | 1 | 2 | 3 | 4 | 5 |
| I expect to drive this NEV in the near future | 1 | 2 | 3 | 4 | 5 |
| I am interested in recommending this NEV to friends/family. | 1 | 2 | 3 | 4 | 5 |
| When I buy my next car, I will consider purchasing this NEV. | 1 | 2 | 3 | 4 | 5 |
Part III. Demographic Information
- 6.
-
What is your age?
- 18-25
- 26-35
- 36-45
- 46-55
- 56 years old and above
- 7.
-
What is your gender?
- Male
- Female
- 8.
-
What is your educational background?
- 11.
- Elementary school or below
- 12.
- Junior high school
- 13.
- High school/vocational school/technical school
- 14.
- Junior college/vocational college
- 15.
- Bachelor’s degree
- 16.
- Master’s Degree
- 17.
- Doctoral Degree and Above
- 18.
- Other (please specify)
- 9.
-
What is your family annual income?
- Under 100,000 RMB
- 100,000–200,000 RMB
- 200,000–300,000 RMB
- 300,000–500,000 RMB
- 500,000–800,000 RMB
- 800,000–1,000,000 RMB
- Over 1,000,000 RMB
- Prefer not to disclose
Thank you for taking the time to complete this survey. Your responses will be kept strictly CONFIDENTIAL and used solely for RESEARCH purposes. Your insights hold significant value for our research on NEV and will help us gain deeper understanding in this field. We sincerely appreciate your thoughtful participation and valuable feedback. Thank you once again for your support and assistance.
Appendix II Questionnaire design of Study 2
Study on the Impact of ESG message strategy in NEV Advertisements on Purchase Intentions
Dear Respondent:
Hello! We are conducting a survey on new energy vehicles to understand your attitudes and perceptions toward related advertisements. Your honest feedback will help us better comprehend consumer needs and provide valuable insights for future advertising design.
Instructions:
--------------------------------------------------------------------------------------------------------------
This questionnaire takes approximately 10 MINUTES to complete. Please answer based on your genuine feelings;
--------------------------------------------------------------------------------------------------------------
2. The survey is ANONYMOUS. All data will be used solely for ACADEMIC RESEARCH. Please feel free to complete it with confidence.
3. There are NO RIGHT OR WRONG answers, and we are solely interested in your genuine thoughts;
Thank you again for your participation and support.
--------------------------------------------------------------------------------------------------------------
For this study, we are using a FICTIONAL NEV brand as our research subject.
Below is a brief introduction to this virtual brand. Please read carefully:
Positioned in the INTERNATIONAL PREMIUM market, this brand primarily manufactures LUXURY NEVs. Its product lineup includes sedans, SUVs, and other models targeting HIGH-END consumers, comparable to international luxury brands in the same segment.
Next, you will see an advertisement for one of the brand’s NEV. Please read it carefully and answer the questions based on your genuine feelings.
Advertisement:
Redefining Luxury Through Responsibility.
Experience the pinnacle of sustainable performance.
- Pure Electric Precision: 600 km certified range deliverers environmental promise. Zero-emission manufacturing validated across our entire production chain.
- Breathe Pure Luxury: Medical-grade HEPA filtration captures 99.9% of PM2.5 particles. Interiors crafted from biodegradable, zero-formaldehyde materials. No compromise on health or elegance.
- Built to Protect: Xuanwu ultra-high-strength body structure achieves global top-tier safety certification. Testing standards backed by our 5-year comprehensive warranty and lifetime battery health monitoring.
- Full Transparency: From raw material sourcing to final assembly, every component is traceable. Third-party verified. Carbon footprint disclosed. Data is our standard.
- VIP Concierge Service: Dedicated support redefines what luxury ownership means
From 598,000 RMB. Drive the future you believe in.
--------------------------------------------------------------------------------------------------------------
Attention detection:
-
What’s the price of this NEV?A. 300,000 RMB
- 29,000 RMB
- 598,000 RMB
- I don’t know
Part I. NEV Information
- 19.
-
Have you or your family ever purchased a new energy vehicle?
- Yes
- No
- 20.
-
Do you or your household currently own a new energy vehicle?
- Yes
- No
- 21.
- Are you familiar with new energy vehicles?
- 4.
- Not at all familiar — I do not know what NEV is.
- 5.
- Slightly familiar — I know what NEV is, but am unfamiliar with their specific types and features.
- 6.
- Moderately familiar — I know the main types and some brands, and have basic usage knowledge.
- 7.
- Very familiar — I am familiar with various NEV types, their performance characteristics, and market landscape.
- 8.
- Extremely familiar — I have professional knowledge or work experience, and can analyze NEV technologies, supply chains, and regulations in depth.
- 22.
- Have you recently paid attention to advertisements for new energy vehicles?
Not at all
Rarely pay attention
Occasionally
Frequently
Very frequently
- 23.
- Do you or your household plan to purchase or repurchase a new energy vehicle in the near future (within the next year)?
- 158.
- Yes
- 159.
- No
- 160.
- Unsure
Part II. Variables measurement
Please use the scale below to rate your agreement with the following statements (Rating scale: 1 = Strongly disagree, 2 = Disagree, 3 = Neutral, 4 = Agree, 5 = Strongly agree)
| Brand Trust | Strongly disagree | Disagree | Neutral | Agree | Strongly Agree |
| I trust this brand. | 1 | 2 | 3 | 4 | 5 |
| I believe this brand is safe. | 1 | 2 | 3 | 4 | 5 |
| I’m concerned about the quality of this brand. | 1 | 2 | 3 | 4 | 5 |
| I believe this brand is honest with its customers. | 1 | 2 | 3 | 4 | 5 |
| I trust this brand’s customer service. | 1 | 2 | 3 | 4 | 5 |
| Brand Image | |||||
| I feel this brand has a highly reputable image. | 1 | 2 | 3 | 4 | 5 |
| I feel this brand has a distinct personality. | 1 | 2 | 3 | 4 | 5 |
| I believe this brand has an eco-friendly image. | 1 | 2 | 3 | 4 | 5 |
| I have a favorable impression of this brand. | 1 | 2 | 3 | 4 | 5 |
| I find this brand to be highly appealing. | 1 | 2 | 3 | 4 | 5 |
| Consumer Attitude | |||||
| I find this brand’s NEV appealing. | 1 | 2 | 3 | 4 | 5 |
| I do not support this brand’s NEV. | 1 | 2 | 3 | 4 | 5 |
| I am very satisfied with this brand’s NEV. | 1 | 2 | 3 | 4 | 5 |
| I think using this brand’s NEV is a good choice. | 1 | 2 | 3 | 4 | 5 |
| I like using this brand’s NEV. | 1 | 2 | 3 | 4 | 5 |
| Purchase Intention | |||||
| I intend to purchase and use this NEV. | 1 | 2 | 3 | 4 | 5 |
| I am willing to purchase and use this NEV. | 1 | 2 | 3 | 4 | 5 |
| I expect to drive this NEV in the near future | 1 | 2 | 3 | 4 | 5 |
| I am interested in recommending this NEV to friends/family. | 1 | 2 | 3 | 4 | 5 |
| When I buy my next car, I will consider purchasing this NEV. | 1 | 2 | 3 | 4 | 5 |
Part III. Demographic Information
- 1.
- What is your age?
- 1.
- 18-25
- 2.
- 26-35
- 3.
- 36-45
- 4.
- 46-55
- 5.
- 56 years old and above
- 6.
- What is your gender?
- 1.
- Male
- 2.
- Female
- 3.
- What is your educational background?
- 1.
- Elementary school or below
- 2.
- Junior high school
- 3.
- High school/vocational school/technical school
- 4.
- Junior college/vocational college
- 5.
- Bachelor’s degree
- 6.
- Master’s Degree
- 7.
- Doctoral Degree and Above
- 8.
- Other (please specify)
- 9.
- What is your family annual income?
- 1.
- Under 100,000 RMB
- 2.
- 100,000–200,000 RMB
- 3.
- 200,000–300,000 RMB
- 4.
- 300,000–500,000 RMB
- 5.
- 500,000–800,000 RMB
- 6.
- 800,000–1,000,000 RMB
- 7.
- Over 1,000,000 RMB
- 8.
- Prefer not to disclose
Thank you for taking the time to complete this survey. Your responses will be kept strictly CONFIDENTIAL and used solely for RESEARCH purposes. Your insights hold significant value for our research on NEV and will help us gain deeper understanding in this field. We sincerely appreciate your thoughtful participation and valuable feedback. Thank you once again for your support and assistance.
Figure 2.
CFA measurement model.
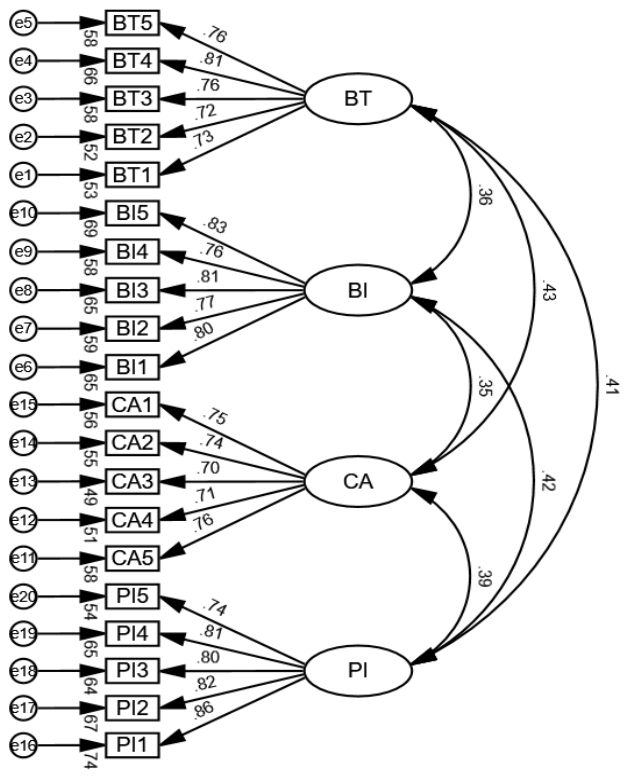
Figure 3.
Second-order factor model.
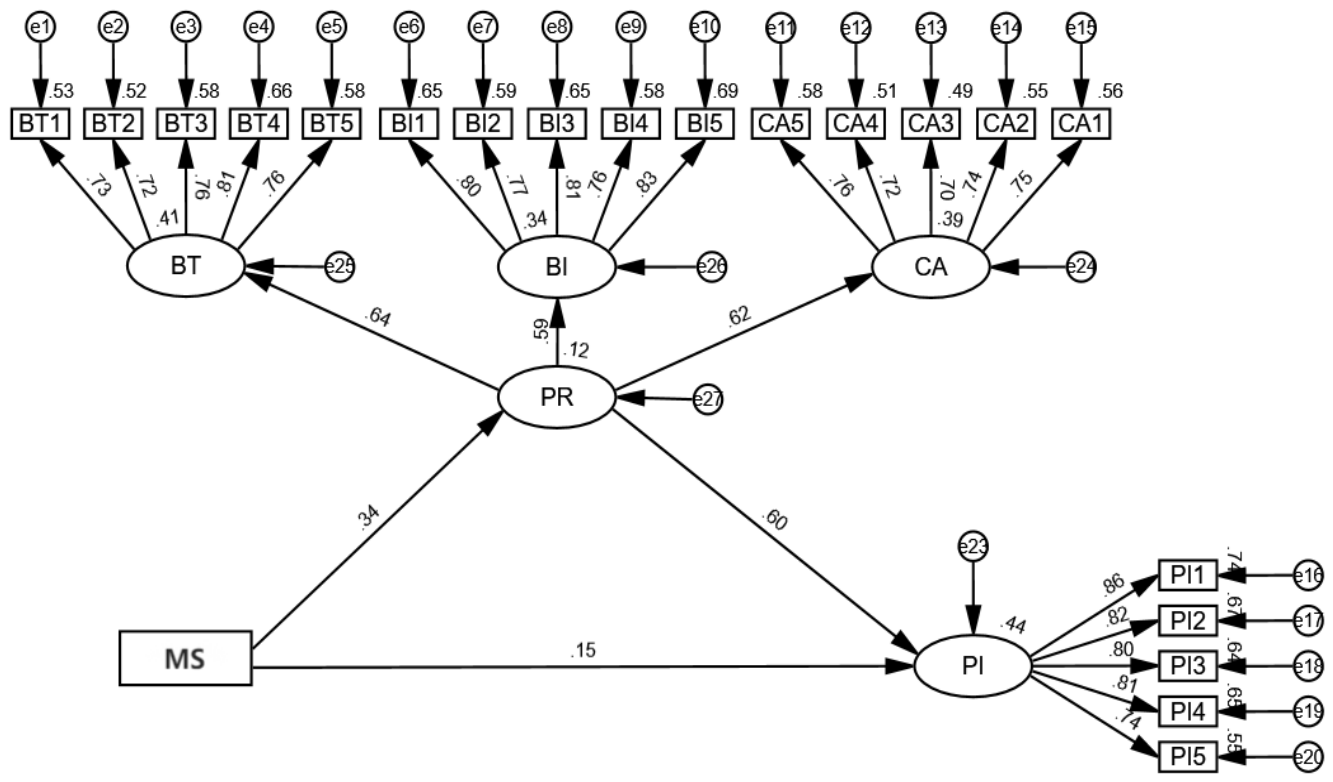
Figure 4.
First-order factor model.
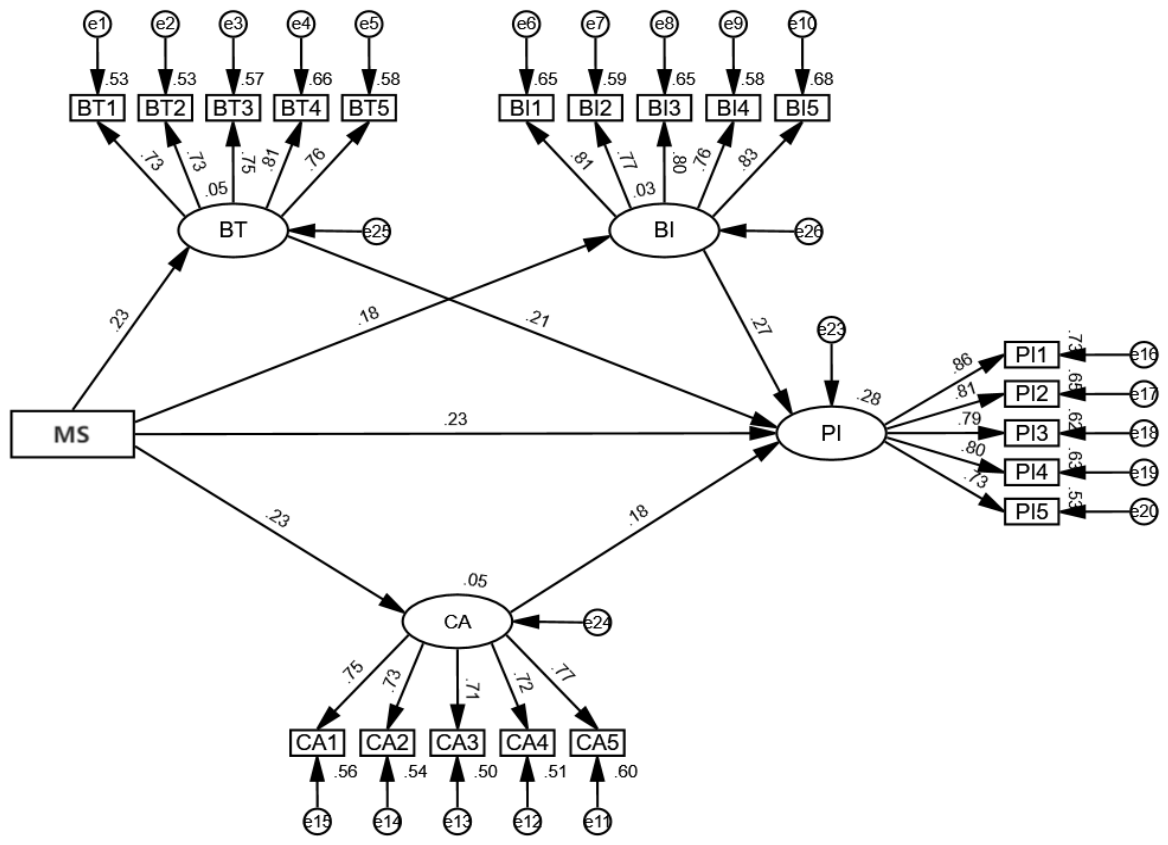

Table 1.
Independent-samples t-tests of pretest A.
| Item | Group 2 M(SD) |
Group 1 M(SD) |
t | p | Cohen’s d |
| Q1. Environmental protection actions | 1.70(1.24) | 4.33(1.21) | -8.329 | <.001 | 2.15 |
| Q2. Social contributions | 1.77(1.28) | 4.27(1.14) | -7.987 | <.001 | 2.06 |
| Q3. Governance and ethical standards | 1.77(1.25) | 4.10(1.35) | -6.950 | <.001 | 1.79 |
| Q4. Overall ESG/sustainability information | 1.87(1.38) | 4.33(1.06) | -7.750 | <.001 | 2.00 |
| Q5. Exclusive functional emphasis | 0.47(0.90) | 3.10(2.01) | -6.561 | <.001 | 1.69 |
| Composite Score | 11.67(4.54) | 19.40(3.92) | -7.067 | <.001 | 1.83 |
Table 2.
Independent-samples t-tests of pretest B.
| Item | Group 1 M(SD) | Group 2 M(SD) | t | p | Cohen’s d |
| Q1. Specific ESG descriptions | 4.15(0.91) | 2.15(1.12) | 7.134 | 0.000*** | 1.960 |
| Q2. Clear data support | 4.33(0.92) | 1.92(1.09) | 8.700 | 0.000*** | 2.391 |
| Q6. Fact-based nature | 4.22(0.85) | 2.00(1.02) | 8.642 | 0.000*** | 2.375 |
| Perceived Directness | 4.23(0.89) | 2.02(1.08) | 8.173 | 0.000*** | 2.239 |
| Q3. Inference required | 1.96(1.02) | 4.50(0.76) | -10.240 | 0.000*** | 2.814 |
| Q4. Emotional resonance | 1.96(1.02) | 4.62(0.70) | -11.099 | 0.000*** | 3.029 |
| Q5. Vision and values | 1.78(1.12) | 4.62(0.75) | -10.857 | 0.000*** | 2.962 |
| Perceived Indirectness | 1.90(1.05) | 4.58(0.74) | -10.701 | 0.000*** | 2.943 |
***p<0.001.
Table 3.
Brand trust measurement scale.
| Variable | Question | Source |
| Brand Trust | I trust this brand. This brand is safe. I trust on the quality of this brand. This brand is honest with its customers. This brand makes me feel a sense of security. |
Sung and Kim [130] Morgan [131] Sirdeshmukh, Singh, and Sabol [132] |
Table 4.
Brand image measurement scale.
| Variable | Question | Source |
| Brand Image | I feel this brand has a prestigious image. I feel this brand has a strong personality. I feel this brand has a green image. I have a favorable impression of this brand. I feel this brand is a very attractive brand. |
Bernarto et al. [133] Bianchi, Bruno, and Sarabia-Sanchez [134] |
Table 5.
Consumer attitude measurement scale.
| Variable | Question | Source |
| Consumer Attitude | I believe that electric cars are beneficial and attractive. My attitude towards electric cars is favourable. I feel using electric cars is a wise idea. I feel using electric cars is a good idea. I like to use electric cars. |
Ajzen [135] Bennett and Vijaygopal [136] Shih and Fang [137] |
Table 6.
Purchase intention measurement scale.
| Variable | Question | Source |
| Purchase Intention | I intend to buy and use this electric car. I am willing to buy and use this electric car. I expect to drive an electric car in the near future. I have the intention to drive an electric car in the near future. Next time I buy a car, I will consider buying an electric car. |
Han, Hwang, and Lee [138] Barbarossa et al. [139]; He, Zhan, and Hu [140] |
Table 7.
KMO and Bartlett’s test.
| Variable | KMO | Bartlett’s Test of Sphericity | ||
| Approx. Chi-Square | df | Sig. | ||
| BT | 0.867 | 895.989 | 10 | <.001 |
| BI | 0.877 | 1105.951 | 10 | <.001 |
| CA | 0.863 | 786.667 | 10 | <.001 |
| PI | 0.886 | 1181.454 | 10 | <.001 |
Table 8.
Model fit indices.
| Fit Index | CMIN/DF | GFI | NFI | IFI | TLI | CFI | RMSEA |
| Value | 1.936 | 0.923 | 0.929 | 0.964 | 0.959 | 0.964 | 0.048 |
| Threshold | <5 | >0.90 | >0.90 | >0.90 | >0.90 | >0.90 | <0.08 |
Table 9.
Reliability analysis.
| Variable | Item | CITC | Cronbach’s α if item deleted | Cronbach’s α |
| BT | BT1 | 0.674 | 0.847 | 0.869 |
| BT2 | 0.671 | 0.847 | ||
| BT3 | 0.686 | 0.844 | ||
| BT4 | 0.738 | 0.831 | ||
| BT5 | 0.702 | 0.84 | ||
| BI | BI1 | 0.754 | 0.869 | 0.895 |
| BI2 | 0.723 | 0.876 | ||
| BI3 | 0.744 | 0.871 | ||
| BI4 | 0.719 | 0.877 | ||
| BI5 | 0.767 | 0.866 | ||
| CA | CA1 | 0.678 | 0.82 | 0.854 |
| CA2 | 0.666 | 0.824 | ||
| CA3 | 0.641 | 0.83 | ||
| CA4 | 0.651 | 0.827 | ||
| CA5 | 0.696 | 0.816 | ||
| PI | PI1 | 0.8 | 0.871 | 0.902 |
| PI2 | 0.775 | 0.876 | ||
| PI3 | 0.748 | 0.882 | ||
| PI4 | 0.759 | 0.88 | ||
| PI5 | 0.697 | 0.893 |
Table 10.
Convergent validity.
| Variable | Item | Unstd | S.E. | C.R. | P | Std | AVE | CR |
| BT | BT1 | 1 | 0.73 | 0.573 | 0.87 | |||
| BT2 | 0.958 | 0.071 | 13.58 | *** | 0.721 | |||
| BT3 | 1.008 | 0.07 | 14.309 | *** | 0.76 | |||
| BT4 | 1.063 | 0.07 | 15.169 | *** | 0.809 | |||
| BT5 | 1.058 | 0.074 | 14.305 | *** | 0.76 | |||
| BI | BI1 | 1 | 0.804 | 0.629 | 0.895 | |||
| BI2 | 0.898 | 0.054 | 16.492 | *** | 0.766 | |||
| BI3 | 0.986 | 0.056 | 17.589 | *** | 0.806 | |||
| BI4 | 0.911 | 0.056 | 16.332 | *** | 0.76 | |||
| BI5 | 1.021 | 0.056 | 18.24 | *** | 0.83 | |||
| CA | CA1 | 1 | 0.751 | 0.54 | 0.854 | |||
| CA2 | 1.061 | 0.075 | 14.086 | *** | 0.743 | |||
| CA3 | 0.926 | 0.07 | 13.276 | *** | 0.7 | |||
| CA4 | 0.997 | 0.074 | 13.56 | *** | 0.715 | |||
| CA5 | 0.992 | 0.069 | 14.465 | *** | 0.763 | |||
| PI | PI1 | 1 | 0.863 | 0.649 | 0.902 | |||
| PI2 | 0.893 | 0.045 | 19.941 | *** | 0.816 | |||
| PI3 | 0.899 | 0.047 | 19.283 | *** | 0.799 | |||
| PI4 | 0.891 | 0.045 | 19.612 | *** | 0.808 | |||
| PI5 | 0.8 | 0.047 | 17.09 | *** | 0.738 | |||
| ***p<0.001. |
Table 11.
Correlation and square roots of AVE.
| BT | BI | CA | PI | AVE | Mean | Std.Dev. | |
| BT | 0.757 | 0.573 | 3.716 | 0.784 | |||
| BI | 0.312** | 0.793 | 0.629 | 3.602 | 0.869 | ||
| CA | 0.371** | 0.308** | 0.735 | 0.540 | 3.716 | 0.781 | |
| PI | 0.361** | 0.367** | 0.338** | 0.806 | 0.649 | 3.614 | 0.926 |
**p<0.01. The diagonal elements represent the square roots of the AVE values.
Table 12.
Descriptive statistics (N=204).
| Feature | Options | Count | % |
| Have you or your family ever purchased a NEV? | Yes | 195 | 95.59 |
| No | 9 | 4.41 | |
| Do you or your family currently own an NEV? | Yes | 186 | 91.17 |
| No | 18 | 8.82 | |
| Are you familiar with NEV? | Slightly Aware | 25 | 12.25 |
| Moderately Aware | 75 | 36.76 | |
| Quite Aware | 64 | 31.37 | |
| Extremely Aware | 40 | 19.61 | |
| Have you recently paid attention to NEV advertising? | Rarely | 20 | 12.25 |
| Occasionally | 62 | 30.00 | |
| Frequently | 77 | 41.75 | |
| Very Frequently | 45 | 16.00 | |
| Do you or your family plan to purchase or repurchase an NEV in the next year? | Yes | 204 | 100 |
| No | 0 | 0 | |
| Unsure | 0 | 0 | |
| Age | 18-25 | 41 | 20.10 |
| 26-35 | 58 | 28.43 | |
| 36-45 | 49 | 24.02 | |
| 46-55 | 21 | 10.29 | |
| Over 56 | 35 | 17.16 | |
| Gender | Male | 69 | 33.82 |
| Female | 135 | 66.18 | |
| Educational Level | Primary and below | 20 | 9.80 |
| Junior High School | 15 | 7.35 | |
| High school | 35 | 17.16 | |
| College/higher vocational | 31 | 15.20 | |
| Bachelor degree | 56 | 27.45 | |
| Master’s degree | 20 | 9.80 | |
| Doctorate degree | 27 | 13.24 | |
| Family Annual Income | Below CNY 100,000 | 27 | 13.24 |
| CNY 100,000 - 200,000 | 50 | 24.51 | |
| CNY 200,000 - 300,000 | 51 | 25.00 | |
| CNY 300,000 - 500,000 | 34 | 16.67 | |
| CNY 500,000 - 800,000 | 27 | 13.24 | |
| CNY 800,000 - 1,000,000 | 15 | 7.35 |
Table 13.
Independent-samples t-test.
| Variable | Mean ± Std. Deviation | Mean Difference (Control - Experimental) |
t | p | |
| Control | Experimental | ||||
| PI | 3.56 ± 1.05 | 4.23 ± 0.63 | -0.67 | -6.756 | 0.000** |
** p<0.01
Table 14.
Descriptive statistics (N=400).
| Feature | Options | Count | % |
| Have you or your family ever purchased a NEV? | Yes | 366 | 91.50 |
| No | 34 | 8.50 | |
| Do you or your family currently own an NEV? | Yes | 375 | 93.75 |
| No | 25 | 6.25 | |
| Are you familiar with NEV? | Slightly Aware | 51 | 12.75 |
| Moderately Aware | 160 | 40.00 | |
| Quite Aware | 123 | 30.75 | |
| Extremely Aware | 66 | 16.50 | |
| Have you recently paid attention to NEV advertising? | Rarely | 49 | 12.25 |
| Occasionally | 120 | 30.00 | |
| Frequently | 167 | 41.75 | |
| Very Frequently | 64 | 16.00 | |
| Do you or your family plan to purchase or repurchase an NEV in the next year? | Yes | 400 | 100 |
| No | 0 | 0 | |
| Unsure | 0 | 0 | |
| Age | 18-25 | 86 | 21.50 |
| 26-35 | 136 | 34.00 | |
| 36-45 | 77 | 19.25 | |
| 46-55 | 64 | 16.00 | |
| Over 56 | 37 | 9.25 | |
| Gender | Male | 196 | 49.00 |
| Female | 204 | 51.00 | |
| Educational Level | Primary and below | 12 | 3.00 |
| Junior High School | 39 | 9.75 | |
| High school | 60 | 15.00 | |
| College/higher vocational | 103 | 25.75 | |
| Bachelor degree | 135 | 33.75 | |
| Master’s degree | 44 | 11.00 | |
| Doctorate degree | 7 | 1.75 | |
| Family Annual Income | Below CNY 100,000 | 72 | 18.00 |
| CNY 100,000 - 200,000 | 128 | 32.00 | |
| CNY 200,000 - 300,000 | 121 | 30.25 | |
| CNY 300,000 - 500,000 | 41 | 10.25 | |
| CNY 500,000 - 800,000 | 29 | 7.25 | |
| CNY 800,000 - 1,000,000 | 9 | 2.25 |
Table 15.
Independent samples test.
| MS | Mean | Std. Deviation | Std. Error Mean | t | p | 95%CI | |
| PI | Indirect | 3.30 | 0.89 | 0.06 | -7.292 | <.001 | 0.806-0.342 |
| Direct | 3.93 | 0.85 | 0.06 |
Table 16.
SEM path analysis of PR.
| Path | Unstd | S.E. | C.R. | P | Std | Test Results |
| MS→PR | 0.317 | 0.064 | 4.980 | *** | 0.343 | Supported |
| MS→PI | 0.302 | 0.106 | 2.860 | 0.004 | 0.154 | Supported |
| PR→PI | 1.268 | 0.196 | 6.472 | *** | 0.598 | Supported |
***p<0.001.
Table 17.
Bootstrap analysis of PR.
| Path | Estimates | S.E. | Bias-95%CI | Effect proportion | ||
| Lower | Upper | P | ||||
| Indirect | 0.205 | 0.043 | 0.129 | 0.298 | <.001 | 57.1% |
| Direct | 0.154 | 0.055 | 0.042 | 0.258 | 0.008 | 42.9% |
| Total | 0.359 | 0.047 | 0.265 | 0.449 | <.001 | |
Table 18.
SEM path analysis of BT/BI/CA.
| Path | Unstd. | S.E. | C.R. | P | Std | Test Results |
| MS→BT | 0.329 | 0.077 | 4.300 | *** | 0.230 | Supported |
| MS→BI | 0.301 | 0.090 | 3.351 | *** | 0.176 | Supported |
| MS→CA | 0.332 | 0.078 | 4.260 | *** | 0.229 | Supported |
| MS→PI | 0.444 | 0.095 | 4.671 | *** | 0.235 | Supported |
| CA→PI | 0.235 | 0.068 | 3.455 | *** | 0.180 | Supported |
| BI→PI | 0.294 | 0.057 | 5.210 | *** | 0.266 | Supported |
| BT→PI | 0.284 | 0.069 | 4.106 | *** | 0.215 | Supported |
***p<0.001.
Table 19.
Bootstrap analysis of BT/BI/CA.
| Path | Estimates | S.E. | Bias-95%CI | Effect proportion | ||
| Lower | Upper | P | ||||
| MS→BT→PI | 0.049 | 0.017 | 0.022 | 0.093 | <.001 | 13.17% |
| MS→BI→PI | 0.047 | 0.017 | 0.019 | 0.087 | <.001 | 12.63% |
| MS→CA→PI | 0.041 | 0.017 | 0.014 | 0.084 | 0.001 | 11.02% |
| Direct | 0.235 | 0.048 | 0.136 | 0.327 | <.001 | 63.17% |
| Total | 0.372 | 0.048 | 0.276 | 0.462 | <.001 | |
Table 20.
Tests of between-subjects effects.
| Source | Type III Sum of Squares | df | Mean Square | F | Sig. | Partial Eta Squared |
| Corrected Model | 58.551a | 3 | 19.517 | 27.254 | <.001 | 0.171 |
| IntercePI | 5057.799 | 1 | 5057.799 | 7062.964 | <.001 | 0.947 |
| Brand Type | 8.349 | 1 | 8.349 | 11.659 | 0.001 | 0.029 |
| MS | 34.609 | 1 | 34.609 | 48.33 | <.001 | 0.109 |
| Brand Type*MS | 9.879 | 1 | 9.879 | 13.796 | <.001 | 0.034 |
| Error | 283.576 | 396 | 0.716 | |||
| Total | 5565.08 | 400 | ||||
| Corrected Total | 342.127 | 399 |
R²= .171 (Adjusted R²= .165)
Table 21.
Descriptive statistics for PI.
| Brand Type | MS | Mean | Std. Error | 95% Confidence Interval | |
| Lower | Upper | ||||
| Luxury | Indirect | 3.31 | 0.08 | 3.151 | 3.463 |
| Direct | 3.58 | 0.09 | 3.404 | 3.763 | |
| Affordable | Indirect | 3.28 | 0.09 | 3.102 | 3.461 |
| Direct | 4.19 | 0.08 | 4.037 | 4.349 | |
Table 22.
Results of hypothesis testing.
| H | Hypothesized Relationship | Results |
| 1 | MS inclusion → enhanced PI | Supported |
| 2 | Direct MS → stronger PI than indirect MS | Supported |
| 3 | MS → PR → PI (overall mediation) | Supported |
| 3-1 | MS → BT → PI | Supported |
| 3-2 | MS → BI → PI | Supported |
| 3-3 | MS → CA → PI | Supported |
| 4 | Brand type moderates MS → PI | Partially Supported |
| 4-1 | Luxury brand × indirect MS → stronger PI | Not Supported |
| 4-2 | Affordable brand × direct MS → stronger PI | Supported |
Disclaimer/Publisher’s Note: The statements, opinions and data contained in all publications are solely those of the individual author(s) and contributor(s) and not of MDPI and/or the editor(s). MDPI and/or the editor(s) disclaim responsibility for any injury to people or property resulting from any ideas, methods, instructions or products referred to in the content. |
© 2026 by the authors. Licensee MDPI, Basel, Switzerland. This article is an open access article distributed under the terms and conditions of the Creative Commons Attribution (CC BY) license (http://creativecommons.org/licenses/by/4.0/).
Copyright: This open access article is published under a Creative Commons CC BY 4.0 license, which permit the free download, distribution, and reuse, provided that the author and preprint are cited in any reuse.