
Submitted:
21 August 2026
Posted:
24 August 2026
You are already at the latest version
Abstract
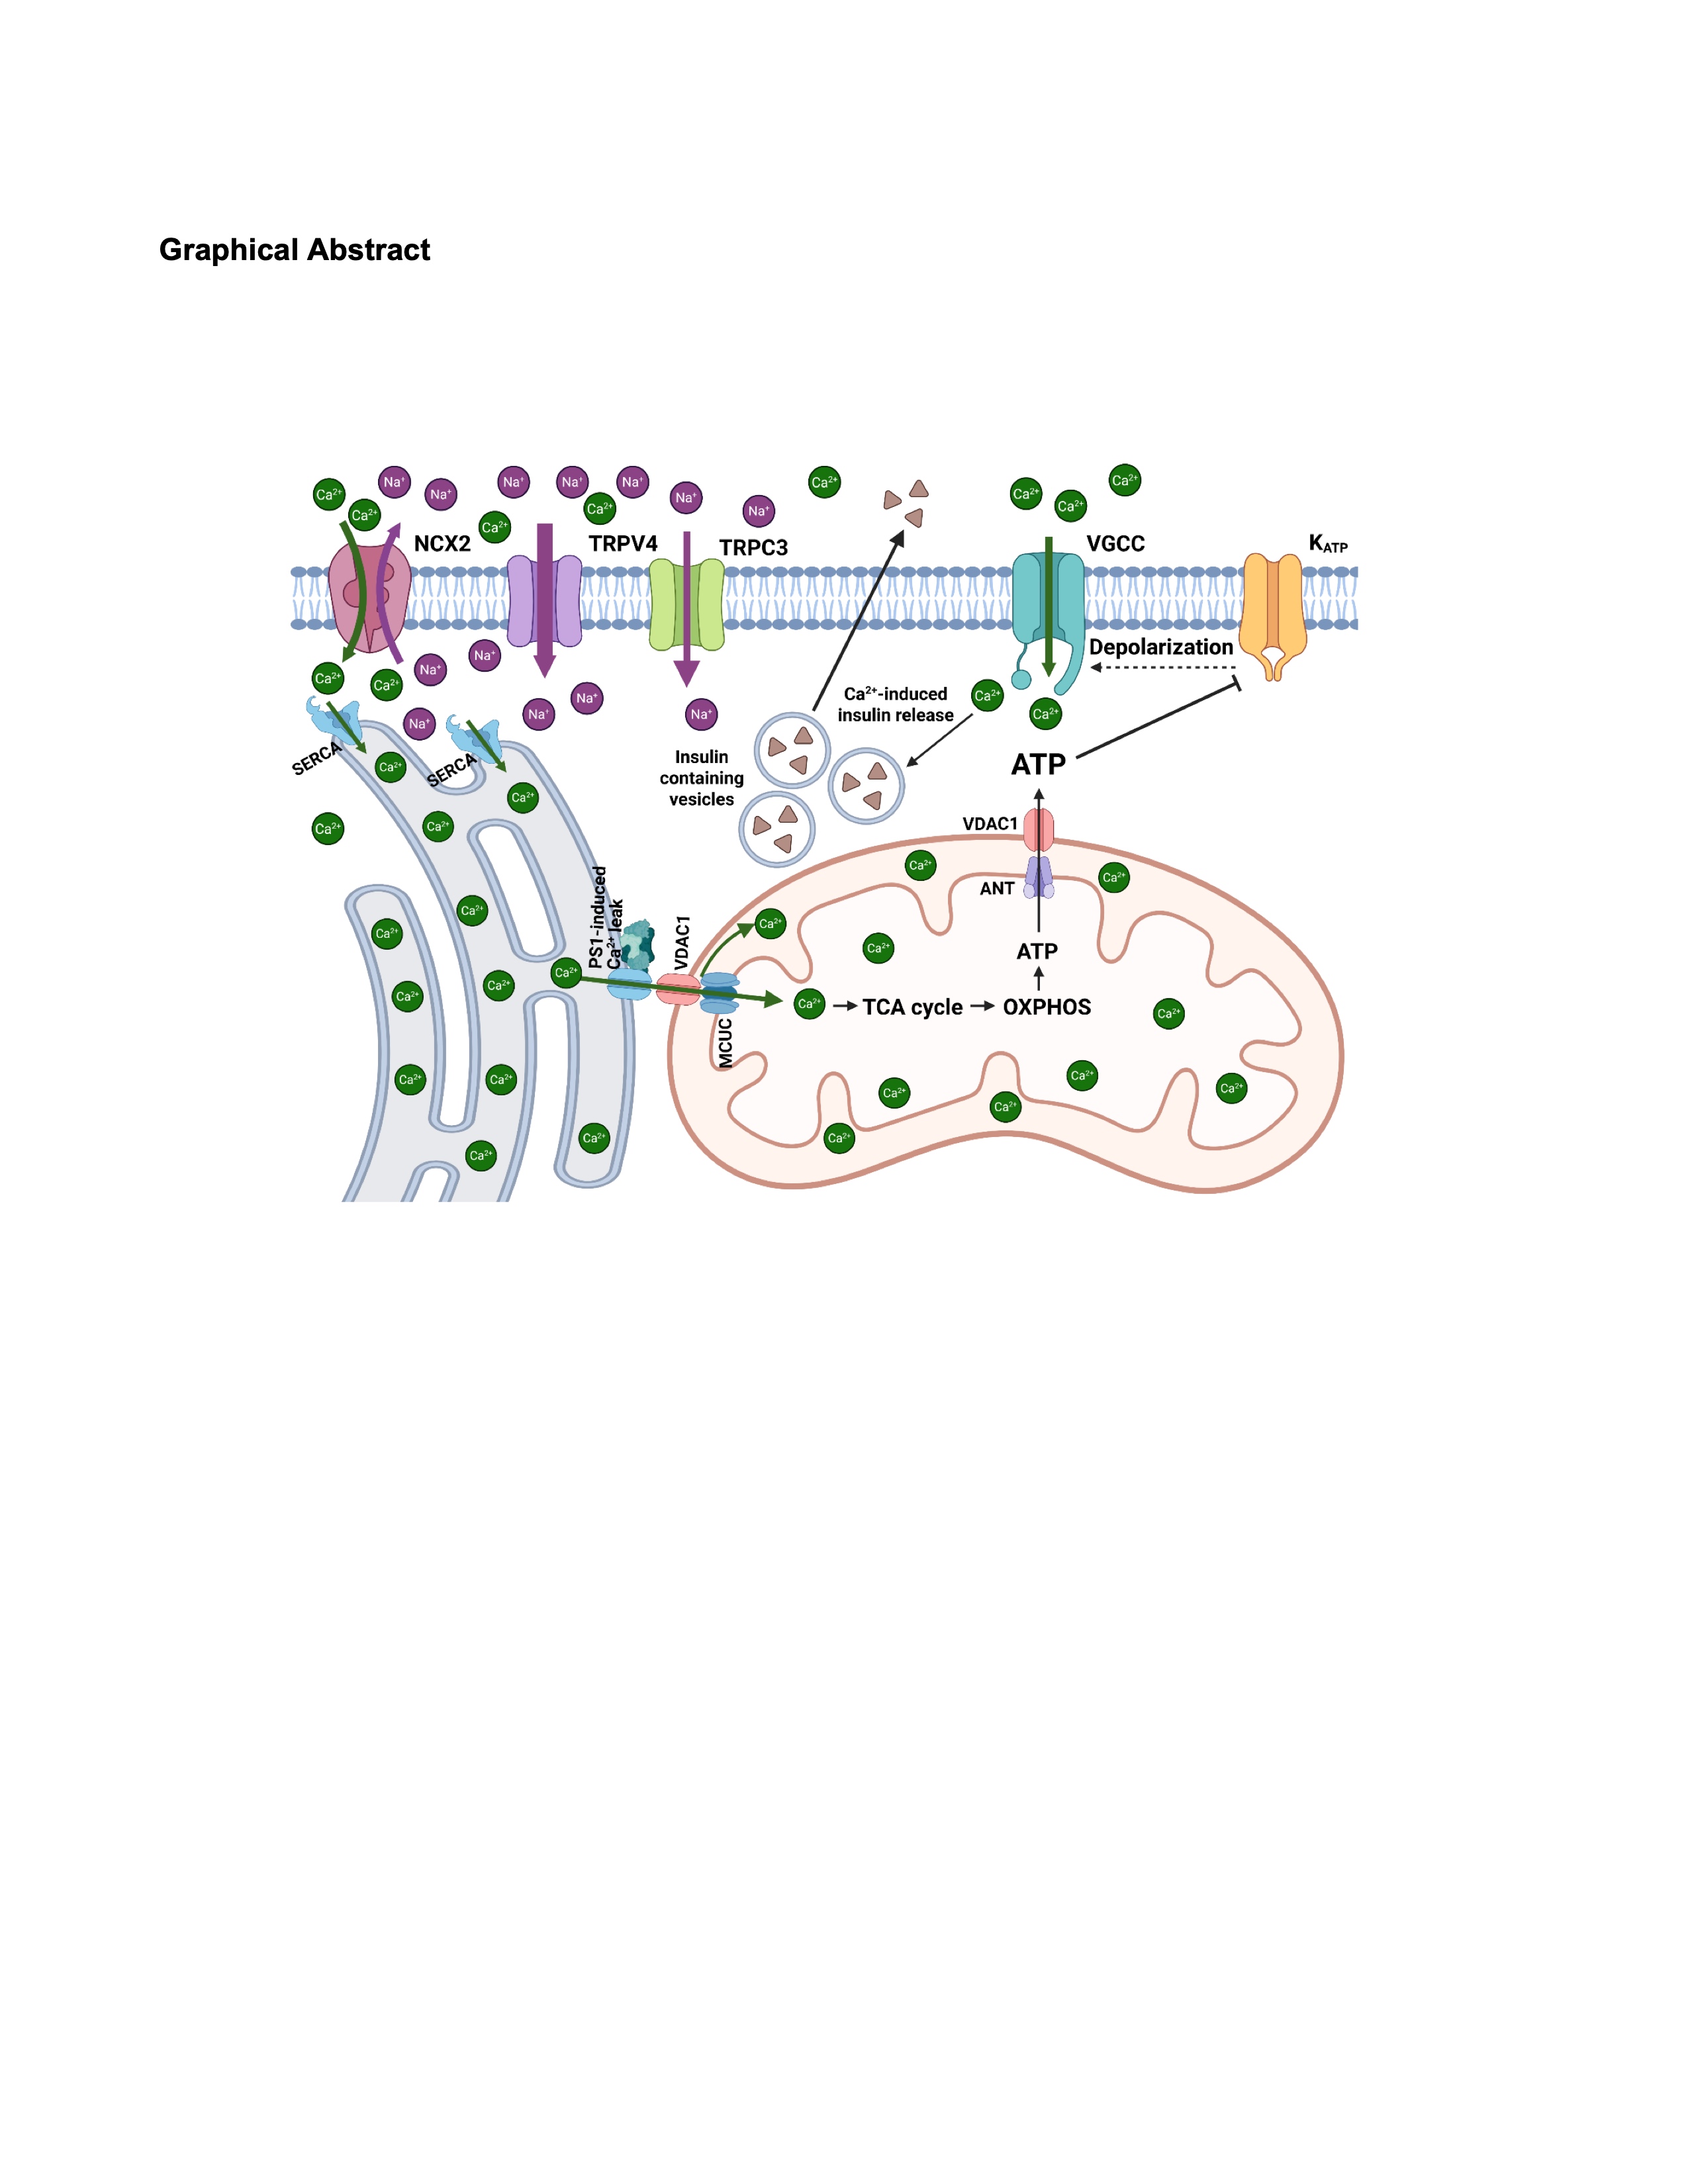
Background: For appropriate glucose sensing, pancreatic beta-cells essentially establish a constant mitochondria-directed endoplasmic reticulum (ER) Ca2+ leak via phosphorylated presenilin-1. In the current work, we investigated how cells maintain the ER Ca2+ content during this continuous Ca2+ leak. Methods: Ca2+ imaging for ER, cytosolic and subplasmalemmal Ca2+, high resolution respirometry, and ELISA for insulin secretion were used. Results: A novel ER Ca2+ refilling mechanism driven by reverse-mode of NCX2, which is fueled by local Na+ influxes through TRPC3 and TRPV4 channels that are independent from STIM-ORAI1 was found in pancreatic beta cell lines. Disrupting this TRPs-NCX2 axis reduces subplasmalemmal Ca2+ levels, abolishes glucose-induced cytosolic Ca2+ oscillations, suppresses glucose-triggered elevation in mitochondrial energetics, and impairs first-phase insulin secretion. Conclusions: We identified a novel, ORAI1-independent "TRPs-NCX2" relay that couples Na+ influx via TRPC3 and TRPV4 to NCX2 reverse mode to maintain ER Ca2+ stores during physiological basal (ER) Ca2+ leakage, which is fundamental to beta-cell responsiveness to elevated glucose.
Keywords:
beta cell
; ER Ca2+ leak
; NCX
; TRPC3
; TRPV4
; ER Ca2+ refilling
; glucose- stimulated insulin secretion
1. Introduction
The ability of pancreatic β-cells to sense changes in blood glucose concentration and secrete insulin accordingly relies on a finely tuned interplay between cellular metabolism and Ca²⁺ signaling. Upon glucose uptake and metabolism, the rise in intracellular ATP leads to closure of ATP-sensitive K⁺ (KATP) channels, plasma membrane depolarization, and activation of voltage-dependent Ca²⁺ channels. The resulting Ca²⁺ influx into the cytosol serves as the principal trigger for exocytosis of insulin-containing granules [1].
It was shown that GSK3ß-phosphorylates presenilin-1 (PS1) that, in turn, establishes a constitutive continuous ER Ca²⁺ leak that is transferred to the mitochondria, elevates basal mitochondrial matrix Ca²⁺ levels [2], which stimulates Ca²⁺-sensitive dehydrogenases of the tricarboxylic acid cycle, thereby enhancing oxidative phosphorylation and ATP synthesis and primes the organelle for instant glucose sensing oxidative metabolism, and which is crucial for the initial insulin release [3]. Silencing PS1 or inhibiting GSK3β abolishes this leak, resulting in reduced basal mitochondrial respiration and loss of the first phase of insulin secretion, which contributes to postprandial hyperglycemia and the development of type 2 diabetes mellitus [4].
Although this PS1-mediated ER Ca²⁺ leak is fundamental for β-cell responsiveness and β-cell integrity [5], it raises an important physiological question: how do β-cells maintain ER Ca²⁺ content under continuous ER Ca2+ leakage? If such continuous basal ER Ca2+ leak is not compensated, the persistent ER Ca²⁺ depletion would impair both mitochondrial metabolism and insulin secretion, indicating that a compensatory Ca²⁺ refilling mechanism must exist. In most cell types, store-operated Ca²⁺ entry (SOCE) through STIM–ORAI channels replenishes ER Ca²⁺ stores following agonist/IP3-induced depletion [6,7,8]. However, for activation of SOCE, the ER Ca2+ content must be substantially decreased, which would result in a continuous emptying-refilling cycle in β-cells with their established continuous ER Ca2+ leak [9,10,11]. As such, the emptying-refilling cycle did not become evident in our previous work, we anticipate a covert mechanism of continuous ER Ca2+ refilling as compensation for the continuous ER Ca2+ leak in β-cells.
Therefore, this study aimed to identify the plasma membrane transporters and ion channels responsible for covert continuous ER Ca²⁺ refilling in INS-1 β-cells that compensates PS1-mediated ER Ca²⁺ leak. Hence, we intended to explore the importance of this hidden mechanism for continuous ER Ca2+ refilling for mitochondrial bioenergetics and β-cell physiology in pancreatic β-cells. Ultimately, this study should evaluate an unknown Achilles’ heel for β-cell dysfunction as early onset of diabetes when β-cells fail to preserve ER Ca²⁺ balance, unable to compensate the continuous Ca²⁺ leak established by PS1, resulting in loss of glucose sensitivity due to reduced mitochondrial bioenergetics and hampered insulin secretion.
2. Materials and Methods
Reagents: KB-R7943 (PubChem ID CID:9823846) and Fluo-4 AM (PubChem ID CID:4060965) were purchased from THP Medical Products (Vienna, Austria). Pyr10 (PubChem ID CID:53475435) was purchased from Tedubio (Offenbach, Germany). HC067047 (PubChem ID CID:2742550), oligomycin A (PubChem CID: 5281899), antimycin A (PubChem CID: 16218979), 2,5-di-t-butyl-1, 4-benzohydroquinone (BHQ; PubChem CID: 16043), carbachol (Cch; PubChem CID: 5832), carbonyl cyanide p-trifluoromethoxyphenylhydrazone (FCCP; PubChem CID: 3330), ethylene glycol tetraacetic acid (EGTA; PubChem CID: 6207), were from Sigma Aldrich (Vienna, Austria). Cell culture materials were obtained from Greiner Bio-One (Kremsmünster, Austria). D1ER was from Addgene (Cambridge, MA 02139, USA).
Cell culture: INS-1 832/13 cells were kindly provided by Prof. Dr. Claes B. Wollheim and Dr. Françoise Assimacopoulos-Jeannet (University Medical Center, Geneva, Switzerland). INS-1 cells were cultured in RPMI 1640 containing 11mM glucose (PubChem CID: 5793) supplemented with 10 mM HEPES (PubChem CID: 23831), 10% fetal calf serum (FCS), 1 mM sodium pyruvate (PubChem CID: 23662274), 50 μM β-mercaptoethanol (PubChem CID: 1567), 1% (v/v) Pen Strep® (ThermoFischer, Vienna, Austria; 10.000 U/L).
Transfection: For Ca²⁺ imaging, cells were seeded on 30 mm glass coverslips placed in 6-well plates and transiently transfected at 60–80% confluency with 0.5 µg of plasmid DNA. Transfection was performed using 3 µl of PolyJet reagent (SignaGen Laboratories, Rockville, MD, USA) in 1 ml of complete culture medium. The cells were then placed in an incubator at 37 °C with 5% CO₂ and 95% air for 10–12 h, after which the transfection medium was replaced with a full culture medium. All experiments were conducted 40-48 h after transfection or treatment.
For knockdown experiments, cells (60–80% confluence), were transfected either with siRNA and plasmid combination by using 2.5 µl of ScreenFect A Plus transfection reagent (ScreenFect, Eggenstein-Leopoldshafen, Germany). Afterward, the transfection medium was replaced with 2 ml of full culture medium. Experiments were performed 40–48 h after transfection. Before each experiment, cells were adjusted to room temperature while kept in a storage buffer. Scrambled control siRNA sequence (sense strands, 5′-3′) AGGUAGUGUAAUCGCCUUGTT (siControl), NCX1 siRNA sequence (sense strands, 5′-3′) CCAUAUAACUGCAGAUACATT (siNCX1), NCX2 (sense strands, 5′-3′) siRNA sequence AGGCAGCCGAUUAUGATT (siNCX2), TRPC3 siRNA sequence (sense strands, 5′-3′) CAUUGGCUAUGUCCUUUAUTT (siTRPC3) and TRPV4 siRNA sequence (sense strands, 5′-3′) GCUUAACAAUGACGGUCUUTT (siTRPV4) Microsynth (Balgach, Switzerland) were used.
Buffers and solutions: Before the microscopic measurements, cells were adjusted to room temperature in storage buffer: 2 mM CaCl2, 138 mM NaCl, 1 mM MgCl2, 5 mM KCl, 10 mM HEPES, 2.6 mM NaHCO3, 0.44 mM KH2PO4, amino acid, and vitamins mix, 10 mM glucose, 2 mM L-glutamine, 1% penicillin/streptomycin, 1.25 μg/mL amphotericin B and pH adjusted to 7.4. Live-cell imaging experiments were performed either in the Hepes-buffered Ca2+ containing experimental buffer with normal Na+ (2Ca138Na): 2 mM CaCl2, 138 mM NaCl, 1 mM MgCl2, 5 mM KCl, 10 mM Hepes, and 10 mM D-glucose at pH 7.4 or a nominal Ca2+ free solution with normal Na+ (0Ca138Na) containing 0.1 mM EGTA or in the Hepes-buffered Ca2+ containing experimental buffer with low Na+ (2Ca19Na) containing 19 mM NaCl and 119 mM choline chloride.
Live cell imaging: Experiments were conducted using an Olympus IX73 inverted microscope equipped with a UApoN340 40× oil immersion objective (Olympus, Tokyo, Japan) and a CCD Retiga R1 camera (Q-imaging, Surrey, BC, Canada). Illumination was provided by LedHUB® (Omicron, Germany) with 340, 385, 455, 470, and 550 nm LEDs combined with a CFP/YFP/RFP (CFP/YFP/mCherry-3X, Semrock, New York, NY, USA) filter set as previously described [12]. Data acquisition was performed using VisiView 4.2.01 (Visitron, Puchheim, Germany). Cells were placed into a flow chamber for the live cell imaging experiments. A gravity-based perfusion system PS-9D (NGFI, Graz, Austria) was used to perfuse cells during measurements. A motorized valve with nine positions was connected to the reservoirs (NGFI), and the desired reservoir was automatically activated using perfusion control software. Cells were randomly selected based on the expression of genetically encoded biosensors.
ER Ca2+ measurement: ER Ca2+ levels were measured with genetically encoded, FRET-based, ER-targeted ratiometric Ca2+ sensor D1ER [13] as described previously [14]. This sensor was illuminated with a 455 nm LED every 2 s using a 300-ms exposure time. Emission was collected at 480 nm and 530 nm by using a CFP/YFP/mCherry-3X filter set and 505dcxr beam-splitter. All recordings were background subtracted. Cells were preincubated in the corresponding preincubation buffer for 40 minutes and then stimulated with 100 µM carbachol (IP3-generating agonist) in the presence of 15 µM BHQ (SERCA inhibitor) in nominal 0 mM Ca2+ 138 mM Na+ experimental buffer.
Subplasmalemmal Ca2+ measurements: To measure the subplasmalemmal Ca2+ signal, cells were transfected with a genetically encoded Ca2+ sensor GCAMPS6s-CAAX [15]. Then, cells were illuminated at 470 nm every 2 s using a 300-ms exposure time, and fluorescence emission was recorded at 510 nm. Cells were perfused with a 2 mM Ca2+-containing buffer for 5 minutes to measure the basal Ca2+ oscillations. Subsequently, cells were perfused with the nominal Ca2+-free buffer containing 0.1 mM EGTA for 20 min to partially deplete the ER Ca2+ content. Then the buffer was replaced by Ca2+-containing buffer again to refill the ER Ca2+ content and measure the subplasmalemmal Ca2+ signal for 5 min. Corresponding inhibitors were used to block the respective channels. All recordings were background subtracted and normalized to the basal level.
Cytosolic Ca2+ measurements: Fluo-4 AM dye was used to measure the cytosolic Ca2+ oscillations [16]. Cells were loaded with 2 µM of Fluo-4 AM in a storage buffer with 3 mM glucose instead of 10 mM glucose for 20 minutes. Then, the cells were washed with the same storage buffer and placed into a glucose-free experimental buffer with DMSO or the corresponding inhibitor for 40-45 minutes before imaging to minimize the cytosolic Ca2+ oscillations. Mannitol was used as a glucose substitute to adjust the osmolarity. On the microscope, cells were perfused with 0 mM glucose (0G) buffer for 2 min before switching to a 16 mM glucose (16G) buffer containing the corresponding inhibitors during acquisition. Cells were alternately illuminated at 470 nm every 2 s using a 300-ms exposure time, whereas fluorescence emission was recorded at 510 nm. All recordings were background subtracted. The measurements were normalized to the basal level, and the number of oscillations after glucose stimulations was counted.
Mitochondrial respiration measurements: INS-1 cells were seeded in XF96 polystyrene cell culture microplates (Seahorse® , Agilent, Santa Clara, CA, USA) at a density of 100,000 cells per well. Following overnight incubation, the culture media was changed to the Sea Horse media with or without inhibitors. The cells were incubated at 37℃ for 1 hour and the mitochondrial respiration was analyzed using the XF96 extracellular flux analyzer (Seahorse Bioscience®) according to previously described protocols [17].
Insulin measurements: For the determination of insulin secretion rate INS-1 cells were routinely seeded on 6-well plates. 24 h after seeding, cells were washed twice with HBSS buffer containing 3 mM D-glucose, followed by a 1 h incubation in this buffer with the corresponding inhibitors to record basal insulin secretion. For stimulation of insulin secretion, cells were stimulated with HBSS buffer containing 16 mM D-glucose. Samples were taken at the 10th, 20th, and 45th minutes. Samples were stored on ice and centrifuged at 3000 rpm for 5 min to remove residual cells. Supernatant was transferred to fresh tubes and assayed using the Mercodia Rat Insulin ELISA (Mercodia, Uppsala, Sweden). Insulin secretion rate was calculated as previously described [18] using a standard procedure [19].
mRNA Isolation and PCR Analysis: Total RNA was isolated and processed for reverse transcription, PCR, and real-time PCR according to previously established protocols [20]. The relative mRNA levels of NCX2 and NCX3 were expressed as a fold-difference compared to NCX1 levels. Specific primers for detection and real-time PCR were sourced from Invitrogen (Vienna, Austria), with primer sequences as follows: Rat NCX1 5’-TACGATGACAAGCAGCCACT-3’ and 5’-CTTCCAGCTTGGTGTGTTCG-3’; Rat NCX2 5’-TTCTGCTGTCTGTCATCGAG-3’ and 5’-ACACACACAGCAATGACCAC-3’; Rat NCX3 5’-TTCCTGCATGGTCATCATCC-3’ and 5’-GCCATCCTCAATAGTCTTCC-3’.
Statistics: The number of independent experiments and number of cells where applicable is indicated in each figure legend along with the used statistical test and significance. Unless otherwise stated, all data are shown as means +/- SEM. Microsoft Excel (Microsoft 365, Microsoft, Redmond, WA, USA) was used for the data analysis and calculations. For statistical analysis, such as unpaired Student’s t-test or Analysis of variance (ANOVA) with Bonferroni post-hoc test where applicable, GraphPad Prism 11 (GraphPad Software, San Diego, CA, USA) was used.
3. Results
3.1. ER Ca²⁺ Refilling Depends on Plasma Membrane Permeability to Na+ and Ca2+
To explore the mechanism that compensates for the loss of ER Ca²⁺ due to the PS1-induced ER Ca²⁺ leak, ER Ca²⁺ dynamics were monitored using the ER-targeted Ca2+ FRET sensor D1ER [13] in INS-1 cells. During preincubation in standard medium (2 mM Ca²⁺, 138 mM Na⁺), cells maintained stable ER Ca²⁺ content, whereas removing extracellular Ca2⁺ yielded a time-dependent depletion of the ER (Figure 1A, left panel) and decreased the releasable ER Ca²⁺ pool by carbachol (Cch, 100 µM) and BHQ (15 µM) (Figure 1A, right panel).
As these data point to a compensatory mechanism for the PS1-mediated ER Ca2+ loss that utilizes extracellular Ca2+ for constant ER refilling, we next examined the contribution of TRPC3, TRPV4, or Orai1 in the compensatory mechanisms for ER Ca²⁺ refilling. For this purpose, we developed a simple protocol that allowed us to compare the ER Ca2+ content under conditions where the compensation of the ER Ca2+ leak is in place (in the presence of extracellular Ca2+), when no compensation is possible (in the absence of extracellular Ca2+), and in the presence of extracellular Ca2+ and a respective channel inhibitor for either of these channels.
Inhibition of Orai1 with Pyr6 [21] (2 µM) in the presence of extracellular Ca2+ did not affect ER Ca²⁺ dynamics (Figure 1B, 1E), indicating that refilling occurs independently of classical store-operated Ca²⁺ entry. In contrast, inhibition of TRPC3 with Pyr10 [21] (3 µM) and TRPV4 with HC-067047 [22] (5 µM) in the presence of extracellular Ca2+ reduced ER Ca²⁺ levels (Figure 1C), and the amount of releasable ER Ca²⁺ pool (Figure 1D). TRPV4 inhibition exerted a stronger effect than TRPC3 (Figure 1E).
3.2. ER Ca²⁺ Refilling Depends on Plasma Membrane Na⁺ Fluxes Fueling NCX Reverse-Mode Activity
Notably, both TRP channels, TRPC3 and TRPV4, are permeable for Na+ and Ca2+ with a selectivity of PCa : PNa of 1.6 and 6 [23], respectively. Considering the presence of 2 mM Ca2+ and 138 mM Na+ in our experimental buffer, we speculated that these channels preferentially establish Na+ over Ca2+ fluxes in beta cells under resting conditions [23].
To further explore the possibility of Na+ fluxes as initial compensatory ion movement for the compensation of PS1-mediated ER Ca2+ leak, we used the same protocol as in Figure 1, but preincubated the cells in low Na+ (19 mM Na+) [24] buffer in the presence of extracellular Ca2+ for 40 minutes before ER Ca2+ measurement and compared to the cells preincubated in normal Na+ buffer (138 mM Na+ 2mM Ca2+). Basal ER Ca²⁺ levels (Figure 2A, left panel) and the amount of releasable ER Ca²⁺ pool (Figure 2A, right panel) were strongly reduced in low extracellular Na⁺ compared to 138 mM controls. These data point to transmembrane Na+ fluxes as an important event in the compensation of ER Ca2+ loss due to the PS1-established ER Ca2+ leak and let us speculate on a joined activity of Na+ fluxes established by TRPs and a functionally coupled reverse activity of the plasma membrane Na+/Ca2+ exchanger (NCX). Therefore, we next tested whether reverse-mode Na⁺/Ca²⁺ exchange [24] contributes to compensating for ER Ca2+ loss caused by the PS1-induced ER Ca2+ leak. Cells were treated in the presence of extracellular Ca2+ with the NCX reverse-mode inhibitor KB-R7943 (10 µM) [25]. KB-R7943 reproduced the effects of low Na⁺ or Ca²⁺ removal and markedly reduced basal ER Ca²⁺ content (Figure 2 B, left panel) and the amount of releasable ER Ca²⁺ pool (Figure 2 B, right panel). Together, these findings suggest that ER Ca²⁺ replenishment for PS1-established ER Ca2+ leak in beta cells requires a joint activity of Na⁺ influx via the TRPC3 and TRPV4, and the reverse-mode of NCX pumping in Ca2+ (Figure 2C).
3.3. TRPC3/TRPV4 and NCX Jointly Establish Subplasmalemmal Ca²⁺ Signals for ER Refilling
To further challenge our hypothesis illustrated in figure 2C, we monitored subplasmalemmal Ca²⁺ signals using the membrane-targeted Ca²⁺ sensor GCAMP6s-CAAX [15]. Cells expressing GCAMP6s-CAAX were perfused with 0 mM Ca²⁺ buffer containing DMSO as a control (Figure 3A), 3 µM Pyr10 (TRPC3 inhibitor) (Figure 3B) or 5 µM HC-067047 (TRPV4 inhibitor) (Figure 3C). After 20 min in a nominal Ca²⁺-free solution, the extracellular buffer was replaced by the 2 mM Ca²⁺ containing buffer without and with the respective inhibitors for TRPC3 and TRPV4, and the subplasmalemmal Ca²⁺ signal was monitored. We expected that in the absence of extracellular Ca²⁺, any Na+ currents are pronounced, yielding subplasmalemmal Na+ loading that fuels the NCX upon re-addition of extracellular Ca²⁺ to shuttle in Ca2+ and increase subplasmalemmal Ca²⁺. Both TRP channel inhibitors strongly reduced the subplasmalemmal Ca²⁺ elevation upon the re-addition of extracellular Ca²⁺ (Figure 3), thus supporting the concept that TRPC3 and TRPV4 indeed contribute to subplasmalemmal Na+ loading. This data further supports the previous findings, indicating that TRPV4 is more involved than TRPC3 in the process of the compensation of ER Ca²⁺ loss by PS1-established ER Ca²⁺ leak.
To confirm these findings with pharmacological inhibitors, we employed a genetic approach with siRNA-mediated knockdown of either TRPC3 or TRPV4. An identical experimental protocol to the previous one using cells expressing GCAMP6s-CAAX was performed with cells treated with either siRNA control or siRNA against TRPC3 or TRPV4. The maximal subplasmalemmal Ca2+ elevation upon re-addition of extracellular Ca²⁺ was monitored. Knockdown of TRPC3 or TRPV4 (siTRPC3, siTRPV4) recapitulated the effects of the inhibitors, reducing the magnitude of the subplasmalemmal Ca²⁺ elevation upon re-addition of extracellular Ca²⁺ (Figure 4A–D). Notably, the number of basal subplasmalemmal Ca²⁺ peaks in the presence of extracellular Ca²⁺ (0-5 min) and the subplasmalemmal Ca2+ elevation upon readdition of extracellular Ca2+ were strongly reduced by the knock-down of TRPC3 and TRPV4 (Figure 4D,E). These results suggest that both TRPC3 and TRPV4 contribute to Na+ influx in the presence and absence of extracellular Ca²⁺ conditions and, thus essentially maintain the localized Ca²⁺ microenvironment in the subplasmalemmal area by Na+ supply presumably fueling reversed NCX activity [26] for efficient ER Ca²⁺ replenishment.
We next examined the specific transporters responsible for translating the TRP-mediated Na⁺ influx into Ca²⁺ entry. The cells were perfused with 0 mM Ca2+ buffer under the microscope, and 2 mM Ca2+ containing buffer was introduced with DMSO as a control, or 10 µM KB-R7943, an inhibitor of the reversed mode of NCX, or 2 µM Pyr6, an ORAI1 inhibitor.
Inhibition of the reversed mode of NCX with KB-R7943 blunted the subplasmalemmal Ca²⁺ refilling signal upon the re-addition of extracellular Ca2+ after 20 min in Ca2+-free solution (Figure 5B, 5D). This data further supports our hypothesis that the reversed mode of NCX translates plasmalemmal Na+ fluxes by TRPC3/TRPV4 into Ca2+ supply for ER Ca2+ refilling to compensate for PS1-induced ER Ca2+ leak in pancreatic β-cells (Figure 5E). In contrast, inhibition of Orai1 with Pyr6 had no significant effect on the Ca2+ refilling amplitude (Figure 5C, 5D), reinforcing the model that the classical store-operated Ca²⁺ entry (SOCE) via Orai1 is not the primary driver of basal ER Ca2+ refilling in pancreatic β-cells.
Pancreatic β-cells predominantly express the NCX2 over the NCX1 isoform and only very small amounts of NCX3 (Figure 6F). To determine which NCX isoform is involved, we performed isoform-specific knockdown and tested which of the NCX isoforms are involved in the translation of TRPC3/TRPV4-fueled subplasmalemmal Na+ to spatial Ca2+ elevation. Subplasmalemmal Ca2+ was recorded in the presence of extracellular Ca2+, followed 20 min in the nominal absence of extracellular Ca2+ (“stimulated Na+ loading period”), and the subsequent re-addition of 2 mM Ca2+ containing buffer. The number of subplasmalemmal Ca2+ oscillations during the basal conditions in the presence of extracellular Ca2+ (0-5 min), and the maximal subplasmalemmal Ca2+ elevation upon the Ca2+ re-addition were measured. Knockdown of NCX1 did neither affect basal Ca2+ oscillation nor the Ca2+ peak upon Ca2+ re-addition (Figure 6). In contrast, knockdown of NCX2 strongly reduced the number of basal Ca²⁺ peaks and the subplasmalemmal Ca²⁺ amplitude (Figure 6).
3.4. TRPC3, TRPV4, and the Reversed Mode of NCX Jointly Establish Glucose-Induced Cytosolic Ca²⁺ Oscillations in Pancreatic β-Cells
To assess the functional significance of these complex Na+/Ca2+ signaling in β-cell, glucose-triggered cytosolic Ca²⁺ oscillations were recorded using Fluo-4 AM [16]. β-cells were incubated for 40 minutes with the various inhibitors or DMSO as a control, and subsequently stimulated with 16 mM glucose. Control cells displayed a regular number of oscillations, while inhibition of NCX reverse mode (KB-R7943), TRPC3 (Pyr10) or TRPV4 (HC-067047), markedly reduced the number of oscillations (Figure 7A, B). Quantification revealed the strongest reduction upon NCX inhibition > TRPV4 > TRPC3, indicating that the TRPV4/TRPC3–NCX contributes critically to maintaining glucose-induced Ca²⁺ oscillations in β-cells.
3.5. NCX Reverse Mode, TRPC3, and TRPV4 Jointly Contribute to Mitochondrial Oxygen Consumption
Because ER–mitochondria Ca²⁺ transfer is a key driver of basal β-cell oxidative metabolism [27,28,29], we investigated the impact of NCX reverse mode, TRPC3, and TRPV4 on basal mitochondrial respiration. ß-cells were preincubated with or without the respective inhibitors for 40 minutes before the experiment. Seahorse® analysis revealed that inhibition of NCX reverse mode (KB-R7943), TRPC3 (Pyr10) or TRPV4 (HC-067047) significantly decreased both basal and maximal oxygen consumption rates (OCR) compared to control cells (Figure 8). These results indicate that TRPC3/TRPV4–NCX-mediated ER Ca²⁺ refilling supports basal mitochondrial Ca²⁺ uptake and respiration, linking ER Ca²⁺ homeostasis directly to the ER Ca2+ leak and β-cell basal metabolic activity.
3.6. TRPC3/TRPV4, Jointly with NCX, Ensure First-Phase Insulin Secretion Upon Elevated Glucose
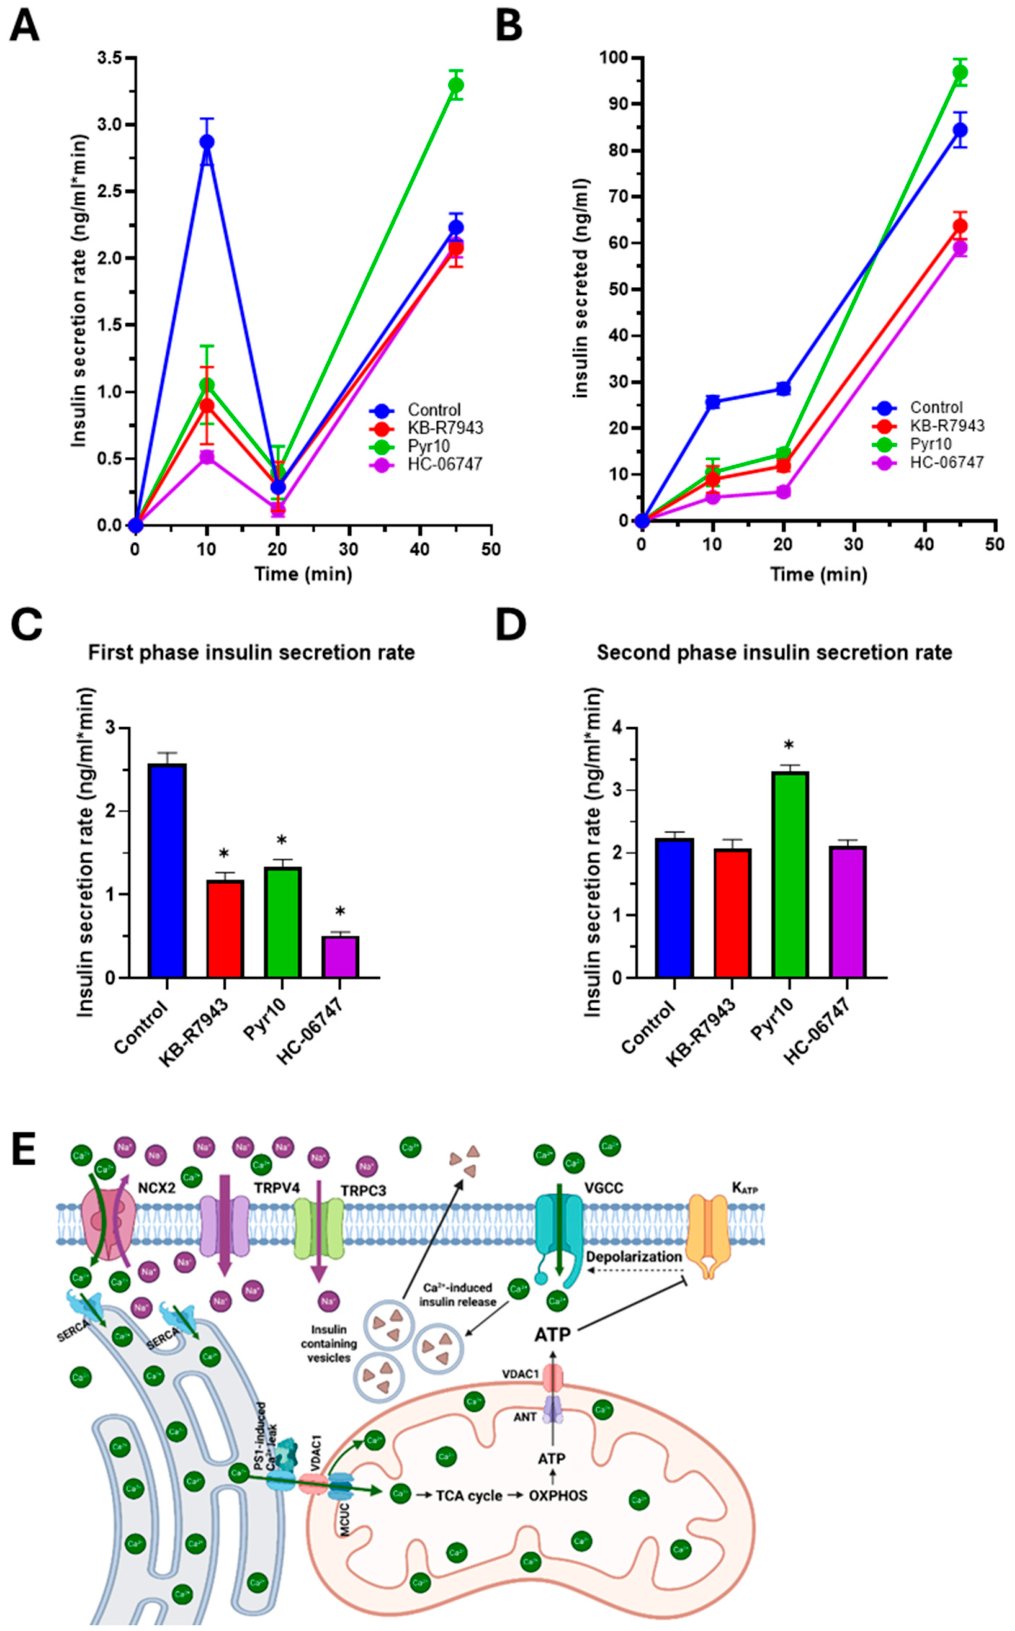
Finally, we examined whether interference with the compensation for the PS1-mediated ER Ca2+ leak affects glucose-stimulated insulin secretion (GSIS). Therefore, β-cells were incubated in 3 mM glucose-containing medium with or without the corresponding inhibitors for 1 hour, followed by a shift to 16 mM glucose with or without the corresponding inhibitors. The secreted insulin was measured at 0, 10, 20, and 45 minutes after the glucose elevation. In control ß-cells, glucose stimulation (16 mM) evoked the already described biphasic insulin release (Figure 9).
Inhibition of NCX, TRPC3, or TRPV4 strongly reduced first-phase insulin secretion (Figure 9A, C), whereas effects on the second phase were only moderate (Figure 9B, D). As in most experiments illustrated above, TRPV4 inhibition produced the strongest suppression of insulin release. These results support our hypothesis of a joint action of TRPV4>TRPC3 for subplasmalemmal Na+ that is translated to Ca2+ uptake via a reversed mode of NCX2 to compensate PS1-established ER Ca2+ leak, thus maintaining ER Ca²⁺ content, and ß-cell sensitivity for elevated glucose to ensure adequate GSIS.
4. Discussion
Pancreatic β-cells rely on tightly regulated Ca2+ fluxes to couple glucose metabolism to insulin secretion [30,31]. A continuous ER Ca2+ leak, established by presenilin-1 (PS1) [2,3], requires an equally continuous Ca2+ refilling mechanism to preserve ER Ca2+ content that essentially maintains mitochondrial metabolism, cytosolic Ca2+ oscillations, and glucose-stimulated insulin secretion. Here, we identify a subplasmalemmal Na+-dependent TRPC3/TRPV4 – NCX2 Ca2+ entry pathway that constitutively replenishes ER Ca2+ in INS-1 β-cells. We show that at least two plasma membrane TRP channels participate in this process. Our data that a pharmacological inhibition of TRPC3 with Pyr10 [21] and TRPV4 with HC-067047 [22], as well as protein-specific siRNA-mediated knockdown, significantly reduced the Ca2+ signal in the subplasmalemmal region during ER refilling and decreased ER Ca2+ refilling, point to a contribution of these TRP channels in the compensatory mechanism for the PS1-established ER Ca2+ leak in resting β-cells. Such basal activity in resting cells is consistent with the reported biophysical properties of these very TRP channels. In this respect, electrophysiological studies have described native TRPC3 activity, thereby establishing a constitutively active channel that maintains spontaneous activity at rest in rabbit ear artery myocytes [32]. Similarly, TRPV4 functions as a metabolic sensor in enteroendocrine cells, where it is activated by glucose to regulate GLP-1 release [33]. While our data focus on their constitutive role in the compensation of PS1-established ER Ca2+ leak for maintaining ER Ca2+, the established sensitivity of these channels to nutrient cues—such as TRPC3 activation by lipid-derived diacylglycerol (DAG) [34] and TRPV4 modulation by glucose-induced metabolic shifts [33] —provides a compelling framework for their function in pancreatic β-cells. These characteristics suggest a model in which TRPC3 and TRPV4 serve as dynamic metabolic integrators, potentially linking fluctuations in the local nutrient environment to the maintenance of β-cell basal Ca2+ homeostasis that is vital for the cell’s responsiveness to elevated glucose and associated insulin secretion [35]. This proposed correlation suggests that the ER refilling rate could scale with the β-cell's metabolic load, ensuring that Ca2+ stores are replenished more efficiently during periods of high demand.
Our results showing that extracellular Na+ is fundamental for maintaining ER Ca2+ under conditions of PS1-mediated ER Ca2+ leak suggest that TRPC3 and TRPV4 preferentially establish Na+ conductance under resting conditions. This assumption is in line with the reported selectivity of these channels for Na+ and Ca2+ (PCa : PNa of 1.6 and 6, for TRPC3 and TRPV4, respectively) [23] at the given intra- and extracellular ion ratios and resting membrane potential. In line with these findings, inhibition of the NCX reverse mode with KB-R7943 strongly reduced ER Ca2+ level under basal conditions of PS1-evoked ER Ca2+ leak. In contrast, inhibition of ORAI1 with Pyr6 had no significant effect on basal ER Ca2+ refilling. These findings support a model for the basal compensatory mechanism of the PS1-induced ER Ca2+ leak in resting pancreatic ß-cells (Figure 5E) to rely on TRPC3 and TRPV4 basal Na+ conductances, which, in turn, fuels the reversed mode of NCX, ultimately achieving continuous ER Ca2+ refilling under these conditions, while no activation of STIM/ORAI1 occurs [26].
Such physical and functional assembly of a TRP-NCX signaling complex is well-documented in other tissues. In cardiac myocytes, TRPC3 is physically associated with NCX1, where PLC-mediated Na+ loading through TRPC3 drives NCX into reverse mode to control Ca2+ homeostasis [26]. A functional interaction with NCX is not limited to TRPC3; in airway smooth muscle, TRPV4 has been shown to interact directly with NCX and IP3R1 to modulate Ca2+ signaling and muscle tension [36].
The use of a Na+-dependent "double relay" from TRP-mediated Na+ influx to NCX-mediated Ca2+ entry might represent a strategic evolutionary adaptation for spatial ion compartmentalization in specialized cells. According to this model, by using Na+ as a signaling intermediary, the pancreatic β-cell may control selectively isolated Ca2+ movements within the subplasmalemmal-ER junction. This would allow the entering Ca2+ to be immediately sequestered by SERCA to refill the ER, effectively "buffering" the signal and preventing it from reaching the global cytosol where it might otherwise trigger unscheduled insulin vesicle exocytosis. While the aforementioned studies often implicate NCX1, we identified the specific involvement of the NCX2 isoform in this β-cell model. This finding suggests a specialized role for NCX2 in maintaining beta-cell Ca2+ levels. Accordingly, our proposed mechanism posits that Na+ influx through TRPC3/TRPV4 creates the microdomain necessary to flip NCX2 into reverse mode, allowing Ca2+ entry that is subsequently sequestered by SERCA to refill the ER (Fig. 5E).
Functionally, inhibiting joined TPPC3/TRPV4 & NCX2 achieved compensation of PS1-established ER Ca2+ leak mimicked the PS1 knockdown phenotype in this cell type, and impaired glucose-induced cytosolic Ca2+ oscillations, mitochondrial oxygen consumption, and first-phase insulin secretion upon elevated glucose. These findings are confirmed by the reports that TRPC3 is functionally expressed in islet β-cells, where its activation enhances insulin secretion and its deletion leads to glucose intolerance [37]. Moreover, pharmacological activation of TRPV4 has been shown to modulate Ca2+ levels in INS-1 cells, reinforcing its role in β-cell Ca2+ homeostasis [38].
5. Conclusions
Collectively, our present data support the hypothesis that the TRPC3/TRPV4–NCX2 module is required to sustain the ER-mitochondria Ca2+ flux content compensating PS1-established ER Ca2+ leak in pancreatic β-cells. This "covert" refilling mechanism ensures that mitochondria are bioenergetically primed to maintain the proper reactivity of the Ca2+-sensitive dehydrogenases of the TCA [39,40] and the Ca2+-dependent malate-aspartate shuttle [41] in the first phase of a glucose elevation. The present findings further provide information on novel potential targets contributing to β-cell dysfunction, as an impairment of the compensation mechanism of the ER Ca2+ leak, leading to reduced metabolic activation and defective GSIS (Figure 9E).
Author Contributions
Data curation, formal analysis, validation, writing—original draft, A.S.; data curation; validation; methodology, F.E.O.; investigation, A.K.; investigation, S.v.A.; data curation; software; validation; methodology, B.G.; investigation, methodology, R.R.;. data curation, validation, methodology, ZK; writing—review and editing, R.M.; conceptualization, supervision, funding acquisition, visualization, writing— review, editing and final, project administration, W.F.G.
Funding
We. are grateful to the Austrian Science Fund (FWF) for the excellence cluster 10.55776/COE14 (MetAGE). This research was further supported by the FWF via the DKplus program 10.55776/W1226 (DK-MCD) to W.F.G., and the MEFO Graz (to W.F.G.). A.S., A.K. and S.v.A. are thesis students in the excellence cluster 10.55776/COE14 (MetAGE, W.F.G.). M.H. was a fellow of the Molecular Medicine (MolMed) doctoral program at the Medical University of Graz.
Data Availability Statement
The original data presented in the study will be openly available. Access is provided on reasonable request from the corresponding author.
Acknowledgments
We appreciate the technical assistance from Anna Schreilechner, Stella Petritsch, and Anika Brunner. The SIM equipment is part of the Nikon Center of Excellence, Graz, and is supported by the Austrian infrastructure program 2013/ 2014, Nikon Austria Inc., and BioTechMed (to W.F.G.). For open access purposes, the authors have applied a CC BY public copyright license to any author-accepted manuscript version arising from this submission.” We thank the Medical University of Graz for financial support.
Conflicts of Interest
The authors declare no conflicts of interest.
Abbreviations
The following abbreviations are used in this manuscript:
| PS1 | presenilin-1 |
| GSK3ß | glykogensynthase-kinase 3 beta |
| ER | Endoplasmic reticulum |
| STIM | stromal interaction molecule |
| ORAI | Ion channel responsible for store-operated Ca2+ entry |
| INS-1 | immortalized rat insulinoma model cell line |
| TRP | transient receptor potential channels |
| NCX | plasma membrane sodium-calcium exchanger |
| SERCA | sarcoplasmic/endoplasmic reticulum calcium ATPase |
| TCA | tricarboxylic acid cycle |
| Cch | carbachol |
| BHQ | 2,5-di-tert-butylhydroquinone |
References
- Klec, C.; Ziomek, G.; Pichler, M.; Malli, R.; Graier, W.F. Calcium Signaling in β-Cell Physiology and Pathology: A Revisit. Int. J. Mol. Sci. 2019, 20, 6110. [Google Scholar] [CrossRef]
- Klec, C.; Madreiter-Sokolowski, C.T.; Stryeck, S.; Sachdev, V.; Duta-Mare, M.; Gottschalk, B.; Depaoli, M.R.; Rost, R.; Hay, J.; Waldeck-Weiermair, M.; et al. Glycogen Synthase Kinase 3 Beta Controls Presenilin-1-Mediated Endoplasmic Reticulum Ca2+ Leak Directed to Mitochondria in Pancreatic Islets and β-Cells. Cell Physiol. Biochem Int. J. Exp. Cell Physiol. Biochem Pharmacol. 2019, 52, 57–75. [Google Scholar] [CrossRef]
- Klec, C.; Madreiter-Sokolowski, C.T.; Ziomek, G.; Stryeck, S.; Sachdev, V.; Duta-Mare, M.; Gottschalk, B.; Depaoli, M.R.; Rost, R.; Hay, J.; et al. Presenilin-1 Established ER-Ca2+ Leak: A Follow Up on Its Importance for the Initial Insulin Secretion in Pancreatic Islets and β-Cells Upon Elevated Glucose. Cell. Physiol. Biochem. 2019, 53, 573–586. [Google Scholar] [CrossRef]
- Prato, S.D. Loss of Early Insulin Secretion Leads to Postprandial Hyperglycaemia. Diabetologia 2003, 46, M2–M8. [Google Scholar] [CrossRef]
- Koshenov, Z.; Postic, S.; Schoiswohl, G.; van Amsterdam, S.; Hois-Zelinka, V.; Oflaz, F.E.; Rost, R.; Tiapko, O.; Gottschalk, B.; Hirtl, M.; et al. Presenilin-1 Controls Glycolysis and Identity of Pancreatic Beta Cells. Commun. Biol. 2026. [Google Scholar] [CrossRef]
- Hewavitharana, T.; Deng, X.; Soboloff, J.; Gill, D.L. Role of STIM and Orai Proteins in the Store-Operated Calcium Signaling Pathway. Cell Calcium 2007, 42, 173–182. [Google Scholar] [CrossRef]
- Soboloff, J.; Spassova, M.A.; Tang, X.D.; Hewavitharana, T.; Xu, W.; Gill, D.L. Orai1 and STIM Reconstitute Store-Operated Calcium Channel Function. J. Biol. Chem. 2006, 281, 20661–20665. [Google Scholar] [CrossRef]
- Peinelt, C.; Vig, M.; Koomoa, D.L.; Beck, A.; Nadler, M.J.S.; Koblan-Huberson, M.; Lis, A.; Fleig, A.; Penner, R.; Kinet, J.-P. Amplification of CRAC Current by STIM1 and CRACM1 (Orai1). Nat. Cell Biol. 2006, 8, ncb1435. [Google Scholar] [CrossRef]
- Wu, M.M.; Buchanan, J.; Luik, R.M.; Lewis, R.S. Ca2+ Store Depletion Causes STIM1 to Accumulate in ER Regions Closely Associated with the Plasma Membrane. J. Cell Biol. 2006, 174, 803–813. [Google Scholar] [CrossRef]
- Wang, Y.; Deng, X.; Gill, D.L. Calcium Signaling by STIM and Orai: Intimate Coupling Details Revealed. Sci. Signal 2010, 3, pe42–pe42. [Google Scholar] [CrossRef]
- Gudlur, A.; Zeraik, A.E.; Hirve, N.; Rajanikanth, V.; Bobkov, A.A.; Ma, G.; Zheng, S.; Wang, Y.; Zhou, Y.; Komives, E.A.; et al. Calcium Sensing by the STIM1 ER-Luminal Domain. Nat. Commun. 2018, 9, 4536. [Google Scholar] [CrossRef]
- Oflaz, F.E.; Koshenov, Z.; Hirtl, M.; Rost, R.; Malli, R.; Graier, W.F. Sigma-1 Receptor Modulation by Ligands Coordinates Cancer Cell Energy Metabolism. Biomol 2022, 12, 762. [Google Scholar] [CrossRef]
- Palmer, A.E.; Jin, C.; Reed, J.C.; Tsien, R.Y. Bcl-2-Mediated Alterations in Endoplasmic Reticulum Ca2+ Analyzed with an Improved Genetically Encoded Fluorescent Sensor. P Natl. Acad. Sci. Usa 2004, 101, 17404–17409. [Google Scholar] [CrossRef]
- Deak, A.T.; Blass, S.; Khan, M.J.; Groschner, L.N.; Waldeck-Weiermair, M.; Hallström, S.; Graier, W.F.; Malli, R. IP3-Mediated STIM1 Oligomerization Requires Intact Mitochondrial Ca2+ Uptake. J. Cell Sci. 2014, 127, 2944–2955. [Google Scholar] [CrossRef]
- Tsai, F.-C.; Seki, A.; Yang, H.W.; Hayer, A.; Carrasco, S.; Malmersjö, S.; Meyer, T. A Polarized Ca2+, Diacylglycerol and STIM1 Signalling System Regulates Directed Cell Migration. Nat. Cell Biol. 2014, 16, ncb2906. [Google Scholar] [CrossRef]
- Mariggiò, S.; Sebastià, J.; Filippi, B.M.; Iurisci, C.; Volonté, C.; Amadio, S.; Falco, V.D.; Santoro, M.; Corda, D. A Novel Pathway of Cell Growth Regulation Mediated by a PLA2α-Derived Phosphoinositide Metabolite. Faseb J. 2006, 20, 2567–2569. [Google Scholar] [CrossRef]
- Madreiter-Sokolowski, C.T.; Győrffy, B.; Klec, C.; Sokolowski, A.A.; Rost, R.; Waldeck-Weiermair, M.; Malli, R.; Graier, W.F. UCP2 and PRMT1 Are Key Prognostic Markers for Lung Carcinoma Patients. Oncotarget 2017, 8(46), 80278–80285. [Google Scholar] [CrossRef]
- Alam, M.R.; Groschner, L.N.; Parichatikanond, W.; Kuo, L.; Bondarenko, A.I.; Rost, R.; Waldeck-Weiermair, M.; Malli, R.; Graier, W.F. Mitochondrial Ca2+ Uptake 1 (MICU1) and Mitochondrial Ca2+ Uniporter (MCU) Contribute to Metabolism-Secretion Coupling in Clonal Pancreatic β-Cells. J. Biol. Chem. 2012, 287, 34445–34454. [Google Scholar] [CrossRef]
- Lorenz, M.A.; Azzouny, M.A.E.; Kennedy, R.T.; Burant, C.F. Metabolome Response to Glucose in the β-Cell Line INS-1 832/13*. J. Biol. Chem. 2013, 288, 10923–10935. [Google Scholar] [CrossRef]
- Oflaz, F.E.; Bondarenko, A.I.; Trenker, M.; Waldeck-Weiermair, M.; Gottschalk, B.; Bernhart, E.; Koshenov, Z.; Radulović, S.; Rost, R.; Hirtl, M.; et al. Annexin A5 Controls VDAC1-Dependent Mitochondrial Ca2+ Homeostasis and Determines Cellular Susceptibility to Apoptosis. EMBO J. 2025, 44, 3413–3447. [Google Scholar] [CrossRef]
- Schleifer, H.; Doleschal, B.; Lichtenegger, M.; Oppenrieder, R.; Derler, I.; Frischauf, I.; Glasnov, T.; Kappe, C.; Romanin, C.; Groschner, K. Novel Pyrazole Compounds for Pharmacological Discrimination between Receptor-operated and Store-operated Ca2+ Entry Pathways. Brit J. Pharmacol. 2012, 167, 1712–1722. [Google Scholar] [CrossRef]
- Everaerts, W.; Zhen, X.; Ghosh, D.; Vriens, J.; Gevaert, T.; Gilbert, J.P.; Hayward, N.J.; McNamara, C.R.; Xue, F.; Moran, M.M.; et al. Inhibition of the Cation Channel TRPV4 Improves Bladder Function in Mice and Rats with Cyclophosphamide-Induced Cystitis. Proc. Natl. Acad. Sci. 2010, 107, 19084–19089. [Google Scholar] [CrossRef]
- Pedersen, S.F.; Owsianik, G.; Nilius, B. TRP Channels: An Overview. Cell Calcium 2005, 38, 233–252. [Google Scholar] [CrossRef]
- Paltauf-Doburzynska, J.; Frieden, M.; Spitaler, M.; Graier, W.F. Histamine-induced Ca2+ Oscillations in a Human Endothelial Cell Line Depend on Transmembrane Ion Flux, Ryanodine Receptors and Endoplasmic Reticulum Ca2+-ATPase. J. Physiol. 2000, 524, 701–713. [Google Scholar] [CrossRef]
- Baczkó, I.; Giles, W.R.; Light, P.E. Resting Membrane Potential Regulates Na+–Ca2+ Exchange-Mediated Ca2+ Overload during Hypoxia–Reoxygenation in Rat Ventricular Myocytes. J. Physiol. 2003, 550, 889–898. [Google Scholar] [CrossRef]
- Eder, P.; Probst, D.; Rosker, C.; Poteser, M.; Wolinski, H.; Kohlwein, S.D.; Romanin, C.; Groschner, K. Phospholipase C-Dependent Control of Cardiac Calcium Homeostasis Involves a TRPC3-NCX1 Signaling Complex. Cardiovasc. Res. 2007, 73, 111–119. [Google Scholar] [CrossRef]
- Rutter, G.A.; Diggle, T.A.; Denton, R.M. Regulation of Pyruvate Dehydrogenase by Insulin and Polyamines within Electropermeabilized Fat-Cells and Isolated Mitochondria. Biochem J. 1992, 285, 435–439. [Google Scholar] [CrossRef]
- McCormack, J.G.; Denton, R.M. Role of Ca2+ Ions in the Regulation of Intramitochondrial Metabolism in Rat Heart. Evidence from Studies with Isolated Mitochondria That Adrenaline Activates the Pyruvate Dehydrogenase and 2-Oxoglutarate Dehydrogenase Complexes by Increasing the Intramitochondrial Concentration of Ca2+. Biochem J. 1984, 218, 235–247. [Google Scholar] [CrossRef]
- Griffiths, E.J.; Rutter, G.A. Mitochondrial Calcium as a Key Regulator of Mitochondrial ATP Production in Mammalian Cells. Biochim. Et. Biophys. Acta Bba-Bioenerg. 2009, 1787, 1324–1333. [Google Scholar] [CrossRef]
- Rutter, G.A.; McCormack, J.G.; Midgley, P.J.W.; Denton, R.M. The Role of Ca2+ in the Hormonal Regulation of the Activities of Pyruvate Dehydrogenase and Oxoglutarate Dehydrogenase Complexes. Ann. Ny. Acad. Sci. 1989, 573, 206–217. [Google Scholar] [CrossRef]
- Rutter, G.A.; McCormack, J.G.; Halestrap, A.P.; Denton, R.M. The Roles of Cytosolic and Intramitochondrial Ca2+ and the Mitochondrial Ca2+-Uniporter (MCU) in the Stimulation of Mammalian Oxidative Phosphorylation. J. Biol. Chem. 2020, 295, 10506–10506. [Google Scholar] [CrossRef]
- Albert, A.P.; Pucovský, V.; Prestwich, S.A.; Large, W.A. TRPC3 Properties of a Native Constitutively Active Ca2+-permeable Cation Channel in Rabbit Ear Artery Myocytes. J. Physiol. 2006, 571, 361–369. [Google Scholar] [CrossRef]
- Chen, X.; Chu, F.; Sunchen, S.; Li, J.; Zhang, M.; Xu, F.; Dong, H. TRPV4 Couples with NCX1 to Mediate Glucose-dependent Glucagon-like Peptide-1 Release and Improve Glucose Homeostasis. J. Physiol. 2024, 602, 6827–6847. [Google Scholar] [CrossRef]
- Hofmann, T.; Obukhov, A.G.; Schaefer, M.; Harteneck, C.; Gudermann, T.; Schultz, G. Direct Activation of Human TRPC6 and TRPC3 Channels by Diacylglycerol. Nature 1999, 397, 16711. [Google Scholar] [CrossRef]
- Hellman, B.; Gylfe, E.; Berggren, P.-O.; Andersson, T.; Abrahamsson, H.; Rorsman, P.; Betsholtz, C. Ca2+ Transport in Pancreatic β-Cells during Glucose Stimulation of Insulin Secretion. Upsala J. Méd. Sci. 1980, 85, 259–263. [Google Scholar] [CrossRef]
- Zhang, J.; Wei, Y.; Bai, S.; Ding, S.; Gao, H.; Yin, S.; Chen, S.; Lu, J.; Wang, H.; Shen, Y.; et al. TRPV4 Complexes With the Na+/Ca2+ Exchanger and IP3 Receptor 1 to Regulate Local Intracellular Calcium and Tracheal Tension in Mice. Front. Physiol. 2019, 10, 1471. [Google Scholar] [CrossRef]
- Rached, G.; Saliba, Y.; Maddah, D.; Hajal, J.; Smayra, V.; Bakhos, J.; Groschner, K.; Birnbaumer, L.; Fares, N. TRPC3 Regulates Islet Beta-Cell Insulin Secretion. Adv. Sci. 2023, 10, 2204846. [Google Scholar] [CrossRef]
- Billert, M.; Skrzypski, M.; Sassek, M.; Szczepankiewicz, D.; Wojciechowicz, T.; Mergler, S.; Strowski, M.Z.; Nowak, K.W. TRPV4 Regulates Insulin mRNA Expression and INS-1E Cell Death via ERK1/2 and NO-Dependent Mechanisms. Cell. Signal. 2017, 35, 242–249. [Google Scholar] [CrossRef]
- Affourtit, C.; Alberts, B.; Barlow, J.; Carré, J.E.; Wynne, A.G. Control of Pancreatic β-Cell Bioenergetics. Biochem. Soc. Trans. 2018, 46, 555–564. [Google Scholar] [CrossRef]
- Nieves, A.M.R.; Wauford, B.M.; Fu, A. Mitochondrial Bioenergetics, Metabolism, and beyond in Pancreatic β-Cells and Diabetes. Front. Mol. Biosci. 2024, 11, 1354199. [Google Scholar] [CrossRef]
- Koshenov, Z.; Oflaz, F.E.; Hirtl, M.; Gottschalk, B.; Rost, R.; Malli, R.; Graier, W.F. Citrin Mediated Metabolic Rewiring in Response to Altered Basal Subcellular Ca2+ Homeostasis. Commun. Biol. 2022, 5, 76. [Google Scholar] [CrossRef]
Figure 1.
ER Ca²⁺ refilling depends on extracellular Ca²⁺ and the inhibition of TRPC3, TRPV4, but not ORAI1, reduces ER Ca²⁺ refilling. (A) Left panel: Representative D1ER FRET traces showing endoplasmic reticulum (ER) Ca2+ dynamics during preincubation in 2 mM Ca2+ 138 mM Na+ (dark blue dashed line) or 0 mM Ca2+ 138 mM Na+ (cyan dashed line). Right panel: Bar graphs show the ER Ca2+ content after 40 minutes of preincubation in 2 mM Ca2+ (blue) and 0 mM Ca2+ (cyan). Data points represent the mean +/- SEM (n for 2mM = 53/6; n for 0mM = 50/6). Significant differences were assessed with an unpaired Student’s t-test (*p < 0.05). (B) Average D1ER FRET traces showing ER Ca2+ dynamics in 2 mM Ca2+ + DMSO (blue), 0 mM Ca2+ + DMSO (cyan), and 2 mM Ca2+ + Pyr6 (orange). (C) Average D1ER FRET traces showing ER Ca2+ dynamics in 2 mM Ca2+ + DMSO (blue), 0 mM Ca2+ + DMSO (cyan), and 2 mM Ca2+ + Pyr10 (green). (D) Average D1ER FRET traces showing ER Ca2+ dynamics in 2 mM Ca2+ + DMSO (blue), 0 mM Ca2+ + DMSO (cyan), and 2 mM Ca2+ + HC-067047 (purple). (E) Bar graphs show the summary quantification of ER Ca2+ content after 40 minutes of preincubation with indicated inhibitors. Data points represent mean +/- SEM (n for 2 mM Ca2+ + DMSO = 42/6; n for 0 mM Ca2+ + DMSO = 67/6; n for 2 mM Ca2+ + Pyr10 = 86/6; n for 2 mM Ca2+ + HC-067047 = 83/6; n for 2 mM Ca2+ + Pyr6 = 59/6). Significant differences were assessed using one-way ANOVA with Bonferroni post-hoc test (*p < 0.05 versus control).
Figure 1.
ER Ca²⁺ refilling depends on extracellular Ca²⁺ and the inhibition of TRPC3, TRPV4, but not ORAI1, reduces ER Ca²⁺ refilling. (A) Left panel: Representative D1ER FRET traces showing endoplasmic reticulum (ER) Ca2+ dynamics during preincubation in 2 mM Ca2+ 138 mM Na+ (dark blue dashed line) or 0 mM Ca2+ 138 mM Na+ (cyan dashed line). Right panel: Bar graphs show the ER Ca2+ content after 40 minutes of preincubation in 2 mM Ca2+ (blue) and 0 mM Ca2+ (cyan). Data points represent the mean +/- SEM (n for 2mM = 53/6; n for 0mM = 50/6). Significant differences were assessed with an unpaired Student’s t-test (*p < 0.05). (B) Average D1ER FRET traces showing ER Ca2+ dynamics in 2 mM Ca2+ + DMSO (blue), 0 mM Ca2+ + DMSO (cyan), and 2 mM Ca2+ + Pyr6 (orange). (C) Average D1ER FRET traces showing ER Ca2+ dynamics in 2 mM Ca2+ + DMSO (blue), 0 mM Ca2+ + DMSO (cyan), and 2 mM Ca2+ + Pyr10 (green). (D) Average D1ER FRET traces showing ER Ca2+ dynamics in 2 mM Ca2+ + DMSO (blue), 0 mM Ca2+ + DMSO (cyan), and 2 mM Ca2+ + HC-067047 (purple). (E) Bar graphs show the summary quantification of ER Ca2+ content after 40 minutes of preincubation with indicated inhibitors. Data points represent mean +/- SEM (n for 2 mM Ca2+ + DMSO = 42/6; n for 0 mM Ca2+ + DMSO = 67/6; n for 2 mM Ca2+ + Pyr10 = 86/6; n for 2 mM Ca2+ + HC-067047 = 83/6; n for 2 mM Ca2+ + Pyr6 = 59/6). Significant differences were assessed using one-way ANOVA with Bonferroni post-hoc test (*p < 0.05 versus control).
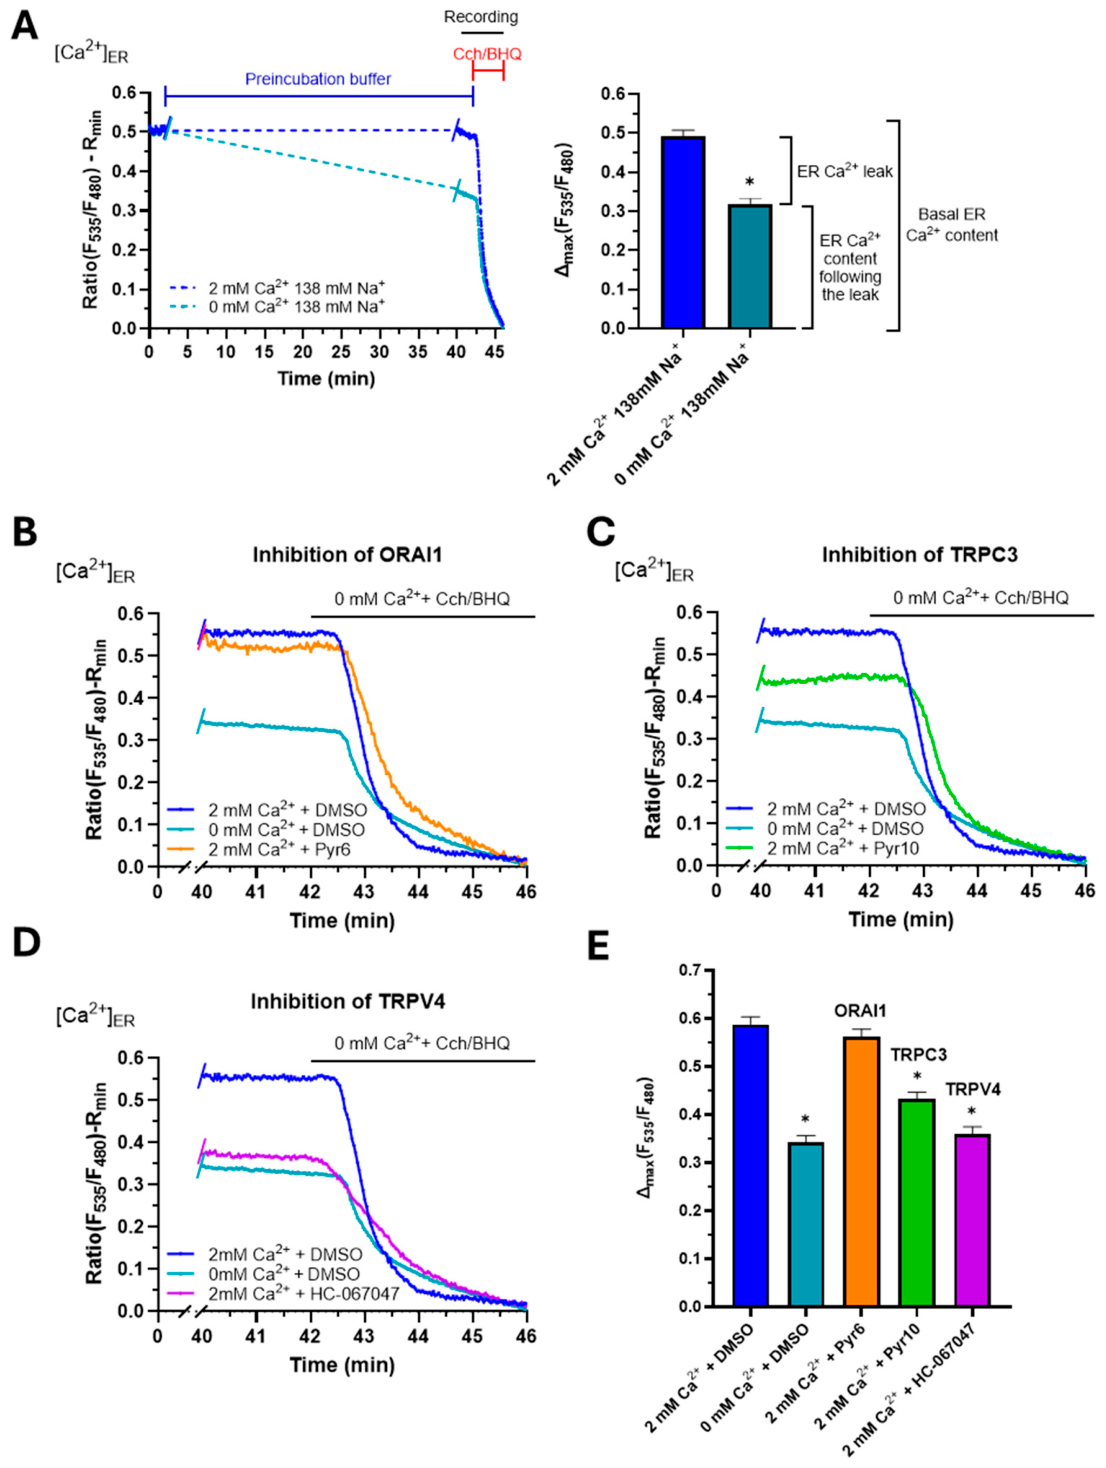
Figure 2.
ER Ca²⁺ refilling depends on extracellular Na⁺ and NCX reverse mode activity. (A) Left panel: Average D1ER FRET traces showing ER Ca2+ dynamics in 138 mM Na+ (blue) or 19 mM Na+ (yellow). Right panel: Bar graphs show the ER Ca2+ content after 40 minutes of preincubation. Data points represent mean +/- SEM (n for 138Na = 53/6; n for 19Na = 42/6). (B) Left panel: Average D1ER FRET traces showing ER Ca2+ dynamics in 2 mM Ca2+ + DMSO (blue), 0 mM Ca2+ + DMSO (cyan), and 2 mM Ca2+ + KB-R7943 (red). Right panel: Bar graphs show the ER Ca2+ content after preincubation. Data points represent mean +/- SEM (n for 2 mM Ca2+ + DMSO = 53/6; n for 0 mM Ca2+ + DMSO = 50/6; n for 2 mM Ca2+ + KB-R7943 = 61/6). Significant differences were assessed with unpaired Student’s t-test for (A) and one-way ANOVA for (B) (*p < 0.05). (C) Schematic representation of the proposed mechanism: low Na+ prevents SERCA refilling (left), while normal Na+ fuels NCX reverse mode to allow refilling (right).
Figure 2.
ER Ca²⁺ refilling depends on extracellular Na⁺ and NCX reverse mode activity. (A) Left panel: Average D1ER FRET traces showing ER Ca2+ dynamics in 138 mM Na+ (blue) or 19 mM Na+ (yellow). Right panel: Bar graphs show the ER Ca2+ content after 40 minutes of preincubation. Data points represent mean +/- SEM (n for 138Na = 53/6; n for 19Na = 42/6). (B) Left panel: Average D1ER FRET traces showing ER Ca2+ dynamics in 2 mM Ca2+ + DMSO (blue), 0 mM Ca2+ + DMSO (cyan), and 2 mM Ca2+ + KB-R7943 (red). Right panel: Bar graphs show the ER Ca2+ content after preincubation. Data points represent mean +/- SEM (n for 2 mM Ca2+ + DMSO = 53/6; n for 0 mM Ca2+ + DMSO = 50/6; n for 2 mM Ca2+ + KB-R7943 = 61/6). Significant differences were assessed with unpaired Student’s t-test for (A) and one-way ANOVA for (B) (*p < 0.05). (C) Schematic representation of the proposed mechanism: low Na+ prevents SERCA refilling (left), while normal Na+ fuels NCX reverse mode to allow refilling (right).
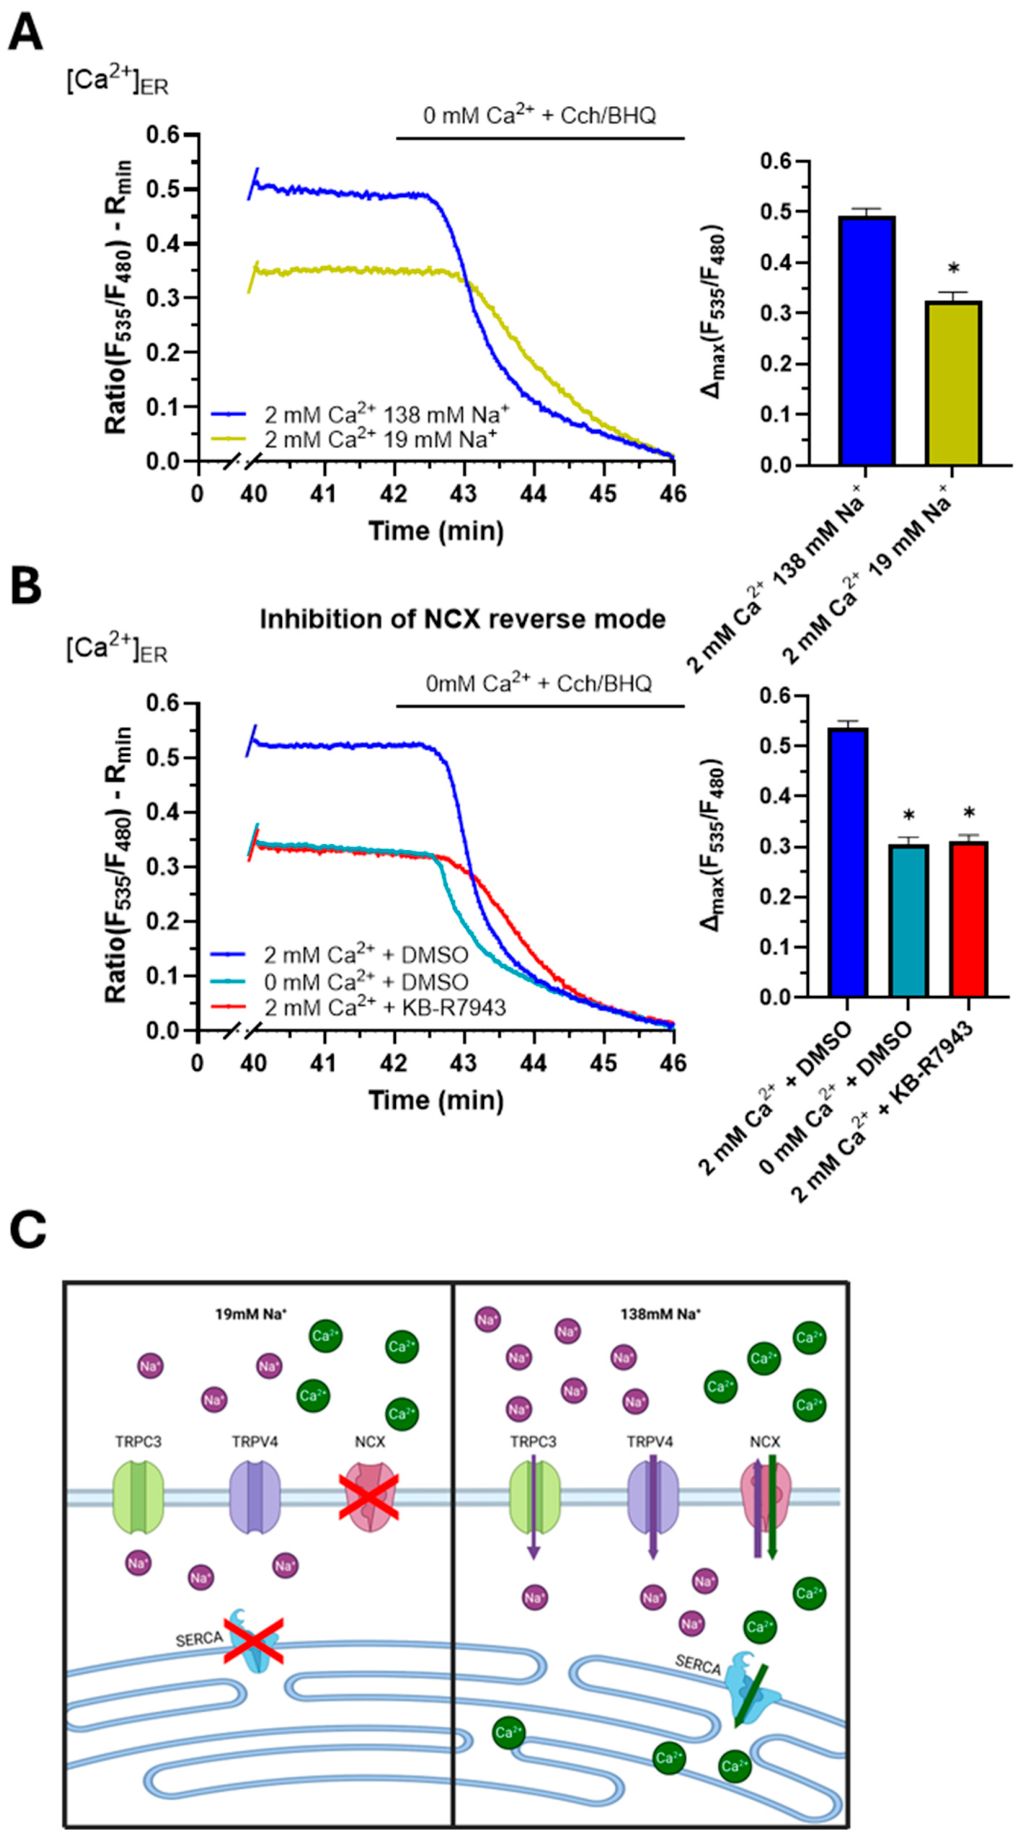
Figure 3.
Inhibition of TRPC3 and TRPV4, reduces Ca²⁺ signal in subplasmalemmal region after partial ER depletion in 0mM Ca2+. Representative temporal traces of subplasmalemmal Ca2+ concentration expressed as fluorescence intensity normalized to the basal (F/F0) in (A) DMSO, (B) Pyr10, and (C) HC-067047. Protocols indicate transitions from 2 mM to 0 mM Ca2+ followed by Ca2+ restoration. (D) Bar graphs show the maximum Ca2+ amplitude during the refilling phase. Data points represent mean +/- SEM (n for DMSO = 68/6; n for Pyr10 = 92/6; n for HC-067047 = 121/6). Significant differences were assessed using one-way ANOVA with Bonferroni post-hoc test (*p < 0.05 versus control).
Figure 3.
Inhibition of TRPC3 and TRPV4, reduces Ca²⁺ signal in subplasmalemmal region after partial ER depletion in 0mM Ca2+. Representative temporal traces of subplasmalemmal Ca2+ concentration expressed as fluorescence intensity normalized to the basal (F/F0) in (A) DMSO, (B) Pyr10, and (C) HC-067047. Protocols indicate transitions from 2 mM to 0 mM Ca2+ followed by Ca2+ restoration. (D) Bar graphs show the maximum Ca2+ amplitude during the refilling phase. Data points represent mean +/- SEM (n for DMSO = 68/6; n for Pyr10 = 92/6; n for HC-067047 = 121/6). Significant differences were assessed using one-way ANOVA with Bonferroni post-hoc test (*p < 0.05 versus control).
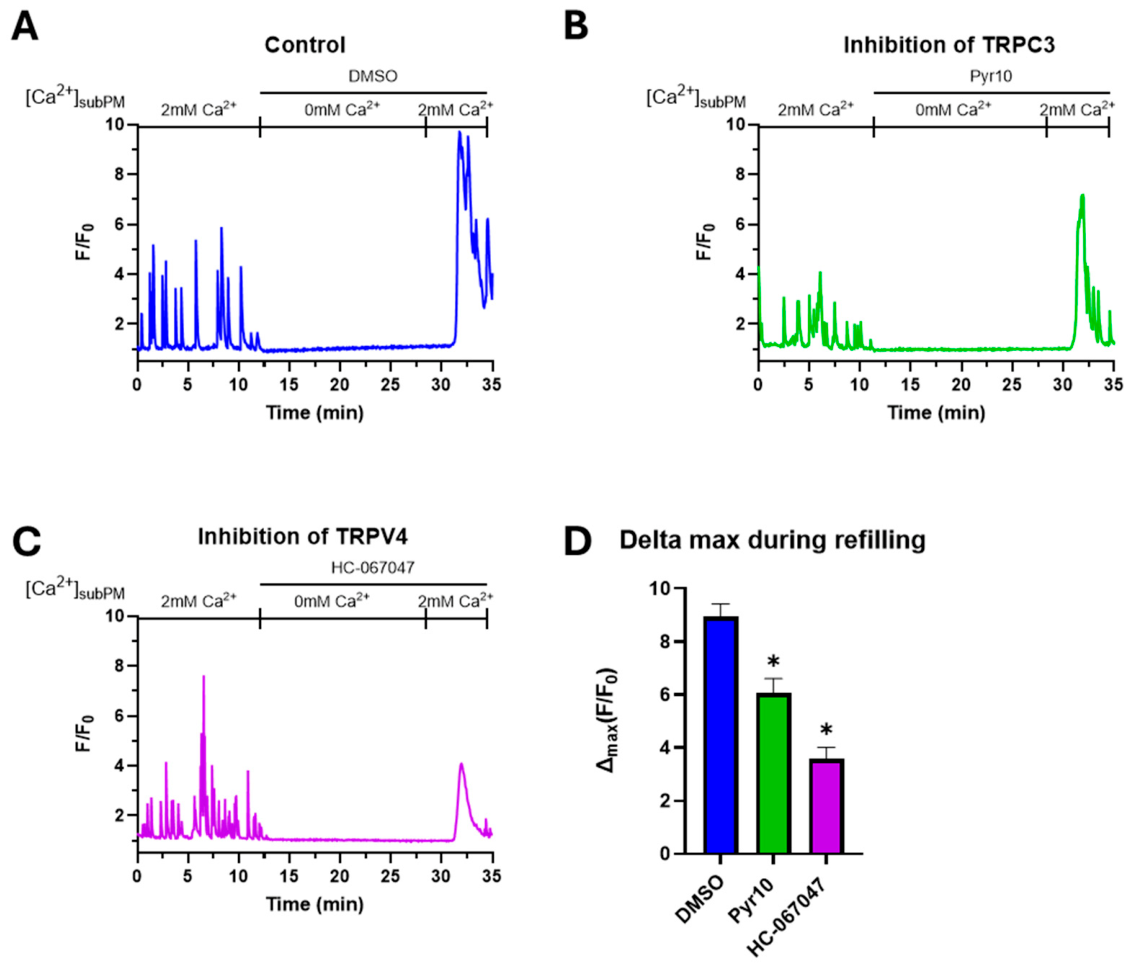
Figure 4.
Knockdown of TRPC3 and TRPV4, reduces Ca²⁺ signal in subplasmalemmal region after partial ER depletion in 0mM Ca2+. Representative temporal traces of subplasmalemmal Ca2+ concentration expressed as fluorescence intensity normalized to the basal (F/F0) in cells transfected with (A) siControl, (B) siTRPC3, or (C) siTRPV4. (D) Bar graphs show the number of Ca2+ oscillations in the basal state and (E) the maximum Ca2+ amplitude during the refilling phase. Data points represent mean +/- SEM (n for siControl = 109/6; n for siTRPC3 = 90/6; n for siTRPV4 = 98/6). Significant differences were assessed using one-way ANOVA with Bonferroni post-hoc test (*p < 0.05 versus control).
Figure 4.
Knockdown of TRPC3 and TRPV4, reduces Ca²⁺ signal in subplasmalemmal region after partial ER depletion in 0mM Ca2+. Representative temporal traces of subplasmalemmal Ca2+ concentration expressed as fluorescence intensity normalized to the basal (F/F0) in cells transfected with (A) siControl, (B) siTRPC3, or (C) siTRPV4. (D) Bar graphs show the number of Ca2+ oscillations in the basal state and (E) the maximum Ca2+ amplitude during the refilling phase. Data points represent mean +/- SEM (n for siControl = 109/6; n for siTRPC3 = 90/6; n for siTRPV4 = 98/6). Significant differences were assessed using one-way ANOVA with Bonferroni post-hoc test (*p < 0.05 versus control).
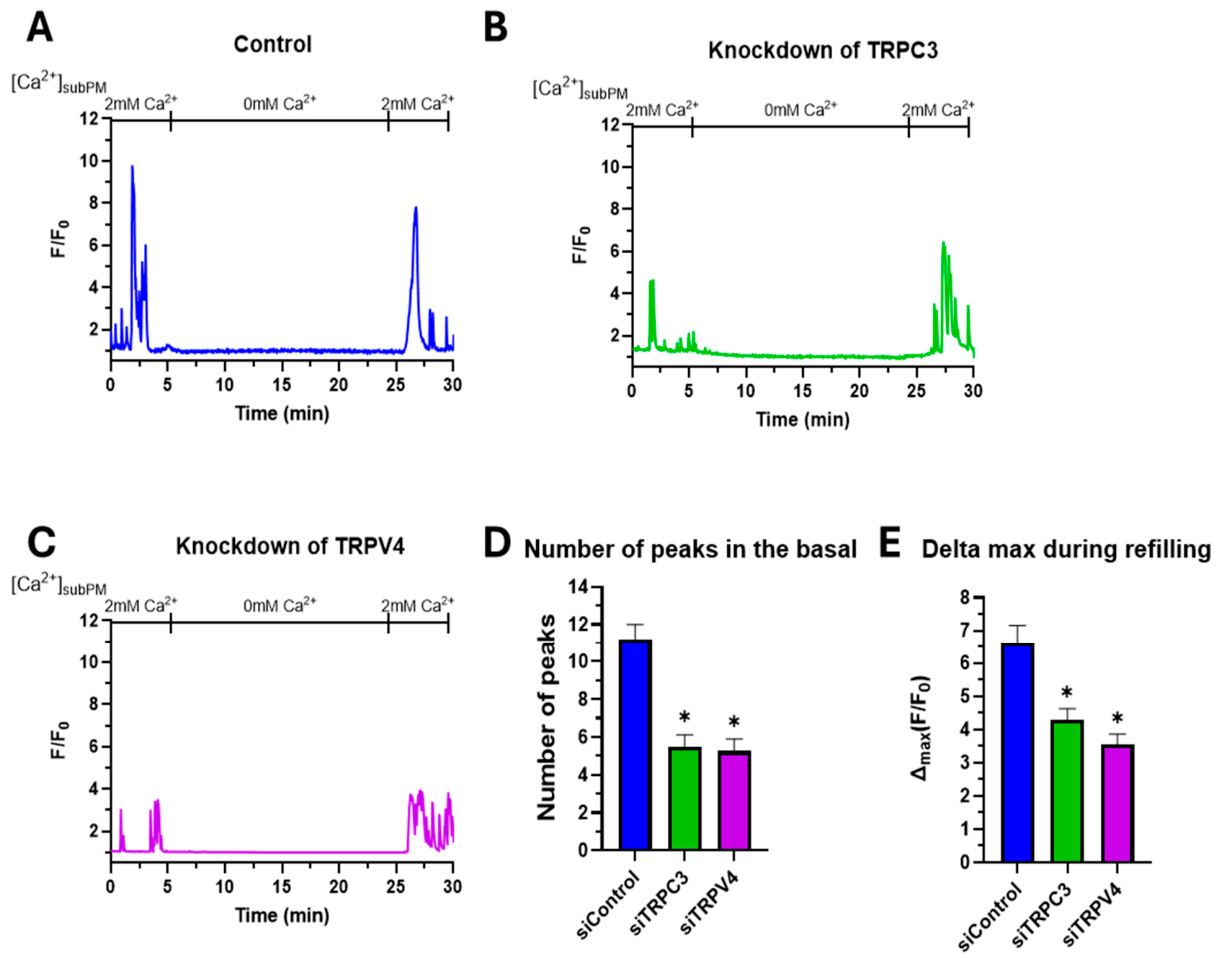
Figure 5.
Inhibition of NCX reverse mode, but not ORAI1, reduces Ca²⁺ signal in subplasmalemmal region after partial ER depletion in 0mM Ca2+. Representative temporal traces of subplasmalemmal Ca2+ concentration expressed as fluorescence intensity normalized to the basal (F/F0) in (A) Control (DMSO), (B) KB-R7943, and (C) Pyr6 treated cells. (D) Bar graphs show the maximum Ca2+ amplitude during the refilling phase. Data points represent mean +/- SEM (n for DMSO = 115/6; n for KB-R7943 = 91/6; n for Pyr6 = 83/6). Significant differences were assessed using one-way ANOVA with Bonferroni post-hoc test (*p < 0.05). (E) Schematic illustration of the TRPC3/TRPV4 and NCX reverse mode pathway compared to ORAI1 inhibition.
Figure 5.
Inhibition of NCX reverse mode, but not ORAI1, reduces Ca²⁺ signal in subplasmalemmal region after partial ER depletion in 0mM Ca2+. Representative temporal traces of subplasmalemmal Ca2+ concentration expressed as fluorescence intensity normalized to the basal (F/F0) in (A) Control (DMSO), (B) KB-R7943, and (C) Pyr6 treated cells. (D) Bar graphs show the maximum Ca2+ amplitude during the refilling phase. Data points represent mean +/- SEM (n for DMSO = 115/6; n for KB-R7943 = 91/6; n for Pyr6 = 83/6). Significant differences were assessed using one-way ANOVA with Bonferroni post-hoc test (*p < 0.05). (E) Schematic illustration of the TRPC3/TRPV4 and NCX reverse mode pathway compared to ORAI1 inhibition.
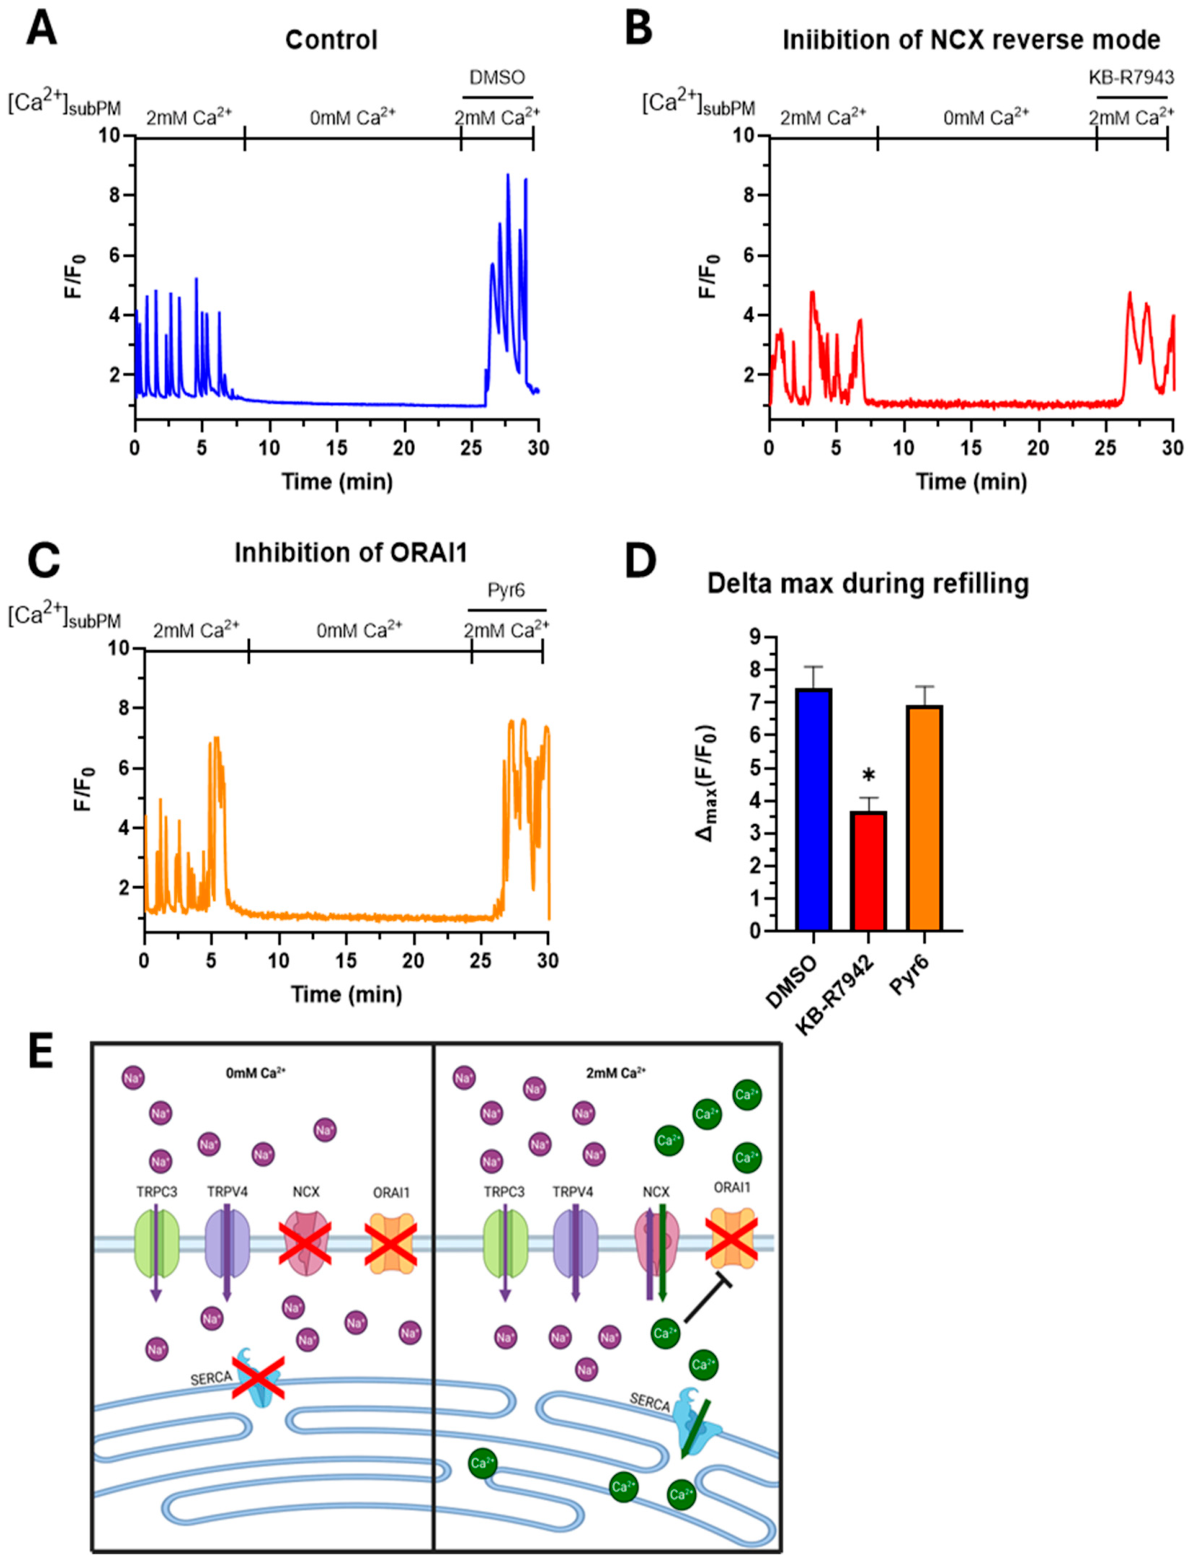
Figure 6.
Knockdown of NCX2 but not NCX1, reduces Ca²⁺ signal in subplasmalemmal region after partial ER depletion in 0mM Ca2+. Representative temporal traces of subplasmalemmal Ca2+ concentration expressed as fluorescence intensity normalized to the basal (F/F0) in cells transfected with (A) siControl, (B) siNCX1, or (C) siNCX2. (D) Bar graphs show the number of Ca2+ oscillations in the basal state and (E) the maximum Ca2+ amplitude during the refilling phase. Data points represent mean +/- SEM (n for siControl = 177/6; n for siNCX1 = 121/6; n for siNCX2 = 144/6). (F) Relative expression level of NCX1, NCX2 and NCX3 in INS1 cells (n = 9/3). Significant differences were assessed using one-way ANOVA with Bonferroni post-hoc test (*p < 0.05 versus control).
Figure 6.
Knockdown of NCX2 but not NCX1, reduces Ca²⁺ signal in subplasmalemmal region after partial ER depletion in 0mM Ca2+. Representative temporal traces of subplasmalemmal Ca2+ concentration expressed as fluorescence intensity normalized to the basal (F/F0) in cells transfected with (A) siControl, (B) siNCX1, or (C) siNCX2. (D) Bar graphs show the number of Ca2+ oscillations in the basal state and (E) the maximum Ca2+ amplitude during the refilling phase. Data points represent mean +/- SEM (n for siControl = 177/6; n for siNCX1 = 121/6; n for siNCX2 = 144/6). (F) Relative expression level of NCX1, NCX2 and NCX3 in INS1 cells (n = 9/3). Significant differences were assessed using one-way ANOVA with Bonferroni post-hoc test (*p < 0.05 versus control).
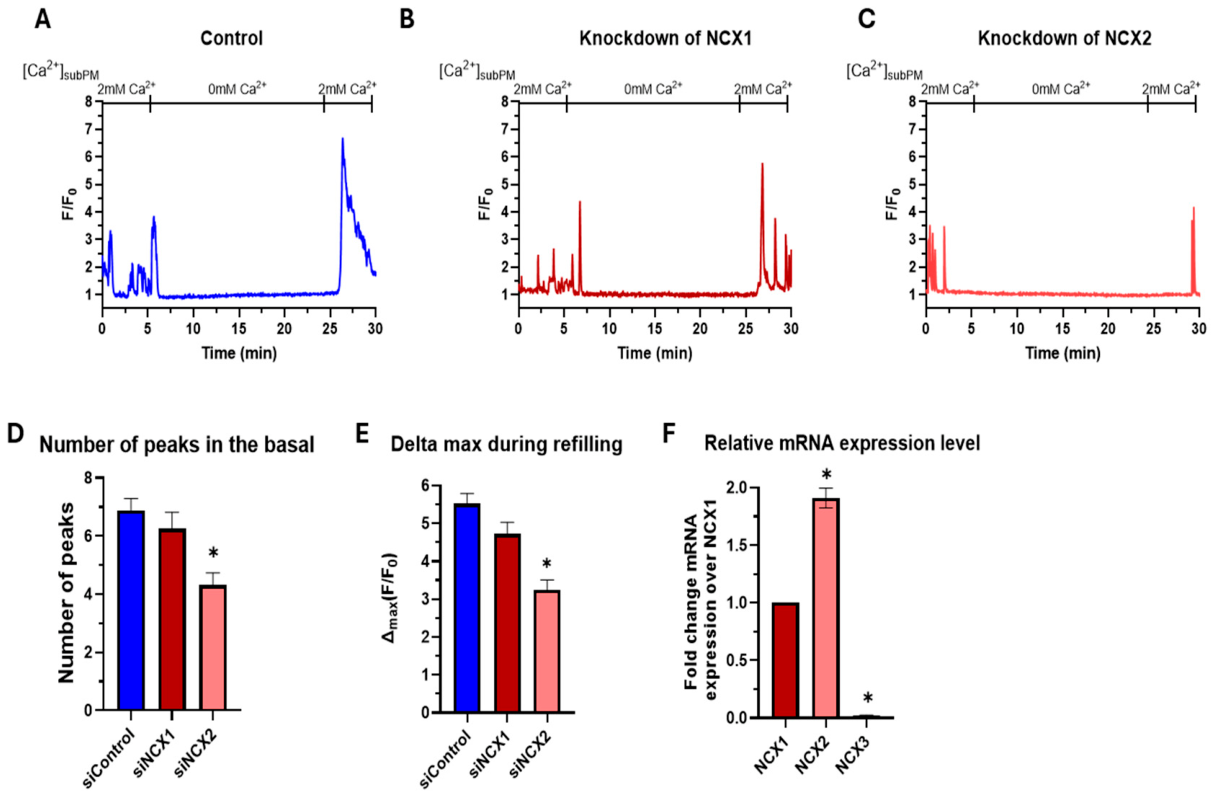
Figure 7.
NCX and TRP channels are required to maintain glucose-induced cytosolic Ca²⁺ oscillations. Representative cytosolic Ca2+ traces measured with Fluo-4 AM in INS-1 cells stimulated with 16 mM glucose under (A) control (blue), (B) KB-R7943 (red), (C) Pyr10 (green), and (D) HC-067047 (purple) conditions. (E) Bar graphs show the Ca2+ oscillation number during glucose stimulation. Data points represent mean +/- SEM (n for Control = 164/6; n for KB-R7943 = 261/6; n for Pyr10 = 279/6; n for HC-067047 = 271/6). Significant differences were assessed using one-way ANOVA with Bonferroni post-hoc test (*p < 0.05 versus control).
Figure 7.
NCX and TRP channels are required to maintain glucose-induced cytosolic Ca²⁺ oscillations. Representative cytosolic Ca2+ traces measured with Fluo-4 AM in INS-1 cells stimulated with 16 mM glucose under (A) control (blue), (B) KB-R7943 (red), (C) Pyr10 (green), and (D) HC-067047 (purple) conditions. (E) Bar graphs show the Ca2+ oscillation number during glucose stimulation. Data points represent mean +/- SEM (n for Control = 164/6; n for KB-R7943 = 261/6; n for Pyr10 = 279/6; n for HC-067047 = 271/6). Significant differences were assessed using one-way ANOVA with Bonferroni post-hoc test (*p < 0.05 versus control).
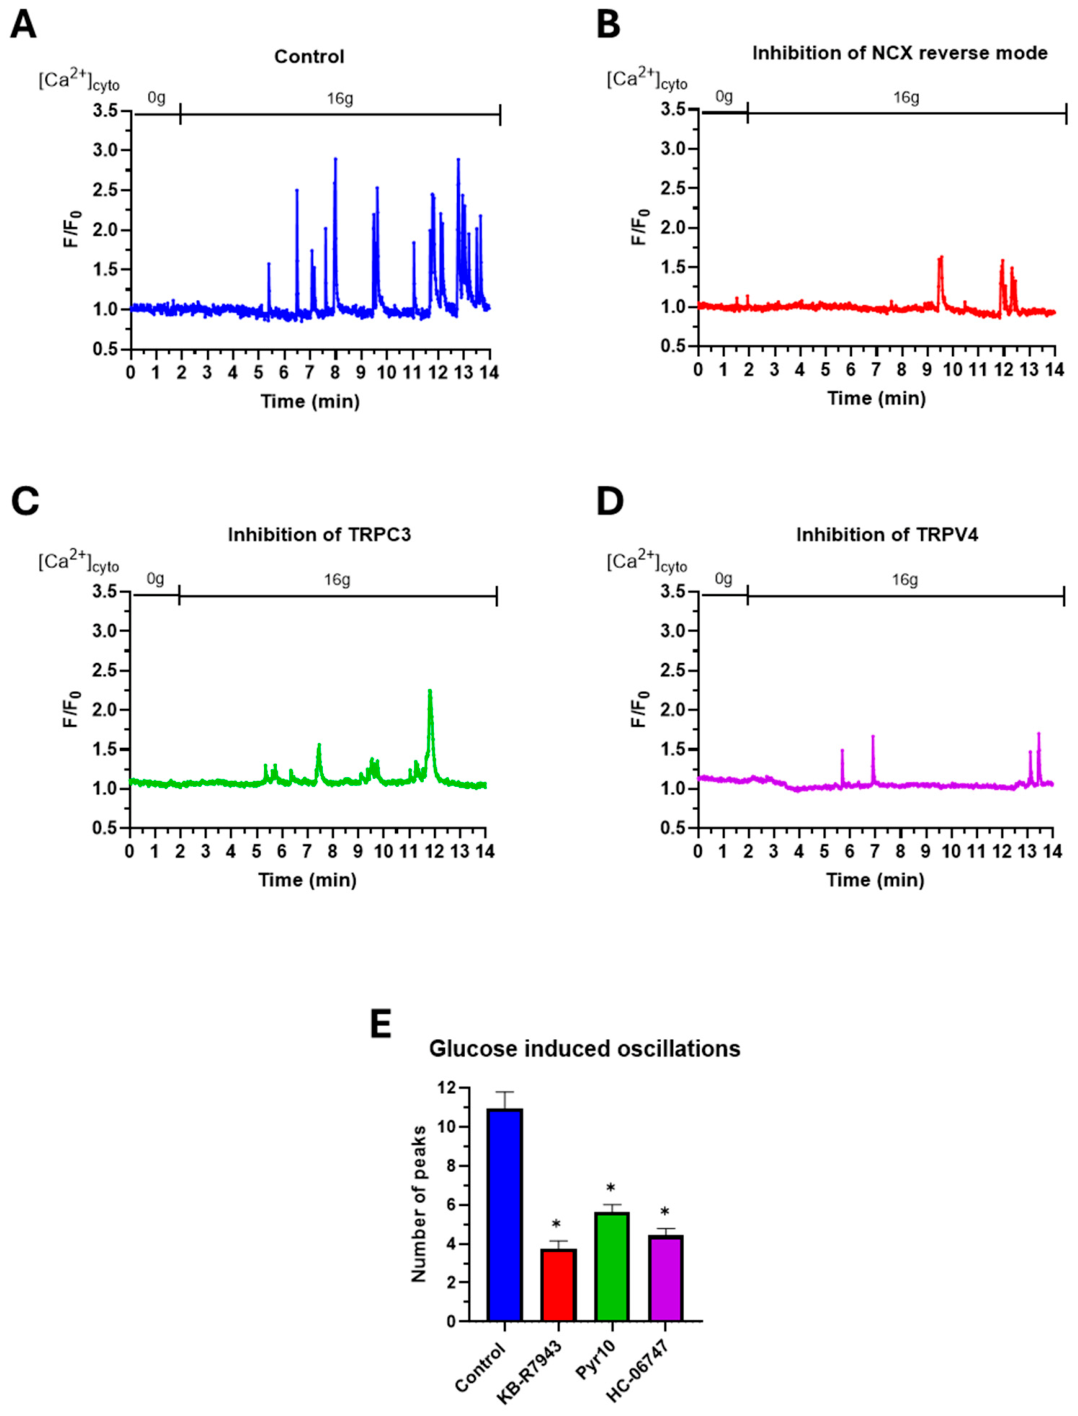
Figure 8.
NCX and TRP channel activity are required to sustain mitochondrial respiration in INS-1 β-cells. (A) Average Seahorse XF96 traces showing oxygen consumption rates (OCR) of INS-1 cells under control (blue), KB-R7943 (red), Pyr10 (green), and HC-067047 (purple) conditions. Dashed lines indicate injections of Oligomycin, FCCP, and Antimycin A. (B) Bar graphs show basal respiration and (C) maximal respiration levels. Data points represent mean +/- SEM (n is greater than or equal to 6 independent experiments). Significant differences were assessed with one-way ANOVA with Bonferroni post-hoc test (*p < 0.05 versus control).
Figure 8.
NCX and TRP channel activity are required to sustain mitochondrial respiration in INS-1 β-cells. (A) Average Seahorse XF96 traces showing oxygen consumption rates (OCR) of INS-1 cells under control (blue), KB-R7943 (red), Pyr10 (green), and HC-067047 (purple) conditions. Dashed lines indicate injections of Oligomycin, FCCP, and Antimycin A. (B) Bar graphs show basal respiration and (C) maximal respiration levels. Data points represent mean +/- SEM (n is greater than or equal to 6 independent experiments). Significant differences were assessed with one-way ANOVA with Bonferroni post-hoc test (*p < 0.05 versus control).
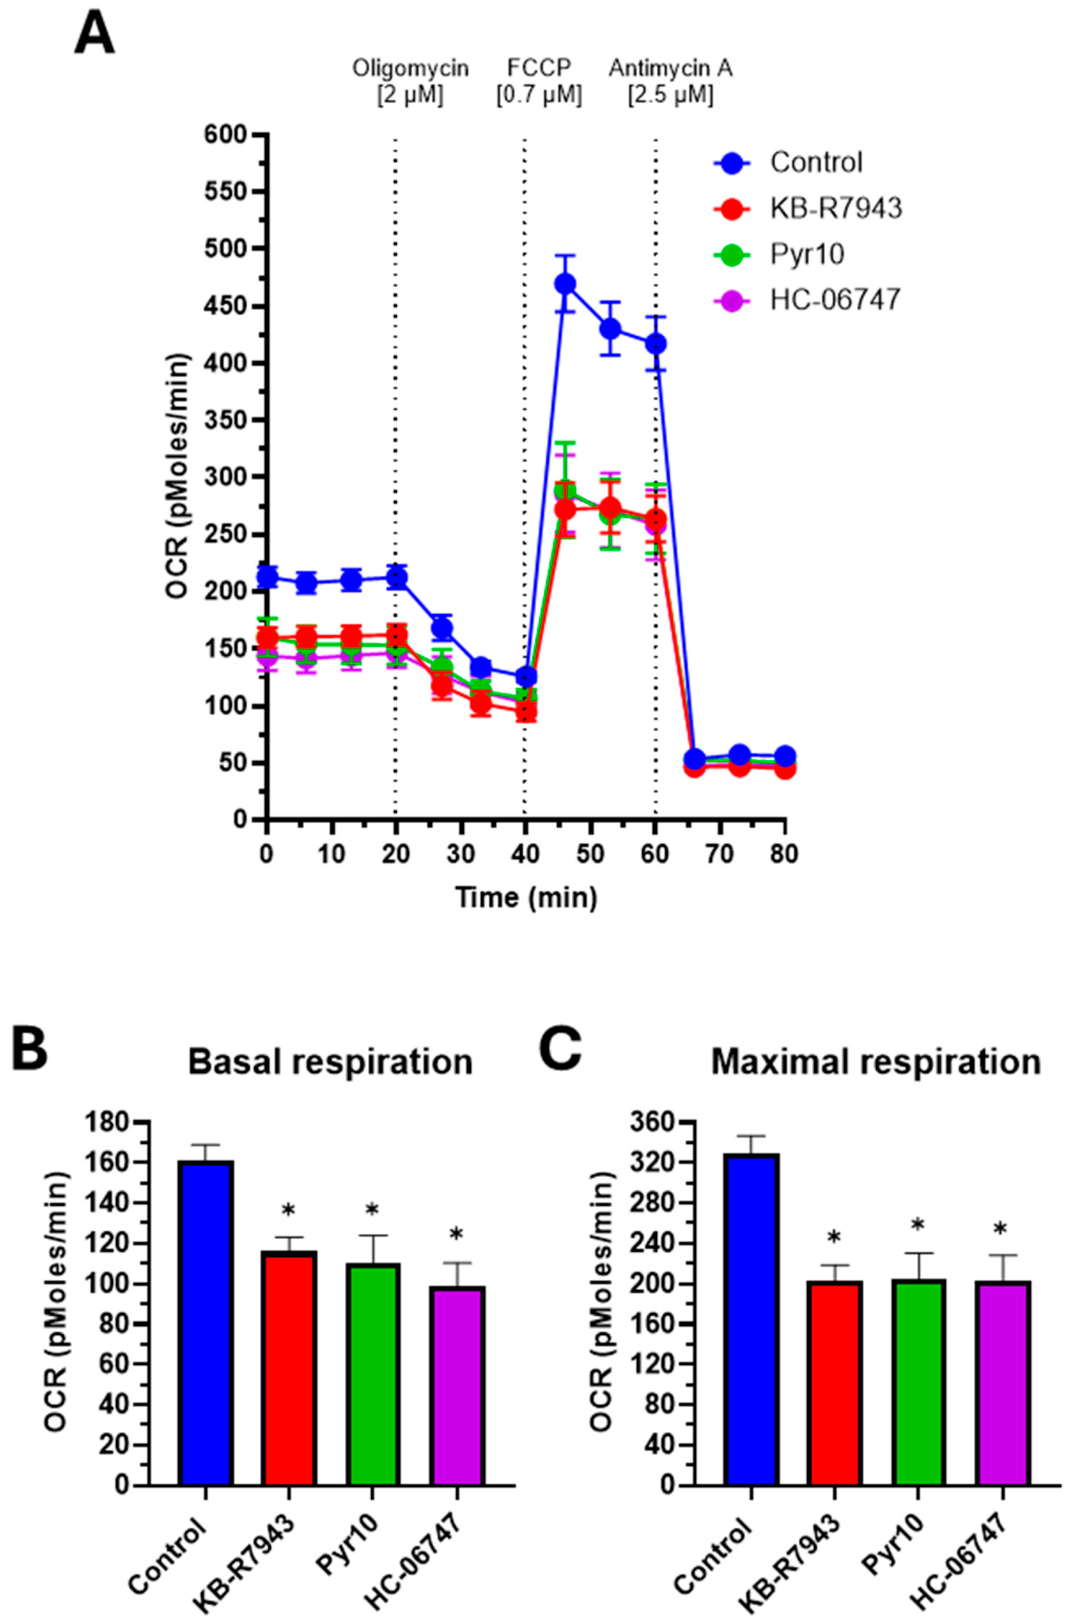
Figure 9.
NCX and TRP channels regulate first-phase glucose-stimulated insulin secretion in INS-1 β-cells. (A) Time-dependent insulin secretion rate (nanograms per milliliter per minute) and (B) cumulative secreted insulin (nanograms per milliliter) under control (blue), KB-R7943 (red), Pyr10 (green), and HC-067047 (purple) conditions. (C) Bar graphs show the first-phase insulin secretion rate (10–20 min) and (D) second-phase insulin secretion rate (20–45 min). Data points represent mean +/- SEM (n is greater than or equal to 4). Significant differences were assessed using one-way ANOVA with Bonferroni post-hoc test (*p < 0.05 versus control). (E) Schematic model of the TRPs–NCX2 relay maintaining beta-cell glucose sensitivity and ER-mitochondria bioenergetics.
Figure 9.
NCX and TRP channels regulate first-phase glucose-stimulated insulin secretion in INS-1 β-cells. (A) Time-dependent insulin secretion rate (nanograms per milliliter per minute) and (B) cumulative secreted insulin (nanograms per milliliter) under control (blue), KB-R7943 (red), Pyr10 (green), and HC-067047 (purple) conditions. (C) Bar graphs show the first-phase insulin secretion rate (10–20 min) and (D) second-phase insulin secretion rate (20–45 min). Data points represent mean +/- SEM (n is greater than or equal to 4). Significant differences were assessed using one-way ANOVA with Bonferroni post-hoc test (*p < 0.05 versus control). (E) Schematic model of the TRPs–NCX2 relay maintaining beta-cell glucose sensitivity and ER-mitochondria bioenergetics.
Disclaimer/Publisher’s Note: The statements, opinions and data contained in all publications are solely those of the individual author(s) and contributor(s) and not of MDPI and/or the editor(s). MDPI and/or the editor(s) disclaim responsibility for any injury to people or property resulting from any ideas, methods, instructions or products referred to in the content. |
© 2026 by the authors. Licensee MDPI, Basel, Switzerland. This article is an open access article distributed under the terms and conditions of the Creative Commons Attribution (CC BY) license (http://creativecommons.org/licenses/by/4.0/).
Copyright: This open access article is published under a Creative Commons CC BY 4.0 license, which permit the free download, distribution, and reuse, provided that the author and preprint are cited in any reuse.