

Submitted:
21 August 2026
Posted:
24 August 2026
You are already at the latest version
Abstract
Transcriptomic biomarkers associated with response to immune-checkpoint blockade remain incompletely defined, particularly across tumour types. We developed Myeloid–Adaptive Response to Atezolizumab (MARTA), a two-gene transcriptomic score integrating CXCL13 and CXCL8 expression. Candidate-gene selection was performed in 81 patients receiving atezolizumab monotherapy in IMmotion150, after which MARTA was evaluated across treatment groups and independently assessed in IMvigor210. In IMmotion150, a higher MARTA score was associated with higher objective response rate (ORR) with atezolizumab alone (odds ratio [OR], 3.20; 95% confidence interval [CI], 1.42–7.19) and atezolizumab plus bevacizumab (OR, 2.61; 95% CI, 1.43–4.76), but not with sunitinib. A higher MARTA score was also associated with longer progression-free survival (PFS) in both atezolizumab-containing groups (hazard ratio [HR], 0.60 and 0.65, respectively), with no association in the sunitinib group; the association differed across treatments for PFS (P=0.01). In IMvigor210, a higher MARTA score was associated with higher ORR (OR per 1-standard-deviation increase, 1.38; 95% CI, 1.05–1.81) and longer overall survival (OS) (HR, 0.76; 95% CI, 0.67–0.86). The OS association remained after multivariate adjustment (HR, 0.80; 95% CI, 0.68–0.95). These findings support further evaluation of MARTA, but prospective validation and analytical reproducibility across platforms are required before clinical application.
Keywords:
atezolizumab
; immune-checkpoint blockade
; transcriptomic biomarker
; CXCL13
; CXCL8
1. Introduction
Immune-checkpoint inhibitors have substantially improved the treatment of several advanced malignancies, but clinical benefit varies considerably among patients, and robust predictive biomarkers remain limited [1,2]. PD-L1 expression is the most widely used tissue biomarker in this setting, although its predictive accuracy is modest and highly context-dependent [3]. Tumour mutational burden (TMB) has also been associated with response to checkpoint inhibition, but its clinical performance is influenced by tumour type, assay methodology, and the threshold used for its definition [4]. These limitations support the need for biomarkers that more directly reflect tumour biology and the immune microenvironment. Gene-expression profiling allows immune-related and tumour-associated transcriptional signatures to be assessed within the same specimen [5]. This approach may be particularly informative in renal-cell and urothelial carcinomas, where response to immune-checkpoint blockade appears to reflect distinct features of both the tumour and its immune microenvironment. In renal-cell carcinoma, transcriptomic analyses from the IMmotion trials identified distinct angiogenic, immune, and myeloid-associated molecular profiles associated with differential outcomes following immune-checkpoint and VEGF-targeted therapy [6,7]. In metastatic urothelial carcinoma, analysis of IMvigor210 showed that response to atezolizumab was associated with a CD8 T-effector phenotype, whereas stromal TGF-β signalling was linked to T-cell exclusion and treatment resistance [8]. Together, these findings support the development of composite transcriptional biomarkers that integrate antitumour immune activity with intrinsic tumour biology and the microenvironment. Among transcriptomic signatures evaluated in atezolizumab studies, the eight-gene T-effector gene-expression signature (tGE8) is one of the best characterised and reflects IFN-γ signalling and CD8+ effector T-cell activity [8,9]. Its association with response has subsequently been examined across tumour types, although its predictive performance has not been consistent [10]. T-cell–inflamed tumours are not uniformly sensitive to checkpoint inhibition, suggesting that T-effector signatures may not fully capture the biological heterogeneity associated with treatment outcome [10,11,12]. Moreover, relatively parsimonious transcriptional signatures have shown reproducible associations with checkpoint-inhibitor outcomes across multiple tumour types [11,13]. In this study, we developed MARTA, the Myeloid–Adaptive Response to Atezolizumab score, a two-gene transcriptomic score based on the relative expression of CXCL13 and CXCL8. MARTA was derived in the randomised IMmotion150 renal cell carcinoma dataset, where its added value beyond tGE8 was assessed. We subsequently evaluated MARTA in the independent IMvigor210 cohort of patients with metastatic urothelial carcinoma treated with atezolizumab. Our aim was to determine whether a simple transcriptional score could identify a reproducible signal associated with outcome during PD-L1 blockade across different clinical endpoints and tumour types.
2. Materials and Methods
2.1. Analysis Cohorts and Clinical Endpoints
We conducted a retrospective biomarker study using de-identified clinical and tumour transcriptomic data from IMmotion150 and IMvigor210. IMmotion150 was used for exploratory biomarker development and evaluation across treatment groups, whereas IMvigor210 served as an independent cross-tumour validation cohort. IMmotion150 [6] was a randomised phase 2 study in previously untreated metastatic renal-cell carcinoma, with patients assigned to sunitinib, atezolizumab monotherapy, or atezolizumab plus bevacizumab. IMvigor210 [14,15] was a phase 2 single-arm study of atezolizumab in patients with locally advanced or metastatic urothelial carcinoma. For the present analyses, patients with available pretreatment tumour transcriptomic data and the relevant clinical endpoints were included. Objective response rate (ORR) was derived from individual objective-response status recorded in the original trial data; for biomarker modelling, response status was analysed as a binary outcome. Progression-free survival (PFS) in IMmotion150 was measured from treatment assignment to disease progression or death, whichever occurred first. Overall survival (OS) in IMvigor210 was measured from treatment initiation to death from any cause. Patients without an event were censored at the last available follow-up.
2.2. MARTA Score Development
Gene-expression data were harmonised at the gene-symbol level. In IMmotion150, the publicly available transcripts-per-million (TPM) expression matrix from 263 molecularly evaluable tumours was transformed as log2(TPM + 1). The previously described tGE8 signature (IFNG, CXCL9, CD8A, GZMA, GZMB, CXCL10, PRF1, and TBX21) was reconstructed as the reference immune-expression comparator. A separate literature-informed exploratory panel of 44 genes with reported associations with sensitivity or resistance to immune-checkpoint blockade was assembled for candidate-gene selection, excluding genes included in tGE8 to avoid overlap (Table S1). Selection of candidate genes was restricted to IMmotion150 patients receiving atezolizumab monotherapy who were evaluable for ORR. Candidate genes were evaluated sequentially in logistic regression models containing continuous tGE8 and ranked according to the incremental likelihood-ratio statistic. This procedure was exploratory and intended for feature selection rather than formal hypothesis testing; no multiplicity-adjusted significance threshold was applied. To maintain focus on the evaluation of the final two-gene score and its external validation, intermediate gene-ranking results were not reported. MARTA was constructed using equal absolute weights for CXCL13 and CXCL8 rather than outcome-derived gene-specific coefficients. For each tumour, CXCL13 and CXCL8 expression was transformed as log2(TPM + 1) and standardised separately using the mean and population standard deviation (SD) of the IMmotion150 molecular cohort. MARTA was defined as the standardised difference between the gene-specific z scores:
MARTA = z[z(log2(TPM_CXCL13 + 1)) − z(log2(TPM_CXCL8 + 1))],
where z(X) denotes standardisation using the cohort mean and population SD. For exact reproduction of the IMmotion150 implementation, the fixed reference values were mean CXCL13 = 2.854063, SD CXCL13 = 0.6234777, mean CXCL8 = 3.001138, SD CXCL8 = 0.4441556, and SD of the resulting CXCL13-minus-CXCL8 z-score difference = 1.240428; the mean of this difference was effectively zero. Accordingly, MARTA was calculated directly as:
MARTA = {[(log2(TPM_CXCL13 + 1) − 2.854063)/0.6234777] − [(log2(TPM_CXCL8 + 1) − 3.001138)/0.4441556]}/1.240428.
Higher MARTA values therefore reflected greater CXCL13 expression relative to CXCL8 after standardisation. For categorical analyses, the upper tertile of MARTA in the complete IMmotion150 molecular cohort was used as the fixed cutoff (0.4556475), with MARTA-high defined as >0.4556475 and MARTA-low as ≤0.4556475. tGE8 was not incorporated into the MARTA score and was used only as a comparator and adjustment covariate in secondary analyses.
2.3. Evaluation of MARTA in IMmotion150
Associations of MARTA with ORR and PFS in IMmotion150 were evaluated using logistic regression and Cox proportional-hazards regression, respectively. Analyses were performed separately within each treatment group, with MARTA evaluated primarily as a continuous variable and effect estimates reported per 1-SD increase in the score. Categorical analyses comparing MARTA-high with MARTA-low were also performed, with MARTA-low as the reference group. PFS distributions according to MARTA group were estimated using the Kaplan-Meier method. To assess whether the associations between MARTA and ORR or PFS differed among treatment groups, interaction models included continuous MARTA, treatment group, and their interaction. The overall interaction was assessed by likelihood-ratio comparison with the corresponding model without the interaction. To determine whether the associations of MARTA were maintained after accounting for tGE8, additional analyses in the atezolizumab-monotherapy group included continuous MARTA and continuous tGE8 in the same model.
2.4. External Validation of MARTA in IMvigor210
MARTA was calculated in IMvigor210 using the same equally weighted z[z(CXCL13) − z(CXCL8)] formulation after cohort-specific normalisation. One transcriptomic sample per patient was retained before normalisation. RNA-sequencing counts were normalised using the DESeq-based implementation of mySimpleVoom in the IMvigor210CoreBiologies package. For the single patient with two available transcriptomic samples, the first sample in source-data order was used for the primary analysis; use of the alternative sample produced virtually identical results. Continuous MARTA was the primary validation variable. Associations with ORR and OS were evaluated using logistic regression and Cox proportional-hazards regression, respectively. For categorical analyses, the upper tertile of MARTA in the full molecular cohort was used as a fixed threshold (0.3871498) and applied unchanged to the population evaluable for ORR. OS distributions according to MARTA group were estimated using the Kaplan-Meier method. In a secondary multivariable analysis, the association between continuous MARTA and OS was evaluated after adjustment for continuous tGE8, TMB, and PD-L1 immune-cell expression. Analyses were restricted to patients with complete data for all included covariates. Prior platinum exposure was examined in sensitivity analyses by including it as an additional covariate, evaluating the association between MARTA and OS within subgroups defined by prior platinum exposure, and testing the interaction between MARTA and prior platinum exposure. This interaction was also evaluated in the corresponding multivariable Cox model adjusted for tGE8, TMB, and PD-L1 immune-cell expression.
2.5. Statistical Analysis
Missing data were not imputed, and each analysis included only patients with available data for the variables required by the corresponding model. Effect estimates are reported as odds ratios (ORs) or hazard ratios (HRs), as appropriate, with 95% confidence intervals (CIs). Kaplan-Meier methods were used to estimate PFS and OS distributions and median survival. The proportional-hazards assumption for Cox models was assessed using scaled Schoenfeld residuals. In the atezolizumab-plus-bevacizumab PFS analysis, where evidence of non-proportional hazards was observed, an exploratory model including an interaction between continuous MARTA and log(time) was fitted to assess whether the association between MARTA and PFS varied over follow-up. In the atezolizumab-monotherapy PFS analysis, departure from linearity was assessed by comparing a model containing MARTA as a linear continuous variable with a model incorporating MARTA as a natural cubic spline with 3 degrees of freedom. Nested models, including those used for treatment-interaction testing, were compared using likelihood-ratio tests.
All P values were two-sided. Categorical and time-varying analyses were exploratory. Statistical analyses were performed using MedCalc Statistical Software version 23.5.2 (MedCalc Software Ltd., Ostend, Belgium) and R version 4.4.2 (R Foundation for Statistical Computing, Vienna, Austria) in RStudio version 2026.04.0+526 (Posit Software, PBC, Boston, MA, USA). ChatGPT (OpenAI) was used to assist with the formulation, refinement, and troubleshooting of complex R commands; all code execution, statistical outputs, and interpretation were reviewed and verified by the author.
3. Results
3.1. Analysis Cohorts, Clinical Endpoints and MARTA Development
In IMmotion150, 247 patients were evaluable for ORR and 263 for PFS. Of the patients evaluable for ORR, 81 received atezolizumab monotherapy and constituted the development population in which the 44 candidate genes were evaluated. In IMvigor210, 347 unique patients comprised the OS analysis population, of whom 298 were evaluable for ORR. Among the 44 candidate genes evaluated in the IMmotion150 development population, CXCL13 and CXCL8 were retained for construction of MARTA. Higher CXCL13 expression was associated with higher ORR, whereas higher CXCL8 expression was associated with lower ORR. These opposing associations provided the basis for the equally weighted CXCL13-minus-CXCL8 formulation of the final score.
3.2. Evaluation of MARTA in IMmotion150
For ORR, higher continuous MARTA was associated with greater odds of objective response in the atezolizumab-monotherapy group (OR, 3.20; 95% CI, 1.42–7.19; P=0.005) and the atezolizumab-plus-bevacizumab group (OR, 2.61; 95% CI, 1.43–4.76; P=0.002), but not in the sunitinib group (OR, 1.16; 95% CI, 0.69–1.95; P=0.58). The association between MARTA and ORR differed across treatment groups (overall interaction P=0.05). Categorical analyses showed a concordant pattern (Table 1, Panel A). Higher continuous MARTA was also associated with longer PFS in the atezolizumab-monotherapy group (HR, 0.60; 95% CI, 0.48–0.75; P<0.001) and the atezolizumab-plus-bevacizumab group (HR, 0.65; 95% CI, 0.48–0.89; P=0.007), but not in the sunitinib group (HR, 1.01; 95% CI, 0.77–1.31; P=0.96). The association between MARTA and PFS differed significantly across treatment groups (likelihood-ratio χ2=9.08; 2 df; P=0.01) (Table 1, Panel B). Among patients receiving atezolizumab monotherapy, median PFS was 17.31 months in the MARTA-high group (95% CI, 5.45–not reached [NR]) and 5.35 months in the MARTA-low group (95% CI, 2.86–6.14), with an HR of 0.39 (95% CI, 0.21–0.71; P=0.002) (Figure 1). The corresponding categorical HRs were 0.89 (95% CI, 0.49–1.61; P=0.69) with sunitinib and 0.59 (95% CI, 0.34–1.04; P=0.07) with atezolizumab plus bevacizumab. There was no evidence of violation of the proportional-hazards assumption for continuous MARTA in the atezolizumab-monotherapy or sunitinib groups. In the atezolizumab-plus-bevacizumab group, the MARTA-by-log(time) interaction was significant (P=0.01), indicating that the favourable association between MARTA and PFS attenuated over follow-up. There was no evidence of departure from linearity in the atezolizumab-monotherapy group (P=0.32). After adjustment for continuous tGE8 in the atezolizumab-monotherapy group, MARTA remained associated with objective response (adjusted OR, 3.97; 95% CI, 1.54–10.25; P=0.004) and PFS (adjusted HR, 0.49; 95% CI, 0.36–0.66; P<0.001) (Table S2).
3.3. External Validation of MARTA in IMvigor210
In the 298 patients evaluable for ORR, higher continuous MARTA was associated with higher ORR (OR per 1-SD increase, 1.38; 95% CI, 1.05–1.81; P=0.02). In categorical analyses, ORR was 30.7% in the MARTA-high group and 18.8% in the MARTA-low group (OR, 1.92; 95% CI, 1.10–3.33; P=0.02) (Table 2). Among the 347 IMvigor210 patients with available pretreatment transcriptomic data, higher continuous MARTA was associated with longer OS (HR per 1-SD increase, 0.76; 95% CI, 0.67–0.86; P<0.001). Median OS was 15.61 months in the MARTA-high group (95% CI, 10.41–NR) and 7.06 months in the MARTA-low group (95% CI, 6.24–9.00) (Figure 2), with an HR for death of 0.57 (95% CI, 0.43–0.77; P<0.001) (Table 2). In a multivariate Cox analysis restricted to the 271 patients with available data for MARTA, tGE8, TMB, and PD-L1 immune-cell expression, among whom 172 deaths occurred, MARTA remained associated with OS after adjustment for these variables (adjusted HR, 0.80; 95% CI, 0.68–0.95; P=0.009) (Table S2). The proportional-hazards assumption was not significantly violated for continuous MARTA (P=0.06) or for the multivariate model (global P=0.22). Prior platinum exposure did not materially alter the association between MARTA and OS. After adjustment for prior platinum exposure, the MARTA HR was 0.77 (95% CI, 0.67–0.87; P<0.001), with no evidence that the association differed according to prior platinum exposure (interaction P=0.71). The corresponding HRs were 0.76 (95% CI, 0.66–0.87) among patients with prior platinum exposure and 0.81 (95% CI, 0.58–1.12) among those without prior platinum exposure. In the multivariate model additionally adjusted for prior platinum exposure, MARTA remained associated with OS (adjusted HR, 0.81; 95% CI, 0.68–0.96; P=0.01), with no evidence of interaction with prior platinum exposure (P=0.61) (Table S3).
4. Discussion
In this exploratory biomarker study, MARTA, a two-gene score based on the relative expression of CXCL13 and CXCL8, was consistently associated with outcomes during atezolizumab treatment across two independent cohorts and two tumour types. In IMmotion150, higher continuous MARTA was associated with higher ORR with atezolizumab monotherapy and atezolizumab plus bevacizumab (ORs, 3.20 and 2.61, respectively) and with longer PFS in both atezolizumab-containing groups (HRs, 0.60 and 0.65, respectively), whereas no association with PFS was observed with sunitinib. The association between MARTA and outcome differed across treatment groups, with P=0.05 for ORR and P=0.01 for PFS. In the independent IMvigor210 cohort, MARTA was associated with both ORR and OS during atezolizumab treatment, and its association with OS remained after adjustment for tGE8, TMB, and PD-L1 expression. These findings do not establish clinical utility, but their consistency across different tumour types and clinical endpoints, together with the treatment-group differences observed in IMmotion150, supports further investigation of MARTA as a potential marker of sensitivity to PD-L1 blockade. The positive component of MARTA, CXCL13, has substantial biological support as a marker of adaptive antitumour immunity [16,17,18,19]. A single-cell meta-analysis of 225 tumour samples from 102 patients treated with immune-checkpoint blockade across five cancer types showed that CXCL13 expression identified both precursor and terminally differentiated tumour-reactive CD8+ T cells. CXCL13+CD8+ T cells were associated with favourable responses, and their abundance increased after treatment in responding tumours [16]. CXCL13 is also closely linked to the formation and organisation of tertiary lymphoid structures (TLS). In metastatic melanoma, the co-occurrence of intratumoural CD8+ T cells and CD20+ B cells was associated with improved survival, with these immune populations organised within CXCL13-associated TLS. A transcriptional signature of TLS was also associated with outcome following immune-checkpoint blockade [20]. Consistent findings across melanoma and renal-cell carcinoma further showed that B-cell-rich TLS were associated with response to immunotherapy, supporting the importance of organised adaptive immunity rather than T-cell infiltration alone [21,22]. This biological rationale is particularly relevant to urothelial carcinoma. In advanced bladder cancer cohorts, higher CXCL13 expression was independently associated with longer survival during immune-checkpoint therapy (HR, 0.80; 95% CI, 0.68–0.94) and with ORR (P<0.0001). In contrast, CXCL13 was not associated with outcome in patients who did not receive immune-checkpoint therapy and correlated with the presence of tumour TLS [23]. These observations provide disease-specific support for the favourable association of the CXCL13 component of MARTA observed in IMvigor210. High CXCL8 expression reflects a myeloid-inflamed tumour microenvironment with increased neutrophil infiltration and is associated with reduced clinical benefit from immune-checkpoint blockade [24,25,26,27]. In pooled analyses of 1,445 patients with metastatic urothelial carcinoma or renal-cell carcinoma enrolled in atezolizumab trials [24], high circulating IL-8 and increased tumour CXCL8 expression were associated with poorer outcomes during PD-L1 blockade. IL-8 was also linked to myeloid-cell populations and reduced expression of antigen-presentation machinery, including in otherwise T-cell-inflamed tumours. These findings were supported by an independent analysis of 1,344 patients with advanced cancers enrolled in phase 3 trials [25], in which elevated baseline serum IL-8 was associated with greater intratumoural neutrophil infiltration and poorer outcomes during immune-checkpoint therapy. The molecular analysis of IMmotion150 [6] provides additional support for this interpretation: T-effector/IFN-γ and myeloid inflammatory transcriptional profiles showed different associations with PFS across atezolizumab, atezolizumab plus bevacizumab, and sunitinib, with myeloid inflammation proposed as a potential mechanism of resistance to checkpoint inhibition. MARTA therefore integrates two biologically contrasting signals. CXCL13 is linked to tumour-reactive adaptive immunity and TLS, whereas CXCL8 is associated with myeloid inflammation and resistance to checkpoint inhibition. By using the standardised difference between CXCL13 and CXCL8, MARTA captures the balance between these signals rather than T-cell inflammation alone. This distinguishes MARTA from tGE8, which primarily reflects T-effector and IFN-γ-related activity. In the atezolizumab-monotherapy group of IMmotion150, MARTA remained associated with both ORR and PFS after adjustment for tGE8. In IMvigor210, its association with OS also persisted in the multivariate model including tGE8, TMB, and PD-L1 expression. These findings indicate that the CXCL13–CXCL8 balance contains outcome information during atezolizumab treatment that is not fully captured by a conventional T-effector signature. This interpretation is consistent with previous analyses of IMmotion150 and IMvigor210, in which response to PD-L1 blockade was influenced not only by immune activation but also by myeloid, stromal, and tumour-intrinsic features [6,8,10]. The simplicity of MARTA should also be considered in relation to more complex transcriptomic predictors. A recently reported LogitDA model used a 49-gene signature derived in IMvigor210. In the independent PCD4989g metastatic urothelial carcinoma dataset, the model achieved an AUC of 0.75, compared with 0.65 for tGE8, 0.67 for an IFN-γ signature, and 0.70 for a T-cell-inflamed signature [28]. We considered LogitDA as a potential comparator; however, the published gene list for the final 49-gene model was incomplete, preventing faithful reconstruction of the predictor in our dataset. A direct comparison was therefore not performed, and tGE8 was retained as the principal transcriptomic reference because its composition and calculation could be reproduced consistently. More complex models may ultimately provide greater predictive accuracy, and the present findings should not be interpreted as evidence that a two-gene score is intrinsically superior to a larger signature. However, models incorporating many variables may be more susceptible to overfitting and to associations that are specific to the development cohort. In a cross-tumour analysis of 366 patients receiving atezolizumab across urothelial carcinoma, non-small-cell lung cancer, and renal-cell carcinoma, cancer type accounted for 35% of global transcriptional variance, whereas response accounted for only approximately 1%. A weighted 58-gene model achieved an AUC of 0.99 in the RNA-seq and TMB-evaluable training population, but its performance, as well as that of other evaluated signatures, was below an AUC of 0.65 in an independent validation cohort of 206 patients [10]. These findings illustrate the challenge of developing transcriptomic predictors that retain their performance across independent datasets and tumour types. Several features of the present analysis support further evaluation of MARTA. Its association was observed across ORR, PFS, and OS rather than being confined to a single endpoint. MARTA was developed in renal-cell carcinoma and subsequently validated in urothelial carcinoma, making it less likely that the findings reflect only a tumour-specific transcriptional pattern. This is relevant given the substantial transcriptional heterogeneity reported across tumour types treated with the same checkpoint inhibitor [10,13]. IMmotion150 also provides information that cannot be obtained from a single-arm immunotherapy cohort. MARTA was associated with PFS in both atezolizumab-containing groups but not with sunitinib, and the association between MARTA and PFS differed significantly across treatment groups. Although this does not establish predictive utility, it supports the possibility that the association is treatment dependent. IMvigor210 independently confirmed the association of MARTA with outcome during atezolizumab treatment. However, because all patients received atezolizumab, the study cannot determine whether MARTA specifically identifies greater benefit from the drug or simply reflects a more favourable prognosis. The absence of significant effect modification by prior platinum exposure further argues against treatment history as an explanation for the observed survival association. The performance of transcriptomic biomarkers may potentially be improved by combining them with selected clinical variables. Transcriptomic data capture tumour and immune biology, whereas clinical characteristics provide complementary information on disease burden, systemic inflammation, metastatic distribution, and general condition [29,30,31,32,33,34,35]. In a retrospective study of 62 patients with metastatic urothelial carcinoma treated with PD-1 or PD-L1 inhibitors, low NLR, absence of visceral metastases, and a higher tumour SNV count were independently associated with clinical benefit. A model combining these three variables achieved a c-statistic of 0.90, although external validation was considered necessary [36]. These findings suggest that combining MARTA with a limited number of clinically relevant variables may possibly improve discrimination, rather than necessarily expanding the transcriptomic component of the score. Formal evaluation of such an approach will require datasets containing both pretreatment transcriptomics and sufficiently complete clinical information, which remain relatively uncommon in publicly accessible immunotherapy cohorts. The increasing use of combination regimens poses an important challenge for predictive biomarker development. In advanced urothelial carcinoma, the phase 3 EV-302 trial [37] established enfortumab vedotin plus pembrolizumab as a first-line standard of care. In renal-cell carcinoma, first-line treatment has similarly shifted towards a PD-1/PD-L1 inhibitor combined with a tyrosine kinase inhibitor or dual immune-checkpoint blockade with PD-1 and CTLA-4 inhibitors [38,39]. These regimens improve outcomes at the population level but do not establish which treatment components are necessary for an individual patient. Without validated predictive biomarkers, it remains uncertain whether some patients could be treated effectively with immunotherapy alone, whether others may derive sufficient benefit without immunotherapy, or whether both components are required. Biomarkers capable of distinguishing these groups could provide a basis for more individualised treatment selection. Studies such as the present analysis may contribute to this goal and support future prospective trials of treatment selection or de-escalation, with the aim of preserving efficacy while avoiding unnecessary treatment and toxicity [40,41]. This study has several limitations. MARTA was developed retrospectively, and candidate-gene selection was exploratory and performed in a relatively small atezolizumab-monotherapy population. No multiplicity-adjusted significance threshold was used for gene selection, and the cutoff used to define MARTA-high and MARTA-low requires independent validation. The analyses were based on bulk RNA sequencing, and reproducibility across sequencing methods, tissue-processing procedures, and expression platforms remains to be established. Although MARTA can be reproduced from the reported calculation and standardisation parameters, equivalent performance across analytical platforms cannot be assumed. Both cohorts were treated with atezolizumab, and the findings may not generalise to other PD-1 or PD-L1 inhibitors. In addition, IMvigor210 lacked a non-immunotherapy comparator, limiting its ability to establish treatment specificity; validation in an independent randomised study would provide stronger evidence of a predictive effect. Finally, more complex transcriptomic models may achieve greater discrimination [28], whereas incomplete clinical annotation in available transcriptomic datasets limited our ability to evaluate models combining MARTA with clinical variables. The potential value of integrating transcriptomic and clinical information has been demonstrated in atezolizumab-treated urothelial carcinoma and warrants further evaluation in datasets with sufficiently complete molecular and clinical data [42].
5. Conclusions
MARTA is a simple two-gene transcriptomic score that showed consistent associations with clinical outcomes during atezolizumab treatment in independent renal-cell and urothelial carcinoma cohorts. These findings support further validation but are not sufficient to recommend MARTA for clinical decision-making. Future studies should establish its analytical reproducibility, validate it in additional cohorts treated with PD-1 or PD-L1 inhibitors, and determine whether selected clinical variables can improve its discrimination while preserving the simplicity of the score.
Supplementary Materials
The following supporting information can be downloaded at the website of this paper posted on Preprints.org, Table S1: Candidate genes included in the literature-based panel evaluated during MARTA development; Table S2: Adjusted association of continuous MARTA with clinical outcomes; Table S3: Sensitivity analysis according to prior platinum exposure in IMvigor210.
Author Contributions
Conceptualization, M.U.; methodology, M.U.; formal analysis, M.U.; validation, M.U.; data curation, M.U.; writing—original draft preparation, M.U.; writing—review and editing, M.U.; visualization, M.U.; project administration, M.U. The author has read and agreed to the published version of the manuscript.
Funding
This research received no external funding.
Institutional Review Board Statement
This study was a secondary analysis of publicly available, de-identified patient-level clinical and tumour-transcriptomic data from the IMmotion150 and IMvigor210 clinical trials. No participants were recruited or contacted, and the author had no access to directly identifiable information. In accordance with Section 4.2.8 of the UK Research Ethics Committee Policy Document, NHS/HSC Research Ethics Committee review was not required. Data were analysed in accordance with the terms of use of the respective public data repositories and applicable data-governance requirements.
Informed Consent Statement
Not applicable.
Data Availability Statement
The clinical and tumour-transcriptomic data analysed in this study are publicly available through cBioPortal for Cancer Genomics [43,44,45] as iAtlas-harmonized datasets, under the study identifiers rcc_iatlas_immotion150_2018 and blca_iatlas_imvigor210_2017, corresponding to IMmotion150 and IMvigor210, respectively. IMvigor210 RNA-sequencing data were processed using the IMvigor210CoreBiologies R package, as described in the Methods. No new patient-level clinical or molecular data were generated in the present study.
Conflicts of Interest
The author declares no conflicts of interest.
References
- Holder, A.M.; Dedeilia, A.; Sierra-Davidson, K.; Cohen, S.; Liu, D.; Parikh, A.; Boland, G.M. Defining clinically useful biomarkers of immune checkpoint inhibitors in solid tumours. Nat. Rev. Cancer 2024, 24, 498–512. [Google Scholar] [CrossRef] [PubMed]
- Uccello, M.; Adeleke, S.; Moschetta, M.; Ghose, A.; Boussios, S. Immunotherapy for advanced urothelial carcinoma (UC): rational and current evidence. Ann. Palliat. Med. 2023, 12, 1345–1354. [Google Scholar] [CrossRef]
- Doroshow, D.B.; Bhalla, S.; Beasley, M.B.; Sholl, L.M.; Kerr, K.M.; Gnjatic, S.; Wistuba, I.I.; Rimm, D.L.; Tsao, M.S.; Hirsch, F.R. PD-L1 as a biomarker of response to immune-checkpoint inhibitors. Nat. Rev. Clin. Oncol. 2021, 18, 345–362. [Google Scholar] [CrossRef]
- Budczies, J.; Kazdal, D.; Menzel, M.; Beck, S.; Kluck, K.; Altbürger, C.; Schwab, C.; Allgäuer, M.; Ahadova, A.; Kloor, M.; et al. Tumour mutational burden: clinical utility, challenges and emerging improvements. Nat. Rev. Clin. Oncol. 2024, 21, 725–742. [Google Scholar] [CrossRef]
- Aung, T.N.; Monkman, J.; Warrell, J.; Vathiotis, I.; Bates, K.M.; Gavrielatou, N.; Trontzas, I.P.; Tan, C.W.; Fernandez, A.I.; Moutafi, M.; et al. Spatial signatures for predicting immunotherapy outcomes using multi-omics in non-small cell lung cancer. Nat. Genet. 2025, 57, 2482–2493. [Google Scholar] [CrossRef]
- McDermott, D.F.; Huseni, M.A.; Atkins, M.B.; Motzer, R.J.; Rini, B.I.; Escudier, B.; Fong, L.; Joseph, R.W.; Pal, S.K.; Reeves, J.A.; et al. Clinical activity and molecular correlates of response to atezolizumab alone or in combination with bevacizumab versus sunitinib in renal cell carcinoma. Nat. Med. 2018, 24, 749–757. [Google Scholar] [CrossRef]
- Motzer, R.J.; Banchereau, R.; Hamidi, H.; Powles, T.; McDermott, D.; Atkins, M.B.; Escudier, B.; Liu, L.F.; Leng, N.; Abbas, A.R.; et al. Molecular Subsets in Renal Cancer Determine Outcome to Checkpoint and Angiogenesis Blockade. Cancer Cell 2020, 38, 803–817.e4. [Google Scholar] [CrossRef]
- Mariathasan, S.; Turley, S.J.; Nickles, D.; Castiglioni, A.; Yuen, K.; Wang, Y.; Kadel, E.E., III; Koeppen, H.; Astarita, J.L.; Cubas, R.; et al. TGFβ attenuates tumour response to PD-L1 blockade by contributing to exclusion of T cells. Nature 2018, 554, 544–548. [Google Scholar] [CrossRef] [PubMed]
- Powles, T.; Kockx, M.; Rodriguez-Vida, A.; Duran, I.; Crabb, S.J.; Van Der Heijden, M.S.; Szabados, B.; Pous, A.F.; Gravis, G.; Herranz, U.A.; et al. Clinical efficacy and biomarker analysis of neoadjuvant atezolizumab in operable urothelial carcinoma in the ABACUS trial. Nat. Med. 2019, 25, 1706–1714. [Google Scholar] [CrossRef]
- Banchereau, R.; Leng, N.; Zill, O.; Sokol, E.; Liu, G.; Pavlick, D.; Maund, S.; Liu, L.F.; Kadel, E., III; Baldwin, N.; et al. Molecular determinants of response to PD-L1 blockade across tumor types. Nat. Commun. 2021, 12, 3969. [Google Scholar] [CrossRef]
- Ayers, M.; Lunceford, J.; Nebozhyn, M.; Murphy, E.; Loboda, A.; Kaufman, D.R.; Albright, A.; Cheng, J.D.; Kang, S.P.; Shankaran, V.; et al. IFN-γ-related mRNA profile predicts clinical response to PD-1 blockade. J. Clin. Investig. 2017, 127, 2930–2940. [Google Scholar] [CrossRef]
- Cristescu, R.; Mogg, R.; Ayers, M.; Albright, A.; Murphy, E.; Yearley, J.; Sher, X.; Liu, X.Q.; Lu, H.; Nebozhyn, M.; et al. Pan-tumor genomic biomarkers for PD-1 checkpoint blockade-based immunotherapy. Science 2018, 362, eaar3593. [Google Scholar] [CrossRef]
- Ott, P.A.; Bang, Y.J.; Piha-Paul, S.A.; Razak, A.R.A.; Bennouna, J.; Soria, J.C.; Rugo, H.S.; Cohen, R.B.; O’Neil, B.H.; Mehnert, J.M.; et al. T-Cell-Inflamed Gene-Expression Profile, Programmed Death Ligand 1 Expression, and Tumor Mutational Burden Predict Efficacy in Patients Treated With Pembrolizumab Across 20 Cancers: KEYNOTE-028. J. Clin. Oncol. 2019, 37, 318–327. [Google Scholar] [CrossRef]
- Rosenberg, J.E.; Hoffman-Censits, J.; Powles, T.; van der Heijden, M.S.; Balar, A.V.; Necchi, A.; Dawson, N.; O’Donnell, P.H.; Balmanoukian, A.; Loriot, Y.; et al. Atezolizumab in patients with locally advanced and metastatic urothelial carcinoma who have progressed following treatment with platinum-based chemotherapy: a single-arm, multicentre, phase 2 trial. Lancet 2016, 387, 1909–1920. [Google Scholar] [CrossRef]
- Balar, A.V.; Galsky, M.D.; Rosenberg, J.E.; Powles, T.; Petrylak, D.P.; Bellmunt, J.; Loriot, Y.; Necchi, A.; Hoffman-Censits, J.; Perez-Gracia, J.L.; et al. Atezolizumab as first-line treatment in cisplatin-ineligible patients with locally advanced and metastatic urothelial carcinoma: a single-arm, multicentre, phase 2 trial. Lancet 2017, 389, 67–76. [Google Scholar] [CrossRef]
- Liu, B.; Zhang, Y.; Wang, D.; Hu, X.; Zhang, Z. Single-cell meta-analyses reveal responses of tumor-reactive CXCL13+ T cells to immune-checkpoint blockade. Nat. Cancer 2022, 3, 1123–1136. [Google Scholar] [CrossRef]
- Thommen, D.S.; Koelzer, V.H.; Herzig, P.; Roller, A.; Trefny, M.; Dimeloe, S.; Kiialainen, A.; Hanhart, J.; Schill, C.; Hess, C.; et al. A transcriptionally and functionally distinct PD-1+ CD8+ T cell pool with predictive potential in non-small-cell lung cancer treated with PD-1 blockade. Nat. Med. 2018, 24, 994–1004. [Google Scholar] [CrossRef]
- Sautès-Fridman, C.; Petitprez, F.; Calderaro, J.; Fridman, W.H. Tertiary lymphoid structures in the era of cancer immunotherapy. Nat. Rev. Cancer 2019, 19, 307–325. [Google Scholar] [CrossRef]
- Gu, X.; Li, D.; Wu, P.; Zhang, C.; Cui, X.; Shang, D.; Ma, R.; Liu, J.; Sun, N.; He, J. Revisiting the CXCL13/CXCR5 axis in the tumor microenvironment in the era of single-cell omics: Implications for immunotherapy. Cancer Lett. 2024, 605, 217278. [Google Scholar] [CrossRef]
- Cabrita, R.; Lauss, M.; Sanna, A.; Donia, M.; Skaarup Larsen, M.; Mitra, S.; Johansson, I.; Phung, B.; Harbst, K.; Vallon-Christersson, J.; et al. Tertiary lymphoid structures improve immunotherapy and survival in melanoma. Nature 2020, 577, 561–565. [Google Scholar] [CrossRef]
- Helmink, B.A.; Reddy, S.M.; Gao, J.; Zhang, S.; Basar, R.; Thakur, R.; Yizhak, K.; Sade-Feldman, M.; Blando, J.; Han, G.; et al. B cells and tertiary lymphoid structures promote immunotherapy response. Nature 2020, 577, 549–555. [Google Scholar] [CrossRef]
- Meylan, M.; Petitprez, F.; Becht, E.; Bougoüin, A.; Pupier, G.; Calvez, A.; Giglioli, I.; Verkarre, V.; Lacroix, G.; Verneau, J.; et al. Tertiary lymphoid structures generate and propagate anti-tumor antibody-producing plasma cells in renal cell cancer. Immunity 2022, 55, 527–541.e5. [Google Scholar] [CrossRef]
- Groeneveld, C.S.; Fontugne, J.; Cabel, L.; Bernard-Pierrot, I.; Radvanyi, F.; Allory, Y.; de Reyniès, A. Tertiary lymphoid structures marker CXCL13 is associated with better survival for patients with advanced-stage bladder cancer treated with immunotherapy. Eur. J. Cancer 2021, 148, 181–189. [Google Scholar] [CrossRef]
- Yuen, K.C.; Liu, L.F.; Gupta, V.; Madireddi, S.; Keerthivasan, S.; Li, C.; Rishipathak, D.; Williams, P.; Kadel, E.E., III; Koeppen, H.; et al. High systemic and tumor-associated IL-8 correlates with reduced clinical benefit of PD-L1 blockade. Nat. Med. 2020, 26, 693–698. [Google Scholar] [CrossRef]
- Schalper, K.A.; Carleton, M.; Zhou, M.; Chen, T.; Feng, Y.; Huang, S.P.; Walsh, A.M.; Baxi, V.; Pandya, D.; Baradet, T.; et al. Elevated serum interleukin-8 is associated with enhanced intratumor neutrophils and reduced clinical benefit of immune-checkpoint inhibitors. Nat. Med. 2020, 26, 688–692. [Google Scholar] [CrossRef]
- Teijeira, A.; Garasa, S.; Ochoa, M.C.; Villalba, M.; Olivera, I.; Cirella, A.; Eguren-Santamaria, I.; Berraondo, P.; Schalper, K.A.; de Andrea, C.E.; et al. IL8, Neutrophils, and NETs in a Collusion against Cancer Immunity and Immunotherapy. Clin. Cancer Res. 2021, 27, 2383–2393. [Google Scholar] [CrossRef]
- Karol, A.B.; Fujiwara, Y.; D’Ovidio, T.; Baldwin, E.; Joshi, H.; Doroshow, D.B.; Galsky, M.D. Peripheral blood cytokines and outcomes with immune checkpoint blockade: a systematic review and meta-analysis. Immunotherapy 2024, 16, 829–840. [Google Scholar] [CrossRef]
- Langfelder, P.; Lin, E.T.; Tsai, Y.T.; Cha, T.L.; Shieh, G.S. Gene signature for response prediction to immunotherapy and prognostic markers in metastatic urothelial carcinoma. Front. Immunol. 2025, 16, 1607222. [Google Scholar] [CrossRef]
- Bajorin, D.F.; Dodd, P.M.; Mazumdar, M.; Fazzari, M.; McCaffrey, J.A.; Scher, H.I.; Herr, H.; Higgins, G.; Boyle, M.G. Long-term survival in metastatic transitional-cell carcinoma and prognostic factors predicting outcome of therapy. J. Clin. Oncol. 1999, 17, 3173–3181. [Google Scholar] [CrossRef]
- Heng, D.Y.; Xie, W.; Regan, M.M.; Warren, M.A.; Golshayan, A.R.; Sahi, C.; Eigl, B.J.; Ruether, J.D.; Cheng, T.; North, S.; et al. Prognostic factors for overall survival in patients with metastatic renal cell carcinoma treated with vascular endothelial growth factor-targeted agents: results from a large, multicenter study. J. Clin. Oncol. 2009, 27, 5794–5799. [Google Scholar] [CrossRef]
- Bellmunt, J.; Choueiri, T.K.; Fougeray, R.; Schutz, F.A.; Salhi, Y.; Winquist, E.; Culine, S.; von der Maase, H.; Vaughn, D.J.; Rosenberg, J.E. Prognostic factors in patients with advanced transitional cell carcinoma of the urothelial tract experiencing treatment failure with platinum-containing regimens. J. Clin. Oncol. 2010, 28, 1850–1855. [Google Scholar] [CrossRef]
- Uccello, M.; Alam, T.; Abbas, H.; Nair, A.; Paskins, J.; Faust, G. Assessing Outcomes and Prognostic Factors for First-Line Therapy in Elderly Patients With Metastatic Renal Cell Carcinoma: Real-Life Data From a Single United Kingdom Institution. Clin. Genitourin. Cancer 2019, 17, e658–e663. [Google Scholar] [CrossRef] [PubMed]
- Khaki, A.R.; Li, A.; Diamantopoulos, L.N.; Miller, N.J.; Carril-Ajuria, L.; Castellano, D.; De Kouchkovsky, I.; Koshkin, V.; Park, J.; Alva, A.; et al. A New Prognostic Model in Patients with Advanced Urothelial Carcinoma Treated with First-line Immune Checkpoint Inhibitors. Eur. Urol. Oncol. 2021, 4, 464–472. [Google Scholar] [CrossRef]
- Bamias, A.; Merseburger, A.; Loriot, Y.; James, N.; Choy, E.; Castellano, D.; Lopez-Rios, F.; Calabrò, F.; Kramer, M.; de Velasco, G.; et al. New prognostic model in patients with advanced urothelial carcinoma treated with second-line immune checkpoint inhibitors. J. Immunother. Cancer 2023, 11, e005977. [Google Scholar] [CrossRef]
- Uccello, M.; Gee, A.L.; Bennett, J.A.; Hazell, H.L.; Ruiz-Echarri Rueda, M.; Beresford, M.J. Metastatic Tumour Burden as Prognostic Factor in Nivolumab-Treated Metastatic Renal Cell Carcinoma: An Exploratory Study. Curr. Oncol. 2026, 33, 320. [Google Scholar] [CrossRef]
- Nassar, A.H.; Mouw, K.W.; Jegede, O.; Shinagare, A.B.; Kim, J.; Liu, C.J.; Pomerantz, M.; Harshman, L.C.; Van Allen, E.M.; Wei, X.X.; et al. A model combining clinical and genomic factors to predict response to PD-1/PD-L1 blockade in advanced urothelial carcinoma. Br. J. Cancer 2020, 122, 555–563. [Google Scholar] [CrossRef]
- Powles, T.; Valderrama, B.P.; Gupta, S.; Bedke, J.; Kikuchi, E.; Hoffman-Censits, J.; Iyer, G.; Vulsteke, C.; Park, S.H.; Shin, S.J.; et al. Enfortumab Vedotin and Pembrolizumab in Untreated Advanced Urothelial Cancer. N. Engl. J. Med. 2024, 390, 875–888. [Google Scholar] [CrossRef]
- Barragan-Carrillo, R.; Saad, E.; Saliby, R.M.; Sun, M.; Albiges, L.; Bex, A.; Heng, D.; Mejean, A.; Motzer, R.J.; Plimack, E.R.; et al. First and Second-line Treatments in Metastatic Renal Cell Carcinoma. Eur. Urol. 2025, 87, 143–154. [Google Scholar] [CrossRef]
- Powles, T.; Albiges, L.; Bex, A.; Comperat, E.; Grünwald, V.; Kanesvaran, R.; Kitamura, H.; McKay, R.; Porta, C.; Procopio, G.; et al. Renal cell carcinoma: ESMO Clinical Practice Guideline for diagnosis, treatment and follow-up. Ann. Oncol. 2024, 35, 692–706. [Google Scholar] [CrossRef]
- Moinard-Butot, F.; Nannini, S.; Gravis, G.; Pautas, M.; Pignot, G.; Barthélémy, P. De-escalation of Treatment in Metastatic Renal Cell Carcinoma: Why? How? Who? When? Clin. Genitourin. Cancer 2026, 24, 102605. [Google Scholar] [CrossRef]
- Qadar, A.; Balkhi, S.S.; Jasaraj, R.B.; Das, A.; Stratton, K.L.; Cookson, M.; Patel, S.; McIntosh, A.G.; Heinlen, J.; Ayanambakkam, A. Circulating tumor DNA response adapted treatment de-escalation in metastatic urothelial carcinoma (CT-READ). J. Clin. Oncol. 2026, 44 (Suppl. 7), abstr. TPS907. [Google Scholar] [CrossRef]
- Piyawajanusorn, C.; Ghislat, G.; Ballester, P.J. Predicting atezolizumab response in metastatic urothelial carcinoma patients using machine learning on integrated tumour gene expression and clinical data. npj Precis. Oncol. 2025, 9, 170. [Google Scholar] [CrossRef]
- Cerami, E.; Gao, J.; Dogrusoz, U.; Gross, B.E.; Sumer, S.O.; Aksoy, B.A.; Jacobsen, A.; Byrne, C.J.; Heuer, M.L.; Larsson, E.; et al. The cBio cancer genomics portal: an open platform for exploring multidimensional cancer genomics data. Cancer Discov. 2012, 2, 401–404. [Google Scholar] [CrossRef] [PubMed]
- Gao, J.; Aksoy, B.A.; Dogrusoz, U.; Dresdner, G.; Gross, B.; Sumer, S.O.; Sun, Y.; Jacobsen, A.; Sinha, R.; Larsson, E.; et al. Integrative analysis of complex cancer genomics and clinical profiles using the cBioPortal. Sci. Signal. 2013, 6, pl1. [Google Scholar] [CrossRef]
- de Bruijn, I.; Kundra, R.; Mastrogiacomo, B.; Tran, T.N.; Sikina, L.; Mazor, T.; Li, X.; Ochoa, A.; Zhao, G.; Lai, B.; et al. Analysis and Visualization of Longitudinal Genomic and Clinical Data from the AACR Project GENIE Biopharma Collaborative in cBioPortal. Cancer Res. 2023, 83, 3861–3867. [Google Scholar] [CrossRef]
Figure 1.
Progression-Free Survival According to MARTA Category in IMmotion150. Kaplan–Meier estimates of PFS among patients receiving atezolizumab monotherapy according to MARTA category. MARTA-high was defined as a score >0.4556475 and MARTA-low as a score ≤0.4556475. Median PFS was 17.31 months in the MARTA-high group (95% CI, 5.45–NR) and 5.35 months in the MARTA-low group (95% CI, 2.86–6.14). The HR for MARTA-high versus MARTA-low was 0.39 (95% CI, 0.21–0.71; P=0.002). Tick marks indicate censored observations; numbers at risk are shown below the plot. Abbreviations: CI, confidence interval; HR, hazard ratio; MARTA, Myeloid–Adaptive Response to Atezolizumab; NR, not reached; PFS, progression-free survival.
Figure 1.
Progression-Free Survival According to MARTA Category in IMmotion150. Kaplan–Meier estimates of PFS among patients receiving atezolizumab monotherapy according to MARTA category. MARTA-high was defined as a score >0.4556475 and MARTA-low as a score ≤0.4556475. Median PFS was 17.31 months in the MARTA-high group (95% CI, 5.45–NR) and 5.35 months in the MARTA-low group (95% CI, 2.86–6.14). The HR for MARTA-high versus MARTA-low was 0.39 (95% CI, 0.21–0.71; P=0.002). Tick marks indicate censored observations; numbers at risk are shown below the plot. Abbreviations: CI, confidence interval; HR, hazard ratio; MARTA, Myeloid–Adaptive Response to Atezolizumab; NR, not reached; PFS, progression-free survival.
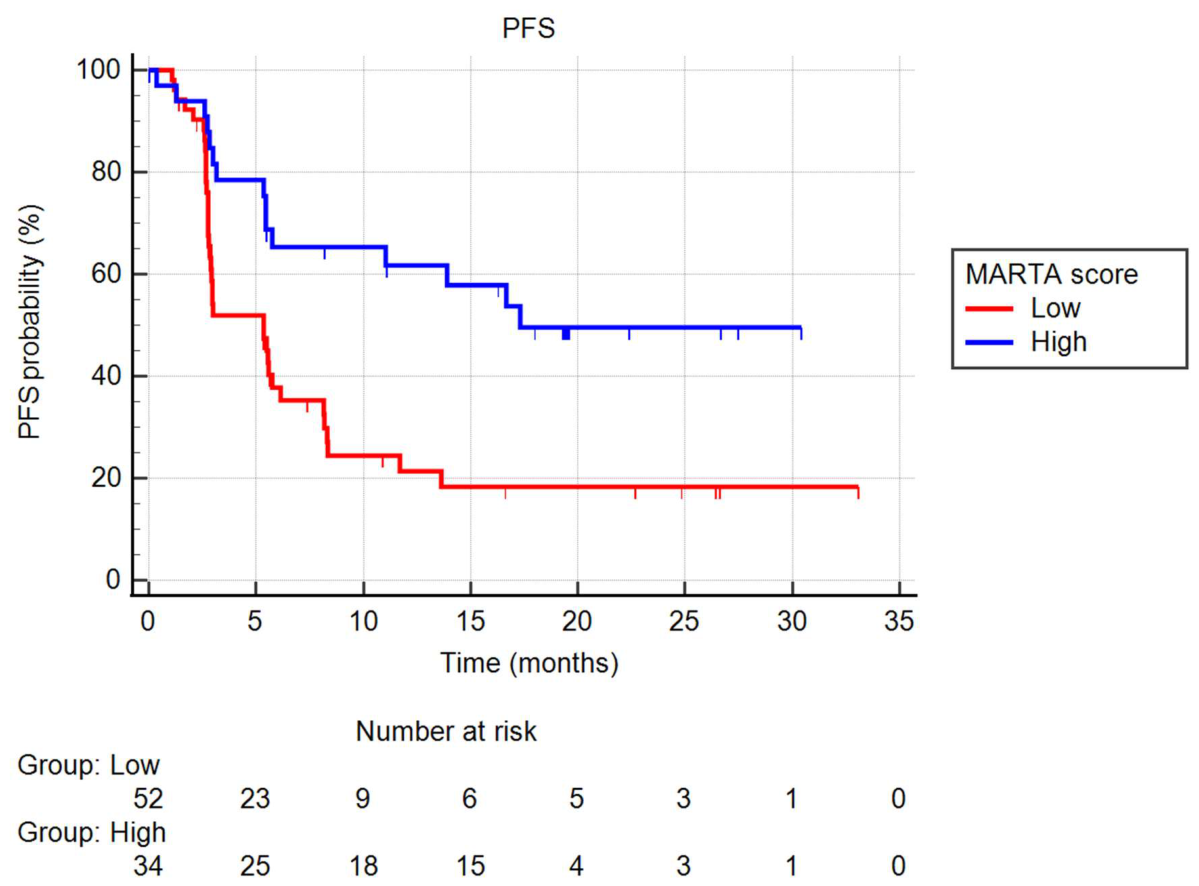
Figure 2.
Overall Survival According to MARTA Category in IMvigor210. Kaplan–Meier estimates of OS according to MARTA category among 347 patients with available pretreatment transcriptomic data in IMvigor210. MARTA-high was defined as a MARTA score >0.3871498 and MARTA-low as a score ≤0.3871498. Median OS was 15.61 months in the MARTA-high group (95% CI, 10.41–NR) and 7.06 months in the MARTA-low group (95% CI, 6.24–9.00). The HR for death for MARTA-high versus MARTA-low was 0.57 (95% CI, 0.43–0.77; P<0.001). Tick marks indicate censored observations; numbers at risk are shown below the plot. Abbreviations: CI, confidence interval; HR, hazard ratio; MARTA, Myeloid–Adaptive Response to Atezolizumab; NR, not reached; OS, overall survival.
Figure 2.
Overall Survival According to MARTA Category in IMvigor210. Kaplan–Meier estimates of OS according to MARTA category among 347 patients with available pretreatment transcriptomic data in IMvigor210. MARTA-high was defined as a MARTA score >0.3871498 and MARTA-low as a score ≤0.3871498. Median OS was 15.61 months in the MARTA-high group (95% CI, 10.41–NR) and 7.06 months in the MARTA-low group (95% CI, 6.24–9.00). The HR for death for MARTA-high versus MARTA-low was 0.57 (95% CI, 0.43–0.77; P<0.001). Tick marks indicate censored observations; numbers at risk are shown below the plot. Abbreviations: CI, confidence interval; HR, hazard ratio; MARTA, Myeloid–Adaptive Response to Atezolizumab; NR, not reached; OS, overall survival.
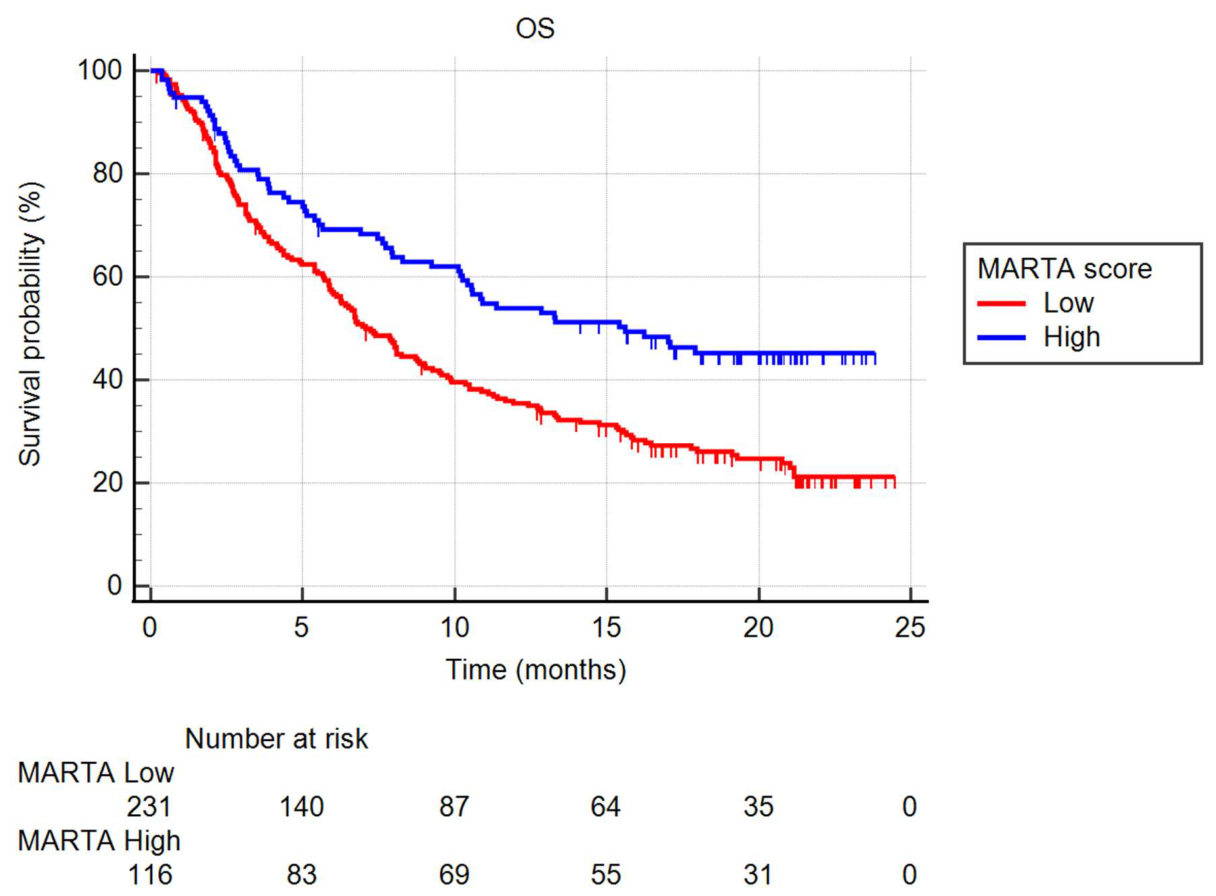

Table 1.
Association of MARTA with ORR and PFS in IMmotion150. Panel A. ORR. Panel B. PFS.
| A. | ||||||||||||
| Treatment | ORR, n/N (%) |
OR, MARTA-high vs. low (95% CI) |
P value |
OR per 1-SD increase (95% CI) |
P value | |||||||
| MARTA-low | MARTA-high | |||||||||||
| Sunitinib | 15/60 (25.0) | 9/22 (40.9) | 2.08 (0.74–5.83) | 0.17 | 1.16 (0.69–1.95) | 0.58 | ||||||
| Atezo | 6/50 (12.0) | 14/31 (45.2) | 6.04 (1.99–18.29) | 0.001 | 3.20 (1.42–7.19) | 0.005 | ||||||
| Atezo + Beva | 11/54 (20.4) | 17/30 (56.7) | 5.11 (1.92–13.62) | 0.001 | 2.61 (1.43–4.76) | 0.002 | ||||||
| B. | ||||||||||||
| Treatment | Events/N | Median PFS, months (95% CI) |
HR, MARTA-high vs. low (95% CI) |
P value |
HR per 1-SD increase (95% CI) |
P value | ||||||
| MARTA-low | MARTA-high | |||||||||||
| Sunitinib | 55/89 | 8.25 (4.43–10.81) | 10.71 (3.71–22.34) | 0.89 (0.49–1.61) | 0.69 | 1.01 (0.77–1.31) | 0.96 | |||||
| Atezo | 51/86 | 5.35 (2.86–6.14) | 17.31 (5.45–NR) | 0.39 (0.21–0.71) | 0.002 | 0.60 (0.48–0.75) | <0.001 | |||||
| Atezo + Beva | 58/88 | 8.31 (2.92–11.40) | 21.68 (9.86–25.07) | 0.59 (0.34–1.04) | 0.07 | 0.65 (0.48–0.89) | 0.007 | |||||
Continuous effect estimates are reported per 1-SD increase in MARTA; categorical ORs and HRs compare MARTA-high with MARTA-low. MARTA-high was defined by the fixed IMmotion150 upper-tertile cutoff (>0.4556475), and MARTA-low as ≤0.4556475. P for interaction across treatment groups was 0.05 for ORR and 0.01 for PFS. In the Atezo + Beva PFS analysis, the proportional-hazards assumption was not satisfied; the continuous HR therefore represents an average association over follow-up. Abbreviations: Atezo, atezolizumab; Beva, bevacizumab; CI, confidence interval; HR, hazard ratio; MARTA, Myeloid–Adaptive Response to Atezolizumab; NR, not reached; OR, odds ratio; ORR, objective response rate; PFS, progression-free survival; SD, standard deviation.
Table 2.
External Validation of MARTA in IMvigor210.
| MARTA group | ORR, n/N (%) | OR for response (95% CI); P | Deaths, n/N (%) | Median OS, months (95% CI) | HR for death (95% CI); P |
|---|---|---|---|---|---|
| MARTA-low | 37/197 (18.8) | Reference | 170/231 (73.6) | 7.06 (6.24–9.00) | Reference |
| MARTA-high | 31/101 (30.7) | 1.92 (1.10–3.33); P=0.02 | 61/116 (52.6) | 15.61 (10.41–NR) | 0.57 (0.43–0.77); P<0.001 |
MARTA-high was defined using the upper-tertile cutoff from the full 347-patient IMvigor210 molecular cohort; the same threshold was applied unchanged to the 298-patient ORR population. In continuous analyses, each 1-SD increase in MARTA was associated with higher ORR (OR, 1.38; 95% CI, 1.05–1.81; P=0.02) and longer OS (HR for death, 0.76; 95% CI, 0.67–0.86; P<0.001). Abbreviations: CI, confidence interval; HR, hazard ratio; MARTA, Myeloid–Adaptive Response to Atezolizumab; NR, not reached; OR, odds ratio; ORR, objective response rate; OS, overall survival; SD, standard deviation.
Disclaimer/Publisher’s Note: The statements, opinions and data contained in all publications are solely those of the individual author(s) and contributor(s) and not of MDPI and/or the editor(s). MDPI and/or the editor(s) disclaim responsibility for any injury to people or property resulting from any ideas, methods, instructions or products referred to in the content. |
© 2026 by the authors. Licensee MDPI, Basel, Switzerland. This article is an open access article distributed under the terms and conditions of the Creative Commons Attribution (CC BY) license (http://creativecommons.org/licenses/by/4.0/).
Copyright: This open access article is published under a Creative Commons CC BY 4.0 license, which permit the free download, distribution, and reuse, provided that the author and preprint are cited in any reuse.