

Submitted:
21 August 2026
Posted:
24 August 2026
You are already at the latest version
Abstract
The paper presents the results of monoaural and binaural acoustic measurements and speech intelligibility tests conducted in two classrooms representative of typical school buildings in Italy. The sample of two classrooms was selected based on a statistical analysis of reverberation time measurements taken in more than one hundred Italian schools. In the two sample classrooms, measurements were taken both when the room was empty and when it was occupied by pupils. The binaural measurements were conducted on two students who were fitted with special headphones equipped with binaural microphones, with sound sources placed in various positions within the classroom, both in the acoustically untreated classroom (with a long reverberation time) and in the acoustically treated classroom (with a short reverberation time). The results of the speech intelligibility tests conducted on 25 elementary school students confirmed that speech intelligibility improves significantly in the acoustically treated classroom.
Keywords:
schools
; reverberation time
; intelligibility
; binaural acoustic parameters
; room acoustics
; spatial release from masking
; interaural time and level differences
1. Introduction
The negative effect of reverberation on children’s speech intelligibility has been tested in-field in different classroom scenarios accounting for different types of noise. Astolfi et al. (2012) found that traffic noise is the most interfering noise followed by babble noise, but a lowering in reverberation time brought an increase in speech intelligibility only with traffic noise located outdoors and not with babble noise, whose source was in the middle of the classrooms [1]. In a study by Buss et al. (2017), carried out without reverberation in a laboratory, it has been proved that for children aged 5 to 16 years and for adults, a two-talker masker is more detrimental for speech intelligibility than a one-talker masker, due to the increased cognitive resources needed to perceptually isolate the target in the context [2].
In their review, Leibold and Buss (2019) found that adult-like performance for speech-in-speech recognition is not usually observed until adolescence. Difficulties are due in part to the immature allocation of attention to the relevant target speech and extensive listening experience is required before maturing selective attention abilities. Also, working memory seems to play an important role in the development of speech-in-noise recognition. Children with high working memory appear to have high performance on masked speech recognition tests. The central auditory process is responsible for selective attention, which allows isolation of target and masker speech by auditory grouping promoted by different vocal characteristics, temporal onsets, and binaural cues. Children, however, seem to require more acoustic cues than adults to perceptually isolate target and masker speech [3].
Speech intelligibility benefit from spatial separation of the source from the masker is known as a Spatial Release from Masking (SRM), which is typically computed as the difference in Speech Recognition Threshold (SRT) between conditions in which the target and masker are co-located versus spatially separated. Speech Recognition Threshold (SRT) is the signal-to-noise ratio (SNR) yielding a certain % correct recognition score (i.e., for example, Speech Recognition Threshold 80%, SRT80 in dB SNR, is the signal-to-noise ratio yielding an 80% correct recognition score). SRM is likely associated with at least two binaural processes, which are the “better-ear listening” and the “binaural unmasking” [4]. The former is related to the listener’s ability to detect sound from the ear which has a better signal-to-noise ratio, and the latter to the differences in the interaural phase between signal and noise sources, caused by differences in path distance to each ear, exploited by the brain to detect a signal. These processes are related to the Interaural Time and Level Differences (ITD and ILD) [5,6,7]. ITD is the difference in arrival time of a sound wave at the two ears, due to the path length difference from the source to each of the ears. ILD is caused by the attenuation due to head shadowing at high frequencies. ITD and ILD are the most important cues for the auditory system to localise sound sources.
SRM was found for children as young as 4 years in the case of both asymmetrical [8,9] and symmetrical interference configurations [9]. Asymmetrical interference configuration usually considers the target at 0° azimuth and the maskers at +90° or –90°, while in the symmetrical configuration, the maskers are either at +90° or –90. The asymmetrical configuration provides access to both monaural head shadow and interaural differences cues [10], while when maskers are displaced symmetrically, the monaural head shadow is minimized, resulting in a reduced availability of spatial cues for source segregation [11]. However, no significant difference in SRM has been found in the asymmetrical and symmetrical configurations by Misurelli and Litovsky (2012), except when the target and the maskers consist of the same sex-stimuli in the symmetrical interferer condition [9,10,12]. In this case, SRM is significantly reduced because not only monoaural cues are reduced, but also spectral difference cues. Furthermore, no significant differences have been found between adults and children in anechoic conditions [10,11]. On the contrary, Peng and Litovsky (2021) observed SRM immaturity in children between 6 and 15 years of age compared to adults. They found that the adult-child difference of ∼3 dB SRM was mainly driven by children’s poorer ability to use interaural differences rather than head shadow [13].
The above-referenced studies refer to anechoic conditions in the laboratory, while only a recent study, to the best of the Authors’ knowledge, has concerned SRM with reverberation in typical classroom conditions. Peng et al. (2021) found that children in the 7–12 years age range have not reached maturity in using binaural cues that are distorted in reverberation, as adults. They demonstrated 3–8 dB SRM on average in reverberant environments, which was much smaller than that observed for adults (10–13 dB) [14].
Reverberation does not affect the sound source localization ability [15]. Indeed, the “precedent effect in sound localization” (Wallach et al., 1949) claims that a sound source is localized based on the location of the first arriving sound more than on the directions of the reflected sounds arriving later and from many directions unrelated to the source [16]. The “echo threshold” is the briefest delay between the first arriving sound, i.e., the direct sound, and the delayed sound, i.e., the first arriving reflected sound, which allows the listener to perceive one single sound instead of two spatially separated sounds. This is named “fusion” and the localization of the fused signal is at or near the location cued by the first of the two signals, i.e., the direct sound. In the literature, a wide range of echo thresholds is reported, which is from 2 to 100 ms, depending on many factors including age, hearing status, and differences in stimuli [17]. Also, it depends on the signal since it is roughly 1 ms for short impulses, 50 ms for ongoing speech, and 80 ms for classic/romantic music [4]. Children about 5 years old exhibited significantly longer echo thresholds than adults, which leads to a more robust fusion effect, on one side, but also to a deficit in localization of the delayed sound when this threshold is within the limit for adults, on the other side, which suggests an immature spatial hearing in children [18,19].
Even if the localization of a sound source is not affected by reverberation, increasing reverberation reduces ITD and ILD and this results in poorer performance in speech identification. However, in the case of adult listeners, it has little effect on the benefit of spatial separation of the target and the masker, i.e., it does not affect the SRM in the case of informational maskers, which is preserved compared to anechoic conditions and is higher compared to the case of energetic maskers [20]. This represents the condition more often found in real environments where listeners use the “precedent effect” to derive localization from signal transients and thus perceive the target as distinct from the masker.
Binaural listening appears to have limited effects on reducing the impact of noise on learning in children. Leist et al. (2022) compared a realistic classroom-noise scenario presented either monaurally, with identical signals delivered to both ears, or binaurally, preserving interaural differences and spatial information, while children performed tasks involving auditory and visual information processing [21]. Word identification was more impaired in the monaural than in the binaural condition, whereas listening comprehension and short-term memory were similarly affected in both conditions. These findings suggest that irrelevant speech effects are mainly driven by cognitive interference between automatic speech processing and verbal information maintenance, while attention capture elicited by spatially separated and changing sound sources plays only a minor role.
Some advantages of using child HATS (Head And Torso Simulators) rather than adult HATS and/or omnidirectional measurements have been observed when assessing A-weighted equivalent sound pressure levels in classrooms, due to their anthropomorphic characteristics [22]. Regarding prominent ear measurements, no differences are observed between adult and child HATS compared with the omnidirectional microphone up to 2 kHz. However, differences emerge around 4 kHz between HATS measurements and the omnidirectional microphone, while above 8 kHz differences can be observed between child and adult HATS, with higher values recorded by child HATS. Notably, sharpness values also differ across transducers, with child HATS showing greater high-frequency content compared with adult HATS.
Despite the extensive literature on speech recognition in noise and on the use of binaural cues for source segregation, most studies have been conducted under anechoic and laboratory conditions. Evidence collected in real classrooms remains limited, although reverberation and “classroom bubble” noise may substantially degrade the linguistic signal and increase the cognitive load on children. Importantly, speech understanding in classrooms is not an isolated outcome, but a prerequisite for higher-level cognitive processes, such as verbal working memory.
Systematic reviews demonstrate that classroom acoustic treatments (e.g., sound absorbers and diffusers) generally reduce reverberation and improve speech perception, attention, and student well-being across diverse educational settings. However, excessive absorption can inadvertently lower signal intensity and Speech Transmission Index (STI), thereby increasing listening effort. Furthermore, the overall effectiveness of these interventions varies depending on specific noise conditions, spatial configurations, and individual cognitive or perceptual vulnerabilities [23].
In this framework, global room-acoustic parameters such as Reverberation Time (RT), Clarity (C50), and Speech Transmission Index (STI) are particularly relevant to describe classroom communication quality. Binaural measures such as interaural time and level differences (ITD and ILD), interaural cross-correlation (IACC), and direct-to-reverberant ratio (DRR) may provide complementary information to interpret perceptual differences between rooms with different acoustic quality. While monaural parameters describe the room acoustics, the binaural parameters focus on the listeners perspective. The paper aims to investigate which binaural cues are and are not affected by acoustic treatments and therefore identifying the likely perceptual mechanisms behind the observed cognitive benefit.
The objective of the present study is to compare monoaural and binaural acoustic parameters measured in two “twin” primary-school classrooms in Italy, identical in volume and layout but characterized by very different reverberation, with the results of comprehension tests based on verbal working memory, administered in an ecological setting. A classroom representative of typical reverberant conditions in Italian historical school buildings is compared with an acoustically treated classroom, by analyzing classical room-acoustic parameters (RT, C50, STI) and binaural parameters, as well as children’s performance on the Listening Span Test under controlled “classroom bubble” noise.
2. Materials and Methods
To investigate the impact of classroom acoustics on primary school children’s listening and learning performance in an ecological environment, an experimental methodology combining acoustic characterization and cognitive assessment was established. The overall workflow, illustrated in Figure 1, outlines the sequential steps of the investigation. First, a statistical analysis of typical Italian primary school classrooms guided the selection of two twin case-study rooms in Florence, identical in layout but differing in acoustic treatment (untreated classroom C1 vs. acoustically optimized classroom C2). Subsequent room acoustic measurements—incorporating both monaural and binaural parameters under unoccupied and occupied conditions—were performed to thoroughly characterize the sound field. Finally, comprehension tests were administered under controlled noise conditions to a selected sample of primary school pupils to evaluate cognitive performance across the two acoustic environments. Each stage of this experimental investigation is detailed in the following subsections.
2.1. Description of the Case Study
In order to carry out in a real context the study on the effect of acoustic quality in the comprehension and learning process of primary school children, it was necessary to identify two sample classrooms. To this end, a statistical analysis was conducted on a sample of one hundred forty-four Italian schools (many of them located in the city of Florence). The results showed that part of this sample was composed of a classroom with no acoustic treatment while another part had some kind of acoustic treatment (usually an absorbing ceiling). The Reverberation time and Clarity measurements in 1/3 octave frequency bands were carried out in all classrooms (n=144). All classrooms were not occupied by pupils and normally furnished. The average values of Reverberation Time between third octave bands of 200 – 5,000 Hz (i.e., between octave bands of 250 – 4,000 Hz) was analyzed based on the requirements of Italian standard UNI 11367 annex C [24].
Figure 2 shows the statistical distribution of average value of Reverberation Time in the sample of 144 classrooms.
The average value of the RT in this sample was 1.2 s, the median was 1.1 s and the 80th percentile was 1.6 s.
To carry out the tests, it was consequently necessary to select a classroom representative of the typical Italian classrooms, i.e., with an average value of RT of about 1.2 seconds in the octave bands range 250 – 4,000 Hz.
The sample classroom (C1) of the current study was selected in a primary school of the city of Florence that was built as a convent before 1800; the adaptation to the current scholastic use dates back to the ‘50s. This school is representative of many other schools where no acoustic treatment was realized.
The average unoccupied reverberation time of the selected classroom was 1.3 seconds in the octave band range 250 – 4,000 Hz, therefore near to the average value of the sample of 144 Italian classrooms.
To carry out the test it was necessary to select two different classrooms in the same school: the one described above, with high reverberation time (C1), and another with low reverberation time (C2). To this aim, a classroom of the same school building treated with sound-absorbing ceiling was selected as the second sample classroom.
To better represent the two conditions of optimal and inadequate acoustics, additional sound-absorbing panels were added to the walls of classroom with the ceiling treatment, to obtain in this classroom a value of the Reverberation Time adequate to the optimum value defined by the Italian standard UNI 11532-2 [25,26] for classrooms accommodating hearing impaired pupils.
The Italian standard UNI 11532-2 [26] provides the following equation to define the optimum value of reverberation time for classroom housing pupils with hearing defect.
where V is the volume (m3) of the classroom.
Considering the room (C2) dimensions of 7.2 x 6.2 x 3.8 m3 (see Figure 3, right), the optimal reverberation time according to UNI 11532-2 is about 0.5 seconds.
The average Reverberation Time obtained in this classroom (C2) after the insertion of additional absorbing panels to the walls was about 0.4 second in the octave bands range 250-4,000 Hz, therefore about one third of the reverberation time in the other classroom.
In this way, the two test rooms chosen presented the same boundary conditions, except for the sound-absorbing material in one of them (in the ceiling and in part of the walls).
2.2. Room Acoustics Measurements
2.2.1. Monaural Measurements
Different procedures were used for the measurements carried out in the whole sample of 144 classroom and in the case study of the two classrooms (untreated C1 and treated C2) selected as case study.
Room acoustic measurements carried out in the sample of 144 classrooms were performed with a two-channel class 1 real-time analyzer 01dB (from 2012 Acoem) Symphonie with preamplifiers and 1⁄2-inch Gross diffuse-field microphones. Before each measurement, the microphones were calibrated.
An impulsive type of sound source (clapper II Bielettro) was used for sound field generation for reverberation and clarity measurements.
In total, 10-16 impulse response measurements were analyzed and averaged for each room, depending on room volume. Every measurement performed was in third-octave frequency bands between 50 and 5,000 Hz.
Measurements were performed within rooms in furnished and unoccupied conditions, following ISO 3382-2 [27] and Italian standard UNI 11532-1 [25]. Microphones were placed at a distance of at least 1 m from each surface and at a height of at least 1.2 m to simulate the ear height of a seated child.
From impulse response measurements spatial average of Reverberation Time, RT, and Clarity, C50, were obtained for each classroom.
For Speech Transmission Index, STI, measurements, a Talk Box Bedrock model BT65 and an analyzer Bedrock SM 90 were used.
With reference to the two case studies C1 and C2, acoustic measurements were performed both in unoccupied and occupied conditions, in the presence of pupils while administering the tests, which are described in a dedicated section below. In the occupied condition, the measurement of the impulse response was performed using the omnidirectional source 01 dB omni, generating a sine sweep signal (frequency range 20-20.000 Hz), since the clapper produces an impulsive noise which can be harmful to children’s hearing. The two sound sources (clapper and Dodecahedron) are comparable in the frequency range 0.5-8 kHz [28].
Impulse responses were measured in 18 different positions randomly distributed in each of the two sample classrooms. Background noise was measured in two different points in each classroom.
2.2.2. Binaural Measurements
The two sample classrooms (C1 and C2) were also characterized by binaural measurements in unoccupied conditions. In particular, the following binaural parameters were measured for the two listening positions and two sound sources: Interaural Time Difference (ITD), Interaural Level Difference (ILD), binaural C50, InterAural Cross Correlation (IACC), Direct-to-Reverberant Ratio (DRR) [29].
Interaural Level Difference (ILD) and Interaural Time Difference (ITD) were obtained to investigate the perceived sound localization, while InterAural Cross Correlation (IACC) to retrieve information on the sound spatial impression. Direct-to-Reverberant energy Ratio (DRR) was also obtained for the two ears and as the average value between the two ears. Speech Clarity (C50) has been evaluated as a frequency-dependent parameter separately for the two ears.
The measurements were performed using a source Talkbox (NTi Audio AG, Liechtenstein) and a dodecahedron (01 dB omni) as sound sources and a binaural microphone set (In-Ear Microphone, Type 4101, Bruel&Kjaer, Danimark). Figure 4 shows the positions of the Talkbox (S1, S2, and S3), dodecahedron (S2 and S3) and listeners (L1 and L2) in the two classrooms C1 and C2. The binaural microphone set was worn by two children (11 years old), who were considered listeners in positions L1 and L2. The measurements were performed by first locating the Talkbox in the three positions and generating a sine sweep of 3 s with a frequency range of 20-20,000 Hz. The same procedure was followed for the dodecahedron measurements in the two positions S2 and S3. The Talkbox S1 position is considered as the target speaker (T), while the Talkbox S2 and S3 are considered as single-talker interferer producing an unwanted noise (N). The dodecahedron in S2 and S3 positions is considered as a multi-talker interferer producing an unwanted noise (N). In this work, the above-mentioned parameters have been analysed for the target and noise positions.
Figure 4, Figure 5 and Figure 6 show the measurement setup, with the position of the children during the binaural measurements.
The broadband Interaural Time Difference ITD was calculated using the threshold method described in [30]. The broadband Interaural Level Difference ILD was calculated as the energy ratio between the left and right ear. Since in human auditory perception, ITD and ILD are used complementarily for the lower and higher frequency range, respectively, the Binaural Room Impulse Responses, BRIR, were lowpass filtered in the first case and high-pass filtered in the second, using a 10th-order Butterworth filter with a cutoff frequency of 1300 Hz, as in [31]. The broadband Direct to Reverberant energy Ratio, DRR, values for the left and right ears were calculated by exploiting the open-source MATLAB toolbox in [32] which includes a function that determines the direct sound as the peak of the squared impulse response and returns the DRR value using a time window of 5 ms centred in the peak to select the direct sound [33]. The binaural speech clarity was evaluated in octave bands and provided as the average value from 250 Hz to 2 kHz [26]. Differences have also been obtained between speech clarity from the target source and each noise source, at the left and right ears, respectively, and as mean value between the ears. These differences have been used to evaluate the gap in speech clarity between the target and the noise [34]. The JND (just noticeable difference) of IACC is assumed to be 0.075 [27]. The ITD JND is 58 µs, while the ILD JND is 1.9 dB, at mid frequencies [35]. The JND for the Direct-to-Reverberant Ratio (DRR) is approximately 2–3 dB for reference DRRs between 0 and +10 dB [36]. For classrooms, the just noticeable difference (JND) for the speech clarity C50, over the frequency range 0.5-2 kHz, is approximately 1.1 dB, while an increase of about 3 dB is generally required to achieve a clearly perceptible improvement in speech intelligibility [37].
2.3. Comprehension Tests
To investigate the effect of noise on verbal working memory in elementary school children, within an ecological school environment, a test consisting of a particular listening test, Listening Span Test [38], was administered within the two case study classrooms C1 and C2.
Detailed information about the method of analysis is contained in [39] while in the following a summary of boundary conditions and of main parameters analyzed is reported.
The test was carried out in the two selected classrooms C1 and C2, where a dodecahedral source, placed in a corner position (Figure 7, position M, and Figure 8), reproduced a “classroom babble” recorded in a real classroom and reproduced to give an equivalent SPL in the center of the classroom of 59 dBA. This was considered as a masking sound source (M).
Both the dodecahedron reproducing the babble (M) and the talkbox reproducing the signal (T) were calibrated to give a predetermined level in classroom C1.
The talkbox was calibrated to give 60 dBA at 1 meter of frontal distance, according to ISO 9921:2003 [40], while the omnidirectional source was calibrated to give an average level of about 59 dBA in the center of the classroom. The level of 59 dBA was chosen as representative of bubbling generated by primary school children [41].
The average SPL generated by the dodecahedron and by the talkbox in the two classrooms C1 and C2, which were amplified to give the same emission, was different as a consequence of different values of reverberation time as described in Figure 9.
Figure 9 shows the SPL’s measured in the center of the classroom and at 1 meter in front of the talk box or of the teacher in the classroom C1 and in the classroom C2. Both background noise and noise produced by the loudspeaker in position M (the bubble noise) were almost uniform in the classroom, while talkbox speech and teacher speech are greater in front of the source. The difference between the position in front of the source and that in the center of the classroom is greater in the classroom C2 (green bars in the graph of Figure 9) because of the lower reverberation time.
2.4. Participants and Test Design
To carry out the test, a sample of 25 second-grade children was selected and divided into two homogeneous groups (later indicated as: Group A and Group B). Children performed the tests at the same time of day (in the morning from 9 till 12 am) in both classrooms.
At first, the test was administered to group A in the very reverberant classroom (the untreated classroom C1) and to group B in the classroom with acoustic treatment (the treated classroom C2); after 2 months, the test was repeated, inverting the two groups: group A in the classroom C2 with acoustic treatment and group B in the untreated classroom C1. In this way, four combinations of the tests performed were analyzed:
- Group A in the classroom C1 (untreated);
- Group B in the classroom C2 (treated);
- Group A in the classroom C2 (treated);
- Group B in the classroom C1 (untreated).
All he tests were administered by the same researcher/examiner who administered the task (Ph.D. in Psychology), and the same researcher to control the sound pressure level produced by the voice and by the babble noise and the background noise level. The Sound Pressure Level generated by the voice varied between 59÷61dB at 1 m from the mouth and was monitored during all sessions with the Vocal Holter Med dosimeter [42].
2.5. Statistical Analyses
A statistical comparison of verbal working memory performance obtained by the same children in the two different acoustic contexts was performed.
To test verbal working memory, a simplified version of Daneman and Carpenter’s (1980) Listening Span Test for children from second to fifth grade [39] was used.
The level of performance was determined by coding the children’s responses into six indices representing the level of Span, evaluation, words recalled, intrusions, inventions and inversions.
In particular, the index “Evaluations” was obtained by assigning 1 point for each statement heard correctly judged for its truthfulness or falsity by the child; the index “Words recalled” was obtained by assigning 1 point for each correct word recalled by the child; the index “Span” indicates the sequence of words of maximum length correctly remembered and written down by the child; the index “Intrusions” was obtained by counting each word recalled and written down by the child that was not in the last position in the sentence uttered by the researcher; the index “Inventions” was obtained by counting each word written down by the child with semantic or phonological similarity to the last word but not present in the sentence uttered by the researcher; finally, the index “Inversions” was obtained by counting each word recalled and written down by the child but not in the exact sequence of presentation as in the sentence uttered by the researcher.
The normality of the distribution of the results was determined using the Shapiro-Wilk test.
3. Results and Discussion
In the following, monaural and binaural acoustic measurements results and comprehension tests results are reported for the two sample classrooms.
3.1. Monaural Acoustic Measurements Results
Figure 10 and Figure 11 show the average values of Reverberation Time and Clarity C50 measured in the two sample classrooms with and without children.
During the measurements in the occupied classrooms there were 25 children, with their schoolbags and coats in the classrooms in addition to the technicians who performed the measurements.
Figure 10 shows that reverberation time in the classroom C1 reduces from 1.3 to 1.0 seconds from unoccupied to occupied condition, while Figure 11 reports the clarity C50 increases from -1.6 to +4.9 dB, as average value in the octave bands frequency range from 250 to 4,000 Hz. In the classroom C2 Reverberation Time is almost the same without and with children, while clarity increases from 9.2 to 13.5 dB in the same frequency range.
Figure 12 shows the Speech Transmission Index, STI, evaluated in the classrooms C1 and C2 with normal background noise and with background noise generated by the dodecahedron.
The calculation of STI was carried out according to IEC 60268-16 with the following input data.
- -
- Reverberation time measured in the occupied condition 1 meter from the source and in the center of the classroom.
- -
- Signal (the speech level) measured in the same positions with the talkbox as sound source calibrated to give 60 dBA at 1 meter in front of the loudspeaker.
- -
It is evident that the STI reduces when moving from 1 meter in front of the source to the center of the classroom and when introducing the chatting noise, but mainly when considering the reverberant classroom instead of the absorbing classroom.
3.2. Binaural Acoustic Measurements Results
Figure 13 shows the binaural Clarity C50 evaluated for the two listeners and two sources in three different positions for the treated C2 and untreated C1 classrooms. The following outcomes can be drawn:
- The results obtained from the two children’s heads are consistent;
- C50 is approximately 2–4 dB higher for the TalkBox source, which has the directivity of a human talker and simulates a single-talker noise source, than for the dodecahedron, an omnidirectional source that simulates multi-talker background noise;
- The left and right ears show similar C50 values when the source is positioned at 0° azimuth. As expected, the right ear exhibits higher clarity up to 6-8 dB at the highest frequencies than the left ear, when the noise source is located at 120° azimuth;
- C50 is higher for all sound sources (target and noise) in the treated classroom across all octave bands, with improvements exceeding 10 dB in most cases. The only exceptions occur at low frequencies and for the dodecahedron source at 1 kHz in S2, where the increase is approximately 4 dB;
- C50 generally increases with frequency in both the treated and untreated classrooms and for both ears. The main exceptions are a negative peak at 1 kHz for the source in S2, particularly with the dodecahedron, and the source in S3, where C50 remains relatively stable above 250 Hz.
- A local minimum around 1 kHz was observed only in the acoustically treated classroom when the TalkBox and the dodecahedron were positioned at 0° azimuth and 1 m from the listener. This feature was not present in the untreated classroom. A possible explanation is that the reduction of late reverberation could have made interference effects between the direct sound and residual early reflections more evident. In the untreated classroom, the higher reverberant energy may have masked these spectral irregularities, resulting in a smoother frequency response.
Table 1 shows the values of ITD, ILD, IACC, C50, and DRR computed from the binaural impulse responses. It can be seen that:
- The results obtained from the two children’s heads are consistent across all source positions and acoustic treatments, except for IACCearly and IACCfull. Differences in ILDearly and ILDfull are observed only for the omnidirectional noise source located at 120° azimuth in the acoustically treated classroom;
- C50 and DRR (left, right, and mean) are consistently higher in the treated classroom, with differences exceeding their respective JNDs by more than 10 and 3 times, respectively. In contrast, ITD, ILD, and IACC do not exhibit clear trends, as the observed differences are generally within or close to their corresponding JNDs.
Table 2 shows the difference between target and noise binaural RIRs, ΔC50, averaged from 250 Hz to 2 kHz. The following findings emerge:
- The results obtained from the two children’s heads are consistent;
- The difference in C50 between the target and noise sources (ΔC50) is smaller under the more favourable condition of a 120° spatial separation than with co-located target and noise sources, by approximately 2–3 dB;
- ΔC50 is about 2 dB smaller with the multi-talker noise source than with the single-talker source;
- When the target and noise sources are co-located in the untreated classroom, ΔC50 does not differ between single and multi-talker sources to a great extent. In the treated classroom, instead, the multi-talker noise source results in lower ΔC50 values;
- With the noise source positioned at 120° relative to the target source, ΔC50 does not differ between the single-talker and multi-talker noise sources in either the untreated or the treated classroom.
3.3. Verbal Working Memory Task Results
The detailed results obtained with the verbal working memory task are reported in Vettori et al. (2022) [39]. The study investigated whether classroom acoustic quality, specifically reverberation time and background noise, could influence second graders’ Verbal Working Memory (VWM) performance. VWM is a foundational process for learning, as it enables the simultaneous storage and manipulation of new information. This is critical in numerous school activities, such as when students listen to a teacher while attempting to comprehend and encode new concepts or take notes. It is particularly important to study the efficiency of VWM in early primary school children, a stage when cognitive processes are still developing. A sample of twenty-five second-graders was administered a validated verbal working memory task (Listening Span Test by Palladino, 2005) in the two different acoustic conditions given by classroom C1 and C2 with a time frame of 1 month and controlled background noise achieved through soundproofing.
Coding the children’s responses yielded significant results for the Span index, for the number of omitted words and for the words recalled.
No statistically significant differences between the two conditions were observed in the other variables (words invention, inversions, intrusions) taken into account.
As shown in Figure 14, the Span index detected, about the maximum sequence of words remembered, was higher in the treated classroom C2, compared to the untreated classroom C1; the index of words recalled was lower in the classroom C1, compared to that in classroom C2; the number of words omitted was higher in the classroom C1, compared to the classroom C2. For these three outcomes, the Wilcoxon signed-rank test identified the difference between the two acoustic contexts as statistically significant.
The results obtained in the tests confirmed what was expected; the score that the children obtained in the very reverberant classroom C1 was lower than in the classroom with the sound-absorbing treatment C2; “classroom bubble”, in the presence of longer reverberation times, affects in a negative way the children’s efficiency in successfully pursuing tasks requiring verbal working memory, particularly when a dual-task paradigm is involved. High school classroom reverberation combined with typical classroom noise can mask or distort speech signals, thereby increasing cognitive load and interfering with semantic processing or task focus. Thus, children who have to perform tests within overly reverberant environments spend some of their cognitive resources understanding and processing phonemes or words masked by reflections, instead of concentrating on keeping the information in mind to answer the task correctly [43].
3.4. Limitations of the Study and Future Developments
The main limitation of this study is the small sample of children who participated in the test, which included 25 pupils divided into two groups. The binaural measurements could be performed only in two representative positions in the two rooms with two different children.
Another limitation of the study is the fact that the sample consists of pupils with a relatively high socio-economic level and does not include pupils with learning problems.
In the future development of the study, it is planned to involve a larger number of pupils from different socio-economic backgrounds.
4. Conclusions
This article presents the results of monoaural and binaural acoustic measurements and comprehension tests conducted in two classrooms representative of the Italian primary school context. Of the two classrooms, one was acoustically treated in accordance with the Italian standard UNI 11532-2 (classroom C2), while the other was not acoustically treated and represents the average Italian school (classroom C1).
Monoaural measurements were carried out in classrooms C1 and C2 both in occupied and in unoccupied conditions. Results show that average reverberation time in the classroom C1 reduces from 1.3 to 1.0 seconds from unoccupied to occupied condition, while average clarity C50 increases from -1.6 to +4.9 dB. The effect of the students’ presence is less pronounced but still noticeable in the acoustically optimized classroom (C2).
In the treated classroom C2, STI reduces when moving from 1 meter in front of the source to the centre of the classroom and when introducing the chatting noise. This effect is less pronounced in the untreated classroom C1, where the STI remains low regardless of the distance from the speaker.
For binaural measurements, no significant differences are observed for the two children’s heads. Clarity C50 is approximately 2–4 dB higher for the source with a human talker directivity than for the omnidirectional source, representing a multi-talker source. In the treated classroom C2, C50 exceeds the values measured in the untreated classroom C1 by more than 10 dB in the mid- and high-frequency range. As expected, the right ear exhibits higher clarity than the left ear up to 6-8 dB at the highest frequencies, when the noise source is positioned at an azimuth of 120°.
As expected, the acoustic treatment leads to a clear increase in C50 and DRR, with differences exceeding their respective JNDs by more than 10 and 3 times, respectively. Conversely, ITD, ILD, and IACC do not exhibit clear trends, as the observed differences are generally within or close to their corresponding JNDs. Differences between the two children’s heads are mainly observed for IACC.
The results also show that ΔC50 between the target and noise sources is smaller under the more favourable condition of a 120° spatial azimuth separation than with colocation. Furthermore, the single-talker noise source (Talkbox) produces larger ΔC50 than the omnidirectional multi-talker noise source in the treated classroom, indicating a greater detrimental effect. In the untreated room, this effect is not evident.
In conclusion, the benefit appears to originate primarily from improvements in speech clarity and direct-sound dominance rather than from enhanced binaural localization or spatial-segregation cues.
As reported, the aim of the work was to investigate how the binaural measurements contribute to the interpretation of the cognitive results by identifying which auditory cues are affected by the acoustic treatment. It was shown that while ITD, ILD, and IACC remained largely unvaried between classrooms, substantial increases were observed for C50 and DRR. These findings suggest that the improved verbal working-memory performance found in the treated classroom is unlikely to be related to enhanced localization cues (ITD and ILD). Instead, it may be associated with a more favourable balance between direct and reverberant sound and with increased speech clarity at the listener’s ears. It can be suggested that under these conditions, children may require less effort to decode the spoken information, leaving more cognitive resources available for storing and processing in verbal working-memory tasks.
These findings contribute new knowledge to the field of classroom acoustics. However, further experiments using auralised binaural signals with children are needed to determine whether these parameters are related to speech intelligibility and cognitive performance. For now, the results obtained in the comprehension tests confirmed what was expected; the score of the children in the untreated classroom C1 was lower than that of the children in the treated classroom C2, demonstrating how the bubbling noise in the presence of longer reverberation times negatively affects the children’s efficiency in those tests that required the use of verbal working memory.
This is because children in excessively reverberant environments spend part of their cognitive resources on understanding and processing any phonemes or words masked by reflections, instead of concentrating on keeping in mind the information needed to answer the task correctly.
Author Contributions
For research articles with several authors, a short paragraph specifying their individual contributions must be provided. The following statements should be used “Conceptualization, X.X. and Y.Y.; methodology, X.X.; software, X.X.; validation, X.X., Y.Y. and Z.Z.; formal analysis, X.X.; investigation, X.X.; resources, X.X.; data curation, X.X.; writing—original draft preparation, X.X.; writing—review and editing, X.X.; visualization, X.X.; supervision, X.X.; project administration, X.X.; funding acquisition, Y.Y. All authors have read and agreed to the published version of the manuscript.” Please turn to the CRediT taxonomy for the term explanation. Authorship must be limited to those who have contributed substantially to the work reported.
Funding
This research was founded by the Foundation of the Savings Bank of Florence, by the Municipality of Florence and by a local manufacturer (Manifattura Maiano spa).
Data Availability Statement
We encourage all authors of articles published in MDPI journals to share their research data. In this section, please provide details regarding where data supporting reported results can be found, including links to publicly archived datasets analyzed or generated during the study. Where no new data were created, or where data is unavailable due to privacy or ethical restrictions, a statement is still required. Suggested Data Availability Statements are available in section “MDPI Research Data Policies” at https://www.mdpi.com/ethics.
Acknowledgments
In this section, you can acknowledge any support given which is not covered by the author contribution or funding sections. This may include administrative and technical support, or donations in kind (e.g., materials used for experiments).
Conflicts of Interest
Declare conflicts of interest or state “The authors declare no conflict of interest.” Authors must identify and declare any personal circumstances or interest that may be perceived as inappropriately influencing the representation or interpretation of reported research results. Any role of the funders in the design of the study; in the collection, analyses or interpretation of data; in the writing of the manuscript; or in the decision to publish the results must be declared in this section. If there is no role, please state “The funders had no role in the design of the study; in the collection, analyses, or interpretation of data; in the writing of the manuscript; or in the decision to publish the results”.
References
- Astolfi, A.; Bottalico, P.; Barbato, G. Subjective and objective speech intelligibility investigations in primary school classrooms. J. Acoust. Soc. Am. 2012, 131(1), 247–57. [Google Scholar] [CrossRef] [PubMed]
- Buss, E.; Leibold, L.J.; Porter, H.L.; Grose, J.H. Speech recognition in one- and two-talker maskers in school-age children and adults: Development of perceptual masking and glimpsing. J. Acoust. Soc. Am. 2017, 141(4), 2650–2660. [Google Scholar] [CrossRef]
- Leibold, L.J.; Buss, E. Masked Speech Recognition in School-Age Children. Front. Psychol. 10, 1981. [CrossRef]
- Blauert, J. The Technology of Binaural Listening; Springer, 2012. [Google Scholar]
- Bronkhorst, A.W. The cocktail-party problem revisited: early processing and selection of multi-talker speech. Atten. Percept. Psychophys. 2015, 77(5), 1465–87. [Google Scholar] [CrossRef] [PubMed] [PubMed Central]
- Peng, E.Z.; Litovsky, R.Y. The role of interaural differences, head shadow, and binaural redundancy in binaural intelligibility benefits among school-aged children. Trends Hear. 2021, 25, 1–14. [Google Scholar] [CrossRef]
- Dieudonné, B.; Francart, T. Redundant Information Is Sometimes More Beneficial Than Spatial Information to Understand Speech in Noise. Ear Hear. 2019, 40, 545–554. [Google Scholar] [CrossRef]
- Ching, T.Y.C.; van Wanrooy, E.; Dillon, H.; Carter, L. Spatial release from masking in normal-hearing children and children who use hearing aids. J. Acoust. Soc. Am. 2011, 129, 368–375. [Google Scholar] [CrossRef]
- Misurelli, S.M.; Litovsky, R.Y. Spatial release from masking in children with normal hearing and with bilateral cochlear implants: effect of interferer asymmetry. J. Acoust. Soc. Am. 2012, 132(1), 380–91. [Google Scholar] [CrossRef] [PubMed] [PubMed Central]
- Corbin, N.E.; Buss, E.; Leibold, L.J. Spatial Release from Masking in Children: Effects of Simulated Unilateral Hearing Loss. Ear Hear. 2017, 38, 223–235. [Google Scholar] [CrossRef]
- Griffin, A.M.; Poissant, S.F.; Freyman, R.L. Speech-in-Noise and Quality-of-Life Measures in School-Aged Children with Normal Hearing and With Unilateral Hearing Loss. Ear Hear. 2019, 40, 887–904. [Google Scholar] [CrossRef]
- Misurelli, S.M.; Litovsky, R.Y. Spatial release from masking in reverberation for school-age children. J. Acoust. Soc. Am. 2021, 150(5), 3263–3274. [Google Scholar] [CrossRef]
- Peng, E.Z.; Litovsky, R.Y. The Role of Interaural Differences, Head Shadow, and Binaural Redundancy in Binaural Intelligibility Benefits Among School-Aged Children. Trends Hear. 2021, 25, 23312165211045313. [Google Scholar] [CrossRef]
- Peng, Z.E.; Pausch, F.; Fels, J. Spatial release from masking in reverberation for school-age children. J. Acoust. Soc. Am. 2021, 150, 3263–3274. [Google Scholar] [CrossRef]
- Brown, A.D.; Stecker, G.C.; Tollin, D.J. The Precedence Effect in Sound Localization. JARO 2015, 16, 1–28. [Google Scholar] [CrossRef]
- Wallach, H.; Newman, E.B.; Rosenzweig, R. The precedence effect in sound localization. Am. J. Psychol. 1949, 62, 315–336. [Google Scholar] [CrossRef]
- Litovsky, R.Y.; Colburn, H.S.; Yost, W.A.; Guzman, S.J. The precedence effect. J. Acoust. Soc. Am. 1999, 106, 1633–1654. [Google Scholar] [CrossRef]
- Litovsky, R.Y.; Godar, S.P. Difference in precedence effect between children and adults signifies development of sound localization abilities in complex listening tasks. J. Acoust. Soc. Am. 2010, 128, 1979–1991. [Google Scholar] [CrossRef] [PubMed]
- Clifton, R.K.; Morrongiello, B.A.; Dowd, J.M. A developmental look at an auditory illusion: the precedence effect. Dev. Psychol. 1984, 17, 519–536. [Google Scholar] [CrossRef]
- Kidd, G., Jr.; Mason, C.R.; Brughera, A.; Hartmann, W.M. The role of reverberation in release from masking due to spatial separation of sources for speech identification. Acta Acust. United Acust. 2005, 91, 526–536. [Google Scholar]
- Leist, L.; Breuer, C.; Yadav, M.; Fremerey, S.; Fels, J.; Raake, A.; Lachmann, T.; Schlittmeier, S.J.; Klatte, M. Differential Effects of Task-Irrelevant Monaural and Binaural Classroom Scenarios on Children’s and Adults’ Speech Perception, Listening Comprehension, and Visual–Verbal Short-Term Memory. Int. J. Environ. Res. Public Health 2022, 19, 15998. [Google Scholar] [CrossRef]
- Loh, K.; Yadav, M.; Persson Waye, K.; Klatte, M.; Fels, J. Toward Child-Appropriate Acoustic Measurement Methods in Primary Schools and Daycare Centers. Front. Built Environ. 2022, 8, 688847. [Google Scholar] [CrossRef]
- Mealings, K. The Effect of Classroom Acoustic Treatment on Listening, Learning, and Well-being: A Scoping Review. Acoust. Aust. 2023, 51, 279–291. [Google Scholar] [CrossRef]
- Ente Italiano di Normazione. UNI 11367:2023; Acustica in edilizia - Classificazione acustica delle unità immobiliari - Procedura di valutazione e verifica in opera [Building Acoustics - Acoustic Classification of Building Units - Procedure for On-Site Assessment and Verification]. Ente Italiano di Normazione: Milano, Italy, 2023.
- Ente Italiano di Normazione. UNI 11532-1:2018; Caratteristiche Acustiche Interne di Ambienti Confinati — Metodi di Progettazione e Tecniche di Valutazione — Parte 1: Requisiti Generali [Internal Acoustic Characteristics of Confined Spaces — Design Methods and Evaluation Techniques — Part 1: General Requirements]. Ente Italiano di Normazione: Milano, Italy, 2018.
- Ente Italiano di Normazione. UNI 11532-2; Caratteristiche Acustiche Interne Di Ambienti Confinati – Metodi Di Progettazione E Tecniche Di Valutazione - Parte 2: Settore Scolastico [Internal Acoustic Characteristics of Confined Spaces — Design Methods and Evaluation Techniques — Part 2: School Sector]. Ente Italiano di Normazione: Milano, Italy, 2015.
- ISO 3382-1:2009; Acoustics — Measurement of Room Acoustic Parameters — Part 1: Performance Spaces. International Organization for Standardization: Geneva, Switzerland, 2009.
- Astolfi, A.; Minelli, G.; Puglisi, G.E. A basic protocol for the acoustic characterization of small and medium-sized classrooms. J. Acoust. Soc. Am. 2022, 152(3), 1646–1659. [Google Scholar] [CrossRef]
- Guastamacchia, A.; Rosso, R.G.; Puglisi, G.E.; Riente, F.; Shtrepi, L.; Astolfi, A. Real and Virtual Lecture Rooms: Validation of a Virtual Reality System for the Perceptual Assessment of Room Acoustical Quality. Acoustics 2024, 6(4), 933–965. [Google Scholar] [CrossRef]
- Katz, B.F.G.; Noisternig, M. A comparative study of interaural time delay estimation methods. J. Acoust. Soc. Am. 2014, 135, 3530–3540. [Google Scholar] [CrossRef]
- Hládek, L.; Ewert, S.D.; Seeber, B.U. Communication conditions in virtual acoustic scenes in an underground station. In Proceedings of the 2021 Immersive and 3D Audio: From Architecture to Automotive (I3DA), Online; IEEE, 8–10 September 2021; pp. 1–8. [Google Scholar]
- Hummersone, C. Impulse response acoustic information calculator, GitHub, 2023. Available online: https://github.com/IoSR-Surrey/MatlabToolbox.
- Zahorik, P. Direct-to-reverberant energy ratio sensitivity. J. Acoust. Soc. Am. 2002, 112, 2110–2117. [Google Scholar] [CrossRef]
- Lavandier, M.; Jelfs, S.; Culling, J.F.; Watkins, A.J.; Raimond, A.P.; Makin, S.J. Binaural prediction of speech intelligibility in reverberant rooms with multiple noise sources. J. Acoust. Soc. Am. 2012, 131(1), 218–231. [Google Scholar] [CrossRef]
- Spencer, N.J.; Hawley, M.L.; Colburn, H.S. Relating interaural difference sensitivities for several parameters measured in normal-hearing and hearing-impaired listeners. J. Acoust. Soc. Am. 140(3), 1783–1799. [CrossRef]
- Larsen, E.; Iyer, N.; Lansing, C.R.; Feng, A.S. On the minimum audible difference in direct-to-reverberant energy ratio. J. Acoust. Soc. Am. 124(1), 450–461. [CrossRef]
- Bradley, J.S.; Reich, R.D.; Norcross, S.G. A just noticeable difference in C50 for speech. Appl. Acoust. 58(2), 99–108. [CrossRef]
- Palladino, P. A measure of verbal working memory for children from second to fifth grade: Norms and validation. Psicol. Clin. Dello Svilupp. 2005, 9(1), 129–149. [Google Scholar]
- Vettori, G.; Di Leonardo, L.; Secchi, S.; Astolfi, A.; Bigozzi, L. Primary school children’s verbal working memory performances in classrooms with different acoustic conditions. Cogn. Dev. 2022, 64, 101256. [Google Scholar] [CrossRef]
- ISO 9921:2003; Ergonomics — Assessment of Speech Communication. International Organization for Standardization: Geneva, Switzerland, 2003.
- Shield, B.; Dockrell, J. E. External and internal noise surveys of London primary schools. J. Acoust. Soc. Am. 2004, 115(2), 730–738. [Google Scholar] [CrossRef]
- Carullo, A.; Vallan, A.; Astolfi, A.; Pavese, L.; Puglisi, G.E. Validation of calibration procedures and uncertainty estimation of contact-microphone based vocal analyzers. Measurement 2015, Volume 74, Pages 130–142. [Google Scholar] [CrossRef]
- Leibold, L.J.; Buss, E. Masked Speech Recognition in School-Age Children. Front Psychol. Published. 2019, 10, 1981. [Google Scholar] [CrossRef]
Figure 1.
Experimental methodology workflow, including site selection, monaural and binaural acoustic characterization, and the crossover design for comprehension testing in the two sample classrooms (untreated C1 and acoustically treated C2).
Figure 1.
Experimental methodology workflow, including site selection, monaural and binaural acoustic characterization, and the crossover design for comprehension testing in the two sample classrooms (untreated C1 and acoustically treated C2).
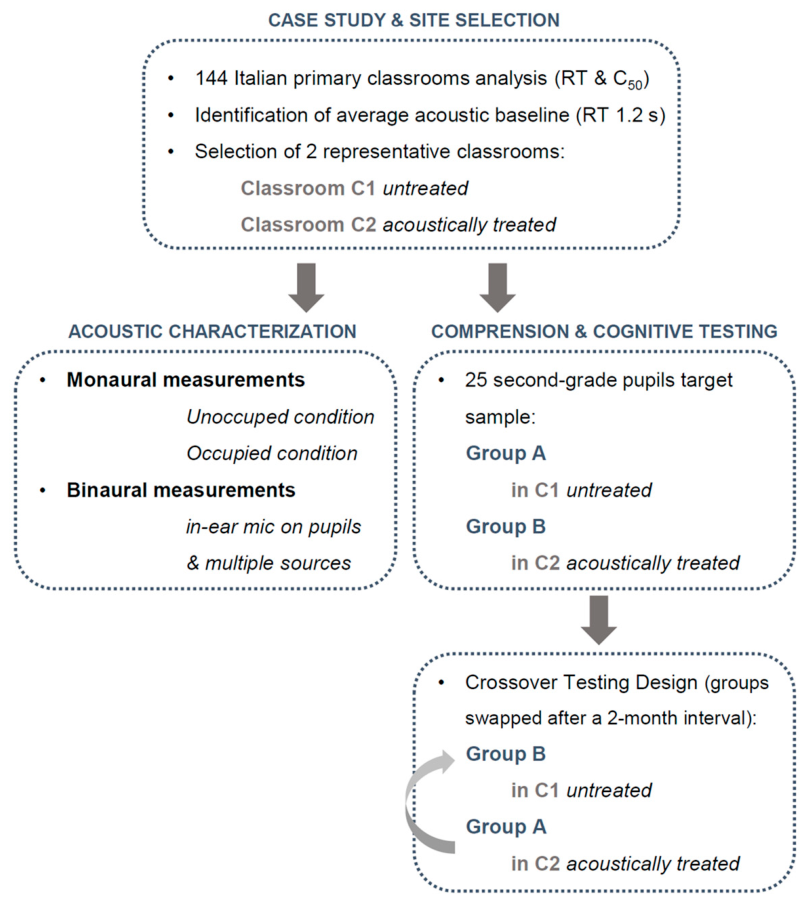
Figure 2.
Statistical distribution of results of Reverberation Time (average 250 – 4,000 Hz) in a group of 144 classrooms.
Figure 2.
Statistical distribution of results of Reverberation Time (average 250 – 4,000 Hz) in a group of 144 classrooms.
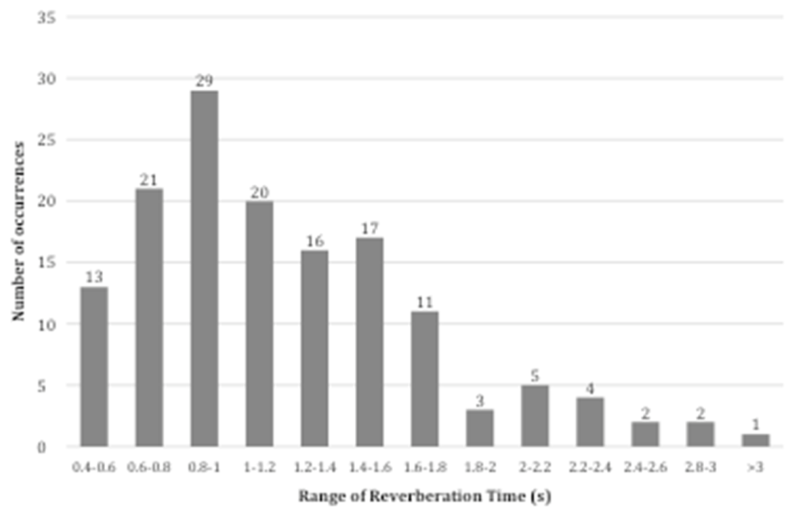
Figure 3.
The case study: two twin classrooms with different acoustic quality. The untreated classroom C1 on the left, and the treated classroom C2 on the right.
Figure 3.
The case study: two twin classrooms with different acoustic quality. The untreated classroom C1 on the left, and the treated classroom C2 on the right.
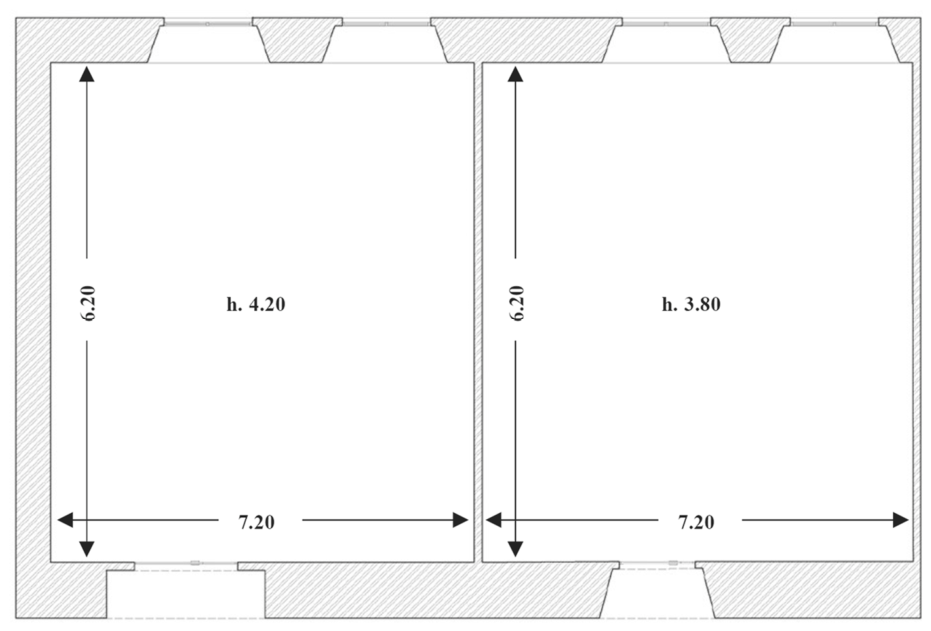
Figure 4.
Experimental setup of binaural measurements: in classroom C1, on the left, and in classroom C2, on the right. Positions of the sources (S1, in the target speech position at 3.6 m from the listener, S2, at one meter from the listeners, S3 at one meter from the listener, 120°), and listeners (L1 listener type one, L2 listener type two).
Figure 4.
Experimental setup of binaural measurements: in classroom C1, on the left, and in classroom C2, on the right. Positions of the sources (S1, in the target speech position at 3.6 m from the listener, S2, at one meter from the listeners, S3 at one meter from the listener, 120°), and listeners (L1 listener type one, L2 listener type two).
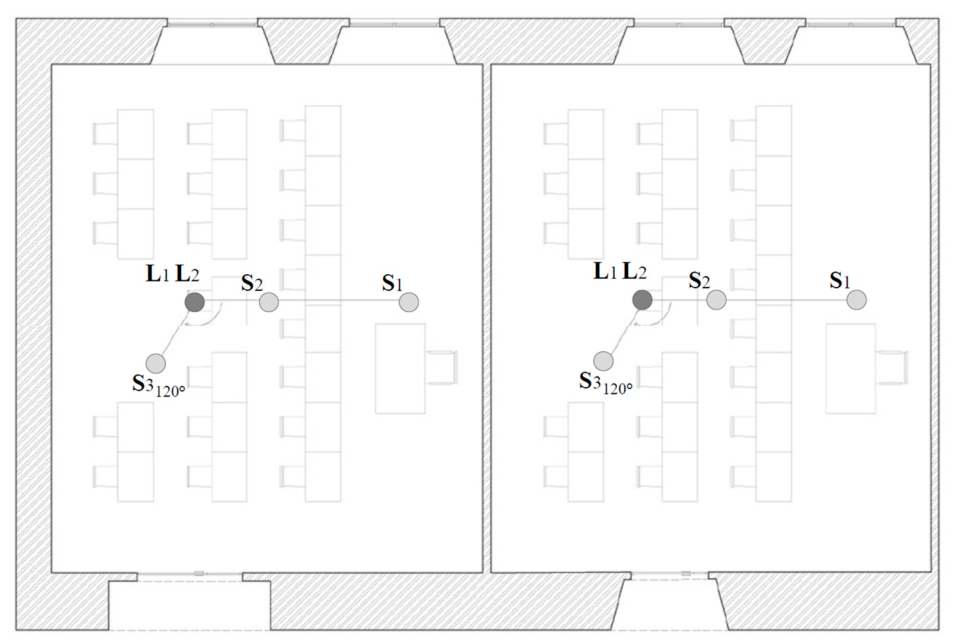
Figure 5.
Experimental setup of binaural measurements in the classroom C1 (untreated): listener L1 and the two sources (S2, Talkbox at one meter from the listener L1 and dodecahedron S3, at one meter from the listener).
Figure 5.
Experimental setup of binaural measurements in the classroom C1 (untreated): listener L1 and the two sources (S2, Talkbox at one meter from the listener L1 and dodecahedron S3, at one meter from the listener).
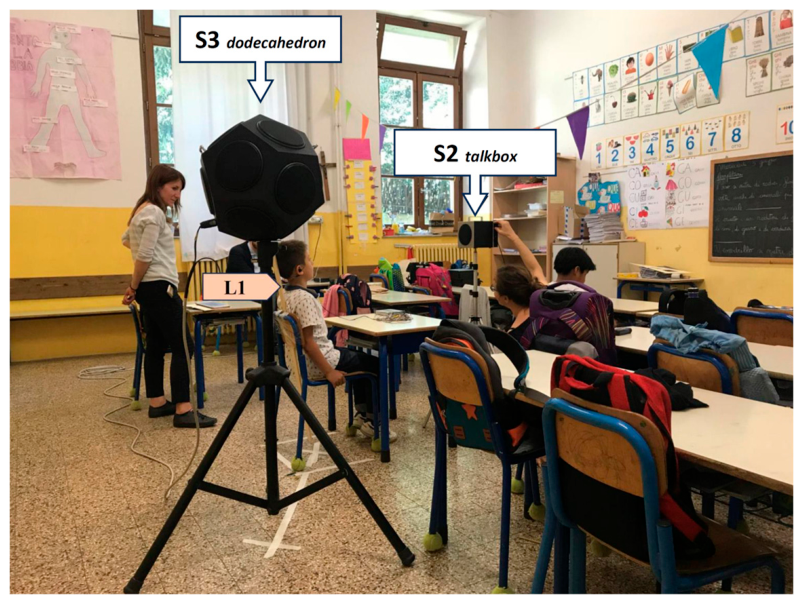
Figure 6.
Experimental setup of binaural measurements in the classroom C1: on the left, listener type one (L1); on the right, listener type two (L2).
Figure 6.
Experimental setup of binaural measurements in the classroom C1: on the left, listener type one (L1); on the right, listener type two (L2).
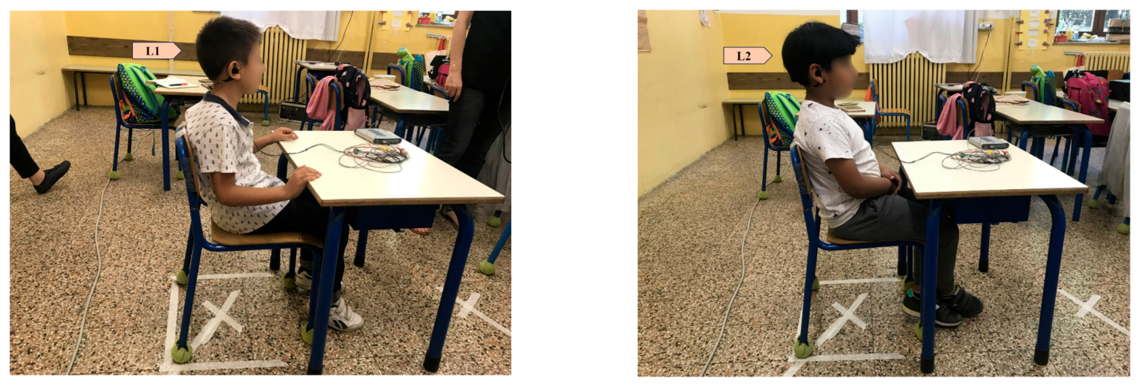
Figure 7.
Experimental setup during the comprehension tests: in the classroom C1 on the left, and in the classroom C2 on the right. Positions of the talkbox (T), microphones (R1 at one meter from the target speech, R2 in the middle), and the masking sound source (dodecahedron) (M).
Figure 7.
Experimental setup during the comprehension tests: in the classroom C1 on the left, and in the classroom C2 on the right. Positions of the talkbox (T), microphones (R1 at one meter from the target speech, R2 in the middle), and the masking sound source (dodecahedron) (M).
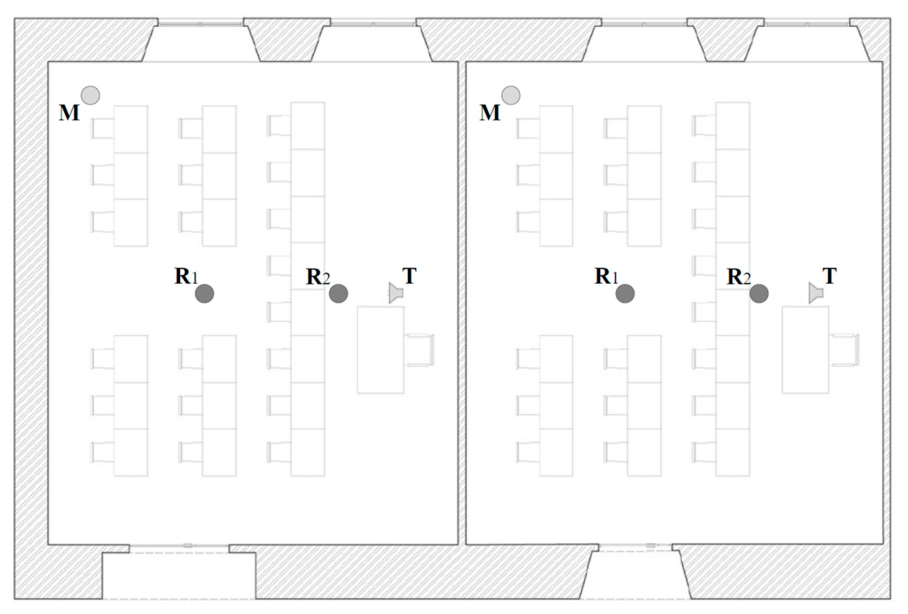
Figure 8.
Experimental setup during the comprehension tests: on the left, positions of the talkbox (T) and microphones (R2 at one meter from the talkbox, R1 in the middle) in the classroom C1; on the right, positions of the masking sound source (dodecahedron) (M) in the classroom C2. In the photo the absorbing panels placed near the walls are shown.
Figure 8.
Experimental setup during the comprehension tests: on the left, positions of the talkbox (T) and microphones (R2 at one meter from the talkbox, R1 in the middle) in the classroom C1; on the right, positions of the masking sound source (dodecahedron) (M) in the classroom C2. In the photo the absorbing panels placed near the walls are shown.
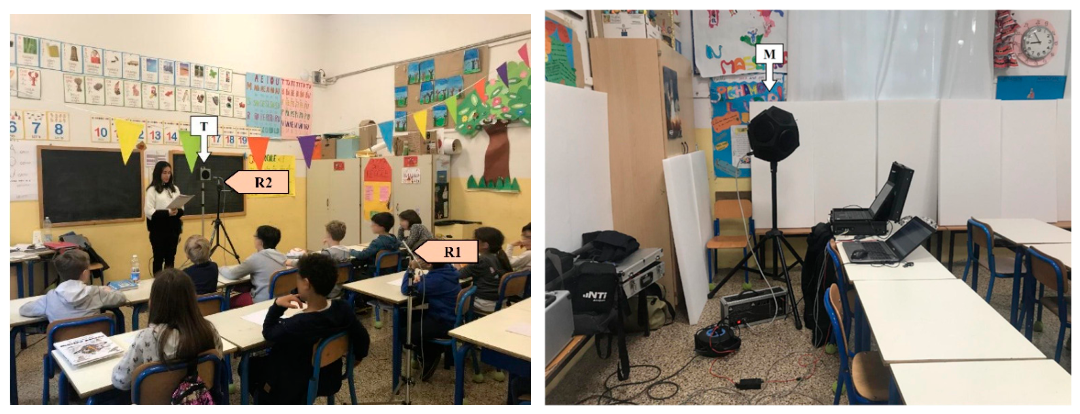
Figure 9.
SPL’s in the classrooms C1 and C2 due to the talk box, to the teacher’s speech, to the babble reproduce by the dodecahedron and to background noise.
Figure 9.
SPL’s in the classrooms C1 and C2 due to the talk box, to the teacher’s speech, to the babble reproduce by the dodecahedron and to background noise.
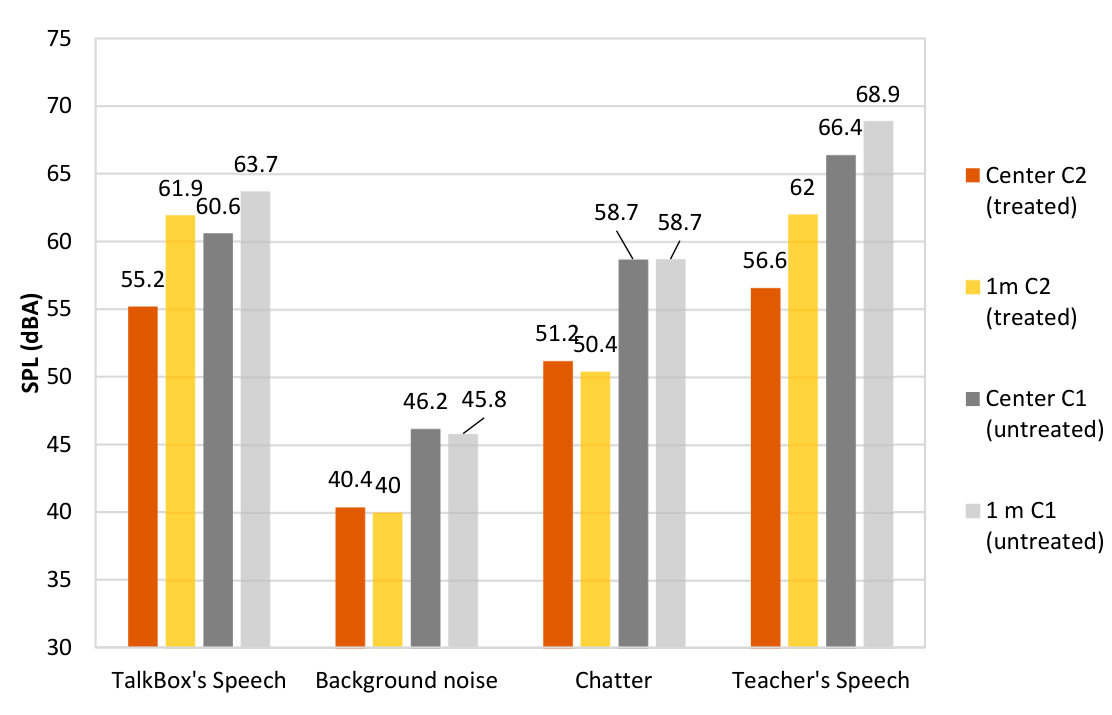
Figure 10.
Average Reverberation Time in the two case study classrooms C1 and C2 (untreated and treated) with (occupied) and without children (unoccupied).
Figure 10.
Average Reverberation Time in the two case study classrooms C1 and C2 (untreated and treated) with (occupied) and without children (unoccupied).
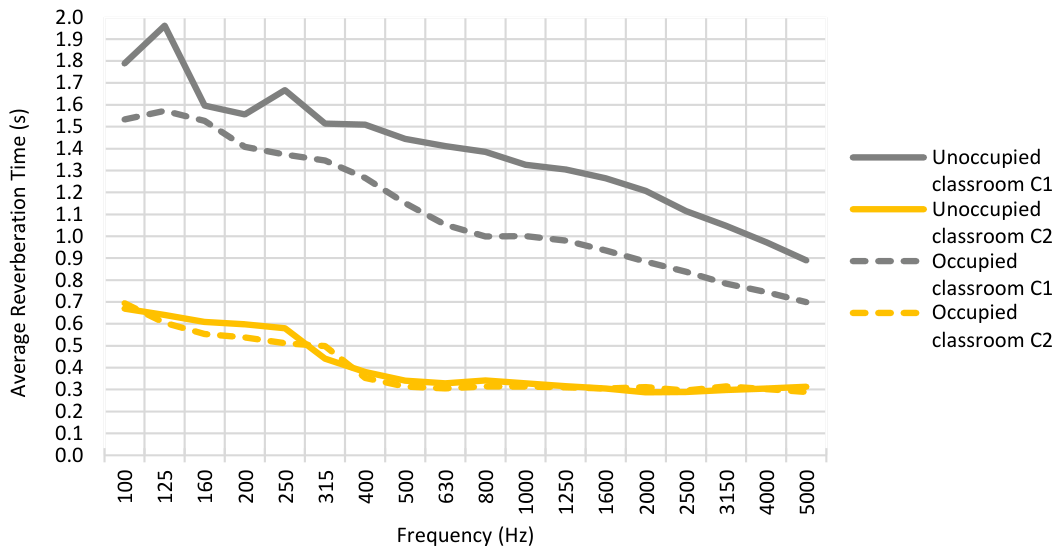
Figure 11.
Average Clarity C50 in the two case study classrooms C1 and C2, with (occupied) and without children (unoccupied).
Figure 11.
Average Clarity C50 in the two case study classrooms C1 and C2, with (occupied) and without children (unoccupied).
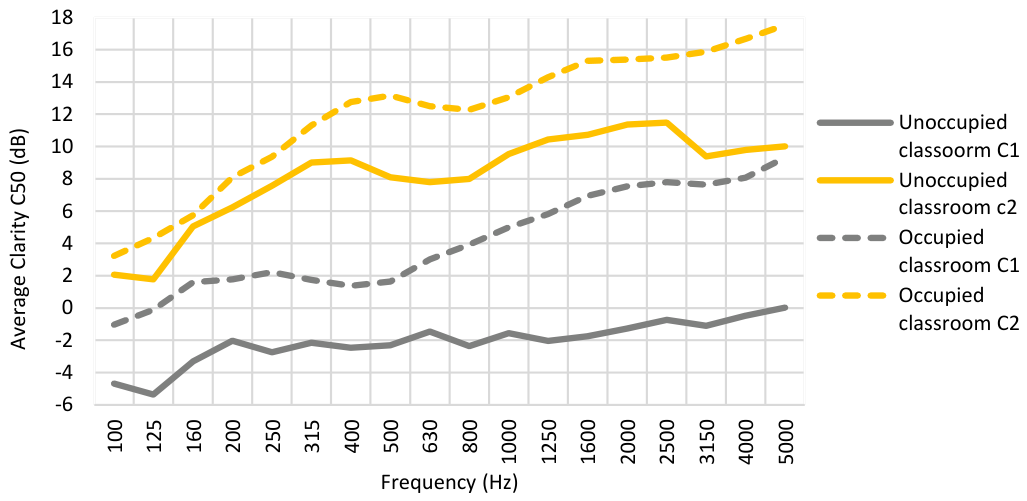
Figure 12.
Speech Transmission Index in the two occupied classrooms C1 and C2, 1 meter in front of the talkbox and in the center of the classroom, with normal background and with background due to the babble reproduced by the dodecahedron.
Figure 12.
Speech Transmission Index in the two occupied classrooms C1 and C2, 1 meter in front of the talkbox and in the center of the classroom, with normal background and with background due to the babble reproduced by the dodecahedron.
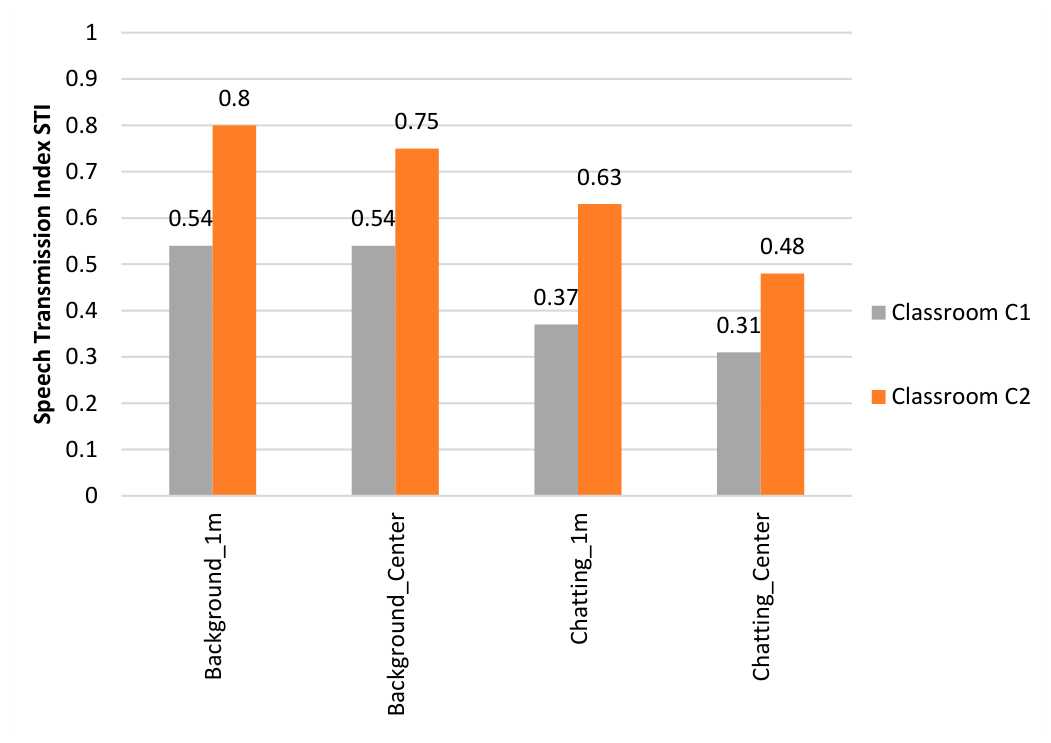
Figure 13.
Binaural Clarity in the untreated (C1) and treated (C2) classrooms for two different source types (Talkbox and dodecahedron) located in three positions (S1, S2 and S3).
Figure 13.
Binaural Clarity in the untreated (C1) and treated (C2) classrooms for two different source types (Talkbox and dodecahedron) located in three positions (S1, S2 and S3).
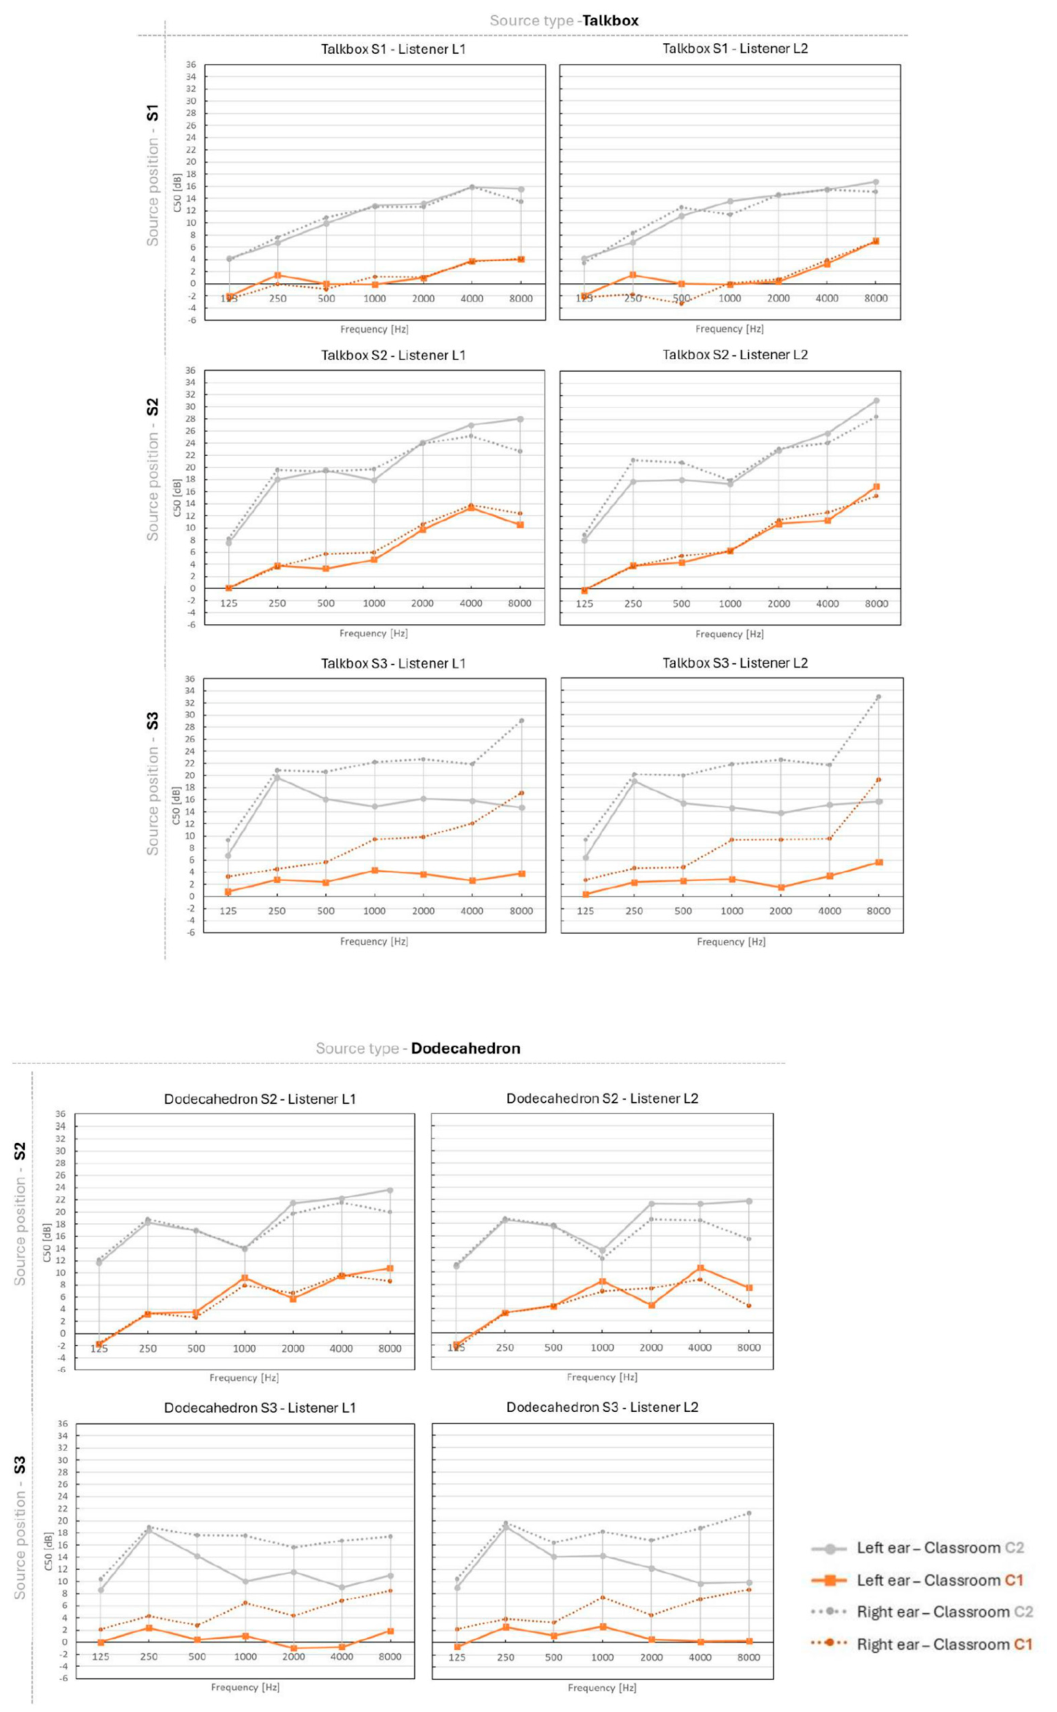
Figure 14.
Average scores of Recalled words, Omitted words and Span indexes as a function of the acoustic condition. Error bars indicate standard errors of the means. Note: p < 0.05.
Figure 14.
Average scores of Recalled words, Omitted words and Span indexes as a function of the acoustic condition. Error bars indicate standard errors of the means. Note: p < 0.05.
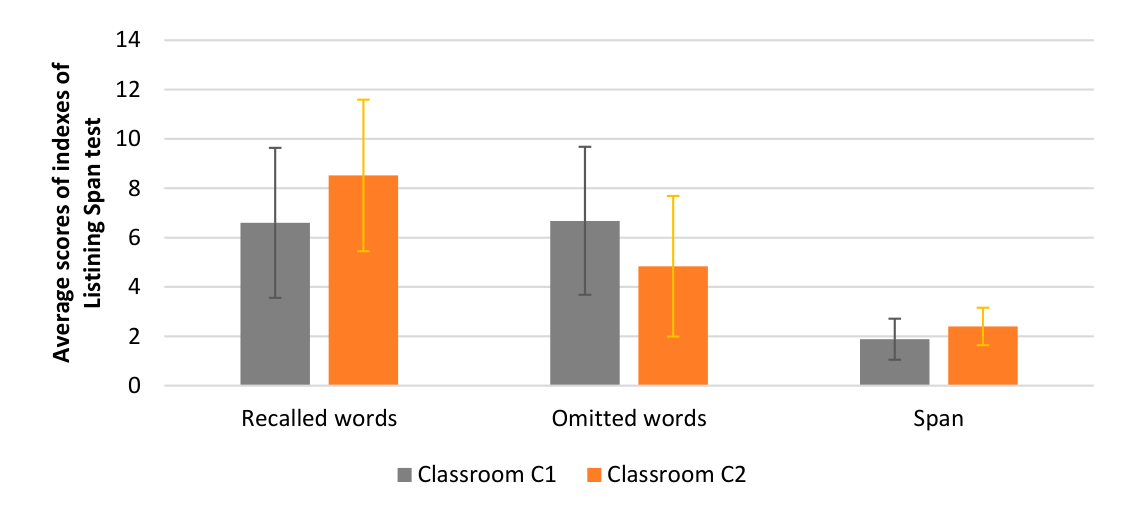

Table 1.
ITD (low-pass filtered with a cut-off frequency of 1.3 kHz), ILD (high-pass filtered with a cut-off frequency of 1.3 kHz), broadband IACC, left ear, right ear and within-ear mean DRR (broadband) and C50 (average from 250 Hz to 2 kHz) values computed from the binaural impulse responses.
Table 1.
ITD (low-pass filtered with a cut-off frequency of 1.3 kHz), ILD (high-pass filtered with a cut-off frequency of 1.3 kHz), broadband IACC, left ear, right ear and within-ear mean DRR (broadband) and C50 (average from 250 Hz to 2 kHz) values computed from the binaural impulse responses.
| Listener L1 | Listener L2 | |||||||||||||||||||
|---|---|---|---|---|---|---|---|---|---|---|---|---|---|---|---|---|---|---|---|---|
| Talker type | Single-talker noise (Talkbox) | Multi-talker noise (Dodecahedron) | Single-talker noise (Talkbox) | Multi-talker noise (Dodecahedron) | ||||||||||||||||
| Speech/Noise position | T@3.6m,0° | N@1m,0° | N@1m,120° | N@1m,0° | N@1m,120° | T@3.6m,0° | N@1m,0° | N@1m,120° | N@1m,0° | N@1m,120° | ||||||||||
| Classroom | C1 | C2 | C1 | C2 | C1 | C2 | C1 | C2 | C1 | C2 | C1 | C2 | C1 | C2 | C1 | C2 | C1 | C2 | C1 | C2 |
| ITDearly (μs) | 41.7 | 62.5 | 41.7 | 20.8 | 541.7 | 625.0 | 48.6 | 27.8 | 444.4 | 520.8 | 55.6 | 62.5 | 20.8 | 20.8 | 583.3 | 562.5 | 55.6 | 41.7 | 486.1 | 465.3 |
| ITDfull (μs) | 34.7 | 62.5 | 34.7 | 20.8 | 541.7 | 625.0 | 48.6 | 27.8 | 416.7 | 520.8 | 55.6 | 62.5 | 20.8 | 20.8 | 583.3 | 562.5 | 55.6 | 41.7 | 437.5 | 465.3 |
| ILDearly (dB) | -0.7 | -0.2 | -1.2 | 1.2 | -9.9 | -10.6 | 0.8 | 1.0 | -6.2 | -6.6 | -1.0 | -1.7 | -0.5 | -0.4 | -8.4 | -10.6 | 0.0 | 2.0 | -6.5 | -9.6 |
| ILDfull (dB) | -0.7 | -0.2 | -1.1 | 1.2 | -9.0 | -10.6 | 0.7 | 1.0 | -5.3 | -6.5 | -1.0 | -1.7 | -0.5 | -0.4 | -7.6 | -10.6 | 0.0 | 2.0 | -5.4 | -9.5 |
| IACCearly (-) | 0.5 | 0.6 | 0.9 | 0.8 | 0.4 | 0.5 | 0.6 | 0.7 | 0.2 | 0.3 | 0.5 | 0.7 | 0.8 | 0.9 | 0.5 | 0.4 | 0.7 | 0.7 | 0.3 | 0.4 |
| IACClate (-) | 0.1 | 0.2 | 0.2 | 0.4 | 0.1 | 0.3 | 0.2 | 0.3 | 0.3 | 0.3 | 0.1 | 0.2 | 0.1 | 0.4 | 0.1 | 0.3 | 0.2 | 0.4 | 0.2 | 0.4 |
| IACCfull (-) | 0.4 | 0.6 | 0.8 | 0.8 | 0.3 | 0.5 | 0.5 | 0.7 | 0.2 | 0.3 | 0.4 | 0.7 | 0.8 | 0.9 | 0.4 | 0.4 | 0.6 | 0.7 | 0.2 | 0.4 |
| C50_L (dB) | -0.1 | 12.5 | 5.1 | 18.6 | 2.0 | 13.1 | 5.6 | 16.8 | 0.9 | 11.3 | -0.4 | 11.6 | 6.5 | 19.5 | 1.2 | 14.3 | 5.8 | 16.8 | -0.3 | 12.7 |
| C50_R (dB) | 0.1 | 12.4 | 6.7 | 19.9 | 6.8 | 19.7 | 5.7 | 16.5 | 4.3 | 16.0 | -1.2 | 11.8 | 7.3 | 20.0 | 6.5 | 20.3 | 5.4 | 15.8 | 4.0 | 16.3 |
| C50_mean (dB) | 0.0 | 12.5 | 6.0 | 19.3 | 5.1 | 17.6 | 5.7 | 16.7 | 3.0 | 14.3 | -0.7 | 11.7 | 6.9 | 19.8 | 4.7 | 18.3 | 5.6 | 16.3 | 2.4 | 14.9 |
| DRR_L (dB) | -2.7 | 5.8 | 8.5 | 16.5 | -3.6 | 2.6 | 4.7 | 11.2 | -7.9 | -3.2 | -1.8 | 5.5 | 8.8 | 15.8 | -3.0 | 3.8 | 5.9 | 9.3 | -9.3 | -2.3 |
| DRR_R (dB) | -2.4 | 6.6 | 8.0 | 15.0 | 8.9 | 14.7 | 3.8 | 9.8 | 0.7 | 2.8 | -2.2 | 5.9 | 8.6 | 15.3 | 7.7 | 14.5 | 5.7 | 7.1 | 0.8 | 5.5 |
| DRR_mean (dB) | -2.6 | 6.2 | 8.3 | 15.8 | 6.1 | 11.9 | 4.3 | 10.5 | -1.7 | 0.8 | -2.0 | 5.7 | 8.7 | 15.5 | 5.0 | 11.9 | 5.8 | 8.3 | -1.8 | 3.1 |
Table 2.
Difference between target and noise binaural RIRs C50 averaged from 250 Hz to 2 kHz.
|
|
Untreated Classroom (C1) | Treated Classroom(C2) | ||||||
|---|---|---|---|---|---|---|---|---|
| C50_L (dB) | C50_R (dB) | C50_mean (dB) | C50_L (dB) | C50_R (dB) | C50_mean (dB) | |||
| L2 | Single-talker | T@3.6m,0° | -6.9 | -8.5 | -7.6 | -6.1 | -7.5 | -6.8 |
| N@1m,0° | ||||||||
| T@3.6m,0° | -1.6 | -7.7 | -5.4 | -0.5 | -7.3 | -5.1 | ||
| N@1m,120° | ||||||||
| Multi-talker | T@3.6m,0° | -6.2 | -6.7 | -6.3 | -4.3 | -4.1 | -4.2 | |
| N@1m,0° | ||||||||
| T@3.6m,0° | -0.1 | -5.2 | -3.1 | 1.2 | -3.5 | -1.8 | ||
| N@1m,120° | ||||||||
| L1 | Single-talker | T@3.6m,0° | -5.2 | -6.6 | -6.0 | -7.9 | -8.3 | -8.1 |
| N@1m,0° | ||||||||
| T@3.6m,0° | -2.2 | -6.8 | -5.1 | -2.7 | -8.5 | -6.6 | ||
| N@1m,120° | ||||||||
| Multi-talker | T@3.6m,0° | -5.7 | -5.6 | -5.7 | -5.1 | -4.0 | -4.7 | |
| N@1m,0° | ||||||||
| T@3.6m,0° | -1.0 | -4.3 | -3.0 | -1.1 | -4.6 | -3.2 | ||
| N@1m,120° | ||||||||
Disclaimer/Publisher’s Note: The statements, opinions and data contained in all publications are solely those of the individual author(s) and contributor(s) and not of MDPI and/or the editor(s). MDPI and/or the editor(s) disclaim responsibility for any injury to people or property resulting from any ideas, methods, instructions or products referred to in the content. |
© 2026 by the authors. Licensee MDPI, Basel, Switzerland. This article is an open access article distributed under the terms and conditions of the Creative Commons Attribution (CC BY) license (http://creativecommons.org/licenses/by/4.0/).
Copyright: This open access article is published under a Creative Commons CC BY 4.0 license, which permit the free download, distribution, and reuse, provided that the author and preprint are cited in any reuse.