

Submitted:
21 August 2026
Posted:
24 August 2026
You are already at the latest version
Abstract
High-altitude (HA, >2500 m) hypobaric hypoxia, together with oxidative stress and ultraviolet radiation, can induce DNA damage and disrupt telomere homeostasis. Telomeres are essential for chromosomal integrity and cellular viability and are particularly vulnerable to oxidative damage, which may contribute to High-Altitude Pulmonary Edema (HAPE) and its severity. The association among telomere dynamics, oxidative stress, and HAPE risk, however, remains poorly understood. This case-control study included HA native residents (HLs, n = 247), HAPE-free sojourners (controls, n = 262), and HAPE patients (n = 371), with patients further classified as mild, moderate, or severe. The study investigated associations among telomere length, telomerase activity, oxidative stress, telomere-associated gene expression, single-nucleotide polymorphisms (SNPs), and protein–protein interactions. Telomere length was measured by quantitative real-time PCR (qRT-PCR), 8-hydroxy-2′-deoxyguanosine (8-oxo-dG) by ELISA, telomerase activity using the TRAPeze assay, gene expression by qRT-PCR, and SNPs using the Global Screening Array (GSA). Protein–protein interactions were analyzed using STRING. HAPE patients exhibited shorter telomeres, increased telomerase activity, and elevated 8-oxo-dG levels (P < 0.0001). In HAPE patients, telomere length was positively correlated with telomerase activity and negatively correlated with 8-oxo-dG levels (P < 0.01), while telomerase activity was positively correlated with 8-oxo-dG. Differential gene expression and seven significant SNPs (P ≤ 0.05) were also identified. These findings suggest that oxidative stress-associated telomere attrition and altered telomerase activity may contribute to HAPE susceptibility and severity.
Keywords:
high-altitude pulmonary edema
; telomere
; telomerase
; 8-oxo-dG
; gene expression
; global screening array
; protein-protein interaction
Introduction
High Altitude Pulmonary Edema (HAPE) is characterized by exaggerated hypoxic vasoconstriction at reduced levels of alveolar oxygen, vascular leakage through over perfusion, fluid accumulation in the lungs due to rapid ascent exposure to high altitude (HA>2500 meters from sea level), hypobaric hypoxia condition [1]. HAPE is caused by increased pressure in pulmonary circulation due to widespread pulmonary arterial vasoconstriction and increased capillary permeability, causing fluid to move into the alveoli in individuals susceptible to HAPE [2]. This results in dyspnea, exercise intolerance, fatigue, cough and cyanosis leading to cascade of inflammatory, biochemical and physiological changes. Hypobaric hypoxia at HA induces oxidative stress, which results in increased production of reactive oxygen species (ROS) and can damage DNA [3,4,5]. The natives of HA are well adapted to this environment, the incapability of some of the sojourners to acclimatize at HA results in maladaptation and leads to various HA illnesses like HAPE [1]. If not treated immediately, it may lead to life threatening condition and could be fatal. Apart from the rate of ascent and the altitude attained, studies have indicated that genetic background contributes to the effectiveness of altitude acclimatization and may influence susceptibility to disease development (Miglani et al., 2020).
Telomeres are specialized nucleoprotein structures located at the ends of eukaryotic chromosomes that protect chromosome termini from degradation and inappropriate DNA-damage responses [8]. Eventually, telomeres are abundant with G-rich strands, also known as G-quadruplexes, which are susceptible to oxidative stress due to their redox reaction and have four-stranded DNA structures generated in guanine-rich areas [9]. The presence of hypobaric hypoxia at HA can affect telomere stability and functionality by attaching to G-quadruplex sites, making the structures more susceptible to oxidative damage and resulting in DNA lesion mispairing with adenine during replication, with G→T transversions [10,11].
Oxidative stress is actively involved in HAPE pathophysiology due to an imbalance between the production of reactive oxygen species (ROS) and antioxidants, with excess ROS production [12]. 8-Hydroxy-2′-deoxyguanosine (8-oxo-dG) is one of the common markers of DNA that has been used in many oxidative stress and telomere-related studies because of the presence of guanine in telomeres [13]. However, although oxidative DNA damage has been investigated in high-altitude exposure, the relationship between 8-oxo-dG, telomere length, and HAPE phenotype remains insufficiently characterized. Therefore, exploring might give an insight into adaptation or maladaptation in HAPE.
In studies, cellular stress due to hypoxia can enhance G-quadruplex destabilization, leading to telomere-telomerase malfunction, replication stress, and alteration in gene expression. Moreover, the telomere subunit shelterin complex mediates t-loop formation, which is essential for preserving telomere integrity and safeguarding chromosomal termini from being identified as sites of DNA damage by forming a lasso-like structure [14]. Telomere Repeating Binding Factor-1 & 2 (TERF-1 & 2) bind as a homodimer to double-stranded telomeric DNA through its myeloblastosis (Myb) binding domain and tether other telomere-binding proteins to the shelterin complex, functioning as a negative regulator of telomere length in tumour cells, which might lead to securing the telomere in a secondary structure that is inaccessible to telomerase [15]. Telomerase Reverse Transcriptase (TERT) and Telomerase RNA Component (TERC) help to reduce telomere shortening by adding the RNA template to extend the 3’ end of the lagging strand [16]. Regulator of Telomere Elongation Helicase 1 (RTEL1), a helicase required for telomere integrity, plays multiple roles in the regulation and maintenance of telomere length and in the localisation of mitotic DNA damage sites [17]. Tankyrase (TNKS) is the positive regulator and helps in increasing telomerase access to telomeres by recruiting itself to TERF and poly-ADP ribosylating the TERF, a negative regulator of telomeres.
Thus, TNKS, a positive regulator of telomere length, plays a protective role during telomeric damage by sharply increasing its activity [18]. Additionally, the ataxia telangiectasia mutated (ATM) helps in detecting the DNA damage signal pathway. Its mutations may lead to telomere maintenance defects in mammalian cells [19]. However, telomere maintenance is not only controlled by a single locus but represents a sequence-wide gene regulatory network, where coordinated genetic variation across multiple telomere-associated genes determines chromosomal stability, replicative lifespan, and disease susceptibility [20].
The sequence-wide gene importance lies in the cumulative effect of polymorphisms, mutations, and regulatory variants distributed across structural, catalytic, helicase, and checkpoint genes. Variants in these genes influence enzyme activity, transcriptional regulation, and template stability, contributing to inter-individual telomere variability and risk of cancer or degenerative disorders [21].
Additionally, protein-protein interactions (PPIs) may involve strongly associated proteins that form stable PPIs, as well as proteins that interact temporarily, known as transient PPIs, or a combination of both. The functional roles of PPIs vary depending on the nature and duration of these interactions. Through stable or transient associations, proteins coordinate with one another to carry out essential cellular processes, collectively forming extensive interaction networks known as interactomes [22].
Telomere regulation reflects a systems-level genetic architecture, where disruptions such as shelterin complex instability or dysregulation cascade through sequence-wide networks, driving genomic instability underlying ageing, cancer progression, and hypoxia-induced pathologies like HAPE.
This study examines hypobaric hypoxia’s effects on telomere length dynamics and its mechanistic contributions to HAPE pathogenesis. Hypobaric hypoxia triggers endoplasmic reticulum stress and ROS buildup, yet the pathways linking it to telomere attrition in susceptible individuals via oxidative lesions like 8-oxo-dG. The present study extends previous high-altitude telomere research by integrating relative telomere length, telomerase activity, oxidative DNA damage, telomere-associated gene expression, genetic variation, and protein-interaction analysis across adapted, healthy sojourner, and HAPE groups. Association with oxidative stress (8-oxo-dG) along with telomerase activity, differential telomere-related gene expression, SNPs through GSA and protein-protein interaction under hypobaric conditions is still not explored. By elucidating attrition-repair imbalances in hypobaric hypoxia, this work uncovers genetic risk markers and therapeutic targets to inform HAPE prevention and management.
Materials and Methods
Ethical Approval
The human ethical committees of the Sonam Norboo Memorial (SNM) Hospital, Leh, Ladakh, and Council of Scientific and Industrial Research-Institute of Genomics and Integrative Biology (CSIR-IGIB), (EC REG. NO. EC/NEW/INST/2023/3276) (Ref No: CSIR-IGIB/IHEC/2023-24/03) approved the study. Subjects were recruited through general outpatient clinic SNM Hospital, Leh, Ladakh, India (∼3500 m). After getting ethical committee approval, the study was performed at IGIB, and SRM University, Delhi-NCR.
The identities of all the subjects were kept confidential and their blood samples were obtained only after getting the informed written consent from all the participants. All procedures were completed in accordance with the Declaration of Helsinki.
Study Subject Sample Collection and Processing
The study comprised of total 880 participants with age between19-70 Years. Subjects were classified into three distinct groups: healthy HLs (n = 247), healthy HA sojourners or controls (n = 262); HAPE patients (n = 371). Information on demographic characteristics such as age, gender, weight, height, etc., and clinical characteristics such as systolic blood pressure (SBP), diastolic blood pressure (DBP), and peripheral oxygen saturation (SpO2) were obtained through a detailed questionnaire on environmental factors, health, family clinical history, migration status, and hemodynamic parameters of the participants.
The diagnosis and confirmation of HAPE was based on the assessment of clinical symptoms such as chest tightness/pain, cough, and dyspnea at rest, presence of pulmonary rales, cyanosis, tachycardia, tachypnea, and lower pulse oximeter oxygen saturation level indicating hypoxemia. Chest X-ray, radiographic infiltrates and echocardiography reports showing pulmonary edema had confirmed the HAPE. Patients with alternate etiologies of hypoxemia, such as pneumonia, based upon clinical assessment, were likewise excluded. The control group consisted of sojourners from low-altitude (<200 m) who had visited the same altitude more than once and carried out routine physical activities without suffering from the disorder. To rule out acute mountain sickness in controls, Lake Louise scoring was applied [23]. HLs were unrelated permanent residents of the Ladakh region, having an altitude of >3500 m abo. All the subjects were examined to exclude those with infectious diseases and any prior history of cardiopulmonary disease.
A venous blood sample (10 ml) was drawn in an anticoagulant, acid citrate dextrose (ACD) tube. The HAPE sample was drawn after the diagnosis but before treatment, whereas samples from two healthy groups, controls and HLs, were drawn after an overnight fast. Plasma and peripheral blood leucocytes were separated; the latter was processed for DNA and RNA isolation. Plasma and RNA were stored at −80ᵒC and DNA at −20ᵒC.
Disease Severity Classification in Patients with HAPE
The HA physician team at SNM Hospital classified HAPE into mild (n = 123), moderate (n = 124), and severe (n = 124) cases based on clinical signs, symptoms and chest X-ray [24].
Plasma, Genomic DNA and RNA Extraction
Plasma from blood was separated through density gradient centrifugation at 1,200g for 10 minutes at room temperature and stored at –80 °C until further usage. Genomic DNA was isolated using the FlexiGene DNA Kit (Qiagen, Germany), and RNA was extracted using PAXgene blood RNA kit (Qiagen, Germany). RNA yield was measured by Qubit RNA BR Assay Kit (ThermoFisher Scientific, U.S.A.). The purity of the genomic DNA and RNA was measured by Nanodrop (Thermo Fisher Scientific Inc, USA). The DNA samples were stored at –20 °C and RNA at -80ᵒC until further usage.
Relative Telomere Length Estimation
Relative telomere length was measured by qRT-PCR [25]. PCR was performed on CFX96 Touch Real-Time PCR Detection System (2024 Bio-Rad Laboratories) using KAPABIOSYSTEMS SYBR (Sigma-Aldrich, Kapa Biosystem, South Africa) with default qRT-PCR cycling conditions [26]. Relative telomere length is defined by the T/S ratio, which is a ratio of telomeric repeat copy number (T) DNA to the copy number of the single-copy gene (S). T/S ratios were calculated for all the samples in duplicates and the telomere length was measured for HLs, controls, and HAPE. β-Globin served as a single-copy gene (SCG). The working concentration of 10 pm/μl was used for each primer.
Telomerase Activity Estimation
Telomerase activity was performed in HLs, controls, HAPE and HAPE mild, moderate and severe groups. Telomerase activity was estimated in the plasma samples using commercially available TRAPeze® RT Telomerase Detection Kit (EMD Millipore, USA). The Detection Kit is a highly sensitive in vitro assay for the fluorometric detection and real-time quantification of telomerase activity. This kit is founded on the telomere repeat amplification protocol (TRAP) method. The telomerase activity in the plasma sample is determined through its ability to synthesize telomeric repeats onto an oligonucleotide substrate in vitro upon the addition of a suitable buffer and deoxyribonucleotide triphosphates. Telomerase from the test sample adds telomeric repeats onto a substrate oligonucleotide, and the resultant extended products are subsequently amplified and measured by qRT-PCR. A standard curve was prepared using the TSR control template provided in the kit. TSR is an oligonucleotide with a sequence similar to telomere primers. Working standards were prepared, and the standard curve between TSR concentrations and Ct values was plotted and then, was used to determine telomerase activity in terms of the TSR control concentrations.
8. -oxo-dG Level Estimation
8-oxo-dG levels in 300 ng of genomic DNA samples were analyzed using a commercially available Colorimetric 8-oxo-dG DNA Damage Quantification Direct Kit (Epigentek, Farmingdale, NY, USA). The absorbance of 8-oxo-dG was recorded in a microplate reader (Thermo Fisher Scientific, USA) at 450 nm.
TERF-1, TERF-2, TERT, TERC, RTEL1, TNKS and ATM Gene Expression Analysis
The expression of TERF-1, TERF-2, TERT, TERC, RTEL1, TNKS, and ATM genes was performed. For the overall three-group comparison, gene expression was analyzed in 30 samples from each group (HLs, controls, and HAPE). For the severity-specific analysis, 31 independent HAPE samples were analyzed in each severity category (mild, moderate, and severe; n = 31 per category; total n = 93). The expression levels of genes were calculated by quantifying complementary DNA (cDNA) by qRT-PCR. In each group, 1.5 μg RNA was used to generate cDNA using the RevertAid First Strand cDNA synthesis kit (Thermo Fisher Scientific). Perl Primer software was used to design the primers for TERF-1, TERF-2, TERT, TERC, RTEL1, TNKS, ATM, and housekeeping gene RN18S1 (18S ribosomal RNA; internal control gene). The sequence is represented in the supplementary file. Real-time PCR was performed on a CFX Opus 384 Real-Time PCR System (© 2024 Bio-Rad Laboratories) using KAPABIOSYSTEMS SYBR (Sigma-Aldrich, Kapa Biosystem, South Africa).
qRT-PCR was performed in duplicates and was repeated three times for each gene and each sample. Relative transcript quantities were calculated using the ΔΔCt method with 18S rRNA as the endogenous reference gene.
Genotyping Using Illumina Global Screening Array
Genomic DNA samples were genotyped using the Infinium Global Screening Array (GSA) v3.0 (Illumina Inc., San Diego, CA, USA), following the manufacturer’s recommended protocol. This high-throughput genotyping platform interrogates over 700,000 SNPs across the human genome and is optimized for population-scale genetic studies, clinical research, and genome-wide association studies (GWAS). For each sample, 5 µL of high-quality genomic DNA at a concentration of 50 ng/µL (total 250ng) was used as input. DNA quality was first checked by NanoDrop™ 2000 Spectrophotometer (Thermo Fisher Scientific, Waltham, MA, USA), ensuring absorbance ratios of A260/A280 between 1.8–2.0 and A260/A230 above 1.7. DNA quantification was further confirmed using the Qubit™ 4 Fluorometer with the dsDNA High Sensitivity Assay Kit (Invitrogen™, Thermo Fisher Scientific). Samples were subjected to whole-genome amplification (WGA) through an isothermal enzymatic amplification, yielding microgram-level quantities of amplified DNA. Amplified DNA was enzymatically fragmented to achieve a size distribution typically between 300–600 bp. The fragmentation reaction was subsequently heat-inactivated. DNA was then precipitated, washed with ethanol, and resuspended in hybridization buffer. A total of 18 µL of the processed DNA was loaded onto each well of the GSA BeadChip. Hybridization was carried out at 48 °C overnight (16–24 hours) to facilitate locus-specific binding of DNA fragments to immobilized probes on the array surface. Following hybridization, single-base extension (SBE) was performed using dye-labeled terminator nucleotides, enabling allele-specific detection through fluorophore incorporation. Non-specific signals were removed through post-extension washes, and the arrays were stained to enhance signal intensity. The BeadChips were scanned using the Illumina iScan System (Model: iScan, Illumina Inc., San Diego, CA, USA), a high-resolution laser-based scanner designed for high-throughput genotyping. Raw image data were processed and converted into IDAT files using Illumina GenomeStudio Software (v2.0). Genotype calling was performed using the Genotyping Module with default cluster settings. Samples with a genotype call rate exceeding 99% were considered high quality and retained for downstream analyses.
Protein-Protein Interaction
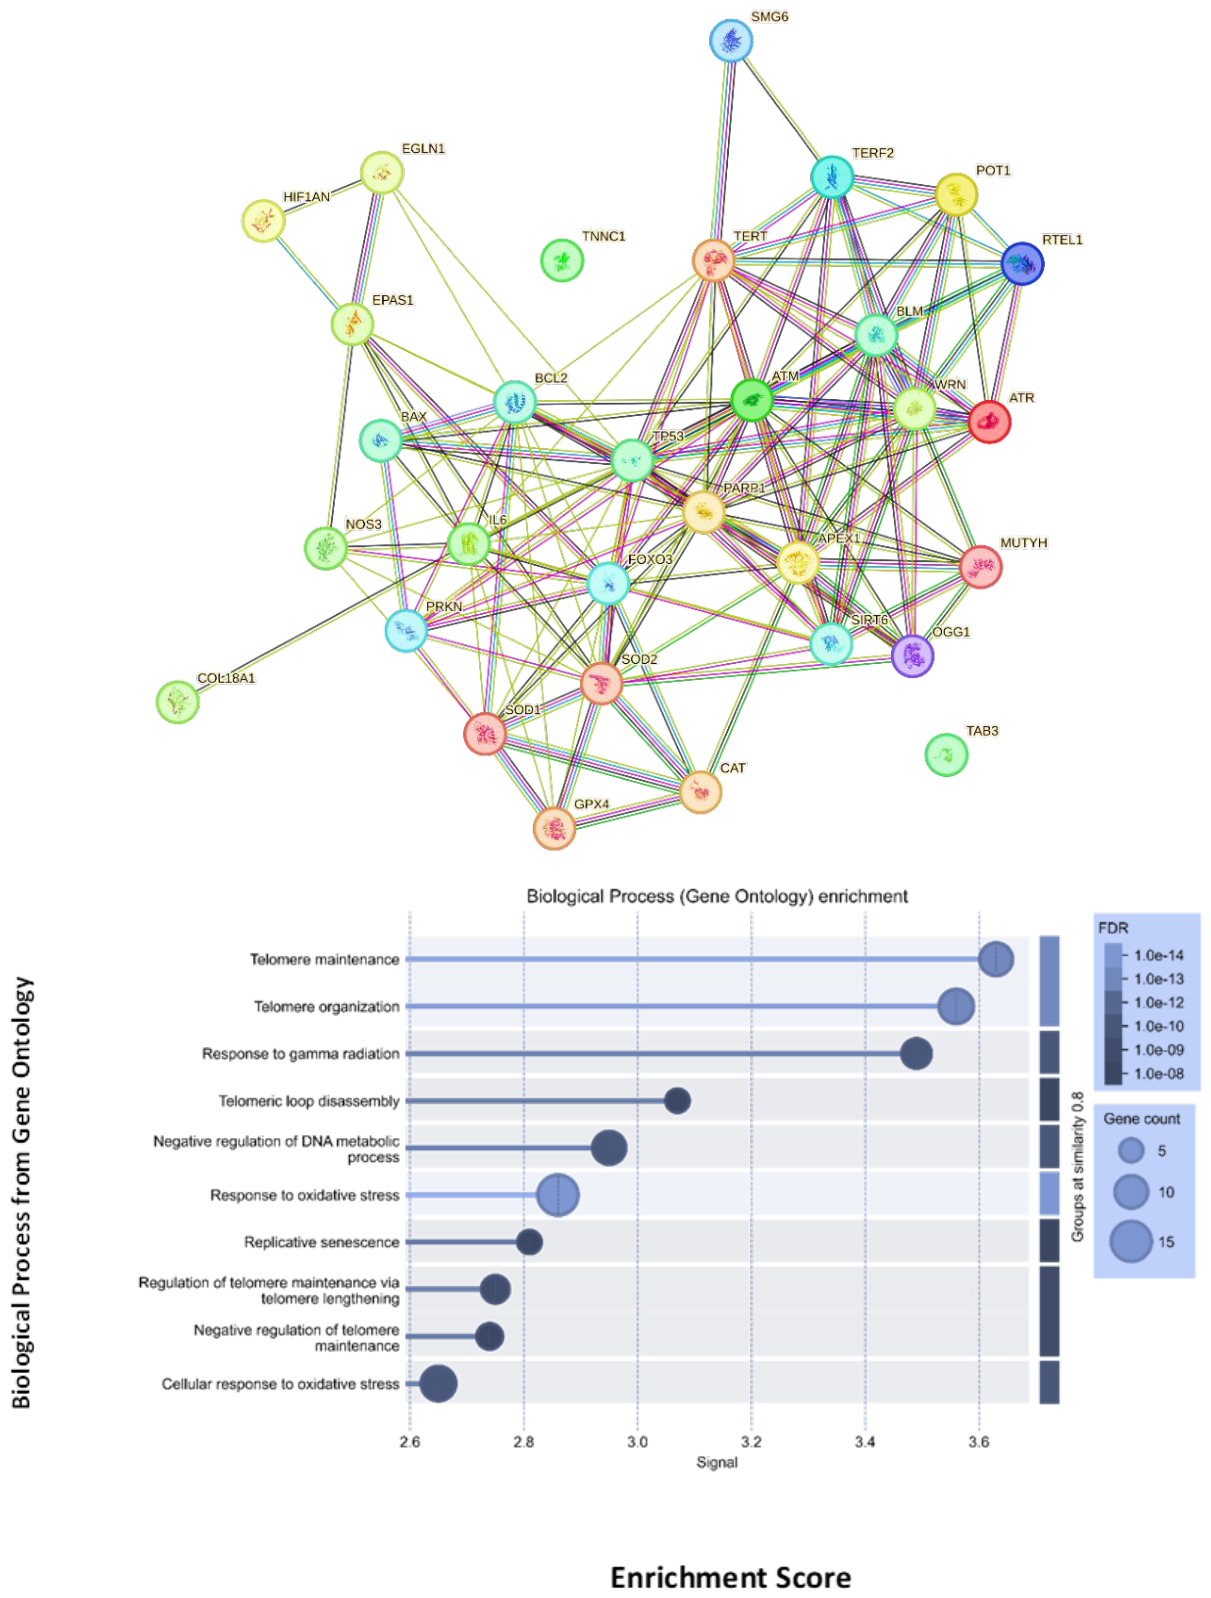
Protein–protein interaction (PPI) network analysis was performed using STRING version 12.0 to investigate the functional interactions among 31 selected proteins associated with telomere maintenance, hypoxia response, DNA damage and repair, oxidative stress, and cellular signaling. The analysis was performed using Homo sapiens as the organism. The resulting network comprised 31 nodes and 143 edges, with an average node degree of 9.23 and an average local clustering coefficient of 0.692. The expected number of edges was 40, and the PPI enrichment P-value was <1.0 × 10⁻¹⁶, indicating significantly greater functional connectivity among the input proteins than expected for a random network of similar size.
Statistical Analysis
The study group’s clinical parameters were reported as mean ± SD, and adjusted P values were obtained using GraphPad Prism software (version 8.0.2, GraphPad Software USA). The telomere length, 8-oxo-dG levels and telomerase activity were reported as mean ± SD and were analysed using the two-tailed Mann-Whitney U test for non-parametric data distribution using GraphPad Prism software (version 8.0.2, GraphPad Software USA).
Correlation analysis was performed using the R programming language (version 4.4.0) to check the relationship between the SpO2 level, telomere length, telomerase activity, and 8-oxo-dG using Pearson’s correlation coefficient (r). Genotyping is done through PLINK version 1.9 Beta, authors Shaun Purcell, Christopher Chang, URL: www.cog-genomics.org/plink/1.9/. The protein-protein interactions are done through STRING version 12.0.
Results
Demographic and Clinical Characteristics of the Study Groups
The demographic and clinical characteristics of HLs, controls, and HAPE are shown & compared in Table 1. Systolic Blood Pressure (SBP) was significantly increased in HLs vs HAPE (P < 0.0001), HLs vs controls (P = 0.0048), and controls vs HAPE (P = 0.0420); however, no change was shown in Diastolic Blood Pressure (DBP) among HLs, controls, and HAPE. Significantly decreased SpO2 was found in HLs vs HAPE (P < 0.0001) and controls vs HAPE (P < 0.0001), though significantly increased Mean arterial Pressure (MAP) was present in HLs vs HAPE (P < 0.0001) and controls vs HAPE (P = 0.0184). There was no significant difference in age among the three groups; however, Body Mass Index (BMI) was significantly increased in HLs vs HAPE (P < 0.0001) and controls vs HAPE (P < 0.0001).
Relative Telomere Length
The telomere length was calculated by the T/S ratio method. The data were adjusted with demographic parameters like age, gender and BMI to include their effect on telomere length. Relative telomere length was significantly shorter in HAPE than in both HLs and low-altitude controls, indicating an association between telomere shortening and HAPE (Figure 1A).
Additionally, the telomere length of HLs and controls was compared with HAPE severity groups; mild, moderate and severe. The telomere length was significantly higher in HLs and controls compared with HAPE severity groups (P < 0.0001 in HLs or Controls vs mild, HLs or Controls vs moderate, and HLs or Controls vs severe) (Figure 1B).
Relative Telomere length was also studied with respect to age, comparing among themselves with age differences of young age (18-30 years) and middle age (31-60 years). Telomere length was significantly higher in HLs, Controls, and HAPE in the young age group (18–30 years) compared to middle age group (31–60 years). (P = 0.0120 in HLs; P = 0.0110 in controls and P = 0.0474 in HAPE) (Figure 1C).
Moreover, the telomere length of HLs, controls and HAPE were compared in association with BMI wherein BMI has been classified into two groups, normal BMI (16–24.9 kg/m2) and obese BMI (≥ 25 kg/m2). Telomere length was significantly higher in HLs, controls, and HAPE in normal BMI as compared to obese BMI (P = 0.0083 HLs; P = 0.0091 controls; and P = 0.0318 HAPE), respectively (Figure 1D)
Telomerase Activity Estimation
The levels of telomerase activity were calculated according to the manufacturer’s manual provided in the kit. We observed that the level of telomerase activity was lower in HLs compared with controls (P = 0.0065), and was higher in HAPE compared with controls vs HAPE and HLs vs HAPE, respectively (P < 0.0001), (Figure 2A).
We also observed a significant result in the level of telomerase activity among HAPE severity groups, with the observation of higher telomerase activity in moderate and severe (P = 0.0001), (Figure 2B).
Additionally, telomerase activity in HAPE severity groups compared with HLs or controls was found to be higher in HAPE severity groups of moderate and severe (P < 0.0001, in HLs or Controls vs moderate, and HLs or Controls vs severe) (Figure 2C and D). However, we did not observe any significant results when compared with age and BMI groups.
8. -oxo-dG Level Estimation
8-oxo-dG concentration is measured in pg/µl according to the manufacturer’s manual provided in the kit, in HLs, controls, and HAPE. We observed that the 8-oxo-dG was significantly higher in HLs compared with controls (P < 0.0001) and higher in HAPE compared with controls (P = 0.0195) and higher in HLs compared with HAPE (P < 0.0001) (Figure 3A). Additionally, the data were adjusted with demographic parameters like age and BMI to include their effect on oxidative stress level. However, we did not find any significant differences in the age and BMI groups.
Additionally, the 8-oxo-dG of HLs and controls were compared with HAPE severity groups; mild, moderate and severe. 8-oxo-dG was found to be significantly higher in HLs in comparison with mild (P < 0.0001 HLs vs mild), and moderate (P = 0.0019 HLs vs moderate) (Figure 3B).
8-oxo-dG was found to be higher when compared to the control, with moderate and severe are found to be higher than the control (P < 0.0396 controls vs moderate; P < 0.0001 controls vs severe) (Figure 3C).
Gene Expression of TERF-1, TERF-2, TERC, TERT, RTEL1, TNKS and ATM Genes in HLs, Control & HAPE
The expression of the TERF-1 gene showed downregulation in both HLs (P = 0.0021) and HAPE (P = 0.0170) by 6.15 and 2.43 folds, respectively (Figure 4. A). The expression of TERF-2 showed no significant result in HLs compared with controls, having a 1.06 fold change (P = 0.055). The TERF-2 also did not show any significant result when compared to controls with HAPE, having a 1.8 fold change (P = 0.072) (Figure 4 B). TERC gene is upregulated by 4.22 folds in HLs compared with controls (P = 0.0002) and 7.51 folds in HAPE compared with controls (P = 0.0017) (Figure 4. C). The expression analysis of Gene TERT and RTEL1 has shown 15.58 and 2.03 folds upregulated in HLs compared to the controls (P = 0.0058; P = 0.2187) and when compared with controls, TERT expression was significantly reduced 12.7 folds in HAPE (P = 0.0069), whereas RTEL1 expression was reduced 1.74 fold (P = 0.0214) (Figure 4 D and E, respectively). TNKS gene has shown downregulation by 2.92 folds in HLs (P = 0.0759) compared to controls and upregulation by 8.98 folds in HAPE (P = 0.015) compared to controls (Figure 4 F). ATM expression has shown no significant change in HLs and downregulated in HAPE by 11.5 folds, compared to the controls (P = 0.8016; P < 0.0001) (Figure 4 G).
Gene Expression of TERF-1, TERF-2, TERC, TERT, RTEL1, TNKS and ATM Genes in Mild, Moderate and Severe
The expression of the TERF-1 gene in HAPE severity group is downregulated in mild, moderate and severe by 3.37, 1.72, and 6.61 folds (P = 0.0103, P = 0.0510 and P = 0.0013), respectively compared to the controls (Figure 5A). The expression of TERF-2 in the HAPE severity group, when compared to controls with mild, has shown no significant result with 1.12 folds (P = 0.99). When compared to controls with moderate, it has also shown no significant results with a 1.40 fold change (P = 0.91). However, when controls were compared with severe, it showed downregulation with an 8.05 fold change (P = 0.005) (Figure 5B). TERC gene was found to be upregulated in mild, moderate and severe by 10.95, 32.07, and 9.63 folds compared with controls (P = 0.0655, P = 0.0011 and P = 0.0568) (Figure 5 C). TERT and RTEL1 genes were found to be downregulated in mild, moderate and severe by 26.6, 16.34, and 21.29 folds; and 4.42, 1.66, and 1.96 folds respectively compared to controls (P = 0.0005, P = 0.0029 and P = 0.0011); (P = 0.0072, P = 0.0785 and P = 0.0568) (Figure 5 D and E). TNKS gene was upregulated in mild, moderate, and severe by 8.03, 10.51, and 4.46 folds compared to control (P = 0.0017, P = 0.0005 and 0.0230) (Figure 5 F). ATM gene was downregulated by 1.19, 1.48, and 4.51 folds, respectively, in mild, moderate, and severe compared to the control (P = 0.0012, 0.0007 and < 0.0001) (Figure 5 G).
Correlation Analysis
The correlation analysis of telomere length with SpO2%, telomere length with 8-oxo-dG, telomere length with telomerase activity and telomerase activity with 8-oxo-dG was analysed in the three study groups HLs, controls, and HAPE. The correlation of telomere length with SpO2% in control and HLs showed a non-significant association (R = 0.213, P = 0.09; R = 0.294, P = 0.085), respectively. In the HAPE group, we have observed a significant negative association between telomere length and SpO2% (R = -0.623, P = 1.93 x 10⁻⁸) (Figure 6A). The negative correlation indicates that lower SpO2 values were associated with shorter relative telomere length in HAPE. This relationship suggests that oxidative stress, caused by hypoxia-induced ROS, damages telomeric DNA and disrupts telomere-telomerase maintenance mechanisms.
In the correlation of telomere length with 8-oxo-dG in HLs, controls, and HAPE groups. We have observed no significant relationship between telomere length and 8-oxo-dG in HLs and controls (R = -0.028, P = 0.85; R = 0.082, P = 0.707), respectively. However, in HAPE we observed a significant negative correlation with a significant decrease of telomere length with the increase of 8-oxo-dG in the HAPE study group (R = -0.288, P = 0.000651) (Figure 6. B), suggesting this inverse association is consistent with the possibility that oxidative DNA damage contributes to telomere attrition; however, the cross-sectional design does not establish causality.
In the correlation analysis between telomere length and telomerase activity in the HLs and controls study groups, we have observed a negative relationship and a non-significant result (R = -0.2533, P = 0.2324; R = -0.091, P = 0.6654), respectively. However, in the correlation between telomerase activity and telomere length in the HAPE study group, we observed a significant correlation with a positive relationship (R = 0.2649, P = 0.0225) (Figure 6. C). The positive association between telomerase activity and telomere length, together with the positive association between telomerase activity and 8-oxo-dG, may be consistent with a compensatory telomerase response to oxidative stress. However, longitudinal or functional studies are required to establish whether increased telomerase activity directly preserves telomere length in HAPE.
In the correlation analysis between telomerase activity and 8-oxo-dG in the HLs and controls study groups, we have observed a weak positive relationship with a non-significant result (R = 0.0316; P = 0.8781; r = 0.0489, P = 0.8126), respectively. However, in the correlation between telomerase activity and 8-oxo-dG in the HAPE study group, we observed a significant positive relationship (R = 0.2864, P = 0.01676) (Figure 6. D), suggesting that higher oxidative stress from hypobaric hypoxia likely 8-oxo-dG triggers compensatory telomerase upregulation to repair telomeric damage and maintain chromosomal stability.
Genotyping
DNA samples from 308 participants across the three study groups were genotyped using the Infinium GSA-24+ v3.0-EarlyAccess | HTS GSA v3.0+ Multi-Disease chip. Quality control was performed using a call rate of 98%, GenTrain score >0.7, and cluster separation >0.3. Variants located on the X, Y, and mitochondrial chromosomes were excluded. Following these QC procedures, 277 participants were retained for further analysis, comprising 82 healthy high-altitude (HA) sojourners/controls, 148 HAPE, and 47 healthy highlanders (HLs).
Further quality control was performed using PLINK. Variants deviating from Hardy–Weinberg equilibrium (HWE <1 × 10⁻⁶) were excluded, and linkage disequilibrium (LD) pruning was performed using an r2 threshold of 0.2. After QC and filtering, 256,592 SNPs with an overall call rate of 98% were retained for downstream analysis.
Genotype imputation was performed using the QC-passed genotype dataset, resulting in a total of 72,092,971 imputed variants. Post-imputation filtering was performed using an imputation quality score (R2) >0.8 and minor allele frequency (MAF) >0.05, resulting in 5,931,901 variants for association analysis.
Genome-wide association analysis was performed using PLINK. Additional genotype and sample missingness filters were applied using Geno and mind thresholds of 0.20, resulting in 5,867,291 variants for the final association analysis. Associations between genetic variants and HAPE status were evaluated using a case-control GWAS framework.
A total of 250 variants reached the predefined suggestive significance threshold of P ≤1 × 10⁻⁵. Due to the modest sample size and limited statistical power, a suggestive significance threshold of P <1 × 10⁻⁵ was used instead of the conventional genome-wide significance threshold of P <5 × 10⁻⁸.
Top three each one from HLs, controls and HAPE genotype are mentioned here with, minor allele frequency (MAF), chromosome position (CHR), single nucleotide polymorphisms (SNPs), base pair (BPs), allele 1 and 2 (A1 and A2), with the comparison between highlander vs HAPE, Highlander vs Control and Control vs HAPE containing P - value, odd ratio and 95% confidence intervals and rest is presented in (Table 2).
The rs56345976 SNP in the TERT gene reveals a complex, comparison-specific genetic association. The most significant finding is a strong risk effect when comparing HLs vs HAPE, where the minor allele is associated with 2.3 times higher odds of being a HLs (P = 0.0029). This indicates a higher allele frequency in the adapted population relative to the susceptible group. However, in the controls vs HAPE comparison, this allele also shows a nominally significant but smaller risk effect (OR = 1.56, P = 0.025), suggesting it may confer a broad susceptibility to HAPE in the general population. Notably, there is no significant difference between HLs vs controls (P = 0.20), which is a critical detail. This specific pattern, where the allele frequency is high in HLs, low in HAPE, but similar in HLs and Controls, suggests the signal may be driven by an enrichment of the alternate (likely protective) allele specifically in the HAPE group, rather than by positive selection in HLs. Therefore, while this SNP marks a locus relevant to high-altitude disease susceptibility, its allele frequency distribution does not fit the classic signature of an adaptive variant that differentiates an adapted population from its ancestral source. It may instead tag a risk haplotype that is depleted in both adapted and general populations only when compared to the extreme phenotype of HAPE.
The rs7184015 SNP in the BLM gene shows a context-dependent association. Its primary and statistically significant effect is observed when comparing controls vs HAPE, where the minor allele is associated with a significant 44% reduction in the odds of HAPE (OR = 0.56, P = 0.00783). This suggests a protective role for this allele against developing HAPE in the general population. In contrast, the comparison between HLs vs HAPE shows only a marginal, non-significant trend for protection (P = 0.05074, OR = 0.57. Furthermore, there is no difference in allele frequency between HLs vs controls (P = 0.94), indicating this variant is not a target of strong positive selection in the adapted population, unlike classic adaptive loci. Therefore, rs7184015 marks a potential general susceptibility for HAPE via DNA repair pathways, but it does not appear to be a primary genetic factor driving high-altitude adaptation.
The rs6010620 SNP in the RTEL1 gene demonstrates a powerful genetic signature of high-altitude adaptation. In a dominant model, the minor allele shows a strong, opposite-direction association when comparing adapted highlanders to susceptible individuals. It is highly protective against HAPE, with carriers having 71% lower odds of being HLs vs HAPE (OR = 0.29, P = 1.99 x 10⁻⁶). Conversely, the same allele is significantly enriched in HLs vs controls (OR = 2.91, P = 0.000174), indicating this population is genetically distinct at this locus. Critically, no association exists between general controls vs HAPE patients (P = 0.4195), highlighting that the effect is specific to the adapted versus susceptible comparison, a classic indicator of positive selection. The enrichment of this allele among HLs relative to HAPE is consistent with a potential association with high-altitude adaptation; however, the present case-control comparisons alone cannot establish positive selection. Population-genetic analyses and replication in independent high-altitude cohorts would be required to demonstrate selection. The RTEL1 gene, involved in telomere maintenance and genomic stability, is a biologically plausible candidate for adaptation, as its dysfunction is linked to pulmonary pathologies. Therefore, genotyping rs6010620 provides key insights for stratifying genetic risk for HAPE and understanding the mechanisms of hypoxia tolerance.
Protein-Protein Interaction
To investigate the functional relationships among the selected telomere, hypoxia, DNA-damage, and oxidative-stress related proteins, a PPI network was generated using STRING version 12.0 (Figure 7). The network comprised 31 nodes and 143 edges, compared with 40 expected edges, and showed significant PPI enrichment (P < 1.0 × 10⁻¹⁶). The network exhibited an average node degree of 9.23 and an average local clustering coefficient of 0.692, indicating substantial functional connectivity among the selected proteins. The network integrated key telomere-associated proteins, including TERF2, TERT, POT1, RTEL1, BLM, and WRN, with DNA-damage-response proteins such as ATM, Ataxia Telangiectasia and Rad3 related (ATR), Tumor Protein 53 (TP53), Poly(ADP-ribose) polymerase 1 (PARP1), Apurinic/apyrimidinic endodeoxyribonuclease 1 (APEX1), 8-Oxoguanine DNA glycosylase 1 (OGG1), and MutY DNA glycosylase (MUTYH). In addition, oxidative-stress-related proteins, including Superoxide Dismutase 1 & 2 (SOD1 & SOD2), Glutathione Peroxidase 4 (GPX4), and Catalase (CAT), were interconnected within the network. Collectively, these interactions highlight the functional convergence of telomere maintenance, hypoxia signaling, DNA-damage response, and oxidative-stress pathways, suggesting that coordinated regulation of these processes may contribute to cellular responses to high-altitude hypoxic stress and HAPE pathophysiology.
Discussion
The results of the present study showed that decreased telomere length, higher telomerase activity, higher oxidative stress, along with differential gene expression of the telomere pathway, SNPs and protein-protein interaction, may play an important role in HAPE progression. The correlation of telomere length with SpO2 level, telomerase activity, and 8-oxo-dG, along with telomere length and telomerase activity, strengthens the molecular basis of the HA disorder. Moreover, the clinical data of the studied groups exhibited decreased SpO2 levels in HAPE compared to HLs and controls (P < 0.0001). This is attributed to the fact that in HAPE, fluid retention and low oxygen availability to the arteries. Our findings are consistent with other studies where the SpO2 levels in HAPE were low [27]. Moreover, MAP was higher in HAPE compared to both HLs and controls (P < 0.0001), due to elevated capillary pressure and pulmonary hypertension in HAPE. Additionally, the BMI of HAPE is higher as compared to HLs and controls (P < 0.0001), which is consistent with the fact that obesity plays a role in HA-related diseases [28]. The reduced SpO2 and increased MAP & BMI in HAPE specify HAPE pathophysiology. Furthermore, we assessed the telomere length in the study subjects, which might give us an insight into the degree of susceptibility of an individual toward HA disease progression.
We found shorter telomere length in HAPE compared to HLs and healthy controls (P < 0.0001), which might indicate that the shorter telomere length observed in HAPE is associated with the disease phenotype. Additionally, the telomere length of HLs and controls is compared with different HAPE severity groups to observe in which group the telomere lengths are affected, more. We observed that the telomere lengths are more affected in the mild conditions than moderate and severe conditions when compared with both HLs and controls. The reason might be, HLs have evolved over the years to adapt to the HA environment, attributed to their adaptive feature of longer telomeric lengths to combat oxidative stresses, which is not present at sea level [11]. For the controls, the reason might be that they can adapt themselves like highlanders by following the protocols and guidance provided to them while going to HA [29]. When the relative telomere lengths were compared in different age groups, we observed significant telomere length differences between young age groups of 18–30 years and middle age groups of 31–60 years in HLs, controls, and HAPE. During age progression, important hormonal changes occur, leading to cellular degradation and ageing, which might be enhanced in extreme environments. Moreover, it is observed that in HAPE, the telomere attrition rate is higher in the older age group. Additionally, physical activity is associated with telomere length, and a lack of it, as observed in obese people, leads to telomere shortening [30]. We observed significant telomere length differences between normal and Obese samples in HLs, controls and HAPE. Obesity increases systemic inflammation and oxidative stress, leading to shorter telomere length.
Our findings should also be considered in the broader context of telomere responses to chronic hypoxic stress. Previous studies in high-altitude populations and hypoxia-related disorders have reported shortening of telomere length and altered telomerase regulation, suggesting that telomere homeostasis may be a component of the cellular response to prolonged oxygen limitation. However, telomere responses may vary with altitude, exposure duration, genetic background, and disease phenotype. In this context, the present study extends previous observations by simultaneously examining relative telomere length, telomerase activity, oxidative DNA damage, telomere-associated gene expression, and genetic variation in individuals with HAPE and high-altitude adaptation.
Telomerase activity refers to the enzymatic function of telomerase, a ribonucleoprotein that extends telomeres, the protective DNA caps at chromosome ends, by adding repetitive nucleotide sequences [31]. In the analysis of telomerase activity, we observed a high level of telomerase activity in the HAPE group. This suggests a compensatory cellular response to hypobaric hypoxia-induced oxidative stress and telomere damage at high altitude, attempting to maintain telomere length [32]. We observed no significant difference in telomerase activity levels in different age groups and obesity when compared among HLs, controls, and HAPE, which might be because hypoxia-responsive pathways, including HIF-dependent signaling, may influence telomerase regulation; however, HIF-1α was not measured in the present study and this mechanism therefore remains speculative. This hypoxia-driven mechanism stabilizes activity across study groups, as exposure induces ROS and HIF-1α to boost TERT expression consistently, regardless of age-related decline or obesity-linked inflammation [11]. Along with these, we have also analysed the comparison of the HAPE severity group, the control with severity group and the highlander with severity group. We have observed Telomerase activity was significantly higher in the moderate and severe HAPE groups compared with the relevant reference groups. These findings may indicate activation of telomere-maintenance pathways during more advanced disease; however, the cross-sectional design prevents determination of whether this represents a compensatory response or a consequence of disease severity [33].
As telomere length is composed of rich-guanine nucleotides, and guanine is susceptible to oxidative stress, which is present at maximum at HA [34]. We therefore measured the levels of 8-oxo-dG in study groups. We observed that the 8-oxo-dG was higher in HAPE when compared with control because of the presence of hypobaric hypoxia and extreme environments at HA. However, the higher 8-oxo-dG levels observed in HLs compared with low-altitude controls may reflect chronic exposure to hypobaric hypoxia and the associated long-term oxidative burden. Importantly, because antioxidant capacity and adaptive responses were not directly measured in the present study, this interpretation remains speculative. Elevated oxidative DNA damage in high-altitude residents may therefore represent either increased oxidative burden, an adaptive response to chronic exposure, or a balance between oxidative damage and antioxidant defence [35]. Also, we have checked which condition 8-oxo-dG affects more in the HAPE severity groups. Interestingly, the pattern of 8-oxo-dG across HAPE severity categories did not show a consistent progressive increase with disease severity. HLs exhibited higher 8-oxo-dG levels than the mild and moderate HAPE groups, whereas controls showed higher levels than the moderate and severe HAPE groups. The relatively higher 8-oxo-dG levels observed in HLs may reflect prolonged exposure to hypobaric hypoxia and the associated oxidative burden resulting from long-term residence at high altitude. However, because antioxidant capacity and other determinants of oxidative stress were not directly assessed in the present study, this interpretation remains speculative. Overall, the observed pattern suggests that oxidative DNA damage may be influenced by both chronic high-altitude exposure and disease status rather than increasing linearly with HAPE severity [36]. However, individual variability, driven by genetics, lifestyle, and health status, can mask these effects, leading to nonsignificant oxidative stress levels among different age and obesity groups of HLs, controls, and HAPE.
Additionally, we also investigated the expression of TERF-1, TERF-2, TERC, TERT, RTEL1, TNKS, and ATM as they are linked to telomere biology for the comprehensive study of HA pathophysiology [37]. The expression profiling showed the downregulation of the TERF-1 gene in both HLs and HAPE, which is a negative regulator of telomere length by inhibiting telomerase binding to maintain telomere length and the downregulation of the TERF-1 and TERF-2 genes in hypobaric hypoxia conditions shows the activation of telomerase activity (Smogorzewska et al., 2000). TERC, the positive regulator, has shown up-regulated expression in both HLs and HAPE, which is one of the components of the telomerase enzyme, indicating the activation of telomerase activity by providing RNA templates for telomerase to synthesize telomere repeats. But the TERT gene, which is also a positive regulator of telomeres and one of the components of telomerase enzyme, is found to be downregulated in HAPE, indicating an inability to synthesize telomere repeats and making the telomeres short in HAPE in hypobaric conditions [39]. Upregulation of TERT in HLs compared to controls could be the reason for activating the telomerase enzyme in hypobaric hypoxic conditions to maintain the telomere length. This could be because of living in continuous stress conditions by localizing mitochondria and improving their functions [40]. RTEL1 the positive regulator, which resolves the secondary structures of telomeres by unwinding the G–quadruplexes formed due to abundant guanine-rich DNA sequence in telomeric DNA to facilitate replication and prevent telomere fragility, is found to be upregulated in HLs and downregulated in HAPE as compared to control, resulting in impaired DNA replication and telomere shortening in HAPE [41]. TNKS, the positive regulator, and a poly (ADP-ribose) polymerase enzyme (PARP) are found to be downregulated in HLs and upregulated in HAPE, indicating its recruitment in hypobaric hypoxia conditions, ADP-ribosylating TERF-1, facilitates the binding of telomerase to maintain telomere length [42].
ATM, the positive regulator of telomeres, is a protein kinase in the DNA damage response mechanism activated in response to double-stranded breaks, and ATM is found to be slightly upregulated in HLs and downregulated in HAPE compared to the controls. The reason could be preventing telomere-driven genomic instability under the condition of oxidative stress. However, differential expression of these genes in HAPE suggests maintaining telomere length and combating oxidative stress [43].
We also observed the expression of these genes in HAPE severity groups to determine at which severity of HAPE the genes were more prominent. We observed that TERF1 expression was reduced across the three HAPE severity categories, although the reduction did not reach statistical significance in the moderate group. TERF2 expression was significantly reduced only in severe HAPE, and is consistent with the results of detachment from telomeres and activation of telomerase activity. This progressive loss of TERF-1 correlates with disease severity and likely contributes to telomere uncapping and genomic instability. The telomerase RNA component TERC expression showed a numerical increase across the severity categories, reaching statistical significance only in the moderate group. This pattern aligns with known HIF-1α-mediated regulation of TERC under hypoxic conditions. Downregulation of TERT, the catalytic subunit of telomerase, reflects the variability of telomerase activity under oxidative stress in all severity groups. RTEL1 shows consistent downregulation, indicating persistent replication stress that may contribute to telomere fragility. TNKS expression follows a compensatory pattern similar to TERC, peaking in moderate conditions before declining, consistent with its role in telomere length regulation under stress conditions. The reduced ATM expression observed across increasing severity categories may indicate altered DNA-damage-response signaling; however, additional functional measurements are required to determine whether DNA-repair capacity is impaired. Therefore, the moderate conditions stage emerges as a critical transition point where compensatory mechanisms of TERC and TNKS upregulation peak before succumbing to overwhelming oxidative damage in severe conditions. This provides important insights into the pathophysiology of HAPE. These findings provide a basis for future functional studies investigating whether telomere-maintenance pathways contribute to disease progression and whether they can be therapeutically modulated.
Along with these, we have also done a correlation study of telomere length with SpO2 level, 8-oxo-dG, and telomerase activity. We observed no significant correlation between telomere length and SpO2, telomere length and 8-oxo-dG, telomere length and telomerase activity and telomerase activity with 8-oxo-dG in controls and HLs. In HAPE, we observed a significant negative correlation between telomere length and SpO2 level, indicating the presence of oxidative stress affecting telomere length. In HAPE, a significant negative correlation was observed, suggesting that the elevation of oxidative stress affects telomere length and makes them shorter. We observed a significant positive correlation between telomerase activity and telomere length, and between telomerase activity and 8-oxo-dG, suggesting an active cellular repair mechanism in response to high-altitude hypoxia-induced DNA damage in HAPE. Higher telomerase preserves telomere length by counteracting attrition from ROS, while its elevation alongside 8-oxo-dG indicates enzyme activation proportional to damage severity, attempting telomere maintenance despite ongoing stress [44].
In genotyping, we get seven significant telomere-related genes Ataxia Telangiectasia and Rad3-related (ATR), TERT, Werner Syndrome ATP-Dependent Helicase (WRN), Bloom Syndrome Helicase (BLM), TERF-2, SMG6 nonsense-mediated mRNA decay factor (SMG6), and RTEL1).
The ATR rs2227928 (A>C) variant shows a significant association under the dominant model. The minor allele demonstrates a protective effect with OR = 0.527 (95% CI: 0.3159–0.8791, P = 0.01414) HLs vs HAPE, while the alternate comparison shows increased risk OR = 1.863 (95% CI: 1.0718–3.2383, P = 0.0274). These findings suggest allele-dependent effects, indicating genetic adaptation. The TERT rs2736122 (G>A) polymorphism showed a significant association under the dominant model (OR = 2.084, 95% CI: 1.1957–3.6323, P = 0.0095) in HLs vs Controls, suggesting increased susceptibility. In contrast, the TERT rs35838177 variant under the recessive model showed different effects among the study groups. No significant association was observed in HLs vs HAPE (P = 0.4229), indicating limited influence on HAPE susceptibility in highlanders. However, a significant protective effect was observed in HLs vs Controls (OR = 0.1591, P = 0.0459) and Controls vs HAPE (OR = 0.3642, P = 0.0186). These findings suggest that the minor allele may contribute to reduced risk of HAPE, potentially through mechanisms related to telomere maintenance and cellular response to hypoxic stress. Additionally, the dominant model, TERT rs56345976, showed a significant association in HLs vs HAPE (OR = 2.3, P = 0.0029) and Controls vs HAPE (OR = 1.558, P = 0.025), indicating increased susceptibility to HAPE. rs7725218 demonstrated a modest association in HLs vs HAPE (OR = 1.747, P = 0.040). In contrast, rs2736100 showed a protective effect in HLs vs HAPE (OR = 0.4978, P = 0.0079) but increased risk in HLs vs Controls (OR = 2.084, P = 0.0096), suggesting allele-specific effects influencing telomere regulation and hypoxia adaptation. WRN rs62506091 showed a significant association in HLs vs HAPE (OR = 2.321, P = 0.031) but a protective effect in HLs vs Controls (OR = 0.416, P = 0.032), suggesting allele-specific adaptation. rs1800392 demonstrated a protective effect in HLs vs HAPE (OR = 0.589, P = 0.042) but increased risk in HLs vs Controls (OR = 1.827, P = 0.033). Similarly, rs6994361 showed increased susceptibility in HLs vs Controls (OR = 2.054, P = 0.012), indicating differential genetic influences on hypoxia tolerance and HAPE susceptibility. BLM rs7184015 showed a protective association in Controls vs HAPE (OR = 0.5619, P = 0.0078), suggesting reduced susceptibility to HAPE, while no significant association was observed in the other comparisons. Similarly, TERF2 rs80343879 under the additive model demonstrated a significant protective effect in Controls vs HAPE (OR = 0.2296, P = 0.0218), suggesting that the variants in BLM and TERF2, both involved in telomere stability and DNA repair, may contribute to protective genetic mechanisms against hypoxia-related pathology. SMG6 gene polymorphisms under the dominant genetic model revealed several significant associations across the comparison groups, indicating a potential role of this gene in hypoxia-related susceptibility and adaptation. Multiple SNPs, including rs2760744, rs2760743, rs2760740, rs2281727, rs1231206, rs216172, and rs170040, demonstrated a significant association in the HLs vs HAPE comparison, with odds ratios ranging from 2.17 to 2.39 (P < 0.05). These elevated odds ratios suggest that individuals carrying the minor alleles of these variants have a higher likelihood of developing HAPE when compared with highlanders, indicating that these polymorphisms may contribute to maladaptive responses to hypobaric hypoxia. Additionally, the same variants showed a protective association in the HLs vs Controls comparison, with odds ratios ranging from 0.41 to 0.49, suggesting that these alleles might be more prevalent among highlanders who have developed adaptation. In the Controls vs HAPE comparison, most variants did not show significant differences, indicating comparable allele distributions between these two groups. However, rs12450118 showed a significant protective effect (OR = 0.5723, P = 0.048), suggesting that this variant may reduce susceptibility to HAPE. This might suggest the possible involvement of SMG6, a gene involved in RNA surveillance and telomere maintenance, in modulating cellular responses to oxidative stress and hypoxia, thereby influencing the risk of high-altitude pulmonary edema. The RTEL1 rs6010620 polymorphism under the dominant model showed a strong association in the study groups.
In HLs vs HAPE, the variant exhibited a significant protective effect (OR = 0.2904, P = 1.99×10⁻⁶), suggesting reduced susceptibility to HAPE among highlanders carrying the allele. In contrast, HLs vs Controls showed increased risk (OR = 2.905, P = 0.000174), indicating higher allele frequency in highlanders, possibly reflecting genetic adaptation to chronic hypoxia. No significant association was observed in Controls vs HAPE, suggesting similar allele distribution between these groups.
The STRING-based PPI analysis demonstrated extensive functional connectivity among the 31 selected proteins involved in telomere maintenance, hypoxia signaling, DNA-damage response, oxidative stress, and cellular survival. Notably, proteins including TP53, PARP1, SOD1, SOD2, GPX4, CAT, SIRT6, OGG1, APEX1, and MUTYH connected the telomere-associated proteins with oxidative-stress and DNA-repair pathways. The presence of TERF2, TERT, POT1, RTEL1, BLM, and WRN within the same network further supports functional interactions between telomere maintenance and genome-stability pathways [45].
Collectively, our findings demonstrate differential regulation of telomere-associated genes across the study groups and HAPE severity categories, supporting an association between telomere maintenance pathways, oxidative DNA damage, and susceptibility to high-altitude pulmonary edema. The inter-individual differences in HA disease susceptibility might be due to differences in telomeres and their associated differential genes in different people ascending to heights. Telomeric constituents have long been known to be markers of ageing, longevity, cancer, etc. However, this is the first continuous study of its kind where telomere length, telomerase activity, 8-oxo-dG, and differential gene expression of telomere-associated genes TERF-1, TERF-2, TERC, TERT, RTEL1, TNKS, and ATM, genetic polymorphisms and protein-protein interaction are studied in the context of HA disorders. Several limitations should be considered when interpreting these findings. First, the cross-sectional case-control design does not allow causal relationships to be established between hypobaric hypoxia, oxidative DNA damage, telomere alterations, and HAPE. Second, although demographic variables such as age, sex, and BMI were considered in selected analyses, potentially important confounders, including dietary habits, physical activity, smoking exposure, inflammatory status, duration and intensity of high-altitude exposure, and individual acclimatization history, were not comprehensively assessed. Third, gene-expression analyses were performed in subsets of the overall cohort, and the corresponding sample sizes should therefore be considered when interpreting the findings. Finally, the genetic associations require replication in independent high-altitude cohorts and functional validation before the identified variants can be considered robust biomarkers of HAPE susceptibility or adaptation.
Conclusion
The present study demonstrates an association between altered telomere biology, oxidative DNA damage, and HAPE. HAPE patients exhibited shorter relative telomere length, increased telomerase activity, and higher 8-oxo-dG levels compared with the reference groups, together with differential expression of telomere-associated genes. The observed associations between telomere length, SpO2, telomerase activity, and 8-oxo-dG further support an interaction between oxygen availability, oxidative DNA damage, and telomere homeostasis in HAPE.
Genetic analyses identified several variants in telomere- and DNA-repair-related genes that were associated with differences between highlanders, controls, and HAPE patients; however, these findings should be considered exploratory and require replication and functional validation. Overall, the findings support telomere-associated pathways as potential molecular contributors to high-altitude adaptation and HAPE susceptibility, while longitudinal and mechanistic studies are required to establish causality and evaluate their potential as biomarkers.
Funding
This research received no external or internal funding.
Acknowledgments
We acknowledge the support of SRM University, Delhi-NCR, Institute of Genomics and Integrative Biology-Council of Scientific & Industrial Research (IGIB-CSIR), Delhi, and SNM Hospital, Leh, Ladakh. We also thank all the study participants.
Conflicts of Interest
Authors show no conflict of interest.
References
- P. Bärtsch, H. Mairbäurl, M. Maggiorini, E. R. Swenson, W. Bärtsch, and P. Bärtsch, “Physiological aspects of high-altitude pulmonary edema and 3 Veterans Affairs Puget Sound Health Care System,” J Appl Physiol, vol. 98, pp. 1101–1110, 2005. [CrossRef]
- Z. Ali et al., “Interactions among Vascular-Tone Modulators Contribute to High Altitude Pulmonary Edema and Augmented Vasoreactivity in Highlanders,” PLoS One, vol. 7, no. 9, Sep. 2012. [CrossRef]
- Vibhuti, E. Arif, D. Deepak, B. Singh, and M. A. Qadar Pasha, “Genetic polymorphisms of GSTP1 and mEPHX correlate with oxidative stress markers and lung function in COPD,” Biochem. Biophys. Res. Commun., vol. 359, no. 1, pp. 136–142, Jul. 2007. [CrossRef]
- Q. Pasha and P. Pandey, “Oxidative stress at high altitude: genotype–phenotype correlations,” Adv. Genomics Genet., p. 29, May 2014. [CrossRef]
- Mishra, G. Mohammad, T. Norboo, J. H. Newman, and M. A. Qadar Pasha, “Lungs at high-altitude: genomic insights into hypoxic responses,” J Appl Physiol, vol. 119, pp. 1–15, 2015. [CrossRef]
- Janaszak-jasiecka, A. Siekierzycka, A. Płoska, I. T. Dobrucki, and L. Kalinowski, “Endothelial dysfunction driven by hypoxia—the influence of oxygen deficiency on no bioavailability,” Jul. 01, 2021, MDPI. [CrossRef]
- M. Miglani et al., “Shorter telomere length, higher telomerase activity in association with tankyrase gene polymorphism contribute to high-altitude pulmonary edema,” Hum. Mol. Genet., vol. 29, no. 18, pp. 3094–3106, Sep. 2020. [CrossRef]
- D. B. Rhee, A. Ghosh, J. Lu, V. A. Bohr, and Y. Liu, “Factors that influence telomeric oxidative base damage and repair by DNA glycosylase OGG1,” DNA Repair (Amst)., vol. 10, no. 1, pp. 34–44, Jan. 2011. [CrossRef]
- S. BielskuteÌ, J. Plavec, and P. Podbevšek, “Impact of Oxidative Lesions on the Human Telomeric G-Quadruplex,” J. Am. Chem. Soc., vol. 141, no. 6, pp. 2594–2603, Feb. 2019. [CrossRef]
- F. Gorini, S. Ambrosio, L. Lania, B. Majello, and S. Amente, “The Intertwined Role of 8-oxodG and G4 in Transcription Regulation,” Feb. 01, 2023, MDPI. [CrossRef]
- Q. Pasha, M. Rain, S. Tasnim, H. Kanipakam, T. Thinlas, and G. Mohammad, “The Telomere-Telomerase System Is Detrimental to Health at High-Altitude,” Int. J. Environ. Res. Public Health, vol. 20, no. 3, Feb. 2023. [CrossRef]
- E. Pena, S. El Alam, P. Siques, and J. Brito, “Oxidative Stress and Diseases Associated with High-Altitude Exposure,” Feb. 01, 2022, MDPI. [CrossRef]
- K. Kumar, A. J. Fornace, and S. Suman, “8-OxodG: A Potential Biomarker for Chronic Oxidative Stress Induced by High-LET Radiation,” DNA, vol. 4, no. 3, pp. 221–238, Aug. 2024. [CrossRef]
- J. Lin and E. Epel, “Stress and telomere shortening: Insights from cellular mechanisms,” Ageing Res. Rev., vol. 73, 2022. [CrossRef]
- Kallingal, R. Krzemieniecki, N. Maciejewska, W. Brankiewicz-Kopcińska, and M. Baginski, “TRF1 and TRF2: pioneering targets in telomere-based cancer therapy,” Jul. 01, 2024, Springer Science and Business Media Deutschland GmbH. [CrossRef]
- D. Scarabino, M. Peconi, F. Pelliccia, and R. M. Corbo, “Analysis of the association between TERC and TERT genetic variation and leukocyte telomere length and human lifespan-a follow-up study,” Genes (Basel)., vol. 10, no. 2, Jan. 2019. [CrossRef]
- E. J. Uringa, J. L. Youds, K. Lisaingo, P. M. Lansdorp, and S. J. Boulton, “RTEL1: An essential helicase for telomere maintenance and the regulation of homologous recombination,” Nucleic Acids Res., vol. 39, no. 5, pp. 1647–1655, Mar. 2011. [CrossRef]
- G. H. Ha et al., “Tankyrase-1 function at telomeres and during mitosis is regulated by Polo-like kinase-1-mediated phosphorylation,” Cell Death Differ., vol. 19, no. 2, pp. 321–332, Feb. 2012. [CrossRef]
- X. Guo et al., “Dysfunctional telomeres activate an ATM-ATR-dependent DNA damage response to suppress tumorigenesis,” EMBO Journal, vol. 26, no. 22, pp. 4709–4719, Nov. 2007. [CrossRef]
- N. Srinivas, S. Rachakonda, and R. Kumar, “Telomeres and telomere length: A general overview,” Mar. 01, 2020, MDPI AG. [CrossRef]
- P. Sebastiani, N. Timofeev, D. A. Dworkis, T. T. Perls, and M. H. Steinberg, “Genome-wide association studies and the genetic dissection of complex traits,” Aug. 2009. [CrossRef]
- G. Ngounou Wetie, I. Sokolowska, A. G. Woods, U. Roy, K. Deinhardt, and C. C. Darie, “Protein-protein interactions: Switch from classical methods to proteomics and bioinformatics-based approaches,” Jan. 2014. [CrossRef]
- R. C. Roach et al., “The 2018 lake louise acute mountain sickness score,” High Alt. Med. Biol., vol. 19, no. 1, pp. 4–6, Mar. 2018. [CrossRef]
- M. Ali et al., “Hypobaric hypoxia modulated structural characteristics of circulating cell-free DNA in high-altitude pulmonary edema,” Am. J. Physiol. Lung Cell. Mol. Physiol., vol. 326, no. 4, pp. L496–L507, Apr. 2024. [CrossRef]
- M. D. Gupta et al., “Telomere length in young patients with acute myocardial infarction without conventional risk factors: A pilot study from a South Asian population,” Indian Heart J., vol. 72, no. 6, pp. 619–622, Nov. 2020. [CrossRef]
- E. Mundstock et al., “Effect of obesity on telomere length: Systematic review and meta-analysis,” Nov. 01, 2015, Blackwell Publishing Inc. [CrossRef]
- Y. Suona et al., “Predictive model for estimating the risk of high-altitude pulmonary edema: a single-centre retrospective outcome-reporting study,” BMJ Open, vol. 13, no. 11, Nov. 2023. [CrossRef]
- M. Maggiorini et al., “High-Altitude Pulmonary Edema Is Initially Caused by an Increase in Capillary Pressure,” 2001. [Online]. Available: http://www.circulationaha.org.
- P. Azad et al., “High-altitude adaptation in humans: from genomics to integrative physiology,” J. Mol. Med., vol. 95, no. 12, pp. 1269–1282, 2017. [CrossRef]
- L. A. Tucker and C. J. Bates, “Telomere Length and Biological Aging: The Role of Strength Training in 4814 US Men and Women,” Biology (Basel)., vol. 13, no. 11, Nov. 2024. [CrossRef]
- H. D. M. Wyatt, S. C. West, and T. L. Beattie, “InTERTpreting telomerase structure and function,” Nucleic Acids Res., vol. 38, no. 17, pp. 5609–5622, May 2010. [CrossRef]
- Lira-Mejía et al., “Impact of Exposure Duration to High-Altitude Hypoxia on Oxidative Homeostasis in Rat Brain Regions,” Int. J. Mol. Sci., vol. 26, no. 17, Sep. 2025. [CrossRef]
- L. Gesang et al., “A machine learning-based severity stratification tool for high altitude pulmonary edema,” BMC Med. Inform. Decis. Mak., vol. 25, no. 1, Dec. 2025. [CrossRef]
- G. Gavia-García, J. Rosado-Pérez, T. L. Arista-Ugalde, I. Aguiñiga-Sánchez, E. Santiago-Osorio, and V. M. Mendoza-Núñez, “Telomere length and oxidative stress and its relation with metabolic syndrome components in the aging,” Apr. 01, 2021, MDPI AG. [CrossRef]
- M. Chiorcea-Paquim, “8-oxoguanine and 8-oxodeoxyguanosine Biomarkers of Oxidative DNA Damage: A Review on HPLC–ECD Determination,” Mar. 01, 2022, MDPI. [CrossRef]
- X. Zhang and L. Li, “The significance of 8-oxoGsn in aging-related diseases,” 2020, International Society on Aging and Disease. [CrossRef]
- A. Bertuch, “The molecular genetics of the telomere biology disorders,” Aug. 02, 2016, Taylor and Francis Inc. [CrossRef]
- Smogorzewska et al., “Control of Human Telomere Length by TRF1 and TRF2,” 2000.
- J. Zhou, D. Ding, M. Wang, and Y. S. Cong, “Telomerase reverse transcriptase in the regulation of gene expression,” Jan. 2014. [CrossRef]
- Sengupta et al., “Telomeres control human telomerase (TERT) expression through non-telomeric TRF2,” Elife, vol. 14, Sep. 2025. [CrossRef]
- E. J. Uringa et al., “RTEL1 contributes to DNA replication and repair and telomere maintenance,” Mol. Biol. Cell, vol. 23, no. 14, pp. 2782–2792, Jul. 2012. [CrossRef]
- D. Cook, J. N. Dynek, W. Chang, G. Shostak, and S. Smith, “Role for the Related Poly(ADP-Ribose) Polymerases Tankyrase 1 and 2 at Human Telomeres,” Mol. Cell. Biol., vol. 22, no. 1, pp. 332–342, Jan. 2002. [CrossRef]
- E. G. Di Domenico, E. Romano, P. Del Porto, and F. Ascenzioni, “Multifunctional Role of ATM/Tel1 Kinase in Genome Stability: A from the DNA Damage Response to Telomere Maintenance,” 2014, Hindawi Publishing Corporation. [CrossRef]
- E. Fouquerel, R. P. Barnes, S. Uttam, S. C. Watkins, M. P. Bruchez, and P. L. Opresko, “Targeted and Persistent 8-Oxoguanine Base Damage at Telomeres Promotes Telomere Loss and Crisis,” Mol. Cell, vol. 75, no. 1, pp. 117-130.e6, Jul. 2019. [CrossRef]
- Kristan, N. Debeljak, and T. Kunej, “Integration and visualization of regulatory elements and variations of the epas1 gene in human,” Genes (Basel)., vol. 12, no. 11, Nov. 2021. [CrossRef]
Figure 1.
Relative Telomere Length is represented as mean ± SD in HLs, control, and HAPE (A); in HAPE severity groups: mild, moderate and severe (B); in the age group; young adults (18-30 yr) and middle age (31-60 yr) (C); in the BMI group normal (18.5-24.9 kg/m2) and obese (25 to 30 kg/m2) (D) in GraphPad Prism software (version 8.0.2, GraphPad Software USA). (ns as non-significant, *P ≤0.05, **P ≤0.01, ***P ≤0.001, ****P ≤0.0001).
Figure 1.
Relative Telomere Length is represented as mean ± SD in HLs, control, and HAPE (A); in HAPE severity groups: mild, moderate and severe (B); in the age group; young adults (18-30 yr) and middle age (31-60 yr) (C); in the BMI group normal (18.5-24.9 kg/m2) and obese (25 to 30 kg/m2) (D) in GraphPad Prism software (version 8.0.2, GraphPad Software USA). (ns as non-significant, *P ≤0.05, **P ≤0.01, ***P ≤0.001, ****P ≤0.0001).
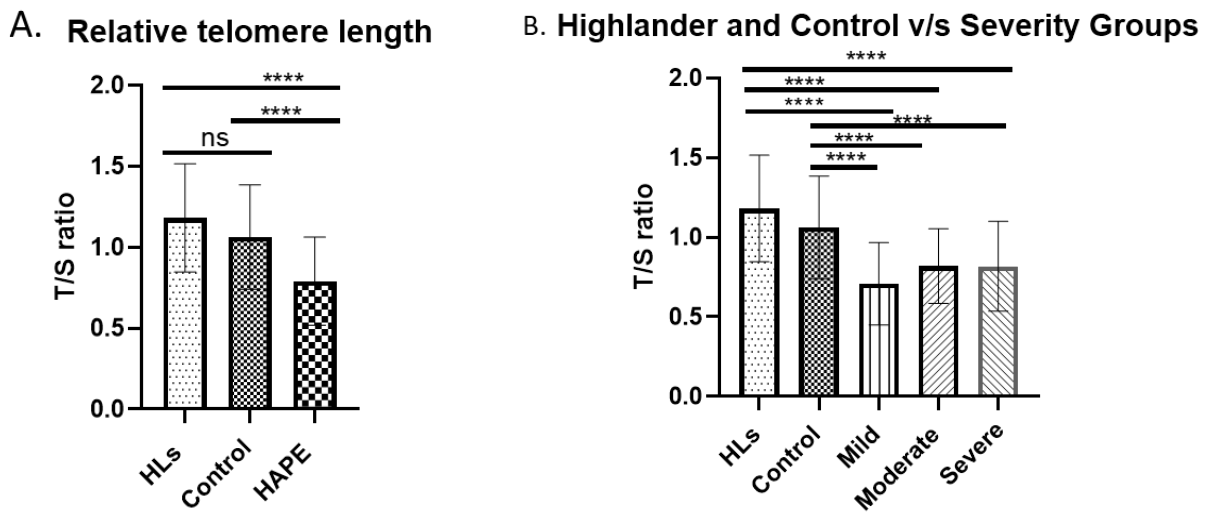
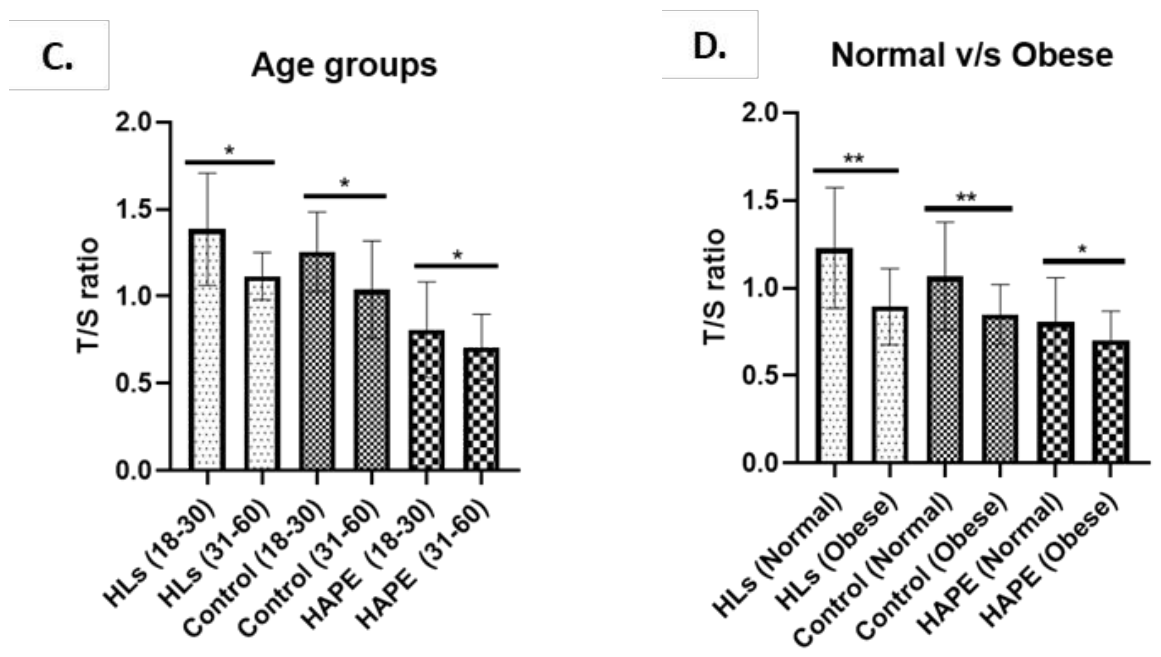
Figure 2.
Telomerase activity is represented as mean ± SD in HLs, control, and HAPE (A); in HAPE severity groups: mild, moderate and severe (B), Highlander v/s HAPE severity groups (C) and Control v/s HAPE severity groups (D), in GraphPad Prism software (version 8.0.2, GraphPad Software USA) was used to perform the comparison (ns as non-significant, *P ≤ 0.05, **P ≤ 0.01, ***P ≤ 0.001, ****P ≤ 0.0001).
Figure 2.
Telomerase activity is represented as mean ± SD in HLs, control, and HAPE (A); in HAPE severity groups: mild, moderate and severe (B), Highlander v/s HAPE severity groups (C) and Control v/s HAPE severity groups (D), in GraphPad Prism software (version 8.0.2, GraphPad Software USA) was used to perform the comparison (ns as non-significant, *P ≤ 0.05, **P ≤ 0.01, ***P ≤ 0.001, ****P ≤ 0.0001).
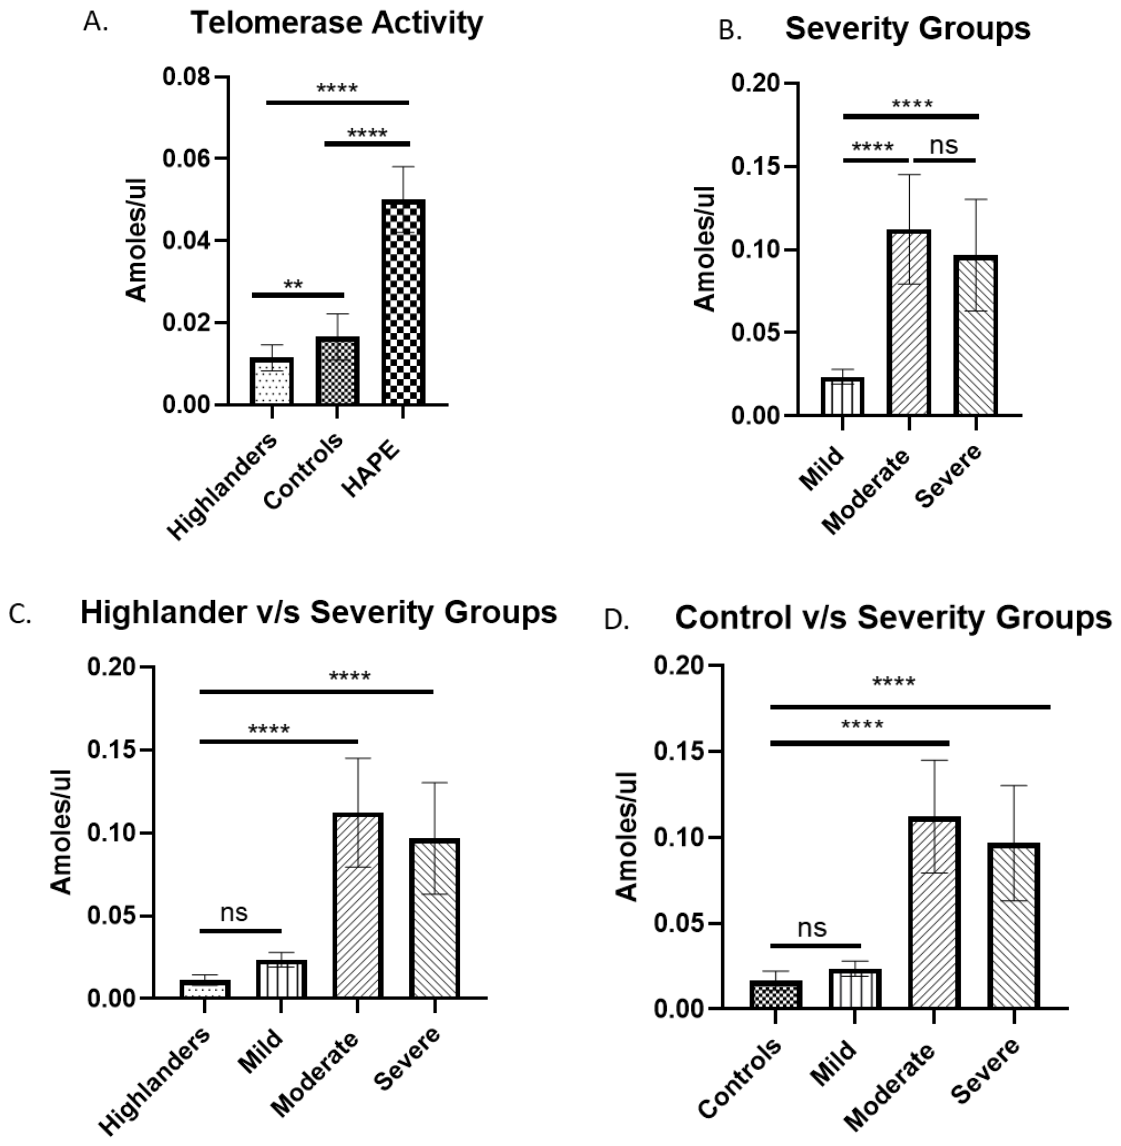
Figure 3.
8-oxo-dG level represented as mean ± SD in HLs, control, and HAPE (A); in HAPE severity groups: mild, moderate and severe as compared to HLs (B); and in HAPE severity groups: mild, moderate and severe as compared to Control C); GraphPad Prism software (version 8.0.2, GraphPad Software USA) was used to perform the comparison (ns as non-significant, *P ≤ 0.05, **P ≤ 0.01, ***P ≤ 0.001, ****P ≤ 0.0001).
Figure 3.
8-oxo-dG level represented as mean ± SD in HLs, control, and HAPE (A); in HAPE severity groups: mild, moderate and severe as compared to HLs (B); and in HAPE severity groups: mild, moderate and severe as compared to Control C); GraphPad Prism software (version 8.0.2, GraphPad Software USA) was used to perform the comparison (ns as non-significant, *P ≤ 0.05, **P ≤ 0.01, ***P ≤ 0.001, ****P ≤ 0.0001).
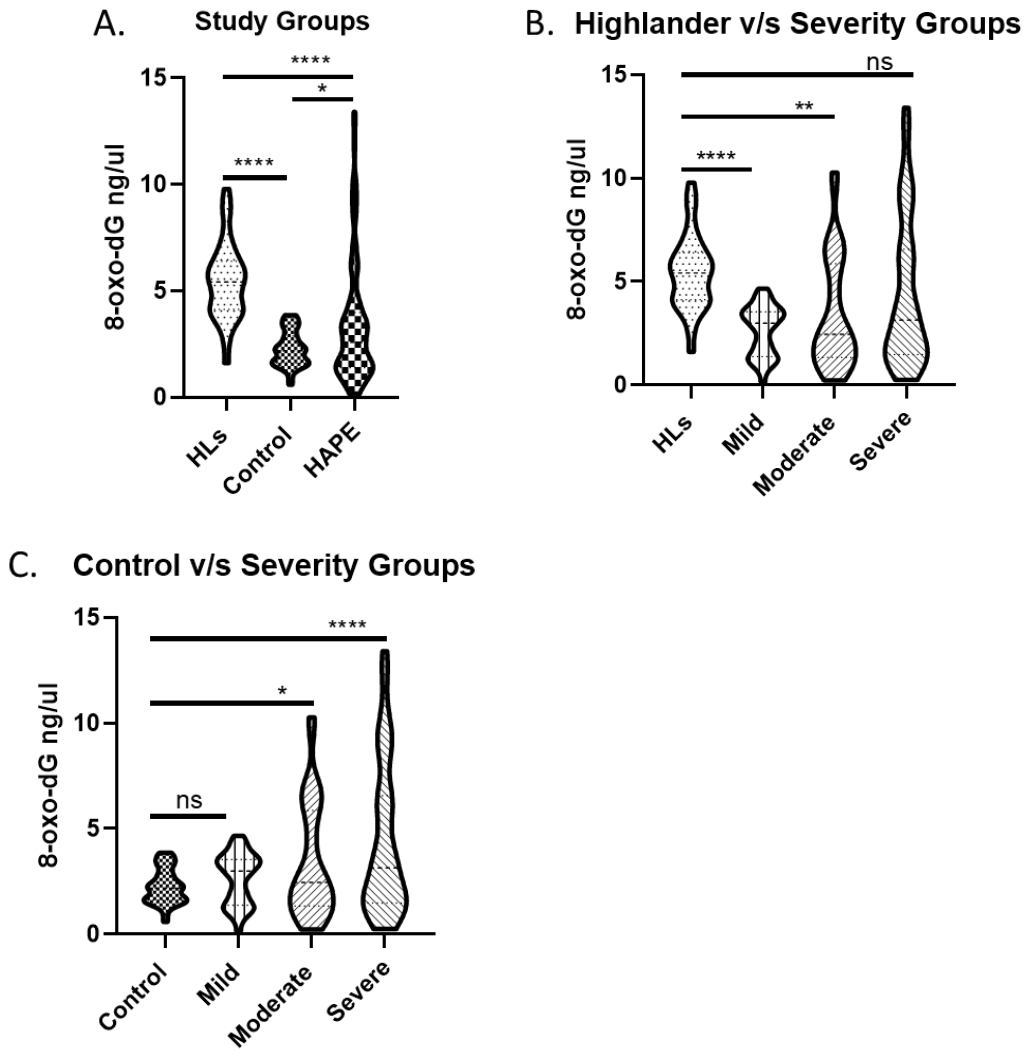
Figure 4.
Expression levels of A). TERF 1, B). TERF 2, C). TERC, D). TERT, E). RTEL1, F). TNKS, and G). ATM: mRNA levels are expressed as fold changes in the HLs and HAPE-p compared with the control. (ns as non-significant, *P ≤0.05, **P ≤0.01, ***P ≤0.001, ****P ≤0.0001).
Figure 4.
Expression levels of A). TERF 1, B). TERF 2, C). TERC, D). TERT, E). RTEL1, F). TNKS, and G). ATM: mRNA levels are expressed as fold changes in the HLs and HAPE-p compared with the control. (ns as non-significant, *P ≤0.05, **P ≤0.01, ***P ≤0.001, ****P ≤0.0001).
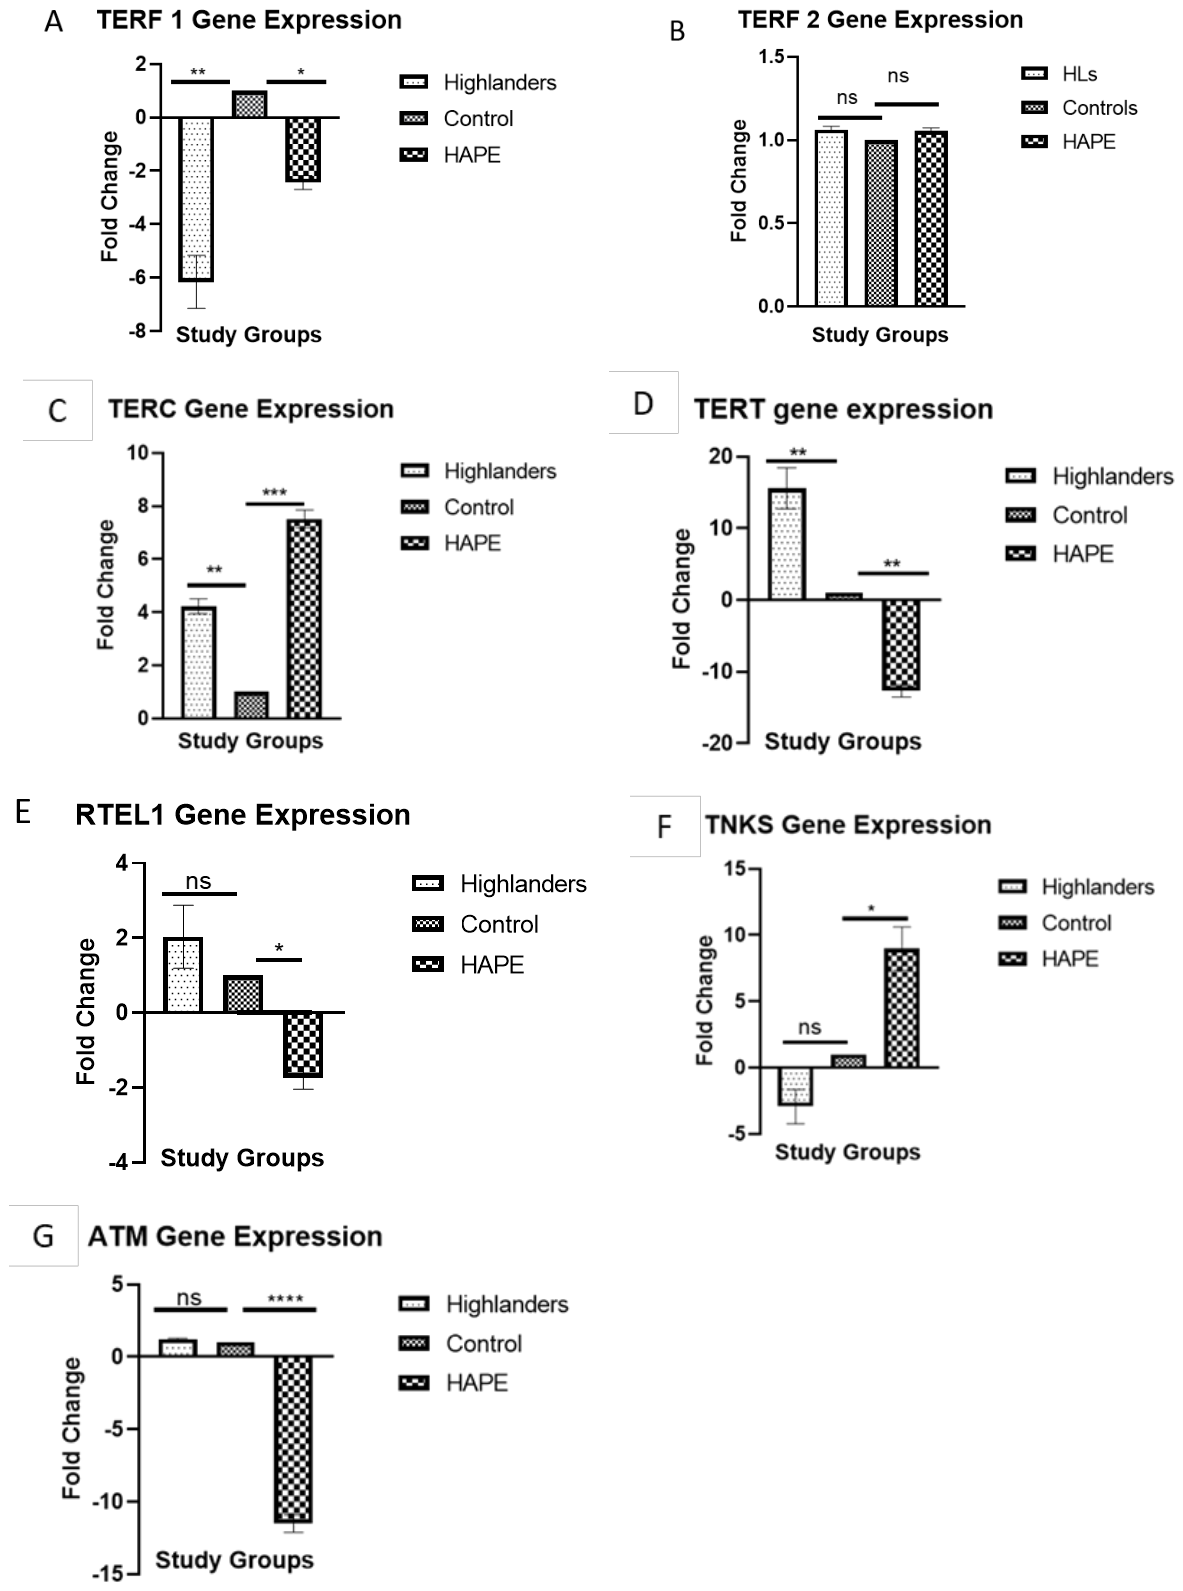
Figure 5.
Expression levels of A). TERF 1, B). TERF 2, C). TERC, D). TERT, E). RTEL1, F). TNKS, and G). ATM in HAPE severity groups: mild, moderate and severe as compared to Controls: mRNA levels are expressed as mild, moderate, and severe fold changes compared with the control. (ns as non-significant, *P ≤ 0.05, **P ≤ 0.01, ***P ≤ 0.001, ****P ≤ 0.0001).
Figure 5.
Expression levels of A). TERF 1, B). TERF 2, C). TERC, D). TERT, E). RTEL1, F). TNKS, and G). ATM in HAPE severity groups: mild, moderate and severe as compared to Controls: mRNA levels are expressed as mild, moderate, and severe fold changes compared with the control. (ns as non-significant, *P ≤ 0.05, **P ≤ 0.01, ***P ≤ 0.001, ****P ≤ 0.0001).
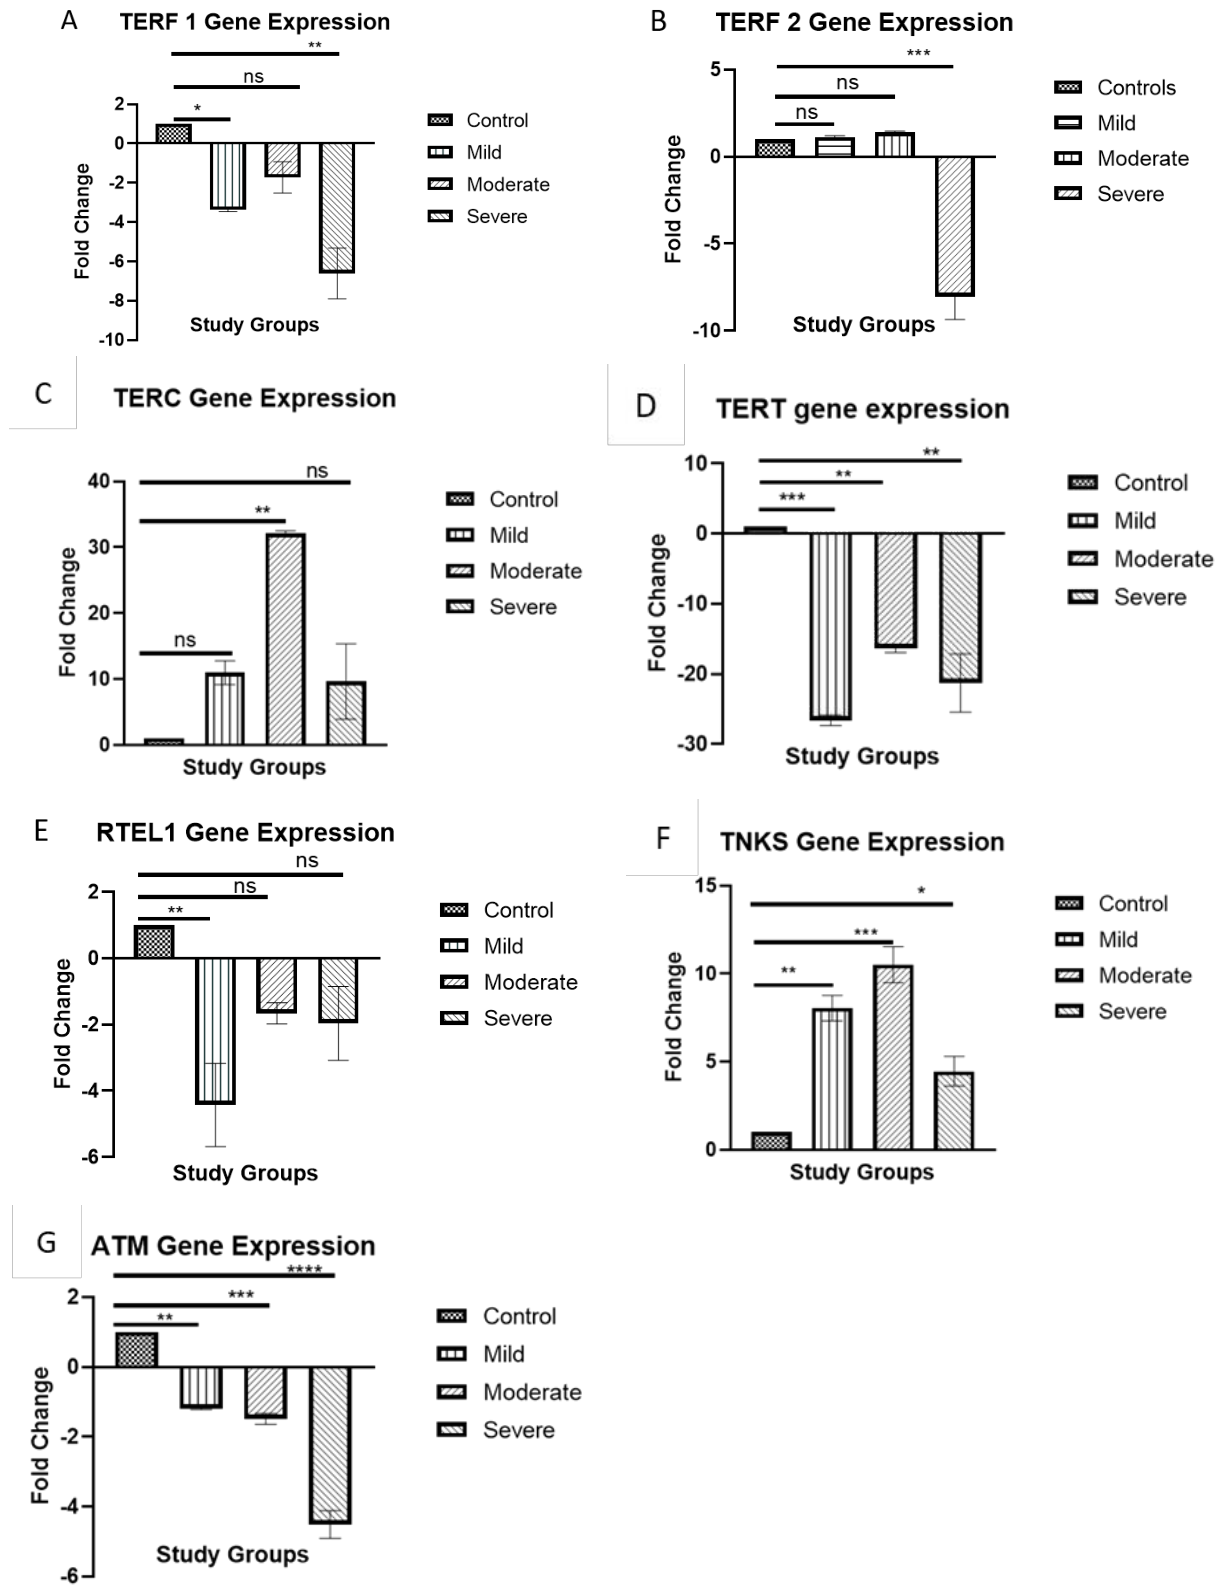
Figure 6.
Correlation analyses in HAPE patients. (A) Relative telomere length versus SpO2; (B) relative telomere length versus 8-oxo-dG; (C) relative telomere length versus telomerase activity; and (D) telomerase activity versus 8-oxo-dG. Correlations were assessed using R programming language (version 4.4.0). P < 0.05 was considered statistically significant.
Figure 6.
Correlation analyses in HAPE patients. (A) Relative telomere length versus SpO2; (B) relative telomere length versus 8-oxo-dG; (C) relative telomere length versus telomerase activity; and (D) telomerase activity versus 8-oxo-dG. Correlations were assessed using R programming language (version 4.4.0). P < 0.05 was considered statistically significant.
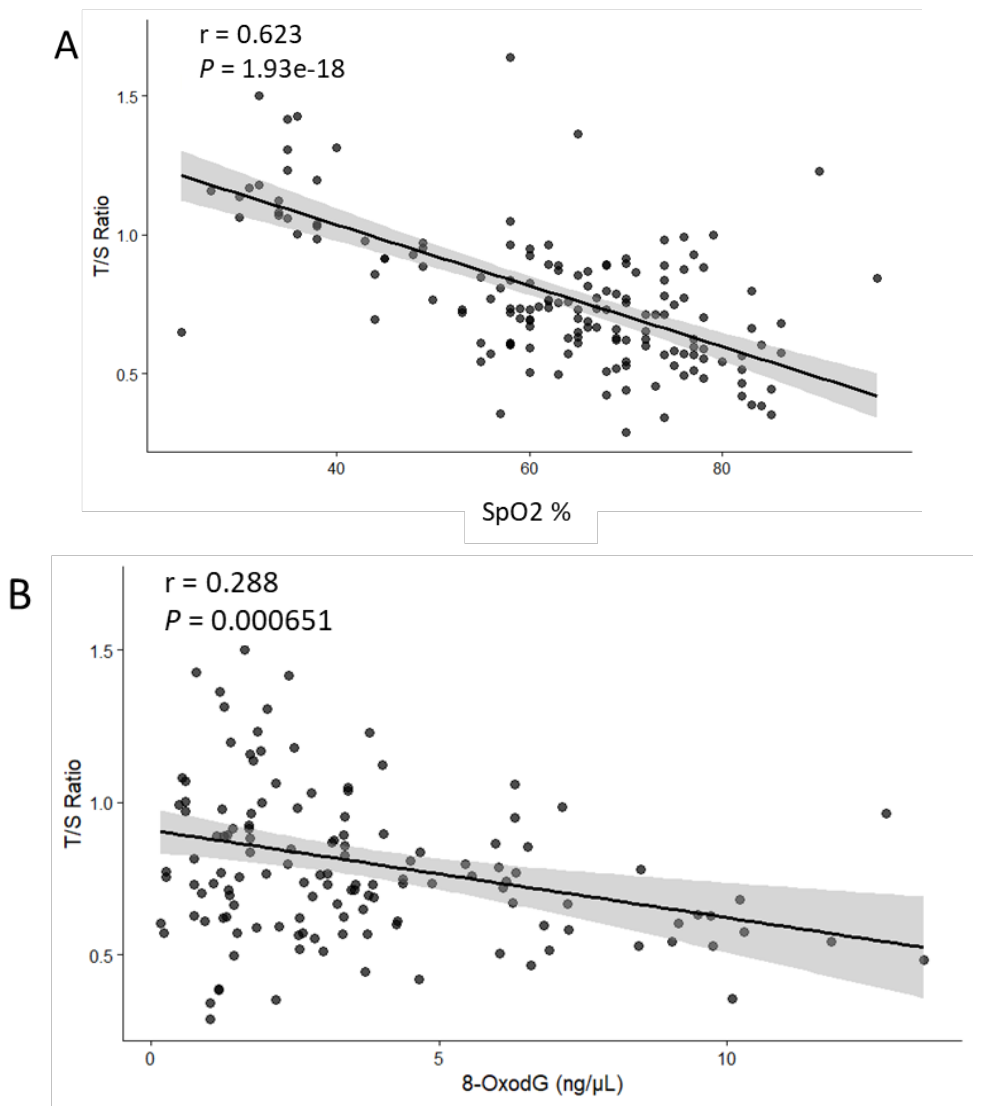
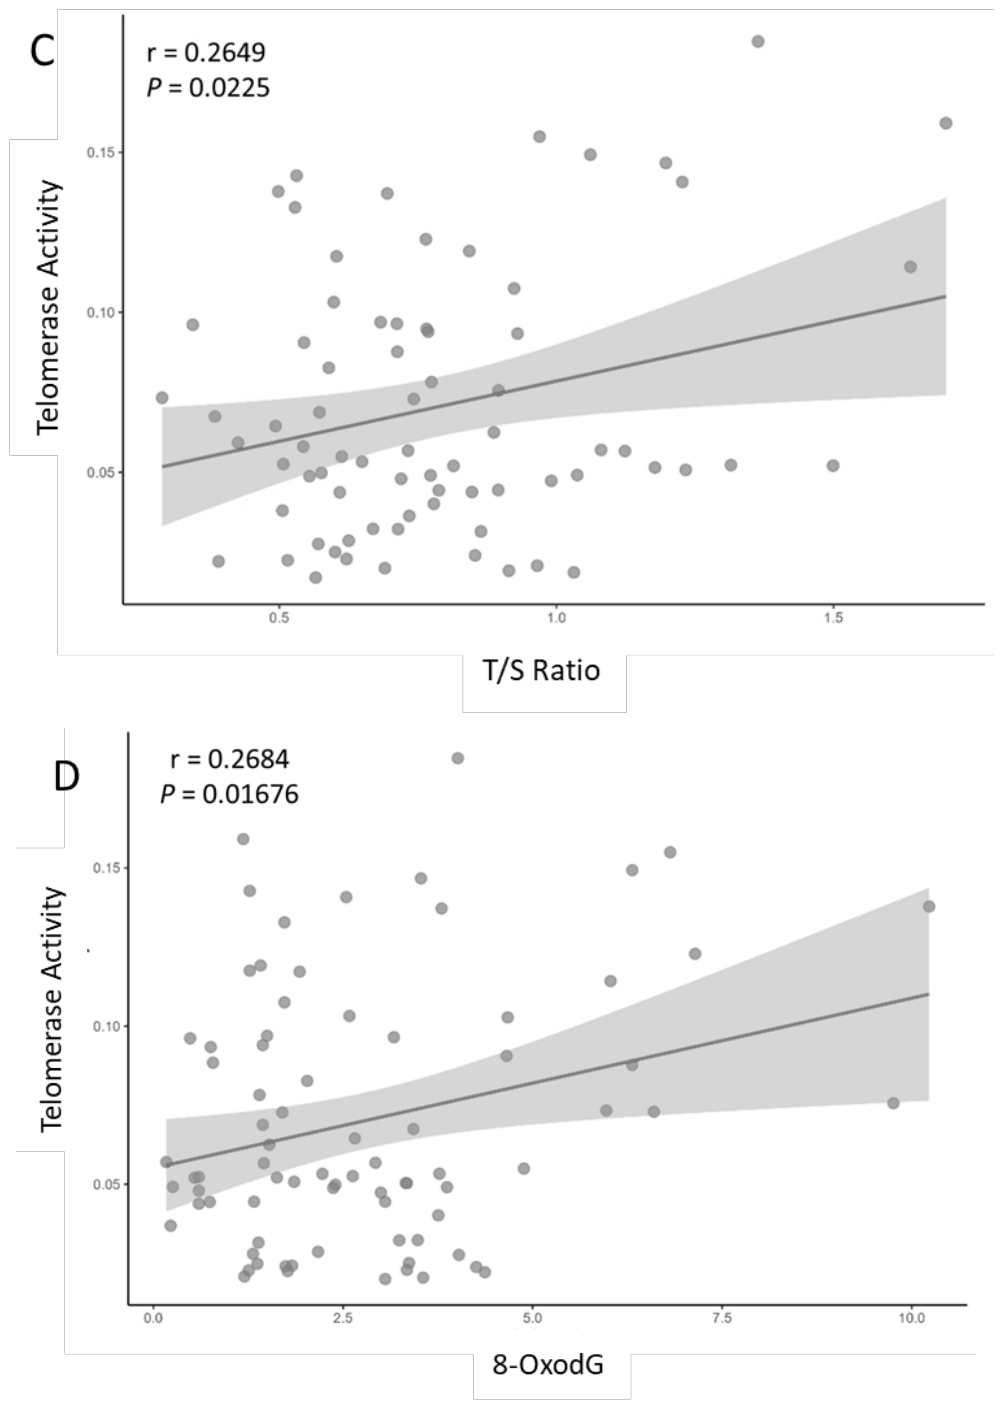
Figure 7.
Protein–protein interaction network of the 31 selected proteins generated using STRING version 12.0. The network consisted of 31 nodes and 143 edges, with an average node degree of 9.23 and an average local clustering coefficient of 0.692. The network showed significant PPI enrichment (P < 1.0 × 10⁻¹⁶), indicating greater functional connectivity among the selected proteins than expected by chance.
Figure 7.
Protein–protein interaction network of the 31 selected proteins generated using STRING version 12.0. The network consisted of 31 nodes and 143 edges, with an average node degree of 9.23 and an average local clustering coefficient of 0.692. The network showed significant PPI enrichment (P < 1.0 × 10⁻¹⁶), indicating greater functional connectivity among the selected proteins than expected by chance.
Disclaimer/Publisher’s Note: The statements, opinions and data contained in all publications are solely those of the individual author(s) and contributor(s) and not of MDPI and/or the editor(s). MDPI and/or the editor(s) disclaim responsibility for any injury to people or property resulting from any ideas, methods, instructions or products referred to in the content. |
© 2026 by the authors. Licensee MDPI, Basel, Switzerland. This article is an open access article distributed under the terms and conditions of the Creative Commons Attribution (CC BY) license (http://creativecommons.org/licenses/by/4.0/).
Copyright: This open access article is published under a Creative Commons CC BY 4.0 license, which permit the free download, distribution, and reuse, provided that the author and preprint are cited in any reuse.