

Submitted:
21 August 2026
Posted:
24 August 2026
You are already at the latest version
Abstract
Background/Objectives: Deep endometriosis surgery may require bowel and multiorgan procedures. We quantified the frequency of a hemoglobin decline of at least 3 g/dL and examined associations with surgery duration and clinically recognizable measures of operative extent.
Methods: This single-center retrospective cohort included the first eligible surgery per patient from 2020 through 2025. Hemoglobin decline was the last preoperative value within 7 days before surgery minus the lowest recorded postoperative value through day 3. Multivariable regression examined a decline of at least 3 g/dL and continuous decline; secondary analyses assessed operative extent, models excluding preoperative hemoglobin, and missing data.
Results: Among 424 patients, 416 (98.1%) had paired measurements; 156/416 (37.5%) met the primary outcome. Each additional surgical hour was associated with higher odds (odds ratio [OR], 1.61; 95% confidence interval [CI], 1.35–1.91); the estimate was similar without preoperative hemoglobin (OR, 1.50; 95% CI, 1.28–1.76). Continuous decline was 0.20 g/dL greater per hour (95% CI, 0.13–0.26). The lowest recorded postoperative value occurred on days 2–3 in 242/421 patients (57.5%); sampling was not standardized. Among 379 patients with available resection-multiplicity data, exploratory outcome rates were 14.5%, 38.3%, and 54.9% after no, one, and multiple full-thickness bowel resections, respectively.
Conclusions: A hemoglobin decline of at least 3 g/dL occurred after 37.5% of surgeries. Longer duration was associated with greater decline; exploratory analyses suggested gradients with operative extent. Their monitoring value requires prospective evaluation. Preoperative anemia remains relevant because the same decline produces a lower postoperative concentration.
Keywords:
deep endometriosis
; hemoglobin
; patient blood management
; surgery duration
; bowel resection
; perioperative anemia
1. Introduction
Surgery for deep endometriosis may combine rectosigmoid and upper-bowel procedures in a single session. For the operating surgeon, the practical question is which surgeries are most likely to be followed by a hemoglobin decline of at least 3 g/dL. This information may inform preoperative preparation and the timing of postoperative testing [1,2,3].
Preoperative anemia and perioperative hemoglobin decline represent different clinical problems. A lower preoperative concentration leaves less reserve after any given decline, so anemia should be investigated and treated when indicated. Surgical features may identify a different group: patients whose surgery is likely to be followed by a larger decline and who may benefit from planned postoperative monitoring.
The extent of surgery varies widely among patients. Guidelines recommend specialist-center treatment and an individualized multidisciplinary plan [4,5,6]. Previous studies have linked bowel resection and extensive disease with longer operating times, greater measured blood loss, and postoperative morbidity [7,8,9]. However, perioperative hemoglobin decline has received less attention in this population.
Patient blood management (PBM) begins before surgery and continues through postoperative care. It combines identification and treatment of anemia, measures that limit avoidable blood loss, and appropriately timed blood counts [1,2]. However, transfusion is a treatment-dependent endpoint influenced by clinical thresholds, patient status, and local practice [10]. Many gynecologic prediction studies have nevertheless used transfusion as their endpoint [11,12], and published models vary substantially [13].
Our primary aim was to quantify the frequency of a hemoglobin decline of at least 3 g/dL and examine its association with surgery duration. Secondary objectives were to analyze decline as a continuous outcome, compare clinically recognizable categories of surgical type and extent, and test whether the duration finding persisted after preoperative hemoglobin was removed from the model.
2. Materials and Methods
2.1. Study Design and Setting
We conducted a single-center retrospective cohort study of patients who underwent surgery for deep endometriosis at the Clinical Department of Gynecologic Oncology, Prof. Tadeusz Koszarowski Opole Cancer Centre, an academic affiliate of the Institute of Medical Sciences, University of Opole. Data were drawn from the institutional deep-endometriosis registry, linked locally to laboratory records. The study period covered 1 January 2020 through 31 December 2025. Reporting followed the STROBE statement and the RECORD extension for routinely collected health data [14,15].
The Bioethics Committee of the University of Opole approved the study (decision No. UO/0029/KB/2026; 25 June 2026) and waived individual informed consent because of the retrospective design. Analyses were performed locally using pseudonymized data.
2.2. Participants
Surgeries recorded in the institutional deep-endometriosis registry during the study period were eligible if they had a same-day link to the operative record, a recorded start time and duration, and organ-specific procedure information. Availability of hemoglobin measurements was not an eligibility criterion. When a patient had more than one eligible surgery, the earliest was selected as the index surgery. Each patient therefore contributed one surgery to the analysis.
2.3. Hemoglobin Measurements and Outcomes
Preoperative hemoglobin (Hb) was the last measurement obtained from 7 days before surgery until the recorded start of surgery. The recorded postoperative nadir was the lowest available value after the end of surgery through postoperative day 3. No intraoperative hemoglobin measurements were available.
The primary outcome was an absolute hemoglobin decline of at least 3 g/dL, calculated as preoperative hemoglobin minus the postoperative nadir. This operational threshold was selected before the feasibility analysis but is not a validated minimum clinically important difference. Continuous decline was a key secondary outcome. Other secondary outcomes were a decline of at least 4 g/dL, a postoperative nadir below 9 g/dL and below 8 g/dL, and red blood cell (RBC) transfusion during the index hospitalization.
Transfusion was considered present if it was recorded in the dedicated transfusion table or with ICD-9 procedure code 99.04. Discordant records were not clinically adjudicated, and the timing of transfusion relative to the recorded postoperative nadir was unavailable.
2.4. Surgical Variables and Other Covariates
Surgery duration was modeled as a continuous variable and expressed per 60-minute increment. The primary model additionally included preoperative hemoglobin concentration, the number of organs involved in the procedure, and the presence of upper-bowel and bladder surgery. The organ count comprised upper bowel, bladder, rectum or sigmoid colon, uterus, vagina, and ureter. The upper bowel was defined as the small bowel, appendix, cecum, and colon proximal to the rectosigmoid junction; rectosigmoid procedures were counted separately. Age at surgery was also described, together with the length of hospital stay, counted as inclusive calendar days from admission through discharge. Conversion to laparotomy was reported descriptively because the registry did not contain a standardized field for initial operative access.
We used three exploratory groupings to characterize the type and extent of surgery. First, rectosigmoid surgery, reported as bowel technique in the tables and figures, was classified as no full-thickness resection or shaving only, discoid resection without segmental resection, or any segmental resection. Second, a separate registry field indicated whether more than one full-thickness bowel resection had been performed. Among completed records, surgeries were classified as no resection when no full-thickness resection was recorded, one resection when a resection was recorded without the multiple-resection flag, and multiple resections when the flag was present. Neither the exact number of resections nor their anatomical distribution was recorded, and a blank field was treated as missing rather than as zero, so this variable was analyzed in complete cases only. Third, the organ count was categorized as no more than one, two, or three or more. Two further variables were handled separately: anastomotic height above the anal verge was modeled as a continuous variable and reported per 5-cm increment among patients undergoing segmental resection, and body mass index (BMI) was included only in sensitivity analyses.
An additional exploratory analysis combined resection multiplicity and organ count into three operative-burden strata. Low burden was defined as no recorded full-thickness bowel resection together with involvement of no more than one organ. High burden was defined as an explicitly recorded multiple bowel resection or involvement of three or more organs; all other surgeries were intermediate. For these strata, a blank multiplicity field was handled as no recorded multiple resection; it could therefore prevent, but never create, assignment to the high-burden group. Definitions were set before the composite group outcomes were calculated; none used fitted probabilities or outcome-derived cut points. The display rule was outcome-dependent; it is specified in the Supplementary Methods. These strata were intended as a descriptive clinical summary rather than a validated prediction rule.
2.5. Statistical Analysis
Continuous variables were summarized as medians and interquartile ranges, and categorical variables as n/N (%). Exact 95% confidence intervals (CIs) were calculated for proportions.
Multivariable logistic regression was used to examine factors associated with a hemoglobin decline of at least 3 g/dL. The outcome threshold was fixed before preliminary feasibility work. Surgery duration was selected as the principal exposure after that work, and the primary model was fixed before the final analysis. It included surgery duration, preoperative hemoglobin, organ count, upper-bowel surgery, and bladder surgery. Results are reported as adjusted odds ratios (ORs) with 95% CIs. Continuous hemoglobin decline was examined with the same covariates using linear regression with HC3 robust standard errors.
Because preoperative hemoglobin is part of the calculated decline, its apparent association with that decline can arise partly from arithmetic rather than biology [16,17]. We therefore repeated the binary and continuous analyses without preoperative hemoglobin. We also compared how well preoperative hemoglobin alone, the surgical variables alone, and both together discriminated between patients in whom the primary outcome did and did not occur. We summarized discrimination with the area under the receiver operating characteristic (ROC) curve (AUC) and overall prediction error with the Brier score, and we assessed calibration as the agreement between predicted and observed proportions [18,19]. Model performance was internally validated by patient-level bootstrap resampling; full specifications are provided in the Supplementary Methods.
Primary analyses included patients with both hemoglobin measurements. We compared patients with and without a complete pair and repeated the duration analysis using inverse-probability weighting, multiple imputation of the two hemoglobin components, and prespecified missing-not-at-random scenarios [20,21,22,23]. In separate sensitivity analyses we excluded surgeries involving the bladder, excluded patients with a recorded transfusion, allowed a nonlinear duration effect, used separate organ indicators, and added BMI (Table S1). Age and year of surgery were examined separately in post hoc sensitivity models. We also examined the last platelet count, activated partial thromboplastin time (APTT), and international normalized ratio (INR) recorded from 7 days before surgery until the recorded start of surgery. Each marker was added separately and all three were then added together to assess information beyond the primary model. None of these analyses replaced the primary model. Full specifications are provided in the Supplementary Methods.
Analyses of surgical type and extent were exploratory. Continuous decline was the main outcome and the binary outcome was secondary. All models were adjusted for preoperative hemoglobin and were fitted both with and without surgery duration. For the post hoc operative-burden strata, we reported group-specific outcomes and an ordered trend across low, intermediate, and high burden. Adjustment for surgery duration was treated as an attenuation check because duration is itself one manifestation of operative burden. No outcome-based cut point, interaction, or confirmatory family was defined.
Analyses were performed in R version 4.6.1 (R Foundation for Statistical Computing, Vienna, Austria). Multiple imputation used mice version 3.19.0. Figures were produced with ggplot2 version 4.0.3, patchwork version 1.3.2, svglite version 2.2.2, ragg version 1.5.2, and scales version 1.4.0. Missing-data reporting followed TARMOS. The TRIPOD and PROBAST checklists guided reporting of discrimination and calibration, although this study did not develop or validate a clinical prediction model [23,24,25].
2.6. Relationship to Previous Publications From the Center
Previous publications from our center examined bladder endometriosis, a modified segmental bowel-resection technique, and colorectal dehiscence or rectovaginal fistula [26,27,28]. One prior bladder cohort reported descriptive and subgroup perioperative hemoglobin changes. None of the prior publications assessed the full cohort using the present 3-g/dL endpoint, postoperative-day- 0–3 window, and primary multivariable framework.
The reconstructed cohorts overlap: at least 402/424 patients appeared in one or more prior cohorts; the categories overlap, and the historical modified-resection count is a lower bound. The present analysis extends previous work from our center and is not based on an independent cohort. It does not re-evaluate the organ-specific complications reported in those studies.
3. Results
3.1. Hemoglobin Decline and Cohort Profile
The source cohort contained 443 eligible surgeries. After 19 repeat surgeries were excluded, 424 patients contributed one index surgery each (Figure 1). The median age was 38.3 years (IQR, 33.6–42.3), and the median length of hospital stay was 8 days (IQR, 8–9). Among 419 patients with a preoperative measurement, 41 (9.8%) had hemoglobin below 12 g/dL.
A rectosigmoid procedure was performed in 383/424 patients (90.3%), uterine surgery in 273 (64.4%), and bladder surgery in 82 (19.3%). A ureteral procedure was performed in 63 patients (14.9%) and an upper-bowel procedure in 57 (13.4%) (Table 1).
Preoperative hemoglobin was available for 419/424 patients, a postoperative nadir for 421/424, and both measurements for 416/424 (98.1%). Among the 416 patients with both measurements, the median hemoglobin decline was 2.6 g/dL (IQR, 2.0–3.3). The primary outcome occurred in 156/416 patients (37.5%; exact 95% CI, 32.8–42.3%), and 42/416 (10.1%) had a decline of at least 4 g/dL. Median hemoglobin decreased from 13.3 g/dL (IQR, 12.6–14.0) before surgery to 10.6 g/dL (IQR, 9.7–11.4) at the recorded postoperative nadir. A recorded nadir below 9 g/dL occurred in 42/421 patients (10.0%), and 8/421 (1.9%) had a recorded nadir below 8 g/dL.
The lowest recorded postoperative value occurred on postoperative day 1 in 179/421 patients (42.5%), day 2 in 123 (29.2%), and day 3 in 119 (28.3%). Because sampling times were not standardized, this distribution describes the lowest available value rather than measurements obtained on a common schedule. RBC transfusion was recorded in 42/424 patients (9.9%). Among the 42 transfused patients with both hemoglobin measurements, the primary outcome occurred in 29 (69.0%; Table 2).
3.2. Surgery Duration and Hemoglobin Decline
Longer surgery duration was associated with greater hemoglobin decline. In the primary model, each additional hour was associated with 61% higher odds of the primary outcome (OR, 1.61; 95% CI, 1.35–1.91). Removing preoperative hemoglobin did not materially weaken the association (OR, 1.50; 95% CI, 1.28–1.76).
Each additional hour also corresponded to a 0.20-g/dL greater continuous decline, both with preoperative hemoglobin in the model (95% CI, 0.13–0.26) and without it (95% CI, 0.12–0.27). The interquartile range of surgery duration was 170 to 286 minutes. Across that interval, the modeled probability of the primary outcome increased from approximately 25% to 45% (Figure 2).
Table 3 summarizes binary and continuous duration estimates; the complete coefficient sets are given in Table S4.
The preoperative-Hb model contains preoperative hemoglobin only. The surgical-variable model contains surgery duration, organ count, upper-bowel surgery, and bladder surgery. The combined model contains both sets of variables. The recorded-postoperative-nadir row is an algebraic re-expression of the continuous-decline row, because the nadir equals preoperative hemoglobin minus the decline in a model that already adjusts for preoperative hemoglobin; it is shown for completeness and is not an independent confirmation. The three logistic models in Panel B were internally validated with 1000 bootstrap resamples; internally validated values equal apparent performance minus the average bootstrap optimism. AUC differences used 2000 paired resamples. Hb, hemoglobin; OR, odds ratio; CI, confidence interval; AUC, area under the receiver operating characteristic curve.
Preoperative hemoglobin was strongly associated with crossing the fixed 3-g/dL threshold (OR per 1 g/dL, 2.32; 95% CI, 1.81–2.98). Because preoperative hemoglobin is part of the calculated decline, this coefficient reflects both the data and an arithmetic relationship. The association with surgery duration persisted in both models that excluded preoperative hemoglobin.
3.3. Clinically Recognizable Patterns of Surgical Extent
Hemoglobin decline increased with the extent of rectosigmoid surgery (Figure 3 and Table 4). The primary outcome occurred in 17/83 patients (20.5%) after no full-thickness resection or shaving only, 20/64 (31.2%) after discoid resection, and 119/269 (44.2%) after segmental resection (Table S2). With preoperative hemoglobin and duration in the model, the mean decline was 0.33 g/dL greater after discoid resection (95% CI, 0.05–0.61) than in the reference group. The corresponding difference after segmental resection was 0.40 g/dL (95% CI, 0.18–0.62).
A similar pattern was observed across the bowel-resection multiplicity categories. Among 379 patients with this field recorded, the outcome frequency was 9/62 (14.5%) with no full-thickness resection and 102/266 (38.3%) with one resection. It was 28/51 (54.9%) when multiple resections were performed during the same surgical session. In the same adjusted model, the mean decline was 0.40 g/dL greater after one resection (95% CI, 0.17–0.64). The corresponding difference after multiple resections was 0.70 g/dL (95% CI, 0.28–1.11). Corresponding ORs were 2.61 (95% CI, 1.13–6.04) and 3.46 (95% CI, 1.21–9.91). Because technique and multiplicity were separate registry fields, their denominators differed; details are provided in the Supplementary Methods.
A comparable gradient was observed for the number of organs involved. The outcome frequency was 28/108 (25.9%) with no more than one organ involved, 76/204 (37.3%) with two organs, and 52/104 (50.0%) with at least three (Table S2). After adjustment for preoperative hemoglobin and duration, the mean decline was 0.13 g/dL greater for two organs than for no more than one (95% CI, −0.08 to 0.34). The corresponding difference for at least three organs was 0.33 g/dL (95% CI, 0.05–0.61).
No clear association was observed between anastomotic height and hemoglobin decline. This variable was recorded in 240 of the 269 patients who underwent segmental resection. In this subgroup, the adjusted mean difference per 5-cm increase was −0.09 g/dL (95% CI, −0.33 to 0.15). Field availability is detailed in the Supplementary Methods.
3.4. Descriptive Operative-Burden Strata
The post hoc operative-burden strata summarized these overlapping surgical features. The definitions were specified before group outcomes were calculated, but the strata were retained for presentation only after minimum-size, minimum-event, and monotonic-outcome display conditions were met. They are descriptive and require external validation. Low-, intermediate-, and high-burden strata included 44/416 (10.6%), 256/416 (61.5%), and 116/416 (27.9%) patients, respectively. The outcome frequency was 11/44 (25.0%), 85/256 (33.2%), and 60/116 (51.7%), and the mean hemoglobin decline was 2.12, 2.64, and 3.06 g/dL, respectively (Table 5).
Low burden was defined as no recorded full-thickness bowel resection and no more than one organ involved. High burden was defined as an explicitly recorded multiple bowel resection or at least three organs involved; all remaining surgeries were intermediate. When a surgery met both the low-burden and the high-burden definition, the high-burden definition took precedence. A blank resection-multiplicity field was treated as no recorded multiple resection; it could therefore prevent, but never create, assignment to the high-burden group. The definitions were specified before group outcomes were calculated, but the strata were retained for presentation only after minimum-size, minimum-event, and monotonic-outcome display conditions were met. This display rule was outcome-dependent. The strata are descriptive and require external validation. Confidence intervals for proportions are exact (Clopper–Pearson). Hb, hemoglobin; IQR, interquartile range; CI, confidence interval.
After adjustment for preoperative hemoglobin and duration, mean decline was 0.30 g/dL greater per category increase (95% CI, 0.13–0.48). For the binary outcome, the corresponding estimate was imprecise (OR, 1.48; 95% CI, 0.96–2.28; Table S5).
3.5. Robustness of the Duration Finding
Combining preoperative hemoglobin with surgical variables yielded an internally validated AUC of 0.760. Without preoperative hemoglobin, the surgical-variable model had an AUC of 0.684. On the apparent-performance scale used for paired comparisons, adding preoperative hemoglobin to the surgical model increased AUC by 0.074 (95% CI, 0.031–0.125). Adding surgical variables to the preoperative-hemoglobin model increased AUC by 0.085 (95% CI, 0.054–0.131). Both preoperative hemoglobin and the surgical variables contributed to discrimination (Table 3). Calibration within this cohort is shown in Figure 4.
Alternative approaches to missing measurements produced comparable duration estimates. Inverse-probability weighting gave an OR of 1.61 (95% CI, 1.35–1.92). Multiple imputation gave an OR of 1.58 (95% CI, 1.33–1.88) and a continuous estimate of 0.19 g/dL per hour (95% CI, 0.13–0.25). Planned missing-not-at-random scenarios left the estimates essentially unchanged (Table S3).
Age was not clearly associated with either outcome (per 10 years: OR, 1.21; 95% CI, 0.82–1.79; continuous decline, 0.12 g/dL; 95% CI, −0.03 to 0.27). These intervals were wide and did not exclude a clinically relevant association. Including age did not materially change the duration estimate. Excluding surgeries involving the bladder yielded a consistent duration association (OR, 1.59; 95% CI, 1.31–1.94). There was no strong evidence of nonlinearity (p = 0.075). The per-hour estimate should be interpreted as an average association across the observed range. Year-of-surgery and other sensitivity analyses likewise preserved the duration association (Table S1).
Preoperative platelet count, APTT, and INR were available for 416, 415, and 413 patients with both hemoglobin measurements, respectively. None materially changed the duration estimate. Adding all three changed apparent AUC by 0.002 and provided no evidence of improved model fit (likelihood-ratio p = 0.822; Table S5).
4. Discussion
4.1. Main Findings
A hemoglobin decline of at least 3 g/dL occurred after 37.5% of surgeries for deep endometriosis. Surgery duration remained associated with both binary and continuous decline when preoperative hemoglobin was removed from the model. Exploratory gradients were observed across rectosigmoid techniques, bowel-resection multiplicity, and the number of organs involved. The post hoc operative-burden strata also showed a descriptive gradient, but their display was outcome-dependent and the duration-adjusted binary trend was imprecise (OR, 1.48; 95% CI, 0.96–2.28). These exploratory patterns require external validation.
4.2. Comparison with Previous Studies
Earlier studies of deep endometriosis have generally reported measured blood loss, surgery duration, or postoperative complications rather than a defined hemoglobin-change outcome. Direct comparison with the 37.5% primary outcome frequency is therefore limited. These findings are nevertheless consistent with reports that extensive disease and bowel resection are accompanied by longer operating times and greater blood loss [7,8]. Specialist-center cohorts also show that morbidity varies with operative complexity [9]. We report a frequently observed, explicitly defined laboratory outcome that complements that clinical picture.
4.3. Clinical Implications
Preoperative anemia and operative extent inform different steps in care. A lower preoperative hemoglobin increases the clinical impact of any given decline because the postoperative concentration will also be lower. Among patients with an available preoperative measurement, 9.8% had hemoglobin below 12 g/dL. These patients warrant evaluation for the cause of the anemia and treatment when indicated.
Surgery duration and operative extent may help identify patients likely to experience a greater decline. The directly recorded surgical features—not the post hoc composite strata—provide the most transparent basis for future work. Their potential use in prioritizing postoperative monitoring requires prospective evaluation before they can define a clinical rule.
The lowest recorded postoperative hemoglobin value was on days 2–3 in 57.5% of the 421 patients with a postoperative measurement. Because day-specific measurement completeness and within-patient day-1-versus-later comparisons were not available, this distribution may reflect both postoperative trajectory and surveillance intensity. It should not be interpreted as evidence that routine testing on days 2–3 is superior to testing on day 1.
4.4. Interpretation of the Analyses Excluding Preoperative Hemoglobin
A fixed decline threshold is more readily crossed when preoperative hemoglobin is higher, because the preoperative value is part of the calculation [16,17]. This mathematical relationship helps explain why preoperative hemoglobin improved model performance and why its odds ratio should not be interpreted as a purely biological effect. Importantly, longer duration remained associated with both the binary outcome and continuous decline when preoperative hemoglobin was removed. Adding the surgical variables to the model containing preoperative hemoglobin improved discrimination. However, the surgical-variable model did not clearly outperform preoperative hemoglobin alone (difference in AUC, 0.011; 95% CI, −0.060 to 0.092).
4.5. Added Value and Future Research
Previous publications from our center focused on organ-specific technique or postoperative complications. This analysis addresses a distinct PBM question across the full cohort. It quantifies a perioperative hemoglobin outcome and shows that the duration association persisted when preoperative hemoglobin was omitted. Exploratory measures of operative extent showed gradients that require external validation.
Future studies should prospectively record measured blood loss, fluid balance, the cause and treatment of preoperative anemia, and transfusion timing, and should apply a standardized postoperative sampling schedule. External validation should then test whether the operative-burden strata improve monitoring decisions and whether continuous decline or a clinically validated threshold is the better endpoint.
4.6. Strengths and Limitations
The study included consecutive eligible index surgeries, used clearly defined measurement windows, and captured both hemoglobin measurements in 98.1% of patients. After preliminary feasibility work, we fixed the primary model before the final analysis. The duration estimates were consistent across several approaches to the remaining missing measurements. All analyses were performed in a scripted R workflow.
The retrospective, single-center design precludes control of variation in perioperative care and limits the applicability of the estimates to other settings. Rectosigmoid procedures were performed in 90.3% of patients, and the median hospital stay was 8 days; both features may differ in other centers. Surgeon and team effects, ASA class, comorbidities, and anticoagulant exposure were not available for adjustment. Surgery duration should therefore be interpreted as a marker of operative complexity rather than a modifiable causal exposure. The cohort also overlaps with those of previous publications from our center and should be regarded as an extension rather than an independent validation cohort. Surgery duration was designated the principal exposure only after preliminary feasibility work; internal validation cannot account for that data-driven choice.
Quantitative measurements of blood loss and perioperative fluid volumes were not available, so bleeding could not be separated from hemodilution. Ferritin, transferrin saturation, and other measures of iron status were also unavailable; the cause of preoperative anemia could not be determined. Standardized fields for intravenous iron, tranexamic acid, and cell salvage were absent, precluding evaluation of these PBM measures. Transfusion status combined two discordant structured sources and was not clinically adjudicated; its timing relative to the recorded postoperative nadir was unavailable.
Eight patients lacked one or both hemoglobin measurements, and the missing-data analyses had little effect on the estimates. The missingness mechanism nevertheless cannot be established. Patients meeting the primary outcome had more postoperative measurements than those without it (mean, 3.07 vs. 2.64), which may have increased the chance of observing a lower value and created surveillance bias in this nadir-based outcome. Day-specific measurement availability was not reconstructed, and the timing of the lowest recorded value was described for the cohort as a whole rather than according to surgical extent. The observed distribution therefore cannot establish whether hemoglobin declined after day 1. Moreover, the lowest recorded value was on day 3 in 28.3% of patients, so a later true nadir may have been missed.
The 3-g/dL threshold is not a validated minimum clinically important difference. Resection multiplicity was unavailable for 37 patients with both hemoglobin measurements, and the surgical-extent analyses involved several exploratory comparisons without adjustment for multiple testing. Presentation of the post hoc operative-burden strata depended on minimum group sizes and monotonic outcome gradients. A blank multiplicity field was treated as no recorded multiple resection for those strata and could prevent, but not create, high-burden assignment. These choices may have led to under-assignment of surgeries to the high-burden group and limit the evidential weight of the gradient; the strata require external validation. Finally, the narrow observed ranges of APTT and INR limit the hemostasis analysis; its findings do not apply to patients with clinically important coagulopathy.
5. Conclusions
Longer surgery duration was associated with greater perioperative hemoglobin decline after surgery for deep endometriosis. Exploratory analyses also showed gradients across bowel-resection multiplicity and the number of organs involved, but these findings do not define a monitoring or prediction rule. These routinely available features warrant prospective evaluation as possible monitoring indicators, while lower preoperative hemoglobin indicates less reserve after a similar decline. The optimal timing of postoperative hemoglobin measurement cannot be determined from these retrospective data and should be evaluated prospectively with a standardized sampling schedule.
Supplementary Materials
The following supporting information can be downloaded at the website of this paper posted on Preprints.org. Supplementary Methods provide full specifications for resampling, missing data, and exploratory analyses. Table S1 reports sensitivity analyses; Table S2, surgical-group profiles and additional model information; Table S3, component-level missingness, multiple imputation, and missing-not-at-random analyses; Table S4, complete coefficient sets for the binary and continuous duration models; and Table S5, post hoc operative-burden and preoperative hemostatic-marker analyses.
Author Contributions
Conceptualization, K.N.; methodology, K.N.; formal analysis, K.N.; investigation, K.N., M.M. and W.O.; data curation, K.N., M.M. and W.O.; project administration, K.N.; visualization, K.N.; writing—original draft preparation, K.N.; writing—review and editing, K.N., M.M. and W.O. All authors have read and agreed to the published version of the manuscript.
Funding
This research received no external funding. The article processing charge will be funded by the University of Opole.
Institutional Review Board Statement
The study was conducted in accordance with the Declaration of Helsinki and approved by the Bioethics Committee of the University of Opole (decision No. UO/0029/KB/2026; 25 June 2026).
Informed Consent Statement
The requirement for individual informed consent was waived because of the retrospective study design.
Data Availability Statement
Patient-level data are not publicly available because of privacy and institutional governance restrictions. Aggregate data and analytical code may be made available by the corresponding author upon reasonable request, subject to institutional approval.
Acknowledgments
During preparation of this manuscript, the authors used OpenAI Codex (GPT-5, OpenAI; accessed July–August 2026) and Anthropic Claude (project-recorded models claude-fable-5, claude-opus-4-8, and claude-opus-5; Anthropic; accessed July 2026). Their use is described in Section 2.7. The authors reviewed and edited all outputs and take full responsibility for the content of this publication.
Conflicts of Interest
The authors declare no conflicts of interest.
Abbreviations
| APTT | activated partial thromboplastin time |
| AUC | area under the receiver operating characteristic curve |
| BMI | body mass index |
| CI | confidence interval |
| Hb | hemoglobin |
| HC3 | heteroskedasticity-consistent covariance estimator |
| INR | international normalized ratio |
| IPW | inverse-probability weighting |
| IQR | interquartile range |
| MAR | missing at random |
| MNAR | missing not at random |
| OR | odds ratio |
| PBM | patient blood management |
| RBC | red blood cell |
| R² | coefficient of determination |
References
- Mueller, M.M.; Van Remoortel, H.; Meybohm, P.; Aranko, K.; Aubron, C.; Burger, R.; Carson, J.L.; Cichutek, K.; De Buck, E.; Devine, D.; et al. Patient Blood Management: Recommendations From the 2018 Frankfurt Consensus Conference. JAMA 2019, 321, 983–997. [Google Scholar] [CrossRef]
- Shander, A.; Corwin, H.L.; Meier, J.; Auerbach, M.; Bisbe, E.; Blitz, J.; Erhard, J.; Faraoni, D.; Farmer, S.L.; Frank, S.M.; et al. Recommendations From the International Consensus Conference on Anemia Management in Surgical Patients (ICCAMS). Ann. Surg. 2023, 277, 581–590. [Google Scholar] [CrossRef]
- Abeysiri, S.; Chau, M.; Richards, T. Perioperative Anemia Management. Semin Thromb. Hemost. 2020, 46, 8–16. [Google Scholar] [CrossRef]
- Becker, C.M.; Bokor, A.; Heikinheimo, O.; Horne, A.; Jansen, F.; Kiesel, L.; King, K.; Kvaskoff, M.; Nap, A.; Petersen, K.; et al. ESHRE Guideline: Endometriosis. Hum. Reprod. Open 2022, 2022, hoac009. [Google Scholar] [CrossRef]
- Working group of ESGE; ESHRE; and WES; Keckstein, J.; Becker, C.M.; Canis, M.; Feki, A.; Grimbizis, G.F.; Hummelshoj, L.; Nisolle, M.; Roman, H.; Saridogan, E.; et al. Recommendations for the Surgical Treatment of Endometriosis. Part 2: Deep Endometriosis. Hum. Reprod. Open 2020, 2020, hoaa002. [Google Scholar] [CrossRef]
- Ugwumadu, L.; Chakrabarti, R.; Williams-Brown, E.; Rendle, J.; Swift, I.; John, B.; Allen-Coward, H.; Ofuasia, E. The Role of the Multidisciplinary Team in the Management of Deep Infiltrating Endometriosis. Gynecol. Surg. 2017, 14, 15. [Google Scholar] [CrossRef]
- Härmä, K.; Binda, A.; Ith, M.; Poellinger, A.; Siegenthaler, F.; Heverhagen, J.; Imboden, S.; Mueller, M. Cloverleaf Sign in Pelvic Magnetic Resonance Imaging for Deep Infiltrating Endometriosis: Association With Longer Operation Times, Greater Blood Loss, and Higher Rates of Bowel Resection. Invest Radiol. 2020, 55, 53–59. [Google Scholar] [CrossRef]
- Pavone, M.; Baroni, A.; Campolo, F.; Goglia, M.; Raimondo, D.; Carcagnì, A.; Akladios, C.; Marescaux, J.; Fanfani, F.; Scambia, G.; et al. Robotic Assisted Versus Laparoscopic Surgery for Deep Endometriosis: A Meta-Analysis of Current Evidence. J. Robot Surg. 2024, 18, 212. [Google Scholar] [CrossRef]
- Leborne, P.; Huberlant, S.; Masia, F.; de Tayrac, R.; Letouzey, V.; Allegre, L. Clinical Outcomes Following Surgical Management of Deep Infiltrating Endometriosis. Sci. Rep. 2022, 12, 21800. [Google Scholar] [CrossRef]
- Carson, J.L.; Stanworth, S.J.; Guyatt, G.; Valentine, S.; Dennis, J.; Bakhtary, S.; Cohn, C.S.; Dubon, A.; Grossman, B.J.; Gupta, G.K.; et al. Red Blood Cell Transfusion: 2023 AABB International Guidelines. JAMA 2023, 330, 1892–1902. [Google Scholar] [CrossRef]
- Stanhiser, J.; Chagin, K.; Jelovsek, J.E. A Model to Predict Risk of Blood Transfusion After Gynecologic Surgery. Am. J. Obstet. Gynecol. 2017, 216, 506.e1–506.e14. [Google Scholar] [CrossRef]
- Cao, X.; Liu, X.; Zhang, X.; Zhang, K.; Chen, C.; Yang, Q.; Wang, J.; Li, X.; Wei, L. Risk Factors for Perioperative Blood Transfusion in Patients Undergoing Total Laparoscopic Hysterectomy. BMC Womens Health 2024, 24, 65. [Google Scholar] [CrossRef]
- Pan, Z.; Charoenkwan, K. Prediction Models for Perioperative Blood Transfusion in Patients Undergoing Gynecologic Surgery: A Systematic Review. Diagnostics 2024, 14, 2018. [Google Scholar] [CrossRef]
- von Elm, E.; Altman, D.G.; Egger, M.; Pocock, S.J.; Gøtzsche, P.C.; Vandenbroucke, J.P.; STROBE Initiative. The Strengthening the Reporting of Observational Studies in Epidemiology (STROBE) Statement: Guidelines for Reporting Observational Studies. Ann. Intern Med. 2007, 147, 573–577. [Google Scholar] [CrossRef]
- Benchimol, E.I.; Smeeth, L.; Guttmann, A.; Harron, K.; Moher, D.; Petersen, I.; Sørensen, H.T.; von Elm, E.; Langan, S.M.; RECORD Working Committee. The REporting of Studies Conducted Using Observational Routinely-Collected Health Data (RECORD) Statement. PLoS Med. 2015, 12, e1001885. [Google Scholar] [CrossRef] [PubMed]
- Oldham, P.D. A Note on the Analysis of Repeated Measurements of the Same Subjects. J. Chronic Dis. 1962, 15, 969–977. [Google Scholar] [CrossRef]
- Tu, Y.K.; Gilthorpe, M.S. Revisiting the Relation Between Change and Initial Value: A Review and Evaluation. Stat. Med. 2007, 26, 443–457. [Google Scholar] [CrossRef]
- Steyerberg, E.W.; Harrell, F.E., Jr.; Borsboom, G.J.; Eijkemans, M.J.; Vergouwe, Y.; Habbema, J.D. Internal Validation of Predictive Models: Efficiency of Some Procedures for Logistic Regression Analysis. J. Clin. Epidemiol. 2001, 54, 774–781. [Google Scholar] [CrossRef] [PubMed]
- Van Calster, B.; McLernon, D.J.; van Smeden, M.; Wynants, L.; Steyerberg, E.W. Topic Group 'Evaluating Diagnostic Tests and Prediction Models' of the STRATOS Initiative. Calibration: The Achilles Heel of Predictive Analytics. BMC Med. 2019, 17, 230. [Google Scholar] [CrossRef] [PubMed]
- Austin, P.C. Balance Diagnostics for Comparing the Distribution of Baseline Covariates Between Treatment Groups in Propensity-Score Matched Samples. Stat. Med. 2009, 28, 3083–3107. [Google Scholar] [CrossRef] [PubMed]
- Seaman, S.R.; White, I.R. Review of Inverse Probability Weighting for Dealing With Missing Data. Stat. Methods Med. Res. 2013, 22, 278–295. [Google Scholar] [CrossRef]
- White, I.R.; Royston, P.; Wood, A.M. Multiple Imputation Using Chained Equations: Issues and Guidance for Practice. Stat. Med. 2011, 30, 377–399. [Google Scholar] [CrossRef]
- Lee, K.J.; Tilling, K.M.; Cornish, R.P.; Little, R.J.A.; Bell, M.L.; Goetghebeur, E.; Hogan, J.W.; Carpenter, J.R.; STRATOS Initiative. Framework for the Treatment and Reporting of Missing Data in Observational Studies: The TARMOS Framework. J. Clin. Epidemiol. 2021, 134, 79–88. [Google Scholar] [CrossRef] [PubMed]
- Collins, G.S.; Reitsma, J.B.; Altman, D.G.; Moons, K.G. Transparent Reporting of a Multivariable Prediction Model for Individual Prognosis or Diagnosis (TRIPOD): The TRIPOD Statement. Ann. Intern Med. 2015, 162, 55–63. [Google Scholar] [CrossRef]
- Wolff, R.F.; Moons, K.G.M.; Riley, R.D.; Whiting, P.F.; Westwood, M.; Collins, G.S.; Reitsma, J.B.; Kleijnen, J.; Mallett, S.; PROBAST Group. PROBAST: A Tool to Assess the Risk of Bias and Applicability of Prediction Model Studies. Ann. Intern Med. 2019, 170, 51–58. [Google Scholar] [CrossRef]
- Mrugała, M.; Fiutowski, M.; Dąbrowska, A.; Nowak, K.; Milnerowicz-Nabzdyk, E. Bladder Endometriosis as Part of Complex Pelvic Deep Endometriosis: Surgical Challenges and Outcomes in a Reference Center. J. Clin. Med. 2026, 15, 1995. [Google Scholar] [CrossRef]
- Milnerowicz-Nabzdyk, E.; Nowak, K.; Ogonowska, W.; Mrugała, M.; Sachanbinski, T. Modified Segmental Bowel Resection Technique in Deep Infiltrating Endometriosis. Is It a Suitable Method to Reduce the Risk of Bowel Leakage After an Extensive Complex Surgery? Ginekol. Pol. 2023, 94, 698–703. [Google Scholar] [CrossRef]
- Nowak, K.; Dąbrowska, A.; Mrugała, M.; Milnerowicz-Nabzdyk, E. Surgically Relative Risk Factors for Lower Colorectal Anastomotic Dehiscence and Rectovaginal Fistulas in Complex Deep Endometriosis Cases: A Single-Center Retrospective-Prospective Cohort Study. J. Clin. Med. 2026, 15, 2630. [Google Scholar] [CrossRef]
- Gerdessen, L.; Meybohm, P.; Choorapoikayil, S.; Herrmann, E.; Taeuber, I.; Neef, V.; Raimann, F.J.; Zacharowski, K.; Piekarski, F. Comparison of Common Perioperative Blood Loss Estimation Techniques: A Systematic Review and Meta-Analysis. J. Clin. Monit. Comput 2021, 35, 245–258. [Google Scholar] [CrossRef]
- Quispe-Cornejo, A.A.; Alves da Cunha, A.L.; Njimi, H.; Mongkolpun, W.; Valle-Martins, A.L.; Arébalo-López, M.; Creteur, J.; Vincent, J.L. Effects of Rapid Fluid Infusion on Hemoglobin Concentration: A Systematic Review and Meta-Analysis. Crit. Care 2022, 26, 324. [Google Scholar] [CrossRef]
Figure 1.
Study cohort. The diagram shows the number of eligible surgeries, exclusion of repeat surgeries, selection of one index surgery per patient, and availability of both preoperative and postoperative hemoglobin measurements. The final boxes give the number of patients with and without a hemoglobin decline of at least 3 g/dL.
Figure 1.
Study cohort. The diagram shows the number of eligible surgeries, exclusion of repeat surgeries, selection of one index surgery per patient, and availability of both preoperative and postoperative hemoglobin measurements. The final boxes give the number of patients with and without a hemoglobin decline of at least 3 g/dL.
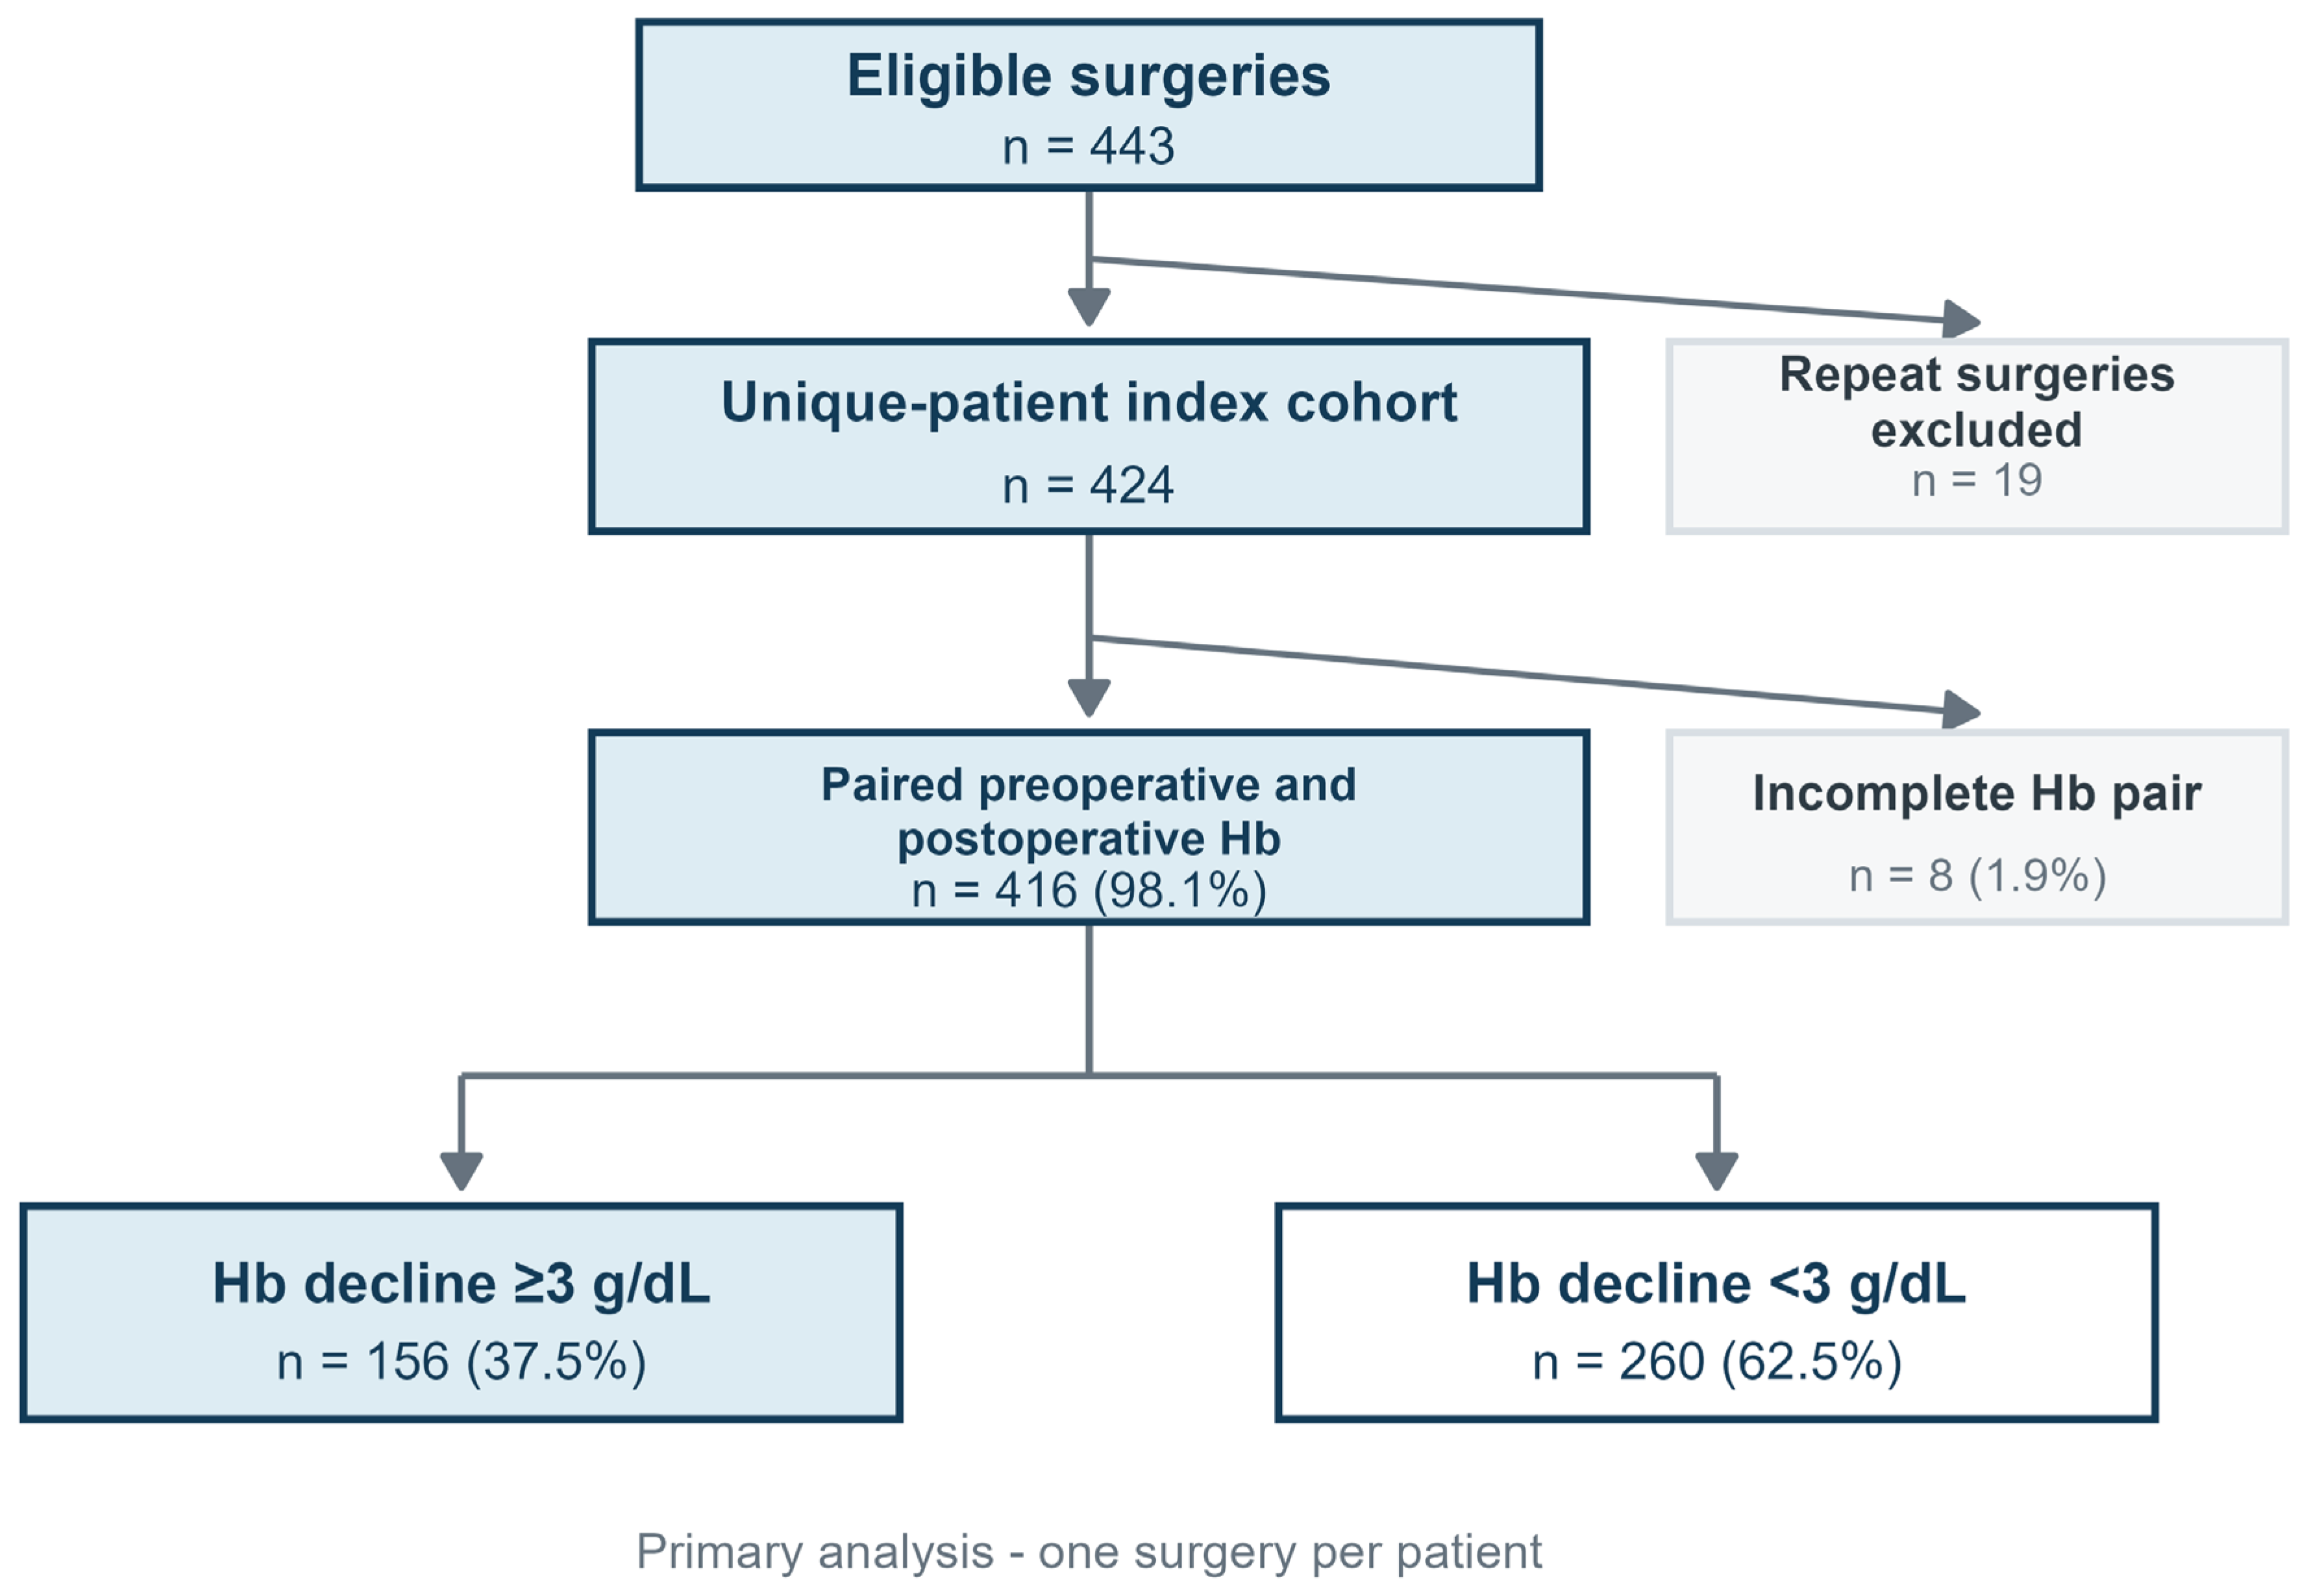
Figure 2.
Adjusted probability of a hemoglobin decline of at least 3 g/dL according to surgery duration. The line shows estimates from the primary multivariable model for a preoperative hemoglobin concentration of 13.3 g/dL, involvement of two organs, and no upper-bowel or bladder procedure. The shaded area is the pointwise 95% confidence interval. For legibility, the display is limited to 60–445 minutes, a range that includes the surgery durations of 404/416 patients (97.1%); all 416 patients, including the 12 with durations beyond the displayed range, were retained in model estimation. The lower panel shows the distribution of surgery duration within the displayed range.
Figure 2.
Adjusted probability of a hemoglobin decline of at least 3 g/dL according to surgery duration. The line shows estimates from the primary multivariable model for a preoperative hemoglobin concentration of 13.3 g/dL, involvement of two organs, and no upper-bowel or bladder procedure. The shaded area is the pointwise 95% confidence interval. For legibility, the display is limited to 60–445 minutes, a range that includes the surgery durations of 404/416 patients (97.1%); all 416 patients, including the 12 with durations beyond the displayed range, were retained in model estimation. The lower panel shows the distribution of surgery duration within the displayed range.
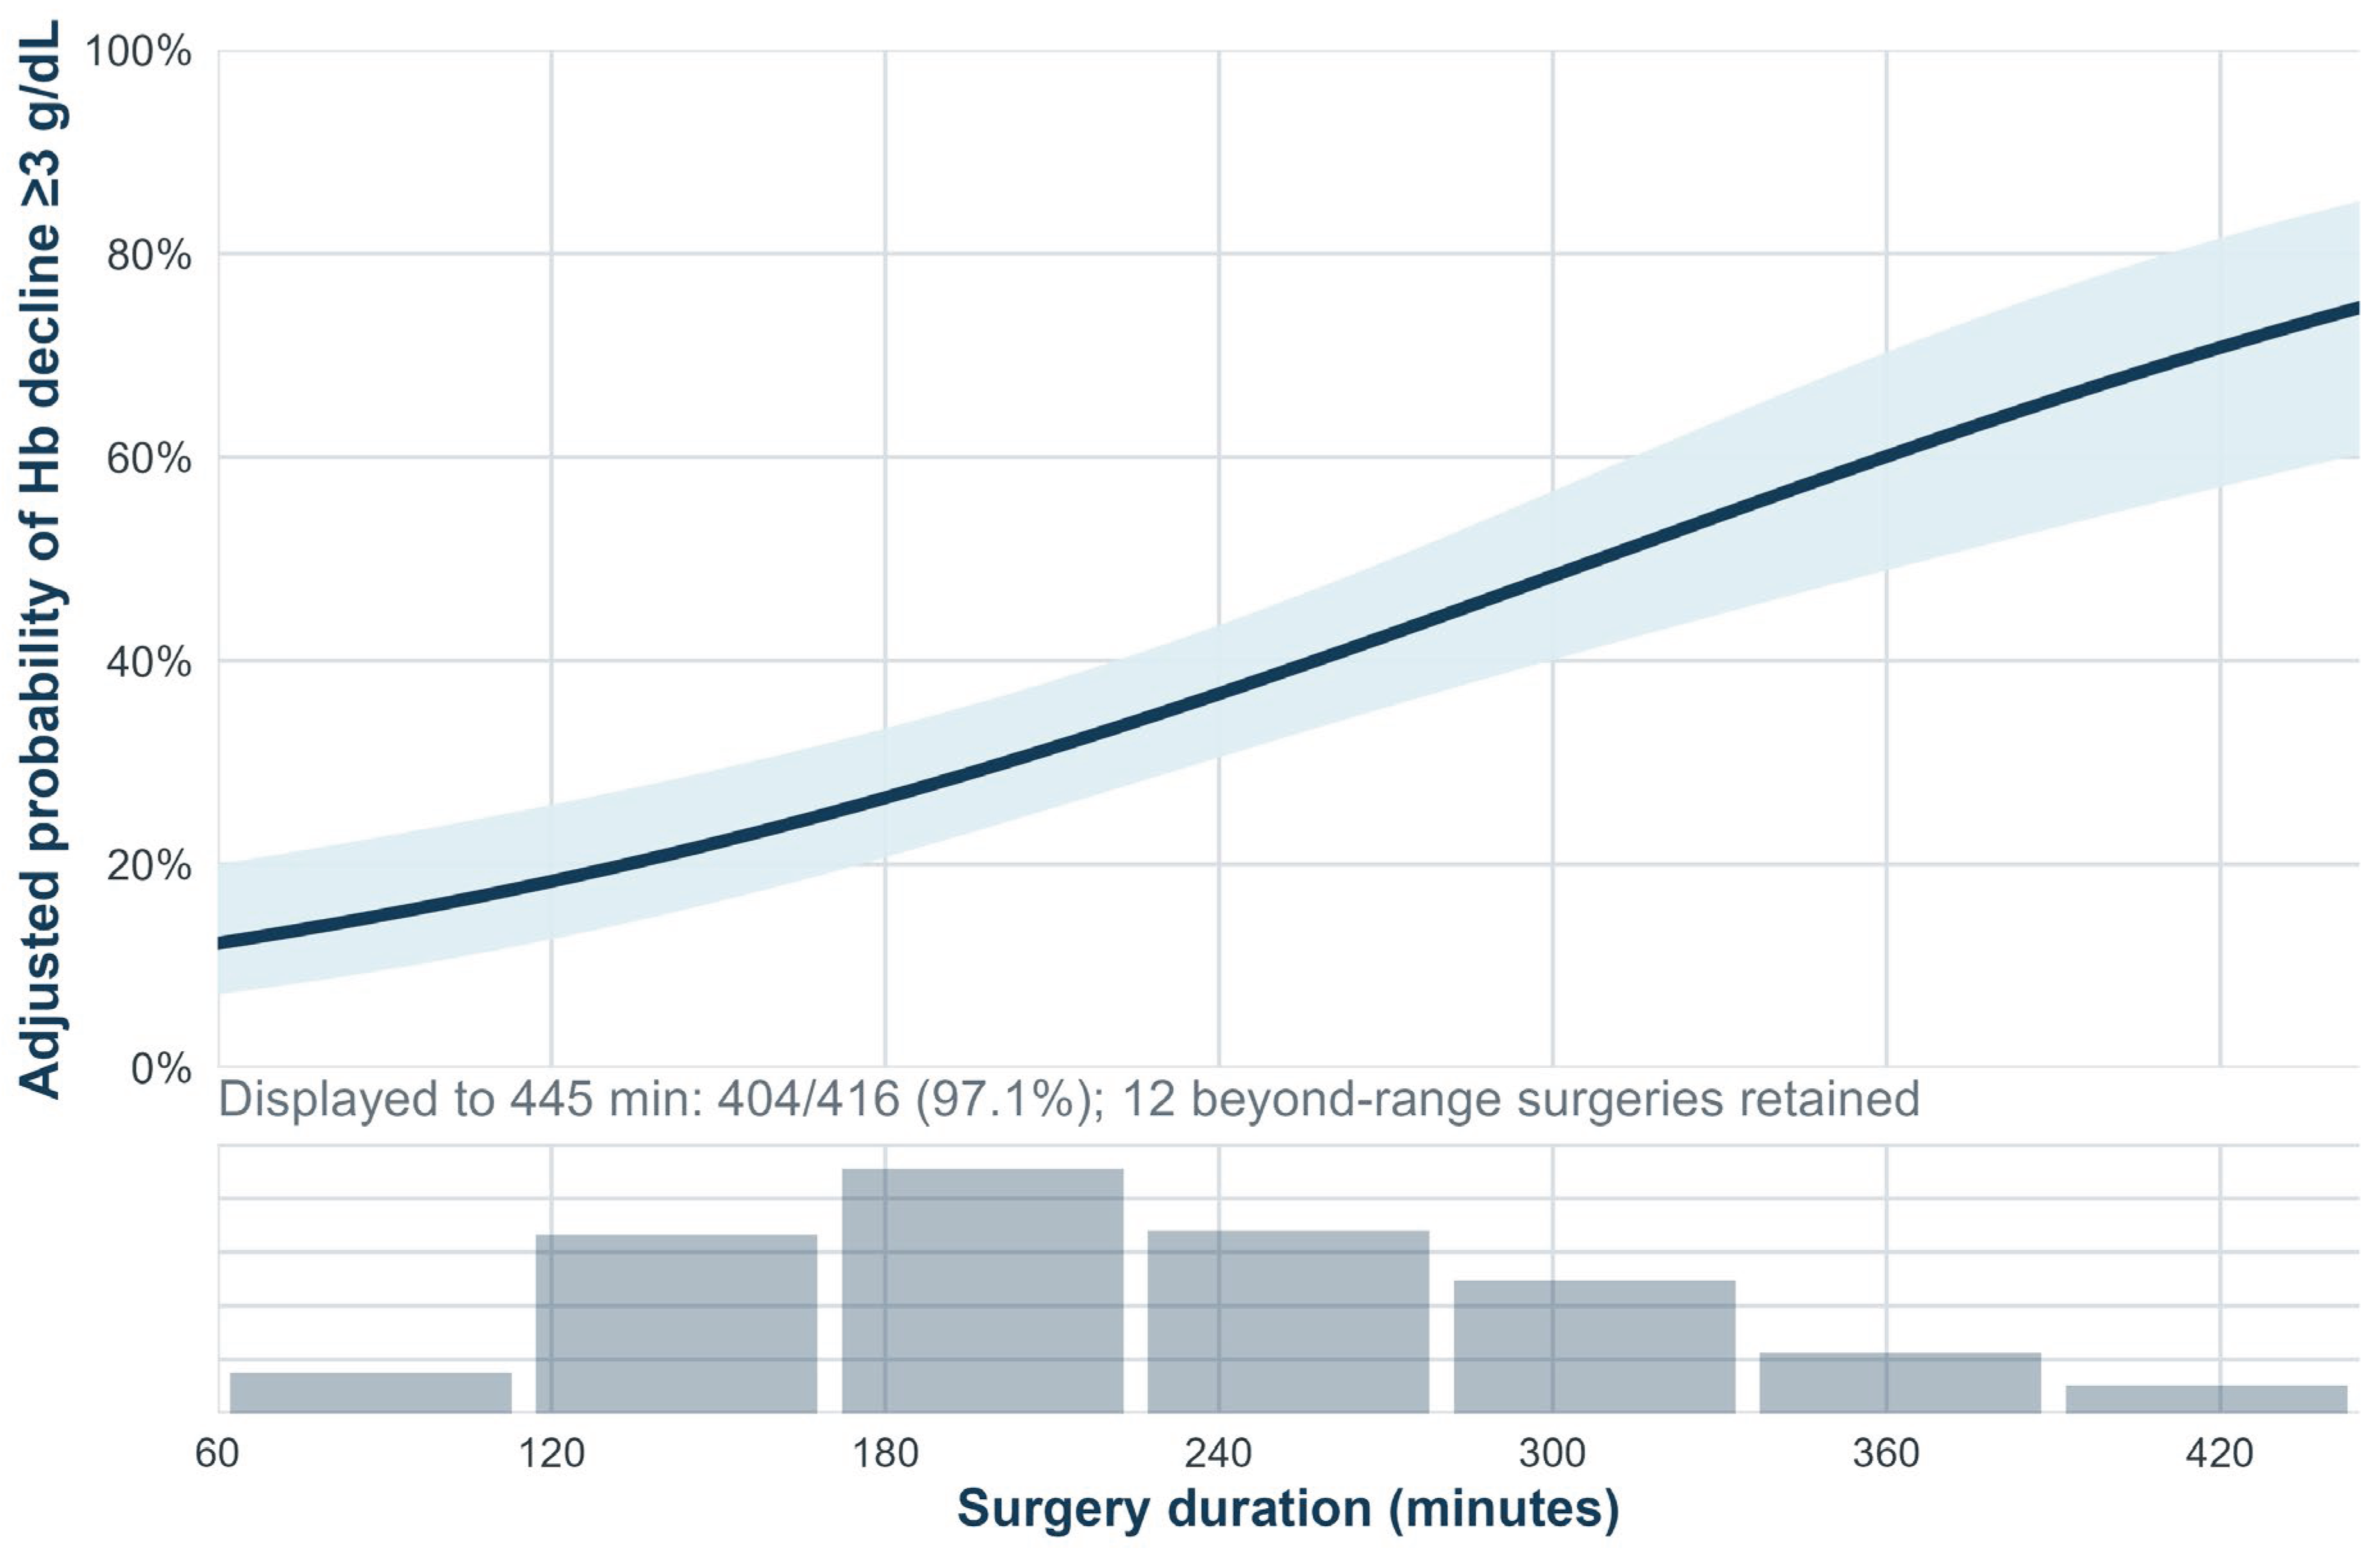
Figure 3.
Associations of the type and extent of surgery with continuous hemoglobin decline. Circles show adjusted mean differences, and horizontal bars show 95% confidence intervals. Models were adjusted for preoperative hemoglobin and surgery duration. Reference groups were no full-thickness rectosigmoid resection, including shaving-only procedures; no full-thickness bowel resection; and surgery involving one or fewer organs, matching the labels shown in the figure. The analysis included 416 patients for bowel technique and for the number of organs involved, 379 for resection multiplicity, and 240 for anastomotic height. Anastomotic height was analyzed per 5-cm increase.
Figure 3.
Associations of the type and extent of surgery with continuous hemoglobin decline. Circles show adjusted mean differences, and horizontal bars show 95% confidence intervals. Models were adjusted for preoperative hemoglobin and surgery duration. Reference groups were no full-thickness rectosigmoid resection, including shaving-only procedures; no full-thickness bowel resection; and surgery involving one or fewer organs, matching the labels shown in the figure. The analysis included 416 patients for bowel technique and for the number of organs involved, 379 for resection multiplicity, and 240 for anastomotic height. Anastomotic height was analyzed per 5-cm increase.
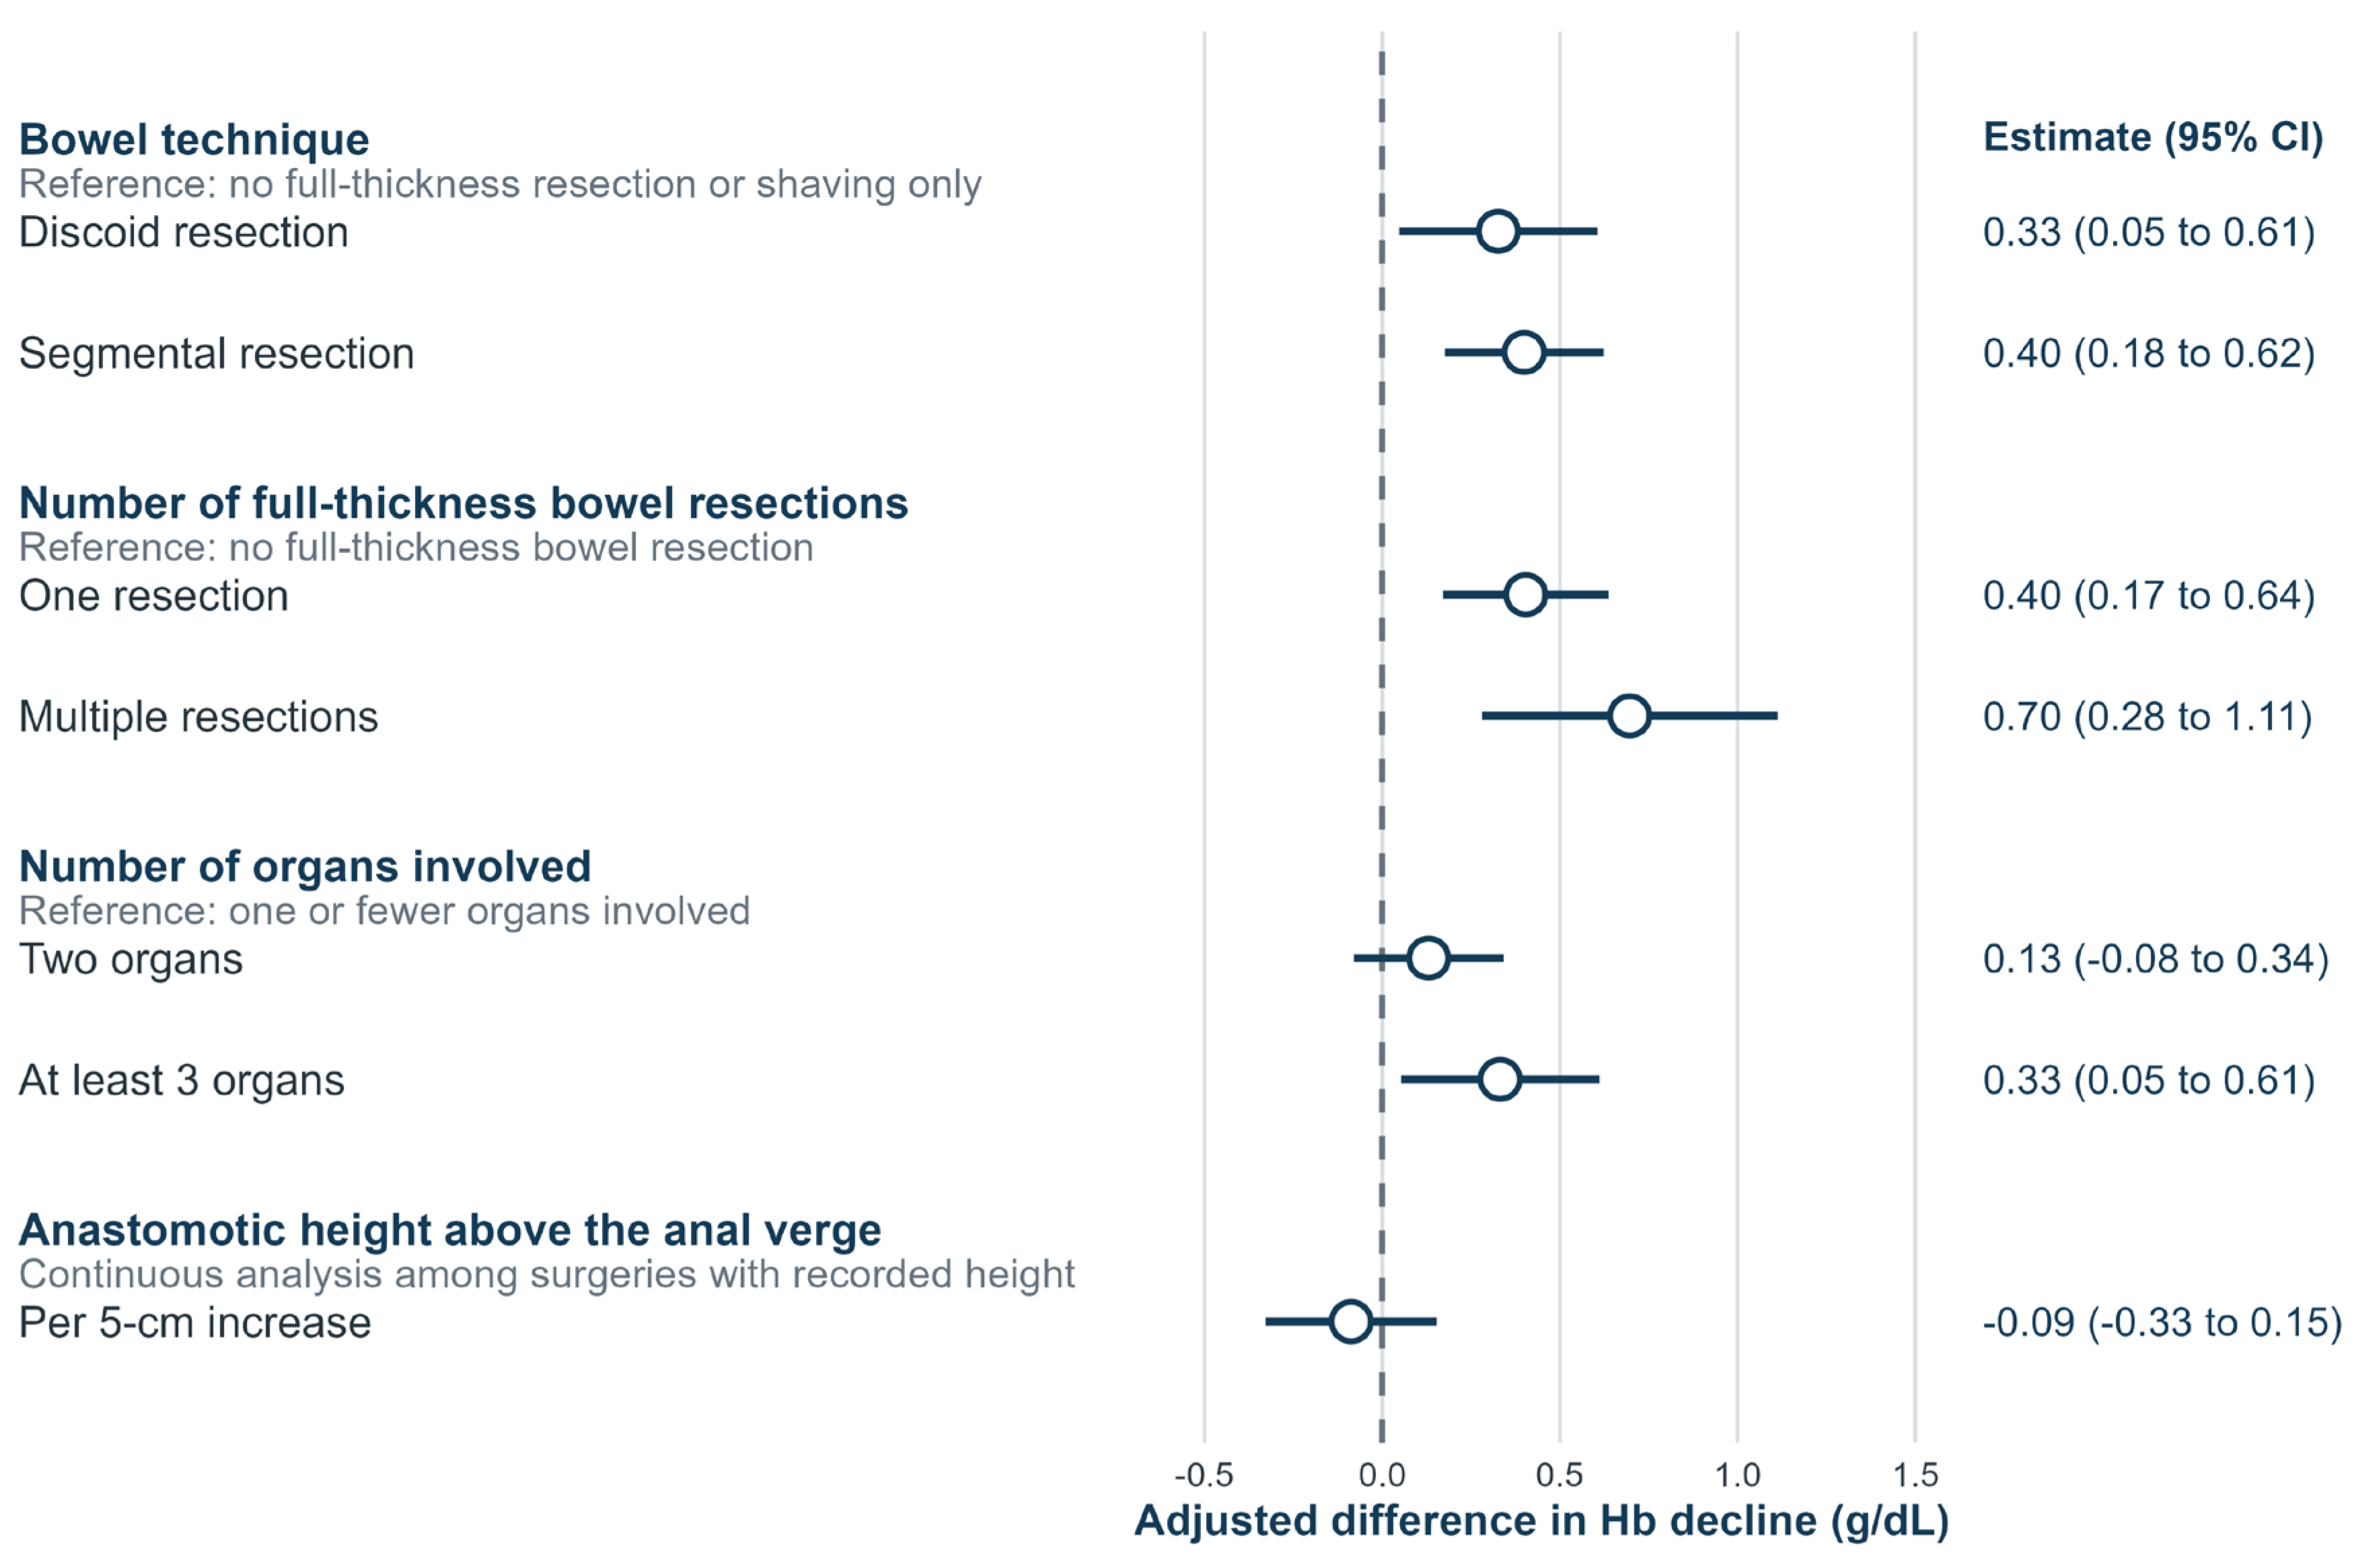
Figure 4.
Agreement between predicted and observed proportions for the model including preoperative hemoglobin and surgical variables. Patients were divided into deciles of predicted risk. Circles show observed proportions, vertical bars show Wilson 95% confidence intervals, and the diagonal represents ideal agreement. The lower panel shows the predicted-risk distribution in the 416 patients with both preoperative and postoperative hemoglobin measurements.
Figure 4.
Agreement between predicted and observed proportions for the model including preoperative hemoglobin and surgical variables. Patients were divided into deciles of predicted risk. Circles show observed proportions, vertical bars show Wilson 95% confidence intervals, and the diagonal represents ideal agreement. The lower panel shows the predicted-risk distribution in the 416 patients with both preoperative and postoperative hemoglobin measurements.
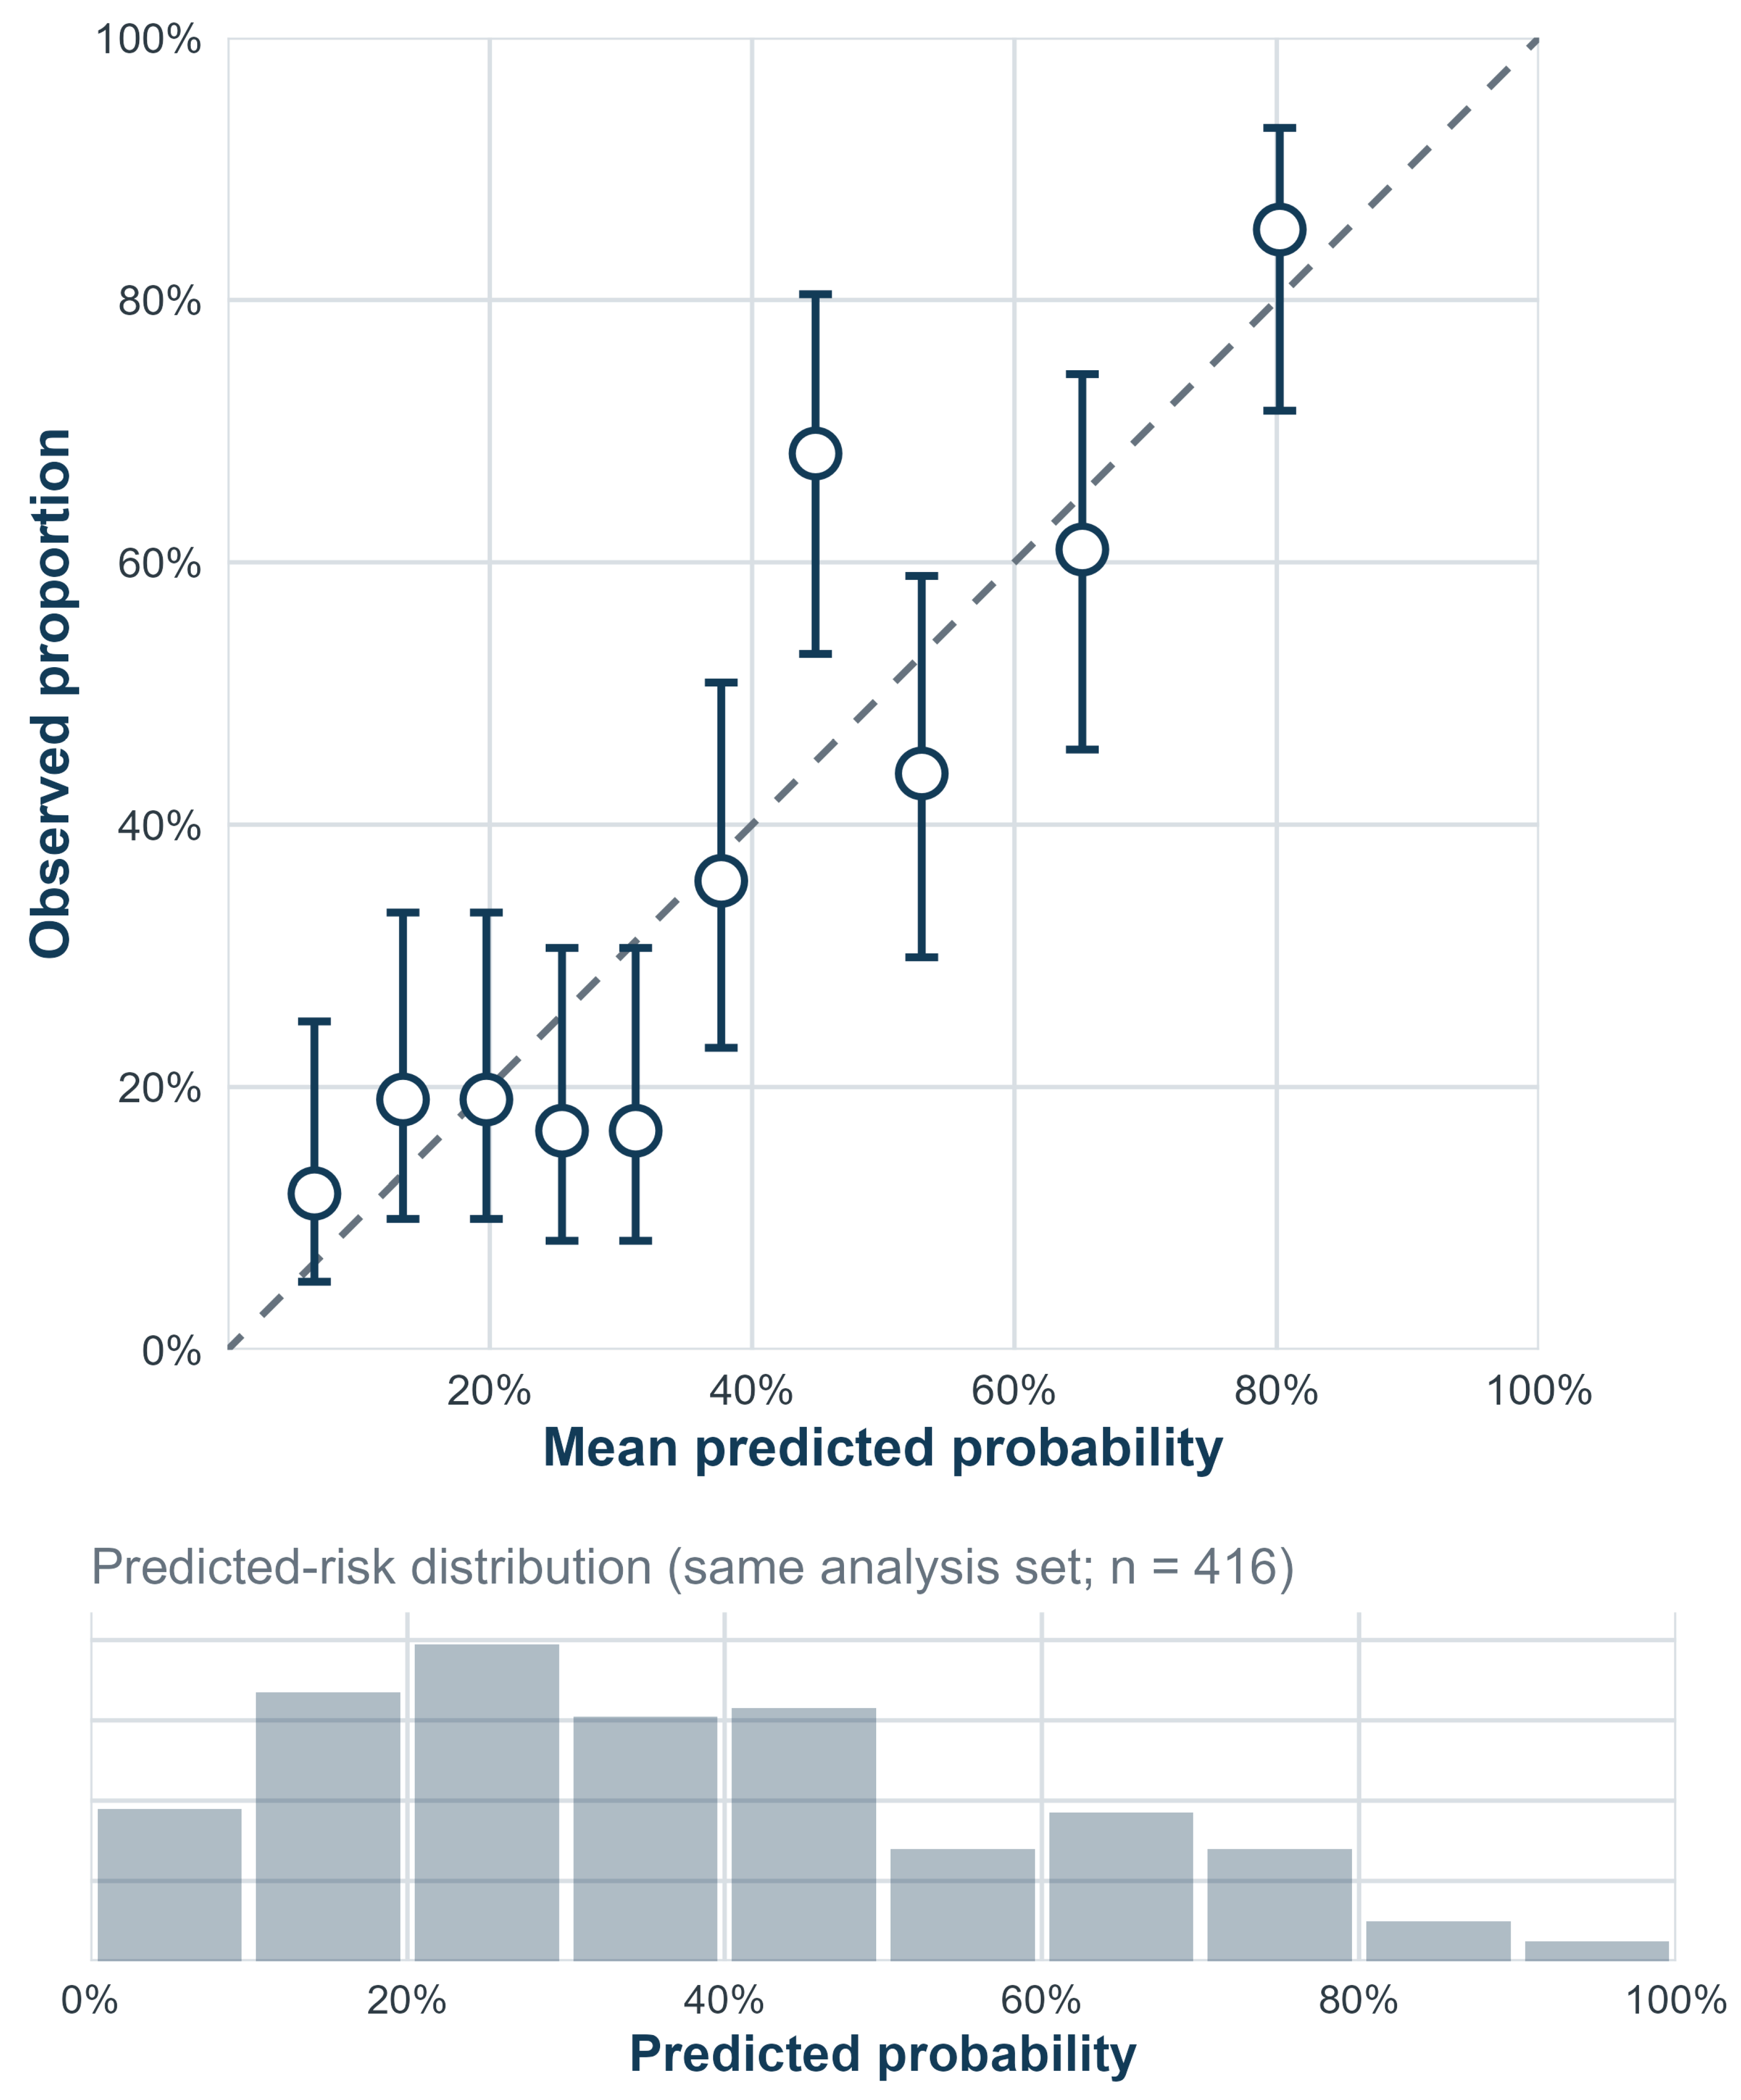

Table 1.
Patient and operative characteristics.
| Characteristic | Full cohort (N = 424) | Both hemoglobin measurements available (n = 416) |
| Continuous characteristics, median (IQR) | — | — |
| Age at surgery, years | 38.3 (33.6–42.3) | 38.3 (33.5–42.2) |
| Surgery duration, min | 218 (170–286) | 220 (170–286) |
| Length of hospital stay, days | 8 (8–9) | 8 (8–9) |
| Body weight, kg | 62.0 (56.0–70.0) [n = 381] | 62.0 (56.0–70.0) [n = 374] |
| Height, cm | 165 (161–168) [n = 379] | 165 (161–168) [n = 372] |
| BMI, kg/m² | 22.9 (20.9–25.5) [n = 402] | 22.9 (20.9–25.5) [n = 395] |
| Clinical and operative characteristics, n/N (%) | — | — |
| Preoperative Hb <12 g/dL | 41/419 (9.8%) | 41/416 (9.9%) |
| Organs involved: ≤1 | 111/424 (26.2%) | 108/416 (26.0%) |
| Organs involved: 2 | 205/424 (48.3%) | 204/416 (49.0%) |
| Organs involved: ≥3 | 108/424 (25.5%) | 104/416 (25.0%) |
| Upper-bowel procedure | 57/424 (13.4%) | 56/416 (13.5%) |
| Bladder procedure | 82/424 (19.3%) | 79/416 (19.0%) |
| Rectosigmoid procedure | 383/424 (90.3%) | 376/416 (90.4%) |
| Uterine procedure | 273/424 (64.4%) | 267/416 (64.2%) |
| Ureteral procedure | 63/424 (14.9%) | 63/416 (15.1%) |
| Conversion to laparotomy | 11/424 (2.6%) | 11/416 (2.6%) |
Values are median (IQR) or n/N (%). A bracketed n denotes the number of available observations for anthropometric variables. Eight patients lacked one or both hemoglobin measurements; because this group is too small to describe by individual characteristics, it is summarized in Table S3 according to which hemoglobin component was available. No between-group hypothesis tests were performed. Hb, hemoglobin; IQR, interquartile range; BMI, body mass index.
Table 2.
Perioperative hemoglobin and transfusion outcomes.
| Outcome | Estimate | 95% CI |
| Primary outcome | — | — |
| Hb decline ≥3 g/dL | 156/416 (37.5%) | 32.8–42.3% |
| Secondary hemoglobin outcomes | — | — |
| Continuous Hb decline, g/dL | 2.6 (2.0–3.3) | — |
| Hb decline ≥4 g/dL | 42/416 (10.1%) | 7.4–13.4% |
| Recorded postoperative nadir <9 g/dL | 42/421 (10.0%) | 7.3–13.2% |
| Recorded postoperative nadir <8 g/dL | 8/421 (1.9%) | 0.8–3.7% |
| Transfusion outcome | — | — |
| Red blood cell (RBC) transfusion during the index hospitalization | 42/424 (9.9%) | 7.2–13.2% |
| Hb decline ≥3 g/dL among transfused patients with both hemoglobin measurements | 29/42 (69.0%) | 52.9–82.4% |
Values are n/N (%) unless otherwise stated. Exact (Clopper–Pearson) 95% confidence intervals are shown for proportions; continuous Hb decline is summarized as median (IQR). Hb, hemoglobin; IQR, interquartile range; CI, confidence interval; RBC, red blood cell.
Table 3.
Surgery duration and model performance with and without preoperative hemoglobin.
| Panel A. Duration association across binary and continuous outcomes | ||||
| Outcome and model | Patients, n | Duration estimate per 60 min (95% CI) | p value | |
| Hb decline ≥3 g/dL, primary model | 416 | OR 1.61 (1.35 to 1.91) | <0.001 | |
| Hb decline ≥3 g/dL, model without preoperative Hb | 416 | OR 1.50 (1.28 to 1.76) | <0.001 | |
| Continuous Hb decline, model with preoperative Hb | 416 | 0.20 (0.13 to 0.26) g/dL | <0.001 | |
| Continuous Hb decline, model without preoperative Hb | 416 | 0.20 (0.12 to 0.27) g/dL | <0.001 | |
| Recorded postoperative Hb nadir, adjusted for preoperative Hb, organ count, upper-bowel surgery, and bladder surgery | 416 | −0.20 (−0.26 to −0.13) g/dL | <0.001 | |
| Panel B. Apparent and internally validated model performance | ||||
| Model | Apparent AUC | Internally validated AUC | Apparent Brier score | Internally validated Brier score |
| Preoperative Hb only | 0.684 | 0.684 | 0.211 | 0.214 |
| Surgical variables without preoperative Hb | 0.696 | 0.684 | 0.212 | 0.217 |
| Preoperative Hb plus surgical variables | 0.770 | 0.760 | 0.182 | 0.188 |
| Panel C. Bootstrap differences in apparent AUC | ||||
| Contrast | Δ AUC (95% bootstrap CI) | |||
| Preoperative Hb added to the surgical-variable model | 0.074 (0.031 to 0.125) | |||
| Surgical variables added to the preoperative-Hb model | 0.085 (0.054 to 0.131) | |||
| Surgical-variable model versus preoperative Hb alone | 0.011 (−0.060 to 0.092) | |||
Table 4.
Exploratory associations of the type and extent of surgery with hemoglobin decline.
| Contrast | Patients, n | Adjusted mean difference in Hb decline, g/dL (95% CI) | Adjusted OR for Hb decline ≥3 g/dL (95% CI) |
| Bowel technique (reference: no full-thickness rectosigmoid resection, including shaving-only procedures) | — | — | — |
| Discoid resection | 416 | 0.33 (0.05 to 0.61) | 1.66 (0.73 to 3.74) |
| Segmental resection | 416 | 0.40 (0.18 to 0.62) | 2.06 (1.06 to 4.00) |
| Number of full-thickness bowel resections (reference: no resection) | — | — | — |
| One resection | 379 | 0.40 (0.17 to 0.64) | 2.61 (1.13 to 6.04) |
| Multiple resections | 379 | 0.70 (0.28 to 1.11) | 3.46 (1.21 to 9.91) |
| Number of organs involved (reference: ≤1 organ) | — | — | — |
| Two organs | 416 | 0.13 (−0.08 to 0.34) | 1.47 (0.83 to 2.58) |
| ≥3 organs | 416 | 0.33 (0.05 to 0.61) | 1.89 (0.94 to 3.79) |
| Anastomotic height above the anal verge | — | — | — |
| Per 5-cm increase | 240 | −0.09 (−0.33 to 0.15) | 0.87 (0.46 to 1.66) |
All models are adjusted for preoperative Hb and surgery duration. Continuous models use HC3 robust standard errors. Reference categories are given in parentheses in the group-heading rows. Bowel technique denotes the rectosigmoid technique group defined in the Methods. Hb, hemoglobin; OR, odds ratio; CI, confidence interval.
Table 5.
Descriptive operative-burden strata and hemoglobin outcomes.
| Operative-burden stratum | Patients, n/N (%) | Hb decline ≥3 g/dL, n/N (%; exact 95% CI) | Hb decline, mean (95% CI), g/dL | Hb decline, median (IQR), g/dL |
| Low burden | 44/416 (10.6%) | 11/44 (25.0%; 13.2–40.3%) | 2.12 (1.80 to 2.45) | 2.0 (1.2–3.0) |
| Intermediate burden | 256/416 (61.5%) | 85/256 (33.2%; 27.5–39.3%) | 2.64 (2.53 to 2.75) | 2.5 (2.0–3.2) |
| High burden | 116/416 (27.9%) | 60/116 (51.7%; 42.3–61.1%) | 3.06 (2.84 to 3.28) | 3.0 (2.2–3.8) |
Disclaimer/Publisher’s Note: The statements, opinions and data contained in all publications are solely those of the individual author(s) and contributor(s) and not of MDPI and/or the editor(s). MDPI and/or the editor(s) disclaim responsibility for any injury to people or property resulting from any ideas, methods, instructions or products referred to in the content. |
© 2026 by the authors. Licensee MDPI, Basel, Switzerland. This article is an open access article distributed under the terms and conditions of the Creative Commons Attribution (CC BY) license (http://creativecommons.org/licenses/by/4.0/).
Copyright: This open access article is published under a Creative Commons CC BY 4.0 license, which permit the free download, distribution, and reuse, provided that the author and preprint are cited in any reuse.