

Submitted:
21 August 2026
Posted:
21 August 2026
You are already at the latest version
Abstract
During dyadic interaction, another person’s unfolding action may proceed successfully as expected, succeed after correction, or ultimately fail, with different implications for how the observer should respond. It remains unclear whether the brain differentiates these action courses while the interaction is still unfolding and whether extensive dyadic motor experience sharpens this differentiation. Here, we recorded EEG from expert table tennis players and novices while they observed three-stroke interactions containing uninterrupted success, corrected success, or unsuccessful action. Experts showed a stronger ERP distinction between corrected success and unsuccessful action than novices. Time-frequency and multivariate analyses further revealed temporally evolving and decodable information about action course, particularly in experts, although expertise-related enhancement was not consistent across measures. Experts were more accurate overall in predicting landing location, but this behavioral advantage did not vary across action courses. These findings show that unfolding action courses can be neurally differentiated during dyadic observation and that extensive motor experience selectively sharpens some of these distinctions. More broadly, neural monitoring during dyadic interaction appears sensitive to how another person’s action develops and to its relevance for how the interaction is likely to continue.
Keywords:
action monitoring
; action observation
; dyadic interaction
; motor expertise
; EEG
1. Introduction
During dyadic interaction, the unfolding action of one person constrains how the other should respond (Müller, 2016; Sacheli et al., 2018). Accordingly, observers need to anticipate not only what the other person is doing, but also whether the ongoing action is likely to succeed and what it implies for the next stage of the interaction. Previous studies have shown that observers continuously use unfolding action information to update predictions about another person’s behavior and its likely consequences (Betti et al., 2022; Monaco et al., 2019; Moreau et al., 2020; Sacheli et al., 2021). An unexpected change in an observed action does not necessarily lead to failure. The actor may correct the movement and still achieve a successful outcome. Thus, an unfolding action may proceed successfully as expected, succeed after correction, or ultimately fail. These different action courses have different implications for how the interaction is likely to continue and for how the observer should respond. A key question, therefore, is whether the brain differentiates these action courses while the observed action is still unfolding.
Among these action courses, corrected success is particularly informative because it shows that an action can deviate from its expected course without ending in failure. The observer may therefore need to monitor not only whether a deviation has occurred, but also what that deviation implies for the likely outcome. Performance-monitoring theories provide a framework for this possibility, proposing that neural monitoring supports both the detection of action errors or deviations and the prediction or evaluation of their consequences (Holroyd & Coles, 2002; Alexander & Brown, 2011). Consistent with this view, medial-frontal electrophysiological responses are sensitive to predictive information about upcoming errors (Krigolson & Holroyd, 2007). Moreover, perturbations occurring during an action and failures to achieve the intended outcome can elicit dissociable electrophysiological responses (Krigolson et al., 2008). Similar monitoring responses are elicited during action observation and are modulated by the goal-related significance of the observed event (de Bruijn & von Rhein, 2012). These findings suggest that neural monitoring may incorporate information about both the occurrence of a deviation and its likely consequences, making corrected success a particularly useful case for examining how neural monitoring reflects these two sources of information.
Existing research on dyadic action and social performance monitoring provides evidence that the neural processing of another person’s action depends on its relevance to the ongoing interaction. Joint-action contexts modulate motor-related activity during action observation, even when the observer is not currently executing a response, suggesting that others’ actions are processed differently when they form part of a shared or coordinated interaction (Bolt & Loehr, 2021). More specifically, observing errors in another person’s action engages medial-frontal performance-monitoring mechanisms, and these responses are influenced by the social and goal-related context in which the action occurs (Maffongelli et al., 2020; Musco et al., 2023; Pyasik et al., 2023). In dyadic motor interaction, prediction errors produced by a partner’s action are accompanied by midfrontal low-frequency activity and coordinated activity within the action-observation network, consistent with the need to predict and adapt to the partner’s unfolding behavior (Maffongelli et al., 2020). These findings suggest that neural responses to another person’s errors depend not only on the occurrence of the error itself, but also on its relevance to the ongoing interaction. However, most previous studies have contrasted correct with erroneous actions or manipulated whether an observed action occurs in a social context. They therefore do not reveal how the brain differentiates corrected success from either uninterrupted success or unsuccessful action while the interaction is still unfolding.
Motor expertise provides an important test of this interaction-based account. In fast dyadic sports such as table tennis, successful performance depends on continuously monitoring an opponent’s unfolding action and using that information to anticipate how the interaction is likely to continue. Extensive practice exposes experts repeatedly to relations among movement kinematics, emerging deviations, attempted adjustments, and subsequent outcomes under severe temporal constraints. Consistent with this experience, experts use early kinematic information more effectively than novices to anticipate action outcomes (Aglioti et al., 2008; Denis et al., 2017; Ji et al., 2023; Zhao et al., 2018, 2025; Lu et al., 2025). They also show greater neural sensitivity when observed kinematics conflict with subsequent ball trajectories and when predicted and actual outcomes diverge (Lu et al., 2020; Wang et al., 2024), with related expertise effects in theta and N400 responses reported for incongruent actions in familiar domains (Zhao et al., 2021). Recent time-resolved EEG decoding research further shows that predictive information carried by unfolding sport actions can be decoded from distributed neural activity, with expertise shaping the temporal dynamics of this information (Wang et al., 2025). Together, these findings suggest that extensive interaction experience refines the use of unfolding action information and the monitoring of departures from expected action–outcome relations. If uninterrupted success, corrected success, and unsuccessful action constitute functionally meaningful action courses in an ongoing interaction, their neural differentiation should therefore be more pronounced in experts than in novices.
In the present study, we tested these predictions by recording EEG from expert table tennis players and novices while they observed three-stroke dyadic table tennis interactions. The critical action could proceed successfully as expected, deviate from expectation but recover through online adjustment, or ultimately fail. The ball trajectory was occluded before the eventual outcome became available, requiring observers to rely on the unfolding action and early kinematic information to anticipate how the interaction would continue. We combined event-related potentials, midfrontal delta–theta activity, and time-resolved multivariate pattern analysis to examine the temporal dynamics and neural differentiation of these three action courses. Comparisons among uninterrupted success, corrected success, and unsuccessful action allowed us to test whether neural monitoring distinguished action courses that differed in whether a deviation occurred and in how that deviation affected the developing interaction. We further examined whether this differentiation was enhanced by extensive dyadic motor experience. We predicted that extensive dyadic motor experience would sharpen the neural differentiation of these action courses in experts relative to novices.
2. Materials and Methods
2.1. Preregistration
The experimental design, data collection plan, hypotheses, and analysis plan for this study have been preregistered on the OSF prior to data collection (https://doi.org/10.17605/OSF.IO/TMXGC). Deviations from the preregistered analysis plan are reported in the relevant Methods sections.
2.2. Participants
An a priori sample-size analysis was conducted using G*Power 3.1 (Faul et al., 2009). The analysis assumed a medium effect size of Cohen's f = 0.25, a significance level of α = 0.05, and statistical power of 1 − β = 0.90. The estimated minimum sample size was 18 participants per group. A total of 42 participants were recruited, including 20 highly skilled table tennis players and 22 novices without sport-specific table tennis training. One novice was excluded from the analyses because of persistent EEG signal drift, leaving a final analytical sample of 41 participants (20 experts and 21 novices). All experts were national first- or second-class table tennis players. They had trained for 10.45 ± 2.24 years and practiced for 6.80 ± 3.34 h per week. The novices had received no systematic table tennis training. Demographic characteristics are presented in Table 1. All participants were right-handed, had normal or corrected-to-normal vision, and reported no history of neurological or psychiatric disorders. Each participant provided written informed consent before the experiment and received 80–120 Chinese yuan after completing the study. The study was approved by the Ethics Committee of Shanghai University of Sport (102772025RT237).
2.3. Stimuli
The stimuli were videos of three-stroke table tennis interactions recorded by the research team.
Trained table tennis players performed the actions using a right-handed shakehand grip for both serves and returns. Videos were recorded with a Canon EOS 5D Mark III camera at an original resolution of 1280 × 720 pixels and a frame rate of 50 frames/s. The camera was positioned above and behind the server to provide a viewing perspective that approximated the action and ball-trajectory information available during competition. Each video comprised three strokes: 1) Serve. In every trial, Player A served a short straight ball from the backhand corner to a fixed landing location. 2) Serve return. Player B returned the serve with a forehand stroke using a return type determined by the experimental condition. 3) Third stroke. The video showed Player A's third-stroke action, while the subsequent ball trajectory and landing outcome remained visually occluded.
The critical presentation period extended from Player B's return action through Player A's third-stroke action. Three conditions were defined according to the match between Player A's action preparation and the incoming ball: 1) No-deviation condition: Player A correctly anticipated the landing location and type of the incoming ball, and the prepared action enabled a successful return. 2) Correctable action-deviation condition: Player A's prepared action did not fully match the incoming ball, but a subsequent action adjustment enabled a successful return. 3) Goal-disrupting deviation condition: Player A incorrectly anticipated the incoming ball, and the prepared action could not be adjusted to produce an effective return. Conceptually, these three experimental conditions corresponded to uninterrupted success, corrected success, and unsuccessful action, respectively.
The experiment included 24 videos, with eight videos in each condition corresponding to eight return locations. Landing-location categories were matched across the three conditions to reduce confounding by the spatial position of the ball. All videos were standardized in Adobe Premiere Pro. During the experiment, videos were presented at a resolution of 640 × 360 pixels and a frame rate of 25 frames/s with all sound removed. The server's face was pixelated to reduce the influence of nonaction cues. The interval from serve onset to racket–ball contact by Player B lasted 2000 ms. The video then continued for 800 ms to show Player A's third-stroke action, followed by an 800-ms freeze frame. Each video therefore lasted 3600 ms. The ball was visually occluded from the moment of racket–ball contact by Player B to reduce explicit postcontact trajectory information. Participants therefore predicted the subsequent outcome primarily from the observed action and early kinematic cues. An example of the stimuli is shown in Figure 1.
2.4. Task and Procedure
Participants viewed videos of three-stroke table tennis interactive actions and predicted the landing location of the third stroke on a subset of trials. Each trial began with a central fixation point presented for 1600 ms, followed by a 3600 ms action video. The interval from video onset to racket–ball contact by Player B lasted 2000 ms. The third-stroke action then remained visible for 800 ms, followed by an 800-ms freeze frame of the final video frame. To ensure sustained attention to the action information, the prompt "Please judge the ball's landing location" appeared after the video on 30% of trials. Participants used the observed third-stroke action and kinematic cues to predict which of eight table regions the ball would land in. They responded within 3000 ms using the Q, W, E, R, A, S, D, or F key, with each key corresponding to one landing region. No response was required on the remaining 70% of trials, and the video was followed directly by a 1000-ms intertrial interval. The prediction task was used to maintain attention to the action and landing-location information. Participants did not know before viewing a video whether a response would be required. The experiment comprised four blocks of 48 trials. Each of the 24 videos was presented twice in random order within each block, yielding 192 trials. The three action-course conditions and eight landing locations were balanced within each block, and trial order was randomized. Before the experiment, participants completed a practice session to become familiar with the procedure, landing-region divisions, and key mappings. The task sequence and response-key mapping are shown in Figure 2.
2.5. Data and Statistical Analyses
2.5.1. Behavioral Data Analysis
Behavioral analyses were based on trials that required a landing-location prediction. Trials without a response within the specified interval were treated as omissions and excluded. Mean accuracy across all prediction trials was calculated for each participant and compared with the theoretical chance level of 12.5% using a one-sample t test. This chance level corresponded to randomly selecting one of eight landing regions and tested whether participants could predict the landing location from the action information in the videos.
Trial-level binary accuracy was then analyzed using a generalized linear mixed-effects model. Correct responses were coded as 1 and incorrect responses as 0. The model used a binomial distribution with a logit link and was fitted using the glmer function in the lme4 package in R (Bates et al., 2015; Jaeger, 2008). Motor expertise and action course were entered as fixed effects. Participant was included as a random intercept to account for individual differences in baseline accuracy. Likelihood-ratio tests sequentially compared four nested models. The null model contained only the participant random intercept. The second model added the main effect of motor expertise, and the third added the main effect of action course. The full model included motor expertise, action course, and their interaction. A newly added fixed effect was retained only when it significantly improved model fit. Fixed-effect parameters were evaluated using Wald z tests. Regression coefficients were converted to odds ratios (ORs) and reported with 95% confidence intervals. For significant multilevel fixed effects retained in the final model, estimated marginal means (Lenth, 2016) and pairwise condition comparisons were calculated using the emmeans package. All pairwise comparisons were corrected for multiple comparisons using the Tukey method. The significance level was α = 0.05.
2.5.2. EEG Recording and Preprocessing
EEG data were recorded at 1000 Hz using an actiCHamp amplifier system (Brain Products GmbH, Gilching, Germany), with FCz as the online reference. The raw recordings comprised 59 directly recorded scalp channels, bilateral mastoid channels TP9 and TP10, and vertical and horizontal electrooculogram channels. FCz was restored during offline rereferencing, yielding 60 scalp channels for analysis. Offline preprocessing was performed in MATLAB using EEGLAB (Delorme & Makeig, 2004). Continuous signals were rereferenced to the average of TP9 and TP10, bandpass filtered from 0.1 to 30 Hz, notch filtered from 48 to 52 Hz, and downsampled to 500 Hz. After resampling, the electrooculogram channels were removed, and the data were segmented around racket–ball contact markers to obtain contact-locked epochs extending from approximately −3700 to 2100 ms. Extended Infomax independent component analysis (Lee et al., 1999) was performed on the epoched 60-channel data using participant-specific principal-component ranks. Components associated with eye movements, blinks, or muscle activity were identified and removed. Trials were excluded if the amplitude at any scalp channel exceeded ±100 μV between −500 and 1600 ms relative to racket–ball contact. One novice was excluded because of persistent EEG signal drift. The final analytical sample therefore comprised 41 participants, including 20 experts and 21 novices. ERP epochs were baseline corrected using the −500 to 0 ms precontact interval.
1.a.3 ERP analysis
ERP analyses were conducted in MATLAB using FieldTrip (Oostenveld et al., 2011). For each participant and condition, artifact-free epochs were averaged after baseline correction. Statistical analyses included all 60 scalp electrodes and the 0–1500 ms interval after racket–ball contact.
ERP amplitudes were analyzed using a 2 × 3 mixed-design spatiotemporal cluster-based permutation analysis, with motor expertise as a between-participant factor and action course as a within-participant factor. The analysis tested both main effects and their interaction. The interaction was decomposed by directly comparing the three pairwise condition effects between experts and novices. For each condition pair, participant-level condition effects were entered into a two-sided independent-samples spatiotemporal cluster test. Holm correction was applied across the three direct between-group comparisons and separately across the three within-group comparisons in each expertise group. Spatial neighbors were defined from three-dimensional electrode coordinates using triangulation. Samples exceeding an uncorrected threshold of p < .05 were grouped into clusters based on temporal and spatial adjacency, with at least two neighboring electrodes required. F tests used an upper-tailed threshold, whereas t tests were two-sided. Cluster mass was defined as the sum of the F or t values within each cluster. Statistical significance was assessed using 1000 Monte Carlo randomizations and the maximum cluster statistic. Motor expertise labels were permuted across participants for between-participant tests, whereas condition information was permuted within participants for within-participant tests. This procedure controlled the familywise error rate across electrodes and time within each test. Cluster-level significance was set at p < .05 (Maris & Oostenveld, 2007).
- 1.
- a.4 Time-frequency analysis
Time–frequency analyses were conducted in MATLAB using Letswave 7. A continuous wavelet transform (CWT) was applied separately to each preprocessed, contact-locked single-trial EEG epoch. The analysis included 100 linearly spaced frequency points ranging from 1 to 30 Hz. A complex Morlet wavelet (cmor1-1.5) was used, with a bandwidth parameter of 1 and a center-frequency parameter of 1.5. Time–frequency power was calculated for each trial, electrode, time point, and frequency as the squared magnitude of the complex wavelet coefficients. Single-trial power was then averaged within each experimental condition for each participant. Event-related spectral perturbation (ERSP) was used to quantify event-related changes in power. For the condition-averaged power, the power at time (t) and frequency (f), (P(t,f)), was compared with the mean power at the same frequency during the −500 to 0 ms baseline preceding racket–ball contact, Pbaseline(f). Percentage power change from baseline was calculated as:
ER%(t,f)=[P(t,f) − Pbaseline(f)] / Pbaseline(f) × 100
The primary analysis focused on midfrontal delta–theta activity. Based on previous research on action-deviation monitoring (Wang et al., 2024; Era et al., 2025) and the overall time–frequency distributions, mean ERSP values from 2 to 6 Hz were extracted at FCz. To characterize the temporal dynamics of delta–theta activity, the 100–1500 ms interval following racket–ball contact was divided into 14 consecutive, nonoverlapping 100 ms windows. Mean ERSP was calculated within each time window.
The resulting ERSP values were analyzed using a 2 × 3 × 14 mixed-design repeated-measures analysis of variance (ANOVA). Motor expertise was included as a between-subject factor, whereas action course and time window were included as within-subject factors. Greenhouse–Geisser corrections were applied when sphericity was violated. Significant interactions were followed by simple-effects analyses and pairwise comparisons, with Bonferroni correction applied for multiple comparisons. Additional within-group comparisons were conducted on an exploratory basis when the higher-order interaction involving motor expertise was not significant. These comparisons were performed separately for each 100-ms time window, and Bonferroni correction was applied across the three pairwise action-course comparisons within each window. Exploratory within-group effects were interpreted descriptively and were not taken as evidence of differential effects between experts and novices.
Given the association of sensorimotor oscillations with action anticipation and observation (Denis et al., 2017), an exploratory mu-rhythm analysis was also conducted. Mean ERSP values from 8 to 12 Hz were extracted across the sensorimotor electrodes C3, C4, CP3, CP4, FC3, and FC4 using the same 14 time windows. These values were analyzed using a 2 × 3 × 14 mixed-design repeated-measures ANOVA.
2.5.5. Multivariate Pattern Analysis
Time-resolved multivariate pattern analysis was conducted in MATLAB using MVPA-Light (Treder, 2020) to test whether EEG activity contained information that distinguished the three action-course conditions. Decoding was performed from −500 to 1600 ms relative to racket–ball contact. Binary classifications used linear discriminant analysis (LDA), with decoding performance quantified using the area under the receiver operating characteristic curve (AUC; chance level = 0.50). Z-score parameters were estimated within each training fold and applied to the corresponding test fold.
For whole-scalp ERP decoding, single-trial voltages were baseline corrected using the −500 to 0 ms interval and temporally smoothed using a 20-ms moving average. At each time point, voltage values from all 60 scalp electrodes formed the feature vector. Three pairwise classifications were performed separately for each participant: no deviation versus correctable action deviation, correctable action deviation versus goal-disrupting deviation, and no deviation versus goal-disrupting deviation. Leave-one-location-out cross-validation was used to test whether action-course-related neural patterns generalized across landing locations. The eight landing locations served as eight predefined folds. In each fold, trials from one location formed the test set, whereas trials from the remaining seven locations formed the training set. Within each motor-expertise group, one-sided cluster-based permutation tests assessed whether decoding performance exceeded chance using participant-level sign flips. Between-group differences were tested using two-sided group-label permutations while preserving the original group sizes. Candidate clusters were formed from temporally adjacent samples exceeding an uncorrected threshold of p < 0.05. Statistical significance was evaluated using 1000 permutations and a familywise-error-corrected cluster threshold of p < 0.05.
Additional pairwise decoding examined whether midfrontal delta–theta power distinguished the action-course conditions. Single-trial FCz signals were bandpass filtered from 2 to 6 Hz using a third-order, zero-phase Butterworth filter. Instantaneous power was calculated as the squared magnitude of the Hilbert-transformed signal and expressed in decibels relative to the −500 to 0 ms baseline. The resulting power time series was smoothed using a 10-ms moving average. The same pairwise contrasts, LDA classifier, AUC metric, leave-one-location-out cross-validation, and cluster-based statistical procedures were used as in the whole-scalp ERP analysis.
Three-class decoding and cross-subject motor-expertise decoding were conducted as supplementary analyses. Three-class decoding used multiclass LDA and classification accuracy, with a chance level of 33.33%. Cross-subject decoding tested whether whole-scalp voltage patterns distinguished experts from novices within each action-course condition using leave-one-subject-out cross-validation. Full preprocessing and statistical details for these supplementary analyses are provided in the Supplementary Methods.
3. Results
3.1. Behavioral Results
3.1.1. Task Validity
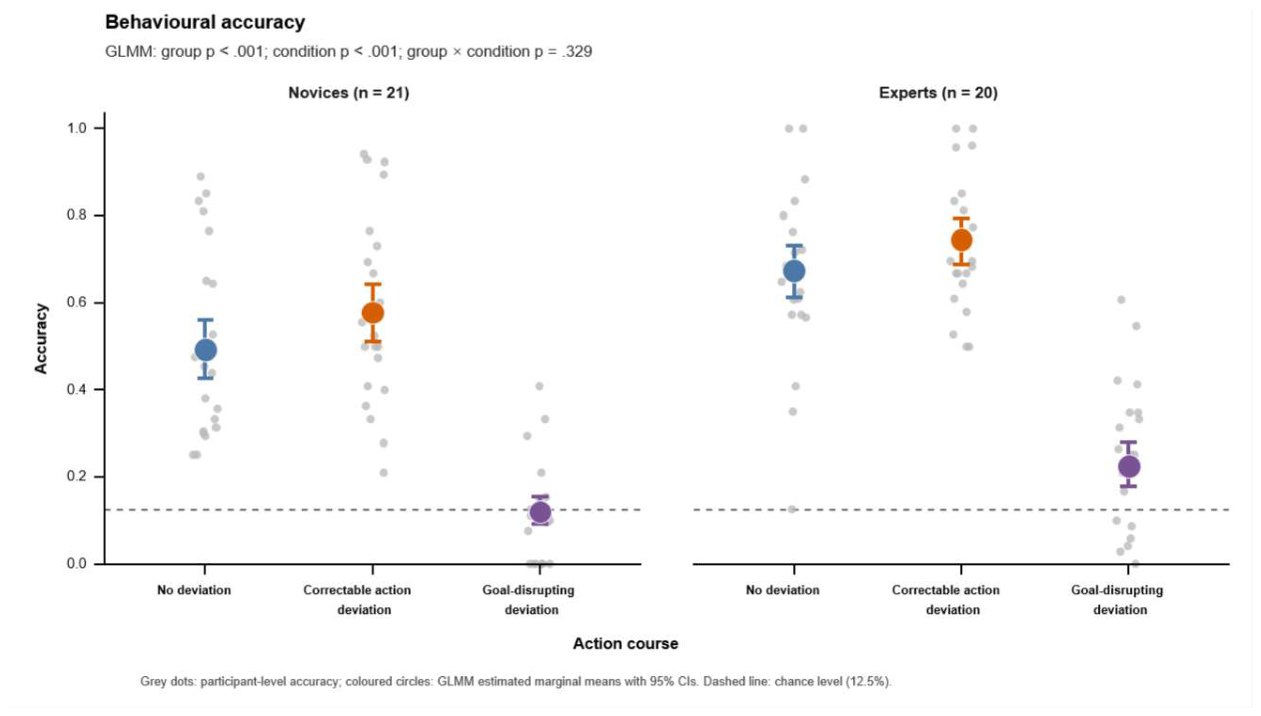
To determine whether participants could use action information in the videos to predict the third-stroke landing location, mean accuracy on prediction trials was compared with the theoretical chance level of 12.5%. Mean accuracy across all participants was 46.8%, significantly above chance, t(40) = 16.590, p < .001, Cohen's d = 2.59. Experts achieved a mean accuracy of 54.4%, which was significantly above chance, t(19) = 16.684, p < .001, Cohen's d = 3.73. Novices also performed significantly above chance, with a mean accuracy of 39.6%, t(20) = 11.385, p < .001, Cohen's d = 2.48. Thus, both groups used the observed action and kinematic cues to predict the subsequent landing location of the occluded ball.
3.1.2. Motor Expertise and Action Course Independently Affected Landing-Location Prediction Accuracy
Descriptive statistics for the three action-course conditions in each motor-expertise group are presented in Table 2. Four nested generalized linear mixed-effects models were compared sequentially using likelihood-ratio tests. Adding the main effect of motor expertise significantly improved model fit relative to the null model containing only a participant random intercept, χ²(1) = 15.510, p < .001. Adding the main effect of action course further improved model fit, χ²(2) = 480.762, p < .001. In contrast, adding the motor expertise × action course interaction did not improve model fit, χ²(2) = 2.224, p = .329. The final model therefore retained the main effects of motor expertise and action course.
After controlling for action course, the effect of motor expertise was significant, χ²(1) = 15.124, p < .001. The odds of a correct response were greater for experts than novices, β = 0.758, SE = 0.178, z = 4.252, p < .001, OR = 2.134, 95% CI [1.505, 3.026]. The effect of action course was also significant, χ²(2) = 480.762, p < .001. Tukey-corrected pairwise comparisons showed that the odds of a correct response were greater in the correctable action-deviation condition than in the no-deviation condition, OR = 1.409, p = .004. The odds were greater in the no-deviation condition than in the goal-disrupting deviation condition, OR = 7.111, p < .001. They were also greater in the correctable action-deviation condition than in the goal-disrupting deviation condition, OR = 10.023, p < .001.

Table 3.
Model comparisons for landing-location prediction accuracy.
| Model | df | AIC | BIC | logLik | χ² | p |
|---|---|---|---|---|---|---|
| ACC ~ 1 + (1|Subject) | 2 | 3345.491 | 3357.114 | −1670.746 | ||
| ACC ~ 1 + (1|Subject) + Group | 3 | 3331.982 | 3349.416 | −1662.991 | 15.510 | < .001 |
| ACC ~ 1 + (1|Subject) + Group + Action Course | 5 | 2855.220 | 2884.277 | −1422.610 | 480.762 | < .001 |
| ACC ~ 1 + (1|Subject) + Group × Action Course | 7 | 2856.995 | 2897.676 | −1421.498 | 2.224 | .329 |
Figure 3.
Effects of motor expertise and action course on landing-location prediction accuracy. Gray points show participant-level accuracy. Colored circles show generalized linear mixed-model estimated marginal means, and error bars show 95% confidence intervals. The dashed line marks the theoretical chance level of 12.5%. The model showed significant main effects of motor expertise and action course, but no interaction.
Figure 3.
Effects of motor expertise and action course on landing-location prediction accuracy. Gray points show participant-level accuracy. Colored circles show generalized linear mixed-model estimated marginal means, and error bars show 95% confidence intervals. The dashed line marks the theoretical chance level of 12.5%. The model showed significant main effects of motor expertise and action course, but no interaction.
3.2. ERP Results
The 2 × 3 mixed-design analysis identified no significant spatiotemporal cluster for the main effect of motor expertise, cluster-level p > .05. The main effect of action course yielded a significant cluster from 432 to 1080 ms, cluster-level p = .001, cluster mass = 77,370.56. The cluster included all 60 electrodes and reached its maximum at CP3 at 860 ms, F(2, 38) = 35.32. The motor expertise × action course interaction was also significant from 368 to 684 ms, cluster-level p = .023, cluster mass = 17,819.84. This cluster included 56 electrodes and reached its maximum at P5 at 480 ms, F(2, 38) = 12.71 (Figure 4A,B).
The interaction decomposition showed that the difference between goal-disrupting and correctable action deviations was greater in experts than in novices from 364 to 772 ms, Holm-adjusted p= .018, cluster mass = 14,874.76. The cluster included 58 electrodes and reached its maximum at P2 at 600 ms, t(39) = 4.59. Within experts, goal-disrupting deviations elicited more positive ERP activity than correctable action deviations from 362 to 1022 ms, Holm-adjusted p = .006, cluster mass = 35,444.64. The cluster included 59 electrodes and reached its maximum at P6 at 906 ms, t(19) = 7.34. No cluster for this comparison survived Holm correction in novices, adjusted p = .208. (Figure 5A–C)
Correctable action deviations elicited more negative ERP activity than no deviation in experts from 500 to 1150 ms, Holm-adjusted p = .006, cluster mass = −31,088.46. The cluster included all 60 electrodes and reached its maximum at CP6 at 660 ms, t(19) = −11.22. No cluster for this comparison survived Holm correction in novices, adjusted p = .114. However, this condition effect did not differ significantly between experts and novices, adjusted p = .072 (Supplementary Figure S1).
Goal-disrupting deviations elicited more positive ERP activity than no deviation in experts from 268 to 622 ms, Holm-adjusted p = .014, cluster mass = 8,813.78. The cluster included 54 electrodes and reached its maximum at CPz at 400 ms, t(19) = 6.62. No cluster for this comparison survived Holm correction in novices, adjusted p = .571. This condition effect also did not differ significantly between experts and novices, adjusted p = .256(Supplementary Figure S1).
3.3. Time-Frequency Results
3.3.1. Delta–Theta Power Showed Action Course-Related Temporal Dynamics
Delta–theta power from 2 to 6 Hz at FCz changed over time after racket–ball contact (Figure 6, Figure 7 and Figure 8). The mixed-design repeated-measures ANOVA showed a significant main effect of time, F(13, 507) = 10.213, p < .001, partial η² = .208, and motor expertise, F(1, 39) = 5.235, p = .028, partial η² = .118. The main effect of action course was not significant, F(2, 78) = 2.657, p = .076, partial η² = .064.The action course × time interaction was significant, F(26, 1014) = 2.596, p = .026, partial η² = .062. The motor expertise × action course × time interaction was not significant, F(26, 1014) = 1.940, p = .088, partial η² = .047. Neither the motor expertise × action course interaction, F(2, 78) = 0.160, p = .852, partial η² = .004, nor the motor expertise × time interaction, F(13, 507) = 0.065, p = .896, partial η² = .002, was significant.
Because the three-way interaction was not significant, follow-up comparisons were treated as exploratory. In experts, delta–theta power was higher for correctable action deviations than for goal-disrupting deviations from 1100 to 1500 ms. The cellwise Bonferroni-adjusted p values for the four consecutive windows were .042, .021, .022, and .046. Continuous scalp-power distributions and pairwise condition contrasts are shown in Supplementary Figure S2–S5.
3.3.2. Mu-Band ERSP Changed Over Time but Was Not Modulated by Motor Expertise or Action Course
Sensorimotor mu power from 8 to 12 Hz changed over time after racket–ball contact (Figure 9 and Figure 10). The main effect of time was significant, F(13, 507) = 9.498, p < .001, partial η² = .196. The main effects of motor expertise, F(1, 39) = 3.061, p = .088, partial η² = .073, and action course, F(2, 78) = 0.535, p = .588, partial η² = .014, were not significant. The motor expertise × time, F(13, 507) = 0.963, p = .407, partial η² = .024, motor expertise × action course, F(2, 78) = 1.166, p = .317, partial η² = .029, and action course × time interactions, F(26, 1014) = 0.988, p = .445, partial η² = .025, were also not significant. The motor expertise × action course × time interaction was not significant, F(26, 1014) = 0.773, p = .626, partial η² = .019. Thus, mu power changed over time, with no evidence that its temporal profile varied by motor expertise or action course. Scalp distributions are shown in Supplementary Figure S6 and Figure S7.
3.4. Multivariate Pattern Analysis Results
3.4.1. Whole-Scalp ERP Patterns Distinguished All Three Action-Course Pairs in Experts
Time-resolved pairwise decoding based on whole-scalp ERP features tested whether the action courses were associated with distinguishable spatiotemporal neural patterns. Decoding performance was evaluated using AUC with a theoretical chance level of 0.50 (Figure 11).
For no deviation versus correctable action deviation, experts showed AUC values significantly above 0.50 from 522 to 590 ms, 598 to 1184 ms, 1226 to 1334 ms, and 1356 to 1600 ms. Whole-scalp ERP patterns distinguished the two conditions across landing locations during several middle and late intervals. Novices showed no significant above-chance temporal cluster. The direct comparison between experts and novices was not significant.
For correctable action deviation versus goal-disrupting deviation, experts showed AUC values significantly above 0.50 from 832 to 920 ms, whereas novices showed no significant decoding interval. The direct comparison between experts and novices was not significant. Thus, neural activity in experts distinguished corrected success from unsuccessful action.
For no deviation versus goal-disrupting deviation, experts showed AUC values significantly above 0.50 from 830 to 912 ms, 938 to 1056 ms, and 1242 to 1320 ms. Novices showed no significant above-chance temporal cluster. Direct group comparisons further showed significantly higher AUC values in experts than novices from 454 to 510 ms, 830 to 912 ms, and 940 to 1020 ms. The neural distinction between no deviation and goal-disrupting deviation therefore differed by motor expertise across multiple periods.
Overall, experts showed significantly above-chance whole-scalp ERP decoding for all three condition pairs, whereas novices showed no stable decoding interval. Direct group comparisons indicated that motor-expertise-related differences were concentrated in decoding no deviation from goal-disrupting deviation.
3.4.2. Midfrontal Delta–Theta Patterns Distinguished Corrected Success from Unsuccessful Action in Experts
Time-resolved pairwise decoding was also conducted using FCz delta–theta features from 2 to 6 Hz (Figure 12). For correctable action deviation versus goal-disrupting deviation, experts showed AUC values significantly above 0.50 from 296 to 412 ms, whereas novices showed no significant above-chance cluster. However, the direct comparison between experts and novices was not significant.
For no deviation versus correctable action deviation and no deviation versus goal-disrupting deviation, neither group showed a significant above-chance interval. Direct comparisons between groups were also not significant.
3.4.3. Supplementary Decoding Analyses
Three-class decoding was performed using whole-scalp ERP features and FCz delta–theta features to evaluate the overall separability of the three action courses. For whole-scalp ERP features, classification accuracy was significantly above the 33.33% chance level during several periods in experts only. Novices showed no significant above-chance temporal cluster. In contrast, three-class decoding based on FCz delta–theta features produced no stable significant cluster in either group. These results are shown in Supplementary Figure S8 and Figure S9.
Cross-subject motor-expertise decoding was also conducted within each action-course condition. Neural patterns of experts and novices were distinguishable above chance during several periods in the no-deviation, correctable action-deviation, and goal-disrupting deviation conditions. Cross-subject decoding quantified overall differences in neural patterns between experts and novices within each action course. Detailed results are shown in Supplementary Figure S10–S12.
4. Discussion
The present study examined whether the brain differentiates three distinct courses of an unfolding dyadic action concluding uninterrupted success, corrected success, and unsuccessful action, and whether extensive interaction experience sharpens this differentiation. The results showed that these action courses were neurally distinguishable, particularly in experts, but the evidence for expertise-related enhancement differed across neural measures. Most notably, the ERP distinction between corrected success and unsuccessful action was significantly greater in experts than in novices. Whole-scalp decoding further revealed separable neural information among all three action-course pairs in experts. Midfrontal delta–theta activity showed time-varying sensitivity to action course. Behaviorally, experts were more accurate overall, but their advantage did not vary reliably across action courses. Together, these findings show that neural activity differentiates unfolding action courses during dyadic observation and that motor expertise modulates specific action-course distinctions.
The position of corrected success within this pattern is particularly informative. Corrected success shared the successful continuation of the action with uninterrupted success, but shared the occurrence of a deviation with unsuccessful action. It therefore occupied an intermediate course that cannot be characterized simply as either an entirely expected action or an unsuccessful one. Experts showed separable neural patterns among all three action courses. The stronger ERP distinction between corrected success and unsuccessful action further indicates sensitivity to how an action developed after departing from expectation. Once a deviation had occurred, the neural response differentiated whether the unfolding action recovered toward successful continuation or remained on an unsuccessful course. Neural activity differentiated whether the action recovered toward successful continuation or progressed toward failure after a deviation. This intermediate position extends prior evidence that observed-action monitoring is sensitive to the occurrence and magnitude of a deviation (Pezzetta et al., 2018; Spinelli et al., 2018).
The ERP effect may reflect long-term experience in monitoring rapidly changing action courses during dyadic interaction. Skilled athletes use kinematic information to update their interpretation of an opponent’s action as it develops. Previous work shows that experts make more effective use of early kinematic cues when anticipating action outcomes (Aglioti et al., 2008; Denis et al., 2017; Zhao et al., 2018, 2025) and exhibit altered neural responses when predicted and actual outcomes diverge (Lu et al., 2020; Wang et al., 2024; Zhao et al., 2021). The present findings extend this work by showing greater neural differentiation of post-deviation action courses in experts. In particular, experts may use unfolding kinematic information more effectively to distinguish an action that is recovering toward successful continuation from one progressing toward failure. Such sensitivity would be especially useful in fast dyadic interactions, where the observer’s preparation depends on continuously updating the state of the other person’s action. The temporal characteristics of the ERP effect provide further information about this differentiation. The direct expertise-related difference between corrected success and unsuccessful action extended from 364 to 772 ms, while within experts the distinction persisted until approximately 1022 ms. Its sustained duration and broad scalp distribution are consistent with a temporally extended evaluative process spanning several canonical ERP windows (Choo et al., 2023; Musco et al., 2023). Such sustained activity may reflect continued updating as additional movement information becomes available after the initial deviation. Evidence from dyadic motor interactions likewise shows that monitoring depends on the partner’s action and the shared goal (Moreau et al., 2023; Sacheli et al., 2022).
Time-frequency and multivariate analyses revealed complementary temporal and representational features of the three action courses. Delta–theta activity changed across action courses over time, indicating that the neural processing of the three courses changed dynamically across the observation period. However, the three-way interaction among motor expertise, action course, and time was not significant, and the late increase for corrected success relative to unsuccessful action in experts emerged only in exploratory analyses. Thus, the time-frequency results showed temporal changes in action course processing, but no reliable modulation by expertise. In the delta–theta MVPA, corrected success and unsuccessful action were distinguishable in experts from 296 to 412 ms, although the direct expert–novice comparison was not significant. Whole-scalp ERP patterns in experts carried information that distinguished all three action-course pairs. Together, these findings complement the ERP results by showing that neural differentiation of the action courses emerged across multiple time periods and was detectable in both midfrontal low-frequency activity and distributed scalp patterns. In particular, the corrected-success versus unsuccessful-action contrast was detectable across neural measures in experts.
Behavioral performance revealed a more general advantage of motor expertise. Both experts and novices predicted landing locations above chance, demonstrating that the available action information supported anticipation despite occlusion of the ball trajectory. Experts were more accurate overall, and accuracy varied across action courses, but there was no interaction between motor expertise and action course. This pattern differed from the ERP results, where expertise specifically influenced the distinction between corrected success and unsuccessful action. One possible explanation is that EEG captured neural processing while the action was unfolding, whereas behavioral accuracy reflected a final decision based on information accumulated across the entire video. The neural distinction observed in experts may therefore reflect differences in online action monitoring that were not evident in the final behavioral response.
The naturalistic action courses constrain the interpretation of the neural differences. Because the three action courses were defined by naturally unfolding movement sequences, their kinematic development and likely outcomes were not independently manipulated. The present findings establish neural differentiation at the level of action course. Identifying the kinematic or outcome information that drives this differentiation requires independent manipulation. The unsuccessful action condition was also more difficult behaviorally, especially for novices, which may have increased uncertainty when interpreting this action course. Future studies could independently manipulate these sources of information to determine which features contribute most strongly to action-course differentiation. In addition, because expertise was examined cross-sectionally, the observed group differences cannot be attributed causally to training. The present findings show that different unfolding action courses can be neurally distinguished during dyadic observation and that specific distinctions are more pronounced in experts. In particular, the enhanced ERP distinction between corrected success and unsuccessful action suggests that extensive motor experience is associated with more differentiated neural processing of how an action develops following a deviation.
Supplementary Materials
The following supporting information can be downloaded at the website of this paper posted on Preprints.org.
Institutional Review Board Statement
The study was approved by the Ethics Committee of Shanghai University of Sport (102772025RT237, date 2026-01-28).
Informed Consent Statement
Informed consent was obtained from all subjects involved in the study.
References
- Aglioti, S. M.; Cesari, P.; Romani, M.; Urgesi, C. Action anticipation and motor resonance in elite basketball players. Nat. Neurosci. 2008, 11(9), 1109–1116. [Google Scholar] [CrossRef] [PubMed]
- Alexander, W. H.; Brown, J. W. Medial prefrontal cortex as an action-outcome predictor. Nat. Neurosci. 2011, 14(10), 1338–1344. [Google Scholar] [CrossRef] [PubMed]
- Bates, D.; Mächler, M.; Bolker, B.; Walker, S. Fitting linear mixed-effects models using lme4. J. Stat. Softw. 2015, 67(1), 1–48. [Google Scholar] [CrossRef]
- Betti, S.; Finisguerra, A.; Amoruso, L.; Urgesi, C. Contextual priors guide perception and motor responses to observed actions. Cereb. Cortex 2022, 32(3), 608–625. [Google Scholar] [CrossRef] [PubMed]
- Bolt, N. K.; Loehr, J. D. The motor-related brain activity that supports joint action: A review. Acta Psychol. 2021, 212, 103218. [Google Scholar] [CrossRef] [PubMed]
- Choo, Y.; Mather, A.; Wessel, J. R. Early action error processing is due to domain-general surprise, whereas later processing is error specific. J. Neurosci. 2023, 43(45), 7678–7689. [Google Scholar] [CrossRef] [PubMed]
- de Bruijn, E. R. A.; von Rhein, D. T. Is your error my concern? An event-related potential study on own and observed error detection in cooperation and competition. Front. Neurosci. 2012, 6, 8. [Google Scholar] [CrossRef] [PubMed]
- Delorme, A.; Makeig, S. EEGLAB: An open source toolbox for analysis of single-trial EEG dynamics including independent component analysis. J. Neurosci. Methods 2004, 134(1), 9–21. [Google Scholar] [CrossRef] [PubMed]
- Denis, D.; Rowe, R.; Williams, A. M.; Milne, E. The role of cortical sensorimotor oscillations in action anticipation. NeuroImage 2017, 146, 1102–1114. [Google Scholar] [CrossRef] [PubMed]
- Era, V.; Pesci, U. G.; Moreau, Q.; Pezzetta, R.; Zabberoni, S.; Peppe, A.; Costa, A.; Taglieri, S.; Candidi, M.; Aglioti, S. M. Dopaminergic modulation of behavioral and electrocortical markers of interpersonal performance monitoring in Parkinson’s disease. Commun. Biol. 2025, 8(1), Article 1195. [Google Scholar] [CrossRef] [PubMed]
- Faul, F.; Erdfelder, E.; Buchner, A.; Lang, A.-G. Statistical power analyses using G*Power 3.1: Tests for correlation and regression analyses. Behav. Res. Methods 2009, 41(4), 1149–1160. [Google Scholar] [CrossRef] [PubMed]
- Holroyd, C. B.; Coles, M. G. H. The neural basis of human error processing: Reinforcement learning, dopamine, and the error-related negativity. Psychol. Rev. 2002, 109(4), 679–709. [Google Scholar] [CrossRef] [PubMed]
- Jaeger, T. F. Categorical data analysis: Away from ANOVAs (transformation or not) and towards logit mixed models. J. Mem. Lang. 2008, 59(4), 434–446. [Google Scholar] [CrossRef] [PubMed]
- Ji, Q.; Zhou, C.; Wang, Y. Influence of conflicting prior information on action anticipation in soccer players: An ERP study. Front. Behav. Neurosci. 2023, 17, 1320900. [Google Scholar] [CrossRef] [PubMed]
- Krigolson, O. E.; Holroyd, C. B. Predictive information and error processing: The role of medial-frontal cortex during motor control. Psychophysiology 2007, 44(4), 586–595. [Google Scholar] [CrossRef] [PubMed]
- Krigolson, O. E.; Holroyd, C. B.; Van Gyn, G.; Heath, M. Electroencephalographic correlates of target and outcome errors. Exp. Brain Res. 2008, 190(4), 401–411. [Google Scholar] [CrossRef] [PubMed]
- Lee, T.-W.; Girolami, M.; Sejnowski, T. J. Independent component analysis using an extended Infomax algorithm for mixed sub-Gaussian and super-Gaussian sources. Neural Comput. 1999, 11(2), 417–441. [Google Scholar] [CrossRef] [PubMed]
- Lenth, R. V. Least-squares means: The R package lsmeans. J. Stat. Softw. 2016, 69(1), 1–33. [Google Scholar] [CrossRef]
- Lu, Y.; Yang, T.; Hatfield, B. D.; Cong, F.; Zhou, C. Influence of cognitive-motor expertise on brain dynamics of anticipatory-based outcome processing. Psychophysiology 2020, 57(2), e13477. [Google Scholar] [CrossRef] [PubMed]
- Lu, Y.; Huang, Y.; Wang, D.; Li, D.; Luan, M. Preserved use of prior information under time constraints: An EEG study of action anticipation in expert athletes. Cogn. Res. Princ. Implic. 2025, 10(1), 74. [Google Scholar] [CrossRef] [PubMed]
- Maffongelli, L.; Ferrari, E.; Bartoli, E.; Campus, C.; Olivier, E.; Fadiga, L.; D’Ausilio, A. Role of sensorimotor areas in early detection of motor errors: An EEG and TMS study. Behav. Brain Res. 2020, 378, 112248. [Google Scholar] [CrossRef] [PubMed]
- Maris, E.; Oostenveld, R. Nonparametric statistical testing of EEG- and MEG-data. J. Neurosci. Methods 2007, 164(1), 177–190. [Google Scholar] [CrossRef] [PubMed]
- Monaco, S.; Malfatti, G.; Zendron, A.; Pellencin, E.; Turella, L. Predictive coding of action intentions in dorsal and ventral visual stream is based on visual anticipations, memory-based information and motor preparation. Brain Struct. Funct. 2019, 224(9), 3291–3308. [Google Scholar] [CrossRef] [PubMed]
- Moreau, Q.; Candidi, M.; Era, V.; Tieri, G.; Aglioti, S. M. Midline frontal and occipito-temporal activity during error monitoring in dyadic motor interactions. Cortex 2020, 127, 131–149. [Google Scholar] [CrossRef] [PubMed]
- Moreau, Q.; Tieri, G.; Era, V.; Aglioti, S. M.; Candidi, M. The performance monitoring system is attuned to others’ actions during dyadic motor interactions. Cereb. Cortex 2023, 33(1), 222–234. [Google Scholar] [CrossRef] [PubMed]
- Müller, R. Does the anticipation of compatible partner reactions facilitate action planning in joint tasks? Psychol. Res. 2016, 80(4), 464–486. [Google Scholar] [CrossRef] [PubMed]
- Musco, M. A.; Zazzera, E.; Paulesu, E.; Sacheli, L. M. Error observation as a window on performance monitoring in social contexts? A systematic review. Neurosci. Biobehav. Rev. 2023, 147, 105077. [Google Scholar] [CrossRef] [PubMed]
- Oostenveld, R.; Fries, P.; Maris, E.; Schoffelen, J.-M. FieldTrip: Open source software for advanced analysis of MEG, EEG, and invasive electrophysiological data. Comput. Intell. Neurosci. 2011, 156869. [Google Scholar] [CrossRef] [PubMed]
- Pezzetta, R.; Nicolardi, V.; Tidoni, E.; Aglioti, S. M. Error, rather than its probability, elicits specific electrocortical signatures: A combined EEG-immersive virtual reality study of action observation. J. Neurophysiol. 2018, 120(3), 1107–1118. [Google Scholar] [CrossRef] [PubMed]
- Pyasik, M.; Beccherle, M.; Faraoni, F.; Pezzetta, R.; Moro, V. Effects of the social context on the neurophysiological correlates of observed error monitoring. Neuropsychologia 2023, 181, 108503. [Google Scholar] [CrossRef] [PubMed]
- Sacheli, L. M.; Arcangeli, E.; Paulesu, E. Evidence for a dyadic motor plan in joint action. Sci. Rep. 2018, 8(1), 5027. [Google Scholar] [CrossRef] [PubMed]
- Sacheli, L. M.; Musco, M. A.; Zazzera, E.; Paulesu, E. Mechanisms for mutual support in motor interactions. Sci. Rep. 2021, 11(1), 3060. [Google Scholar] [CrossRef] [PubMed]
- Sacheli, L. M.; Musco, M. A.; Zazzera, E.; Banfi, G.; Paulesu, E. How shared goals shape action monitoring. Cereb. Cortex 2022, 32(21), 4934–4951. [Google Scholar] [CrossRef] [PubMed]
- Spinelli, G.; Tieri, G.; Pavone, E. F.; Aglioti, S. M. Wronger than wrong: Graded mapping of the errors of an avatar in the performance monitoring system of the onlooker. NeuroImage 2018, 167, 1–10. [Google Scholar] [CrossRef] [PubMed]
- Treder, M. S. MVPA-Light: A classification and regression toolbox for multi-dimensional data. Front. Neurosci. 2020, 14, 289. [Google Scholar] [CrossRef] [PubMed]
- van Schie, H. T.; Mars, R. B.; Coles, M. G. H.; Bekkering, H. Modulation of activity in medial frontal and motor cortices during error observation. Nat. Neurosci. 2004, 7(5), 549–554. [Google Scholar] [CrossRef] [PubMed]
- Wang, D.; Li, D.; Mirifar, A.; Zhou, C.; Luan, M. The neural dynamics of integrating prior and kinematic information during action anticipation in sport. NeuroImage 2025, 315, 121291. [Google Scholar] [CrossRef] [PubMed]
- Wang, Y.; Zhao, Q.; Shan, X.; Lu, Y. Coping strategies and brain activity in table tennis players faced with discrepancies between predicted and actual outcomes. J. Sports Sci. 2024, 42(8), 665–675. [Google Scholar] [CrossRef] [PubMed]
- Zhao, Q.; Lu, Y.; Jaquess, K. J.; Zhou, C. Utilization of cues in action anticipation in table tennis players. J. Sports Sci. 2018, 36(23), 2699–2705. [Google Scholar] [CrossRef] [PubMed]
- Zhao, Q.; Wang, Y.; Chen, Y.; Wang, Y.; Zhou, C.; Lu, Y. Expertise influences congruency monitoring during action observation at the motor level. Soc. Cogn. Affect. Neurosci. 2021, 16(12), 1288–1298. [Google Scholar] [CrossRef] [PubMed]
- Zhao, Q.; Wang, Y.; Lu, Y.; Luan, M.; Gao, S.; Li, X.; Zhou, C. Computational bases of domain-specific action anticipation superiority in experts: Kinematic invariants mapping. Cogn. 259 2025, 106121. [Google Scholar] [CrossRef] [PubMed]
Figure 1.
Three-stroke table tennis interactive action stimuli and deviation conditions. Each video sequentially presented the serve, serve return, and third-stroke action. Racket–ball contact by the receiver, Player B, was defined as the critical event. Stimuli were classified into the no-deviation, correctable action-deviation, and goal-disrupting deviation conditions according to the match between third-stroke action preparation and the incoming ball.
Figure 1.
Three-stroke table tennis interactive action stimuli and deviation conditions. Each video sequentially presented the serve, serve return, and third-stroke action. Racket–ball contact by the receiver, Player B, was defined as the critical event. Stimuli were classified into the no-deviation, correctable action-deviation, and goal-disrupting deviation conditions according to the match between third-stroke action preparation and the incoming ball.
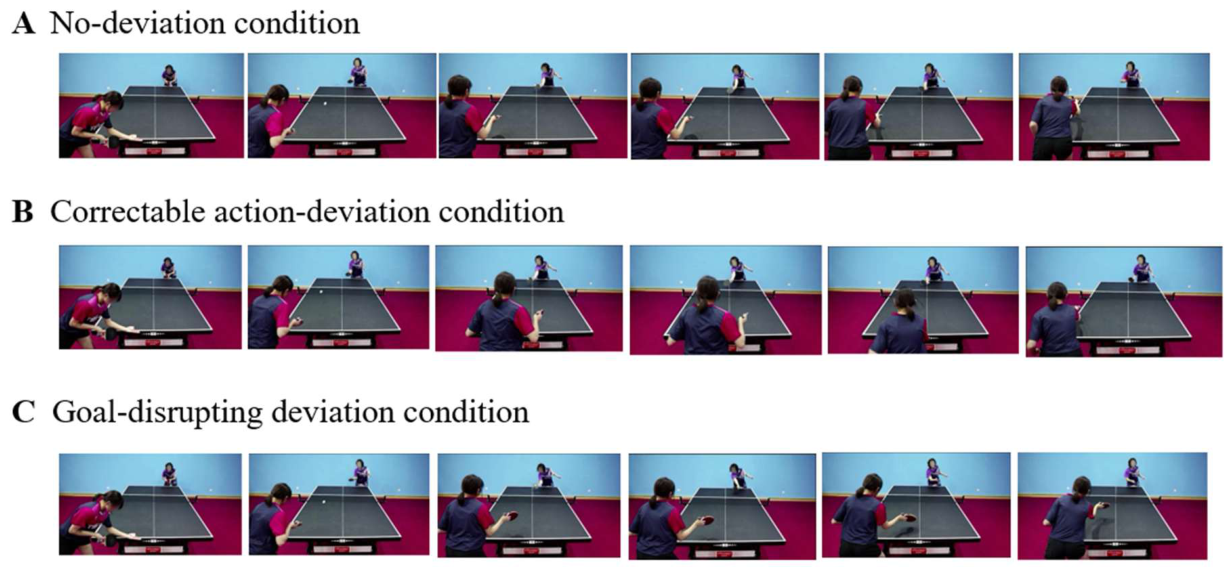
Figure 2.
Experimental procedure and landing-location response mapping. Each trial sequentially presented a fixation point and a video of a three-stroke table tennis interactive action. On 30% of trials, participants predicted the third-stroke landing location after the video. No response was required on the remaining trials. The eight landing regions corresponded to the Q, W, E, R, A, S, D, and F keys.
Figure 2.
Experimental procedure and landing-location response mapping. Each trial sequentially presented a fixation point and a video of a three-stroke table tennis interactive action. On 30% of trials, participants predicted the third-stroke landing location after the video. No response was required on the remaining trials. The eight landing regions corresponded to the Q, W, E, R, A, S, D, and F keys.
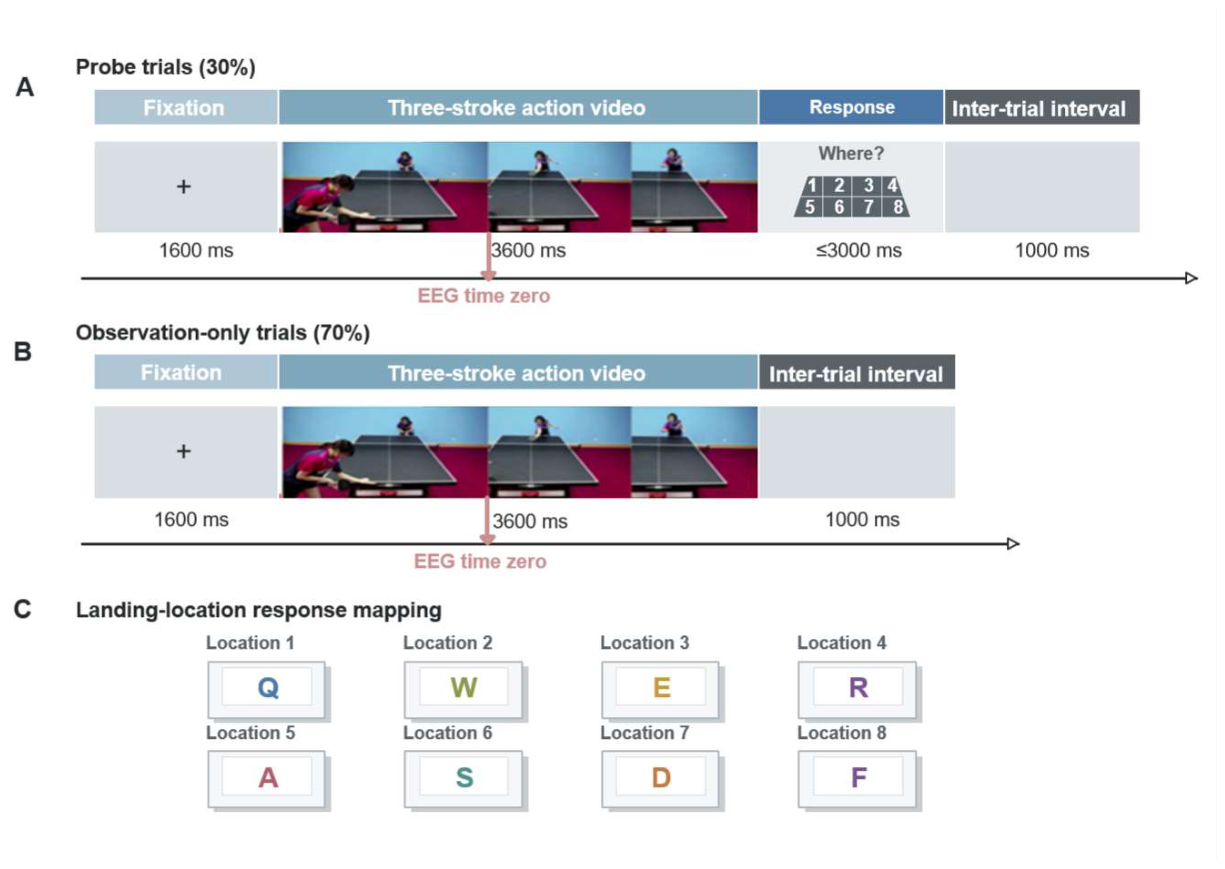
Figure 4.
Whole-scalp ERP effects. A, Main effect of action course (432–1080 ms; cluster p = .001). B, Motor expertise × action course interaction (368–684 ms; cluster p = .023). C, Mean scalp F distributions across each cluster interval. Dark shading marks samples in the significant spatiotemporal cluster; open electrodes contributed at least one sample. F values show effect magnitude.
Figure 4.
Whole-scalp ERP effects. A, Main effect of action course (432–1080 ms; cluster p = .001). B, Motor expertise × action course interaction (368–684 ms; cluster p = .023). C, Mean scalp F distributions across each cluster interval. Dark shading marks samples in the significant spatiotemporal cluster; open electrodes contributed at least one sample. F values show effect magnitude.
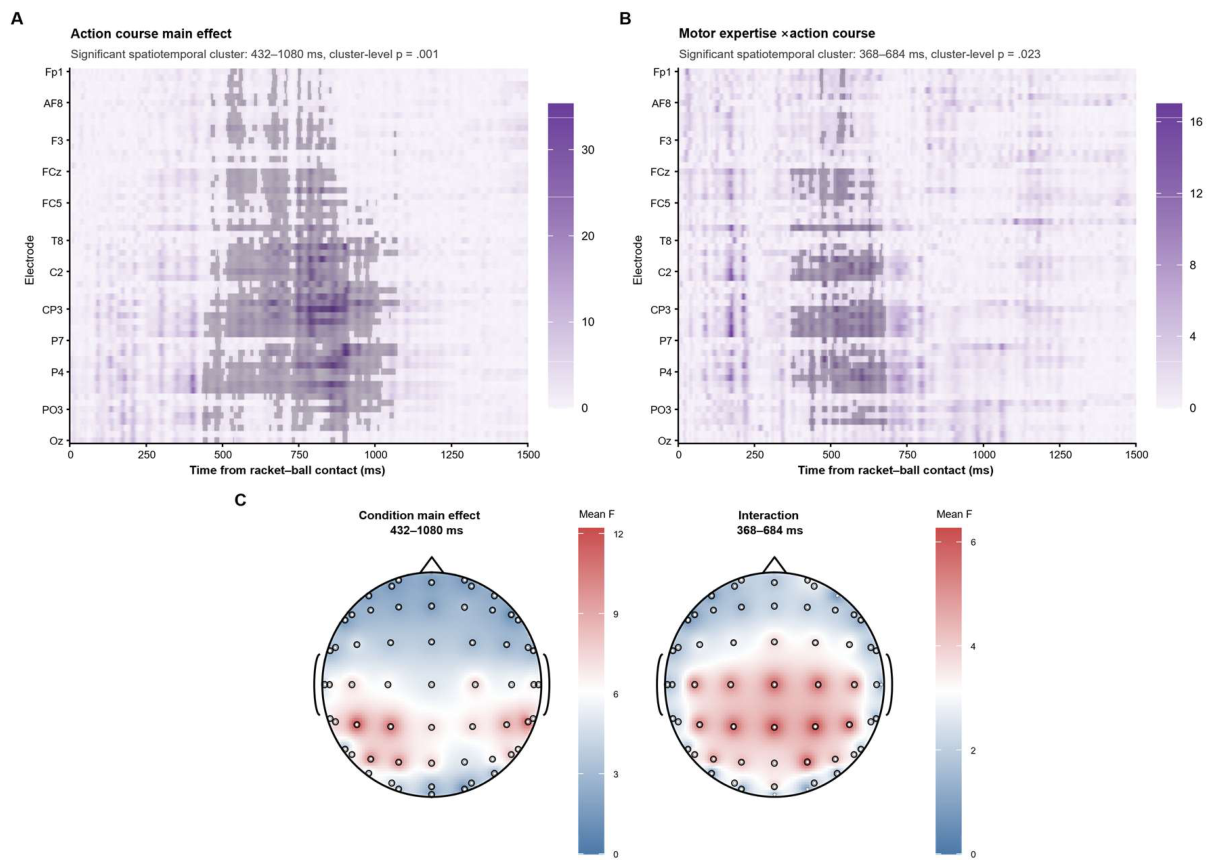
Figure 5.
Motor expertise modulated the ERP difference between goal-disrupting and correctable action deviations. A, Goal-disrupting-minus-correctable difference waves; shading shows SEM and the gray band marks the direct between-group cluster (364–772 ms; Holm-adjusted p = .018). Waveforms are displayed across the 58 electrodes contributing to that cluster, and this display average was not a predefined ROI. B, Scalp distributions for experts, novices, and their direct difference over 364–772 ms. C, Significant-sample masks for the within-expert and direct between-group tests. Inference used the full electrode × time permutation tests.
Figure 5.
Motor expertise modulated the ERP difference between goal-disrupting and correctable action deviations. A, Goal-disrupting-minus-correctable difference waves; shading shows SEM and the gray band marks the direct between-group cluster (364–772 ms; Holm-adjusted p = .018). Waveforms are displayed across the 58 electrodes contributing to that cluster, and this display average was not a predefined ROI. B, Scalp distributions for experts, novices, and their direct difference over 364–772 ms. C, Significant-sample masks for the within-expert and direct between-group tests. Inference used the full electrode × time permutation tests.
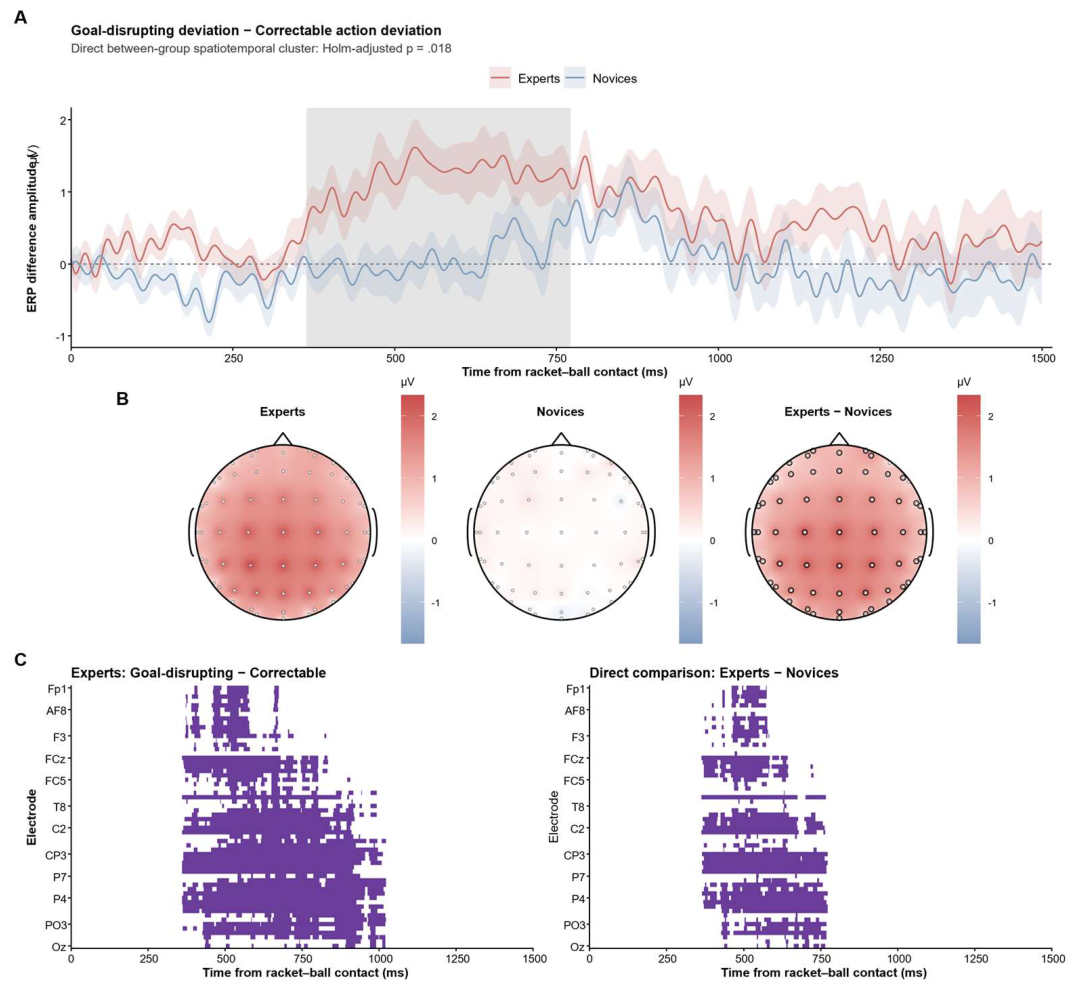
Figure 6.
Time-frequency power at FCz in the delta–theta band (2–6 Hz). ERSP time-frequency distributions are shown for experts and novices in the three action-course conditions. The distributions illustrate the dynamics of midfrontal low-frequency activity.
Figure 6.
Time-frequency power at FCz in the delta–theta band (2–6 Hz). ERSP time-frequency distributions are shown for experts and novices in the three action-course conditions. The distributions illustrate the dynamics of midfrontal low-frequency activity.
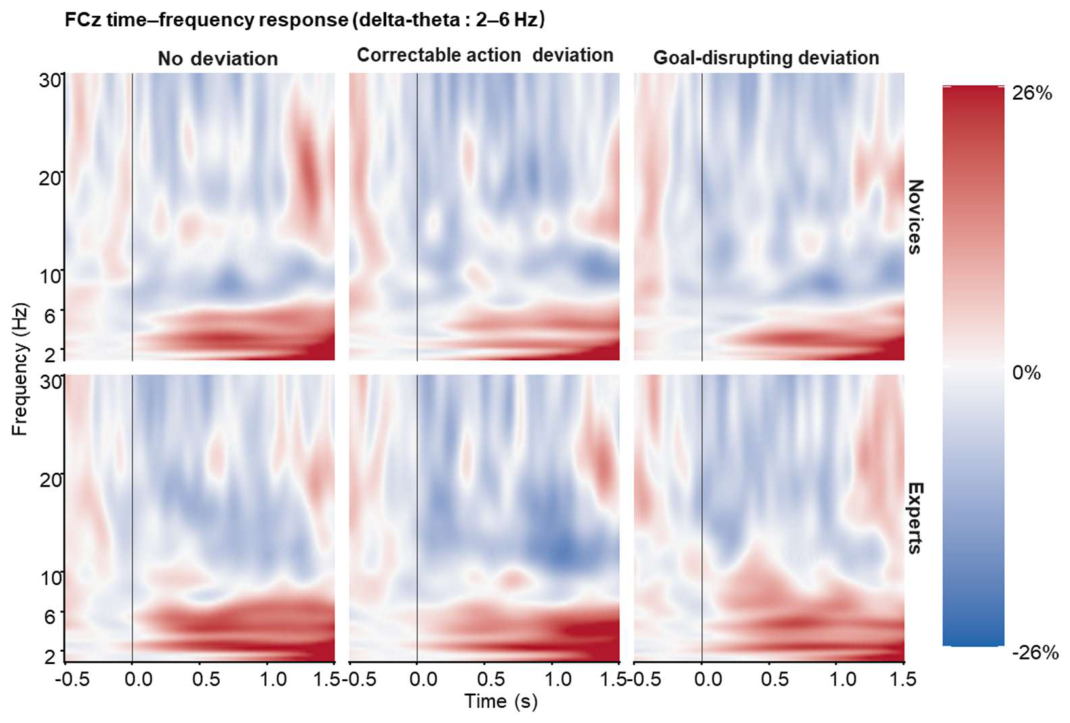
Figure 7.
Whole-scalp topographies of delta–theta power. Maps show the between-group difference in 2–6 Hz ERSP for each action course across consecutive 100 ms windows from 100 to 1500 ms. Positive values indicate greater ERSP in experts.
Figure 7.
Whole-scalp topographies of delta–theta power. Maps show the between-group difference in 2–6 Hz ERSP for each action course across consecutive 100 ms windows from 100 to 1500 ms. Positive values indicate greater ERSP in experts.
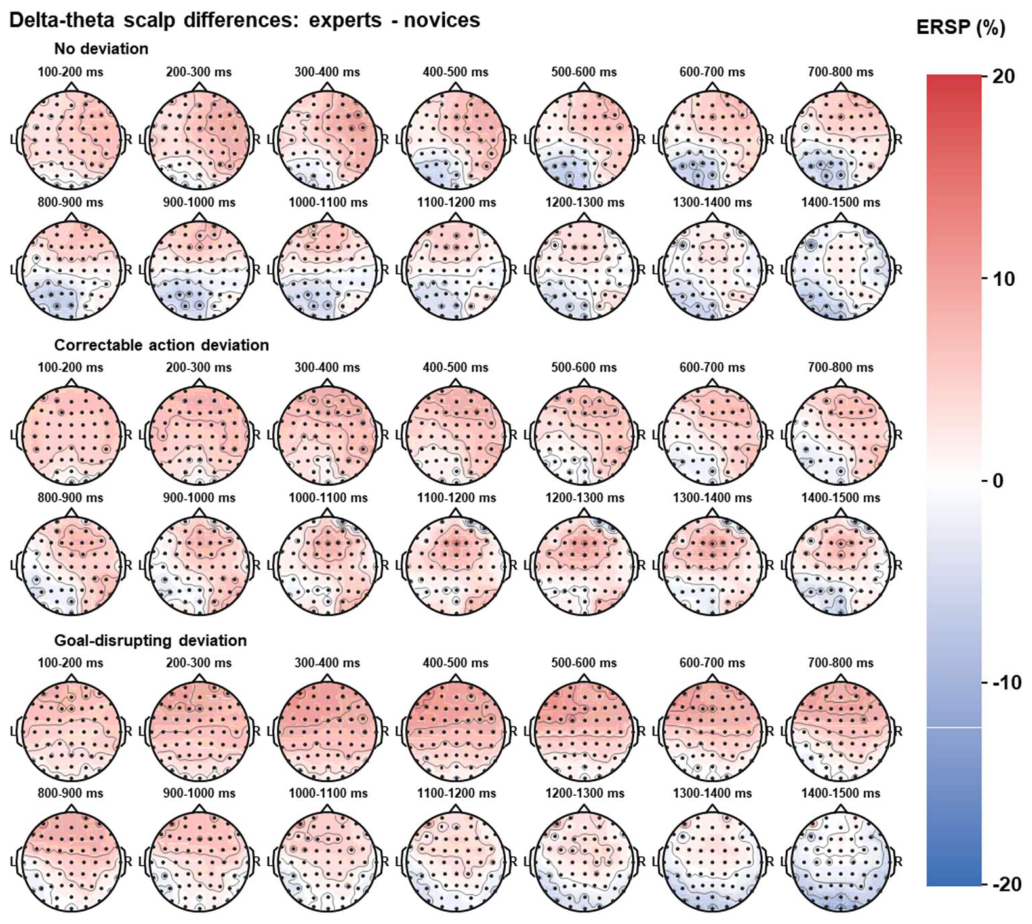
Figure 8.
Time course of delta–theta ERSP. Mean ERSP values from 2 to 6 Hz at FCz are shown across time windows for experts and novices in the three action-course conditions.
Figure 8.
Time course of delta–theta ERSP. Mean ERSP values from 2 to 6 Hz at FCz are shown across time windows for experts and novices in the three action-course conditions.
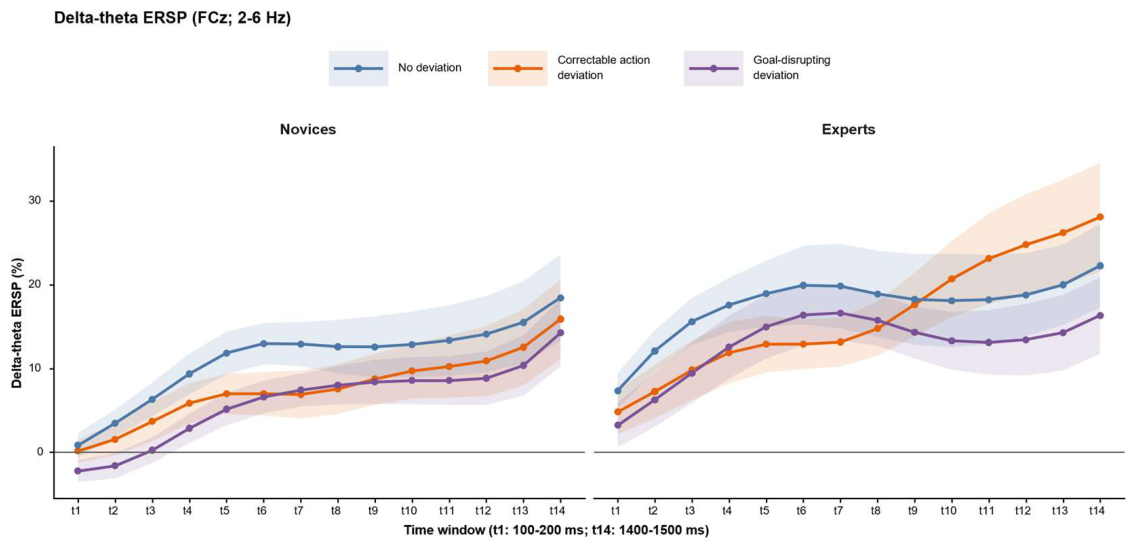
Figure 9.
Time-frequency power in the mu band (8–12 Hz). Mu-band ERSP values are shown across the sensorimotor electrodes (C3, C4, CP3, CP4, FC3, and FC4) for experts and novices.
Figure 9.
Time-frequency power in the mu band (8–12 Hz). Mu-band ERSP values are shown across the sensorimotor electrodes (C3, C4, CP3, CP4, FC3, and FC4) for experts and novices.
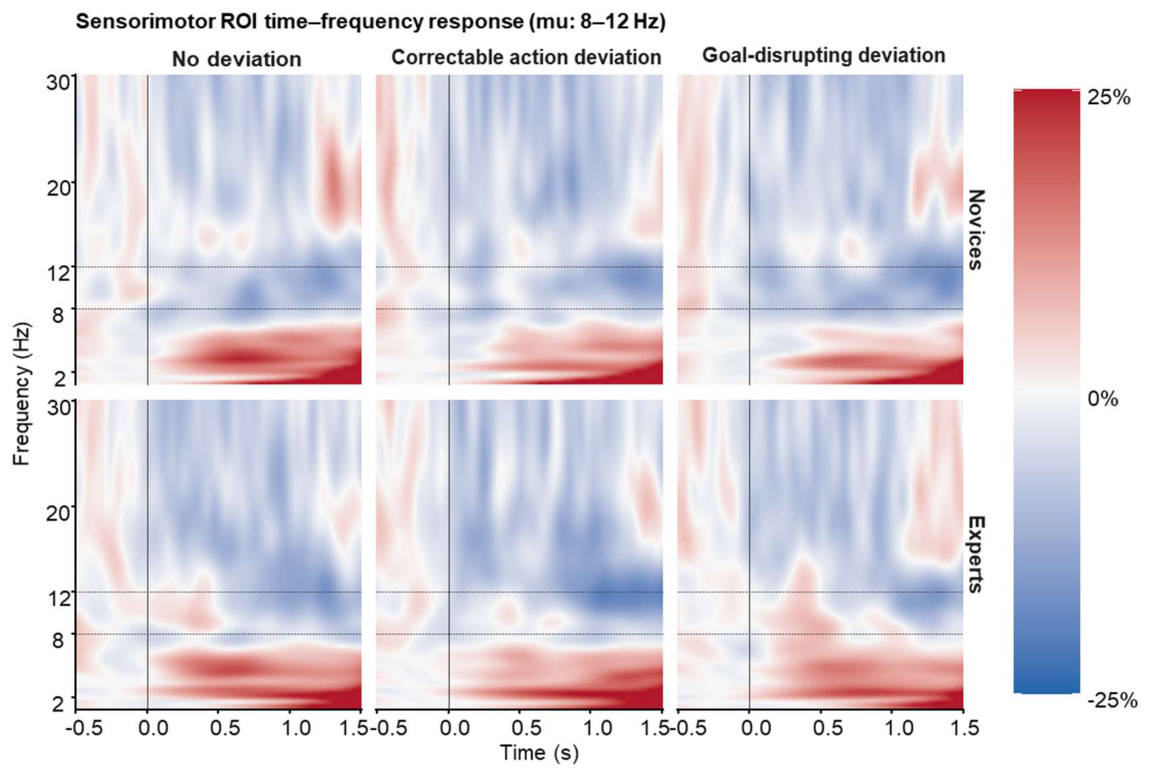
Figure 10.
Time course of mu-band ERSP. Mean sensorimotor mu-band ERSP values are shown across time windows for experts and novices in the three action course conditions.
Figure 10.
Time course of mu-band ERSP. Mean sensorimotor mu-band ERSP values are shown across time windows for experts and novices in the three action course conditions.
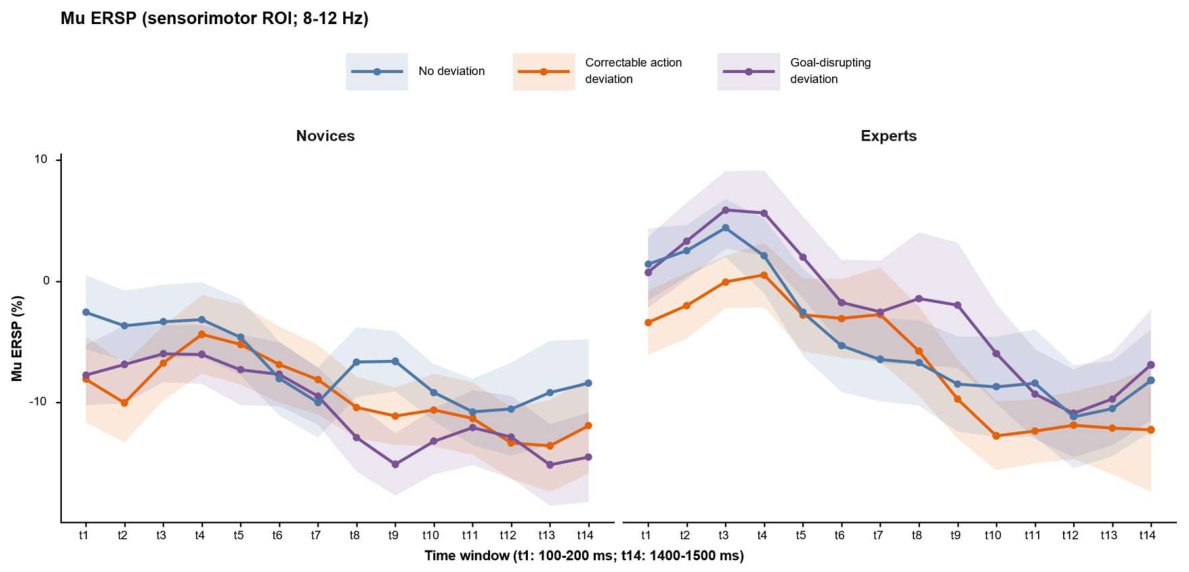
Figure 11.
Time-resolved pairwise decoding from whole-scalp ERP features. A, No deviation versus correctable action deviation. B, Correctable action deviation versus goal-disrupting deviation. C, No deviation versus goal-disrupting deviation. Lines show mean AUC and shading shows SEM; the dashed horizontal line marks chance (0.50), and time 0 marks racket–ball contact. Red bottom bars mark above-chance clusters in experts; gray vertical bands in C mark significant direct expert–novice differences. No novice above-chance cluster survived correction.
Figure 11.
Time-resolved pairwise decoding from whole-scalp ERP features. A, No deviation versus correctable action deviation. B, Correctable action deviation versus goal-disrupting deviation. C, No deviation versus goal-disrupting deviation. Lines show mean AUC and shading shows SEM; the dashed horizontal line marks chance (0.50), and time 0 marks racket–ball contact. Red bottom bars mark above-chance clusters in experts; gray vertical bands in C mark significant direct expert–novice differences. No novice above-chance cluster survived correction.
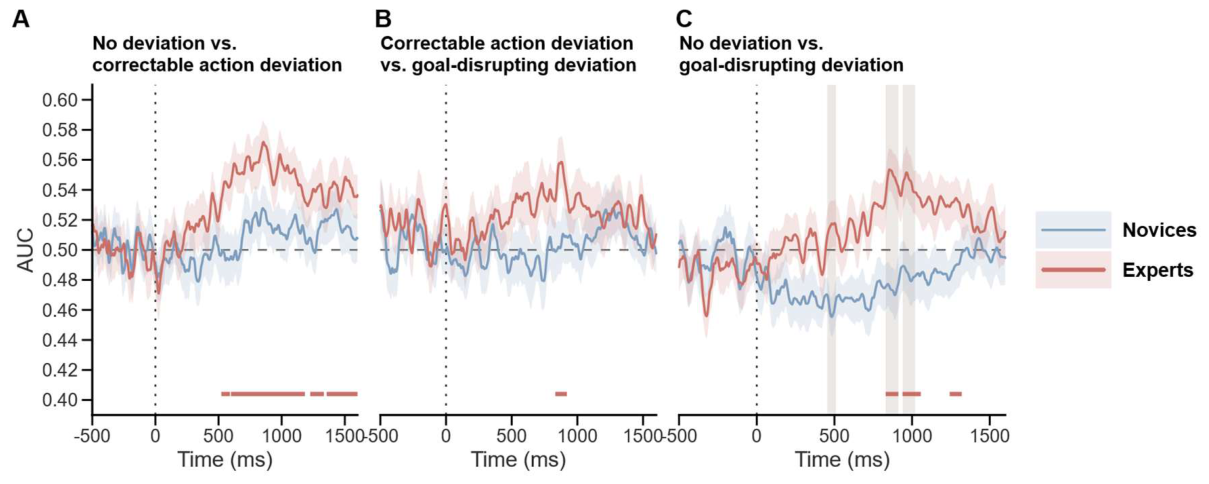
Figure 12.
Time-resolved pairwise decoding from FCz delta–theta power. A, No deviation versus correctable action deviation. B, Correctable action deviation versus goal-disrupting deviation. C, No deviation versus goal-disrupting deviation. Lines show mean AUC and shading shows SEM; the dashed horizontal line marks chance (0.50), and time 0 marks racket–ball contact. Red bottom bars mark above-chance clusters in experts. No cluster survived correction in novices or in the direct between-group comparisons.
Figure 12.
Time-resolved pairwise decoding from FCz delta–theta power. A, No deviation versus correctable action deviation. B, Correctable action deviation versus goal-disrupting deviation. C, No deviation versus goal-disrupting deviation. Lines show mean AUC and shading shows SEM; the dashed horizontal line marks chance (0.50), and time 0 marks racket–ball contact. Red bottom bars mark above-chance clusters in experts. No cluster survived correction in novices or in the direct between-group comparisons.
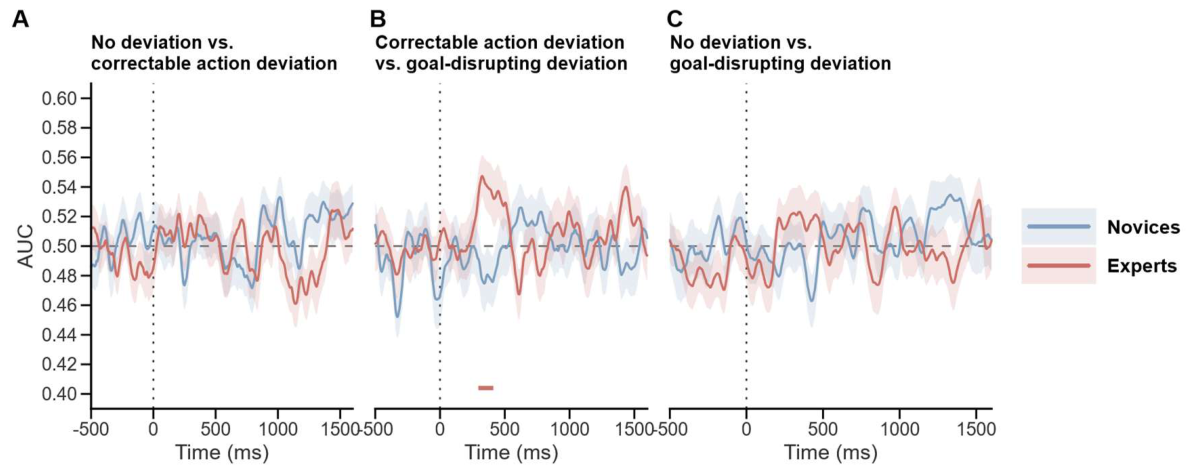
Table 1.
Participant characteristics.
| Characteristic | Novices | Experts |
|---|---|---|
| Sample size | 21 | 20 |
| Sex (male/female) | 10/11 | 12/8 |
| Age (years) | 21.43 ± 2.13 | 20.35 ± 2.25 |
| Training experience (years) | 0 | 10.45 ± 2.24 |
| Weekly training duration (h) | 0 | 6.80 ± 3.34 |
Table 2.
Descriptive statistics for accuracy by motor-expertise group and action course.
| Group | Action Course | N | M | SD |
|---|---|---|---|---|
| Novice | No deviation | 21 | 0.506 | 0.217 |
| Novice | Correctable action deviation | 21 | 0.580 | 0.221 |
| Novice | Goal-disrupting deviation | 21 | 0.121 | 0.114 |
| Expert | No deviation | 20 | 0.658 | 0.208 |
| Expert | Correctable action deviation | 20 | 0.731 | 0.161 |
| Expert | Goal-disrupting deviation | 20 | 0.250 | 0.170 |
Disclaimer/Publisher’s Note: The statements, opinions and data contained in all publications are solely those of the individual author(s) and contributor(s) and not of MDPI and/or the editor(s). MDPI and/or the editor(s) disclaim responsibility for any injury to people or property resulting from any ideas, methods, instructions or products referred to in the content. |
© 2026 by the authors. Licensee MDPI, Basel, Switzerland. This article is an open access article distributed under the terms and conditions of the Creative Commons Attribution (CC BY) license (http://creativecommons.org/licenses/by/4.0/).
Copyright: This open access article is published under a Creative Commons CC BY 4.0 license, which permit the free download, distribution, and reuse, provided that the author and preprint are cited in any reuse.