

Submitted:
20 August 2026
Posted:
21 August 2026
You are already at the latest version
Abstract
Rapid screening methods reflecting the metabolic profile of urine are promising for assessing the risk of decreased renal function in children with obstructive uropathies. The aim of this pilot study was to evaluate the applicability of a reaction-based fingerprinting strategy for this purpose, which has previously demonstrated its effectiveness in recognizing samples with similar composition. The study included 27 children with hydronephrosis (HN, 5 patients) and vesicoureteral reflux (VUR, 15 patients), as well as healthy children without urinary pathology who comprised the control group (7 patients). Supervised chemometric analysis demonstrated that standard clinical and laboratory indicators enabled discrimination of urine samples from children with HN and VUR from the control group; however, the recognition accuracy was only satisfactory, ranging from 79% to 86%. Using the kinetic variant of fingerprinting, six indicator reactions of different natures involving dyes were investigated, with absorbance and fluorescence of the reaction products monitored photographically throughout the reaction. The introduction of urine samples into the indicator reactions enabled discrimination of both diagnoses (VUR and HN) from the control group and from each other, with recognition accuracy reaching 100%. Furthermore, no correlation was observed between the results obtained using kinetic-based methods and standard clinical and laboratory indicators, which may reflect different levels of the pathological process, namely functional and molecular. Thus, the reaction-based optical fingerprinting strategy can be considered a promising approach for in-depth non-invasive diagnostics in pediatric urology.
Keywords:
obstructive uropathies
; urine metabolomics
; reaction-based fingerprinting
; chemometrics
; pediatric urology
1. Introduction
Congenital Anomalies of the Kidney and Urinary Tract (CAKUT) comprise a heterogeneous group of structural abnormalities resulting from defects in urinary system embryogenesis during the critical period of 3–10 weeks of gestation. This term encompasses a broad spectrum of malformations, among which obstructive uropathies, including hydronephrosis (HR), megaureter, and vesicoureteral reflux (VUR) [1,2], are of particular clinical significance.
The prevalence of CAKUT ranges from 1:200 to 1:500 newborns, making these anomalies one of the leading causes of chronic kidney disease (CKD) in childhood [3,4]. The clinical course of CAKUT is highly variable, ranging from asymptomatic disease to progressive deterioration of kidney function and the development of end-stage renal disease [5].
The major complications of obstructive and reflux uropathies include recurrent urinary tract infections (UTIs), nephrosclerosis, arterial hypertension, and progression of CKD. UTIs occurring in the setting of impaired urodynamics play an important role in the development of cicatricial changes in the renal parenchyma [6]. Renoparenchymal ischaemia and reflux nephropathy contribute to the development of arterial hypertension, which may manifest even during childhood [7]. According to current studies, up to 40–50% of cases of end-stage CKD in children requiring renal replacement therapy are associated with CAKUT syndrome [8]. The prognosis of the disease depends on several factors. First, the number of functioning nephrons may already be reduced at birth as a consequence of impaired nephrogenesis. Second, compensatory hyperfiltration in the remaining nephrons promotes progressive glomerular injury, proteinuria, and a subsequent decline in the glomerular filtration rate (GFR) at a later age [9].
Despite the widespread use of instrumental diagnostic methods, including ultrasound examination, voiding cystourethrography, and radionuclide studies, assessment of the functional state of the kidneys and differentiation of obstructive and reflux processes remain challenging. Standard clinical and laboratory indicators, such as leukocyturia, serum creatinine levels, and glomerular filtration rate, have limited specificity and may not adequately reflect the extent of pathological changes. In some cases, laboratory indicators remain within normal limits despite pronounced morphological abnormalities, thereby limiting the reliable differentiation of the underlying pathological process and the prediction of its clinical course [10].
In this context, the modern approach to patient management is shifting from a universal surgical strategy toward an individualized assessment of the risk of reduced kidney function. In recent years, increasing attention has been directed toward non-invasive diagnostic approaches based on alterations in the metabolome and proteome. These methods enable the detection of early biochemical changes associated with inflammation, oxidative stress, and fibrosis, which is particularly relevant in pediatric practice, where the use of invasive diagnostic procedures should be minimized [11,12,13]. Among the most convenient non-invasive approaches are those based on urine analysis. Urine composition is highly dynamic and age-dependent, which may facilitate more accurate disease characterization by accounting for the specific features of its course at different ages [14]. Furthermore, the concentrations of metabolites in urine are often higher than those in plasma, providing a richer matrix for analysis [15]. Urine analysis can also be used for disease monitoring and assessment of treatment effectiveness without causing discomfort to the patient [15,16].
When the metabolic profile is assessed in an integrated manner, the concentrations of individual compounds are not necessarily determined. Instead, so-called "fingerprints" of samples are obtained, which provide biochemical information about their composition. The profiles obtained from samples of patients with and without pathology can then be compared without requiring identification of individual compounds. In contrast to traditional chemical analysis, such approaches belong to the class of recognition methods.
Chromatographic methods and multisensor systems, such as the "electronic nose" (e-nose), can be used to obtain such "fingerprints". The latter is based on the detection of signals from volatile organic compounds (VOCs), which represent metabolic products of microorganisms and various endogenous processes, including oxidative stress. It has been demonstrated that e-nose can detect specific VOC profiles associated with bacterial urinary tract infection, including infections caused by E. coli, Proteus spp., and Pseudomonas aeruginosa, with high accuracy, enabling UTI diagnosis within minutes and thus substantially reducing the time required compared with traditional bacteriological culture [17,18]. Experimental data also suggest the potential of e-nose for assessing the degree of renal parenchyma damage through the detection of lipid peroxidation products; however, standardized protocols for its application in children with CAKUT are currently lacking.
Another promising approach to pattern recognition is the "electronic tongue" (e-tongue), a multisensor system designed to characterize the chemical composition of a solution. This method has been used for non-invasive monitoring of renal concentrating function, which is particularly relevant in children with obstructive uropathies accompanied by polyuria and impaired tubular reabsorption [19]. In addition, e-tongue technology can differentiate infectious from sterile inflammation, which may be important in the management of patients with recurrent pyelonephritis. Another potentially relevant clinical application is monitoring kidney function, including the early detection of microalbuminuria before it becomes detectable by standard tests [20].
In contrast to the aforementioned multisensor systems, fluorescence spectroscopy provides a biochemical profile of urine based on the detection of spectra from endogenous fluorophores, including tryptophan, NADH, porphyrins, collagen-like peptides, and lipid oxidation products. With the development of hypoxia and tubulointerstitial fibrosis, which are characteristic of obstructive and reflux uropathies, the relative contribution of these fluorophores changes and can be detected using multivariate analysis methods [21,22]. Thus, a "metabolomic fingerprint" can be generated that reflects the current state of the kidney parenchyma.
In recent years, advanced fluorescence-based sample recognition methods have been developed. For example, the addition of fluorophores to samples makes it possible to assess the effect of sample components on fluorophore emission intensity in combination with the intrinsic fluorescence of the samples. This approach expands the range of substances contributing to the signal and, consequently, the range of analytical problems that can be addressed [23,24]. A kinetic optical fingerprinting method has also been developed, based on recording changes in fluorescence and light absorption signals during an indicator reaction, such as dye oxidation [25,26]. This method has been applied, in particular, to the recognition of sera from healthy and cancer-inoculated mice [27]. The kinetic variant of optical recognition methods therefore appears promising for the examination of patients with CAKUT syndrome. Urine can be used as the sample material for this approach, potentially reducing radiation exposure by decreasing the need for radiological examinations, as well as reducing the number of invasive procedures, such as venous access and bladder catheterization.
New optical recognition methods, particularly when adapted for portable use and screening applications, may have potential in the diagnosis of asymptomatic infection, monitoring of kidney function, assessment of the type of urodynamic disorder, evaluation of treatment efficacy, and, most importantly, prediction of disease progression and personalization of treatment strategies, including the timing of surgical intervention. In particular, optical recognition methods may represent a convenient tool for the differential diagnosis of obstructive and reflux uropathies. Obstructive processes are predominantly associated with ischaemic damage and progressive tubulointerstitial fibrosis, whereas in vesicoureteral reflux, inflammatory changes and infectious factors play a more prominent role. These pathophysiological differences may be reflected in urine composition and consequently give rise to specific metabolomic patterns [28]. Optical profiling methods, including fluorimetry and photometry, offer several practical advantages: non-invasiveness, simplicity and cost-effectiveness, rapid acquisition of results, minimal sample preparation requirements, low sample consumption, and the possibility of repeated analyses, as well as the potential for the development of portable diagnostic devices [29,30].
Currently, data on the application of optical profiling methods in children with CAKUT remain limited, and standardized diagnostic criteria have not yet been established. Therefore, further investigation of optical urine profiling as a tool for the non-invasive diagnosis and differentiation of obstructive and reflux uropathies in children is warranted.
We hypothesize that the metabolic differences between obstructive uropathies, in which ischaemia and subsequent renal parenchyma fibrosis represent key pathogenetic links, and reflux uropathies, in which persistent chronic low-intensity inflammation contributes to nephrosclerosis, are reflected in urine composition and can be detected using the kinetic optical fingerprinting method. Accordingly, the aim of this study was to evaluate the diagnostic capability of this recognition approach for differentiating groups of obstructive and reflux uropathies in children and to determine its potential for assessing the risk of renal parenchyma damage.
2. Materials and Methods
2.1. Samples
The present pilot study on urine profiling (approved by the local ethics committee No. 259 of 16.03.2026) involved 27 children aged 0.5-7 years (control group – up to 12 years), undergoing examination and treatment in a specialized hospital. In all groups, male patients predominated. Patients were divided into three groups depending on the clinical diagnosis. The control group consisted of 7 children without urinary pathology (healthy controls), admitted for planned treatment for conditions such as phimosis, hydrocele of the testis, inguinal hernias, and who had normal urine test results, including the absence of leukocyturia and bacteriuria. The second group included 15 patients with a confirmed diagnosis of vesicoureteral reflux (VUR). The third group consisted of 5 patients with hydronephrosis.
All patients underwent a comprehensive clinical and laboratory examination, including history taking, physical examination, and standard laboratory methods. A complete blood count with determination of leukocyte count and erythrocyte sedimentation rate (ESR), a biochemical blood test with assessment of creatinine and urea concentrations, as well as determination of C-reactive protein level, were performed. Renal function was assessed by the estimated glomerular filtration rate (eGFR). A urinalysis with assessment of proteinuria and leukocyturia was also performed. Instrumental examination included ultrasound of the kidneys and urinary tract, voiding cystourethrography, excretory urography, and, in some cases, contrast-enhanced computed tomography of the kidneys to verify the diagnosis and determine the type of urodynamic impairment.
Biomaterial was collected in the morning after overnight fasting one day after admission, during which patients received a standard age-appropriate diet. A morning midstream urine sample collected in a sterile container was used. For urine collection in children under 1.5 years of age, adhesive urine collection bags attached to the perineal skin were used [31]. Samples were allowed to settle for 2 hours at room temperature to remove cellular elements, after which the supernatant was collected with a sterile syringe, transferred to Eppendorf tubes, labeled, and stored in a freezer at −20°C until analysis.
2.2. Methodology, Reagents and Instruments
When studying urine by the kinetic “fingerprint” method, samples were thawed by immersing the lower half of the tubes in water at room temperature. After thawing, 10 μL of the sample was introduced into a 96-well plate using a dispenser, into which the components of the indicator systems were also placed (conditions are given in Table 1). Each sample was tested in six replicates (in reaction A, in four replicates). Only one indicator reaction was carried out in one plate at a time. The moment of oxidant addition was taken as the reaction start time. In reactions A, B, D, and E, carbocyanine dyes were used (Figure 1). Dyes 1 and 2 were synthesized by the authors according to [32] and [33], respectively. Dye 3 was purchased from Lumiprobe, Russia. Gold nanoclusters stabilized with adenosine monophosphate [34] were used as catalysts for the oxidation of carbocyanine 1 by hydrogen peroxide (reaction D). In reaction G, chlorophyll isolated by the authors from spinach according to [35] was oxidized by hydrogen peroxide. Riboflavin was used as a photosensitizer in the oxidation of dye 1 by peroxide (Figure 1, reaction F).
Sigma-Aldrich reagents were used without further purification. Acetate buffer solutions were 0.1 M in acetate, and phosphate buffer solutions were 0.067 M in phosphate. Deionized water purified with an Ulupure system (Chengdu Ultrapure Technology, Chengdu, China), conductivity 18.2 MΩ·cm, was used to prepare solutions. Carbocyanine dyes were dissolved in 95% ethanol at a concentration of 1 mg/mL and stored at 4°C; diluted solutions were prepared on the day of the experiment by diluting the stock solutions with water.
After the start of the indicator reaction, the plate was photographed in different spectral ranges (1–4), depending on the reaction used (Table 1): (1) absorption/reflection of visible light; (2) fluorescence in the visible region excited at 254 nm; (3) the same, with excitation at 366 nm; (4) fluorescence in the near-IR region excited at 660 nm. Photographic images of the plate in ranges (1–3) were obtained using a Visualizer 2 (Camag, Switzerland), and in range (4) using a homemade visualizer in which red LEDs served as the light source, and photographs were taken with a Nikon D50 or Canon EOS 350D camera equipped with a 720 nm long-pass filter [36]. As the indicator reaction proceeded, photographs of the plate in each spectral range were obtained over 0.5–1.5 h. Examples of photographs of the plate with reaction mixtures are shown in Figure 2, and the general scheme of the experiment is given in Figure 3.
2.3. Data Processing
Photographs were digitized using the cloud-based software Chrometrica.ru developed by the authors [37]. The photographs were either subjected to RGB splitting, yielding three intensity channels, red, green, and blue (R, G, B), for each photo, or the overall image intensities were used (as specified in the text). The resulting intensity values for each indicator reaction were compiled into data tables in which the rows corresponded to samples (observations) and the columns corresponded to photographs taken at different time points in different spectral channels (depending on the nature of the indicator reaction, from 7 to 23 photographs were obtained over the entire reaction).
The data were processed using chemometric methods: principal component analysis (as an unsupervised method of data compression) and supervised methods with the following default parameter values: linear discriminant analysis (LDA) based on singular value decomposition with the number of discriminant components set to the minimum of the number of classes minus one and the number of features; softmax regression (SR) with L2 regularization, an inverse regularization strength equal to 1, and a maximum of 1000 iterations; k-nearest neighbors (kNN) with 5 neighbors, the Minkowski distance metric, and the Euclidean power parameter set to 2; a support vector machine classifier (SVM) with the inverse regularization strength fixed at 1; a random forest (RF) comprising 100 decision trees; partial least squares discriminant analysis (PLS-DA) in its hard classification version with varied number of latent variables to be optimized (2–9) and an error rate of 0.05; and soft independent modelling of class analogy (SIMCA) with 7 principal components and the same error rate. For logistic regression, kNN, PLS-DA, and SIMCA, the corresponding feature matrices were centered and scaled to unit variance prior to modelling.
To build chemometric models, the intensity values of replicate measurements were averaged for each urine sample (typically 6 replicates were used; accordingly, the number of rows in the data table was reduced by a factor of 6). The quality of classification was assessed by leave-one-out cross-validation, sequentially removing each sample from the model and calculating the overall classification accuracy (ACC) and, in the case of LDA, the area under the ROC curve (AUC). The averaged ACC or AUC values over all cross-validation folds are reported below as the number of correctly classified samples divided by the total number of samples: ACC = (TP + TN)/(TP + TN + FP + FN), where TP is the number of true positives (sick), TN – true negatives (controls), FP – false positives, FN – false negatives. ACC values in the range of 90–99% were considered “good,” 80–89% “satisfactory,” and below 80% “unsatisfactory” [38].
In most cases, sample discrimination was performed for two classes (e.g., all samples with uropathies vs. controls, or only samples with hydronephrosis vs. controls, etc.). Sensitivity (SENS) and specificity (SPEC) metrics were calculated using the standard formulas SENS = TP/(TP+FN), SPEC = TN/(TN+FP).
To assess the risk of overfitting and the statistical significance of the PLS-DA and LDA models, a permutation test (y-scrambling) was applied [39]. The test procedure consisted in randomly permuting (shuffling) the class label vector (Y) while keeping the feature matrix unchanged. For each of 200 permutations, the model (PLS-DA or LDA) was retrained using the same cross-validation scheme as for the original model, and the corresponding quality metrics were computed: for PLS-DA, the coefficient of determination R² (on calibration data) and the predictive ability coefficient Q² (from cross-validation results); for LDA, classification accuracy and/or AUC, also calculated on the calibration and cross-validation sets. The values obtained when training the model on unshuffled (original) data were referred to as “original.” For each permutation, the Pearson correlation coefficient between the permuted and original Y vector was additionally calculated. Based on the obtained points, a plot of model quality metrics versus the correlation coefficient with the original Y vector (permutation plot) was constructed; a regression line was fitted through the point cloud by the least squares method and extrapolated to the intersection with the ordinate axis (at a correlation score of 0), yielding the intercept value. For PLS-DA, the model was considered statistically significant and not overfitted if: (i) the original R² and Q² values exceeded 0.6; (ii) the R² intercept was below 0.3–0.4; (iii) the Q² intercept was negative. For LDA models, a permutation plot with regression lines and intercepts was constructed for AUC, and the original values were compared with the distribution of values obtained from permutations; the sign and magnitude of the intercepts were also examined. In addition, to assess the degree of overfitting of the LDA and PLS-DA models, p-values were calculated (the probability of randomly obtaining a model with quality no worse than the achieved one if the class labels are shuffled). They were determined as the fraction of permutations for which the metric value on the permuted data exceeded or equaled the original value of the quality metric (AUC for LDA and Q² for PLS-DA) obtained from cross-validation. The criterion for the absence of overfitting was a p-value below 0.05. All calculations were performed using the chrometrica.ru website.
3. Results
3.1. Use of Standard Clinical and Laboratory Parameters for the Recognition of Uropathies
To compare patient groups based on standard clinical and laboratory parameters using chemometric methods, data tables were compiled with samples represented by rows and variables by columns. The variables included age (years), sex (M – 1, F – 2), eGFR (mL/min/1.73 m2), and the following complete blood count parameters: leukocytes (× 103 µL–1), ESR (mm/h), urea (mmol/L), and creatinine (µmol/L) (Table S1). These parameters were selected because they were available for nearly all subjects. For the 9 missing values out of 189, the corresponding column mean was used. Proteinuria, leukocyturia, and elevated C-reactive protein were observed in only 1–3 patients and were therefore excluded from further analysis.
Principal component analysis of the initial data structure (Figure S1 in ESI) showed that the urine samples could not be reliably distinguished according to class (control, hydronephrosis, and VUR) based on standard clinical and laboratory parameters. Therefore, supervised chemometric methods were subsequently applied (Table 2). Discrimination of the samples into three classes according to diagnosis (control, hydronephrosis, and VUR) did not provide a satisfactory result, with an accuracy not exceeding 71%. Two-class discrimination performed better for samples from patients with VUR, which could be distinguished both from controls and from all other samples (control and hydronephrosis); however, the accuracy remained only satisfactory, not exceeding 86%. The two diagnoses, hydronephrosis and VUR, could be distinguished from each other with satisfactory accuracy (80%). In contrast, satisfactory discrimination could not be achieved when hydronephrosis samples were compared with either the control group or the combined [control + VUR] group, for which the accuracy did not exceed 73%. Thus, standard laboratory methods allowed discrimination only of VUR, and even in this case the accuracy was merely satisfactory.
3.2. Use of the Kinetic Optical Fingerprinting Method for the Recognition of Uropathies
3.2.1. Indicator Systems
The described variant of the optical method for recognizing samples of similar composition is based on the influence of sample components on the shape of the kinetic curve of an indicator reaction [26,27,40]. To encompass as broad a range of influencing compounds as possible, processes of different natures are tested as indicator reactions (Table 1). The sample (in this case, untreated patient urine) is mixed with the reaction components, and light absorption and fluorescence are measured in different spectral ranges by periodically photographing the contents of the wells of a 96-well plate. The intensity values obtained by digitizing the images are used as optical fingerprints of the samples, which can then be discriminated using chemometric methods. Such discrimination is based on the fact that samples differ in their metabolomic composition and that different compounds affect the course of indicator reactions in different ways. The mechanisms of such influence may include binding to the catalyst, scavenging of intermediate species (active centers) formed during radical chain reactions, and other processes.
Let us characterize the indicator reactions used in the study. Reactions A and C represent the oxidation of carbocyanine dyes 1 and 2 by hydrogen peroxide and hypochlorite, respectively, which have previously proven effective for the recognition of samples of various compositions [38]. Reaction B also involves the oxidation of dye 2; however, in this system, oxidation occurs through the photochemical generation of reactive oxygen species by photoexcited riboflavin. For this purpose, the system is irradiated with blue light (450 nm) during the reaction [41]. In reaction D, carbocyanine dye 3, bearing an attached hydrazide group, was used. This group interacts with o-phthalaldehyde (PDA) to form an azomethine [42]. In reaction E, chlorophyll isolated from spinach was used as the dye; this natural pigment had previously been used by us as an analytical reagent in paper [35]. Reaction F represents the oxidation of dye 1 by peroxide catalyzed by gold nanoclusters [34], which exhibit high reactivity toward organic compounds [43] and are capable of changing their catalytic activity under their influence.
3.2.2. Selection of Data Processing Conditions
To recognize urine samples from children with uropathies and control samples, indicator reactions A–F were carried out in the presence of the samples. The reaction mixtures in the plate were photographed in four spectral ranges: visible absorption and fluorescence excited at 254, 366, and 660 nm. Examples of the resulting plate images are presented in Figure 2, while examples of the results obtained by digitizing the photographs (kinetic reaction curves) in the presence of urine samples are shown in Figure 4.
The score plots of principal component analysis (an unsupervised method; Figure 5a, b) show that simple data compression is insufficient for recognizing uropathies and that supervised methods are therefore required. Further processing of the photographic data was performed using the 7 most common chemometric methods that have previously proven effective for recognizing samples of similar composition [44]. At the first stage, the data were processed automatically using the chrometrica.ru package (freeware) with the default method parameters specified in the Materials and Methods section, using the spectral ranges and processing type indicated in Table 1 for each reaction. The results showed that hydronephrosis could be distinguished from control samples with an accuracy of 98–99% and from VUR with an accuracy of 82–84% (Table S2). However, the results of the automated processing cannot be considered final for the following reasons.
First, recognition accuracy can be improved by manually varying the following parameters: (a) the spectral ranges subjected to processing, (b) the type of intensity values (overall intensity or RGB splitting of the image, hereinafter referred to as the “processing type”), and (c) the number of photographs processed for each reaction by excluding some of them. Second, it is necessary, especially when high accuracy values are obtained, to check the chemometric model for overfitting, which is frequently observed when the number of samples used is limited [45].
In view of the above, the criterion for selecting the conditions (a–c: spectral range, processing type, and number of photographs included in the data processing) was the maximum recognition accuracy in the absence of model overfitting. The results showed that there is no universal spectral range (a) or processing type (b); rather, these parameters must be selected separately for each classification task. (Thus, the optimal processing conditions differ, for example, when distinguishing VUR from control samples and hydronephrosis from non-hydronephrosis samples.) An example of the effect of the selected spectral range and processing type on the results is given in Table S3. It can be seen that high recognition accuracy (up to 100%) for VUR and hydronephrosis is generally achieved using LDA and PLS-DA methods. However, in the case of VUR recognition, this requires processing photographs of visible absorption, whereas for hydronephrosis recognition, photographs of fluorescence in the IR range are required. Thus, the maximum accuracy for different recognition tasks is achieved using different spectral ranges and processing types.
The number of photographs included in the processing also affects the recognition results. During the course of the indicator reaction, 7 to 23 photographs were obtained, depending on the nature of the reaction. However, many of the images contain duplicate information and essentially introduce noise; therefore, their removal can improve recognition accuracy. For example, using every third image increased the recognition accuracy of VUR by the LDA method from 67% (processing of all photographs) to 100% (processing of every third photograph, Table 3). At the same time, for the PLS-DA method, 100% accuracy was achieved both when all photographs were processed and when every second or third photograph was used, after which the accuracy decreased. It should also be taken into account that changing the number of processed photographs can alter the results of permutation tests even when the accuracy remains unchanged. In the case of reaction A, reducing the number of photographs from 23 to 16 did not affect the non-overfitting test of the PLS-DA model. However, reducing their number to 12 and then to 8 resulted in a greater number of permutations for which the Q2 value was above zero, while the trend line for R2 became higher than the original value at x = 1 (Table S7). Thus, reducing the number of processed photographs carries a risk of model overfitting. For other recognition tasks, the number of processed photographs had a weaker effect on accuracy (Table S4). In Table 5, we present the results obtained with a reduced number of photographs only when this improved the accuracy compared with the original set of photographs.
In addition to the above-described factors (a–c), the recognition results may be affected by whether replicate measurements of samples are averaged. The results showed that averaging can either improve or reduce recognition accuracy under otherwise identical processing conditions. Only in five recognition tasks (for reactions D and E) was the maximum accuracy achieved without averaging; however, it did not exceed 80% and was therefore considered unsatisfactory according to our criteria. Consequently, we excluded processing without averaging and present in Table 5 only the values obtained by averaging the replicate measurements for each sample.

Table 3.
Dependence of the recognition accuracy (%) of urine samples from patients with VUR and control samples on the number of processed photographs obtained in indicator reaction A.
Table 3.
Dependence of the recognition accuracy (%) of urine samples from patients with VUR and control samples on the number of processed photographs obtained in indicator reaction A.
| Images used in processing | Number of images | Chemometric method | |||||||
|---|---|---|---|---|---|---|---|---|---|
| kNN | LDA | SR | PLS-DA | RF | SIMCA | SVM | |||
| All | 23 | 60 | 67 | 67 | 100 | 53 | 87 | 33 | |
| 2/3* | 16 | 60 | 73 | 67 | 100 | 60 | 87 | 33 | |
| 1/2** | 12 | 60 | 93 | 67 | 100 | 60 | 60 | 33 | |
| 1/3 | 8 | 53 | 100 | 60 | 100 | 60 | 73 | 40 | |
| 1/4 | 6 | 53 | 80 | 60 | 80 | 60 | 53 | 53 | |
| 1/6 | 4 | 60 | 87 | 60 | 87 | 60 | 60 | 53 | |
| First and last | 2 | 67 | 60 | 60 | 60 | 67 | 47 | 20 | |
| First image | 1 | 67 | 67 | 60 | - | 47 | 53 | 67 | |
| Last image | 1 | 73 | 60 | 60 | - | 80 | 53 | 87 | |
* Each third image (at equal time intervals) was excluded from processing. ** Each second image was disregarded.
The selected conditions for processing the urine samples are summarized in Table 4, while the corresponding accuracy values for the recognition of uropathies under these conditions, together with the areas under the ROC curve obtained during cross-validation (CV AUC), are presented in Table 5. The highest accuracy values after optimization were obtained using the LDA and PLS-DA methods; the other methods yielded lower values. Therefore, Table 5 presents only the results obtained using LDA or PLS-DA. AUC values are provided for those systems in which the LDA method yielded higher accuracy, since overfitting of the LDA model was assessed using permutation tests with calculation of the AUC.
Table 4.
Conditions for processing photographic data of indicator reactions (spectral range* and RGB-splitting) that allowed obtaining the highest accuracy values for the recognition of uropathies, presented in Table 5.
Table 4.
Conditions for processing photographic data of indicator reactions (spectral range* and RGB-splitting) that allowed obtaining the highest accuracy values for the recognition of uropathies, presented in Table 5.
| Pairs of classes to recognize | Indicator reaction | |||||||||||
|---|---|---|---|---|---|---|---|---|---|---|---|---|
| A** | B | С | D | E | F | |||||||
| n*** | Spectral ranges* | RGB | n | Spectral ranges | RGB | n | n | RGB | n | RGB | ||
| HN | Control | 23 | 1–3 | N | 36 | 1 | N | 9 | 4 | Y | 7 | Y |
| HN | Control + VUR | 23 | 1 | N | 12 | 4 | Y | 13 | 4 | Y | 5 | Y |
| VUR | Control | 23 | 1–4 | Y | 47 | 1 | Y | 13 | 4 | Y | 4 | Y |
| VUR | Control + HN | 1 | 1–3 | N | 30 | 1 | N | 13 | 2 | Y | 4 | Y |
| HN + VUR | Control | 12 | 4 | Y | 11 | 1 | N | 5 | 2 | Y | 7 | N |
| HN | VUR | 16 | 1 | Y | 5 | 1 | N | 9 | 2 | N | 7 | Y |
| HN, VUR, control (3-class) |
12 | 1–3 | N | 30 | 1 | N | 13 | 2 | Y | 7 | Y | |
* (1) Absorption/reflection of visible light; (2) fluorescence in the visible region excited at 254 nm; (3) the same, with excitation at 366 nm; (4) fluorescence in the near-IR region excited at 660 nm. ** Spectral ranges, processing type, and number of processed photographs for reactions for which they are not indicated in the table: reaction A, 4 (no RGB-splitting); reaction D, 1 and 4 (with RGB-splitting); reaction E, 4; reaction F, 1 and 4 (with RGB-splitting), four images were processed. *** Number of processed photographs.
3.2.3. Results of Recognition of Uropathies by the Fluorimetric Fingerprinting Method
The obtained accuracy values are quite high. Thus, each of the two diagnoses (VUR and hydronephrosis), as well as the two diagnoses considered together, can be distinguished from the control group with an accuracy of 100%. Samples with hydronephrosis can likewise be distinguished from all other samples with 100% accuracy. In contrast, samples with VUR can be distinguished from all other samples only with “good” accuracy (93%), and only using reaction C. This can be explained by the fact that distinguishing the two uropathies from each other proved to be a more difficult task. Whereas samples with hydronephrosis could be separated from the control group using 4 indicator reactions, 100% accuracy in distinguishing the two uropathies from each other was achieved with only two indicator reactions. The attempt to recognize all three classes simultaneously (VUR, hydronephrosis, and the control group) was also successful, with an accuracy of 100%; however, this result was again achieved using only two indicator reactions.
Table 5.
Highest accuracy of recognition of uropathies (%) achieved in the study (the values of the areas under the ROC curves (AUC) are given in parentheses for LDA method).
Table 5.
Highest accuracy of recognition of uropathies (%) achieved in the study (the values of the areas under the ROC curves (AUC) are given in parentheses for LDA method).
| Pairs of classes to recognize | Indicator reaction | ||||||
|---|---|---|---|---|---|---|---|
| A | B | C | D | E | F | ||
| HN | Control |
100 (1.00) |
100 |
100 (1.00) |
100 | 70 | 91 |
| HN | Control + VUR |
85 (0.92) |
100 (1.00) |
100 |
93 (0.92) |
73 | 73 |
| VUR | Control | 100 | 100 |
100 (1.00) |
73 | 75 |
100 (1.00) |
| VUR | Control + HN | 70 |
86 (0.88) |
93 (0.93) |
73 | 60 | 67 |
| HN + VUR | Control | 100 |
100 (1.00) |
93 | 73 |
80 (0.93) |
93 (0.93) |
| HN | VUR | 91 |
100 (1.00) |
89 |
100 (1.00) |
63 | 78 |
| HN, VUR, control (3-class) | 100 | 100 | 80 | 86 | 48 | 53 | |
Note. The recognition accuracies obtained by the LDA and PLS-DA methods are presented. For all results obtained by the LDA method, the AUC values obtained during cross-validation are given in parentheses.
Methods with diagnostic value are usually characterized by sensitivity, as a measure of the absence of false-negative results, and specificity, as a measure of the absence of false-positive results. However, when the accuracy is 100% (Table 5), both characteristics are, naturally, also equal to 100%, making the sensitivity and specificity values uninformative. In the case where the accuracy was 93% (recognition of VUR and all other samples), the sensitivity and specificity were 100% and 91%, respectively.
It is important to note that the high accuracy values, especially 100%, as well as the area under the curve values equal to unity obtained using LDA and PLS-DA, could indicate overfitting of the models. Therefore, permutation tests were performed for all recognition tasks: for PLS-DA, based on the Q2 criterion, and for LDA, based on the area under the ROC curve (AUC). Table 5 presents only the values that passed the overfitting check; the corresponding procedure for assessing model quality is described in Section 2.3. Examples of permutation plots are shown in Figure 5 (a more complete set of plots corresponding to the results in Table 5 is provided in Table S5). Thus, for the LDA method (Figure 6a), the AUC obtained by cross-validation was 1.0, whereas for fully permuted data (at x = 0), it was 0.5, which corresponds to statistical guessing. In some data permutations, the AUC still reached a value of 1.0 (see the inset in the permutation plot); however, the fraction of such permutations, p, was small (the total number of permutations was 200). For the PLS-DA method (Figure 5f), a decrease in the coefficient of determination R2 from 1.0 for unpermuted data to −1.0 for fully permuted data was observed. A similar change was observed for the predictive ability coefficient Q2: the initial data yielded Q2 = 1.00, whereas after permutation, almost all Q2 values were negative; the intercepts for both R2 and Q2 were also negative. These results indicate the absence of model overfitting [39].
Thus, the results presented in Table 5 are based on chemometric models that passed the overfitting test. However, it should be noted that these models achieved high accuracy, in some cases 100%, with a limited number of samples (on the order of two dozen). Despite the demonstrated absence of overfitting, such models are unlikely to be highly robust and may, in principle, fail when applied to new samples. Nevertheless, this is a pilot study; in future work, the number of samples will be increased and new models will be constructed. Based on the present results, high recognition accuracy may also be achieved with larger sample sets. For a larger number of samples, these values may become more realistic, but are unlikely to fall below 90%.
Thus, the recognition of urine samples using the fluorimetric method demonstrated high diagnostic efficiency. Indicator reactions were identified that allowed urine samples from conditionally healthy children and patients with hydronephrosis, as well as urine samples from control children and patients with vesicoureteral reflux, to be distinguished with an accuracy of up to 100%. The possibility of distinguishing all patients with uropathies (VUR or hydronephrosis) from conditionally healthy children, as well as distinguishing the two uropathies from each other, was demonstrated. At the same time, it should be noted that all recognition metrics obtained in this study pertain only to the limited set of samples investigated. Therefore, practical application of the method for diagnostic purposes will require further studies using larger sample sets.
3.2. Correlations of the Kinetic Fingerprinting Method and Standard Clinical and Laboratory Parameters
For the indicator reactions that provided the most effective recognition of pathologies, correlations between the results and the standard clinical and laboratory parameters of the samples were investigated. Table 6 presents the correlation coefficients of the first discriminant analysis factors (or the values of the first latent variables of the PLS-DA method) with these parameters for different recognition tasks (VUR – control, VUR – all other samples, hydronephrosis – control, and hydronephrosis – all other samples) in those cases where complete recognition was achieved.
As shown in Table 6, no correlation was observed between the results of the kinetic fingerprinting method and the standard clinical and laboratory parameters. The laboratory parameters themselves were only weakly correlated with each other (the corresponding results are presented in Table S6). The absence of correlations with the results of the proposed method indicates that it provides fundamentally different information about the samples compared with standard laboratory tests. Thus, the kinetic fingerprinting method makes it possible to obtain new, independent characteristics of the samples.
4. Discussion
The obtained results confirm the limited diagnostic value of standard clinical and laboratory methods for the differential diagnosis of urological pathology in children. The similarity of parameter values between different groups is consistent with literature data indicating the low sensitivity of traditional laboratory markers at the early stages of urinary tract diseases [46,47]. In contrast, metabolomic analysis of urine makes it possible to detect more subtle biochemical changes associated with metabolic and inflammatory processes at the preclinical level [48,49]. A number of studies have demonstrated that metabolomic profiles can be used for the diagnosis and prediction of kidney diseases [50,51,52,53,54,55,56]. For example, different stages of renal cell carcinoma were differentiated using metabolomic analysis with an accuracy of 86–87% [51], while diabetic kidney disease [54], chronic kidney disease [55], and acute kidney injury in prenatal babies [50] were recognized with area under the receiver operating characteristic curve (AUC) values of 0.80–0.94. In our study, the typical AUC values were 0.9–1.0 (Table 6). Thus, the accuracy achieved by our method in distinguishing healthy and diseased children is comparable to or exceeds that reported in these studies.
The absence of correlations between metabolomic parameters and standard laboratory parameters indicates that these two groups of methods reflect different levels of the pathological process—functional and molecular—and suggests that the information obtained from them is largely independent, thereby complementing existing diagnostic methods [49,57,58].
Our pilot study has several limitations that should be acknowledged. One of them is related to the small sample size, particularly in the hydronephrosis group (n = 5), which necessitates validation of the obtained classification models on an independent test cohort to exclude the possibility of overfitting. In addition, the metabolomic composition of urine in young children may depend on the type of feeding, intake of vitamin preparations, and other factors, making standardization of biomaterial collection conditions necessary. A limitation of the optical fingerprinting method itself results from its high sensitivity: the reproducibility of the results on different days is limited, which complicates the formation of databases for further practical application [38]. Therefore, it is necessary to search for indicator systems that provide an optimal combination of sensitivity to a wide range of analytes and signal stability.
5. Conclusions
Standard clinical and laboratory parameters in children with vesicoureteral reflux and hydronephrosis, when analyzed using nonparametric statistical methods, demonstrate substantial overlap between the groups and, even when chemometric methods are applied, provide a recognition accuracy of no more than 82%. This does not allow reliable differential diagnosis of these uropathies. In contrast, fluorimetric profiling of urine using the kinetic fingerprinting method provides substantially higher diagnostic accuracy, reaching 100%, and makes it possible to detect pathological changes at a qualitatively different level. This approach can be considered a promising direction for advanced non-invasive diagnostics in pediatric urology and, with an increase in the number of analyzed samples, may facilitate differentiation of the type of pathology and the degree of urinary tract obstruction.
Supplementary Materials
The following supporting information can be downloaded at the website of this paper posted on Preprints.org, Table S1. Standard clinical laboratory parameters of patients; Figure S1. Principal component analysis score plot for standard laboratory parameters; Figure S2. Results of digitizing photographs obtained at different reaction time points; Table S2. Accuracy of recognition of uropathies by processing optical kinetic data using a default parameter set; Table S3. Effect of spectral data range and processing type on the accuracy of uropathies recognition; Table S4. Recognition accuracy (%) of urine samples as a function of the number of processed photographs; Table S5. Permutation plots for the chemometric models that yielded the highest accuracy in recognizing uropathies; Table S6. Correlation coefficients of standard laboratory parameters of patients with the characteristics of the fingerprinting method and among themselves.
Author Contributions
Conceptualization, M.K.B. and O.L.M.; methodology, E.Y.D., O.L.M. and M.K.B.; software, R.M.A.; validation, A.A.L.; investigation, A.A.L., M.A.K., D.A.P., E.Y.D., data curation, A.A.L. and R.M.A.; writing—original draft preparation, G.I.K. and A.A.L.; writing—review and editing, M.K.B. and O.L.M.; visualization, A.A.L., M.A.K. and D.A.P.; supervision, D.A.M. All authors have read and agreed to the published version of the manuscript.
Funding
The work was financed by Lomonosov Moscow State University, state contract No. AAAA-A21-121011990021-7.
Institutional Review Board Statement
The study was conducted in accordance with the Declaration of Helsinki and approved by the Local Ethics Committee of Pirogov Russian National Research Medical University (protocol no 259, March 16th, 2026).
Informed Consent Statement
Informed consent was obtained from all subjects involved in the study. Written informed consent has been obtained from the patients’ parents.
Data Availability Statement
The software used in this study is freeware (chrometrica.ru). Data obtained in addition to those indicated in the text and ESI may be provided by the authors upon reasonable request.
Acknowledgments
The authors thank the researchers of the Chemistry Department of Lomonosov Moscow State University: I.A. Solovova (Doroshenko) and T.A. Podrugina for providing dyes 1 and 2 and E.A. Karpushkin and A.S. Gubanov for providing gold nanoclusters.
Conflicts of Interest
The authors declare no conflicts of interest.
Abbreviations
The following abbreviations are used in this manuscript:
| VUR | Vesicoureteral reflux |
| HN | Hydronephrosis |
| CKD | Chronic kidney disease |
| GFR | Glomerular filtration rate |
| CAKUT | Congenital Anomalies of the Kidney and Urinary Tract |
| kNN | k-nearest neighbors |
| LDA | Linear discriminant analysis |
| SR | Softmax regression |
| RF | Random forest |
| PLS-DA | Partial least squares discriminant analysis |
| SIMCA | Soft independent modelling of class analogy |
| SVM | Support vector machine |
References
- Chang, Y.-M.; Chen, C.-C.; Lee, N.-C.; Sung, J.-M.; Chou, Y.-Y.; Chiou, Y.-Y. PAX2 Mutation-Related Renal Hypodysplasia: Review of the Literature and Three Case Reports. Front. Pediatr. 2022, 9, 765929. [Google Scholar] [CrossRef] [PubMed]
- Kagan, M.; Pleniceanu, O.; Vivante, A. The Genetic Basis of Congenital Anomalies of the Kidney and Urinary Tract. Pediatr. Nephrol. 2022, 37, 2231–2243. [Google Scholar] [CrossRef] [PubMed]
- Sanna-Cherchi, S.; Westland, R.; Ghiggeri, G.M.; Gharavi, A.G. Genetic Basis of Human Congenital Anomalies of the Kidney and Urinary Tract. J. Clin. Invest. 2018, 128, 4–15. [Google Scholar] [CrossRef] [PubMed]
- Harambat, J.; van Stralen, K.J.; Kim, J.J.; Tizard, E.J. Epidemiology of Chronic Kidney Disease in Children. Pediatr. Nephrol. 2021, 36, 253–268. [Google Scholar] [CrossRef] [PubMed]
- Mattoo, T.K.; Mohammad, D. Primary Vesicoureteral Reflux and Renal Scarring. Pediatr. Clin. North Am. 2022, 69, 1115–1129. [Google Scholar] [CrossRef] [PubMed]
- Shaikh, N.; Osio, V.; Wessel, C.; et al. Prevalence of Asymptomatic Bacteriuria in Children: A Meta-Analysis. J. Pediatr. 2019, 217, 110–117. [Google Scholar] [CrossRef] [PubMed]
- Flynn, J.T. Hypertension in Pediatric Kidney Disease. Kidney Int. 2021, 99, 1027–1036. [Google Scholar] [CrossRef] [PubMed]
- Chesnaye, N.C.; Schaefer, F.; Groothoff, J.W.; et al. Mortality Risk in European Children with End-Stage Renal Disease on Dialysis. Kidney Int. 2016, 89, 1355–1362. [Google Scholar] [CrossRef] [PubMed]
- Adebayo, O.C.; Nkoy, A.B.; van den Heuvel, L.P.; et al. Glomerular Hyperfiltration: Part 2—Clinical Significance in Children. Pediatr. Nephrol. 2023, 38, 2529–2547. [Google Scholar] [CrossRef] [PubMed]
- Schaefer, F.; Greenbaum, L.A. (Eds.) Pediatric Kidney Disease; Springer: Cham, Switzerland, 2023. [Google Scholar] [CrossRef]
- Zhao, Y.; Yavari, K.; Liu, J. Critical Evaluation of Aptamer Binding for Biosensor Designs. TrAC Trends Anal. Chem. 2022, 146, 116480. [Google Scholar] [CrossRef]
- Zhang, W.R.; Parikh, C.R. Biomarkers of Acute and Chronic Kidney Disease. Annu. Rev. Physiol. 2019, 81, 309–333. [Google Scholar] [CrossRef] [PubMed]
- Wolfbeis, O.S. An Overview of Nanoparticles Commonly Used in Fluorescent Bioimaging. Chem. Soc. Rev. 2015, 44, 4743–4768. [Google Scholar] [CrossRef] [PubMed]
- Chiu, C.Y.; Yeh, K.W.; Lin, G.; Chiang, M.H.; Yang, S.C.; Chao, W.J.; et al. Metabolomics Reveals Dynamic Metabolic Changes Associated with Age in Early Childhood. PLoS ONE 2016, 11, e0149823. [Google Scholar] [CrossRef] [PubMed]
- Khamis, M.M.; Adamko, D.J.; El-Aneed, A. Mass Spectrometric Based Approaches in Urine Metabolomics and Biomarker Discovery. Mass Spectrom. Rev. 2017, 36, 115–134. [Google Scholar] [CrossRef] [PubMed]
- Zhang, A.; Sun, H.; Wu, X.; Wang, X. Urine Metabolomics. Clin. Chim. Acta 2012, 414, 65–69. [Google Scholar] [CrossRef] [PubMed]
- de la Rica-Martinez, A.; Martínez-Muñoz, G.; Sanjuan, M.A.; Conesa-Celdrán, A.; Garcia-Moreno, L.; Estan-Cerezo, G.; Oates, M.J.; Gonzalo-Jimenez, N.; Ruiz-Canales, A. Low-Cost Electronic Nose for the Determination of Urinary Infections. Sensors 2023, 24, 157. [Google Scholar] [CrossRef] [PubMed]
- Kuchmenko, T.; Menzhulina, D.; Shuba, A. Noninvasive Detection of Bacterial Infection in Children Using Piezoelectric E-Nose. Sensors 2022, 22, 8496. [Google Scholar] [CrossRef] [PubMed]
- Pauliukaite, R.; Voitechovič, E. Multisensor Systems and Arrays for Medical Applications Employing Naturally-Occurring Compounds and Materials. Sensors 2020, 20, 3551. [Google Scholar] [CrossRef] [PubMed]
- Vlasov, Yu.G.; Legin, A.V.; Rudnitskaya, A.M. Multisensor Systems of the Electronic Tongue Type as Novel Opportunities in Design and Application of Chemical Sensors. Russ. Chem. Rev. 2006, 75, 125–132. [Google Scholar] [CrossRef]
- Lakowicz, J.R. Principles of Fluorescence Spectroscopy, 3rd ed.; Springer: New York, NY, USA, 2020. [Google Scholar] [CrossRef]
- Sarmanova, O.E.; Kudryashov, A.D.; Laptinskiy, K.A.; et al. Applications of Fluorescence Spectroscopy and Machine Learning Methods for Monitoring of Elimination of Carbon Nanoagents from the Body. Opt. Mem. Neural Netw. 2023, 32, 20–33. [Google Scholar] [CrossRef]
- Miranda, O.R.; You, C.-C.; Phillips, R.; Kim, I.-B.; Ghosh, P.S.; Bunz, U.H.F.; Rotello, V.M. Array-Based Sensing of Proteins Using Conjugated Polymers. J. Am. Chem. Soc. 2007, 129, 9856–9857. [Google Scholar] [CrossRef] [PubMed]
- Rukosueva, E.A.; Dobrolyubov, E.O.; Goryacheva, I.Y.; Beklemishev, M.K. Discrimination of Whiskies Using an “Add-a-Fluorophore” Fluorescent Fingerprinting Strategy. Microchem. J. 2019, 145, 397–405. [Google Scholar] [CrossRef]
- Shariati-Rad, M.; Mozaffari, Y. Water Discrimination Based on the Kinetic Variations of AgNP Spectrum. RSC Adv. 2020, 10, 34459–34465. [Google Scholar] [CrossRef] [PubMed]
- Stepanova, I.A.; Lebedeva, A.N.; Shik, A.V.; Skorobogatov, E.V.; Beklemishev, M.K. Recognition and Determination of Sulfonamides by Near-IR Fluorimetry Using Their Effect on the Rate of the Catalytic Oxidation of a Carbocyanine Dye by Hydrogen Peroxide. J. Anal. Chem. 2021, 76, 1399–1407. [Google Scholar] [CrossRef]
- Ustyuzhanin, A.O.; Skorobogatov, E.V.; Babaeva, G.; Pokrovsky, V.S.; Doroshenko, I.A.; Podrugina, T.A.; Filatova, D.G.; Beklemishev, M.K. Recognition of Cancer in Mice by TXRF and Reaction-Based Optical Fingerprinting of Blood Plasma. Anal. Chim. Acta 2026, 1417, 345819. [Google Scholar] [CrossRef] [PubMed]
- Huang, G. Advances in Metabolomics Profiling of Pediatric Kidney Diseases: A Review. Biomol. Biomed. 2024, 24, 1044. [Google Scholar] [CrossRef] [PubMed]
- Nath, P.; Mahtaba, K.R.; Ray, A. Fluorescence-Based Portable Assays for Detection of Biological and Chemical Analytes. Sensors 2023, 23, 5053. [Google Scholar] [CrossRef] [PubMed]
- Lazarou, C.; Moysidou, E.; Christodoulou, M.; Lioulios, G.; Sampani, E.; Dimitriadis, C.; Fylaktou, A.; Stangou, M. Non-Invasive Biomarkers for Early Diagnosis of Kidney Allograft Dysfunction: Current and Future Applications in the Era of Precision Medicine. Medicina 2025, 61, 262. [Google Scholar] [CrossRef] [PubMed]
- Stankovic, A.K.; DiLauri, E. Quality Improvements in the Preanalytical Phase: Focus on Urine Specimen Workflow. Clin. Lab. Med. 2008, 28, 339–350. [Google Scholar] [CrossRef] [PubMed]
- Doroshenko, I.A.; Aminulla, K.G.; Azev, V.N.; Kulinich, T.M.; Vasilichin, V.A.; Shtil, A.A.; Podrugina, T.A. Synthesis of Modified Conformationally Fixed Tricarbocyanine Dyes for Conjugation with Therapeutic Agents. Mendeleev Commun. 2021, 31, 615–617. [Google Scholar] [CrossRef]
- Narayanan, N.; Patonay, G. A New Method for the Synthesis of Heptamethine Cyanine Dyes: Synthesis of New Near-Infrared Fluorescent Labels. J. Org. Chem. 1995, 60, 2391–2395. [Google Scholar] [CrossRef]
- Karpushkin, E.A.; Ivanova, N.K.; Mesnyankina, E.A.; Sergeyev, V.G. Synthesis of Fluorescent Gold Nanoclusters in the Presence of Adenosine Monophosphate: Effect of Azide Ions. Mendeleev Commun. 2024, 34, 78–80. [Google Scholar] [CrossRef]
- Zakharenkova, S.A.; Dobrovolskii, A.A.; Garshev, A.V.; Statkus, M.A.; Beklemishev, M.K. Chlorophyll-Based Self-Assembled Nanostructures for Fluorescent Sensing of Aminoglycoside Antibiotics. ACS Sustain. Chem. Eng. 2021, 9, 3408–3415. [Google Scholar] [CrossRef]
- Zakharenkova, S.A.; Katkova, E.A.; Doroshenko, I.A.; Kriveleva, A.S.; Lebedeva, A.N.; Vidinchuk, T.A.; Shik, A.V.; Abramchuk, S.S.; Podrugina, T.A.; Beklemishev, M.K. Aggregation-Based Fluorescence Amplification Strategy: “Turn-On” Sensing of Aminoglycosides Using Near-IR Carbocyanine Dyes and Pre-Micellar Surfactants. Spectrochim. Acta A 2021, 247, 119109. [Google Scholar] [CrossRef] [PubMed]
- Akhmetov, R.M. Chrometrica (Freeware). Available online: https://chrometrica.ru (accessed on 20 August 2026).
- Shik, A.V.; Stepanova, I.A.; Doroshenko, I.A.; Bliznyuk, U.A.; Podrugina, T.A.; Chernyaev, A.P.; Rodin, I.A.; Beklemishev, M.K. Recognition of Samples of Similar Composition Using Kinetic-Based Optical Fingerprinting Strategy: Choice of Indicator Reactions. Talanta 2026, 308, 129805. [Google Scholar] [CrossRef] [PubMed]
- Westerhuis, J.A.; Hoefsloot, H.C.; Smit, S.; Vis, D.J.; Smilde, A.K.; Van Velzen, E.J.; van Duijnhoven, J.P.M.; Van Dorsten, F.A. Assessment of PLSDA Cross Validation. Metabolomics 2008, 4, 81–89. [Google Scholar] [CrossRef]
- Shik, A.V.; Stepanova, I.A.; Koksharova, M.V.; Doroshenko, I.A.; Podrugina, T.A.; Bliznyuk, U.A.; Borshchegovskaya, P.Y.; Chernyaev, A.P.; Ananieva, I.A.; Rodin, I.A.; Beklemishev, M.K. Estimation of Irradiation Doses in Chicken Samples Using a Reaction-Based Fingerprinting Method. Food Chem. 2025, 482, 144073. [Google Scholar] [CrossRef] [PubMed]
- Liang, J.Y.; Yuann, J.M.P.; Hsie, Z.J.; Huang, S.T.; Chen, C.C. Blue Light Induced Free Radicals from Riboflavin in Degradation of Crystal Violet by Microbial Viability Evaluation. J. Photochem. Photobiol. B 2017, 174, 355–363. [Google Scholar] [CrossRef] [PubMed]
- Zhang, Y.; Huang, Y.; Yue, Y.; Chao, J.; Huo, F.; Yin, C. A Compact Fluorescent Probe Based on o-Phthalaldehyde for Ultrasensitive Detection of Hydrazine in Gas and Solution Phases. Sens. Actuators B 2018, 273, 944–950. [Google Scholar] [CrossRef]
- Yang, W.; Wang, S.; Wei, X.; Feng, Z.; Qin, G.; Mao, J.; Zheng, Z.; Miao, X.; Cheng, Y.; Wang, X.; et al. Ligand-Regulated Catalytic Activity in Fluorescent Gold Nanoclusters. Inorg. Chem. Front. 2024, 11, 6396–6405. [Google Scholar] [CrossRef]
- Lackey, H.E.; Sell, R.L.; Nelson, G.L.; Bryan, T.A.; Lines, A.M.; Bryan, S.A. Practical Guide to Chemometric Analysis of Optical Spectroscopic Data. J. Chem. Educ. 2023, 100, 2608–2626. [Google Scholar] [CrossRef]
- Ruiz-Perez, D.; Guan, H.; Madhivanan, P.; Mathee, K.; Narasimhan, G. So You Think You Can PLS-DA? BMC Bioinform. 2020, 21 (Suppl. 1), 2. [Google Scholar] [CrossRef] [PubMed]
- Vaidyanathan, K. Urinary Proteomics and Metabolomics in the Diagnosis of Pediatric Disorders. Proteom. Clin. Appl. 2015, 9, 482–489. [Google Scholar] [CrossRef] [PubMed]
- Chen, Z.; Kim, J. Urinary Proteomics and Metabolomics Studies to Monitor Bladder Health and Urological Diseases. BMC Urol. 2016, 16, 11. [Google Scholar] [CrossRef] [PubMed]
- Carraro, S.; Giordano, G.; Reniero, F.; et al. Metabolomics: A New Frontier for Research in Pediatrics. J. Pediatr. 2009, 154, 638–644. [Google Scholar] [CrossRef] [PubMed]
- Riccio, S.; Valentino, M.S.; Passaro, A.P.; Izzo, M.; Guarino, S.; Miraglia del Giudice, E.; Marzuillo, P.; Di Sessa, A. New Insights from Metabolomics in Pediatric Renal Diseases. Children 2022, 9, 118. [Google Scholar] [CrossRef] [PubMed]
- Niesert, M.; Cannet, C.; Fichtner, A.; et al. Urinary Metabolomics Predict Acute Kidney Injury in Very-Low-Birth-Weight Infants with Patent Ductus Arteriosus. Biomolecules 2026, 16, 391. [Google Scholar] [CrossRef] [PubMed]
- Bifarin, O.O.; Gaul, D.A.; Sah, S.; et al. Urine-Based Metabolomics and Machine Learning Reveals Metabolites Associated with Renal Cell Carcinoma Stage. Cancers 2021, 13, 6253. [Google Scholar] [CrossRef] [PubMed]
- Wen, J.; Cao, Y.; Li, Y.; et al. Metabolomics Analysis of the Serum from Children with Urolithiasis Using UPLC-MS. Clin. Transl. Sci. 2021, 14, 1327–1337. [Google Scholar] [CrossRef] [PubMed]
- Baskaran, K.; Moshkovich, M.; Hart, L.; et al. The Role of Urine Metabolomics in the Diagnosis and Management of Pediatric Diseases. Biomarkers 2025, 30, 1. [Google Scholar] [CrossRef] [PubMed]
- Hu, Y.; Ni, X.; Chen, Q.; Qu, Y.; Chen, K.; Zhu, G.; Zhang, M.; Xu, N.; Bai, X.; Wang, J.; et al. Predicting Diabetic Kidney Disease with Serum Metabolomics and Gut Microbiota. Sci. Rep. 2025, 15, 12179. [Google Scholar] [CrossRef] [PubMed]
- Chasapi, S.A.; Karagkouni, E.; Kalavrizioti, D.; Vamvakas, S.; Zompra, A.; Takis, P.G.; Goumenos, D.S.; Spyroulias, G.A. NMR-Based Metabolomics in Differential Diagnosis of Chronic Kidney Disease (CKD) Subtypes. Metabolites 2022, 12, 490. [Google Scholar] [CrossRef] [PubMed]
- Posada-Ayala, M.; Zubiri, I.; Martin-Lorenzo, M.; Sanz-Maroto, A.; Molero, D.; Gonzalez-Calero, L.; Fernandez-Fernandez, B.; de la Cuesta, F.; Laborde, C.M.; Barderas, M.G.; et al. Identification of a Urine Metabolomic Signature in Patients with Advanced-Stage Chronic Kidney Disease. Kidney Int. 2014, 85, 103–111. [Google Scholar] [CrossRef] [PubMed]
- Drube, J.; Schiffer, E.; Lau, E.; et al. Urinary Proteome Analysis to Exclude Severe Vesicoureteral Reflux. Pediatrics 2012, 129, e356–e363. [Google Scholar] [CrossRef] [PubMed]
- Dong, B.; Jia, J.; Hu, W.; et al. Application of 1H NMR Metabonomics in Predicting Renal Function Recoverability after Obstructive Uropathy. Clin. Biochem. 2013, 46, 346–353. [Google Scholar] [CrossRef] [PubMed]
Figure 1.
Structures of the dyes.
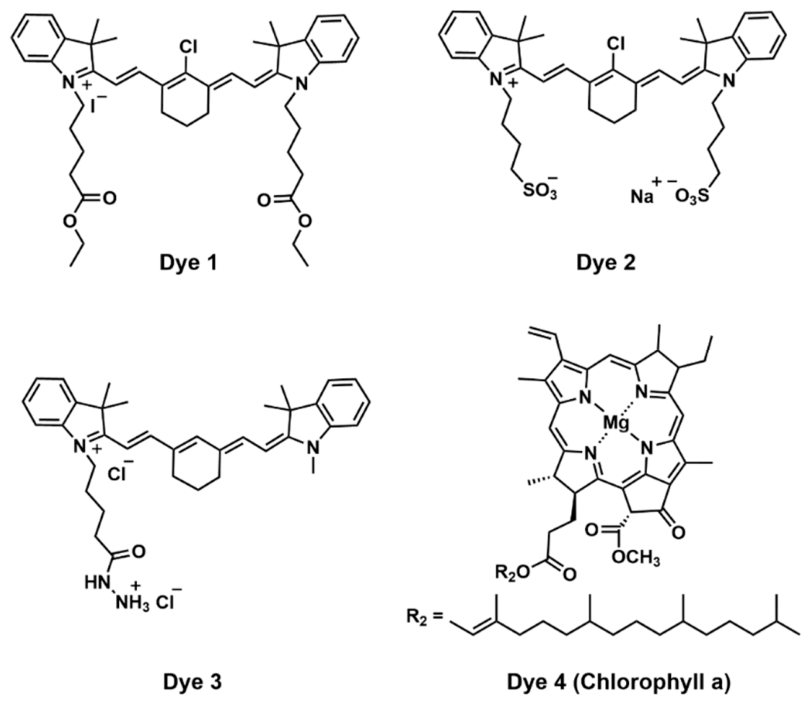
Figure 2.
Photographs of 96-well plates with reaction mixtures (indicator reaction B) at different time points: (a, b) visible images, (c, d) fluorescence excited at 254 nm. Wells containing urine samples from children with hydronephrosis (HN), vesicoureteral reflux (VUR), and the control group, as well as water, are indicated next to the images. Note. The unlabeled sample C7…C12 was not processed.
Figure 2.
Photographs of 96-well plates with reaction mixtures (indicator reaction B) at different time points: (a, b) visible images, (c, d) fluorescence excited at 254 nm. Wells containing urine samples from children with hydronephrosis (HN), vesicoureteral reflux (VUR), and the control group, as well as water, are indicated next to the images. Note. The unlabeled sample C7…C12 was not processed.
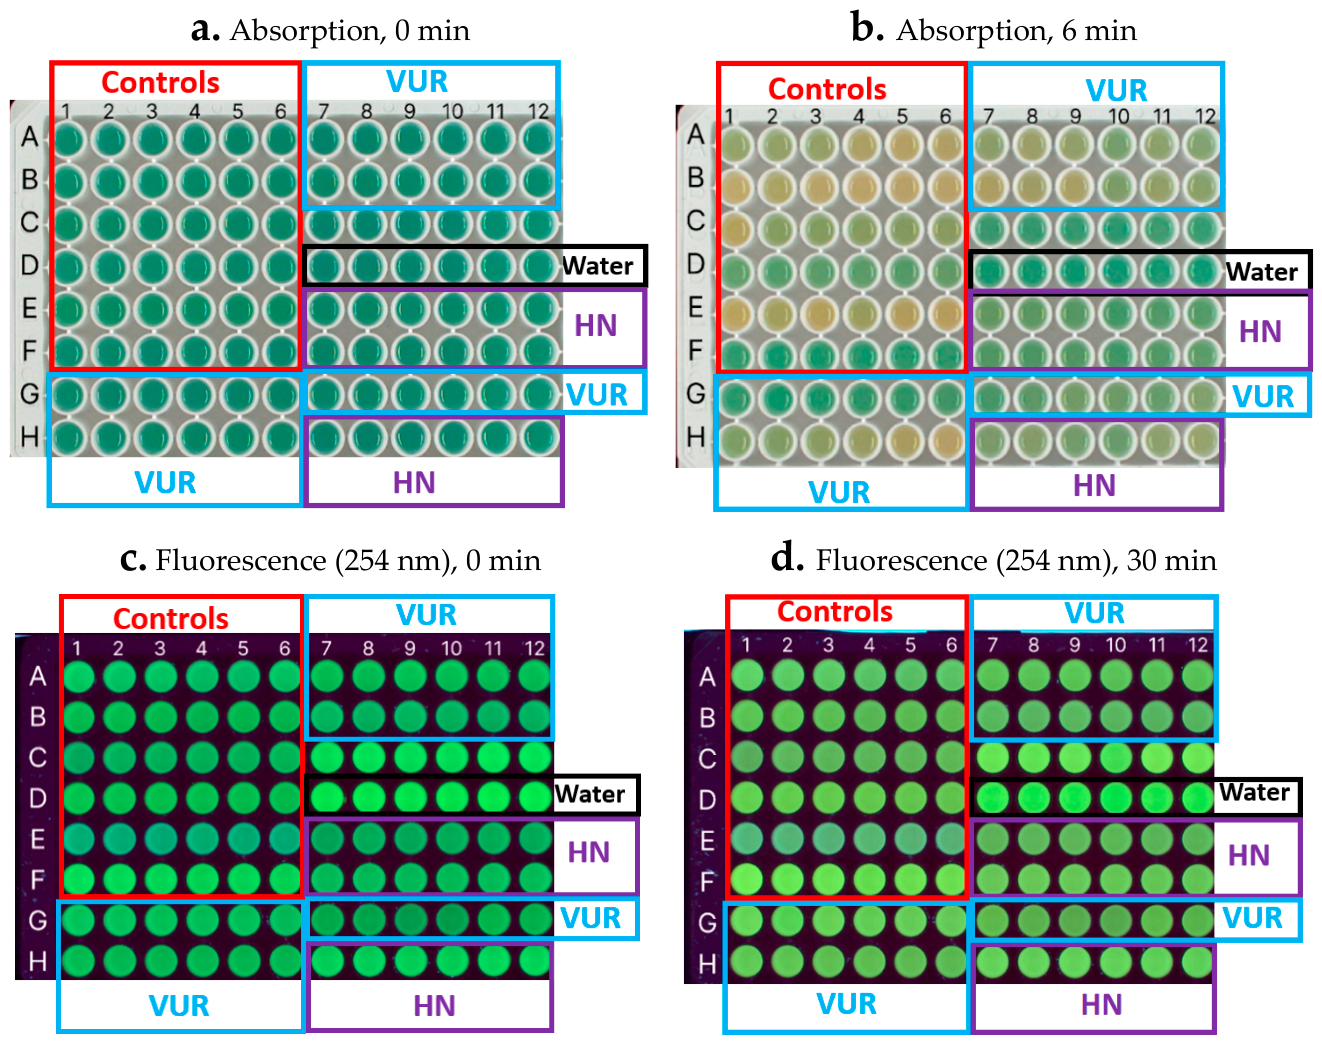
Figure 3.
General outline of recognizing uropathies using optical fingerprinting.
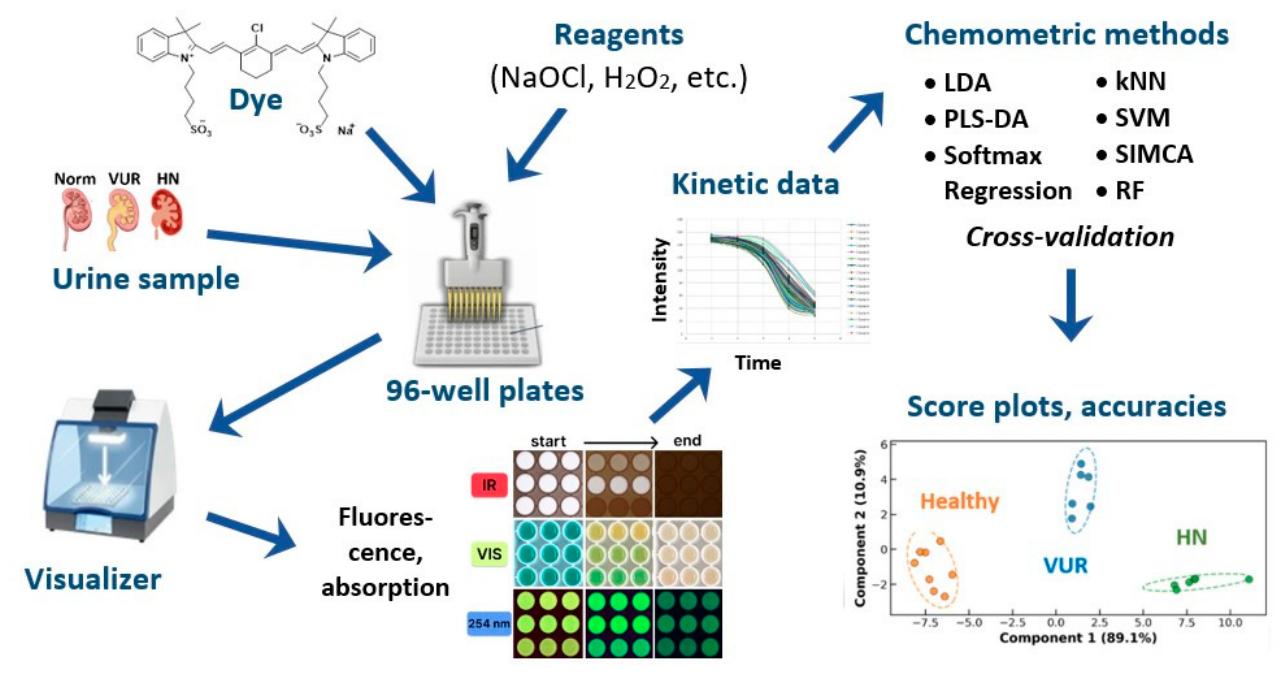
Figure 4.
Kinetic curves: a – indicator reaction B, visible fluorescence excited at 366 nm; b – reaction B, fluorescence in the NIR region excited at 660 nm; c – reaction C, fluorescence in the NIR region excited at 660 nm; VUR – vesicoureteral reflux, HN – hydronephrosis. Error bars correspond to a standard deviation.
Figure 4.
Kinetic curves: a – indicator reaction B, visible fluorescence excited at 366 nm; b – reaction B, fluorescence in the NIR region excited at 660 nm; c – reaction C, fluorescence in the NIR region excited at 660 nm; VUR – vesicoureteral reflux, HN – hydronephrosis. Error bars correspond to a standard deviation.
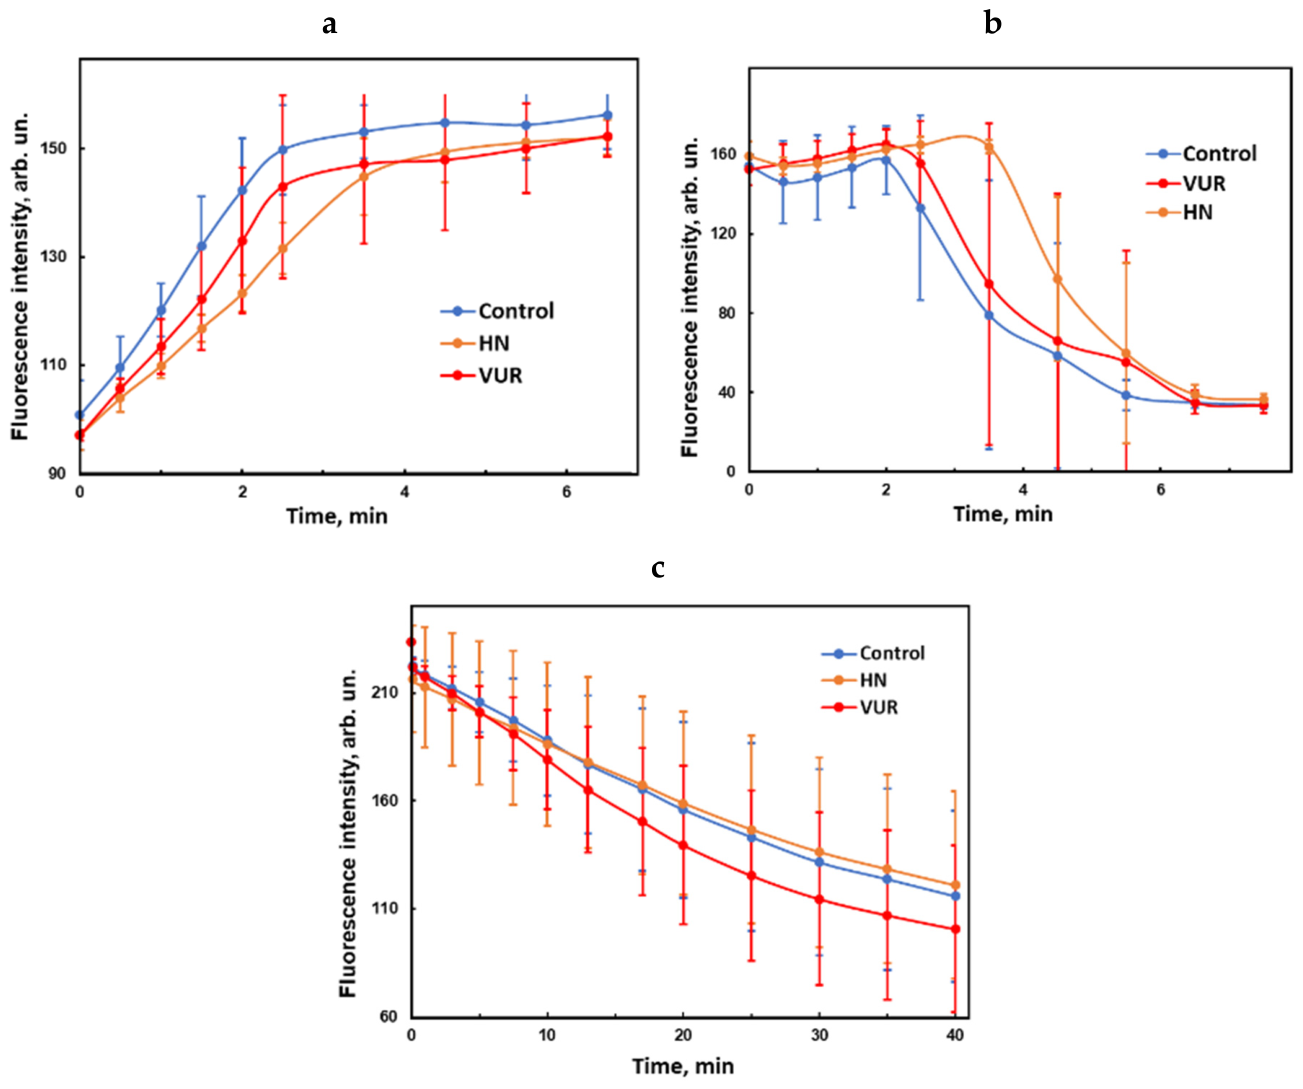
Figure 5.
Score plots of principal component analysis for distinguishing samples with hydronephrosis from control samples by reaction C (a) and for separating three classes of samples: with hydronephrosis, with VUR, and control by reaction A using 12 photographs of the plate in the NIR range (b); the dependence of the first LDA factor on sample number corresponding to panel a (c); the LDA score plot corresponding to panel b (d); permutation test plots for checking the degree of model overfitting: (e) for distinguishing hydronephrosis and control samples using reaction C (accuracy 100% by the LDA method, AUC 1.00; 9 photographs of visible absorption of the plate without RGB-splitting were used); (f) for recognition of samples with VUR and control samples using reaction A (accuracy 100% by the PLS-DA method; 23 photographs of the plate in the NIR range were used).
Figure 5.
Score plots of principal component analysis for distinguishing samples with hydronephrosis from control samples by reaction C (a) and for separating three classes of samples: with hydronephrosis, with VUR, and control by reaction A using 12 photographs of the plate in the NIR range (b); the dependence of the first LDA factor on sample number corresponding to panel a (c); the LDA score plot corresponding to panel b (d); permutation test plots for checking the degree of model overfitting: (e) for distinguishing hydronephrosis and control samples using reaction C (accuracy 100% by the LDA method, AUC 1.00; 9 photographs of visible absorption of the plate without RGB-splitting were used); (f) for recognition of samples with VUR and control samples using reaction A (accuracy 100% by the PLS-DA method; 23 photographs of the plate in the NIR range were used).
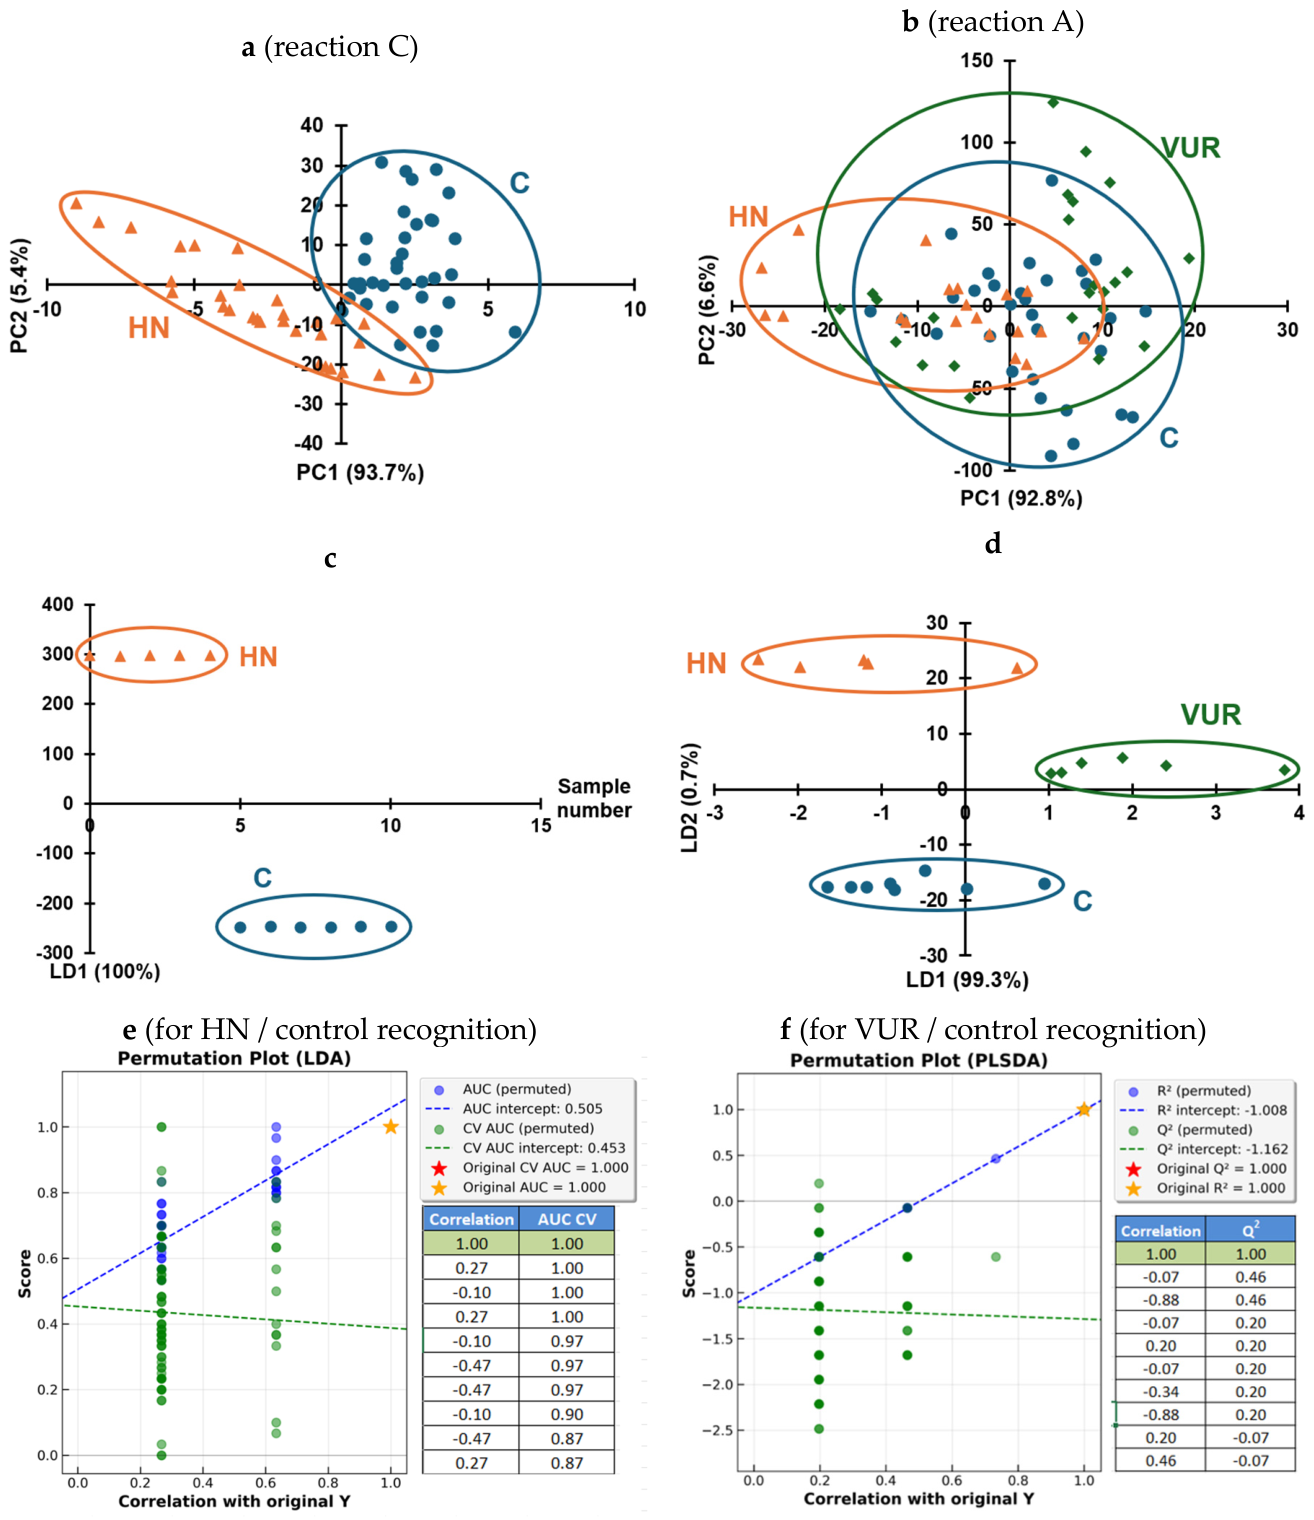
Table 1.
Conditions for conducting indicator reactions for recognizing uropathies by the kinetic fingerprint method.
Table 1.
Conditions for conducting indicator reactions for recognizing uropathies by the kinetic fingerprint method.
| Reaction | Dye | Other reagents | Components introduced into the plate well | Spectral ranges* (processing type) |
|---|---|---|---|---|
| A | 1 | H2O2 | Phosphate buffer (pH 7.4), 30 μL; urine sample, 10 μL, water, 150 μL; CuSO4 0.001 M, 30 μL; H2O2 0.05M, 50 μL; Dye 1, 0.04 g/L in ethanol, 30 μL | 4 (no RGB-splitting) |
| B | 2 | Riboflavin, O2 | Phosphate buffer (pH 7.4), 30 μL; urine sample, 10 μL; Dye 2, 0.05 g/L in water, 60 μL; Riboflavin 2.2⋅10−5 M, 90 μL and illuminate by blue LED (450 nm) | 1, 2, 3 (no RGB-splitting) |
| C | 2 | NaOCl | Acetate buffer (pH 5.8), 30 μL; ethanol 95%, 30 μL; urine sample, 10 μL; Dye 2, 0.01 g/L, 100 μL; NaOCl 0.01 M, 50 μL | 1 (no RGB splitting) |
| D | 3 | PDA** | 0.1 M HCl, 60 µL; 0.0021 M PDA in ethanol, 15 µL; Dye 3, 0.01 g/L in water,10 µL; urine sample, 5 µL | 1, 4 (RGB-splitting) |
| E | 4 | H2O2 | Phosphate buffer (pH 7.4), 30 μL; cetyltrimethylammonium bromide, 1 mM, 80 μL; urine sample, 10 μL; ethanol 95%, 110 μL; Н2О2, 0.5 M, 20 μL; CuSO4, 0.001 M, 20 μL; Dye 4 in DMSO, 6 μM, 50 μL | 4 (RGB-splitting) |
| F | 2 | H2O2, AuNCs*** | Phosphate buffer (pH 7.4), 30 μL; Dye 2, 0.1 g/L, 30 μL; AuNCs***, 30 μL; urine sample, 10 μL; Н2О2, 3M, 30 μL | 1, 4 (RGB-splitting) |
* (1) Absorption/reflection of visible light; (2) fluorescence in the visible region excited at 254 nm; (3) the same, with excitation at 366 nm; (4) fluorescence in the near-IR region excited at 660 nm. ** o-Phthalaldehyde. *** Gold nanoclusters stabilized with adenosine monophosphate; gold concentration – 0.2 mM [34].
Table 2.
Accuracy of recognition of uropathies using standard laboratory parameters.
| Classes to recognize | No of classes | Chemometric method* | ||||||
|---|---|---|---|---|---|---|---|---|
| kNN | LDA | SR | PLS-DA | RF | SIMCA | SVM | ||
| HN, VUR, Control | 3 | 54% | 64% | 71% | 68% | 68% | 39% | 57% |
| VUR from Control | 2 | 67% | 86% | 76% | 86% | 86% | 57% | 71% |
| HN from Control | 2 | 64% | 73% | 73% | 73% | 45% | 55% | 36% |
| VUR from [Control + HN] | 2 | 71% | 79% | 79% | 79% | 79% | 46% | 67% |
| HN from [Control + VUR] | 2 | 67% | 58% | 58% | 58% | 42% | 42% | 67% |
| HN from VUR | 2 | 80% | 65% | 70% | 65% | 75% | 70% | 80% |
* kNN – k-nearest neighbors, LDA – linear discriminant analysis, SR – softmax regression, RF – random forest, PLS-DA – partial least squares discriminant analysis, SIMCA – soft independent modelling of class analogy, SVM – support vector machine.
Table 6.
Correlation coefficients of standard laboratory parameters of patients with the characteristics of the fingerprinting method.
Table 6.
Correlation coefficients of standard laboratory parameters of patients with the characteristics of the fingerprinting method.
| Reaction | Discrimination task | Variable | ESR | Leukoc | Creat | GFR | Urea |
|---|---|---|---|---|---|---|---|
| B | VUR from controls | LD1 | -0.241 | 0.036 | 0.123 | -0.286 | 0.094 |
| C | VUR from (controls + HN) | LV1 | -0.158 | -0.037 | -0.224 | 0.132 | 0.193 |
| C | HN from controls | LV1 | 0.308 | 0.313 | 0.222 | 0.220 | -0.004 |
| A | HN from (controls + VUR) | LV1 | -0.209 | 0.175 | -0.047 | -0.128 | -0.088 |
* LD1 – first LDA factor obtained in processing data from the named indicator reaction; LV1 – first latent variable of PLS-DA method; ESR – Erythrocyte Sedimentation Rate, mm/h; Leukoc – leukocyte count in blood, × 103 µL−1; GFR – Glomerular Filtration Rate, mL/min/1.73 m2; Creat – creatinine concentration in blood, µM; Urea – urea concentration in blood, mM.
Disclaimer/Publisher’s Note: The statements, opinions and data contained in all publications are solely those of the individual author(s) and contributor(s) and not of MDPI and/or the editor(s). MDPI and/or the editor(s) disclaim responsibility for any injury to people or property resulting from any ideas, methods, instructions or products referred to in the content. |
© 2026 by the authors. Licensee MDPI, Basel, Switzerland. This article is an open access article distributed under the terms and conditions of the Creative Commons Attribution (CC BY) license (http://creativecommons.org/licenses/by/4.0/).
Copyright: This open access article is published under a Creative Commons CC BY 4.0 license, which permit the free download, distribution, and reuse, provided that the author and preprint are cited in any reuse.